

Form 8-K Expedia, Inc. For: Feb 05
 Tweet
Tweet Share
Share�
�
UNITED STATES
SECURITIES AND EXCHANGE COMMISSION
Washington, D.C. 20549
�
�
FORM 8-K
�
�
CURRENT REPORT
PURSUANT TO SECTION 13 OR 15(d) OF
THE SECURITIES EXCHANGE ACT OF 1934
DATE OF REPORT (DATE OF EARLIEST EVENT REPORTED) February�5, 2015
�
�
EXPEDIA, INC.
(Exact name of registrant as specified in its charter)
�
�
�
| Delaware | � | 000-51447 | � | 20-2705720 |
| (State or other jurisdiction of incorporation) |
� | (Commission File Number) |
� | (I.R.S. Employer Identification No.) |
333 108th Avenue NE
Bellevue, Washington 98004
(Address of principal executive offices) (Zip code)
(425) 679-7200
Registrant�s telephone number, including area code
Not Applicable
(Former name or former address if changed since last report)
�
�
Check the appropriate box below if the Form 8-K filing is intended to simultaneously satisfy the filing obligation of the registrant under any of the following provisions:
�
| � | Written communications pursuant to Rule 425 under the Securities Act (17 CFR 230.425) |
�
| � | Soliciting material pursuant to Rule 14a-12 under the Exchange Act (17 CFR 240.14a-12) |
�
| � | Pre-commencement communications pursuant to Rule 14d-2(b) under the Exchange Act (17 CFR 240.14d-2(b)) |
�
| � | Pre-commencement communications pursuant to Rule 13e-4(c) under the Exchange Act (17 CFR 240.13e-4(c)) |
�
�
�
| Item�2.02. | Results of Operations and Financial Condition. |
On February�5, 2015, Expedia, Inc. announced its financial results for the quarter and year ended December�31, 2014. The full text of this earnings release is furnished as Exhibit 99.1 hereto.
Expedia makes reference to non-GAAP financial measures in the earnings release, and includes information regarding such measures in the earnings release.
Pursuant to General Instruction B.2. to Form 8-K, the information set forth in this Item�2.02 shall not be deemed �filed� for purposes of Section�18 of the Securities Exchange Act of 1934, as amended (the �Exchange Act�), or otherwise subject to the liabilities of that section, or incorporated by reference in any filing under the Securities Act of 1933, as amended (the �Securities Act�), or the Exchange Act, except as shall be expressly set forth by specific reference in such a filing.
�
| Item�7.01. | Regulation FD Disclosure. |
Expedia management intends to make presentations to various investors, analysts and others during February, March, April and May of 2015, using the slides containing company information attached to this report as Exhibit�99.2.
Pursuant to General Instruction B.2. to Form 8-K, the information set forth in this Item�7.01 shall not be deemed �filed� for purposes of Section�18 of the Exchange Act, or otherwise subject to the liabilities of that section, or incorporated by reference in any filing under the Securities Act or the Exchange Act, except as shall be expressly set forth by specific reference in such a filing.
�
| Item�8.01. | Other Events. |
On February�5, 2015, Expedia announced that its Executive Committee, acting on behalf of its Board of Directors, has (i)�declared a quarterly cash dividend of $0.18 per share of outstanding common stock payable on March�26, 2015 to stockholders of record as of the close of business on March�10, 2015, and (ii)�authorized an additional repurchase of up to 10�million shares of the Company�s common stock.
Item�9.01. Financial Statements and Exhibits.
(d) Exhibits
�
| Exhibit Number |
�� | Description |
| 99.1 | �� | Press Release of Expedia, Inc., dated February 5, 2015 |
| 99.2 | �� | Expedia, Inc. Fourth Quarter 2014 Company Overview |
SIGNATURE
Pursuant to the requirements of the Securities Exchange Act of 1934, the registrant has duly caused this report to be signed on its behalf by the undersigned hereunto duly authorized.
�
| EXPEDIA, INC. | ||
| By: | /s/ MARK D. OKERSTROM | |
| Mark D. Okerstrom | ||
| Chief Financial Officer | ||
Dated: February�5, 2015
EXHIBIT INDEX
�
| Exhibit Number |
�� | Description |
| 99.1 | �� | Press Release of Expedia, Inc., dated February 5, 2015 |
| 99.2 | �� | Expedia, Inc. Fourth Quarter 2014 Company Overview |
Exhibit 99.1
�

Expedia, Inc. Reports Fourth Quarter and Full Year 2014 Results
BELLEVUE, WA � February�5, 2015 � Expedia, Inc. (NASDAQ: EXPE) today announced financial results for the fourth quarter and full year ended December�31, 2014.
�
| � | � | � | Room night growth accelerated to 28% year-over-year in the fourth quarter, with international and domestic room night growth accelerating to 30% and 25% year-over-year, respectively. Fourth quarter gross bookings increased 24% and revenue increased 18% year-over-year. |
�
| � | � | � | Strong performance in the core business drove growth in Expedia (excluding eLong) Adjusted EBITDA(1) of 13% in the fourth quarter and 18% for the full year, with consolidated (including eLong) Adjusted EBITDA(1) growth of 3% and 17% for the fourth quarter and full year 2014, respectively. |
�
| � | � | � | Trivago completed 2014 with standalone revenue growth of 68% year-over-year on continued global expansion. |
�
| � | � | � | During November 2014 Expedia, Inc. completed the acquisition of Wotif Group for total cash consideration of A$703 million ($612 million based on November�13, 2014 exchange rates). |
�
| � | � | � | Subsequent to year end, Expedia, Inc. completed the acquisition of the Travelocity brand and related assets for $280 million. |
�
| � | � | � | In 2014, Expedia, Inc. repurchased 7.0�million shares of its common stock for approximately $537 million excluding transaction costs. |
Financial Summary�& Operating Metrics ($ millions except per share amounts)
�
| � | �� | Expedia (excluding eLong) | � | � | eLong(1) | � | � | Expedia, Inc. | � | |||||||||||||||||||||||||||
| � | �� | Fourth Quarter | � | � | Fourth Quarter | � | � | Fourth Quarter | � | |||||||||||||||||||||||||||
| Metric |
�� | 2014 | � | � | 2013 | � | � | Change | � | � | 2014 | � | � | 2013 | � | � | Change | � | � | 2014 | � | � | 2013 | � | � | Change | � | |||||||||
| Room night growth |
�� | � | 28 | %� | � | � | 20 | %� | � | � | 788 | �bps� | � | � | 27 | %� | � | � | 48 | %� | � | � | (2,132 | )�bps� | � | � | 28 | %� | � | � | 25 | %� | � | � | 285 | �bps� |
| Gross bookings |
�� | � | 10,657.4 | �� | � | � | 8,597.1 | �� | � | � | 24 | %� | � | � | 649.7 | �� | � | � | 507.0 | �� | � | � | 28 | %� | � | � | 11,307.1 | �� | � | � | 9,104.1 | �� | � | � | 24 | %� |
| Revenue |
�� | � | 1,318.5 | �� | � | � | 1,109.2 | �� | � | � | 19 | %� | � | � | 37.5 | �� | � | � | 42.8 | �� | � | � | (12 | %)� | � | � | 1,356.0 | �� | � | � | 1,152.0 | �� | � | � | 18 | %� |
| Adjusted EBITDA(2) |
�� | � | 276.6 | �� | � | � | 245.4 | �� | � | � | 13 | %� | � | � | (26.9 | )� | � | � | (3.4 | )� | � | � | (683 | %)� | � | � | 249.7 | �� | � | � | 242.0 | �� | � | � | 3 | %� |
| Operating income (loss) |
�� | � | 125.0 | �� | � | � | 149.1 | �� | � | � | (16 | %)� | � | � | (30.3 | )� | � | � | (10.4 | )� | � | � | (191 | %)� | � | � | 94.7 | �� | � | � | 138.7 | �� | � | � | (32 | %)� |
| Adjusted net income |
�� | � | � | � | � | � | � | � | 113.0 | �� | � | � | 125.3 | �� | � | � | (10 | %)� | ||||||||||||||||||
| Adjusted EPS |
�� | � | � | � | � | � | � | $ | 0.86 | �� | � | $ | 0.92 | �� | � | � | (7 | %)� | ||||||||||||||||||
| Net income attributable to Expedia, Inc. |
�� | � | � | � | � | � | � | � | 66.0 | �� | � | � | 94.7 | �� | � | � | (30 | %)� | ||||||||||||||||||
| Diluted EPS |
�� | � | � | � | � | � | � | $ | 0.50 | �� | � | $ | 0.70 | �� | � | � | (29 | %)� | ||||||||||||||||||
| Free cash flow |
�� | � | � | � | � | � | � | � | (288.6 | )� | � | � | (285.4 | )� | � | � | (1 | %)� | ||||||||||||||||||
| � | �� | Expedia (excluding eLong) | � | � | eLong | � | � | Expedia, Inc. | � | |||||||||||||||||||||||||||
| � | �� | Full Year | � | � | Full Year | � | � | Full Year | � | |||||||||||||||||||||||||||
| Metric |
�� | 2014 | � | � | 2013 | � | � | Change | � | � | 2014 | � | � | 2013 | � | � | Change | � | � | 2014 | � | � | 2013 | � | � | Change | � | |||||||||
| Room night growth(1) |
�� | � | 24 | %� | � | � | 16 | %� | � | � | 796 | �bps� | � | � | 32 | %� | � | � | 60 | %� | � | � | (2,769 | )�bps� | � | � | 26 | %� | � | � | 23 | %� | � | � | 323 | �bps� |
| Gross bookings |
�� | � | 48,018.1 | �� | � | � | 37,503.2 | �� | � | � | 28 | %� | � | � | 2,428.7 | �� | � | � | 1,939.4 | �� | � | � | 25 | %� | � | � | 50,446.8 | �� | � | � | 39,442.6 | �� | � | � | 28 | %� |
| Revenue(1) |
�� | � | 5,585.4 | �� | � | � | 4,607.3 | �� | � | � | 21 | %� | � | � | 178.1 | �� | � | � | 164.0 | �� | � | � | 9 | %� | � | � | 5,763.5 | �� | � | � | 4,771.3 | �� | � | � | 21 | %� |
| Adjusted EBITDA(2) |
�� | � | 1,051.5 | �� | � | � | 890.7 | �� | � | � | 18 | %� | � | � | (26.7 | )� | � | � | (12.0 | )� | � | � | (122 | %)� | � | � | 1,024.8 | �� | � | � | 878.7 | �� | � | � | 17 | %� |
| Operating income (loss) |
�� | � | 568.6 | �� | � | � | 395.0 | �� | � | � | 44 | %� | � | � | (50.8 | )� | � | � | (28.9 | )� | � | � | (76 | %)� | � | � | 517.8 | �� | � | � | 366.1 | �� | � | � | 41 | %� |
| Adjusted net income |
�� | � | � | � | � | � | � | � | 528.1 | �� | � | � | 452.0 | �� | � | � | 17 | %� | ||||||||||||||||||
| Adjusted EPS |
�� | � | � | � | � | � | � | $ | 3.96 | �� | � | $ | 3.22 | �� | � | � | 23 | %� | ||||||||||||||||||
| Net income attributable to Expedia, Inc. |
�� | � | � | � | � | � | � | � | 398.1 | �� | � | � | 232.9 | �� | � | � | 71 | %� | ||||||||||||||||||
| Diluted EPS |
�� | � | � | � | � | � | � | $ | 2.99 | �� | � | $ | 1.67 | �� | � | � | 79 | %� | ||||||||||||||||||
| Free cash flow |
�� | � | � | � | � | � | � | � | 1,038.6 | �� | � | � | 454.6 | �� | � | � | 128 | %� | ||||||||||||||||||
�
| (1)� | �Adjusted EBITDA� (Adjusted Earnings Before Interest, Taxes, Depreciation and Amortization), �Adjusted net income,� �Adjusted EPS� and �Free cash flow� are non-GAAP measures as defined by the Securities and Exchange Commission (the �SEC�). Please see �Definitions of Non-GAAP Measures� and �Tabular Reconciliations for Non-GAAP Measures� on pages 12-15 herein for an explanation of non-GAAP measures used throughout this release. The definition for adjusted net income was revised in the fourth quarters of 2010, 2011 and 2012 and the definition for Adjusted EBITDA was revised in the fourth quarter of 2012. |
| (2)� | The classification of certain revenue and expense items as well as the foreign exchange rates used for reporting purposes may result in immaterial differences between the above reported amounts and eLong�s standalone results. |
Please refer to the Glossary in the Quarterly Results section on Expedia�s investor relations website for definitions of the business and financial terms discussed within this release.
�
Page 1 of 17
Discussion of Results
The results include Brand Expedia (Expedia.com�), Hotels.com�, Hotwire.com�, Expedia� Affiliate Network, Classic Vacations�, Expedia Local Expert�, Expedia� CruiseShipCenters�, Egencia�, eLong�, Venere� Net SpA, trivago GmbH, Wotif Group, Travelocity� and CarRentals.com�, in addition to the related international points of sale.
Expedia and AirAsia� formed a joint venture on July�1, 2011, which is 50% owned by Expedia; therefore, results do not include the Brand Expedia websites in the Asia Pacific region that were contributed to the joint venture.
The results include trivago GmbH (�trivago�) following acquisition of a controlling interest during March 2013, results from the strategic marketing agreement with Travelocity launched during the fourth quarter of 2013, as well as results of Wotif Group following the acquisition by Expedia, Inc. during November 2014. Unless otherwise noted, all comparisons below are versus the fourth quarter of 2013.
Gross Bookings, Revenue�& Revenue Margins
For the fourth quarter of 2014, gross bookings increased 24% (27% excluding foreign exchange) primarily driven by room night and air ticket growth. Room night growth was driven by Hotels.com, Brand Expedia and Travelocity. Air ticket growth was driven by Brand Expedia and Travelocity. Acquisitions added approximately 1 percentage point of inorganic bookings growth for the quarter. eLong did not have a meaningful impact on gross bookings growth in the fourth quarter of 2014.
For the fourth quarter of 2014, domestic gross bookings increased 29% and international gross bookings increased 18% (25% excluding foreign exchange). International bookings totaled $4.9 billion, accounting for 43% of worldwide bookings versus 45% in the fourth quarter of 2013.
For 2014, gross bookings increased 28% (29% excluding foreign exchange) primarily driven by room night and air ticket growth. Acquisitions and eLong each did not have a meaningful impact on gross bookings growth for the full year 2014. Domestic bookings increased 34% and international bookings increased 20% (22% excluding foreign exchange). International bookings totaled $20.8 billion, accounting for 41% of worldwide bookings versus 44% in the prior year. The decrease in international gross bookings mix in the fourth quarter and full year 2014 was primarily due to the inclusion of the Travelocity-branded websites, which bolstered domestic gross bookings.
For the fourth quarter of 2014, revenue increased 18% (22% excluding foreign exchange) primarily driven by growth in hotel and advertising and media revenue. Acquisitions added approximately 1 percentage point of inorganic revenue growth for the quarter. Excluding eLong, revenue increased 19% for the quarter. Domestic revenue increased 24% and international revenue increased 11% (20% excluding foreign exchange). International revenue equaled $628 million, representing 46% of worldwide revenue versus 49% in the fourth quarter of 2013.
For 2014, revenue increased 21% (21% excluding foreign exchange) primarily driven by growth in hotel and advertising and media revenue. Acquisitions added approximately 1 percentage point of inorganic revenue growth for the year. eLong did not have a meaningful impact on revenue growth for the full year 2014. Domestic revenue increased 21% and international revenue increased 20% (21% excluding foreign exchange). International revenue equaled $2.7 billion, representing 47% of worldwide revenue, consistent with the prior year.
Revenue as a percentage of gross bookings (�revenue margin�) was 12.0% for the fourth quarter of 2014, a decrease of 66 basis points compared to the fourth quarter of 2013, primarily due to lower revenue per room night. For 2014, revenue margin totaled 11.4%, a decrease of 67 basis points compared to the prior year, primarily due to lower revenue per room night, partially offset by the growth in advertising and media revenue.
Product�& Services Detail � Fourth Quarter 2014
As a percentage of total worldwide revenue in the fourth quarter of 2014, hotel accounted for 69%, advertising and media accounted for 9%, air accounted for 8% and all other revenues accounted for the remaining 14%.
Hotel revenue increased 15% in the fourth quarter of 2014 on a 28% increase in room nights stayed driven by Hotels.com, Brand Expedia and Travelocity, partially offset by a 10% decrease in revenue per room night. Revenue per room night decreased primarily due to the efforts to expand the size and availability of the global hotel supply portfolio, promotional activities such as growing loyalty programs, as well as unfavorable book-to-stay foreign currency impact. Revenue per
�
Page 2 of 17
room night is expected to continue to decrease in 2015. Average daily room rates (�ADRs�) were flat year-over-year for the quarter, as the positive impacts from a generally improving travel environment and a favorable geographic mix shift were offset by an unfavorable foreign exchange translation impact. ADRs are expected to be negative year-over-year in 2015 primarily due to foreign exchange.
Air revenue increased 18% in the fourth quarter of 2014 due to a 26% increase in air tickets sold, partially offset by a 6% decrease in revenue per ticket. Advertising and media revenue increased 38% in the fourth quarter of 2014 due to continued strong growth in trivago� and Expedia� Media Solutions. All other revenue increased 23% in the fourth quarter of 2014 primarily on growth in travel insurance and car rental products.
Product�& Services Detail � Full Year 2014
As a percentage of total worldwide annual revenue, hotel accounted for 70%, advertising and media accounted for 8%, air accounted for 8% and all other revenues accounted for the remaining 14%.
Hotel revenue increased 18% in 2014 on a 26% increase in room nights stayed driven by Brand Expedia and Hotels.com, partially offset by a 6% decrease in revenue per room night. Revenue per room night decreased primarily due to the efforts to expand the size and availability of the global hotel supply portfolio as well as promotional activities such as growing loyalty programs. This decline was partially offset by a 2% increase in average daily rates for the year.
Air revenue increased 22% in 2014 due to a 28% increase in air tickets sold, partially offset by a 5% decrease in revenue per ticket. Advertising and media revenue increased 50% in 2014 due to strong growth in trivago and Expedia Media Solutions. All other revenue increased 19% in 2014 primarily on growth in travel insurance and car rental products.
Adjusted Expenses
�
| � | �� | Costs and Expenses | � | � | As a % of Revenue | � | ||||||||||||||||||
| � | �� | Three�months�ended�December�31, | � | � | Three�months�ended�December�31, | � | ||||||||||||||||||
| � | �� | 2014 | � | �� | 2013 | � | �� | Growth | � | � | 2014 | � | � | 2013 | � | � | D�in�bps | � | ||||||
| � | �� | (In millions) | � | |||||||||||||||||||||
| Adjusted cost of revenue * |
�� | $ | 274 | �� | �� | $ | 239 | �� | �� | � | 15 | %� | � | � | 20.2 | %� | � | � | 20.7 | %� | � | � | (55 | )� |
| Adjusted selling and marketing * |
�� | � | 618 | �� | �� | � | 478 | �� | �� | � | 29 | %� | � | � | 45.6 | %� | � | � | 41.5 | %� | � | � | 408 | �� |
| Adjusted technology and content * |
�� | � | 121 | �� | �� | � | 104 | �� | �� | � | 16 | %� | � | � | 8.9 | %� | � | � | 9.0 | %� | � | � | (12 | )� |
| Adjusted general and administrative * |
�� | � | 109 | �� | �� | � | 88 | �� | �� | � | 24 | %� | � | � | 8.0 | %� | � | � | 7.6 | %� | � | � | 40 | �� |
| �� | � |
� |
� | �� | � |
� |
� | �� | � |
� |
� | � | � |
� |
� | � | � |
� |
� | � | � |
� |
� | |
| Total adjusted costs and expenses |
�� | $ | 1,121 | �� | �� | $ | 909 | �� | �� | � | 23 | %� | � | � | 82.7 | %� | � | � | 78.9 | %� | � | � | 381 | �� |
| �� | � |
� |
� | �� | � |
� |
� | �� | � |
� |
� | � | � |
� |
� | � | � |
� |
� | � | � |
� |
� | |
| Total depreciation |
�� | � | 71 | �� | �� | � | 59 | �� | �� | � | 20 | %� | � | � | 5.2 | %� | � | � | 5.1 | %� | � | � | 11 | �� |
| Total stock based compensation |
�� | � | 17 | �� | �� | � | 21 | �� | �� | � | -20 | %� | � | � | 1.2 | %� | � | � | 1.8 | %� | � | � | (58 | )� |
| �� | � |
� |
� | �� | � |
� |
� | �� | � |
� |
� | � | � |
� |
� | � | � |
� |
� | � | � |
� |
� | |
| Total costs and expenses�GAAP |
�� | $ | 1,209 | �� | �� | $ | 988 | �� | �� | � | 22 | %� | � | � | 89.1 | %� | � | � | 85.8 | %� | � | � | 335 | �� |
| �� | � |
� |
� | �� | � |
� |
� | �� | � |
� |
� | � | � |
� |
� | � | � |
� |
� | � | � |
� |
� | |
| � | �� | Costs and Expenses | � | � | As a % of Revenue | � | ||||||||||||||||||
| � | �� | Year ended December 31, | � | � | Year ended December 31, | � | ||||||||||||||||||
| � | �� | 2014 | � | �� | 2013 | � | �� | Growth | � | � | 2014 | � | � | 2013 | � | � | D in bps | � | ||||||
| � | �� | (In millions) | � | |||||||||||||||||||||
| Adjusted cost of revenue * |
�� | $ | 1,140 | �� | �� | $ | 1,000 | �� | �� | � | 14 | %� | � | � | 19.8 | %� | � | � | 21.0 | %� | � | � | (118 | )� |
| Adjusted selling and marketing * |
�� | � | 2,782 | �� | �� | � | 2,173 | �� | �� | � | 28 | %� | � | � | 48.3 | %� | � | � | 45.6 | %� | � | � | 273 | �� |
| Adjusted technology and content * |
�� | � | 450 | �� | �� | � | 394 | �� | �� | � | 14 | %� | � | � | 7.8 | %� | � | � | 8.3 | %� | � | � | (45 | )� |
| Adjusted general and administrative * |
�� | � | 376 | �� | �� | � | 337 | �� | �� | � | 12 | %� | � | � | 6.5 | %� | � | � | 7.1 | %� | � | � | (53 | )� |
| �� | � |
� |
� | �� | � |
� |
� | �� | � |
� |
� | � | � |
� |
� | � | � |
� |
� | � | � |
� |
� | |
| Total adjusted costs and expenses |
�� | $ | 4,748 | �� | �� | $ | 3,904 | �� | �� | � | 22 | %� | � | � | 82.4 | %� | � | � | 81.8 | %� | � | � | 56 | �� |
| �� | � |
� |
� | �� | � |
� |
� | �� | � |
� |
� | � | � |
� |
� | � | � |
� |
� | � | � |
� |
� | |
| Total depreciation |
�� | � | 266 | �� | �� | � | 212 | �� | �� | � | 26 | %� | � | � | 4.6 | %� | � | � | 4.4 | %� | � | � | 17 | �� |
| Total stock based compensation |
�� | � | 85 | �� | �� | � | 130 | �� | �� | � | -35 | %� | � | � | 1.5 | %� | � | � | 2.7 | %� | � | � | (125 | )� |
| �� | � |
� |
� | �� | � |
� |
� | �� | � |
� |
� | � | � |
� |
� | � | � |
� |
� | � | � |
� |
� | |
| Total costs and expenses�GAAP |
�� | $ | 5,099 | �� | �� | $ | 4,246 | �� | �� | � | 20 | %� | � | � | 88.5 | %� | � | � | 89.0 | %� | � | � | (52 | )� |
| �� | � |
� |
� | �� | � |
� |
� | �� | � |
� |
� | � | � |
� |
� | � | � |
� |
� | � | � |
� |
� | |
�
| * | Non-GAAP measures as defined by the SEC. Please see �Definitions of Non-GAAP Measures� and �Tabular Reconciliations for Non-GAAP Measures� on pages [10-13] herein for an explanation of the use of these non-GAAP measures. |
Adjusted Cost of Revenue
�
| � | � | � | For the fourth quarter of 2014, adjusted cost of revenue increased 15% due to $19 million more in customer operations expenses, primarily due to an increase in transaction costs period over period, and $17 million more in data center and other costs. Acquisitions contributed approximately 1 percentage point of inorganic growth to adjusted cost of revenue growth during the fourth quarter of 2014. Excluding eLong, adjusted cost of revenue increased 12% for the fourth quarter of 2014. |
�
Page 3 of 17
| � | � | � | For 2014, adjusted cost of revenue increased 14% due to $56 million more in net credit card processing costs, including fraud and chargebacks, $55 million more in customer operations expenses, primarily due to an increase in transaction costs and volumes period over period, and $31 million more in data center and other costs. Acquisitions did not have a meaningful impact on adjusted cost of revenue growth for the full year 2014. Excluding eLong, adjusted cost of revenue increased 13% for the full year 2014. |
Adjusted Selling and Marketing
�
| � | � | � | For the fourth quarter of 2014, adjusted selling and marketing expense increased 29% due to a $120 million increase in direct costs, including online and offline marketing expenses. Brand Expedia including commissions related to the Travelocity agreement, Hotels.com and trivago accounted for a majority of the total increase in direct selling and marketing expenses. Acquisitions contributed approximately 2 percentage points of inorganic growth to adjusted selling and marketing growth during the fourth quarter of 2014. Excluding eLong, adjusted selling and marketing expenses increased 30% for the fourth quarter of 2014. |
�
| � | � | � | For 2014, adjusted selling and marketing increased 28% due to a $542 million increase in direct costs, including online and offline marketing expenses. Brand Expedia including commissions related to the Travelocity agreement, trivago and Hotels.com accounted for a majority of the total increase in direct selling and marketing expenses. Acquisitions contributed approximately 2 percentage points of inorganic growth to adjusted selling and marketing growth for 2014. Excluding eLong, adjusted selling and marketing expenses increased 29% for 2014. |
�
| � | � | � | Indirect costs increased $20 million for the fourth quarter of 2014, primarily driven by additional personnel due to an accelerated pace of hiring in the lodging supply organization as well as a higher incentive compensation accrual. Indirect costs increased $67 million for 2014, primarily driven by the ramping up of hiring in the lodging supply organization, which is expected to continue into 2015, and additional personnel at trivago and certain of our core OTA brands, as well as a higher incentive compensation accrual. As a percentage of total selling and marketing, indirect costs represented 23% in the fourth quarter of 2014 and 19% for the full year compared to 25% and 21%, respectively in the prior year. eLong did not have a meaningful impact on indirect costs as a percentage of total selling and marketing in the fourth quarter of 2014 and full year. |
Adjusted Technology and Content
�
| � | � | � | For the fourth quarter of 2014, adjusted technology and content expense increased 16% primarily due to a $13 million increase in personnel and overhead costs, net of capitalized salary costs, for additional personnel to support key technology projects for eLong, Brand Expedia, corporate technology function and trivago. Acquisitions contributed approximately 1 percentage point of inorganic growth to adjusted technology and content growth during the fourth quarter of 2014. Excluding eLong, adjusted technology and content expense increased 14% for the fourth quarter of 2014. |
�
| � | � | � | For 2014, adjusted technology and content expense increased 14% primarily due to a $46 million increase in personnel and overhead costs, net of capitalized salary costs, for additional personnel to support key technology projects for Brand Expedia, eLong, the corporate technology function and trivago, as well as higher incentive compensation accrual. Acquisitions contributed approximately 1 percentage point of inorganic growth to adjusted technology and content growth for 2014. Excluding eLong, adjusted technology and content expense increased 13% for 2014. |
Adjusted General and Administrative
�
| � | � | � | For the fourth quarter of 2014, adjusted general and administrative expense increased 24% primarily due to a $10 million increase in personnel costs, including higher incentive compensation accrual, as well as an $8 million increase in acquisition-related expenses. Acquisitions contributed approximately 3 percentage points of inorganic growth to adjusted general and administrative growth during the fourth quarter of 2014. Excluding eLong, adjusted general and administrative expense increased 20% during the fourth quarter of 2014. |
�
| � | � | � | For 2014, adjusted general and administrative expense increased 12% primarily due to a $29 million increase in personnel costs, including higher incentive compensation accrual, as well as a $10 million increase in acquisition-related expenses. Acquisitions contributed approximately 1 percentage point of inorganic growth to adjusted general and administrative growth for 2014. Excluding eLong, adjusted general and administrative expense increased 11% for 2014. |
�
Page 4 of 17
Depreciation Expense
For the fourth quarter of 2014 and full year, depreciation expense increased $12 million and $54 million, or 20% and 26%, respectively, primarily due to increased expenses related to previously capitalized software development costs for completed technology which has been placed into service. Depreciation expense is expected to continue to increase as additional projects are completed.
Adjusted EBITDA
Adjusted EBITDA increased 3% for the fourth quarter of 2014, compared to the fourth quarter of 2013. Adjusted EBITDA growth was driven by strong top line performance, offset by additional investments by eLong and higher adjusted expenses. Adjusted EBITDA increased 17% for the full year 2014, primarily driven by strong top line performance. Excluding eLong, Adjusted EBITDA increased 13% and 18% for the fourth quarter and the full year 2014, respectively.
Restructuring and Related Reorganization Charges
In conjunction with the migration of technology platforms and centralization of technology, supply and other operations, primarily related to integrations including Wotif Group, we recognized $26 million in restructuring and related reorganization charges during the fourth quarter of 2014. In 2015, we expect to recognize an additional $10-$15 million in restructuring charges with the vast majority coming in the first half of the year.
Interest and Other
For the fourth quarter of 2014 and full year, interest income increased $2 million and $3 million, or 32% and 10%, respectively, primarily due to higher cash and short-term investment balances. Interest expense increased $6 million and $11 million, or 29% and 12%, respectively, primarily due to higher long-term debt balances.
For the fourth quarter of 2014, other, net was a gain of $15 million compared to a loss of $1 million in the fourth quarter of 2013. The gains for the fourth quarter of 2014 were primarily related to foreign exchange while the loss for the fourth quarter of 2013 was primarily related to an other-than-temporary investment impairment, partially offset by equity method operating gains. For 2014, other, net was a gain of $18 million compared to a loss of $3 million for 2013. The gains for full year 2014 were primarily related to income from joint ventures as well as foreign exchange while the loss for the full year 2013 was primarily related to an other-than-temporary investment impairment, partially offset by equity method operating gains. Foreign currency rate fluctuations negatively impacted fourth quarter 2014 revenue growth rates reflecting depreciation in certain foreign currencies compared to the fourth quarter of 2013. Foreign currency rate fluctuations minimally impacted full year 2014 revenue growth rates compared to the full year 2013. Our revenue hedging program is designed to offset the book-to-stay impact on merchant hotel revenue. We include any realized gains or losses from our revenue hedging program in our calculation of Adjusted EBITDA.
Income Taxes
The effective tax rate on GAAP pre-tax income was 36.0% for the fourth quarter of 2014 and 19.7% for full year 2014, compared with 22.0% and 28.0%, respectively, in the prior year periods. The effective tax rate on pre-tax adjusted net income (�ANI�) was 33.5% for the fourth quarter of 2014 and 24.5% for full year 2014, compared with 23.4% and 24.1%, respectively, in the prior year periods. The fourth quarter variance in GAAP rates was primarily due to the tax treatment of certain 2014 losses in foreign jurisdictions for which we did not record a tax benefit, offset by nondeductible items in the fourth quarter of 2013. The full year variance in GAAP rates was primarily due to expiration of the statute of limitations for the 2001 � 2005 federal tax years and the associated release of liabilities related to uncertain tax positions during 2014, as well as the absence of nondeductible items included in the prior year period. The fourth quarter variance in ANI rates was due to the tax treatment of certain 2014 losses in foreign jurisdictions for which we did not record a tax benefit. The ANI rate for the full year 2014 was essentially consistent with the prior year period.
Balance Sheet, Cash Flows and Capitalization
Cash, cash equivalents, restricted cash and short-term investments totaled $1.8 billion at December�31, 2014. For the year ended December�31, 2014, net cash provided by operating activities was $1.4 billion and free cash flow totaled $1.0 billion. Both measures include $549 million from net changes in operating assets and liabilities, primarily driven by an increase in deferred merchant bookings, which includes amounts related to the Travelocity strategic marketing agreement. Free cash flow increased $584 million for the year ended December�31, 2014, compared to the prior year period primarily due to increased benefits from working capital changes, higher operating income after adjusting for the impacts of depreciation and amortization as well as lower pay-to-play tax assessment payments in the current period.
�
Page 5 of 17
In August 2014, we registered $500 million of senior unsecured notes that are due in August 2024 and bear interest at 4.5% (the �4.5% Notes�). The 4.5% Notes were issued at 99.444% of par resulting in a discount, which is being amortized over their life. Interest is payable semi-annually in February and August of each year, beginning February�15, 2015.
Long-term debt totaled $1.75 billion at December�31, 2014 consisting of $497 million, net of discount, in 4.5% senior notes due 2024, $749 million, net of discount, in 5.95% senior notes due 2020 and $500 million in 7.456% senior notes due 2018. In addition, we have a $1 billion unsecured revolving credit facility which was essentially untapped as of December�31, 2014.
At December�31, 2014, we had stock-based awards outstanding representing approximately 14.8�million shares of our common stock, consisting of options to purchase approximately 14.4�million common shares with a $49.33 weighted average exercise price and weighted average remaining life of 4.1 years, and approximately 0.3�million restricted stock units (RSUs).
During the fourth quarter of 2014, we repurchased 0.8�million shares of Expedia, Inc. common stock for an aggregate purchase price of $68 million excluding transaction costs (an average of $87.75 per share). In 2014, we repurchased 7.0�million shares of Expedia, Inc. common stock for approximately $537 million excluding transaction costs (an average of $76.26 per share). As of December�31, 2014, we had approximately 1.8�million shares remaining under our April 2012 repurchase authorization. On February�4, 2015, the Executive Committee, acting on behalf of the Board of Directors, authorized an additional repurchase of up to 10�million shares of Expedia, Inc. common stock.
Pursuant to the Amended and Restated Governance Agreement with Liberty Interactive Corporation (�Liberty�), we issued 264,608 shares of common stock to Liberty at a price of $77.11 per share for an aggregate value of approximately $20 million. The shares were issued from treasury stock during the fourth quarter of 2014.
On December�11, 2014, we paid a quarterly dividend of $23 million ($0.18 per common share). In addition, on February�4, 2015, the Executive Committee of Expedia�s Board of Directors declared a cash dividend of $0.18 per share of outstanding common stock to be paid to stockholders of record as of the close of business on March�10, 2015, with a payment date of March�26, 2015. Based on our current shares outstanding, we estimate the total payment for this quarterly dividend will be approximately $23 million. Future declaration of dividends and the establishment of future record and payment dates are subject to the final determination of Expedia�s Board of Directors.
�
Page 6 of 17
Recent Highlights
Global Presence and Supply Portfolio
�
| � | � | � | At quarter-end, Expedia, Inc. global websites featured approximately 435,000 properties, including over 218,000 in China through eLong. |
�
| � | � | � | Expedia, Inc. completed the acquisition of the Wotif Group including Asia-Pacific online travel brands Wotif.com�, lastminute.com.au�, travel.com.au, Asia Web Direct�, LateStays.com, GoDo.com.au and Arnold Travel Technology. Its multi-product portfolio focuses primarily on hotel and air, offering consumers more than 29,000 bookable properties in destinations around the world. |
�
| � | � | � | In January 2015, Expedia, Inc. acquired Travelocity from Sabre Corporation for $280 million in cash. The acquisition follows the 2013 strategic marketing agreement between Expedia, Inc. and Travelocity under which Expedia powered the technology platforms for Travelocity�s US and Canadian websites along with providing Travelocity access to Expedia, Inc.�s supply and customer service program. |
�
| � | � | � | Expedia, Inc. entered into commercial agreements with a number of airlines, including British Airways, Iberia, Aeroflot, Air Canada, Japan Airlines (JAL), Azul Brazilian Airlines, Air Tahiti Nui, and Canadian tour operators Transat Tours Canada and WestJet Vacations. |
�
| � | � | � | Brand Expedia completed the rollout of Expedia+ rewards in Canada allowing customers in Canada to earn reward points for travel booked on Expedia.ca. |
�
| � | � | � | Expedia� Affiliate Network (EAN) signed and launched agreements to power online hotel bookings for several international companies including Connexions Loyalty (Loyalty Travel Agency). |
�
| � | � | � | Brand Expedia entered in an exclusive partnership with Eurostar for standalone hotel replacing the Orbitz white label partnership. This partnership allows Expedia to provide Eurostar�s website with a co-branded hotel solution linked via the Eurostar.com site in the UK, France and Belgium. |
�
| � | � | � | Expedia� Lodging Partner Services enabled new provisions that allow for distribution under the Expedia Traveler Preference (�ETP�) program with a number of leading hospitality companies, including Best Western International, Wyndham Hotel Group and Carlson Rezidor Hotel Group. |
�
| � | � | � | Expedia� Media Solutions announced the recipients of its 2014 Latin America and North America Partner Awards for original and groundbreaking campaigns that exemplify innovation and success in digital marketing and advertising across regions. Winning partners included Etihad Airways, Caesars Hotels�& Casinos, Los Angeles Tourism�& Convention Board, Travel Alberta and Promperu. |
�
| � | � | � | Egencia signed $1.2 billion of new business and surpassed the $5 billion gross booking mark during 2014, a 2.5-fold increase in gross bookings versus 2010. For example, the UK market experienced 21% gross bookings growth for the full year by adding 150 clients. |
�
| � | � | � | Expedia� CruiseShipCenters� reported record growth in 2014 with the awarding of 30 new retail franchises and the addition of over 1,000 new Vacation Consultants to its network. |
Technology Innovation
�
| � | � | � | AirAsiaGo launched its new Chinese site (http://china.airasiago.com), allowing customers to pay in the Chinese Yuan. As an extension of the site, the team also unveiled a mobile website and app for AirAsiaGo China. |
�
| � | � | � | Expedia Inc. brands continued advancements in mobile, with more than one in four transactions booked globally on a mobile device while Hotels.com� mobile traffic penetration exceeded 50% on peak days during the fourth quarter. |
�
| � | � | � | Mobile development recognition during the quarter included Web Marketing Association�s �Outstanding Mobile Website� award for �Outstanding Achievement in Mobile Development� for Hotwire, Brand Expedia among Google�s �Best Android Apps of 2014�, and FlightTrack� 5 selected as �Best Travel App� by Global Traveler. |
�
| � | � | � | Several brands added new features in mobile, including the ability to book car rentals on Hotwire�s Android app and the addition of Tripdeck� to Mobiata�s FlightTrack� app, allowing travelers to easily track their flights in a simple itinerary, regardless of where they booked. |
Distribution Channels
�
| � | � | � | Expedia, Inc. partnered with the Airline Reporting Corporation (ARC) to release a white paper entitled �Preparing for Take-Off: Air Travel Trends 2015,� which provided a predictive look at airline ticket prices and trends in 2015 to help advise travelers on when to buy flights. |
�
| � | � | � | Expedia� Media Solutions commissioned a study conducted by comScore that analyzed the importance of multi-platform devices in online travel content consumption, revealing opportunities for travel marketers to reach consumers across devices and travel planning stages. |
�
| � | � | � | Hotels.com won the 2014 Skifties Award for Best Branded Twitter Account and was recognized on Skift.com. |
�
Page 7 of 17
EXPEDIA, INC.
CONSOLIDATED STATEMENTS OF OPERATIONS
(In thousands, except for per share data)
(Unaudited)
�
| � | �� | Three months ended December�31, |
� | � | Year ended December�31, |
� | ||||||||||
| � | �� | 2014 | � | � | 2013 | � | � | 2014 | � | � | 2013 | � | ||||
| Revenue |
�� | $ | 1,355,978 | �� | � | $ | 1,152,015 | �� | � | $ | 5,763,485 | �� | � | $ | 4,771,259 | �� |
| Costs and expenses: |
�� | � | � | � | ||||||||||||
| Cost of revenue (1)(2) |
�� | � | 284,253 | �� | � | � | 248,528 | �� | � | � | 1,179,081 | �� | � | � | 1,038,034 | �� |
| Selling and marketing (1)(2) |
�� | � | 624,214 | �� | � | � | 484,226 | �� | � | � | 2,808,329 | �� | � | � | 2,196,145 | �� |
| Technology and content (1)(2) |
�� | � | 181,350 | �� | � | � | 155,039 | �� | � | � | 686,154 | �� | � | � | 577,820 | �� |
| General and administrative (1)(2) |
�� | � | 118,789 | �� | � | � | 100,460 | �� | � | � | 425,373 | �� | � | � | 377,078 | �� |
| Amortization of intangible assets |
�� | � | 24,340 | �� | � | � | 21,810 | �� | � | � | 79,615 | �� | � | � | 71,731 | �� |
| Legal reserves, occupancy tax and other |
�� | � | 2,696 | �� | � | � | 3,241 | �� | � | � | 41,539 | �� | � | � | 77,919 | �� |
| Restructuring and related reorganization charges |
�� | � | 25,630 | �� | � | � | ��� | �� | � | � | 25,630 | �� | � | � | ��� | �� |
| Acquisition-related and other (1) |
�� | � | ��� | �� | � | � | ��� | �� | � | � | ��� | �� | � | � | 66,472 | �� |
| �� | � |
� |
� | � | � |
� |
� | � | � |
� |
� | � | � |
� |
� | |
| Operating income |
� | 94,706 | �� | � | 138,711 | �� | � | 517,764 | �� | � | 366,060 | �� | ||||
| Other income (expense): |
||||||||||||||||
| Interest income |
� | 6,532 | �� | � | 4,942 | �� | � | 27,288 | �� | � | 24,779 | �� | ||||
| Interest expense |
� | (28,406 | )� | � | (22,015 | )� | � | (98,089 | )� | � | (87,358 | )� | ||||
| Other, net |
� | 15,164 | �� | � | (1,177 | )� | � | 17,678 | �� | � | (2,788 | )� | ||||
| �� | � |
� |
� | � | � |
� |
� | � | � |
� |
� | � | � |
� |
� | |
| Total other expense, net |
� | (6,710 | )� | � | (18,250 | )� | � | (53,123 | )� | � | (65,367 | )� | ||||
| �� | � |
� |
� | � | � |
� |
� | � | � |
� |
� | � | � |
� |
� | |
| Income before income taxes |
� | 87,996 | �� | � | 120,461 | �� | � | 464,641 | �� | � | 300,693 | �� | ||||
| Provision for income taxes |
� | (31,717 | )� | � | (26,474 | )� | � | (91,691 | )� | � | (84,335 | )� | ||||
| �� | � |
� |
� | � | � |
� |
� | � | � |
� |
� | � | � |
� |
� | |
| Net income |
� | 56,279 | �� | � | 93,987 | �� | � | 372,950 | �� | � | 216,358 | �� | ||||
| Net loss attributable to noncontrolling interests |
� | 9,690 | �� | � | 730 | �� | � | 25,147 | �� | � | 16,492 | �� | ||||
| �� | � |
� |
� | � | � |
� |
� | � | � |
� |
� | � | � |
� |
� | |
| Net income attributable to Expedia, Inc. |
$ | 65,969 | �� | $ | 94,717 | �� | $ | 398,097 | �� | $ | 232,850 | �� | ||||
| �� | � |
� |
� | � | � |
� |
� | � | � |
� |
� | � | � |
� |
� | |
| Earnings per share attributable to Expedia, Inc. available to common stockholders: |
||||||||||||||||
| Basic |
$ | 0.52 | �� | $ | 0.72 | �� | $ | 3.09 | �� | $ | 1.73 | �� | ||||
| Diluted |
� | 0.50 | �� | � | 0.70 | �� | � | 2.99 | �� | � | 1.67 | �� | ||||
| Shares used in computing earnings per share: |
||||||||||||||||
| Basic |
� | 127,683 | �� | � | 131,306 | �� | � | 128,912 | �� | � | 134,912 | �� | ||||
| Diluted |
� | 131,639 | �� | � | 135,571 | �� | � | 133,168 | �� | � | 139,593 | �� | ||||
| Dividends declared per common share |
$ | 0.18 | �� | $ | 0.15 | �� | $ | 0.66 | �� | $ | 0.56 | �� | ||||
|
�������������������������� ���������� (1) Includes stock-based compensation as follows: |
||||||||||||||||
| Cost of revenue |
$ | 731 | �� | $ | 1,040 | �� | $ | 3,921 | �� | $ | 3,752 | �� | ||||
| Selling and marketing |
� | 4,269 | �� | � | 4,333 | �� | � | 18,067 | �� | � | 16,190 | �� | ||||
| Technology and content |
� | 4,208 | �� | � | 5,006 | �� | � | 22,100 | �� | � | 20,465 | �� | ||||
| General and administrative |
� | 7,664 | �� | � | 10,591 | �� | � | 40,923 | �� | � | 33,123 | �� | ||||
| Acquisition-related and other |
� | ��� | �� | � | ��� | �� | � | ��� | �� | � | 56,643 | �� | ||||
| (2) Includes depreciation as follows: |
||||||||||||||||
| Cost of revenue |
$ | 9,838 | �� | $ | 8,644 | �� | $ | 35,392 | �� | $ | 34,273 | �� | ||||
| Selling and marketing |
� | 2,025 | �� | � | 1,974 | �� | � | 7,782 | �� | � | 6,639 | �� | ||||
| Technology and content |
� | 56,372 | �� | � | 46,072 | �� | � | 214,262 | �� | � | 163,384 | �� | ||||
| General and administrative |
� | 2,421 | �� | � | 2,084 | �� | � | 8,381 | �� | � | 7,448 | �� | ||||
�
Page 8 of 17
EXPEDIA, INC.
CONSOLIDATED BALANCE SHEETS
(In thousands, except per share data)
(Unaudited)
�
| � | �� | December�31, | � | |||||
| � | �� | 2014 | � | � | 2013 | � | ||
| ASSETS | �� | |||||||
| Current assets: |
�� | � | ||||||
| Cash and cash equivalents |
�� | $ | 1,402,700 | �� | � | $ | 1,021,033 | �� |
| Restricted cash and cash equivalents |
�� | � | 34,888 | �� | � | � | 26,042 | �� |
| Short-term investments |
�� | � | 355,780 | �� | � | � | 325,510 | �� |
| Accounts receivable, net of allowance of $13,760 and $11,555 |
�� | � | 778,334 | �� | � | � | 614,735 | �� |
| Deferred income taxes |
�� | � | 169,269 | �� | � | � | 66,130 | �� |
| Income taxes receivable |
�� | � | 17,161 | �� | � | � | 64,296 | �� |
| Prepaid expenses and other current assets |
�� | � | 166,357 | �� | � | � | 101,541 | �� |
| �� | � |
� |
� | � | � |
� |
� | |
| Total current assets |
�� | � | 2,924,489 | �� | � | � | 2,219,287 | �� |
| Property and equipment, net |
�� | � | 553,126 | �� | � | � | 480,702 | �� |
| Long-term investments and other assets |
�� | � | 286,882 | �� | � | � | 250,626 | �� |
| Deferred income taxes |
�� | � | 10,053 | �� | � | � | 14,151 | �� |
| Intangible assets, net |
�� | � | 1,290,087 | �� | � | � | 1,111,041 | �� |
| Goodwill |
�� | � | 3,955,901 | �� | � | � | 3,663,674 | �� |
| �� | � |
� |
� | � | � |
� |
� | |
| TOTAL ASSETS |
�� | $ | 9,020,538 | �� | � | $ | 7,739,481 | �� |
| �� | � |
� |
� | � | � |
� |
� | |
| LIABILITIES AND STOCKHOLDERS� EQUITY | �� | |||||||
| Current liabilities: |
�� | � | ||||||
| Accounts payable, merchant |
�� | $ | 1,188,483 | �� | � | $ | 1,044,259 | �� |
| Accounts payable, other |
�� | � | 361,382 | �� | � | � | 261,288 | �� |
| Deferred merchant bookings |
�� | � | 1,761,258 | �� | � | � | 1,350,319 | �� |
| Deferred revenue |
�� | � | 62,206 | �� | � | � | 39,746 | �� |
| Income taxes payable |
�� | � | 59,661 | �� | � | � | 61,874 | �� |
| Accrued expenses and other current liabilities |
�� | � | 753,625 | �� | � | � | 536,895 | �� |
| �� | � |
� |
� | � | � |
� |
� | |
| Total current liabilities |
�� | � | 4,186,615 | �� | � | � | 3,294,381 | �� |
| Long-term debt |
�� | � | 1,746,787 | �� | � | � | 1,249,412 | �� |
| Deferred income taxes |
�� | � | 452,958 | �� | � | � | 433,532 | �� |
| Other long-term liabilities |
�� | � | 180,376 | �� | � | � | 138,300 | �� |
| Commitments and contingencies |
�� | � | ||||||
| Redeemable noncontrolling interests |
�� | � | 560,073 | �� | � | � | 364,871 | �� |
| Stockholders� equity: |
�� | � | ||||||
| Common stock $.0001 par value Authorized shares: 1,600,000 Shares issued: 196,802 and 192,562 Shares outstanding: 114,267 and 116,886 |
�� | � | 20 | �� | � | � | 19 | �� |
| Class B common stock $.0001 par value Authorized shares: 400,000 Shares issued and outstanding: 12,800 and 12,800 |
�� | � | 1 | �� | � | � | 1 | �� |
| Additional paid-in capital |
�� | � | 5,892,862 | �� | � | � | 5,802,140 | �� |
| Treasury stock - Common stock, at cost Shares: 82,535 and 75,676 |
�� | � | (3,998,120 | )� | � | � | (3,465,675 | )� |
| Retained earnings (deficit) |
�� | � | 28,278 | �� | � | � | (209,218 | )� |
| Accumulated other comprehensive income (loss) |
�� | � | (138,774 | )� | � | � | 18,197 | �� |
| �� | � |
� |
� | � | � |
� |
� | |
| Total Expedia, Inc. stockholders� equity |
�� | � | 1,784,267 | �� | � | � | 2,145,464 | �� |
| Non-redeemable noncontrolling interest |
�� | � | 109,462 | �� | � | � | 113,521 | �� |
| �� | � |
� |
� | � | � |
� |
� | |
| Total stockholders� equity |
�� | � | 1,893,729 | �� | � | � | 2,258,985 | �� |
| �� | � |
� |
� | � | � |
� |
� | |
| TOTAL LIABILITIES AND STOCKHOLDERS� EQUITY |
�� | $ | 9,020,538 | �� | � | $ | 7,739,481 | �� |
| �� | � |
� |
� | � | � |
� |
� | |
�
Page 9 of 17
EXPEDIA, INC.
CONSOLIDATED STATEMENTS OF CASH FLOWS
(In thousands)
(Unaudited)
�
| � | �� | Year ended December�31, | � | |||||
| � | �� | 2014 | � | � | 2013 | � | ||
| Operating activities: |
�� | � | ||||||
| Net income |
�� | $ | 372,950 | �� | � | $ | 216,358 | �� |
| Adjustments to reconcile net income to net cash provided by operating activities: |
�� | � | ||||||
| Depreciation of property and equipment, including internal-use software and website development |
�� | � | 265,817 | �� | � | � | 211,744 | �� |
| Amortization of stock-based compensation |
�� | � | 85,011 | �� | � | � | 130,173 | �� |
| Amortization of intangible assets |
�� | � | 79,615 | �� | � | � | 71,731 | �� |
| Deferred income taxes |
�� | � | (79,031 | )� | � | � | (772 | )� |
| Foreign exchange (gain) loss on cash, cash equivalents and short-term investments, net |
�� | � | 79,410 | �� | � | � | 56,822 | �� |
| Realized (gain) loss on foreign currency forwards |
�� | � | 5,481 | �� | � | � | (40,850 | )� |
| Other |
�� | � | 8,966 | �� | � | � | 10,576 | �� |
| Changes in operating assets and liabilities, net of effects from acquisitions: |
�� | � | ||||||
| Accounts receivable |
�� | � | (157,957 | )� | � | � | (127,327 | )� |
| Prepaid expenses and other current assets |
�� | � | (65,203 | )� | � | � | (18,724 | )� |
| Accounts payable, merchant |
�� | � | 110,603 | �� | � | � | 91,503 | �� |
| Accounts payable, other, accrued expenses and other current liabilities |
�� | � | 271,454 | �� | � | � | (68,239 | )� |
| Taxes payable/receivable, net |
�� | � | 39,971 | �� | � | � | (29,746 | )� |
| Deferred merchant bookings |
�� | � | 331,133 | �� | � | � | 246,229 | �� |
| Deferred revenue |
�� | � | 18,739 | �� | � | � | 13,722 | �� |
| �� | � |
� |
� | � | � |
� |
� | |
| Net cash provided by operating activities from continuing operations |
�� | � | 1,366,959 | �� | � | � | 763,200 | �� |
| �� | � |
� |
� | � | � |
� |
� | |
| Investing activities: |
�� | � | ||||||
| Capital expenditures, including internal-use software and website development |
�� | � | (328,387 | )� | � | � | (308,581 | )� |
| Purchases of investments |
�� | � | (1,194,210 | )� | � | � | (1,216,591 | )� |
| Sales and maturities of investments |
�� | � | 1,162,557 | �� | � | � | 1,502,576 | �� |
| Acquisitions, net of cash acquired |
�� | � | (560,668 | )� | � | � | (541,247 | )� |
| Net settlement of foreign currency forwards |
�� | � | (5,481 | )� | � | � | 40,850 | �� |
| Other, net |
�� | � | 1,932 | �� | � | � | (2,520 | )� |
| �� | � |
� |
� | � | � |
� |
� | |
| Net cash used in investing activities from continuing operations |
�� | � | (924,257 | )� | � | � | (525,513 | )� |
| �� | � |
� |
� | � | � |
� |
� | |
| Financing activities: |
�� | � | ||||||
| Proceeds from issuance of long-term debt, net of issuance costs |
�� | � | 492,894 | �� | � | � | ��� | �� |
| Purchases of treasury stock |
�� | � | (537,861 | )� | � | � | (522,900 | )� |
| Proceeds from issuance of treasury stock |
�� | � | 20,404 | �� | � | � | 25,273 | �� |
| Payment of dividends to stockholders |
�� | � | (84,697 | )� | � | � | (75,760 | )� |
| Proceeds from exercise of equity awards and employee stock purchase plan |
�� | � | 108,121 | �� | � | � | 56,836 | �� |
| Excess tax benefit on equity awards |
�� | � | 58,156 | �� | � | � | 39,606 | �� |
| Other, net |
�� | � | (8,868 | )� | � | � | (15,571 | )� |
| �� | � |
� |
� | � | � |
� |
� | |
| Net cash provided by (used in) financing activities from continuing operations |
�� | � | 48,149 | �� | � | � | (492,516 | )� |
| �� | � |
� |
� | � | � |
� |
� | |
| Net cash provided by continuing operations |
�� | � | 490,851 | �� | � | � | (254,829 | )� |
| Net cash provided by discontinued operations |
�� | � | ��� | �� | � | � | 13,637 | �� |
| Effect of exchange rate changes on cash and cash equivalents |
�� | � | (109,184 | )� | � | � | (30,936 | )� |
| �� | � |
� |
� | � | � |
� |
� | |
| Net increase in cash and cash equivalents |
�� | � | 381,667 | �� | � | � | (272,128 | )� |
| Cash and cash equivalents at beginning of year |
�� | � | 1,021,033 | �� | � | � | 1,293,161 | �� |
| �� | � |
� |
� | � | � |
� |
� | |
| Cash and cash equivalents at end of year |
�� | $ | 1,402,700 | �� | � | $ | 1,021,033 | �� |
| �� | � |
� |
� | � | � |
� |
� | |
| Supplemental cash flow information |
�� | � | ||||||
| Cash paid for interest from continuing operations |
�� | $ | 87,555 | �� | � | $ | 84,136 | �� |
| Income tax payments, net from continuing operations |
�� | � | 70,339 | �� | � | � | 73,439 | �� |
�
Page 10 of 17
Expedia, Inc.
Trended Metrics
(All figures in millions)
�
| � | � | � | The following metrics are intended as a supplement to the financial statements found in this release and in our filings with the SEC. In the event of discrepancies between amounts in these tables and our historical financial statements, readers should rely on our filings with the SEC and financial statements in our most recent earnings release. |
�
| � | � | � | We intend to periodically review and refine the definition, methodology and appropriateness of each of our supplemental metrics. As a result, metrics are subject to removal and/or change, and such changes could be material. |
�
| � | � | � | These metrics do not include adjustments for one-time items, acquisitions, foreign exchange or other adjustments. |
�
| � | � | � | Some numbers may not add due to rounding. |
�
| � | � | 2013 | � | � | 2014 | � | � | Full Year | � | � | Y�/�Y�Growth | � | ||||||||||||||||||||||||||||||||||||
| � | � | Q1 | � | � | Q2 | � | � | Q3 | � | � | Q4 | � | � | Q1 | � | � | Q2 | � | � | Q3 | � | � | Q4 | � | � | 2013 | � | � | 2014 | � | � | Q414 | � | � | 2014 | � | ||||||||||||
| Gross Bookings by Segment |
� | � | � | � | � | � | � | � | � | � | � | � | ||||||||||||||||||||||||||||||||||||
| Leisure |
� | $ | 8,664 | �� | � | $ | 8,933 | �� | � | $ | 9,312 | �� | � | $ | 8,000 | �� | � | $ | 11,315 | �� | � | $ | 11,718 | �� | � | $ | 12,185 | �� | � | $ | 10,081 | �� | � | $ | 34,910 | �� | � | $ | 45,298 | �� | � | � | 26 | %� | � | � | 30 | %� |
| Egencia |
� | � | 1,117 | �� | � | � | 1,188 | �� | � | � | 1,125 | �� | � | � | 1,104 | �� | � | � | 1,310 | �� | � | � | 1,328 | �� | � | � | 1,285 | �� | � | � | 1,226 | �� | � | � | 4,533 | �� | � | � | 5,149 | �� | � | � | 11 | %� | � | � | 14 | %� |
| � | � |
� |
� | � | � |
� |
� | � | � |
� |
� | � | � |
� |
� | � | � |
� |
� | � | � |
� |
� | � | � |
� |
� | � | � |
� |
� | � | � |
� |
� | � | � |
� |
� | � | � |
� |
� | � | � |
� |
� | |
| Total |
� | $ | 9,781 | �� | � | $ | 10,121 | �� | � | $ | 10,437 | �� | � | $ | 9,104 | �� | � | $ | 12,624 | �� | � | $ | 13,046 | �� | � | $ | 13,470 | �� | � | $ | 11,307 | �� | � | $ | 39,443 | �� | � | $ | 50,447 | �� | � | � | 24 | %� | � | � | 28 | %� |
| Gross Bookings by Geography |
� | � | � | � | � | � | � | � | � | � | � | � | ||||||||||||||||||||||||||||||||||||
| Domestic |
� | $ | 5,484 | �� | � | $ | 5,848 | �� | � | $ | 5,828 | �� | � | $ | 4,982 | �� | � | $ | 7,427 | �� | � | $ | 7,889 | �� | � | $ | 7,861 | �� | � | $ | 6,432 | �� | � | $ | 22,142 | �� | � | $ | 29,609 | �� | � | � | 29 | %� | � | � | 34 | %� |
| International |
� | � | 4,297 | �� | � | � | 4,273 | �� | � | � | 4,609 | �� | � | � | 4,122 | �� | � | � | 5,197 | �� | � | � | 5,157 | �� | � | � | 5,609 | �� | � | � | 4,875 | �� | � | � | 17,301 | �� | � | � | 20,838 | �� | � | � | 18 | %� | � | � | 20 | %� |
| � | � |
� |
� | � | � |
� |
� | � | � |
� |
� | � | � |
� |
� | � | � |
� |
� | � | � |
� |
� | � | � |
� |
� | � | � |
� |
� | � | � |
� |
� | � | � |
� |
� | � | � |
� |
� | � | � |
� |
� | |
| Total |
� | $ | 9,781 | �� | � | $ | 10,121 | �� | � | $ | 10,437 | �� | � | $ | 9,104 | �� | � | $ | 12,624 | �� | � | $ | 13,046 | �� | � | $ | 13,470 | �� | � | $ | 11,307 | �� | � | $ | 39,443 | �� | � | $ | 50,447 | �� | � | � | 24 | %� | � | � | 28 | %� |
| Gross Bookings by Agency/Merchant |
� | � | � | � | � | � | � | � | � | � | � | � | ||||||||||||||||||||||||||||||||||||
| Agency |
� | $ | 5,141 | �� | � | $ | 5,332 | �� | � | $ | 5,508 | �� | � | $ | 5,079 | �� | � | $ | 7,159 | �� | � | $ | 7,365 | �� | � | $ | 7,365 | �� | � | $ | 6,182 | �� | � | $ | 21,060 | �� | � | $ | 28,071 | �� | � | � | 22 | %� | � | � | 33 | %� |
| Merchant |
� | � | 4,640 | �� | � | � | 4,789 | �� | � | � | 4,929 | �� | � | � | 4,025 | �� | � | � | 5,465 | �� | � | � | 5,681 | �� | � | � | 6,104 | �� | � | � | 5,125 | �� | � | � | 18,382 | �� | � | � | 22,376 | �� | � | � | 27 | %� | � | � | 22 | %� |
| � | � |
� |
� | � | � |
� |
� | � | � |
� |
� | � | � |
� |
� | � | � |
� |
� | � | � |
� |
� | � | � |
� |
� | � | � |
� |
� | � | � |
� |
� | � | � |
� |
� | � | � |
� |
� | � | � |
� |
� | |
| Total |
� | $ | 9,781 | �� | � | $ | 10,121 | �� | � | $ | 10,437 | �� | � | $ | 9,104 | �� | � | $ | 12,624 | �� | � | $ | 13,046 | �� | � | $ | 13,470 | �� | � | $ | 11,307 | �� | � | $ | 39,443 | �� | � | $ | 50,447 | �� | � | � | 24 | %� | � | � | 28 | %� |
| Revenue |
� | � | � | � | � | � | � | � | � | � | � | � | ||||||||||||||||||||||||||||||||||||
| Leisure |
� | $ | 924 | �� | � | $ | 1,110 | �� | � | $ | 1,316 | �� | � | $ | 1,056 | �� | � | $ | 1,100 | �� | � | $ | 1,392 | �� | � | $ | 1,616 | �� | � | $ | 1,256 | �� | � | $ | 4,406 | �� | � | $ | 5,364 | �� | � | � | 19 | %� | � | � | 22 | %� |
| Egencia |
� | � | 89 | �� | � | � | 95 | �� | � | � | 85 | �� | � | � | 96 | �� | � | � | 100 | �� | � | � | 103 | �� | � | � | 97 | �� | � | � | 100 | �� | � | � | 365 | �� | � | � | 400 | �� | � | � | 4 | %� | � | � | 10 | %� |
| � | � |
� |
� | � | � |
� |
� | � | � |
� |
� | � | � |
� |
� | � | � |
� |
� | � | � |
� |
� | � | � |
� |
� | � | � |
� |
� | � | � |
� |
� | � | � |
� |
� | � | � |
� |
� | � | � |
� |
� | |
| Total |
� | $ | 1,012 | �� | � | $ | 1,205 | �� | � | $ | 1,402 | �� | � | $ | 1,152 | �� | � | $ | 1,200 | �� | � | $ | 1,495 | �� | � | $ | 1,713 | �� | � | $ | 1,356 | �� | � | $ | 4,771 | �� | � | $ | 5,763 | �� | � | � | 18 | %� | � | � | 21 | %� |
| Revenue by Geography |
� | � | � | � | � | � | � | � | � | � | � | � | ||||||||||||||||||||||||||||||||||||
| Domestic |
� | $ | 558 | �� | � | $ | 650 | �� | � | $ | 717 | �� | � | $ | 585 | �� | � | $ | 642 | �� | � | $ | 789 | �� | � | $ | 888 | �� | � | $ | 728 | �� | � | $ | 2,510 | �� | � | $ | 3,047 | �� | � | � | 24 | %� | � | � | 21 | %� |
| International |
� | � | 454 | �� | � | � | 555 | �� | � | � | 685 | �� | � | � | 567 | �� | � | � | 559 | �� | � | � | 706 | �� | � | � | 824 | �� | � | � | 628 | �� | � | � | 2,261 | �� | � | � | 2,717 | �� | � | � | 11 | %� | � | � | 20 | %� |
| � | � |
� |
� | � | � |
� |
� | � | � |
� |
� | � | � |
� |
� | � | � |
� |
� | � | � |
� |
� | � | � |
� |
� | � | � |
� |
� | � | � |
� |
� | � | � |
� |
� | � | � |
� |
� | � | � |
� |
� | |
| Total |
� | $ | 1,012 | �� | � | $ | 1,205 | �� | � | $ | 1,402 | �� | � | $ | 1,152 | �� | � | $ | 1,200 | �� | � | $ | 1,495 | �� | � | $ | 1,713 | �� | � | $ | 1,356 | �� | � | $ | 4,771 | �� | � | $ | 5,763 | �� | � | � | 18 | %� | � | � | 21 | %� |
| Revenue by Agency/Merchant/ |
� | � | � | � | � | � | � | � | � | � | � | � | ||||||||||||||||||||||||||||||||||||
| Agency |
� | $ | 226 | �� | � | $ | 261 | �� | � | $ | 320 | �� | � | $ | 284 | �� | � | $ | 319 | �� | � | $ | 388 | �� | � | $ | 467 | �� | � | $ | 361 | �� | � | $ | 1,092 | �� | � | $ | 1,535 | �� | � | � | 27 | %� | � | � | 41 | %� |
| Merchant |
� | � | 741 | �� | � | � | 864 | �� | � | � | 972 | �� | � | � | 783 | �� | � | � | 782 | �� | � | � | 984 | �� | � | � | 1,105 | �� | � | � | 878 | �� | � | � | 3,360 | �� | � | � | 3,749 | �� | � | � | 12 | %� | � | � | 12 | %� |
| Advertising & Media |
� | � | 46 | �� | � | � | 80 | �� | � | � | 109 | �� | � | � | 84 | �� | � | � | 99 | �� | � | � | 123 | �� | � | � | 141 | �� | � | � | 117 | �� | � | � | 319 | �� | � | � | 479 | �� | � | � | 38 | %� | � | � | 50 | %� |
| � | � |
� |
� | � | � |
� |
� | � | � |
� |
� | � | � |
� |
� | � | � |
� |
� | � | � |
� |
� | � | � |
� |
� | � | � |
� |
� | � | � |
� |
� | � | � |
� |
� | � | � |
� |
� | � | � |
� |
� | |
| Total |
� | $ | 1,012 | �� | � | $ | 1,205 | �� | � | $ | 1,402 | �� | � | $ | 1,152 | �� | � | $ | 1,200 | �� | � | $ | 1,495 | �� | � | $ | 1,713 | �� | � | $ | 1,356 | �� | � | $ | 4,771 | �� | � | $ | 5,763 | �� | � | � | 18 | %� | � | � | 21 | %� |
| Adjusted EBITDA |
� | � | � | � | � | � | � | � | � | � | � | � | ||||||||||||||||||||||||||||||||||||
| Leisure |
� | $ | 178 | �� | � | $ | 265 | �� | � | $ | 419 | �� | � | $ | 315 | �� | � | $ | 181 | �� | � | $ | 342 | �� | � | $ | 495 | �� | � | $ | 346 | �� | � | $ | 1,177 | �� | � | $ | 1,364 | �� | � | � | 10 | %� | � | � | 16 | %� |
| Unallocated Overhead Costs |
� | � | (85 | )� | � | � | (91 | )� | � | � | (91 | )� | � | � | (91 | )� | � | � | (91 | )� | � | � | (100 | )� | � | � | (101 | )� | � | � | (107 | )� | � | � | (358 | )� | � | � | (399 | )� | � | � | 17 | %� | � | � | 12 | %� |
| � | � |
� |
� | � | � |
� |
� | � | � |
� |
� | � | � |
� |
� | � | � |
� |
� | � | � |
� |
� | � | � |
� |
� | � | � |
� |
� | � | � |
� |
� | � | � |
� |
� | � | � |
� |
� | � | � |
� |
� | |
| Subtotal |
� | $ | 93 | �� | � | $ | 174 | �� | � | $ | 328 | �� | � | $ | 224 | �� | � | $ | 90 | �� | � | $ | 242 | �� | � | $ | 393 | �� | � | $ | 239 | �� | � | $ | 820 | �� | � | $ | 965 | �� | � | � | 7 | %� | � | � | 18 | %� |
| Egencia |
� | � | 12 | �� | � | � | 18 | �� | � | � | 11 | �� | � | � | 18 | �� | � | � | 16 | �� | � | � | 17 | �� | � | � | 16 | �� | � | � | 10 | �� | � | $ | 59 | �� | � | $ | 60 | �� | � | � | -42 | %� | � | � | 1 | %� |
| � | � |
� |
� | � | � |
� |
� | � | � |
� |
� | � | � |
� |
� | � | � |
� |
� | � | � |
� |
� | � | � |
� |
� | � | � |
� |
� | � | � |
� |
� | � | � |
� |
� | � | � |
� |
� | � | � |
� |
� | |
| Total |
� | $ | 105 | �� | � | $ | 192 | �� | � | $ | 340 | �� | � | $ | 242 | �� | � | $ | 107 | �� | � | $ | 259 | �� | � | $ | 409 | �� | � | $ | 250 | �� | � | $ | 879 | �� | � | $ | 1,025 | �� | � | � | 3 | %� | � | � | 17 | %� |
| Worldwide Hotel (Merchant�& Agency) |
� | � | � | � | � | � | � | � | � | � | � | � | ||||||||||||||||||||||||||||||||||||
| Room Nights |
� | � | 29.0 | �� | � | � | 35.9 | �� | � | � | 44.1 | �� | � | � | 37.1 | �� | � | � | 35.9 | �� | � | � | 45.9 | �� | � | � | 54.5 | �� | � | � | 47.3 | �� | � | � | 146.1 | �� | � | � | 183.7 | �� | � | � | ||||||
| Room Night Growth |
� | � | 28 | %� | � | � | 19 | %� | � | � | 20 | %� | � | � | 25 | %� | � | � | 24 | %� | � | � | 28 | %� | � | � | 24 | %� | � | � | 28 | %� | � | � | 23 | %� | � | � | 26 | %� | � | � | ||||||
| Domestic Room Night Growth |
� | � | 15 | %� | � | � | 11 | %� | � | � | 12 | %� | � | � | 18 | %� | � | � | 20 | %� | � | � | 24 | %� | � | � | 24 | %� | � | � | 25 | %� | � | � | 14 | %� | � | � | 23 | %� | � | � | ||||||
| International Room Night Growth |
� | � | 43 | %� | � | � | 29 | %� | � | � | 28 | %� | � | � | 31 | %� | � | � | 27 | %� | � | � | 31 | %� | � | � | 24 | %� | � | � | 30 | %� | � | � | 32 | %� | � | � | 28 | %� | � | � | ||||||
| ADR Growth |
� | � | 0 | %� | � | � | 0 | %� | � | � | 0 | %� | � | � | 0 | %� | � | � | 1 | %� | � | � | 2 | %� | � | � | 5 | %� | � | � | 0 | %� | � | � | 0 | %� | � | � | 2 | %� | � | � | ||||||
| Revenue per Night Growth |
� | � | -3 | %� | � | � | -6 | %� | � | � | -7 | %� | � | � | -9 | %� | � | � | -10 | %� | � | � | -4 | %� | � | � | -2 | %� | � | � | -10 | %� | � | � | -7 | %� | � | � | -6 | %� | � | � | ||||||
| Revenue Growth |
� | � | 24 | %� | � | � | 12 | %� | � | � | 11 | %� | � | � | 13 | %� | � | � | 12 | %� | � | � | 23 | %� | � | � | 21 | %� | � | � | 15 | %� | � | � | 14 | %� | � | � | 18 | %� | � | � | ||||||
| Worldwide Air (Merchant�& Agency) |
� | � | � | � | � | � | � | � | � | � | � | � | ||||||||||||||||||||||||||||||||||||
| Tickets Sold Growth |
� | � | 9 | %� | � | � | 7 | %� | � | � | 7 | %� | � | � | 13 | %� | � | � | 30 | %� | � | � | 28 | %� | � | � | 30 | %� | � | � | 26 | %� | � | � | 9 | %� | � | � | 28 | %� | � | � | ||||||
| Airfare Growth |
� | � | 0 | %� | � | � | 0 | %� | � | � | 3 | %� | � | � | 1 | %� | � | � | 1 | %� | � | � | 3 | %� | � | � | 0 | %� | � | � | -4 | %� | � | � | 1 | %� | � | � | 0 | %� | � | � | ||||||
| Revenue per Ticket Growth |
� | � | 5 | %� | � | � | 1 | %� | � | � | 9 | %� | � | � | 3 | %� | � | � | -2 | %� | � | � | -5 | %� | � | � | -7 | %� | � | � | -6 | %� | � | � | 4 | %� | � | � | -5 | %� | � | � | ||||||
| Revenue Growth |
� | � | 14 | %� | � | � | 8 | %� | � | � | 16 | %� | � | � | 17 | %� | � | � | 28 | %� | � | � | 22 | %� | � | � | 21 | %� | � | � | 18 | %� | � | � | 14 | %� | � | � | 22 | %� | � | � | ||||||
Notes:
The metrics above exclude results from the joint venture between Brand Expedia and AirAsia.
The metrics above include trivago GmbH following the acquisition of a controlling interest on March�8, 2013 and Wotif group following the acquisition on November�13, 2014. trivago GmbH and Wotif group results are recorded within the Leisure segment.
Advertising�& Media Revenue includes revenue from trivago GmbH. All trivago GmbH revenue is classified as international.
Beginning in Q1 2014, Expedia moved to a new Enterprise Accounting System of Record, which caused immaterial changes to some of the metrics above due to remapping.
In Q4 2014, Expedia reclassified certain prior period amounts relating to eLong from agency gross bookings and revenue to merchant gross bookings and revenue. Consolidated amounts did not change.
�
Page 11 of 17
Notes�& Definitions:
Gross Bookings � Total retail value of transactions booked for both agency and merchant transactions, recorded at the time of booking. Bookings include the total price due for travel, including taxes, fees and other charges, and are generally reduced for cancellations and refunds.
Leisure � Reflects results for travel products and services provided to customers of our leisure travel sites including Expedia branded sites, Hotels.com branded sites, Hotwire.com, the Expedia Affiliate Network, trivago, eLong and other leisure brands.
Egencia � Reflects worldwide results for our managed corporate travel business.
Corporate � Includes unallocated corporate expenses.
Worldwide Hotel metrics � Reported on a stayed basis, and include both merchant and agency model hotel stays.
Worldwide Air metrics � Reported on a booked basis and includes both merchant and agency air bookings.
Definitions of Non-GAAP Measures
Expedia, Inc. reports Adjusted EBITDA, Adjusted Net Income, Adjusted EPS, Free Cash Flow and Adjusted Expenses (non-GAAP cost of revenue, non-GAAP selling and marketing, non-GAAP technology and content and non-GAAP general and administrative), all of which are supplemental measures to GAAP and are defined by the SEC as non-GAAP financial measures. These measures are among the primary metrics by which management evaluates the performance of the business and on which internal budgets are based. Management believes that investors should have access to the same set of tools that management uses to analyze our results. These non-GAAP measures should be considered in addition to results prepared in accordance with GAAP, but should not be considered a substitute for or superior to GAAP. Adjusted EBITDA, Adjusted Net Income, Adjusted EPS have certain limitations in that they do not take into account the impact of certain expenses to our consolidated statements of operations. We endeavor to compensate for the limitation of the non-GAAP measures presented by also providing the most directly comparable GAAP measures and descriptions of the reconciling items and adjustments to derive the non-GAAP measures. Adjusted EBITDA, Adjusted Net Income and Adjusted EPS also exclude certain items related to transactional tax matters, which may ultimately be settled in cash, and we urge investors to review the detailed disclosure regarding these matters in the Management Discussion and Analysis, Legal Proceedings sections, as well as the notes to the financial statements, included in the Company�s annual and quarterly reports filed with the Securities and Exchange Commission. The non-GAAP financial measures used by the Company may be calculated differently from, and therefore may not be comparable to, similarly titled measures used by other companies. The definition of Adjusted Net Income was revised in the fourth quarters of 2010, 2011 and 2012 and the definition for Adjusted Earnings Before Interest, Taxes, Depreciation and Amortization was revised in the fourth quarter of 2012. The definition of Adjusted Expenses was revised in the first quarter of 2014.
Adjusted EBITDA is defined as operating income / (loss) plus: (1)�stock-based compensation expense, including compensation expense related to certain subsidiary equity plans; (2)�acquisition-related impacts, including (i)�amortization of intangible assets and goodwill and intangible asset impairment, (ii)�gains (losses) recognized on changes in the value of contingent consideration arrangements; and (iii)�upfront consideration paid to settle employee compensation plans of the acquiree; (3)�certain infrequently occurring items, including restructuring; (4)�items included in Legal reserves, occupancy tax and other, which includes reserves for potential settlement of issues related to transactional taxes (e.g. hotel and excise taxes), related to court decisions and final settlements, and charges incurred, if any, for monies that may be required to be paid in advance of litigation in certain transactional tax proceedings; (5)�gains (losses) realized on revenue hedging activities that are included in other, net; and (6)�depreciation.
The above items are excluded from our Adjusted EBITDA measure because these items are noncash in nature, or because the amount and timing of these items is unpredictable, not driven by core operating results and renders comparisons with prior periods and competitors less meaningful. We believe Adjusted EBITDA is a useful measure for analysts and investors to evaluate our future on-going performance as this measure allows a more meaningful comparison of our performance and projected cash earnings with our historical results from prior periods and to the results of our competitors. Moreover, our management uses this measure internally to evaluate the performance of our business as a whole and our individual business segments. In addition, we believe that by excluding certain items, such as stock-based compensation and acquisition-related impacts, Adjusted EBITDA corresponds more closely to the cash operating income generated from our business and allows investors to gain an understanding of the factors and trends affecting the ongoing cash earnings capabilities of our business, from which capital investments are made and debt is serviced.
�
Page 12 of 17
Adjusted Net Income generally captures all items on the statements of operations that occur in normal course operations and have been, or ultimately will be, settled in cash and is defined as net income/(loss) attributable to Expedia, Inc. plus net of tax: (1)�stock-based compensation expense, including compensation expense related to equity plans of certain subsidiaries and equity-method investments; (2)�acquisition-related impacts, including (i)�amortization of intangible assets, including as part of equity-method investments, and goodwill and intangible asset impairment, (ii)�gains (losses) recognized on changes in the value of contingent consideration arrangements, and (iii)�upfront consideration paid to settle employee compensation plans of the acquiree and (iv)�gains (losses) recognized on noncontrolling investment basis adjustments when we acquire controlling interests; (3)�currency gains or losses on U.S. dollar denominated cash or investments held by eLong; (4)�certain other infrequently occurring items, including restructuring charges; (5)�items included in Legal reserves, occupancy tax and other, which includes reserves for potential settlement of issues related to transactional taxes (e.g., hotel occupancy and excise taxes), related court decisions and final settlements, and charges incurred, if any, for monies that may be required to be paid in advance of litigation in certain transactional tax proceedings; (6)�discontinued operations; (7)�the noncontrolling interest impact of the aforementioned adjustment items and (8)�unrealized gains (losses) on revenue hedging activities that are included in other, net. We believe Adjusted Net Income is useful to investors because it represents Expedia, Inc.�s combined results, taking into account depreciation, which management believes is an ongoing cost of doing business, but excluding the impact of certain expenses, infrequently occurring items and items not directly tied to the core operations of our businesses.
Adjusted EPS is defined as Adjusted Net Income divided by adjusted weighted average shares outstanding, which include dilution from options per the treasury stock method and include all shares relating to RSUs in shares outstanding for Adjusted EPS. This differs from the GAAP method for including RSUs, which treats them on a treasury method basis. Shares outstanding for Adjusted EPS purposes are therefore higher than shares outstanding for GAAP EPS purposes. We believe Adjusted EPS is useful to investors because it represents, on a per share basis, Expedia�s consolidated results, taking into account depreciation, which we believe is an ongoing cost of doing business, as well as other items which are not allocated to the operating businesses such as interest expense, taxes, foreign exchange gains or losses, and minority interest, but excluding the effects of certain expenses not directly tied to the core operations of our businesses. Adjusted Net Income and Adjusted EPS have similar limitations as Adjusted EBITDA. In addition, Adjusted Net Income does not include all items that affect our net income / (loss) and net income / (loss) per share for the period. Therefore, we think it is important to evaluate these measures along with our consolidated statements of operations.
Free Cash Flow is defined as net cash flow provided by operating activities less capital expenditures. Management believes Free Cash Flow is useful to investors because it represents the operating cash flow that our operating businesses generate, less capital expenditures but before taking into account other cash movements that are not directly tied to the core operations of our businesses, such as financing activities, foreign exchange or certain investing activities. Free Cash Flow has certain limitations in that it does not represent the total increase or decrease in the cash balance for the period, nor does it represent the residual cash flow for discretionary expenditures. Therefore, it is important to evaluate Free Cash Flow along with the consolidated statements of cash flows.
Adjusted Expenses (cost of revenue, selling and marketing, technology and content and general and administrative expenses) exclude stock-based compensation related to expenses for stock options, restricted stock units and other equity compensation under applicable stock-based compensation accounting standards as well as depreciation expense. Expedia, Inc. excludes stock-based compensation and depreciation expenses from these measures primarily because they are non-cash expenses that we do not believe are necessarily reflective of our ongoing cash operating expenses and cash operating income. Moreover, because of varying available valuation methodologies, subjective assumptions and the variety of award types that companies can use when adopting applicable stock-based compensation accounting standards, management believes that providing non-GAAP financial measures that exclude stock-based compensation allows investors to make meaningful comparisons between our recurring core business operating results and those of other companies, as well as providing management with an important tool for financial operational decision making and for evaluating our own recurring core business operating results over different periods of time. Exclusion of depreciation expense also allows the year-over-year comparison of expenses on a basis that is consistent with the year-over-year comparison of Adjusted EBITDA. There are certain limitations in using financial measures that do not take into account stock-based compensation and depreciation expense, including the fact that stock-based compensation is a recurring expense and a valued part of employees� compensation and depreciation expense is also a recurring expense and is a direct result of previous capital investment decisions made by management. Therefore it is important to evaluate both our GAAP and non-GAAP measures. See the Notes to the Consolidated Statements of Operations for stock-based compensation and depreciation expense by line item.
�
Page 13 of 17
Tabular Reconciliations for Non-GAAP Measures
Adjusted EBITDA (Adjusted Earnings Before Interest, Taxes, Depreciation�& Amortization)
�
| � | �� | Three months ended December�31, |
� | � | Year ended December�31, |
� | ||||||||||
| � | �� | 2014 | � | � | 2013 | � | � | 2014 | � | � | 2013 | � | ||||
| � | �� | (In thousands) | � | |||||||||||||
| Adjusted EBITDA |
�� | $ | 249,691 | �� | � | $ | 241,996 | �� | � | $ | 1,024,788 | �� | � | $ | 878,723 | �� |
| Depreciation |
�� | � | (70,656 | )� | � | � | (58,774 | )� | � | � | (265,817 | )� | � | � | (211,744 | )� |
| Amortization of intangible assets |
�� | � | (24,340 | )� | � | � | (21,810 | )� | � | � | (79,615 | )� | � | � | (71,731 | )� |
| Stock-based compensation |
�� | � | (16,872 | )� | � | � | (20,970 | )� | � | � | (85,011 | )� | � | � | (130,173 | )� |
| Legal reserves, occupancy tax and other |
�� | � | (2,696 | )� | � | � | (3,241 | )� | � | � | (41,539 | )� | � | � | (77,919 | )� |
| Restructuring and related reorganization charges |
�� | � | (25,630 | )� | � | � | ��� | �� | � | � | (25,630 | )� | � | � | ��� | �� |
| Acquisition-related and other |
�� | � | ��� | �� | � | � | ��� | �� | � | � | ��� | �� | � | � | (9,829 | )� |
| Realized (gain) loss on revenue hedges |
�� | � | (14,791 | )� | � | � | 1,510 | �� | � | � | (9,412 | )� | � | � | (11,267 | )� |
| �� | � |
� |
� | � | � |
� |
� | � | � |
� |
� | � | � |
� |
� | |
| Operating income |
�� | � | 94,706 | �� | � | � | 138,711 | �� | � | � | 517,764 | �� | � | � | 366,060 | �� |
| Interest expense, net |
�� | � | (21,874 | )� | � | � | (17,073 | )� | � | � | (70,801 | )� | � | � | (62,579 | )� |
| Other, net |
�� | � | 15,164 | �� | � | � | (1,177 | )� | � | � | 17,678 | �� | � | � | (2,788 | )� |
| �� | � |
� |
� | � | � |
� |
� | � | � |
� |
� | � | � |
� |
� | |
| Income before income taxes |
�� | � | 87,996 | �� | � | � | 120,461 | �� | � | � | 464,641 | �� | � | � | 300,693 | �� |
| Provision for income taxes |
�� | � | (31,717 | )� | � | � | (26,474 | )� | � | � | (91,691 | )� | � | � | (84,335 | )� |
| �� | � |
� |
� | � | � |
� |
� | � | � |
� |
� | � | � |
� |
� | |
| Net income |
�� | � | 56,279 | �� | � | � | 93,987 | �� | � | � | 372,950 | �� | � | � | 216,358 | �� |
| Net loss attributable to noncontrolling interests |
�� | � | 9,690 | �� | � | � | 730 | �� | � | � | 25,147 | �� | � | � | 16,492 | �� |
| �� | � |
� |
� | � | � |
� |
� | � | � |
� |
� | � | � |
� |
� | |
| Net income attributable to Expedia, Inc. |
�� | $ | 65,969 | �� | � | $ | 94,717 | �� | � | $ | 398,097 | �� | � | $ | 232,850 | �� |
| �� | � |
� |
� | � | � |
� |
� | � | � |
� |
� | � | � |
� |
� | |
Adjusted Net Income�& Adjusted EPS
�
| � | �� | Three months ended December�31, |
� | � | Year ended December�31, |
� | ||||||||||
| � | �� | 2014 | � | � | 2013 | � | � | 2014 | � | � | 2013 | � | ||||
| � | �� | (In thousands) | � | |||||||||||||
| Net income attributable to Expedia, Inc. |
�� | $ | 65,969 | �� | � | $ | 94,717 | �� | � | $ | 398,097 | �� | � | $ | 232,850 | �� |
| Amortization of intangible assets |
�� | � | 24,340 | �� | � | � | 21,810 | �� | � | � | 79,615 | �� | � | � | 71,731 | �� |
| Stock-based compensation |
�� | � | 16,872 | �� | � | � | 20,970 | �� | � | � | 85,011 | �� | � | � | 130,173 | �� |
| Legal reserves, occupancy tax and other |
�� | � | 2,696 | �� | � | � | 3,241 | �� | � | � | 41,539 | �� | � | � | 77,919 | �� |
| Restructuring and related reorganization charges |
�� | � | 25,630 | �� | � | � | ��� | �� | � | � | 25,630 | �� | � | � | ��� | �� |
| Acquisition-related and other |
�� | � | ��� | �� | � | � | ��� | �� | � | � | ��� | �� | � | � | 9,829 | �� |
| Noncontrolling investment basis adjustment |
�� | � | (2,783 | )� | � | � | ��� | �� | � | � | (2,783 | )� | � | � | ��� | �� |
| Foreign currency (gain) loss on U.S. dollar cash balances held by eLong |
�� | � | (233 | )� | � | � | (38 | )� | � | � | (249 | )� | � | � | (165 | )� |
| Unrealized (gain) loss on revenue hedges |
�� | � | (845 | )� | � | � | (2,709 | )� | � | � | (10,680 | )� | � | � | (1,072 | )� |
| Stock-based compensation as part of equity method investments |
�� | � | 511 | �� | � | � | 133 | �� | � | � | 730 | �� | � | � | 232 | �� |
| Other-than-temporary investment impairment |
�� | � | 5,666 | �� | � | � | 4,247 | �� | � | � | 5,666 | �� | � | � | 4,247 | �� |
| Provision for income taxes |
�� | � | (21,776 | )� | � | � | (12,837 | )� | � | � | (77,388 | )� | � | � | (58,493 | )� |
| Noncontrolling interests |
�� | � | (3,077 | )� | � | � | (4,256 | )� | � | � | (17,092 | )� | � | � | (15,278 | )� |
| �� | � |
� |
� | � | � |
� |
� | � | � |
� |
� | � | � |
� |
� | |
| Adjusted Net Income |
�� | $ | 112,970 | �� | � | $ | 125,278 | �� | � | $ | 528,096 | �� | � | $ | 451,973 | �� |
| �� | � |
� |
� | � | � |
� |
� | � | � |
� |
� | � | � |
� |
� | |
| GAAP diluted weighted average shares outstanding |
�� | � | 131,639 | �� | � | � | 135,571 | �� | � | � | 133,168 | �� | � | � | 139,593 | �� |
| Additional dilutive securities |
�� | � | 238 | �� | � | � | 327 | �� | � | � | 245 | �� | � | � | 565 | �� |
| �� | � |
� |
� | � | � |
� |
� | � | � |
� |
� | � | � |
� |
� | |
| Adjusted weighted average shares outstanding |
�� | � | 131,877 | �� | � | � | 135,898 | �� | � | � | 133,413 | �� | � | � | 140,158 | �� |
| �� | � |
� |
� | � | � |
� |
� | � | � |
� |
� | � | � |
� |
� | |
| Diluted earnings per share |
�� | $ | 0.50 | �� | � | $ | 0.70 | �� | � | $ | 2.99 | �� | � | $ | 1.67 | �� |
| Adjusted earnings per share |
�� | � | 0.86 | �� | � | � | 0.92 | �� | � | � | 3.96 | �� | � | � | 3.22 | �� |
�
Page 14 of 17
Free Cash Flow
�
| � | �� | Three months ended December�31, |
� | � | Year ended December�31, |
� | ||||||||||
| � | �� | 2014 | � | � | 2013 | � | � | 2014 | � | � | 2013 | � | ||||
| � | �� | (In thousands) | � | |||||||||||||
| Net cash provided by operating activities |
�� | $ | (199,843 | )� | � | $ | (212,215 | )� | � | $ | 1,366,959 | �� | � | $ | 763,200 | �� |
| Less: capital expenditures |
�� | � | (88,709 | )� | � | � | (73,165 | )� | � | � | (328,387 | )� | � | � | (308,581 | )� |
| �� | � |
� |
� | � | � |
� |
� | � | � |
� |
� | � | � |
� |
� | |
| Free cash flow |
�� | $ | (288,552 | )� | � | $ | (285,380 | )� | � | $ | 1,038,572 | �� | � | $ | 454,619 | �� |
| �� | � |
� |
� | � | � |
� |
� | � | � |
� |
� | � | � |
� |
� | |
Adjusted Expenses (cost of revenue, selling and marketing, technology and content and general and administrative expenses)
�
| � | �� | Three months ended December�31, |
� | � | Year ended December�31, |
� | ||||||||||
| � | �� | 2014 | � | � | 2013 | � | � | 2014 | � | � | 2013 | � | ||||
| � | �� | (in thousands) | � | |||||||||||||
| Cost of revenue |
�� | $ | 284,253 | �� | � | $ | 248,528 | �� | � | $ | 1,179,081 | �� | � | $ | 1,038,034 | �� |
| Less: stock-based compensation |
�� | � | (731 | )� | � | � | (1,040 | )� | � | � | (3,921 | )� | � | � | (3,752 | )� |
| Less: depreciation |
�� | � | (9,838 | )� | � | � | (8,644 | )� | � | � | (35,392 | )� | � | � | (34,273 | )� |
| �� | � |
� |
� | � | � |
� |
� | � | � |
� |
� | � | � |
� |
� | |
| Adjusted cost of revenue |
�� | $ | 273,684 | �� | � | $ | 238,844 | �� | � | $ | 1,139,768 | �� | � | $ | 1,000,009 | �� |
| Selling and marketing expense |
�� | $ | 624,214 | �� | � | $ | 484,226 | �� | � | $ | 2,808,329 | �� | � | $ | 2,196,145 | �� |
| Less: stock-based compensation |
�� | � | (4,269 | )� | � | � | (4,333 | )� | � | � | (18,067 | )� | � | � | (16,190 | )� |
| Less: depreciation |
�� | � | (2,025 | )� | � | � | (1,974 | )� | � | � | (7,782 | )� | � | � | (6,639 | )� |
| �� | � |
� |
� | � | � |
� |
� | � | � |
� |
� | � | � |
� |
� | |
| Adjusted selling and marketing expense |
�� | $ | 617,920 | �� | � | $ | 477,919 | �� | � | $ | 2,782,480 | �� | � | $ | 2,173,316 | �� |
| Technology and content expense |
�� | $ | 181,350 | �� | � | $ | 155,039 | �� | � | $ | 686,154 | �� | � | $ | 577,820 | �� |
| Less: stock-based compensation |
�� | � | (4,208 | )� | � | � | (5,006 | )� | � | � | (22,100 | )� | � | � | (20,465 | )� |
| Less: depreciation |
�� | � | (56,372 | )� | � | � | (46,072 | )� | � | � | (214,262 | )� | � | � | (163,384 | )� |
| �� | � |
� |
� | � | � |
� |
� | � | � |
� |
� | � | � |
� |
� | |
| Adjusted technology and content expense |
�� | $ | 120,770 | �� | � | $ | 103,961 | �� | � | $ | 449,792 | �� | � | $ | 393,971 | �� |
| General and administrative expense |
�� | $ | 118,789 | �� | � | $ | 100,460 | �� | � | $ | 425,373 | �� | � | $ | 377,078 | �� |
| Less: stock-based compensation |
�� | � | (7,664 | )� | � | � | (10,591 | )� | � | � | (40,923 | )� | � | � | (33,123 | )� |
| Less: depreciation |
�� | � | (2,421 | )� | � | � | (2,084 | )� | � | � | (8,381 | )� | � | � | (7,448 | )� |
| �� | � |
� |
� | � | � |
� |
� | � | � |
� |
� | � | � |
� |
� | |
| Adjusted general and administrative expense |
�� | $ | 108,704 | �� | � | $ | 87,785 | �� | � | $ | 376,069 | �� | � | $ | 336,507 | �� |
Conference Call
Expedia, Inc. will webcast a conference call to discuss fourth quarter and full year 2014 financial results and certain forward-looking information on Thursday, February�5, 2015 at 1:30 p.m. Pacific Time (PT). The webcast will be open to the public and available via http://ir.expediainc.com. Expedia, Inc. expects to maintain access to the webcast on the IR website for approximately three months subsequent to the initial broadcast.
Safe Harbor Statement Under the Private Securities Litigation Reform Act of 1995
This release contains �forward-looking statements� within the meaning of the Private Securities Litigation Reform Act of 1995. These statements are not guarantees of future performance. These forward-looking statements are based on management�s expectations as of February�5, 2015 and assumptions which are inherently subject to uncertainties, risks and changes in circumstances that are difficult to predict. The use of words such as �intends� and �expects,� among others, generally identify forward-looking statements. However, these words are not the exclusive means of identifying such statements. In addition, any statements that refer to expectations, projections or other characterizations of future events or circumstances are forward-looking statements and may include statements relating to future revenues, expenses, margins, profitability, net income / (loss), earnings per share and other measures of results of operations and the prospects for future growth of Expedia, Inc.�s business.
Actual results and the timing and outcome of events may differ materially from those expressed or implied in the forward-looking statements for a variety of reasons, including, among others:
�
| � | � | � | an increasingly competitive global environment; |
�
| � | � | � | our failure to modify to our current business models and practices or adopt new business models or practices in order to compete in a dynamic industry; |
�
Page 15 of 17
| � | � | � | changes in search engine algorithms and dynamics or other traffic-generating arrangements; |
�
| � | � | � | our failure to maintain and expand our relationships and contractual agreements with travel suppliers or travel distribution partners; |
�
| � | � | � | our failure to maintain and expand our brand awareness or increased costs to do so; |
�
| � | � | � | our failure to adapt to technological developments or industry trends; |
�
| � | � | � | risks related to our acquisitions, investments or significant commercial arrangements; |
�
| � | � | � | risks relating to our operations in international markets, including China; |
�
| � | � | � | our failure to comply with current laws, rules and regulations, or changes to such laws, rules and regulations; |
�
| � | � | � | adverse application of existing tax or unclaimed property laws, rules or regulations or implementation; |
�
| � | � | � | unfavorable amendment to existing tax laws, rules or regulations or enactment of new unfavorable laws, rules or regulations; |
�
| � | � | � | adverse outcomes in legal proceedings to which we are a party; |
�
| � | � | � | declines or disruptions in the travel industry; |
�
| � | � | � | risks related to payments and fraud; |
�
| � | � | � | fluctuations in foreign exchange rates; |
�
| � | � | � | volatility in our stock price; |
�
| � | � | � | liquidity constraints or our inability to access the capital markets when necessary; |
�
| � | � | � | interruption, security breached or lack of redundancy in our information systems; |
�
| � | � | � | our failure to comply with governmental regulation and other legal obligations related to our processing, storage, use and disclosure of personal information, payment card information and other consumer data; |
�
| � | � | � | our failure to retain or motivate key personnel or hire, retain and motivate qualified personnel, including senior management; |
�
| � | � | � | changes in control of the Company; |
�
| � | � | � | management and director conflicts of interest; |
�
| � | � | � | risks related to actions taken by our business partners and third party service providers, including failure to comply with our requirements or standards or the requirements or standards of governmental authorities, or any cessation of their operations; |
�
| � | � | � | risks related to the failure of counterparties to perform on financial obligations; |
�
| � | � | � | risks related to our long-term indebtedness; |
�
| � | � | � | our failure to effectively operate our businesses due to restrictive covenants in the agreements governing our indebtedness; |
�
| � | � | � | our failure to protect our intellectual property from copying or use by others, including competitors; |
as well as other risks detailed in our public filings with the SEC, including our annual report on Form 10-K for the year ended December�31, 2014. Except as required by law, we undertake no obligation to update any forward-looking or other statements in this release, whether as a result of new information, future events or otherwise.
About Expedia, Inc.
Expedia, Inc. (NASDAQ: EXPE) is one of the world�s largest travel companies, with an extensive brand portfolio that includes leading online travel brands, such as:
�
| � | � | � | Expedia.com�, the world�s largest full service online travel agency with localized sites in 31 countries |
�
| � | � | � | Hotels.com�, the hotel specialist with localized sites in more than 60 countries |
�
| � | � | � | Hotwire�, a leading discount travel site that offers opaque deals in 12 countries throughout North America, Europe and Asia |
�
| � | � | � | Travelocity�, a pioneer in online travel and a leading online travel agency in the US and Canada |
�
| � | � | � | Egencia�, the world�s fifth largest corporate travel management company |
�
| � | � | � | eLong�, a leading mobile and online travel service provider in China |
�
| � | � | � | Venere.com�, an online hotel reservation specialist in Europe |
�
| � | � | � | trivago�, a leading online hotel metasearch company with sites in 49 countries |
�
| � | � | � | Wotif Group, a leading operator of travel brands in the Asia-Pacific region, including Wotif.com�, lastminute.com.au�, travel.com.au, Asia Web Direct�, LateStays.com, GoDo.com.au and Arnold Travel Technology |
�
Page 16 of 17
| � | � | � | Expedia Local Expert�, a provider of online and in-market concierge services, activities, experiences and ground transportation in hundreds of destinations worldwide |
�
| � | � | � | Classic Vacations�, a top luxury travel specialist |
�
| � | � | � | Expedia� CruiseShipCenters�, a provider of exceptional value and expert advice for travelers booking cruises and vacations through its network of 180 franchise locations across North America |
�
| � | � | � | CarRentals.com�, the premier car rental booking company on the web |
The company delivers consumers value in leisure and business travel, drives�incremental demand and direct bookings to travel suppliers, and provides advertisers the opportunity to reach a highly valuable audience of in-market consumers through Expedia� Media Solutions. Expedia also powers bookings for some of the world�s leading airlines and hotels, top consumer brands, high traffic websites, and thousands of active affiliates through Expedia� Affiliate Network. For corporate and industry news and views, visit us at www.expediainc.com or follow us on Twitter @expediainc.
Trademarks and logos are the property of their respective owners. � 2015 Expedia, Inc. All rights reserved. CST: 2029030-50
Contacts
�
| Investor Relations | Communications | |
| (425) 679-3759 | (425) 679-4317 | |
| [email protected] | [email protected] |
�
Page 17 of 17
Exhibit 99.2
�

�
INVESTOR PRESENTATION February�5, 2015
�
Safe Harbor Forward-Looking Statements. This presentation contains �forward-looking statements� within the meaning of the Private Securities Litigation Reform Act of 1995. These statements are not guarantees of future performance. These forward-looking statements are based on management�s expectations as of February�5, 2015 and assumptions which are inherently subject to uncertainties, risks and changes in circumstances that are difficult to predict. The use of words such as �intends� and �expects,� among others, generally identifies forward-looking statements. However, these words are not the exclusive means of identifying such statements. In addition, any statements that refer to expectations, projections or other characterizations of future events or circumstances are forward-looking statements and may include statements relating to future revenues, expenses, margins, profitability, net income / (loss), earnings per share and other measures of results of operations and the prospects for future growth of Expedia, Inc.�s business. Actual results and the timing and outcome of events may differ materially from those expressed or implied in the forward-looking statements for a variety of reasons, including, among others: an increasingly competitive global environment; modifications to our current business models and practices or our adoption of new business models or practices in order to compete; changes in search engine algorithms and dynamics or other traffic-generating arrangements; declines or disruptions in the travel industry; our failure to maintain and expand our relationships and contractual agreements with travel suppliers or travel distribution partners; our failure to maintain and expand our brand awareness or increased costs to do so; our failure to adapt to technological developments or industry trends; risks relating to our operations in international markets, including China; adverse application of existing tax or unclaimed property laws, rules or regulations or implementation of new unfavorable laws, rules or regulations; adverse outcomes in legal proceedings to which we are a party; our failure to comply with current laws, rules and regulations, or changes to such laws, rules and regulations; determinations by U.S. and foreign tax authorities regarding our worldwide tax provision for income taxes; payments related risks, including credit card fraud; volatility in our stock price; liquidity constraints or our inability to access the capital markets when necessary; interruption or lack of redundancy in our information systems; failure to retain or motivate key personnel or hire, retain and motivate qualified personnel, including senior management; changes in control of the Company; management and director conflicts of interest; risks related to actions taken by our business partners and third party service providers, including failure to comply with our requirements or standards or the requirements or standards of governmental authorities, or any cessation of their operations; risks related to the failure of counterparties to perform on financial obligations; fluctuations in foreign exchange rates; our failure to comply with governmental regulation and other legal obligations related to our processing, storage, use and disclosure of personal data, and liabilities related to security breaches; risks related to our acquisitions, investments or significant commercial arrangements; risks related to our long-term indebtedness; our failure to effectively operate our businesses due to restrictive covenants in the agreements governing our indebtedness; our failure to protect our intellectual property from copying or use by others, including competitors; and other risks detailed in Expedia, Inc.�s public filings with the SEC, including our quarterly report on Form 10-K for the year ended December�31, 2014. Except as required by law, we undertake no obligation to update any forward-looking or other statements in this presentation, whether as a result of new information, future events or otherwise. Non-GAAP Measures. Reconciliations to GAAP measures of non-GAAP measures included in this presentation are included in the Appendix. These measures are intended to supplement, not substitute for, GAAP comparable measures. Investors are urged to consider carefully the comparable GAAP measures and reconciliations. Industry / Market Data. Industry and market data used in this presentation have been obtained from industry publications and sources as well as from research reports prepared for other purposes. We have not independently verified the data obtained from these sources and cannot assure you of the data�s accuracy or completeness. Trademarks�& Logos. Trademarks and logos are the property of their respective owners. � 2015 Expedia, Inc. All rights reserved. CST: 2029030-50 July 2014

�
Investment Highlights Global Leader in ~$1.3 Trillion Market with Strong Offline-to-Online Trends Significant Growth Opportunities Across Geographies Rapid Expansion in Highly Fragmented Hotel Industry Supported by Multi-Product Offering Technology Platform Innovation Driving Higher Conversion A Growth Success in Growing Mobile Channels Company High Growth Advertising�& Media Business Consistent financial execution Solid Track Record of Disciplined Capital Allocation
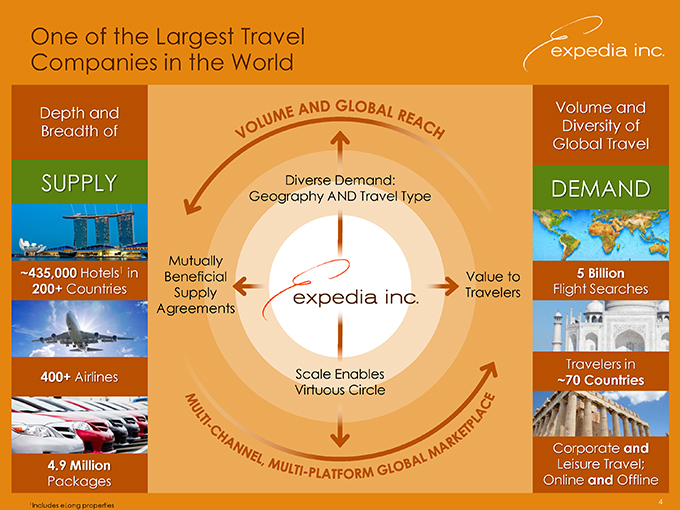
�
One of the Largest Travel Companies in the World Depth and Volume and Breadth of Diversity of Global Travel SUPPLY Diverse Demand: DEMAND Geography AND Travel Type 1 Mutually ~435,000 Hotels in Beneficial Value to 5 Billion 200+ Countries Supply Travelers Flight Searches Agreements Travelers in 400+ Airlines Scale Enables ~70 Countries Virtuous Circle Corporate and 4.9 Million Leisure Travel; Packages Online and Offline

�
Established Brands With Global Reach Trusted Brands #1 Full-Service A Leading Hotel A Leading Hotel A Leader in Global Online Travel Agency Specialist Globally Metasearch Company Corporate Travel 31 Sites in 89 Sites in Sites in Presence in 31 Countries1 68 Countries 49 Countries 64 Countries Brand Strength in EVERY Established Market Solid Foothold in Emerging Markets
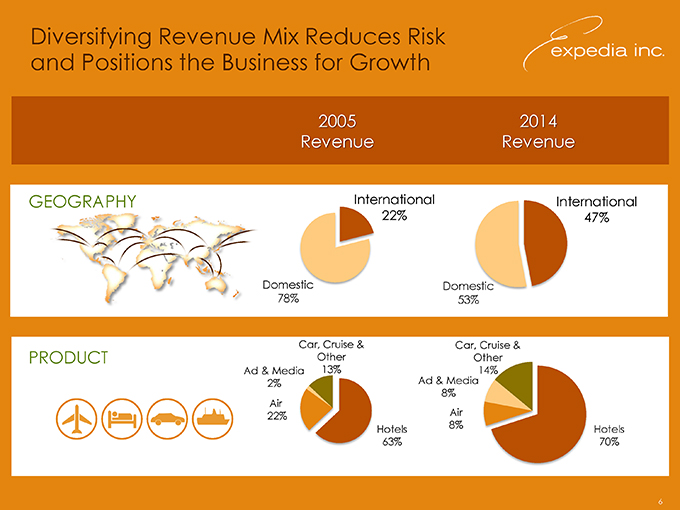
�
Diversifying Revenue Mix Reduces Risk and Positions the Business for Growth 2005 2014 Revenue Revenue GEOGRAPHY International International 22% 47% Domestic Domestic 78% 53% Car, Cruise�& Car, Cruise�& PRODUCT Other Other Ad�& Media 13% 14% 2% Ad�& Media Air 8% 22% Air Hotels 8% Hotels 63% 70%

�
Global Leader and Significant Headroom for Further Growth UNITED EMEA ASIA LATIN STATES PACIFIC AMERICA + CANADA Expedia Share: ONLINE Expedia Expedia Expedia Expedia 16% 6% 5% 5% TRAVEL SEGMENT Other Other Other Other 41% of Total Travel Market 57% 43% 27% 21% Expedia Expedia Expedia Expedia 2014 TOTAL 9% 2% 1% 1% TRAVEL MARKET Other Other Other Other Total Travel Market ~$1.3T $355B $470B $342B $86B Sources: PhoCusWright estimates and Expedia data; travel market size estimates based on PhoCusWright data for full year 2014. Note: Expedia�s share of travel market defined by TTM gross bookings as of December�31, 2014. Beginning in Q4 2014, total travel market definition was expanded to include Canada, Eastern Europe and Middle East. 7
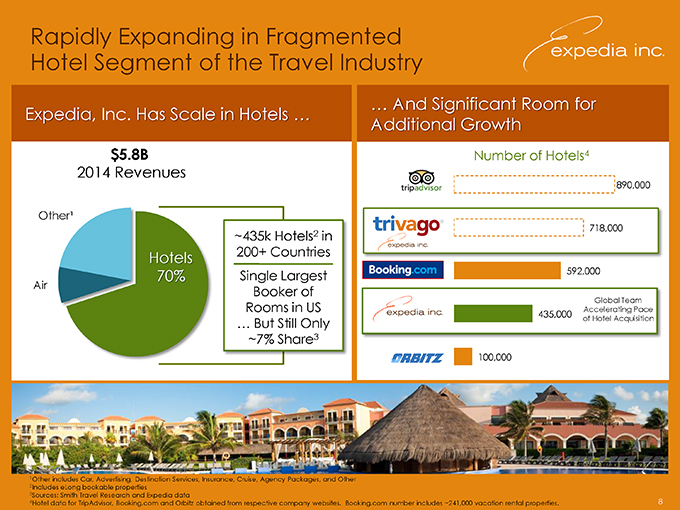
�
Rapidly Expanding in Fragmented Hotel Segment of the Travel Industry � And Significant Room for Expedia, Inc. Has Scale in Hotels � Additional Growth $5.8B Number of Hotels4 2014 Revenues 890,000 Other� 718,000 ~435k Hotels2 in Hotels 200+ Countries 70% Single Largest 592,000 Air Booker of Global Team Rooms in US 435,000 Accelerating Pace � But Still Only of Hotel Acquisition ~7% Share3 100,000

�
Have Completed Significant Technology Investments That Fortify the Business echnol pid Inn Powe ics � Conversion CENTRALIZED Customer Operations Technology CENTRALIZED Transactional Infrastructure: Financials / Order Management / Inventory Management

�
Industry Leading Mobile Initiatives Drive Traffic and Revenue The World Is Opening Up Significant Opportunities in Travel Changing � More than Unique Supply Deal and One in Four Value Proposition to Room Nights Customers: 24 x 7 Mobile Users Booked on a Up to 40% Off Just for Mobile PC-Connected Mobile Device Users � Expedia, Inc. Leads the Way Development in Mobile Innovation Expedia Hotels�& Flights among Google�s Tripdeck feature on �Best Android Apps of 2014� FlightTrack 5 app for iOS and Android, Hotels.com is among Top 10 Free Travel Apps in allowing travelers to the iTunes Store easily track their flights in a simple itinerary, regardless of where FlightTrack 5 selected as �Best Travel App� by they booked Global Traveler

�
Significant Acceleration in the Advertising and Media Business ADVERTISING�& MEDIA REVENUE $ Millions #1 hotel metasearch in Europe $479 $3191 $113 $131 $99 $109 2009 2010 2011 2012 2013 2014 �09-�11 CAGR : 6.8% �11-�14 CAGR : 61.8% Note: Reported numbers are net of any intercompany revenue 1 Controlling interest in trivago GmbH (�trivago�) acquired in March 2013
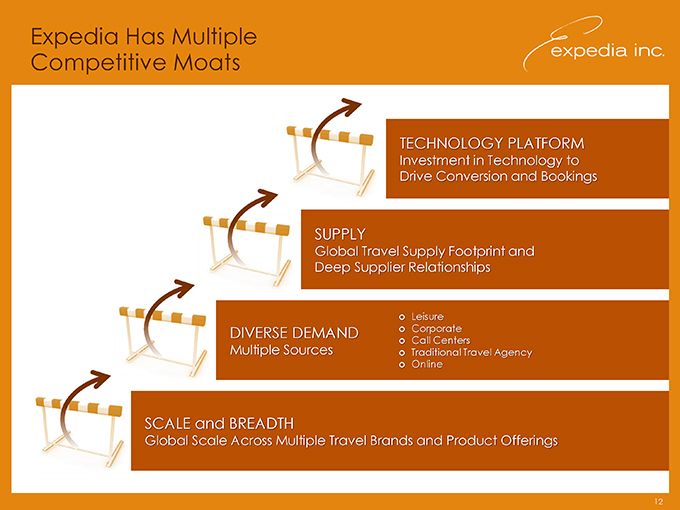
�
Expedia Has Multiple Competitive Moats TECHNOLOGY PLATFORM Investment in Technology to Drive Conversion and Bookings SUPPLY Global Travel Supply Footprint and Deep Supplier Relationships ? Leisure DIVERSE DEMAND ? Corporate ? Call Centers Multiple Sources ? Traditional Travel Agency ? Online SCALE and BREADTH Global Scale Across Multiple Travel Brands and Product Offerings
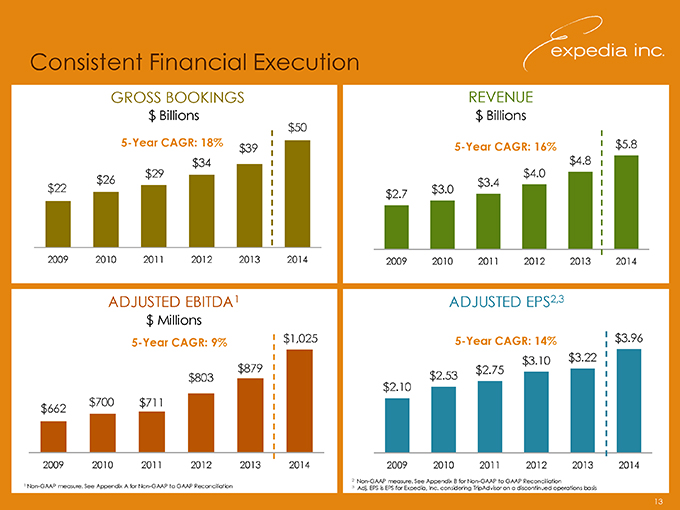
�
Consistent Financial Execution GROSS BOOKINGS REVENUE $ Billions $50 $ Billions 5-Year CAGR: 18% 5-Year CAGR: 16% $5.8 $39 $34 $4.8 $29 $4.0 $26 $3.4 $22 $3.0 $2.7 2009 2010 2011 2012 2013 2014 2009 2010 2011 2012 2013 2014 ADJUSTED EBITDA1 ADJUSTED EPS2,3 $ Millions 5-Year CAGR: 9% $1,025 5-Year CAGR: 14% $3.96 $879 $3.10 $3.22 $2.75 $803 $2.10 $2.53 $700 $711 $662 2009 2010 2011 2012 2013 2014 2009 2010 2011 2012 2013 2014 2 Non-GAAP measure. See Appendix B for Non-GAAP to GAAP Reconciliation 1 Non-GAAP measure. See Appendix A for Non-GAAP to GAAP Reconciliation 3 Adj. EPS is EPS for Expedia, Inc. considering TripAdvisor on a discontinued operations basis
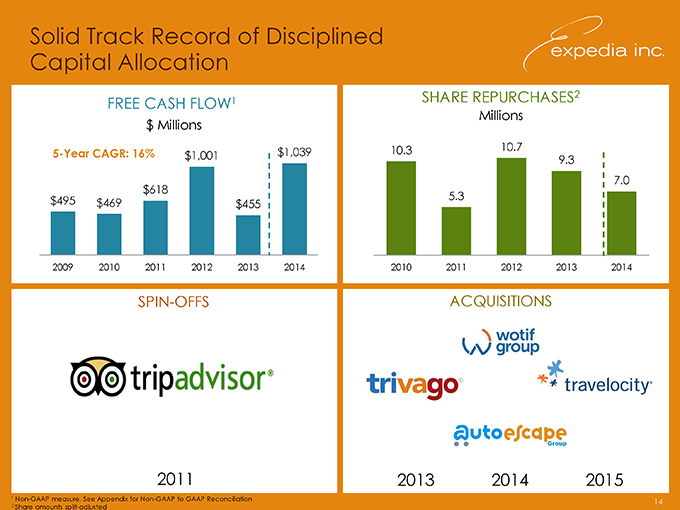
�
Solid Track Record of Disciplined Capital Allocation SHARE REPURCHASES2 FREE CASH FLOW1 Millions $ Millions $1,039 10.3 10.7 5-Year CAGR: 16% $1,001 9.3 7.0 $618 $495 5.3 $469 $455 2009 2010 2011 2012 2013 2014 2010 2011 2012 2013 2014 SPIN-OFFS ACQUISITIONS 2011 2013 2014 2015

�
Investment Highlights Global Leader in ~$1.3 Trillion Market with Strong Offline-to-Online Trends Significant Growth Opportunities Across Geographies Rapid Expansion in Highly Fragmented Hotel Industry Supported by Multi-Product Offering Technology Platform Innovation Driving Higher Conversion A Growth Success in Growing Mobile Channels Company High Growth Advertising�& Media Business Consistent financial execution Solid Track Record of Disciplined Capital Allocation

�
APPENDICES
�
Non-GAAP Definitions Adjusted EBITDA is defined as operating income plus: (1)�stock-based compensation expense, including compensation expense related to certain subsidiary equity plans; (2)�acquisition-related impacts, including (i)�amortization of intangible assets and goodwill and intangible asset impairment, (ii)�gains (losses) recognized on changes in the value of contingent consideration arrangements; and (iii)�upfront consideration paid to settle employee compensation plans of the acquiree; (3)�certain infrequently occurring items, including restructuring; (4)�items included in Legal reserves, occupancy tax and other, which includes reserves for potential settlement of issues related to transactional taxes (e.g. hotel and excise taxes), related to court decisions and final settlements, and charges incurred, if any, for monies that may be required to be paid in advance of litigation in certain transactional tax proceedings; (5)�gains (losses) realized on revenue hedging activities that are included in other, net; and (6)�depreciation. The above items are excluded from our Adjusted EBITDA measure because these items are noncash in nature, or because the amount and timing of these items is unpredictable, not driven by core operating results and renders comparisons with prior periods and competitors less meaningful. We believe Adjusted EBITDA is a useful measure for analysts and investors to evaluate our future ongoing performance as this measure allows a more meaningful comparison of our performance and projected cash earnings with our historical results from prior periods and to the results of our competitors. Moreover, our management uses this measure internally to evaluate the performance of our business as a whole and our individual business segments. In addition, we believe that by excluding certain items, such as stock-based compensation and acquisition-related impacts, Adjusted EBITDA corresponds more closely to the cash operating income generated from our business and allows investors to gain an understanding of the factors and trends affecting the ongoing cash earnings capabilities of our business, from which capital investments are made and debt is serviced. Adjusted EPS is defined as Adjusted Net Income divided by adjusted weighted average shares outstanding, which include dilution from options and warrants per the treasury stock method and include all shares relating to RSUs in shares outstanding for Adjusted EPS. This differs from the GAAP method for including RSUs, which treats them on a treasury method basis. Shares outstanding for Adjusted EPS purposes are therefore higher than shares outstanding for GAAP EPS purposes. We believe Adjusted EPS is useful to investors because it represents, on a per share basis, Expedia�s consolidated results, taking into account depreciation, which we believe is an ongoing cost of doing business, as well as other items which are not allocated to the operating businesses such as interest expense, taxes, foreign exchange gains or losses, and minority interest, but excluding the effects of certain expenses not directly tied to the core operations of our businesses. Adjusted Net Income and Adjusted EPS have similar limitations as Adjusted EBITDA. In addition, Adjusted Net Income does not include all items that affect our net income / (loss) and net income / (loss) per share for the period. Therefore, we think it is important to evaluate these measures along with our consolidated statements of operations.
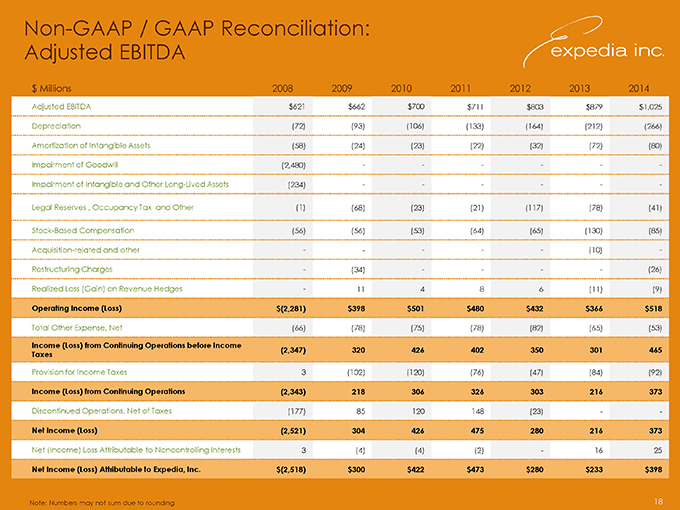
�
Non-GAAP / GAAP Reconciliation: Adjusted EBITDA $ Millions 2008 2009 2010 2011 2012 2013 2014 Adjusted EBITDA $621 $662 $700 $711 $803 $879 $1,025 Depreciation (72)�(93)�(106)�(133)�(164)�(212)�(266)�Amortization of Intangible Assets (58)�(24)�(23)�(22)�(32)�(72)�(80)�Impairment of Goodwill (2,480)�� � � Impairment of Intangible and Other Long-Lived Assets (234)�� � � Legal Reserves , Occupancy Tax and Other (1)�(68)�(23)�(21)�(117)�(78)�(41)�Stock-Based Compensation (56)�(56)�(53)�(64)�(65)�(130)�(85)�Acquisition-related and other � ��(10)�Restructuring Charges�(34)�� � (26)�Realized Loss (Gain) on Revenue Hedges�11 4 8 6 (11)�(9)�Operating Income (Loss) $(2,281) $398 $501 $480 $432 $366 $518 Total Other Expense, Net (66)�(78)�(75)�(78)�(82)�(65)�(53)�Income (Loss) from Continuing Operations before Income (2,347)�320 426 402 350 301 465 Taxes Provision for Income Taxes 3 (102)�(120)�(76)�(47)�(84)�(92)�Income (Loss) from Continuing Operations (2,343)�218 306 326 303 216 373 Discontinued Operations, Net of Taxes (177)�85 120 148 (23)�� Net Income (Loss) (2,521)�304 426 475 280 216 373 Net (Income) Loss Attributable to Noncontrolling Interests 3 (4)�(4)�(2)�16 25 Net Income (Loss) Attributable to Expedia, Inc. $(2,518) $300 $422 $473 $280 $233 $398
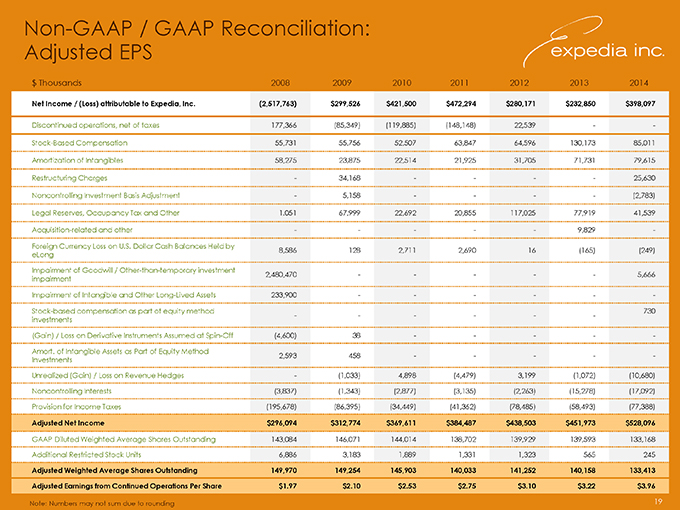
�
Non-GAAP / GAAP Reconciliation: Adjusted EPS $ Thousands 2008 2009 2010 2011 2012 2013 2014 Net Income / (Loss) attributable to Expedia, Inc. (2,517,763)�$299,526 $421,500 $472,294 $280,171 $232,850 $398,097 Discontinued operations, net of taxes 177,366 (85,349)�(119,885)�(148,148)�22,539 � Stock-Based Compensation 55,731 55,756 52,507 63,847 64,596 130,173 85,011 Amortization of Intangibles 58,275 23,875 22,514 21,925 31,705 71,731 79,615 Restructuring Charges� 34,168� ��25,630 Noncontrolling Investment Basis Adjustment� 5,158� ��(2,783)�Legal Reserves, Occupancy Tax and Other 1.051 67,999 22,692 20,855 117,025 77,919 41,539 Acquisition-related and other � ��9,829� Foreign Currency Loss on U.S.�Dollar Cash Balances Held by 8,586 128 2,711 2,690 16 (165)�(249)�eLong Impairment of Goodwill / Other-than-temporary investment 2,480,470� � ��5,666 impairment Impairment of Intangible and Other Long-Lived Assets 233,900� � � � Stock-based compensation as part of equity method 730 � � � investments (Gain) / Loss on Derivative Instruments Assumed at Spin-Off (4,600)�38� � � Amort. of Intangible Assets as Part of Equity Method 2,593 458� � � Investments Unrealized (Gain) / Loss on Revenue Hedges� (1,033)�4,898 (4,479)�3,199 (1,072)�(10,680)�Noncontrolling Interests (3,837)�(1,343)�(2,877)�(3,135)�(2,263)�(15,278)�(17,092)�Provision for Income Taxes (195,678)�(86,395)�(34,449)�(41,362)�(78,485)�(58,493)�(77,388)�Adjusted Net Income $296,094 $312,774 $369,611 $384,487 $438,503 $451,973 $528,096 GAAP Diluted Weighted Average Shares Outstanding 143,084 146,071 144,014 138,702 139,929 139,593 133,168 Additional Restricted Stock Units 6,886 3,183 1,889 1,331 1,323 565 245 Adjusted Weighted Average Shares Outstanding 149,970 149,254 145,903 140,033 141,252 140,158 133,413 Adjusted Earnings from Continued Operations Per Share $1.97 $2.10 $2.53 $2.75 $3.10 $3.22 $3.96
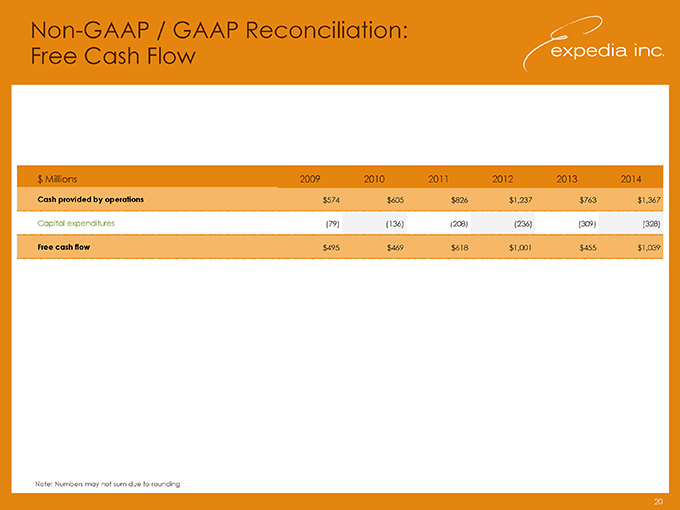
�
Non-GAAP / GAAP Reconciliation: Free Cash Flow $ Millions 2009 2010 2011 2012 2013 2014 Cash provided by operations $574 $605 $826 $1,237 $763 $1,367 Capital expenditures (79)�(136)�(208)�(236)�(309)�(328)�Free cash flow $495 $469 $618 $1,001 $455 $1,039
Serious News for Serious Traders! Try StreetInsider.com Premium Free!
You May Also Be Interested In
- EXPEDIA SUMMER TRAVEL OUTLOOK RELEASED: REVEALS HOW TO SAVE UP TO $265 ON SUMMER AIRFARE
- Bamboo Works Spotlights Potential for Smartphone Recycling in Expert Opinion from ATRenew Chairman Kerry Chen
- THINKWARE Launches ARC Dash Cam: A Compact Solution for Comprehensive Vehicle Surveillance
Create E-mail Alert Related Categories
SEC FilingsSign up for StreetInsider Free!
Receive full access to all new and archived articles, unlimited portfolio tracking, e-mail alerts, custom newswires and RSS feeds - and more!
