

Form 8-K EXELON CORP For: Feb 13
 Tweet
Tweet Share
Share
UNITED STATES
SECURITIES AND EXCHANGE COMMISSION
Washington, DC 20549
FORM 8-K
CURRENT REPORT
Pursuant to Section 13 or 15(d)
of the Securities Exchange Act of 1934
February 13, 2015
Date of Report (Date of earliest event reported)
| Commission File Number |
Exact Name of Registrant as Specified in Its Charter; State of Incorporation; Address of Principal Executive Offices; and Telephone Number |
IRS Employer | ||
| 1-16169 | EXELON CORPORATION (a Pennsylvania corporation) 10 South Dearborn Street P.O. Box 805379 Chicago, Illinois 60680-5379 (312) 394-7398 |
23-2990190 | ||
| 333-85496 | EXELON GENERATION COMPANY, LLC (a Pennsylvania limited liability company) 300 Exelon Way Kennett Square, Pennsylvania 19348-2473 (610) 765-5959 |
23-3064219 | ||
| 1-1839 | COMMONWEALTH EDISON COMPANY (an Illinois corporation) 440 South LaSalle Street Chicago, Illinois 60605-1028 (312) 394-4321 |
36-0938600 | ||
| 000-16844 | PECO ENERGY COMPANY (a Pennsylvania corporation) P.O. Box 8699 2301 Market Street Philadelphia, Pennsylvania 19101-8699 (215) 841-4000 |
23-0970240 | ||
| 1-1910 | BALTIMORE GAS AND ELECTRIC COMPANY (a Maryland corporation) 2 Center Plaza 110 West Fayette Street Baltimore, Maryland 21201 (410) 234-5000 |
52-0280210 |
Check the appropriate box below if the Form 8-K filing is intended to simultaneously satisfy the filing obligation of the registrant under any of the following provisions:
| ¨ | Written communications pursuant to Rule 425 under the Securities Act (17 CFR 230.425) |
| ¨ | Soliciting material pursuant to Rule 14a-12 under the Exchange Act (17 CFR 240.14a-12) |
| ¨ | Pre-commencement communications pursuant to Rule 14d-2(b) under the Exchange Act (17 CFR 240.14d-2(b)) |
| ¨ | Pre-commencement communications pursuant to Rule 13e-4(c) under the Exchange Act (17 CFR 240.13e-4(c)) |
Section 2 – Financial Information
| Item 2.02. | Results of Operations and Financial Condition. |
Section 7 – Regulation FD
| Item 7.01. | Regulation FD Disclosure. |
On February 13, 2015, Exelon Corporation (Exelon) announced via press release its results for the fourth quarter ended December 31, 2014. A copy of the press release and related attachments is attached hereto as Exhibit 99.1. Also attached as Exhibit 99.2 to this Current Report on Form 8-K are the presentation slides to be used at the fourth quarter 2014 earnings conference call. This Form 8-K and the attached exhibits are provided under Items 2.02, 7.01 and 9.01 of Form 8-K and are furnished to, but not filed with, the Securities and Exchange Commission.
Exelon has scheduled the conference call for 11:00 AM ET (10:00 AM CT) on February 13, 2015. The call-in number in the U.S. and Canada is 800-690-3108, and the international call-in number is 973-935-8753. If requested, the conference ID number is 65713906. Media representatives are invited to participate on a listen-only basis. The call will be web-cast and archived on Exelon’s Web site: www.exeloncorp.com. (Please select the Investors page.)
Telephone replays will be available until March 27, 2015. The U.S. and Canada call-in number for replays is 855-859-2056, and the international call-in number is 404-537-3406. The conference ID number is 65713906.
Section 9 – Financial Statements and Exhibits
| Item 9.01. | Financial Statements and Exhibits. |
(d) Exhibits.
| Exhibit |
Description | |
| 99.1 | Press release and earnings release attachments | |
| 99.2 | Earnings conference call presentation slides | |
* * * * *
This combined Form 8-K is being furnished separately by Exelon, Exelon Generation Company, LLC, Commonwealth Edison Company, PECO Energy Company, and Baltimore Gas and Electric Company (Registrants). Information contained herein relating to any individual Registrant has been furnished by such Registrant on its own behalf. No Registrant makes any representation as to information relating to any other Registrant.
This report contains certain forward-looking statements within the meaning of the Private Securities Litigation Reform Act of 1995, that are subject to risks and uncertainties. The factors that could cause actual results to differ materially from the forward-looking statements made by Exelon Corporation, Commonwealth Edison Company, PECO Energy Company, Baltimore Gas and Electric Company and Exelon Generation Company, LLC (Registrants) include those factors discussed herein, as well as the items discussed in (1) Exelon’s 2014 Annual Report on Form 10-K (to be filed on February 13, 2015) in (a) ITEM 1A. Risk Factors, (b) ITEM 7. Management’s Discussion and Analysis of Financial Condition and Results of Operations and (c) ITEM 8. Financial Statements and Supplementary Data: Note 22 and (2) other factors discussed in filings with the SEC by the Registrants. Readers are cautioned not to place undue reliance on these forward-looking statements, which apply only as of the date of this report. None of the Registrants undertakes any obligation to publicly release any revision to its forward-looking statements to reflect events or circumstances after the date of this report.
SIGNATURES
Pursuant to the requirements of the Securities Exchange Act of 1934, each Registrant has duly caused this report to be signed on its behalf by the undersigned hereunto duly authorized.
| EXELON CORPORATION |
| /s/ Jonathan W. Thayer |
| Jonathan W. Thayer |
| Senior Executive Vice President and Chief Financial Officer |
| Exelon Corporation |
| EXELON GENERATION COMPANY, LLC |
| /s/ Bryan P. Wright |
| Bryan P. Wright |
| Senior Vice President and Chief Financial Officer Exelon Generation Company, LLC |
| COMMONWEALTH EDISON COMPANY |
| /s/ Joseph R. Trpik, Jr. |
| Joseph R. Trpik, Jr. |
| Senior Vice President, Chief Financial Officer and Treasurer |
| Commonwealth Edison Company |
| PECO ENERGY COMPANY |
| /s/ Phillip S. Barnett |
| Phillip S. Barnett |
| Senior Vice President, Chief Financial Officer and |
| Treasurer |
| PECO Energy Company |
| BALTIMORE GAS AND ELECTRIC COMPANY |
| /s/ David M. Vahos |
| David M. Vahos |
| Vice President, Chief Financial Officer and Treasurer |
| Baltimore Gas and Electric Company |
February 13, 2015
EXHIBIT INDEX
| Exhibit |
Description | |
| 99.1 | Press release and earnings release attachments | |
| 99.2 | Earnings conference call presentation slides | |
Exhibit 99.1

|

|
| Contact: | Francis Idehen | |||
| Investor Relations | ||||
| 312-394-3967
|
||||
| Paul Adams | ||||
| Corporate Communications | ||||
| 410-470-4167 |
EXELON ANNOUNCES FOURTH QUARTER 2014 RESULTS,
PROVIDES 2015 EARNINGS EXPECTATION
CHICAGO (Feb. 13, 2015) — Exelon Corporation (NYSE: EXC) announced fourth quarter 2014 consolidated earnings as follows:
| Full Year | Fourth Quarter | |||||||||||||||
| 2014 | 2013 | 2014 | 2013 | |||||||||||||
| Adjusted (non-GAAP) Operating |
||||||||||||||||
| Results: |
||||||||||||||||
| Net Income ($ millions) |
$ | 2,068 | $ | 2,149 | $ | 421 | $ | 427 | ||||||||
| Diluted Earnings per Share |
$ | 2.39 | $ | 2.50 | $ | 0.48 | $ | 0.50 | ||||||||
|
|
|
|
|
|
|
|
|
|||||||||
| GAAP Results: |
||||||||||||||||
| Net Income ($ millions) |
$ | 1,623 | $ | 1,719 | $ | 18 | $ | 495 | ||||||||
| Diluted Earnings per Share |
$ | 1.88 | $ | 2.00 | $ | 0.02 | $ | 0.58 | ||||||||
|
|
|
|
|
|
|
|
|
|||||||||
“Exelon had a strong year, both operationally and financially. We delivered earnings within our guidance range, and our generation fleet and utilities continued to perform at high levels,” said Exelon President and CEO Christopher M. Crane. “We made several investments to grow the company, including the proposed merger with Pepco Holdings, Inc. and the acquisition of Integrys Energy Services, and we continue to strengthen our balance sheet for long-term growth.”
1
Fourth Quarter Operating Results
As shown in the table above, Exelon’s adjusted (non-GAAP) operating earnings decreased to $0.48 per share in the fourth quarter of 2014 from $0.50 per share in the fourth quarter of 2013. Earnings in the fourth quarter of 2014 primarily reflected the following negative factors:
| • | Unfavorable earnings associated with the December 2014 extension of bonus income tax depreciation impact on Generation’s domestic production activities deduction and ComEd’s distribution and transmission formula earnings, and |
| • | Unfavorable weather conditions at ComEd and PECO. |
These factors were substantially offset by:
| • | Higher revenue net of purchased power and fuel at Generation as a result of the cancellation of the Department of Energy spent nuclear fuel disposal fees and the inclusion of Integrys beginning Nov. 1, 2014, and |
| • | Cost savings from plan design changes for certain Other Post-Employment Benefits (OPEB) plans. |
Adjusted (non-GAAP) Operating Earnings for the fourth quarter of 2014 do not include the following items (after-tax) that were included in reported GAAP earnings:
| (in millions) | (per diluted share) | |||||||
| Exelon Adjusted (non-GAAP) Operating Earnings |
$ | 421 | $ | 0.48 | ||||
| Mark-to-Market Impact of Economic Hedging Activities |
(70 | ) | (0.08 | ) | ||||
| Unrealized Gains Related to Nuclear Decommissioning Trust (NDT) Fund Investments |
24 | 0.03 | ||||||
| Plant Retirements and Divestitures |
48 | 0.06 | ||||||
| Merger and Integration Costs |
(80 | ) | (0.09 | ) | ||||
| Reassessment of State Deferred Income Taxes |
27 | 0.03 | ||||||
| Amortization of Commodity Contract Intangibles |
(22 | ) | (0.03 | ) | ||||
| Long-Lived Asset Impairments |
(337 | ) | (0.39 | ) | ||||
| Bargain-Purchase Gain on Integrys Acquisition |
28 | 0.03 | ||||||
| Tax Settlements |
5 | 0.01 | ||||||
| CENG Non-Controlling Interest |
(26 | ) | (0.03 | ) | ||||
|
|
|
|
|
|||||
| Exelon GAAP Net Income |
$ | 18 | $ | 0.02 | ||||
|
|
|
|
|
|||||
2
Adjusted (non-GAAP) Operating Earnings for the fourth quarter of 2013 do not include the following items (after-tax) that were included in reported GAAP earnings:
| (in millions) | (per diluted share) | |||||||
| Exelon Adjusted (non-GAAP) Operating Earnings |
$ | 427 | $ | 0.50 | ||||
| Mark-to-Market Impact of Economic Hedging Activities |
143 | 0.16 | ||||||
| Unrealized Gains Related to NDT Fund Investments |
40 | 0.05 | ||||||
| Plant Retirements and Divestitures |
1 | — | ||||||
| Merger and Integration Costs |
(21 | ) | (0.02 | ) | ||||
| Reassessment of State Deferred Income Taxes |
(4 | ) | — | |||||
| Amortization of Commodity Contract Intangibles |
(75 | ) | (0.09 | ) | ||||
| Asset Retirement Obligation |
(1 | ) | — | |||||
| Midwest Generation Bankruptcy Charges |
(16 | ) | (0.02 | ) | ||||
| Long-Lived Asset Impairments |
1 | — | ||||||
|
|
|
|
|
|||||
| Exelon GAAP Net Income |
$ | 495 | $ | 0.58 | ||||
|
|
|
|
|
|||||
2015 Earnings Outlook
Exelon introduced a guidance range for 2015 adjusted (non-GAAP) operating earnings of $2.25 to $2.55 per share. Operating earnings guidance is based on the assumption of normal weather, which is determined based on historical average heating and cooling degree days for a 30-year period in the respective utilities’ service territories.
The outlook for 2015 adjusted (non-GAAP) operating earnings for Exelon and its subsidiaries excludes the following items:
| • | Mark-to-market adjustments from economic hedging activities; |
| • | Unrealized gains and losses from NDT fund investments to the extent not offset by contractual accounting as described in the notes to the consolidated financial statements; |
| • | Certain costs incurred related to the PHI acquisition; |
| • | Non-cash amortization of intangible assets, net, related to commodity contracts recorded at fair value at merger dates; |
| • | Other unusual items; and |
| • | One-time impacts of adopting new accounting standards. |
Fourth Quarter and Recent Highlights
| • | Pepco Holdings, Inc. Merger: On Nov. 20, 2014, the Federal Energy Regulatory Commission (FERC) approved the proposed merger of Exelon and PHI. In addition, on Nov. 21, 2014, Exelon and PHI each certified that it had substantially complied with the Department of Justice request under the Hart-Scott-Rodino Antitrust Improvements Act of 1976 |
3
| (HSR Act). Accordingly, the HSR Act waiting period expired on Dec. 22, 2014, and the HSR Act no longer precludes completion of the merger. Although the DOJ allowed the HSR Act waiting period to expire without taking any action with respect to the merger, the DOJ has not advised Exelon or PHI that it has concluded its investigation. On Feb. 11, 2015, the New Jersey Board of Public Utilities (NJBPU) approved the proposed merger of Exelon and PHI. As part of the approval the NJBPU also approved a settlement agreement which was previously signed and filed by Exelon, PHI, Atlantic City Electric (ACE), NJBPU staff and the Independent Energy Producers of New Jersey. The merger continues to be conditioned upon approval by the Public Service Commissions of the District of Columbia, Delaware and Maryland. Exelon and PHI continue to expect the merger to be complete in the second or third quarter of 2015. |
| • | Asset Divestitures: Exelon closed the following generating asset sales during the quarter: Fore River (CCGT) in Massachusetts, West Valley (CT) in Utah, and Exelon’s ownership interests in Keystone and Conemaugh coal plants in Pennsylvania. The transactions resulted in cumulative pre-tax gains of approximately $83 million. Subsequent to year end, Exelon also closed the sale of Quail Run (CCGT) in Texas. To date, generating asset divestitures have yielded $1.8 billion of pre-tax cash proceeds ($1.4 billion after-tax), which are expected to be used primarily to finance a portion of the acquisition of PHI and for other corporate purposes. |
| • | Constellation: On Nov. 1, 2014, Exelon Generation acquired the competitive retail electric and natural gas business activities of Integrys Energy Group, Inc. through the purchase of all of the stock of its wholly-owned subsidiary, Integrys Energy Services, Inc. (Integrys) for a purchase price of $332 million. The generation and solar asset businesses of Integrys are excluded from the transaction. Generation recognized a $28 million after-tax bargain-purchase gain. |
| • | Nuclear Operations: Generation’s nuclear fleet, including its owned output from the Salem Generating Station and beginning April 1, 2014, 100 percent of the CENG units, produced 44,533 gigawatt-hours (GWh), of which 8,890 GWh were produced by CENG, in the fourth quarter of 2014, compared with 35,329 GWh in the fourth quarter of 2013. Excluding Salem, the Exelon-operated nuclear plants at ownership achieved a 94.8 percent capacity factor for the fourth quarter of 2014, compared with 92.3 percent for the fourth quarter of 2013. The number of planned refueling outage days totaled 97 in the fourth quarter of 2014, compared with 94 in the fourth quarter of 2013. There were eight non-refueling outage days in the fourth quarter of 2014, compared with 33 days in the fourth quarter of 2013. |
| • | Fossil and Renewable Operations: The dispatch match rate for Generation’s gas/hydro fleet was 99.1 percent in the fourth quarter of 2014, compared with 99.3 percent in the fourth quarter of 2013. Energy capture for the wind/solar fleet was 96.4 percent in the fourth quarter of 2014, compared with 94.5 percent in the fourth quarter of 2013. The increase in energy capture for the fourth quarter of 2014 was due to the implementation of reliability programs that resulted in increased turbine availability. |
4
| • | ComEd Distribution Formula Rate Case: On Dec. 11, 2014, the Illinois Commerce Commission (ICC) issued an order approving ComEd’s 2014 annual distribution formula rate update case. The order established the net revenue requirement used to set the rates that took effect in January 2015, with an increase to ComEd’s annual delivery services revenue requirement of approximately $232 million. The electric distribution rate increase was set using an allowed return on capital of 7.06 percent (inclusive of an allowed return on common equity of 9.25 percent). |
| • | BGE Gas and Electric Distribution Rate Case: On Dec. 4, 2014, the Public Utility Law Judge issued a proposed order approving a settlement agreement reached with all parties to BGE’s 2014 distribution rate case without modification, which became a final order on Dec. 12, 2014. The final order, effective for services rendered on or after Dec. 15, 2014, established an increase of $22 million in electric base rates and an increase of $38 million in gas base rates. |
| • | Financing Activities: |
| • | On Nov. 10, 2014, ComEd issued $250 million aggregate principal amount of its First Mortgage 3.10 percent Bonds, Series 117, due Nov. 1, 2024. |
| • | On Jan. 13, 2015, Generation issued $750 million in aggregate principal amount of senior notes. The senior notes carry an annual interest rate of 2.950 percent, payable semi-annually, commencing July 15, 2015, and due Jan. 15, 2020. The proceeds of the senior notes will be used to redeem Exelon Corporate’s $550 million, 4.550 percent senior notes due June 15, 2015 on Feb. 17, 2015, and for general corporate purposes. |
| • | Hedging Update: Exelon’s hedging program involves the hedging of commodity risk for Exelon’s expected generation, typically on a ratable basis over a three-year period. Expected generation is the volume of energy that best represents our commodity position in energy markets from owned or contracted for capacity based upon a simulated dispatch model that makes assumptions regarding future market conditions, which are calibrated to market quotes for power, fuel, load following products, and options. The proportion of expected generation hedged as of Dec. 31, 2014, was 93 percent to 96 percent for 2015, 61 percent to 64 percent for 2016, and 31 percent to 34 percent for 2017, which reflects the divestiture impact of Quail Run. The primary objective of Exelon’s hedging program is to manage market risks and protect the value of its generation and its investment-grade balance sheet, while preserving its ability to participate in improving long-term market fundamentals. |
5
Operating Company Results
Generation consists of owned and contracted electric generating facilities and wholesale and retail customer supply of electric and natural gas products and services, including renewable energy products and natural gas exploration and production activities.
Generation’s fourth quarter 2014 GAAP net loss was $91 million, compared with net income of $269 million in the fourth quarter of 2013. Adjusted (non-GAAP) operating earnings for the fourth quarter of 2014 and 2013 do not include various items (after- tax) that were included in reported GAAP earnings. A reconciliation of Adjusted (non-GAAP) Operating Earnings to GAAP Net Income is in the table below:
| ($ millions) |
4Q14 | 4Q13 | ||||||
| Generation Adjusted (non-GAAP) Operating Earnings |
$ | 231 | $ | 183 | ||||
| Mark-to-Market Impact of Economic Hedging Activities |
(71 | ) | 143 | |||||
| Unrealized Gains Related to NDT Fund Investments |
24 | 40 | ||||||
| Plant Retirements and Divestitures |
48 | 1 | ||||||
| Merger and Integration Costs |
(9 | ) | (19 | ) | ||||
| Reassessment of State Deferred Income Taxes |
39 | 12 | ||||||
| Amortization of Commodity Contract Intangibles |
(22 | ) | (75 | ) | ||||
| Long-Lived Asset Impairments |
(338 | ) | 1 | |||||
| Asset Retirement Obligation |
— | (1 | ) | |||||
| Bargain-Purchase Gain on Integrys Acquisition |
28 | — | ||||||
| Tax Settlements |
5 | — | ||||||
| CENG Non-Controlling Interest |
(26 | ) | — | |||||
| Midwest Generation Bankruptcy Charges |
— | (16 | ) | |||||
|
|
|
|
|
|||||
| Generation GAAP Net (Loss) Income |
$ | (91 | ) | $ | 269 | |||
|
|
|
|
|
|||||
Generation’s Adjusted (non-GAAP) Operating Earnings in the fourth quarter of 2014 increased $48 million compared with the same quarter in 2013. This increase primarily reflected higher revenue net of purchase power and fuel at Generation as a result of the cancellation of the Department of Energy spent nuclear fuel disposal fees and the inclusions of Integrys beginning Nov. 1, 2014. These items were partially offset by the impact of the December 2014 extension of bonus income tax depreciation on Generation’s domestic production activities deduction.
ComEd consists of electricity transmission and distribution operations in northern Illinois.
ComEd’s fourth quarter 2014 GAAP net income was $73 million, compared with net income of $109 million in the fourth quarter of 2013. Adjusted (non-GAAP) Operating Earnings for the fourth quarter of 2013 do not include merger and integration costs that were included in reported GAAP earnings. A reconciliation of Adjusted (non-GAAP) Operating Earnings to GAAP Net Income is in the table below:
| ($ millions) |
4Q14 | 4Q13 | ||||||
| ComEd Adjusted (non-GAAP) Operating Earnings |
$ | 75 | $ | 109 | ||||
| Merger and Integration Costs |
(2 | ) | — | |||||
|
|
|
|
|
|||||
| ComEd GAAP Net Income |
$ | 73 | $ | 109 | ||||
|
|
|
|
|
|||||
6
ComEd’s Adjusted (non-GAAP) Operating Earnings in the fourth quarter of 2014 were down $34 million from the same quarter in 2013, primarily due to the impacts of the December 2014 extension of bonus income tax depreciation on distribution and transmission formula earnings and unfavorable weather conditions and volume in ComEd’s service territory.
For the fourth quarter of 2014, heating degree-days in the ComEd service territory were down 5.6 percent relative to the same period in 2013 and were 2.4 percent above normal. Meanwhile, cooling degree days were down 88.0 percent relative to the same period in 2013 and were 72.7 percent below normal. However, cooling degree days typically have a minimal impact to ComEd during the winter months. Total retail electric deliveries decreased 2.7 percent in the fourth quarter of 2014 compared with the same period in 2013.
Weather-normalized retail electric deliveries were down 1.2 percent in the fourth quarter of 2014 relative to 2013.
PECO consists of electricity transmission and distribution operations and retail natural gas distribution operations in southeastern Pennsylvania.
PECO’s fourth quarter 2014 GAAP net income was $98 million, compared with $102 million in the fourth quarter of 2013. Adjusted (non-GAAP) Operating Earnings for the fourth quarter of 2014 and 2013 do not include merger and integration costs that were included in reported GAAP earnings. A reconciliation of Adjusted (non-GAAP) Operating Earnings to GAAP Net Income is in the table below:
| ($ millions) |
4Q14 | 4Q13 | ||||||
| PECO Adjusted (non-GAAP) Operating Earnings |
$ | 99 | $ | 103 | ||||
| Merger and Integration Costs |
(1 | ) | (1 | ) | ||||
|
|
|
|
|
|||||
| PECO GAAP Net Income |
$ | 98 | $ | 102 | ||||
|
|
|
|
|
|||||
PECO’s Adjusted (non-GAAP) Operating Earnings in the fourth quarter of 2014 decreased $4 million from the same quarter in 2013, primarily due to unfavorable weather conditions in PECO’s service territory during 2014.
For the fourth quarter of 2014, heating degree-days in the PECO service territory were down 5.0 percent relative to the same period in 2013 and were 8.0 percent below normal. Cooling degree-days were down 61.5 percent from prior year, but were 31.6 percent above normal. Total retail electric deliveries were down 3.1 percent compared with the fourth quarter of 2013. Natural gas deliveries (including both retail and transportation segments) were down 2.3 percent compared with the fourth quarter of 2013.
Weather-normalized retail electric deliveries and gas deliveries decreased 1.0 percent and increased 1.9 percent in the fourth quarter of 2014 relative to 2013, respectively. The negative growth in electric sales is primarily driven by the impact of energy efficiency programs. The positive growth in gas sales is driven largely by the favorable impact of customers converting usage from oil and propane to natural gas.
7
BGE consists of electricity transmission and distribution operations and retail natural gas distribution operations in Central Maryland.
BGE’s fourth quarter 2014 GAAP net income was $52 million, compared with $47 million in the fourth quarter of 2013. Adjusted (non-GAAP) Operating Earnings for the fourth quarter of 2014 and 2013 do not include merger and integration costs that were included in reported GAAP earnings. A reconciliation of Adjusted (non-GAAP) Operating Earnings to GAAP Net Income is in the table below:
| ($ millions) |
4Q14 | 4Q13 | ||||||
| BGE Adjusted (non-GAAP) Operating Earnings |
$ | 53 | $ | 48 | ||||
| Merger and Integration Costs |
(1 | ) | (1 | ) | ||||
|
|
|
|
|
|||||
| BGE GAAP Net Income |
$ | 52 | $ | 47 | ||||
|
|
|
|
|
|||||
BGE’s Adjusted (non-GAAP) Operating Earnings in the fourth quarter of 2014 increased $5 million from the same quarter in 2013, primarily due to increased revenue as a result of the December 2013 and 2014 electric and gas distribution rate orders issued by the Maryland Public Service Commission, offset by higher operating and maintenance expense. Due to revenue decoupling, BGE is not affected by actual weather with the exception of major storms.
Adjusted (non-GAAP) Operating Earnings
Adjusted (non-GAAP) operating earnings, which generally exclude significant one-time charges or credits that are not normally associated with ongoing operations, mark-to-market adjustments from economic hedging activities and unrealized gains and losses from NDT fund investments, are provided as a supplement to results reported in accordance with GAAP. Management uses such adjusted (non-GAAP) operating earnings measures internally to evaluate the company’s performance and manage its operations. Reconciliation of GAAP to adjusted (non-GAAP) operating earnings for historical periods is attached. Additional earnings release attachments, which include the reconciliation on pages 8 and 9 are posted on Exelon’s Web site: www.exeloncorp.com and have been furnished to the Securities and Exchange Commission on Form 8-K on February 13, 2015.
Cautionary Statements Regarding Forward-Looking Information
This press release contains certain forward-looking statements within the meaning of the Private Securities Litigation Reform Act of 1995, that are subject to risks and uncertainties. The factors that could cause actual results to differ materially from the forward-looking statements made by Exelon Corporation, Commonwealth Edison Company, PECO Energy Company, Baltimore Gas and Electric Company and Exelon Generation Company, LLC (Registrants) include those factors discussed herein, as well as the items discussed in (1) Exelon’s 2014 Annual Report on Form 10-K (to be filed on February 13, 2015) in (a) ITEM 1A. Risk Factors, (b) ITEM 7. Management’s Discussion and Analysis of Financial Condition and Results of Operations and (c) ITEM 8. Financial Statements and Supplementary Data: Note 22 and (2) other factors discussed in filings with the SEC by the Registrants. Readers are cautioned not to place undue reliance on these forward-looking statements, which apply only as of the date of this press release.
8
None of the Registrants undertakes any obligation to publicly release any revision to its forward-looking statements to reflect events or circumstances after the date of this press release.
# # #
Exelon Corporation (NYSE: EXC) is the nation’s leading competitive energy provider, with 2014 revenues of approximately $27.4 billion. Headquartered in Chicago, Exelon does business in 48 states, the District of Columbia and Canada. Exelon is one of the largest competitive U.S. power generators, with approximately 32,500 megawatts of owned capacity comprising one of the nation’s cleanest and lowest-cost power generation fleets. The company’s Constellation business unit provides energy products and services to more than 2.5 million residential, public sector and business customers, including more than two-thirds of the Fortune 100. Exelon’s utilities deliver electricity and natural gas to more than 7.8 million customers in central Maryland (BGE), northern Illinois (ComEd) and southeastern Pennsylvania (PECO). Follow Exelon on Twitter @Exelon.
9
Earnings Release Attachments
Table of Contents
| Consolidating Statements of Operations - Three Months Ended December 31, 2014 and 2013 |
1 | |||
| Consolidating Statements of Operations - Twelve Months Ended December 31, 2014 and 2013 |
2 | |||
| Business Segment Comparative Statements of Operations - Generation and ComEd - Three and Twelve months ended December 31, 2014 and 2013 |
3 | |||
| Business Segment Comparative Statements of Operations - PECO and BGE - Three and Twelve months ended December 31, 2014 and 2013 |
4 | |||
| Business Segment Comparative Statements of Operations - Other - Three and Twelve months ended December 31, 2014 and 2013 |
5 | |||
| Consolidated Balance Sheets - December 31, 2014 and 2013 |
6 | |||
| Consolidated Statements of Cash Flows - Twelve Months Ended December 31, 2014 and 2013 |
7 | |||
| Reconciliation of Adjusted (non-GAAP) Operating Earnings to GAAP Consolidated Statements of Operations - Exelon - Three Months Ended December 31, 2014 and 2013 |
8 | |||
| Reconciliation of Adjusted (non-GAAP) Operating Earnings to GAAP Consolidated Statements of Operations - Exelon - Twelve Months Ended December 31, 2014 and 2013 |
9 | |||
| Reconciliation of Adjusted (non-GAAP) Operating Earnings to GAAP Earnings By Business Segment - Three Months Ended December 31, 2014 and 2013 |
10 | |||
| Reconciliation of Adjusted (non-GAAP) Operating Earnings to GAAP Earnings By Business Segment - Twelve Months Ended December 31, 2014 and 2013 |
11 | |||
| Reconciliation of Adjusted (non-GAAP) Operating Earnings to GAAP Consolidated Statements of Operations - Generation - Three and Twelve months ended December 31, 2014 and 2013 |
12 | |||
| Reconciliation of Adjusted (non-GAAP) Operating Earnings to GAAP Consolidated Statements of Operations - ComEd - Three and Twelve months ended December 31, 2014 and 2013 |
13 | |||
| Reconciliation of Adjusted (non-GAAP) Operating Earnings to GAAP Consolidated Statements of Operations - PECO - Three and Twelve months ended December 31, 2014 and 2013 |
14 | |||
| Reconciliation of Adjusted (non-GAAP) Operating Earnings to GAAP Consolidated Statements of Operations - BGE - Three and Twelve months ended December 31, 2014 and 2013 |
15 | |||
| Reconciliation of Adjusted (non-GAAP) Operating Earnings to GAAP Consolidated Statements of Operations - Other - Three and Twelve months ended December 31, 2014 and 2013 |
16 | |||
| Exelon Generation Statistics - Three Months Ended December 31, 2014, September 30, 2014, June 30, 2014, March 31, 2014, and December 31, 2013 |
17 | |||
| Exelon Generation Statistics - Twelve Months Ended December 31, 2014 and 2013 |
18 | |||
| ComEd Statistics - Three and Twelve months ended December 31, 2014 and 2013 |
19 | |||
| PECO Statistics - Three and Twelve months ended December 31, 2014 and 2013 |
20 | |||
| BGE Statistics - Three and Twelve months ended December 31, 2014 and 2013 |
21 | |||
EXELON CORPORATION
Consolidating Statements of Operations
(unaudited)
(in millions)
| Three Months Ended December 31, 2014 (a) | ||||||||||||||||||||||||
| Generation | ComEd | PECO | BGE | Other (b) | Exelon Consolidated |
|||||||||||||||||||
| Operating revenues |
$ | 4,802 | $ | 1,079 | $ | 750 | $ | 761 | $ | (137 | ) | $ | 7,255 | |||||||||||
| Operating expenses |
||||||||||||||||||||||||
| Purchased power and fuel |
2,853 | 262 | 301 | 323 | (136 | ) | 3,603 | |||||||||||||||||
| Operating and maintenance |
1,801 | 388 | 198 | 176 | — | 2,563 | ||||||||||||||||||
| Depreciation and amortization |
248 | 166 | 59 | 96 | 13 | 582 | ||||||||||||||||||
| Taxes other than income |
115 | 67 | 36 | 53 | (4 | ) | 267 | |||||||||||||||||
|
|
|
|
|
|
|
|
|
|
|
|
|
|||||||||||||
| Total operating expenses |
5,017 | 883 | 594 | 648 | (127 | ) | 7,015 | |||||||||||||||||
| Gain on sales of assets |
82 | — | — | — | (2 | ) | 80 | |||||||||||||||||
| Gain on acquisition of businesses |
28 | — | — | — | — | 28 | ||||||||||||||||||
|
|
|
|
|
|
|
|
|
|
|
|
|
|||||||||||||
| Operating income (loss) |
(105 | ) | 196 | 156 | 113 | (12 | ) | 348 | ||||||||||||||||
|
|
|
|
|
|
|
|
|
|
|
|
|
|||||||||||||
| Other income and (deductions) |
||||||||||||||||||||||||
| Interest expense |
(96 | ) | (80 | ) | (28 | ) | (25 | ) | (114 | ) | (343 | ) | ||||||||||||
| Other, net |
101 | 4 | 2 | 4 | (1 | ) | 110 | |||||||||||||||||
|
|
|
|
|
|
|
|
|
|
|
|
|
|||||||||||||
| Total other income and (deductions) |
5 | (76 | ) | (26 | ) | (21 | ) | (115 | ) | (233 | ) | |||||||||||||
|
|
|
|
|
|
|
|
|
|
|
|
|
|||||||||||||
| Income (loss) before income taxes |
(100 | ) | 120 | 130 | 92 | (127 | ) | 115 | ||||||||||||||||
| Income taxes |
(83 | ) | 47 | 32 | 37 | (13 | ) | 20 | ||||||||||||||||
|
|
|
|
|
|
|
|
|
|
|
|
|
|||||||||||||
| Net income (loss) |
(17 | ) | 73 | 98 | 55 | (114 | ) | 95 | ||||||||||||||||
| Net income attributable to noncontrolling interests and preference stock dividends |
74 | — | — | 3 | — | 77 | ||||||||||||||||||
|
|
|
|
|
|
|
|
|
|
|
|
|
|||||||||||||
| Net income (loss) attributable to common shareholders |
$ | (91 | ) | $ | 73 | $ | 98 | $ | 52 | $ | (114 | ) | $ | 18 | ||||||||||
|
|
|
|
|
|
|
|
|
|
|
|
|
|||||||||||||
| Three Months Ended December 31, 2013 | ||||||||||||||||||||||||
| Generation | ComEd | PECO | BGE | Other (b) | Exelon Consolidated |
|||||||||||||||||||
| Operating revenues |
$ | 3,773 | $ | 1,068 | $ | 805 | $ | 794 | $ | (265 | ) | $ | 6,175 | |||||||||||
| Operating expenses |
||||||||||||||||||||||||
| Purchased power and fuel |
1,903 | 243 | 347 | 362 | (262 | ) | 2,593 | |||||||||||||||||
| Operating and maintenance |
1,156 | 347 | 194 | 185 | (3 | ) | 1,879 | |||||||||||||||||
| Depreciation and amortization |
214 | 168 | 58 | 95 | 12 | 547 | ||||||||||||||||||
| Taxes other than income |
98 | 74 | 38 | 51 | 9 | 270 | ||||||||||||||||||
|
|
|
|
|
|
|
|
|
|
|
|
|
|||||||||||||
| Total operating expenses |
3,371 | 832 | 637 | 693 | (244 | ) | 5,289 | |||||||||||||||||
|
|
|
|
|
|
|
|
|
|
|
|
|
|||||||||||||
| Equity in earnings of unconsolidated affiliates |
3 | — | — | — | — | 3 | ||||||||||||||||||
|
|
|
|
|
|
|
|
|
|
|
|
|
|||||||||||||
| Gain (loss) on sales of assets |
— | — | — | — | — | — | ||||||||||||||||||
|
|
|
|
|
|
|
|
|
|
|
|
|
|||||||||||||
| Operating income (loss) |
405 | 236 | 168 | 101 | (21 | ) | 889 | |||||||||||||||||
|
|
|
|
|
|
|
|
|
|
|
|
|
|||||||||||||
| Other income and (deductions) |
||||||||||||||||||||||||
| Interest expense |
(99 | ) | (76 | ) | (29 | ) | (28 | ) | (14 | ) | (246 | ) | ||||||||||||
| Other, net |
138 | 8 | 2 | 4 | 10 | 162 | ||||||||||||||||||
|
|
|
|
|
|
|
|
|
|
|
|
|
|||||||||||||
| Total other income and (deductions) |
39 | (68 | ) | (27 | ) | (24 | ) | (4 | ) | (84 | ) | |||||||||||||
|
|
|
|
|
|
|
|
|
|
|
|
|
|||||||||||||
| Income (loss) before income taxes |
444 | 168 | 141 | 77 | (25 | ) | 805 | |||||||||||||||||
| Income taxes |
179 | 59 | 39 | 27 | 7 | 311 | ||||||||||||||||||
|
|
|
|
|
|
|
|
|
|
|
|
|
|||||||||||||
| Net income (loss) |
265 | 109 | 102 | 50 | (32 | ) | 494 | |||||||||||||||||
| Net income (loss) attributable to noncontrolling interests and preference stock dividends |
(4 | ) | — | — | 3 | — | (1 | ) | ||||||||||||||||
|
|
|
|
|
|
|
|
|
|
|
|
|
|||||||||||||
| Net income (loss) attributable to common shareholders |
$ | 269 | $ | 109 | $ | 102 | $ | 47 | $ | (32 | ) | $ | 495 | |||||||||||
|
|
|
|
|
|
|
|
|
|
|
|
|
|||||||||||||
| (a) | On April 1, 2014, Generation assumed operational control of Constellation Energy Nuclear Group’s (“CENG”) nuclear fleet. As a result, the 2014 financial results include CENG’s results of operations on a fully consolidated basis from April 1, 2014 through December 31, 2014. |
| (b) | Other primarily includes eliminating and consolidating adjustments, Exelon’s corporate operations, shared service entities and other financing and investment activities. |
1
EXELON CORPORATION
Consolidating Statements of Operations
(unaudited)
(in millions)
| Twelve Months Ended December 31, 2014 (a) | ||||||||||||||||||||||||
| Generation | ComEd | PECO | BGE | Other (b) | Exelon Consolidated |
|||||||||||||||||||
| Operating revenues |
$ | 17,393 | $ | 4,564 | $ | 3,094 | $ | 3,165 | $ | (787 | ) | $ | 27,429 | |||||||||||
| Operating expenses |
||||||||||||||||||||||||
| Purchased power and fuel |
9,925 | 1,177 | 1,261 | 1,417 | (777 | ) | 13,003 | |||||||||||||||||
| Operating and maintenance |
5,566 | 1,429 | 866 | 717 | (10 | ) | 8,568 | |||||||||||||||||
| Depreciation and amortization |
967 | 687 | 236 | 371 | 53 | 2,314 | ||||||||||||||||||
| Taxes other than income |
465 | 293 | 159 | 221 | 16 | 1,154 | ||||||||||||||||||
|
|
|
|
|
|
|
|
|
|
|
|
|
|||||||||||||
| Total operating expenses |
16,923 | 3,586 | 2,522 | 2,726 | (718 | ) | 25,039 | |||||||||||||||||
| Equity in losses of unconsolidated affiliates |
(20 | ) | — | — | — | — | (20 | ) | ||||||||||||||||
| Gain on sales of assets |
437 | 2 | — | — | (2 | ) | 437 | |||||||||||||||||
| Gain on consolidation and acquisition of businesses |
289 | — | — | — | — | 289 | ||||||||||||||||||
|
|
|
|
|
|
|
|
|
|
|
|
|
|||||||||||||
| Operating income (loss) |
1,176 | 980 | 572 | 439 | (71 | ) | 3,096 | |||||||||||||||||
|
|
|
|
|
|
|
|
|
|
|
|
|
|||||||||||||
| Other income and (deductions) |
||||||||||||||||||||||||
| Interest expense |
(356 | ) | (321 | ) | (113 | ) | (106 | ) | (169 | ) | (1,065 | ) | ||||||||||||
| Other, net |
406 | 17 | 7 | 18 | 7 | 455 | ||||||||||||||||||
|
|
|
|
|
|
|
|
|
|
|
|
|
|||||||||||||
| Total other income and (deductions) |
50 | (304 | ) | (106 | ) | (88 | ) | (162 | ) | (610 | ) | |||||||||||||
|
|
|
|
|
|
|
|
|
|
|
|
|
|||||||||||||
| Income (loss) before income taxes |
1,226 | 676 | 466 | 351 | (233 | ) | 2,486 | |||||||||||||||||
| Income taxes |
207 | 268 | 114 | 140 | (63 | ) | 666 | |||||||||||||||||
|
|
|
|
|
|
|
|
|
|
|
|
|
|||||||||||||
| Net income (loss) |
1,019 | 408 | 352 | 211 | (170 | ) | 1,820 | |||||||||||||||||
| Net income attributable to noncontrolling interests and preference stock dividends |
184 | — | — | 13 | — | 197 | ||||||||||||||||||
|
|
|
|
|
|
|
|
|
|
|
|
|
|||||||||||||
| Net income (loss) attributable to common shareholders |
$ | 835 | $ | 408 | $ | 352 | $ | 198 | $ | (170 | ) | $ | 1,623 | |||||||||||
|
|
|
|
|
|
|
|
|
|
|
|
|
|||||||||||||
| Twelve Months Ended December 31, 2013 | ||||||||||||||||||||||||
| Generation | ComEd | PECO | BGE | Other (b) | Exelon Consolidated |
|||||||||||||||||||
| Operating revenues |
$ | 15,630 | $ | 4,464 | $ | 3,100 | $ | 3,065 | $ | (1,371 | ) | $ | 24,888 | |||||||||||
| Operating expenses |
||||||||||||||||||||||||
| Purchased power and fuel |
8,197 | 1,174 | 1,300 | 1,421 | (1,368 | ) | 10,724 | |||||||||||||||||
| Operating and maintenance |
4,534 | 1,368 | 748 | 634 | (14 | ) | 7,270 | |||||||||||||||||
| Depreciation and amortization |
856 | 669 | 228 | 348 | 52 | 2,153 | ||||||||||||||||||
| Taxes other than income |
389 | 299 | 158 | 213 | 36 | 1,095 | ||||||||||||||||||
|
|
|
|
|
|
|
|
|
|
|
|
|
|||||||||||||
| Total operating expenses |
13,976 | 3,510 | 2,434 | 2,616 | (1,294 | ) | 21,242 | |||||||||||||||||
| Equity in earnings of unconsolidated affiliates |
10 | — | — | — | — | 10 | ||||||||||||||||||
| Gain on sales of assets |
13 | — | — | — | — | 13 | ||||||||||||||||||
|
|
|
|
|
|
|
|
|
|
|
|
|
|||||||||||||
| Operating income (loss) |
1,677 | 954 | 666 | 449 | (77 | ) | 3,669 | |||||||||||||||||
|
|
|
|
|
|
|
|
|
|
|
|
|
|||||||||||||
| Other income and (deductions) |
||||||||||||||||||||||||
| Interest expense |
(357 | ) | (579 | ) | (115 | ) | (122 | ) | (183 | ) | (1,356 | ) | ||||||||||||
| Other, net |
355 | 26 | 6 | 17 | 56 | 460 | ||||||||||||||||||
|
|
|
|
|
|
|
|
|
|
|
|
|
|||||||||||||
| Total other income and (deductions) |
(2 | ) | (553 | ) | (109 | ) | (105 | ) | (127 | ) | (896 | ) | ||||||||||||
|
|
|
|
|
|
|
|
|
|
|
|
|
|||||||||||||
| Income (loss) before income taxes |
1,675 | 401 | 557 | 344 | (204 | ) | 2,773 | |||||||||||||||||
| Income taxes |
615 | 152 | 162 | 134 | (19 | ) | 1,044 | |||||||||||||||||
|
|
|
|
|
|
|
|
|
|
|
|
|
|||||||||||||
| Net income (loss) |
1,060 | 249 | 395 | 210 | (185 | ) | 1,729 | |||||||||||||||||
| Net income (loss) attributable to noncontrolling interests, preferred security dividends and preference stock dividends |
(10 | ) | — | 7 | 13 | — | 10 | |||||||||||||||||
|
|
|
|
|
|
|
|
|
|
|
|
|
|||||||||||||
| Net income (loss) attributable to common shareholders |
$ | 1,070 | $ | 249 | $ | 388 | $ | 197 | $ | (185 | ) | $ | 1,719 | |||||||||||
|
|
|
|
|
|
|
|
|
|
|
|
|
|||||||||||||
| (a) | On April 1, 2014, Generation assumed operational control of Constellation Energy Nuclear Group’s (“CENG”) nuclear fleet. As a result, the 2014 financial results include CENG’s results of operations on a fully consolidated basis from April 1, 2014 through December 31, 2014. |
| (b) | Other primarily includes eliminating and consolidating adjustments, Exelon’s corporate operations, shared service entities and other financing and investment activities. |
2
EXELON CORPORATION
Business Segment Comparative Statements of Operations
(unaudited)
(in millions)
| Generation | ||||||||||||||||||||||||
| Three Months Ended December 31, | Twelve Months Ended December 31, | |||||||||||||||||||||||
| 2014 (a) | 2013 | Variance | 2014 (a) | 2013 | Variance | |||||||||||||||||||
| Operating revenues |
$ | 4,802 | $ | 3,773 | $ | 1,029 | $ | 17,393 | $ | 15,630 | $ | 1,763 | ||||||||||||
| Operating expenses |
||||||||||||||||||||||||
| Purchased power and fuel |
2,853 | 1,903 | 950 | 9,925 | 8,197 | 1,728 | ||||||||||||||||||
| Operating and maintenance |
1,801 | 1,156 | 645 | 5,566 | 4,534 | 1,032 | ||||||||||||||||||
| Depreciation and amortization |
248 | 214 | 34 | 967 | 856 | 111 | ||||||||||||||||||
| Taxes other than income |
115 | 98 | 17 | 465 | 389 | 76 | ||||||||||||||||||
|
|
|
|
|
|
|
|
|
|
|
|
|
|||||||||||||
| Total operating expenses |
5,017 | 3,371 | 1,646 | 16,923 | 13,976 | 2,947 | ||||||||||||||||||
| Equity in earnings (losses) of unconsolidated affiliates |
— | 3 | (3 | ) | (20 | ) | 10 | (30 | ) | |||||||||||||||
| Gain on sales of assets |
82 | — | 82 | 437 | 13 | 424 | ||||||||||||||||||
| Gain on acquisitions of businesses |
28 | — | 28 | 289 | — | 289 | ||||||||||||||||||
|
|
|
|
|
|
|
|
|
|
|
|
|
|||||||||||||
| Operating income (loss) |
(105 | ) | 405 | (510 | ) | 1,176 | 1,677 | (501 | ) | |||||||||||||||
|
|
|
|
|
|
|
|
|
|
|
|
|
|||||||||||||
| Other income and (deductions) |
||||||||||||||||||||||||
| Interest expense |
(96 | ) | (99 | ) | 3 | (356 | ) | (357 | ) | 1 | ||||||||||||||
| Other, net |
101 | 138 | (37 | ) | 406 | 355 | 51 | |||||||||||||||||
|
|
|
|
|
|
|
|
|
|
|
|
|
|||||||||||||
| Total other income and (deductions) |
5 | 39 | (34 | ) | 50 | (2 | ) | 52 | ||||||||||||||||
|
|
|
|
|
|
|
|
|
|
|
|
|
|||||||||||||
| Income (loss) before income taxes |
(100 | ) | 444 | (544 | ) | 1,226 | 1,675 | (449 | ) | |||||||||||||||
| Income taxes |
(83 | ) | 179 | (262 | ) | 207 | 615 | (408 | ) | |||||||||||||||
|
|
|
|
|
|
|
|
|
|
|
|
|
|||||||||||||
| Net income (loss) |
(17 | ) | 265 | (282 | ) | 1,019 | 1,060 | (41 | ) | |||||||||||||||
| Net income (loss) attributable to noncontrolling interests |
74 | (4 | ) | 78 | 184 | (10 | ) | 194 | ||||||||||||||||
|
|
|
|
|
|
|
|
|
|
|
|
|
|||||||||||||
| Net income attributable to membership interest |
$ | (91 | ) | $ | 269 | $ | (360 | ) | $ | 835 | $ | 1,070 | $ | (235 | ) | |||||||||
|
|
|
|
|
|
|
|
|
|
|
|
|
|||||||||||||
| ComEd | ||||||||||||||||||||||||
| Three Months Ended December 31, | Twelve Months Ended December 31, | |||||||||||||||||||||||
| 2014 | 2013 | Variance | 2014 | 2013 | Variance | |||||||||||||||||||
| Operating revenues |
$ | 1,079 | $ | 1,068 | $ | 11 | $ | 4,564 | $ | 4,464 | $ | 100 | ||||||||||||
| Operating expenses |
||||||||||||||||||||||||
| Purchased power |
262 | 243 | 19 | 1,177 | 1,174 | 3 | ||||||||||||||||||
| Operating and maintenance |
388 | 347 | 41 | 1,429 | 1,368 | 61 | ||||||||||||||||||
| Depreciation and amortization |
166 | 168 | (2 | ) | 687 | 669 | 18 | |||||||||||||||||
| Taxes other than income |
67 | 74 | (7 | ) | 293 | 299 | (6 | ) | ||||||||||||||||
|
|
|
|
|
|
|
|
|
|
|
|
|
|||||||||||||
| Total operating expenses |
883 | 832 | 51 | 3,586 | 3,510 | 76 | ||||||||||||||||||
|
|
|
|
|
|
|
|
|
|
|
|
|
|||||||||||||
| Gain on sales of assets |
— | — | — | 2 | — | 2 | ||||||||||||||||||
| Operating income |
196 | 236 | (40 | ) | 980 | 954 | 26 | |||||||||||||||||
|
|
|
|
|
|
|
|
|
|
|
|
|
|||||||||||||
| Other income and (deductions) |
||||||||||||||||||||||||
| Interest expense |
(80 | ) | (76 | ) | (4 | ) | (321 | ) | (579 | ) | 258 | |||||||||||||
| Other, net |
4 | 8 | (4 | ) | 17 | 26 | (9 | ) | ||||||||||||||||
|
|
|
|
|
|
|
|
|
|
|
|
|
|||||||||||||
| Total other income and (deductions) |
(76 | ) | (68 | ) | (8 | ) | (304 | ) | (553 | ) | 249 | |||||||||||||
|
|
|
|
|
|
|
|
|
|
|
|
|
|||||||||||||
| Income before income taxes |
120 | 168 | (48 | ) | 676 | 401 | 275 | |||||||||||||||||
| Income taxes |
47 | 59 | (12 | ) | 268 | 152 | 116 | |||||||||||||||||
|
|
|
|
|
|
|
|
|
|
|
|
|
|||||||||||||
| Net income |
$ | 73 | $ | 109 | $ | (36 | ) | $ | 408 | $ | 249 | $ | 159 | |||||||||||
|
|
|
|
|
|
|
|
|
|
|
|
|
|||||||||||||
| (a) | On April 1, 2014, Generation assumed operational control of Constellation Energy Nuclear Group’s (“CENG”) nuclear fleet. As a result, the 2014 financial results include CENG’s results of operations on a fully consolidated basis from April 1, 2014 through December 31, 2014. |
3
EXELON CORPORATION
Business Segment Comparative Statements of Operations
(unaudited)
(in millions)
| PECO | ||||||||||||||||||||||||
| Three Months Ended December 31, | Twelve Months Ended December 31, | |||||||||||||||||||||||
| 2014 | 2013 | Variance | 2014 | 2013 | Variance | |||||||||||||||||||
| Operating revenues |
$ | 750 | $ | 805 | $ | (55 | ) | $ | 3,094 | $ | 3,100 | $ | (6 | ) | ||||||||||
| Operating expenses |
||||||||||||||||||||||||
| Purchased power and fuel |
301 | 347 | (46 | ) | 1,261 | 1,300 | (39 | ) | ||||||||||||||||
| Operating and maintenance |
198 | 194 | 4 | 866 | 748 | 118 | ||||||||||||||||||
| Depreciation and amortization |
59 | 58 | 1 | 236 | 228 | 8 | ||||||||||||||||||
| Taxes other than income |
36 | 38 | (2 | ) | 159 | 158 | 1 | |||||||||||||||||
|
|
|
|
|
|
|
|
|
|
|
|
|
|||||||||||||
| Total operating expenses |
594 | 637 | (43 | ) | 2,522 | 2,434 | 88 | |||||||||||||||||
|
|
|
|
|
|
|
|
|
|
|
|
|
|||||||||||||
| Operating income |
156 | 168 | (12 | ) | 572 | 666 | (94 | ) | ||||||||||||||||
|
|
|
|
|
|
|
|
|
|
|
|
|
|||||||||||||
| Other income and (deductions) |
||||||||||||||||||||||||
| Interest expense |
(28 | ) | (29 | ) | 1 | (113 | ) | (115 | ) | 2 | ||||||||||||||
| Other, net |
2 | 2 | — | 7 | 6 | 1 | ||||||||||||||||||
|
|
|
|
|
|
|
|
|
|
|
|
|
|||||||||||||
| Total other income and (deductions) |
(26 | ) | (27 | ) | 1 | (106 | ) | (109 | ) | 3 | ||||||||||||||
|
|
|
|
|
|
|
|
|
|
|
|
|
|||||||||||||
| Income before income taxes |
130 | 141 | (11 | ) | 466 | 557 | (91 | ) | ||||||||||||||||
| Income taxes |
32 | 39 | (7 | ) | 114 | 162 | (48 | ) | ||||||||||||||||
|
|
|
|
|
|
|
|
|
|
|
|
|
|||||||||||||
| Net income |
98 | 102 | (4 | ) | 352 | 395 | (43 | ) | ||||||||||||||||
| Preferred security dividends and redemption |
— | — | — | — | 7 | (7 | ) | |||||||||||||||||
|
|
|
|
|
|
|
|
|
|
|
|
|
|||||||||||||
| Net income attributable to common shareholder |
$ | 98 | $ | 102 | $ | (4 | ) | $ | 352 | $ | 388 | $ | (36 | ) | ||||||||||
|
|
|
|
|
|
|
|
|
|
|
|
|
|||||||||||||
| BGE | ||||||||||||||||||||||||
| Three Months Ended December 31, | Twelve Months Ended December 31, | |||||||||||||||||||||||
| 2014 | 2013 | Variance | 2014 | 2013 | Variance | |||||||||||||||||||
| Operating revenues |
$ | 761 | $ | 794 | $ | (33 | ) | $ | 3,165 | $ | 3,065 | $ | 100 | |||||||||||
| Operating expenses |
||||||||||||||||||||||||
| Purchased power and fuel |
323 | 362 | (39 | ) | 1,417 | 1,421 | (4 | ) | ||||||||||||||||
| Operating and maintenance |
176 | 185 | (9 | ) | 717 | 634 | 83 | |||||||||||||||||
| Depreciation and amortization |
96 | 95 | 1 | 371 | 348 | 23 | ||||||||||||||||||
| Taxes other than income |
53 | 51 | 2 | 221 | 213 | 8 | ||||||||||||||||||
|
|
|
|
|
|
|
|
|
|
|
|
|
|||||||||||||
| Total operating expenses |
648 | 693 | (45 | ) | 2,726 | 2,616 | 110 | |||||||||||||||||
|
|
|
|
|
|
|
|
|
|
|
|
|
|||||||||||||
| Operating income |
113 | 101 | 12 | 439 | 449 | (10 | ) | |||||||||||||||||
|
|
|
|
|
|
|
|
|
|
|
|
|
|||||||||||||
| Other income and (deductions) |
||||||||||||||||||||||||
| Interest expense |
(25 | ) | (28 | ) | 3 | (106 | ) | (122 | ) | 16 | ||||||||||||||
| Other, net |
4 | 4 | — | 18 | 17 | 1 | ||||||||||||||||||
|
|
|
|
|
|
|
|
|
|
|
|
|
|||||||||||||
| Total other income and (deductions) |
(21 | ) | (24 | ) | 3 | (88 | ) | (105 | ) | 17 | ||||||||||||||
|
|
|
|
|
|
|
|
|
|
|
|
|
|||||||||||||
| Income before income taxes |
92 | 77 | 15 | 351 | 344 | 7 | ||||||||||||||||||
| Income taxes |
37 | 27 | 10 | 140 | 134 | 6 | ||||||||||||||||||
|
|
|
|
|
|
|
|
|
|
|
|
|
|||||||||||||
| Net income |
55 | 50 | 5 | 211 | 210 | 1 | ||||||||||||||||||
| Preference stock dividends |
3 | 3 | — | 13 | 13 | — | ||||||||||||||||||
|
|
|
|
|
|
|
|
|
|
|
|
|
|||||||||||||
| Net income attributable to common shareholders |
$ | 52 | $ | 47 | $ | 5 | $ | 198 | $ | 197 | $ | 1 | ||||||||||||
|
|
|
|
|
|
|
|
|
|
|
|
|
|||||||||||||
4
EXELON CORPORATION
Business Segment Comparative Statements of Operations
(unaudited)
(in millions)
| Other (a) | ||||||||||||||||||||||||
| Three Months Ended December 31, | Twelve Months Ended December 31, | |||||||||||||||||||||||
| 2014 | 2013 | Variance | 2014 | 2013 | Variance | |||||||||||||||||||
| Operating revenues |
$ | (137 | ) | $ | (265 | ) | $ | 128 | $ | (787 | ) | $ | (1,371 | ) | $ | 584 | ||||||||
| Operating expenses |
||||||||||||||||||||||||
| Purchased power and fuel |
(136 | ) | (262 | ) | 126 | (777 | ) | (1,368 | ) | 591 | ||||||||||||||
| Operating and maintenance |
— | (3 | ) | 3 | (10 | ) | (14 | ) | 4 | |||||||||||||||
| Depreciation and amortization |
13 | 12 | 1 | 53 | 52 | 1 | ||||||||||||||||||
| Taxes other than income |
(4 | ) | 9 | (13 | ) | 16 | 36 | (20 | ) | |||||||||||||||
|
|
|
|
|
|
|
|
|
|
|
|
|
|||||||||||||
| Total operating expenses |
(127 | ) | (244 | ) | 117 | (718 | ) | (1,294 | ) | 576 | ||||||||||||||
|
|
|
|
|
|
|
|
|
|
|
|
|
|||||||||||||
| Gain on sales of assets |
(2 | ) | — | (2 | ) | (2 | ) | — | (2 | ) | ||||||||||||||
| Operating loss |
(12 | ) | (21 | ) | 9 | (71 | ) | (77 | ) | 6 | ||||||||||||||
|
|
|
|
|
|
|
|
|
|
|
|
|
|||||||||||||
| Other income and (deductions) |
||||||||||||||||||||||||
| Interest expense |
(114 | ) | (14 | ) | (100 | ) | (169 | ) | (183 | ) | 14 | |||||||||||||
| Other, net |
(1 | ) | 10 | (11 | ) | 7 | 56 | (49 | ) | |||||||||||||||
|
|
|
|
|
|
|
|
|
|
|
|
|
|||||||||||||
| Total other income and (deductions) |
(115 | ) | (4 | ) | (111 | ) | (162 | ) | (127 | ) | (35 | ) | ||||||||||||
|
|
|
|
|
|
|
|
|
|
|
|
|
|||||||||||||
| Loss before income taxes |
(127 | ) | (25 | ) | (102 | ) | (233 | ) | (204 | ) | (29 | ) | ||||||||||||
| Income taxes |
(13 | ) | 7 | (20 | ) | (63 | ) | (19 | ) | (44 | ) | |||||||||||||
|
|
|
|
|
|
|
|
|
|
|
|
|
|||||||||||||
| Net loss |
$ | (114 | ) | $ | (32 | ) | $ | (82 | ) | $ | (170 | ) | $ | (185 | ) | $ | 15 | |||||||
|
|
|
|
|
|
|
|
|
|
|
|
|
|||||||||||||
| (a) | Other primarily includes eliminating and consolidating adjustments, Exelon’s corporate operations, shared service entities and other financing and investment activities. |
5
EXELON CORPORATION
Consolidated Balance Sheets
(in millions)
| December 31, 2014 | December 31, 2013 | |||||||
| (unaudited) | ||||||||
| Assets |
||||||||
| Current assets |
||||||||
| Cash and cash equivalents |
$ | 1,878 | $ | 1,609 | ||||
| Restricted cash and investments |
271 | 167 | ||||||
| Accounts receivable, net |
||||||||
| Customer |
3,482 | 2,981 | ||||||
| Other |
1,227 | 1,175 | ||||||
| Mark-to-market derivative assets |
1,279 | 727 | ||||||
| Unamortized energy contract assets |
254 | 374 | ||||||
| Inventories, net |
||||||||
| Fossil fuel |
579 | 276 | ||||||
| Materials and supplies |
1,024 | 829 | ||||||
| Deferred income taxes |
244 | 573 | ||||||
| Regulatory assets |
847 | 760 | ||||||
| Assets held for sale |
147 | 14 | ||||||
| Other |
865 | 652 | ||||||
|
|
|
|
|
|||||
| Total current assets |
12,097 | 10,137 | ||||||
|
|
|
|
|
|||||
| Property, plant and equipment, net |
52,087 | 47,330 | ||||||
| Deferred debits and other assets |
||||||||
| Regulatory assets |
6,076 | 5,910 | ||||||
| Nuclear decommissioning trust funds |
10,537 | 8,071 | ||||||
| Investments |
544 | 1,187 | ||||||
| Investment in CENG |
— | 1,925 | ||||||
| Goodwill |
2,672 | 2,625 | ||||||
| Mark-to-market derivative assets |
773 | 607 | ||||||
| Unamortized energy contracts assets |
549 | 710 | ||||||
| Pledged assets for Zion Station decommissioning |
319 | 458 | ||||||
| Other |
1,160 | 964 | ||||||
| Total deferred debits and other assets |
22,630 | 22,457 | ||||||
|
|
|
|
|
|||||
| Total assets |
$ | 86,814 | $ | 79,924 | ||||
|
|
|
|
|
|||||
| Liabilities and shareholders’ equity |
||||||||
| Current liabilities |
||||||||
| Short-term borrowings |
$ | 460 | $ | 341 | ||||
| Long-term debt due within one year |
1,802 | 1,509 | ||||||
| Accounts payable |
3,048 | 2,484 | ||||||
| Accrued expenses |
1,539 | 1,633 | ||||||
| Payables to affiliates |
8 | 116 | ||||||
| Deferred income taxes |
— | 40 | ||||||
| Regulatory liabilities |
310 | 327 | ||||||
| Mark-to-market derivative liabilities |
234 | 159 | ||||||
| Unamortized energy contract liabilities |
238 | 261 | ||||||
| Other |
1,123 | 858 | ||||||
|
|
|
|
|
|||||
| Total current liabilities |
8,762 | 7,728 | ||||||
|
|
|
|
|
|||||
| Long-term debt |
19,362 | 17,623 | ||||||
| Long-term debt to financing trusts |
648 | 648 | ||||||
| Deferred credits and other liabilities |
||||||||
| Deferred income taxes and unamortized investment tax credits |
13,019 | 12,905 | ||||||
| Asset retirement obligations |
7,295 | 5,194 | ||||||
| Pension obligations |
3,366 | 1,876 | ||||||
| Non-pension postretirement benefit obligations |
1,742 | 2,190 | ||||||
| Spent nuclear fuel obligation |
1,021 | 1,021 | ||||||
| Regulatory liabilities |
4,550 | 4,388 | ||||||
| Mark-to-market derivative liabilities |
403 | 300 | ||||||
| Unamortized energy contract liabilities |
211 | 266 | ||||||
| Payable for Zion Station decommissioning |
155 | 305 | ||||||
| Other |
2,147 | 2,540 | ||||||
|
|
|
|
|
|||||
| Total deferred credits and other liabilities |
33,909 | 30,985 | ||||||
|
|
|
|
|
|||||
| Total liabilities |
62,681 | 56,984 | ||||||
|
|
|
|
|
|||||
| Commitments and contingencies |
||||||||
| Shareholders’ equity |
||||||||
| Common stock |
16,709 | 16,741 | ||||||
| Treasury stock, at cost |
(2,327 | ) | (2,327 | ) | ||||
| Retained earnings |
10,910 | 10,358 | ||||||
| Accumulated other comprehensive loss, net |
(2,684 | ) | (2,040 | ) | ||||
|
|
|
|
|
|||||
| Total shareholders’ equity |
22,608 | 22,732 | ||||||
| BGE preference stock not subject to mandatory redemption |
193 | 193 | ||||||
| Noncontrolling interest |
1,332 | 15 | ||||||
|
|
|
|
|
|||||
| Total equity |
24,133 | 22,940 | ||||||
|
|
|
|
|
|||||
| Total liabilities and shareholders’ equity |
$ | 86,814 | $ | 79,924 | ||||
|
|
|
|
|
|||||
6
EXELON CORPORATION
Consolidated Statements of Cash Flows
(unaudited)
(in millions)
| Twelve Months Ended December 31, | ||||||||
| 2014 | 2013 | |||||||
| Cash flows from operating activities |
||||||||
| Net income |
$ | 1,820 | $ | 1,729 | ||||
| Adjustments to reconcile net income to net cash flows provided by operating activities: |
||||||||
| Depreciation, amortization, depletion and accretion, including nuclear fuel and energy contract amortization |
3,868 | 3,779 | ||||||
| Impairment of long-lived assets |
687 | 171 | ||||||
| Gain on consolidation and acquisition of businesses |
(296 | ) | — | |||||
| (Gain) loss on sales of assets |
(437 | ) | (13 | ) | ||||
| Deferred income taxes and amortization of investment tax credits |
502 | 119 | ||||||
| Net fair value changes related to derivatives |
716 | (445 | ) | |||||
| Net realized and unrealized gains on nuclear decommissioning trust fund investments |
(210 | ) | (170 | ) | ||||
| Other non-cash operating activities |
1,054 | 718 | ||||||
| Changes in assets and liabilities: |
||||||||
| Accounts receivable |
(318 | ) | (97 | ) | ||||
| Inventories |
(380 | ) | (100 | ) | ||||
| Accounts payable, accrued expenses and other current liabilities |
209 | (90 | ) | |||||
| Option premiums received (paid), net |
38 | (36 | ) | |||||
| Counterparty collateral (posted) received, net |
(1,478 | ) | 215 | |||||
| Income taxes |
(143 | ) | 883 | |||||
| Pension and non-pension postretirement benefit contributions |
(617 | ) | (422 | ) | ||||
| Other assets and liabilities |
(558 | ) | 102 | |||||
|
|
|
|
|
|||||
| Net cash flows provided by operating activities |
4,457 | 6,343 | ||||||
|
|
|
|
|
|||||
| Cash flows from investing activities |
||||||||
| Capital expenditures |
(6,077 | ) | (5,395 | ) | ||||
| Proceeds from termination of direct financing lease investment |
335 | — | ||||||
| Proceeds from nuclear decommissioning trust fund sales |
7,396 | 4,217 | ||||||
| Investment in nuclear decommissioning trust funds |
(7,551 | ) | (4,450 | ) | ||||
| Cash and restricted cash acquired from acquisitions and consolidations |
140 | — | ||||||
| Acquisition of businesses |
(386 | ) | — | |||||
| Proceeds from sale of long-lived assets |
1,719 | 32 | ||||||
| Proceeds from sale of investments |
7 | 22 | ||||||
| Purchases of investments |
(3 | ) | (4 | ) | ||||
| Change in restricted cash |
(104 | ) | (43 | ) | ||||
| Distribution from CENG |
13 | 115 | ||||||
| Other investing activities |
(88 | ) | 112 | |||||
|
|
|
|
|
|||||
| Net cash flows used in investing activities |
(4,599 | ) | (5,394 | ) | ||||
|
|
|
|
|
|||||
| Cash flows from financing activities |
||||||||
| Payment of accounts receivable agreement |
— | (210 | ) | |||||
| Changes in short-term borrowings |
122 | 332 | ||||||
| Issuance of long-term debt |
3,463 | 2,055 | ||||||
| Retirement of long-term debt |
(1,545 | ) | (1,589 | ) | ||||
| Redemption of preferred securities |
— | (93 | ) | |||||
| Distributions to non-controlling interest of consolidated VIE |
(421 | ) | — | |||||
| Dividends paid on common stock |
(1,065 | ) | (1,249 | ) | ||||
| Proceeds from employee stock plans |
35 | 47 | ||||||
| Other financing activities |
(178 | ) | (119 | ) | ||||
|
|
|
|
|
|||||
| Net cash flows provided by (used in) financing activities |
411 | (826 | ) | |||||
|
|
|
|
|
|||||
| Increase in cash and cash equivalents |
269 | 123 | ||||||
| Cash and cash equivalents at beginning of period |
1,609 | 1,486 | ||||||
|
|
|
|
|
|||||
| Cash and cash equivalents at end of period |
$ | 1,878 | $ | 1,609 | ||||
|
|
|
|
|
|||||
7
EXELON CORPORATION
Reconciliation of Adjusted (non-GAAP) Operating Earnings to GAAP Consolidated Statements of Operations
(unaudited)
(in millions, except per share data)
| Three Months Ended December 31, 2014 | Three Months Ended December 31, 2013 | |||||||||||||||||||||||||||||||
| GAAP (a) | Adjustments | Adjusted Non-GAAP |
GAAP (a) | Adjustments | Adjusted Non-GAAP |
|||||||||||||||||||||||||||
| Operating revenues |
$ | 7,255 | $ | (311 | ) | (b | ),(c) | $ | 6,944 | $ | 6,175 | $ | 79 | (b | ),(c) | $ | 6,254 | |||||||||||||||
| Operating expenses |
||||||||||||||||||||||||||||||||
| Purchased power and fuel |
3,603 | (471 | ) | (b | ),(c) | 3,132 | 2,593 | 208 | (b | ),(c) | 2,801 | |||||||||||||||||||||
| (d | ),(e),(f), | |||||||||||||||||||||||||||||||
| Operating and maintenance |
2,563 | (557 | ) | (d | ),(e),(f) | 2,006 | 1,879 | (47 | ) | (l | ),(m) | 1,832 | ||||||||||||||||||||
| Depreciation and amortization |
582 | — | 582 | 547 | (2 | ) | (f | ) | 545 | |||||||||||||||||||||||
| Taxes other than income |
267 | — | 267 | 270 | — | 270 | ||||||||||||||||||||||||||
|
|
|
|
|
|
|
|
|
|
|
|
|
|||||||||||||||||||||
| Total operating expenses |
7,015 | (1,028 | ) | 5,987 | 5,289 | 159 | 5,448 | |||||||||||||||||||||||||
| Equity in losses of unconsolidated affiliates |
— | — | — | 3 | 30 | (c | ),(d) | 33 | ||||||||||||||||||||||||
| Gain (loss) on sales of assets |
80 | (83 | ) | (f | ) | (3 | ) | — | — | — | ||||||||||||||||||||||
| Gain on acquisition of businesses |
28 | (28 | ) | (g | ) | — | — | — | — | |||||||||||||||||||||||
|
|
|
|
|
|
|
|
|
|
|
|
|
|||||||||||||||||||||
| Operating income |
348 | 606 | 954 | 889 | (50 | ) | 839 | |||||||||||||||||||||||||
|
|
|
|
|
|
|
|
|
|
|
|
|
|||||||||||||||||||||
| Other income and (deductions) |
||||||||||||||||||||||||||||||||
| Interest expense |
(343 | ) | 102 | (d | ) | (241 | ) | (246 | ) | — | (246 | ) | ||||||||||||||||||||
| Other, net |
110 | (41 | ) | (h | ),(i) | 69 | 162 | (118 | ) | (i | ) | 44 | ||||||||||||||||||||
|
|
|
|
|
|
|
|
|
|
|
|
|
|||||||||||||||||||||
| Total other income and (deductions) |
(233 | ) | 61 | (172 | ) | (84 | ) | (118 | ) | (202 | ) | |||||||||||||||||||||
|
|
|
|
|
|
|
|
|
|
|
|
|
|||||||||||||||||||||
| Income before income taxes |
115 | 667 | 782 | 805 | (168 | ) | 637 | |||||||||||||||||||||||||
| (b | ),(c),(d), | (b | ),(c),(d), | |||||||||||||||||||||||||||||
| (e | ),(f),(h), | (e | ),(f),(i), | |||||||||||||||||||||||||||||
| Income taxes |
20 | 291 | (i | ),(j) | 311 | 311 | (104 | ) | (j | ),(l),(m) | 207 | |||||||||||||||||||||
|
|
|
|
|
|
|
|
|
|
|
|
|
|||||||||||||||||||||
| Net income |
95 | 376 | 471 | 494 | (64 | ) | 430 | |||||||||||||||||||||||||
| Net income attributable to noncontrolling interests and preference stock dividends |
77 | (27 | ) | (k | ) | 50 | (1 | ) | 4 | (k | ) | 3 | ||||||||||||||||||||
|
|
|
|
|
|
|
|
|
|
|
|
|
|||||||||||||||||||||
| Net income attributable to common shareholders |
$ | 18 | $ | 403 | $ | 421 | $ | 495 | $ | (68 | ) | $ | 427 | |||||||||||||||||||
|
|
|
|
|
|
|
|
|
|
|
|
|
|||||||||||||||||||||
| Effective tax rate |
17.4 | % | 39.8 | % | 38.6 | % | 32.5 | % | ||||||||||||||||||||||||
| Earnings per average common share |
||||||||||||||||||||||||||||||||
| Basic |
$ | 0.02 | $ | 0.47 | $ | 0.49 | $ | 0.58 | $ | (0.08 | ) | $ | 0.50 | |||||||||||||||||||
| Diluted |
$ | 0.02 | $ | 0.46 | $ | 0.48 | $ | 0.58 | $ | (0.08 | ) | $ | 0.50 | |||||||||||||||||||
|
|
|
|
|
|
|
|
|
|
|
|
|
|||||||||||||||||||||
| Average common shares outstanding |
||||||||||||||||||||||||||||||||
| Basic |
861 | 861 | 857 | 857 | ||||||||||||||||||||||||||||
| Diluted |
868 | 868 | 861 | 861 | ||||||||||||||||||||||||||||
|
Effect of adjustments on earnings per average diluted common share recorded in accordance with GAAP:
|
| |||||||||||||||||||||||||||||||
| Mark-to-market impact of economic hedging activities (b) |
$ | 0.08 | $ | (0.16 | ) | |||||||||||||||||||||||||||
| Amortization of commodity contract intangibles (c) |
0.03 | 0.09 | ||||||||||||||||||||||||||||||
| Merger and integration costs (d) |
0.09 | 0.02 | ||||||||||||||||||||||||||||||
| Long-lived asset impairment (e) |
0.39 | — | ||||||||||||||||||||||||||||||
| Plant retirements and divestitures (f) |
(0.06 | ) | — | |||||||||||||||||||||||||||||
| Bargain-purchase gain (g) |
(0.03 | ) | — | |||||||||||||||||||||||||||||
| Tax settlements (h) |
(0.01 | ) | — | |||||||||||||||||||||||||||||
| Unrealized gains related to NDT fund investments (i) |
(0.03 | ) | (0.05 | ) | ||||||||||||||||||||||||||||
| Reassessment of state deferred income taxes (j) |
(0.03 | ) | — | |||||||||||||||||||||||||||||
| Non-controlling interest (k) |
0.03 | — | ||||||||||||||||||||||||||||||
| Asset retirement obligation (l) |
— | — | ||||||||||||||||||||||||||||||
| Midwest Generation bankruptcy charges (m) |
— | 0.02 | ||||||||||||||||||||||||||||||
|
|
|
|
|
|||||||||||||||||||||||||||||
| Total adjustments |
$ | 0.46 | $ | (0.08 | ) | |||||||||||||||||||||||||||
|
|
|
|
|
|||||||||||||||||||||||||||||
Note: On April 1, 2014, Generation assumed operational control of Constellation Energy Nuclear Group’s (“CENG”) nuclear fleet. As a result, the 2014 financial results include CENG’s results of operations on a fully consolidated basis from April 1, 2014 through December 31, 2014.
| (a) | Results reported in accordance with accounting principles generally accepted in the United States (GAAP). |
| (b) | Adjustment to exclude the mark-to-market impact of Exelon’s economic hedging activities, net of intercompany eliminations. |
| (c) | Adjustment to exclude the non-cash amortization of intangible assets, net, related to commodity contracts recorded at fair value at the 2012 Constellation merger date and the 2014 CENG integration date. |
| (d) | Adjustment to exclude certain costs associated with mergers and acquisitions, including professional fees, employee-related expenses, integration activities, upfront credit facilities, merger commitments, and certain pre-acquisition contingencies, if and when applicable, related to the Constellation merger in 2013 and the Constellation merger, CENG integration, acquisition of Integrys Energy Services, Inc. (“Integrys”) and pending Pepco Holdings Inc. (“PHI”) acquisition in 2014. |
| (e) | Adjustment to exclude a 2014 charge to earnings primarily related to the impairment of assets held for sale and certain upstream assets. |
| (f) | Adjustment to exclude the impacts associated with the sales of Generation’s ownership interests in Fore River and West Valley Generating Stations in 2014, and sale or retirement of generating stations in 2013. |
| (g) | Adjustment to exclude difference between the fair value of assets and liabilities acquired and the purchase price of the Integrys acquisition. |
| (h) | Adjustment to reflect a benefit related to favorable settlements in 2014 of certain income tax positions on Constellation’s pre-acquisition 2009-2012 tax returns. |
| (i) | Adjustment to exclude the unrealized gains on NDT fund investments to the extent not offset by contractual accounting as described in the notes to the consolidated financial statements. |
| (j) | Adjustment to exclude the non-cash impact of the reassessment of state deferred income taxes, primarily as a result of changes in forecasted apportionment. |
| (k) | Adjustments to account for the CENG interest not owned by Generation, where applicable. |
| (l) | Adjustment to exclude the 2014 increase in Generation’s asset retirement obligation, primarily for asbestos at retired fossil power plants. |
| (m) | Adjustment to reflect estimated liabilities pursuant to the Midwest Generation bankruptcy. |
8
EXELON CORPORATION
Reconciliation of Adjusted (non-GAAP) Operating Earnings to GAAP Consolidated Statements of Operations
(unaudited)
(in millions, except per share data)
| Twelve Months Ended December 31, 2014 | Twelve Months Ended December 31, 2013 | |||||||||||||||||||||||||||||||
| GAAP (a) | Adjustments | Adjusted Non-GAAP |
GAAP (a) | Adjustments | Adjusted Non-GAAP |
|||||||||||||||||||||||||||
| Operating revenues |
$ | 27,429 | $ | 460 | (b | ),(c),(d) | $ | 27,889 | $ | 24,888 | $ | 541 | (b | ),(c) | $ | 25,429 | ||||||||||||||||
| Operating expenses |
||||||||||||||||||||||||||||||||
| Purchased power and fuel |
13,003 | (251 | ) | (b | ),(c) | 12,752 | 10,724 | 563 | (b | ),(c) | 11,287 | |||||||||||||||||||||
| Operating and maintenance |
8,568 | (809 | ) | (d | ),(e),(f),(g) | 7,759 | 7,270 | (312 | ) | (d | ),(e),(f),(g),(n) | 6,958 | ||||||||||||||||||||
| Depreciation and amortization |
2,314 | — | 2,314 | 2,153 | (5 | ) | (d | ),(g) | 2,148 | |||||||||||||||||||||||
| Taxes other than income |
1,154 | — | 1,154 | 1,095 | — | 1,095 | ||||||||||||||||||||||||||
|
|
|
|
|
|
|
|
|
|
|
|
|
|||||||||||||||||||||
| Total operating expenses |
25,039 | (1,060 | ) | 23,979 | 21,242 | 246 | 21,488 | |||||||||||||||||||||||||
| Equity in earnings (loss) of unconsolidated affiliates |
(20 | ) | 12 | (b | ),(c) | (8 | ) | 10 | 92 | (c | ),(d) | 102 | ||||||||||||||||||||
| Gain on sales of assets |
437 | (411 | ) | (g | ) | 26 | 13 | (9 | ) | (g | ) | 4 | ||||||||||||||||||||
| Gain on consolidation and acquisition of businesses |
289 | (289 | ) | (h | ),(i) | — | — | — | — | |||||||||||||||||||||||
|
|
|
|
|
|
|
|
|
|
|
|
|
|||||||||||||||||||||
| Operating income |
3,096 | 832 | 3,928 | 3,669 | 378 | 4,047 | ||||||||||||||||||||||||||
|
|
|
|
|
|
|
|
|
|
|
|
|
|||||||||||||||||||||
| Other income and (deductions) |
||||||||||||||||||||||||||||||||
| Interest expense |
(1,065 | ) | 134 | (b | ),(d) | (931 | ) | (1,356 | ) | 370 | (d | ),(e),(o),(p) | (986 | ) | ||||||||||||||||||
| Other, net |
455 | (193 | ) | (j | ),(k) | 262 | 460 | (226 | ) | (d | ),(j),(o) | 234 | ||||||||||||||||||||
|
|
|
|
|
|
|
|
|
|
|
|
|
|||||||||||||||||||||
| Total other income and (deductions) |
(610 | ) | (59 | ) | (669 | ) | (896 | ) | 144 | (752 | ) | |||||||||||||||||||||
|
|
|
|
|
|
|
|
|
|
|
|
|
|||||||||||||||||||||
| Income before income taxes |
2,486 | 773 | 3,259 | 2,773 | 522 | 3,295 | ||||||||||||||||||||||||||
| (b | ),(c),(d), | |||||||||||||||||||||||||||||||
| (b | ),(c),(d), | (e | ),(f),(g), | |||||||||||||||||||||||||||||
| (e | ),(f),(g), | (j | ),(l),(n), | |||||||||||||||||||||||||||||
| Income taxes |
666 | 391 | (h | ),(j),(k),(l) | 1,057 | 1,044 | 88 | (o | ),(p) | 1,132 | ||||||||||||||||||||||
|
|
|
|
|
|
|
|
|
|
|
|
|
|||||||||||||||||||||
| Net income |
1,820 | 382 | 2,202 | 1,729 | 434 | 2,163 | ||||||||||||||||||||||||||
| Net income attributable to noncontrolling interests, preferred security dividends and redemption and preference stock dividends |
197 | (63 | ) | (m | ) | 134 | 10 | 4 | (m | ) | 14 | |||||||||||||||||||||
|
|
|
|
|
|
|
|
|
|
|
|
|
|||||||||||||||||||||
| Net income attributable to common shareholders |
$ | 1,623 | $ | 445 | $ | 2,068 | $ | 1,719 | $ | 430 | $ | 2,149 | ||||||||||||||||||||
|
|
|
|
|
|
|
|
|
|
|
|
|
|||||||||||||||||||||
| Effective tax rate |
26.8 | % | 32.4 | % | 37.6 | % | 34.4 | % | ||||||||||||||||||||||||
| Earnings per average common share |
||||||||||||||||||||||||||||||||
| Basic |
$ | 1.89 | $ | 0.51 | $ | 2.40 | $ | 2.01 | $ | 0.50 | $ | 2.51 | ||||||||||||||||||||
| Diluted |
$ | 1.88 | $ | 0.51 | $ | 2.39 | $ | 2.00 | $ | 0.50 | $ | 2.50 | ||||||||||||||||||||
|
|
|
|
|
|
|
|
|
|
|
|
|
|||||||||||||||||||||
| Average common shares outstanding |
||||||||||||||||||||||||||||||||
| Basic |
860 | 860 | 856 | 856 | ||||||||||||||||||||||||||||
| Diluted |
864 | 864 | 860 | 860 | ||||||||||||||||||||||||||||
|
Effect of adjustments on earnings per average diluted common share recorded in accordance with GAAP:
|
| |||||||||||||||||||||||||||||||
| Mark-to-market impact of economic hedging activities (b) |
0.42 | (0.35 | ) | |||||||||||||||||||||||||||||
| Amortization of commodity contract intangibles (c) |
0.07 | 0.41 | ||||||||||||||||||||||||||||||
| Merger and integration costs (d) |
0.21 | 0.08 | ||||||||||||||||||||||||||||||
| Long-lived asset impairment (e) |
0.50 | 0.14 | ||||||||||||||||||||||||||||||
| Asset retirement obligation (f) |
(0.02 | ) | 0.01 | |||||||||||||||||||||||||||||
| Plant retirements and divestitures (g) |
(0.28 | ) | (0.02 | ) | ||||||||||||||||||||||||||||
| Gain on CENG integration (h) |
(0.18 | ) | — | |||||||||||||||||||||||||||||
| Bargain-purchase gain (i) |
(0.03 | ) | — | |||||||||||||||||||||||||||||
| Unrealized gains related to NDT fund investments (j) |
(0.10 | ) | (0.09 | ) | ||||||||||||||||||||||||||||
| Tax settlement (k) |
(0.12 | ) | — | |||||||||||||||||||||||||||||
| Reassessment of state deferred income taxes (l) |
(0.03 | ) | — | |||||||||||||||||||||||||||||
| Non-controlling interest (m) |
0.07 | — | ||||||||||||||||||||||||||||||
| Midwest Generation bankruptcy charges (n) |
— | 0.02 | ||||||||||||||||||||||||||||||
| Amortization of the fair value of certain debt (o) |
— | (0.01 | ) | |||||||||||||||||||||||||||||
| Remeasurement of like-kind exchange tax position (p) |
— | 0.31 | ||||||||||||||||||||||||||||||
|
|
|
|
|
|||||||||||||||||||||||||||||
| Total adjustments |
$ | 0.51 | $ | 0.50 | ||||||||||||||||||||||||||||
|
|
|
|
|
|||||||||||||||||||||||||||||
Note: On April 1, 2014, Generation assumed operational control of Constellation Energy Nuclear Group’s (“CENG”) nuclear fleet. As a result, the 2014 financial results include CENG’s results of operations on a fully consolidated basis from April 1, 2014 through December 31, 2014.
| (a) | Results reported in accordance with GAAP. |
| (b) | Adjustment to exclude the mark-to-market impact of Exelon’s economic hedging activities, net of intercompany eliminations. |
| (c) | Adjustment to exclude the non-cash amortization of intangible assets, net, related to commodity contracts recorded at fair value at the 2012 Constellation merger date and the 2014 CENG integration date. |
| (d) | Adjustment to exclude certain costs associated with mergers and acquisitions, including professional fees, employee-related expenses, integration activities, upfront credit facilities, merger commitments, and certain pre-acquisition contingencies, if and when applicable to the Constellation merger in 2013 and the Constellation merger, CENG integration, acquisition of Integrys and pending PHI acquisition in 2014. |
| (e) | Adjustment to exclude a 2014 charge to earnings primarily related to the impairment of wind generating assets, generating assets held for sale, and certain upstream assets, and a 2013 charge to earnings primarily related to the cancellation of previously capitalized nuclear uprate projects and impairment of certain wind generating assets. |
| (f) | Adjustment to exclude the 2014 decrease in Generation’s nuclear decommissioning obligation and the 2013 increase in asset retirement obligation for asbestos at retired fossil power plants. |
| (g) | Adjustment to exclude the impacts associated with the sales of Generation’s ownership interests in Safe Harbor Water Power Corporation and the Fore River and West Valley generating stations in 2014, and the sale or retirement of generating stations in 2013. |
| (h) | Adjustment to exclude the gain recorded upon consolidation of CENG resulting from the difference in the fair value of CENG’s net assets and the equity method investment previously recorded on Generation’s and Exelon’s books and the settlement of pre-existing commitments between Generation and CENG. |
| (i) | Adjustment to exclude difference between the fair value of assets and liabilities acquired and the purchase price of the Integrys acquisition. |
| (j) | Adjustment to exclude the unrealized gains on NDT fund investments to the extent not offset by contractual accounting as described in the notes to the consolidated financial statements. |
| (k) | Adjustment to reflect a benefit related to favorable settlements in 2014 of certain income tax positions on Constellation’s pre-acquisition 2009-2012 tax returns. |
| (l) | Adjustment to exclude the non-cash impact of the reassessment of state deferred income taxes, primarily as a result of changes in forecasted apportionment. |
| (m) | Adjustment to account for the CENG interest not owned by Generation, where applicable. |
| (n) | Adjustment to reflect estimated liabilities pursuant to the Midwest Generation bankruptcy. |
| (o) | Adjustment to exclude the non-cash amortization of certain debt recorded at fair value at the Constellation merger date, which was retired in the second quarter of 2013. |
| (p) | Adjustment to exclude a non-cash charge to earnings resulting from the first quarter 2013 remeasurement of a like-kind exchange tax position taken on ComEd’s 1999 sale of fossil generating assets. |
9
EXELON CORPORATION
Reconciliation of Adjusted (non-GAAP) Operating
Earnings to GAAP Earnings (in millions)
Three Months Ended December 31, 2014 and 2013
(unaudited)
| Exelon Earnings per Diluted Share |
Generation | ComEd | PECO | BGE | Other (a) | Exelon | ||||||||||||||||||||||||||
| 2013 GAAP Earnings (Loss) |
$ | 0.58 | $ | 269 | $ | 109 | $ | 102 | $ | 47 | $ | (32 | ) | $ | 495 | |||||||||||||||||
| 2013 Adjusted (non-GAAP) Operating Earnings (Loss) Adjustments: |
||||||||||||||||||||||||||||||||
| Mark-to-Market Impact of Economic Hedging Activities |
(0.16 | ) | (143 | ) | — | — | — | — | (143 | ) | ||||||||||||||||||||||
| Unrealized Gains Related to NDT Fund Investments (1) |
(0.05 | ) | (40 | ) | — | — | — | — | (40 | ) | ||||||||||||||||||||||
| Plant Retirements and Divestitures (2) |
— | (1 | ) | — | — | — | — | (1 | ) | |||||||||||||||||||||||
| Merger and Integration Costs (3) |
0.02 | 19 | — | 1 | 1 | — | 21 | |||||||||||||||||||||||||
| Reassessment of State Deferred Income Taxes (4) |
— | (12 | ) | — | — | — | 16 | 4 | ||||||||||||||||||||||||
| Amortization of Commodity Contract Intangibles (5) |
0.09 | 75 | — | — | — | — | 75 | |||||||||||||||||||||||||
| Asset Retirement Obligation (6) |
— | 1 | — | — | — | — | 1 | |||||||||||||||||||||||||
| Midwest Generation Bankruptcy Charges (7) |
0.02 | 16 | — | — | — | — | 16 | |||||||||||||||||||||||||
| Long-Lived Asset Impairment (8) |
— | (1 | ) | — | — | — | — | (1 | ) | |||||||||||||||||||||||
|
|
|
|
|
|
|
|
|
|
|
|
|
|
|
|||||||||||||||||||
| 2013 Adjusted (non-GAAP) Operating Earnings (Loss) |
0.50 | 183 | 109 | 103 | 48 | (16 | ) | 427 | ||||||||||||||||||||||||
| Year Over Year Effects on Earnings: |
||||||||||||||||||||||||||||||||
| Generation Energy Margins, Excluding Mark-to-Market: |
||||||||||||||||||||||||||||||||
| Nuclear Volume (12) |
0.21 | 184 | — | — | — | — | 184 | |||||||||||||||||||||||||
| Nuclear Fuel Cost (13) |
(0.01 | ) | (11 | ) | — | — | — | — | (11 | ) | ||||||||||||||||||||||
| Capacity Pricing (14) |
0.03 | 27 | — | — | — | — | 27 | |||||||||||||||||||||||||
| Market and Portfolio Conditions (15) |
0.03 | 27 | — | — | — | — | 27 | |||||||||||||||||||||||||
| ComEd, PECO and BGE Margins: |
||||||||||||||||||||||||||||||||
| Weather |
(0.01 | ) | — | (3 | ) | (6 | ) | — | (b | ) | — | (9 | ) | |||||||||||||||||||
| Load |
(0.01 | ) | — | (4 | ) | (2 | ) | — | (b | ) | — | (6 | ) | |||||||||||||||||||
| Other Energy Delivery (16) |
0.01 | — | 2 | 4 | 4 | 1 | 11 | |||||||||||||||||||||||||
| Operating and Maintenance Expense: |
||||||||||||||||||||||||||||||||
| Labor, Contracting and Materials (17) |
(0.08 | ) | (57 | ) | (15 | ) | (3 | ) | 5 | — | (70 | ) | ||||||||||||||||||||
| Planned Nuclear Refueling Outages (18) |
0.02 | 20 | — | — | — | — | 20 | |||||||||||||||||||||||||
| Pension and Non-Pension Postretirement Benefits (19) |
0.04 | 16 | 15 | 1 | (1 | ) | 3 | 34 | ||||||||||||||||||||||||
| Other Operating and Maintenance (20) |
(0.11 | ) | (69 | ) | (26 | ) | (1 | ) | 1 | (1 | ) | (96 | ) | |||||||||||||||||||
| Depreciation and Amortization Expense (21) |
(0.03 | ) | (23 | ) | 1 | (1 | ) | (1 | ) | — | (24 | ) | ||||||||||||||||||||
| Equity in Earnings of Unconsolidated Affiliates (22) |
(0.02 | ) | (21 | ) | — | — | — | — | (21 | ) | ||||||||||||||||||||||
| Income Taxes (23) |
(0.08 | ) | (37 | ) | (3 | ) | 2 | (4 | ) | (26 | ) | (68 | ) | |||||||||||||||||||
| Interest Expense, Net |
— | 3 | (3 | ) | 1 | 2 | (1 | ) | 2 | |||||||||||||||||||||||
| CENG Non-Controlling Interest (24) |
(0.03 | ) | (29 | ) | — | — | — | — | (29 | ) | ||||||||||||||||||||||
| Other (25) |
0.02 | 18 | 2 | 1 | (1 | ) | 3 | 23 | ||||||||||||||||||||||||
|
|
|
|
|
|
|
|
|
|
|
|
|
|
|
|||||||||||||||||||
| 2014 Adjusted (non-GAAP) Operating Earnings (Loss) |
0.48 | 231 | 75 | 99 | 53 | (37 | ) | 421 | ||||||||||||||||||||||||
| 2014 Adjusted (non-GAAP) Operating Earnings (Loss) Adjustments: |
||||||||||||||||||||||||||||||||
| Mark-to-Market Impact of Economic Hedging Activities |
(0.08 | ) | (71 | ) | — | — | — | 1 | (70 | ) | ||||||||||||||||||||||
| Unrealized Gains Related to NDT Fund Investments (1) |
0.03 | 24 | — | — | — | — | 24 | |||||||||||||||||||||||||
| Plant Retirements and Divestitures (2) |
0.06 | 48 | — | — | — | — | 48 | |||||||||||||||||||||||||
| Merger and Integration Costs (3) |
(0.09 | ) | (9 | ) | (2 | ) | (1 | ) | (1 | ) | (67 | ) | (80 | ) | ||||||||||||||||||
| Reassessment of State Deferred Income Taxes (4) |
0.03 | 39 | — | — | (12 | ) | 27 | |||||||||||||||||||||||||
| Amortization of Commodity Contract Intangibles (5) |
(0.03 | ) | (22 | ) | — | — | — | — | (22 | ) | ||||||||||||||||||||||
| Long-Lived Asset Impairment (8) |
(0.39 | ) | (338 | ) | — | — | — | 1 | (337 | ) | ||||||||||||||||||||||
| Bargain-Purchase Gain (9) |
0.03 | 28 | — | — | — | — | 28 | |||||||||||||||||||||||||
| Tax Settlements (10) |
0.01 | 5 | — | — | — | — | 5 | |||||||||||||||||||||||||
| CENG Non-Controlling Interest (11) |
(0.03 | ) | (26 | ) | — | — | — | — | (26 | ) | ||||||||||||||||||||||
|
|
|
|
|
|
|
|
|
|
|
|
|
|
|
|||||||||||||||||||
| 2014 GAAP Earnings (Loss) |
$ | 0.02 | $ | (91 | ) | $ | 73 | $ | 98 | $ | 52 | $ | (114 | ) | $ | 18 | ||||||||||||||||
|
|
|
|
|
|
|
|
|
|
|
|
|
|
|
|||||||||||||||||||
Notes:
| • | Beginning on April 1, 2014, each line item above includes 100% of CENG’s results of operations. Prior to April 1, 2014, CENG’s net results were included in equity in earnings of unconsolidated affiliates. Therefore, the results of operations from 2014 and 2013 for each line item above are not comparable for Generation and Exelon. The explanations below identify any other significant or unusual items affecting the results of operations. |
| (a) | Other primarily includes eliminating and consolidating adjustments, Exelon’s corporate operations, shared service entities and other financing and investment activities. |
| (b) | As approved by the Maryland PSC, BGE records a monthly adjustment to rates for residential and the majority of its commercial and industrial customers to eliminate the effect of abnormal weather and usage patterns per customer on distribution volumes. |
| (1) | Reflects the impact of unrealized gains on NDT fund investments to the extent not offset by contractual accounting as described in the notes to the consolidated financial statements. |
| (2) | Reflects the gains associated with the sales of Generation’s ownership interests in Fore River and West Valley Generating Stations. |
| (3) | Reflects certain costs associated with mergers and acquisitions, including professional fees, employee-related expenses, integration activities, upfront credit facilities, merger commitments, and certain pre-acquisition contingencies, if and when applicable, related to the Constellation merger in 2013 and the Constellation merger, CENG integration, acquisition of Integrys and pending PHI acquisition in 2014. |
| (4) | Reflects the non-cash impacts of the reassessment of state deferred income taxes, primarily as a result of changes in forecasted apportionment. |
| (5) | Represents the non-cash amortization of intangible assets, net, related to commodity contracts recorded at fair value at the 2012 Constellation merger date and the 2014 CENG integration date. |
| (6) | Reflects an increase in Generation’s asset retirement obligation primarily for asbestos at retired fossil power plants. |
| (7) | Reflects estimated liabilities pursuant to the Midwest Generation bankruptcy. |
| (8) | In 2014, reflects charges to earnings related to the impairments of certain generating assets which were held for sale and certain upstream assets. |
| (9) | Represents the excess of the fair value of assets and liabilities acquired over the purchase price related to the Integrys acquisition. |
| (10) | Reflects a benefit related to the favorable settlement in 2014 of certain income tax positions on Constellation’s 2009-2012 tax returns. |
| (11) | Represents Generation’s non-controlling interest related to CENG exclusion items, including the non-cash amortization of commodity contracts recorded at fair value during the integration date, costs incurred associated with the integration, and the impact of unrealized gains and losses on NDT fund investments. |
| (12) | Primarily reflects the inclusion of CENG’s results for the fourth quarter of 2014. |
| (13) | Primarily reflects the inclusion of CENG’s results for the fourth quarter of 2014, partially offset by the cancellation of the DOE spent nuclear fuel disposal fee. |
| (14) | Primarily reflects the inclusion of CENG’s capacity credits within the New York and PJM markets, with increased capacity prices for the Midwest market, mostly offset by a decrease in capacity prices for the Mid-Atlantic market. |
| (15) | Primarily reflects the impact of favorable portfolio management optimization activities in the Mid-Atlantic, New England, and South regions as well as the Integrys acquisition, partially offset by lower realized energy prices related to Exelon’s ratable hedging strategy and loss on gas inventory from lower of cost or market adjustments. |
| (16) | For ComEd primarily reflects higher transmission revenue due to increased capital investment, as well as increased cost recovery associated with energy efficiency programs and uncollectible accounts expense (both offset below in operating and maintenance expense), primarily offset by lower distribution formula rate revenue due to the impacts of bonus depreciation and decreased pension and non-pension postretirement expense (offset below). For PECO, primarily reflects increased recovery from regulatory programs (offset below primarily in operating and maintenance expense and depreciation and amortization expense). For BGE, reflects increased distribution revenue pursuant to electric and natural gas distribution rate case orders issued by the Maryland PSC in December 2013 and 2014. |
| (17) | Primarily reflects the inclusion of CENG’s results for the fourth quarter of 2014 at Generation, increased contracting costs related to EIMA and other preventative and corrective maintenance projects at ComEd, decreased contracting costs on maintenance related activities at BGE, and inflation across all companies. |
| (18) | Primarily reflects the impact of decreased operating and maintenance costs associated with nuclear refueling outages in 2014, excluding Salem. |
| (19) | Primarily reflects cost savings from plan design changes for certain OPEB plans and the favorable impact of higher actuarially assumed pension and OPEB discount rates for 2014, partially offset by the inclusion of CENG’s results for the fourth quarter of 2014 at Generation. |
| (20) | At Generation, primarily relates to the inclusion of CENG’s results for the fourth quarter of 2014 and an increase in nuclear refueling outage days at the Salem plant. At ComEd, primarily relates to increased spend on energy efficiency programs and increased uncollectible accounts expense (both offset above in other energy delivery). |
| (21) | Primarily reflects the inclusion of CENG’s results for the fourth quarter of 2014 at Generation. |
| (22) | Reflects the favorable fourth quarter 2013 non-cash amortization of the fair value basis difference recorded at the Constellation merger date, partially offset by equity in losses in CENG in 2013. CENG’s operating results are fully consolidated in 2014 and, as a result, are not reflected as equity method earnings in 2014. |
| (23) | At Generation, primarily reflects the unfavorable 2014 bonus depreciation extension impact on the domestic production activities deduction and a reduction in investment tax credit benefits. |
| (24) | Reflects Generation’s non-controlling interest related to the net impact of CENG’s operating revenues and expenses. |
| (25) | At Generation, primarily reflects the inclusion of CENG for the fourth quarter of 2014 and higher realized NDT fund gains. |
10
EXELON CORPORATION
Reconciliation of Adjusted (non-GAAP) Operating
Earnings to GAAP Earnings (in millions)
Twelve Months Ended December 31, 2014 and 2013
(unaudited)
| Exelon Earnings per Diluted Share |
Generation | ComEd | PECO | BGE | Other (a) | Exelon | ||||||||||||||||||||||||||
| 2013 GAAP Earnings (Loss) |
$ | 2.00 | $ | 1,070 | $ | 249 | $ | 388 | $ | 197 | $ | (185 | ) | $ | 1,719 | |||||||||||||||||
| 2013 Adjusted (non-GAAP) Operating Earnings (Loss) Adjustments: |
||||||||||||||||||||||||||||||||
| Mark-to-Market Impact of Economic Hedging Activities |
(0.35 | ) | (309 | ) | — | — | — | (1 | ) | (310 | ) | |||||||||||||||||||||
| Unrealized Gains Related to NDT Fund Investments (1) |
(0.09 | ) | (78 | ) | — | — | — | — | (78 | ) | ||||||||||||||||||||||
| Plant Retirements and Divestitures (2) |
(0.02 | ) | (13 | ) | — | — | — | — | (13 | ) | ||||||||||||||||||||||
| Asset Retirement Obligation (3) |
0.01 | 7 | — | — | — | — | 7 | |||||||||||||||||||||||||
| Merger and Integration Costs (4) |
0.08 | 80 | 2 | 5 | (2 | ) | 2 | 87 | ||||||||||||||||||||||||
| Amortization of Commodity Contract Intangibles (5) |
0.41 | 347 | — | — | — | — | 347 | |||||||||||||||||||||||||
| Amortization of the Fair Value of Certain Debt (6) |
(0.01 | ) | (7 | ) | — | — | — | — | (7 | ) | ||||||||||||||||||||||
| Reassessment of State Deferred Income Taxes (7) |
— | (12 | ) | — | — | — | 16 | 4 | ||||||||||||||||||||||||
| Midwest Generation Bankruptcy Charges (8) |
0.02 | 16 | — | — | — | — | 16 | |||||||||||||||||||||||||
| Remeasurement of Like-Kind Exchange Tax Position (9) |
0.31 | — | 170 | — | — | 97 | 267 | |||||||||||||||||||||||||
| Long-Lived Asset Impairment (10) |
0.14 | 101 | — | — | — | 9 | 110 | |||||||||||||||||||||||||
|
|
|
|
|
|
|
|
|
|
|
|
|
|
|
|||||||||||||||||||
| 2013 Adjusted (non-GAAP) Operating Earnings (Loss) |
2.50 | 1,202 | 421 | 393 | 195 | (62 | ) | 2,149 | ||||||||||||||||||||||||
| Year Over Year Effects on Earnings: |
||||||||||||||||||||||||||||||||
| Generation Energy Margins, Excluding Mark-to-Market: |
||||||||||||||||||||||||||||||||
| Nuclear Volume (15) |
0.58 | 505 | — | — | — | — | 505 | |||||||||||||||||||||||||
| Nuclear Fuel Costs (16) |
(0.05 | ) | (42 | ) | — | — | — | — | (42 | ) | ||||||||||||||||||||||
| Capacity Pricing (17) |
0.24 | 209 | — | — | — | — | 209 | |||||||||||||||||||||||||
| Market and Portfolio Conditions (18) |
(0.24 | ) | (204 | ) | — | — | — | — | (204 | ) | ||||||||||||||||||||||
| ComEd, PECO and BGE Margins: |
||||||||||||||||||||||||||||||||
| Weather |
(0.01 | ) | — | (10 | ) | (1 | ) | — | (b | ) | — | (11 | ) | |||||||||||||||||||
| Load |
— | — | — | 4 | — | (b | ) | — | 4 | |||||||||||||||||||||||
| Other Energy Delivery (19) |
0.17 | — | 68 | 16 | 62 | (1 | ) | 145 | ||||||||||||||||||||||||
| Operating and Maintenance Expense: |
||||||||||||||||||||||||||||||||
| Labor, Contracting and Materials (20) |
(0.32 | ) | (221 | ) | (34 | ) | (7 | ) | (13 | ) | — | (275 | ) | |||||||||||||||||||
| Planned Nuclear Refueling Outages (21) |
(0.03 | ) | (23 | ) | — | — | — | — | (23 | ) | ||||||||||||||||||||||
| Pension and Non-Pension Postretirement Benefits (22) |
0.13 | 50 | 51 | 3 | (5 | ) | 9 | 108 | ||||||||||||||||||||||||
| Other Operating and Maintenance (23) |
(0.35 | ) | (152 | ) | (56 | ) | (71 | ) | (33 | ) | 7 | (305 | ) | |||||||||||||||||||
| Depreciation and Amortization Expense (24) |
(0.12 | ) | (71 | ) | (11 | ) | (5 | ) | (14 | ) | (1 | ) | (102 | ) | ||||||||||||||||||
| Equity in Earnings of Unconsolidated Affiliates (25) |
(0.08 | ) | (68 | ) | — | — | — | — | (68 | ) | ||||||||||||||||||||||
| Income Taxes (26) |
0.02 | 17 | — | 14 | 2 | (19 | ) | 14 | ||||||||||||||||||||||||
| Interest Expense, Net (27) |
0.03 | 18 | (18 | ) | 1 | 8 | 15 | 24 | ||||||||||||||||||||||||
| CENG Non-Controlling Interest (28) |
(0.09 | ) | (79 | ) | — | — | — | — | (79 | ) | ||||||||||||||||||||||
| Other (29) |
0.02 | 14 | (1 | ) | 6 | (3 | ) | 3 | 19 | |||||||||||||||||||||||
| Share Differential |
(0.01 | ) | — | — | — | — | — | — | ||||||||||||||||||||||||
|
|
|
|
|
|
|
|
|
|
|
|
|
|
|
|||||||||||||||||||
| 2014 Adjusted (non-GAAP) Operating Earnings (Loss) |
2.39 | 1,155 | 410 | 353 | 199 | (49 | ) | 2,068 | ||||||||||||||||||||||||
| 2014 Adjusted (non-GAAP) Operating Earnings (Loss) Adjustments: |
||||||||||||||||||||||||||||||||
| Mark-to-Market Impact of Economic Hedging Activities |
(0.42 | ) | (365 | ) | — | — | — | 2 | (363 | ) | ||||||||||||||||||||||
| Unrealized Gains Related to NDT Fund Investments (1) |
0.10 | 86 | — | — | — | — | 86 | |||||||||||||||||||||||||
| Plant Retirements and Divestitures (2) |
0.28 | 246 | — | — | — | (1 | ) | 245 | ||||||||||||||||||||||||
| Asset Retirement Obligation (3) |
0.02 | 13 | — | — | — | — | 13 | |||||||||||||||||||||||||
| Merger and Integration Costs (4) |
(0.21 | ) | (85 | ) | (2 | ) | (1 | ) | (1 | ) | (96 | ) | (185 | ) | ||||||||||||||||||
| Amortization of Commodity Contract Intangibles (5) |
(0.07 | ) | (64 | ) | — | — | — | — | (64 | ) | ||||||||||||||||||||||
| Reassessment of State Deferred Income Taxes (7) |
0.03 | 39 | — | — | — | (12 | ) | 27 | ||||||||||||||||||||||||
| Long-Lived Asset Impairment (10) |
(0.50 | ) | (421 | ) | — | — | — | (14 | ) | (435 | ) | |||||||||||||||||||||
| Bargain-Purchase Gain (11) |
0.03 | 28 | — | — | — | — | 28 | |||||||||||||||||||||||||
| Gain on CENG Integration (12) |
0.18 | 159 | — | — | — | — | 159 | |||||||||||||||||||||||||
| Tax Settlements (13) |
0.12 | 106 | — | — | — | — | 106 | |||||||||||||||||||||||||
| CENG Non-Controlling Interest (14) |
(0.07 | ) | (62 | ) | — | — | — | — | (62 | ) | ||||||||||||||||||||||
|
|
|
|
|
|
|
|
|
|
|
|
|
|
|
|||||||||||||||||||
| 2014 GAAP Earnings (Loss) |
$ | 1.88 | $ | 835 | $ | 408 | $ | 352 | $ | 198 | $ | (170 | ) | $ | 1,623 | |||||||||||||||||
|
|
|
|
|
|
|
|
|
|
|
|
|
|
|
|||||||||||||||||||
Notes:
| • | Beginning on April 1, 2014, each line item above includes 100% of CENG’s results of operations. Prior to April 1, 2014, CENG’s net results were included in equity in earnings of unconsolidated affiliates. Therefore, the results of operations from 2014 and 2013 for each line item above are not comparable for Generation and Exelon. The explanations below identify any other significant or unusual items affecting the results of operations. |
| (a) | Other primarily includes eliminating and consolidating adjustments, Exelon’s corporate operations, shared service entities and other financing and investment activities. |
| (b) | As approved by the Maryland PSC, BGE records a monthly adjustment to rates for residential and the majority of its commercial and industrial customers to eliminate the effect of abnormal weather and usage patterns per customer on distribution volumes. |
| (1) | Reflects the impact of unrealized gains on NDT fund investments to the extent not offset by contractual accounting as described in the notes to the consolidated financial statements. |
| (2) | Primarily reflects the gains associated with the sales of Generation’s ownership interests in generating stations, including in 2014, the gains associated with the sales of the Fore River and West Valley generating stations and Generation’s equity interest in Safe Harbor. |
| (3) | In 2013, primarily reflects an increase in Generation’s asset retirement obligation for asbestos at retired fossil power plants. In 2014, primarily reflects a decrease in Generation’s nuclear decommissioning obligation. |
| (4) | Reflects certain costs associated with mergers and acquisitions, including professional fees, employee-related expenses, integration activities, upfront credit facilities, merger commitments, and certain pre-acquisition contingencies, if and when applicable to the Constellation merger in 2013 and the Constellation merger, CENG integration, acquisition of Integrys and pending PHI acquisition in 2014. |
| (5) | Represents the non-cash amortization of intangible assets, net, related to commodity contracts recorded at fair value at the 2012 Constellation merger date and the 2014 CENG integration date. |
| (6) | Represents the non-cash amortization of certain debt recorded at fair value at the Constellation merger date, which was retired in the second quarter of 2013. |
| (7) | Reflects the non-cash impacts of the remeasurement of state deferred income taxes, primarily as a result of changes in forecasted apportionment. |
| (8) | Reflects estimated liabilities pursuant to the Midwest Generation bankruptcy. |
| (9) | Represents a non-cash charge to earnings resulting from the first quarter 2013 remeasurement of a like-kind exchange tax position taken on ComEd’s 1999 sale of fossil generating assets. |
| (10) | In 2013, represents a charge to earnings primarily related to the cancellation of previously capitalized nuclear uprate projects and the impairment of wind generating assets. In 2014, reflects charges to earnings related to the impairment of generating assets which were held for sale, certain upstream assets, and wind generating assets. |
| (11) | Represents the excess of the fair value of assets and liabilities acquired and the purchase price related to the Integrys acquisition. |
| (12) | Represents the gain recorded upon consolidation of CENG resulting from the difference in the fair value of CENG’s net assets as of April 1, 2014, and the equity method investment previously recorded on Generation’s and Exelon’s books and the settlement of pre-existing transactions between Generation and CENG. |
| (13) | Reflects a benefit related to the favorable settlement in 2014 of certain income tax positions on Constellation’s 2009-2012 tax returns. |
| (14) | Represents Generation’s non-controlling interest related to CENG exclusion items, including the non-cash amortization of commodity contracts recorded at fair value during the integration date, costs incurred associated with the integration, and the impact of unrealized gains and losses on NDT fund investments. |
| (15) | Primarily reflects the inclusion of CENG’s results beginning April 1, 2014, partially offset by increased nuclear outage days in 2014. |
| (16) | Primarily reflects the inclusion of CENG’s results beginning April 1, 2014, partially offset by the cancellation of the DOE spent nuclear fuel disposal fee. |
| (17) | Primarily reflects the impact of increased capacity prices related to the Reliability Pricing Model (RPM) for the PJM Interconnection, LLC (PJM) market in addition to the inclusion of CENG’s capacity credits within the New York and PJM markets beginning April 1, 2014. |
| (18) | Primarily reflects the unfavorable impacts related to the extreme cold weather in the first quarter of 2014 due to higher procurement costs for replacement power, lower realized energy prices related to Exelon’s ratable hedging strategy, and loss on gas inventory from lower of cost or market adjustments, partially offset within the New England and South regions as a result of favorable portfolio management optimization activities. |
| (19) | For ComEd, primarily reflects higher transmission revenue, as well as increased cost recovery associated with energy efficiency programs and uncollectible accounts expense (both offset below in other operating and maintenance expense), with lower distribution formula rate revenue due to decreased pension and non-pension postretirement expense (offset below), partially offset by increased capital investment. For PECO, primarily reflects increased recovery from regulatory programs (offset below primarily in operating and maintenance expense and depreciation and amortization expense). For BGE, primarily reflects increased distribution revenue pursuant to increased rates effective in both December of 2013 and 2014, increased cost recovery for energy efficiency and demand response programs (offset below primarily in depreciation and amortization expense), and increased transmission revenue pursuant to increased rates effective June 2014. |
| (20) | Primarily reflects the inclusion of CENG’s results beginning April 1, 2014 at Generation, increased contracting costs associated with EIMA Smart Meter Project assistance at ComEd, increased maintenance activities at BGE, and inflation across all operating companies, partially offset at Generation by merger synergies realized in 2014. |
| (21) | Primarily reflects of the inclusion of CENG’s results beginning April 1, 2014, partially offset by the impact of decreased nuclear refueling outage days in 2014, excluding Salem. |
| (22) | Primarily reflects cost savings from plan design changes for certain OPEB plans and the favorable impact of higher actuarially assumed pension and OPEB discount rates for 2014, partially offset by the inclusion of CENG’s results beginning April 1, 2014. |
| (23) | For Generation, primarily reflects the inclusion of CENG’s results beginning April 1, 2014, an increase in the reserve for future asbestos-related bodily injury claims, an increase in nuclear decommissioning obligation expense, and increased nuclear refueling outage days at the Salem plant in 2014. For ComEd, primarily relates to increased spend on energy efficiency programs and increased uncollectible accounts expense (both offset above in other energy and delivery revenue). For PECO, primarily reflects increased storm costs, including the February 5, 2014 ice storm and July storms, as well as, increased spend on regulatory programs (offset above in other energy delivery). For BGE, primarily reflects increased storm costs and an increase in uncollectible accounts expense. |
| (24) | Primarily reflects the inclusion of CENG’s results beginning April 1, 2014 and increased depreciation expense across the operating companies for ongoing capital expenditures. Also, reflects increased amortization of regulatory assets associated with higher MGP remediation expenditures at ComEd, regulatory programs at PECO (offset above in other energy delivery), and energy efficiency and demand response programs at BGE (primarily offset in other energy delivery). |
| (25) | Reflects the favorable 2013 non-cash amortization of the fair value basis difference recorded at the Constellation merger date, partially offset by equity in losses in CENG in 2013. CENG’s operating results were fully consolidated as of April 1, 2014 and, as a result, are not reflected as equity method earnings from April 1, 2014 to December 31, 2014. |
| (26) | At Generation, primarily reflects an increase in domestic production activities deduction, partially offset by a reduction in investment tax credit benefits. At PECO, primarily reflects an increase in electric tax repairs deduction. |
| (27) | For Generation, primarily reflects a benefit recorded in 2014 related to the favorable settlement of certain income tax positions on Constellation’s 2009-2012 tax returns and an increase in interest income reflecting the inclusion of CENG’s results of operations beginning April 1, 2014. For ComEd, primarily reflects a favorable adjustment recorded in the first quarter of 2013 related to the 1999-2001 IRS settlement. For BGE, primarily reflects the impact of favorable interest rates in 2014. For Corporate, includes the impacts of a 2013 unfavorable franchise tax case settlement. |
| (28) | Reflects Generation’s non-controlling interest related to the net impact of CENG’s operating revenue and expenses. |
| (29) | For Generation, primarily reflects higher realized NDT fund gains, offset by the inclusion of CENG’s results beginning April 1, 2014 and losses on foreign currency exchanges. |
11
EXELON CORPORATION
Reconciliation of Adjusted (non-GAAP) Operating Earnings to
GAAP Consolidated Statements of Operations
(unaudited) (in millions)
| Generation | ||||||||||||||||||||||||||||
| Three Months Ended December 31, 2014 | Three Months Ended December 31, 2013 | |||||||||||||||||||||||||||
| GAAP (a) | Adjustments | Adjusted Non-GAAP |
GAAP (a) | Adjustments | Adjusted Non-GAAP |
|||||||||||||||||||||||
| Operating revenues |
$ | 4,802 | $ | (311 | ) | (b),(c) | $ | 4,491 | $ | 3,773 | $ | 79 | (b),(c) | $ | 3,852 | |||||||||||||
| Operating expenses |
||||||||||||||||||||||||||||
| Purchased power and fuel |
2,853 | (471 | ) | (b),(c) | 2,382 | 1,903 | 208 | (b),(c) | 2,111 | |||||||||||||||||||
| Operating and maintenance |
1,801 | (543 | ) | (d),(e),(f) | 1,258 | 1,156 | (44 | ) | (d),(e),(f), (l),(m) |
1,112 | ||||||||||||||||||
| Depreciation and amortization |
248 | — | 248 | 214 | (2 | ) | (f) | 212 | ||||||||||||||||||||
| Taxes other than income |
115 | — | 115 | 98 | — | 98 | ||||||||||||||||||||||
|
|
|
|
|
|
|
|
|
|
|
|
|
|||||||||||||||||
| Total operating expenses |
5,017 | (1,014 | ) | 4,003 | 3,371 | 162 | 3,533 | |||||||||||||||||||||
| Equity in earnings of unconsolidated affiliates |
— | — | — | 3 | 30 | (c),(d) | 33 | |||||||||||||||||||||
| Gain (loss) on sale of assets |
82 | (83 | ) | (f) | (1 | ) | — | — | — | |||||||||||||||||||
| Gain on acquisition of businesses |
28 | (28 | ) | (g) | — | — | — | — | ||||||||||||||||||||
|
|
|
|
|
|
|
|
|
|
|
|
|
|||||||||||||||||
| Operating income (loss) |
(105 | ) | 592 | 487 | 405 | (53 | ) | 352 | ||||||||||||||||||||
|
|
|
|
|
|
|
|
|
|
|
|
|
|||||||||||||||||
| Other income and (deductions) |
||||||||||||||||||||||||||||
| Interest expense |
(96 | ) | — | (96 | ) | (99 | ) | — | (99 | ) | ||||||||||||||||||
| Other, net |
101 | (41 | ) | (h),(i) | 60 | 138 | (118 | ) | (h) | 20 | ||||||||||||||||||
|
|
|
|
|
|
|
|
|
|
|
|
|
|||||||||||||||||
| Total other income and (deductions) |
5 | (41 | ) | (36 | ) | 39 | (118 | ) | (79 | ) | ||||||||||||||||||
|
|
|
|
|
|
|
|
|
|
|
|
|
|||||||||||||||||
| Income (loss) before income taxes |
(100 | ) | 551 | 451 | 444 | (171 | ) | 273 | ||||||||||||||||||||
| Income taxes |
(83 | ) | 256 | (b),(c),(d), (e),(f),(h), (i),(j) |
173 | 179 | (89 | ) | (b),(c),(d), (e),(f),(h), (j),(l),(m) |
90 | ||||||||||||||||||
|
|
|
|
|
|
|
|
|
|
|
|
|
|||||||||||||||||
| Net income (loss) |
(17 | ) | 295 | 278 | 265 | (82 | ) | 183 | ||||||||||||||||||||
| Net income (loss) attributable to noncontrolling interests |
74 | (27 | ) | (k) | 47 | (4 | ) | 4 | (k) | — | ||||||||||||||||||
|
|
|
|
|
|
|
|
|
|
|
|
|
|||||||||||||||||
| Net income (loss) attributable to membership interest |
$ | (91 | ) | $ | 322 | $ | 231 | $ | 269 | $ | (86 | ) | $ | 183 | ||||||||||||||
|
|
|
|
|
|
|
|
|
|
|
|
|
|||||||||||||||||
| Twelve Months Ended December 31, 2014 | Twelve Months Ended December 31, 2013 | |||||||||||||||||||||||||||
| GAAP (a) | Adjustments | Adjusted Non-GAAP |
GAAP (a) | Adjustments | Adjusted Non-GAAP |
|||||||||||||||||||||||
| Operating revenues |
$ | 17,393 | $ | 460 | (b),(c),(d) | $ | 17,853 | $ | 15,630 | $ | 547 | (b),(c) | $ | 16,177 | ||||||||||||||
| Operating expenses |
||||||||||||||||||||||||||||
| Purchased power and fuel |
9,925 | (251 | ) | (b),(c) | 9,674 | 8,197 | 563 | (b),(c) | 8,760 | |||||||||||||||||||
| Operating and maintenance |
5,566 | (750 | ) | (d),(e),(f),(l) | 4,816 | 4,534 | (285 | ) | (d),(e),(f), (l),(m) |
4,249 | ||||||||||||||||||
| Depreciation, amortization, accretion and depletion |
967 | — | 967 | 856 | (5 | ) | (d),(f) | 851 | ||||||||||||||||||||
| Taxes other than income |
465 | — | 465 | 389 | — | 389 | ||||||||||||||||||||||
|
|
|
|
|
|
|
|
|
|
|
|
|
|||||||||||||||||
| Total operating expenses |
16,923 | (1,001 | ) | 15,922 | 13,976 | 273 | 14,249 | |||||||||||||||||||||
| Equity in earnings (loss) of unconsolidated affiliates |
(20 | ) | 12 | (c),(d) | (8 | ) | 10 | 92 | (c),(d) | 102 | ||||||||||||||||||
| Gain on sales of assets |
437 | (411 | ) | (f) | 26 | 13 | (9 | ) | (f) | 4 | ||||||||||||||||||
| Gain on consolidation and acquisitions of businesses |
289 | (289 | ) | (g),(n) | — | — | — | — | ||||||||||||||||||||
|
|
|
|
|
|
|
|
|
|
|
|
|
|||||||||||||||||
| Operating income |
1,176 | 773 | 1,949 | 1,677 | 357 | 2,034 | ||||||||||||||||||||||
|
|
|
|
|
|
|
|
|
|
|
|
|
|||||||||||||||||
| Other income and (deductions) |
||||||||||||||||||||||||||||
| Interest expense |
(356 | ) | 3 | (b) | (353 | ) | (357 | ) | 2 | (d),(e),(o) | (355 | ) | ||||||||||||||||
| Other, net |
406 | (193 | ) | (h),(i) | 213 | 355 | (226 | ) | (d),(f),(h),(o) | 129 | ||||||||||||||||||
|
|
|
|
|
|
|
|
|
|
|
|
|
|||||||||||||||||
| Total other income and (deductions) |
50 | (190 | ) | (140 | ) | (2 | ) | (224 | ) | (226 | ) | |||||||||||||||||
|
|
|
|
|
|
|
|
|
|
|
|
|
|||||||||||||||||
| Income before income taxes |
1,226 | 583 | 1,809 | 1,675 | 133 | 1,808 | ||||||||||||||||||||||
| Income taxes |
207 | 326 | (b),(c),(d),(e), (f),(h),(i), (j),(l),(m) |
533 | 615 | (3 | ) | (b),(c),(d),(e), (f),(h),(j), (l),(m),(o) |
612 | |||||||||||||||||||
|
|
|
|
|
|
|
|
|
|
|
|
|
|||||||||||||||||
| Net income |
1,019 | 257 | 1,276 | 1,060 | 136 | 1,196 | ||||||||||||||||||||||
| Net income (loss) attributable to noncontrolling interests |
184 | (63 | ) | (k) | 121 | (10 | ) | 4 | (k) | (6 | ) | |||||||||||||||||
|
|
|
|
|
|
|
|
|
|
|
|
|
|||||||||||||||||
| Net income attributable to membership interest |
$ | 835 | $ | 320 | $ | 1,155 | $ | 1,070 | $ | 132 | $ | 1,202 | ||||||||||||||||
|
|
|
|
|
|
|
|
|
|
|
|
|
|||||||||||||||||
Note: On April 1, 2014, Generation assumed operational control of Constellation Energy Nuclear Group’s (“CENG”) nuclear fleet. As a result, the 2014 financial results include CENG’s results of operations on a fully consolidated basis from April 1, 2014 through December 31, 2014.
| (a) | Results reported in accordance with GAAP. |
| (b) | Adjustment to exclude the mark-to-market impact of Generation’s economic hedging activities. |
| (c) | Adjustment to exclude the non-cash amortization of intangible assets, net, related to commodity contracts recorded at fair value at the 2012 Constellation merger date and the 2014 CENG integration date. |
| (d) | Adjustment to exclude certain costs associated with mergers and acquisitions, including professional fees, employee-related expenses, integration activities, upfront credit facilities, merger commitments, and certain pre-acquisition contingencies, if and when applicable to the Constellation merger in 2013 and the Constellation merger, CENG integration, Integrys acquisition and pending PHI acquisition in 2014. |
| (e) | Adjustment to exclude a 2014 charge to earnings primarily related to the impairment of wind generating assets, generating assets which were held-for-sale, and certain upstream assets, and a 2013 charge to earnings primarily related to the cancellation of previously capitalized nuclear uprate projects. |
| (f) | Adjustment to exclude the impacts associated with the sales of Generation’s ownership interests in Safe Harbor Water Power Corporation and the Fore River and West Valley generating stations in 2014. |
| (g) | Adjustment to exclude difference between the fair value of assets and liabilities acquired and the purchase price of the Integrys acquisition. |
| (h) | Adjustment to exclude the unrealized gains and losses on NDT fund investments to the extent not offset by contractual accounting as described in the notes to the consolidated financial statements. |
| (i) | Adjustment to reflect a benefit related to favorable settlements in 2014 of certain income tax positions on Constellation’s pre-acquisition 2009-2012 tax returns. |
| (j) | Adjustment to exclude the non-cash impact of the reassessment of state deferred income taxes, primarily as a result of changes in forecasted apportionment. (k) Adjustment to exclude adjustments for CENG interest not owned by Generation. |
| (l) | Adjustment to exclude the 2014 decrease in Generation’s nuclear decommissioning obligation and the 2013 increase in Generation’s asset retirement obligation for asbestos at retired fossil fuel plants. |
| (m) | Adjustment to reflect estimated liabilities pursuant to the Midwest Generation bankruptcy. |
| (n) | Adjustment to exclude the gain recorded upon consolidation of CENG resulting from the difference in the fair value of CENG’s net assets and the equity method investment previously recorded on Generation’s and Exelon’s books and the settlement of pre-existing commitments between Generation and CENG. |
| (o) | Adjustment to exclude the non-cash amortization of certain debt recorded at fair value at the merger date, which was retired in the second quarter of 2013. |
12
EXELON CORPORATION
Reconciliation of Adjusted (non-GAAP) Operating Earnings to
GAAP Consolidated Statements of Operations
(unaudited)
(in millions)
| ComEd | ||||||||||||||||||||||||||||||
| Three Months Ended December 31, 2014 | Three Months Ended December 31, 2013 | |||||||||||||||||||||||||||||
| GAAP (a) | Adjustments | Adjusted Non- GAAP |
GAAP (a) | Adjustments | Adjusted Non- GAAP |
|||||||||||||||||||||||||
| Operating revenues |
$ | 1,079 | $ | — | $ | 1,079 | $ | 1,068 | $ | — | $ | 1,068 | ||||||||||||||||||
| Operating expenses |
||||||||||||||||||||||||||||||
| Purchased power |
262 | — | 262 | 243 | — | 243 | ||||||||||||||||||||||||
| Operating and maintenance |
388 | (4 | ) | (b | ) | 384 | 347 | — | 347 | |||||||||||||||||||||
| Depreciation and amortization |
166 | — | 166 | 168 | — | 168 | ||||||||||||||||||||||||
| Taxes other than income |
67 | — | 67 | 74 | — | 74 | ||||||||||||||||||||||||
|
|
|
|
|
|
|
|
|
|
|
|
|
|||||||||||||||||||
| Total operating expenses |
883 | (4 | ) | 879 | 832 | — | 832 | |||||||||||||||||||||||
|
|
|
|
|
|
|
|
|
|
|
|
|
|||||||||||||||||||
| Operating income |
196 | 4 | 200 | 236 | — | 236 | ||||||||||||||||||||||||
|
|
|
|
|
|
|
|
|
|
|
|
|
|||||||||||||||||||
| Other income and (deductions) |
||||||||||||||||||||||||||||||
| Interest expense |
(80 | ) | — | (80 | ) | (76 | ) | — | (76 | ) | ||||||||||||||||||||
| Other, net |
4 | — | 4 | 8 | — | 8 | ||||||||||||||||||||||||
|
|
|
|
|
|
|
|
|
|
|
|
|
|||||||||||||||||||
| Total other income and (deductions) |
(76 | ) | — | (76 | ) | (68 | ) | — | (68 | ) | ||||||||||||||||||||
|
|
|
|
|
|
|
|
|
|
|
|
|
|||||||||||||||||||
| Income before income taxes |
120 | 4 | 124 | 168 | — | 168 | ||||||||||||||||||||||||
| Income taxes |
47 | 2 | (b | ) | 49 | 59 | — | 59 | ||||||||||||||||||||||
|
|
|
|
|
|
|
|
|
|
|
|
|
|||||||||||||||||||
| Net income |
$ | 73 | $ | 2 | $ | 75 | $ | 109 | $ | — | $ | 109 | ||||||||||||||||||
|
|
|
|
|
|
|
|
|
|
|
|
|
|||||||||||||||||||
| Twelve Months Ended December 31, 2014 | Twelve Months Ended December 31, 2013 | |||||||||||||||||||||||||||||
| GAAP (a) | Adjustments | Adjusted Non- GAAP |
GAAP (a) | Adjustments | Adjusted Non- GAAP |
|||||||||||||||||||||||||
| Operating revenues |
$ | 4,564 | $ | — | $ | 4,564 | $ | 4,464 | $ | — | $ | 4,464 | ||||||||||||||||||
| Operating expenses |
||||||||||||||||||||||||||||||
| Purchased power |
1,177 | — | 1,177 | 1,174 | — | 1,174 | ||||||||||||||||||||||||
| Operating and maintenance |
1,429 | (4 | ) | (b | ) | 1,425 | 1,368 | (2 | ) | (b) | 1,366 | |||||||||||||||||||
| Depreciation and amortization |
687 | — | 687 | 669 | — | 669 | ||||||||||||||||||||||||
| Taxes other than income |
293 | — | 293 | 299 | — | 299 | ||||||||||||||||||||||||
|
|
|
|
|
|
|
|
|
|
|
|
|
|||||||||||||||||||
| Total operating expenses |
3,586 | (4 | ) | 3,582 | 3,510 | (2 | ) | 3,508 | ||||||||||||||||||||||
|
|
|
|
|
|
|
|
|
|
|
|
|
|||||||||||||||||||
| Gain on sales of assets |
2 | — | 2 | — | — | — | ||||||||||||||||||||||||
|
|
|
|
|
|
|
|
|
|
|
|
|
|||||||||||||||||||
| Operating income |
980 | 4 | 984 | 954 | 2 | 956 | ||||||||||||||||||||||||
|
|
|
|
|
|
|
|
|
|
|
|
|
|||||||||||||||||||
| Other income and (deductions) |
||||||||||||||||||||||||||||||
| Interest expense |
(321 | ) | — | (321 | ) | (579 | ) | 287 | (c) | (292 | ) | |||||||||||||||||||
| Other, net |
17 | — | 17 | 26 | — | 26 | ||||||||||||||||||||||||
|
|
|
|
|
|
|
|
|
|
|
|
|
|||||||||||||||||||
| Total other income and (deductions) |
(304 | ) | — | (304 | ) | (553 | ) | 287 | (266 | ) | ||||||||||||||||||||
|
|
|
|
|
|
|
|
|
|
|
|
|
|||||||||||||||||||
| Income before income taxes |
676 | 4 | 680 | 401 | 289 | 690 | ||||||||||||||||||||||||
| Income taxes |
268 | 2 | (b | ) | 270 | 152 | 117 | (b), (c) |
269 | |||||||||||||||||||||
|
|
|
|
|
|
|
|
|
|
|
|
|
|||||||||||||||||||
| Net income |
$ | 408 | $ | 2 | $ | 410 | $ | 249 | $ | 172 | $ | 421 | ||||||||||||||||||
|
|
|
|
|
|
|
|
|
|
|
|
|
|||||||||||||||||||
| (a) | Results reported in accordance with GAAP. |
| (b) | Adjustment to exclude certain costs associated with mergers and acquisitions, including professional fees, employee-related expenses, integration activities, upfront credit facilities, merger commitments, and certain pre-acquisition contingencies related to the Constellation merger in 2013 and the pending PHI acquisition in 2014. |
| (c) | Adjustment to exclude a non-cash charge to earnings resulting from the first quarter 2013 remeasurement of a like-kind exchange tax position taken on ComEd’s 1999 sale of fossil generating assets. |
13
EXELON CORPORATION
Reconciliation of Adjusted (non-GAAP) Operating Earnings to
GAAP Consolidated Statements of Operations
(unaudited)
(in millions)
| PECO | ||||||||||||||||||||||||||||||||
| Three Months Ended December 31, 2014 | Three Months Ended December 31, 2013 | |||||||||||||||||||||||||||||||
| GAAP (a) | Adjustments | Adjusted Non- GAAP |
GAAP (a) | Adjustments | Adjusted Non- GAAP |
|||||||||||||||||||||||||||
| Operating revenues |
$ | 750 | $ | — | $ | 750 | $ | 805 | $ | — | $ | 805 | ||||||||||||||||||||
| Operating expenses |
||||||||||||||||||||||||||||||||
| Purchased power and fuel |
301 | — | 301 | 347 | — | 347 | ||||||||||||||||||||||||||
| Operating and maintenance |
198 | (1 | ) | (b | ) | 197 | 194 | (1 | ) | (b | ) | 193 | ||||||||||||||||||||
| Depreciation and amortization |
59 | — | 59 | 58 | — | 58 | ||||||||||||||||||||||||||
| Taxes other than income |
36 | — | 36 | 38 | — | 38 | ||||||||||||||||||||||||||
|
|
|
|
|
|
|
|
|
|
|
|
|
|||||||||||||||||||||
| Total operating expenses |
594 | (1 | ) | 593 | 637 | (1 | ) | 636 | ||||||||||||||||||||||||
|
|
|
|
|
|
|
|
|
|
|
|
|
|||||||||||||||||||||
| Operating income |
156 | 1 | 157 | 168 | 1 | 169 | ||||||||||||||||||||||||||
|
|
|
|
|
|
|
|
|
|
|
|
|
|||||||||||||||||||||
| Other income and (deductions) |
||||||||||||||||||||||||||||||||
| Interest expense |
(28 | ) | — | (28 | ) | (29 | ) | — | (29 | ) | ||||||||||||||||||||||
| Other, net |
2 | — | 2 | 2 | — | 2 | ||||||||||||||||||||||||||
|
|
|
|
|
|
|
|
|
|
|
|
|
|||||||||||||||||||||
| Total other income and (deductions) |
(26 | ) | — | (26 | ) | (27 | ) | — | (27 | ) | ||||||||||||||||||||||
|
|
|
|
|
|
|
|
|
|
|
|
|
|||||||||||||||||||||
| Income before income taxes |
130 | 1 | 131 | 141 | 1 | 142 | ||||||||||||||||||||||||||
| Income taxes |
32 | — | 32 | 39 | — | 39 | ||||||||||||||||||||||||||
|
|
|
|
|
|
|
|
|
|
|
|
|
|||||||||||||||||||||
| Net income attributable to common shareholder |
$ | 98 | $ | 1 | $ | 99 | $ | 102 | $ | 1 | $ | 103 | ||||||||||||||||||||
|
|
|
|
|
|
|
|
|
|
|
|
|
|||||||||||||||||||||
| Twelve Months Ended December 31, 2014 | Twelve Months Ended December 31, 2013 | |||||||||||||||||||||||||||||||
| GAAP (a) | Adjustments | Adjusted Non- GAAP |
GAAP (a) | Adjustments | Adjusted Non- GAAP |
|||||||||||||||||||||||||||
| Operating revenues |
$ | 3,094 | $ | — | $ | 3,094 | $ | 3,100 | $ | — | $ | 3,100 | ||||||||||||||||||||
| Operating expenses |
||||||||||||||||||||||||||||||||
| Purchased power and fuel |
1,261 | — | 1,261 | 1,300 | — | 1,300 | ||||||||||||||||||||||||||
| Operating and maintenance |
866 | (2 | ) | (b | ) | 864 | 748 | (9 | ) | (b | ) | 739 | ||||||||||||||||||||
| Depreciation and amortization |
236 | — | 236 | 228 | — | 228 | ||||||||||||||||||||||||||
| Taxes other than income |
159 | — | 159 | 158 | — | 158 | ||||||||||||||||||||||||||
|
|
|
|
|
|
|
|
|
|
|
|
|
|||||||||||||||||||||
| Total operating expenses |
2,522 | (2 | ) | 2,520 | 2,434 | (9 | ) | 2,425 | ||||||||||||||||||||||||
|
|
|
|
|
|
|
|
|
|
|
|
|
|||||||||||||||||||||
| Operating income |
572 | 2 | 574 | 666 | 9 | 675 | ||||||||||||||||||||||||||
|
|
|
|
|
|
|
|
|
|
|
|
|
|||||||||||||||||||||
| Other income and (deductions) |
||||||||||||||||||||||||||||||||
| Interest expense |
(113 | ) | — | (113 | ) | (115 | ) | — | (115 | ) | ||||||||||||||||||||||
| Other, net |
7 | — | 7 | 6 | — | 6 | ||||||||||||||||||||||||||
|
|
|
|
|
|
|
|
|
|
|
|
|
|||||||||||||||||||||
| Total other income and (deductions) |
(106 | ) | — | (106 | ) | (109 | ) | — | (109 | ) | ||||||||||||||||||||||
|
|
|
|
|
|
|
|
|
|
|
|
|
|||||||||||||||||||||
| Income before income taxes |
466 | 2 | 468 | 557 | 9 | 566 | ||||||||||||||||||||||||||
| Income taxes |
114 | 1 | (b | ) | 115 | 162 | 4 | (b | ) | 166 | ||||||||||||||||||||||
|
|
|
|
|
|
|
|
|
|
|
|
|
|||||||||||||||||||||
| Net income |
352 | 1 | 353 | 395 | 5 | 400 | ||||||||||||||||||||||||||
| Preferred security dividends and redemption |
— | — | — | 7 | — | 7 | ||||||||||||||||||||||||||
|
|
|
|
|
|
|
|
|
|
|
|
|
|||||||||||||||||||||
| Net income attributable to common shareholder |
$ | 352 | $ | 1 | $ | 353 | $ | 388 | $ | 5 | $ | 393 | ||||||||||||||||||||
|
|
|
|
|
|
|
|
|
|
|
|
|
|||||||||||||||||||||
| (a) | Results reported in accordance with GAAP. |
| (b) | Adjustment to exclude certain costs associated with mergers and acquisitions, including professional fees, employee-related expenses, integration activities, upfront credit facilities, merger commitments, and certain pre-acquisition contingencies related to the Constellation merger in 2013 and the pending PHI acquisition in 2014. |
14
EXELON CORPORATION
Reconciliation of Adjusted (non-GAAP) Operating Earnings to
GAAP Consolidated Statements of Operations
(unaudited)
(in millions)
| BGE | ||||||||||||||||||||||||||||||||
| Three Months Ended December 31, 2014 | Three Months Ended December 31, 2013 | |||||||||||||||||||||||||||||||
| GAAP (a) | Adjustments | Adjusted Non- GAAP |
GAAP (a) | Adjustments | Adjusted Non- GAAP |
|||||||||||||||||||||||||||
| Operating revenues |
$ | 761 | $ | — | $ | 761 | $ | 794 | $ | — | $ | 794 | ||||||||||||||||||||
| Operating expenses |
||||||||||||||||||||||||||||||||
| Purchased power and fuel |
323 | — | 323 | 362 | — | 362 | ||||||||||||||||||||||||||
| Operating and maintenance |
176 | (1 | ) | (b | ) | 175 | 185 | (1 | ) | (b | ) | 184 | ||||||||||||||||||||
| Depreciation and amortization |
96 | — | 96 | 95 | — | 95 | ||||||||||||||||||||||||||
| Taxes other than income |
53 | — | 53 | 51 | — | 51 | ||||||||||||||||||||||||||
|
|
|
|
|
|
|
|
|
|
|
|
|
|||||||||||||||||||||
| Total operating expenses |
648 | (1 | ) | 647 | 693 | (1 | ) | 692 | ||||||||||||||||||||||||
|
|
|
|
|
|
|
|
|
|
|
|
|
|||||||||||||||||||||
| Operating income |
113 | 1 | 114 | 101 | 1 | 102 | ||||||||||||||||||||||||||
|
|
|
|
|
|
|
|
|
|
|
|
|
|||||||||||||||||||||
| Other income and (deductions) |
||||||||||||||||||||||||||||||||
| Interest expense |
(25 | ) | — | (25 | ) | (28 | ) | — | (28 | ) | ||||||||||||||||||||||
| Other, net |
4 | — | 4 | 4 | — | 4 | ||||||||||||||||||||||||||
|
|
|
|
|
|
|
|
|
|
|
|
|
|||||||||||||||||||||
| Total other income and (deductions) |
(21 | ) | — | (21 | ) | (24 | ) | — | (24 | ) | ||||||||||||||||||||||
|
|
|
|
|
|
|
|
|
|
|
|
|
|||||||||||||||||||||
| Income before income taxes |
92 | 1 | 93 | 77 | 1 | 78 | ||||||||||||||||||||||||||
| Income taxes |
37 | — | 37 | 27 | — | 27 | ||||||||||||||||||||||||||
|
|
|
|
|
|
|
|
|
|
|
|
|
|||||||||||||||||||||
| Net income |
55 | 1 | 56 | 50 | 1 | 51 | ||||||||||||||||||||||||||
| Preference stock dividends |
3 | — | 3 | 3 | — | 3 | ||||||||||||||||||||||||||
|
|
|
|
|
|
|
|
|
|
|
|
|
|||||||||||||||||||||
| Net income attributable to common shareholders |
$ | 52 | $ | 1 | $ | 53 | $ | 47 | $ | 1 | $ | 48 | ||||||||||||||||||||
|
|
|
|
|
|
|
|
|
|
|
|
|
|||||||||||||||||||||
| Twelve Months Ended December 31, 2014 | Twelve Months Ended December 31, 2013 | |||||||||||||||||||||||||||||||
| GAAP (a) | Adjustments | Adjusted Non- GAAP |
GAAP (a) | Adjustments | Adjusted Non- GAAP |
|||||||||||||||||||||||||||
| Operating revenues |
$ | 3,165 | $ | — | $ | 3,165 | $ | 3,065 | $ | — | $ | 3,065 | ||||||||||||||||||||
| Operating expenses |
||||||||||||||||||||||||||||||||
| Purchased power and fuel |
1,417 | — | 1,417 | 1,421 | — | 1,421 | ||||||||||||||||||||||||||
| Operating and maintenance |
717 | (2 | ) | (b | ) | 715 | 634 | 3 | (b | ) | 637 | |||||||||||||||||||||
| Depreciation and amortization |
371 | — | 371 | 348 | — | 348 | ||||||||||||||||||||||||||
| Taxes other than income |
221 | — | 221 | 213 | — | 213 | ||||||||||||||||||||||||||
|
|
|
|
|
|
|
|
|
|
|
|
|
|||||||||||||||||||||
| Total operating expenses |
2,726 | (2 | ) | 2,724 | 2,616 | 3 | 2,619 | |||||||||||||||||||||||||
|
|
|
|
|
|
|
|
|
|
|
|
|
|||||||||||||||||||||
| Operating income (loss) |
439 | 2 | 441 | 449 | (3 | ) | 446 | |||||||||||||||||||||||||
|
|
|
|
|
|
|
|
|
|
|
|
|
|||||||||||||||||||||
| Other income and (deductions) |
||||||||||||||||||||||||||||||||
| Interest expense |
(106 | ) | — | (106 | ) | (122 | ) | — | (122 | ) | ||||||||||||||||||||||
| Other, net |
18 | — | 18 | 17 | — | 17 | ||||||||||||||||||||||||||
|
|
|
|
|
|
|
|
|
|
|
|
|
|||||||||||||||||||||
| Total other income and (deductions) |
(88 | ) | — | (88 | ) | (105 | ) | — | (105 | ) | ||||||||||||||||||||||
|
|
|
|
|
|
|
|
|
|
|
|
|
|||||||||||||||||||||
| Income before income taxes |
351 | 2 | 353 | 344 | (3 | ) | 341 | |||||||||||||||||||||||||
| Income taxes |
140 | 1 | (b | ) | 141 | 134 | (1 | ) | (b | ) | 133 | |||||||||||||||||||||
|
|
|
|
|
|
|
|
|
|
|
|
|
|||||||||||||||||||||
| Net income |
211 | 1 | 212 | 210 | (2 | ) | 208 | |||||||||||||||||||||||||
| Preference stock dividends |
13 | — | 13 | 13 | — | 13 | ||||||||||||||||||||||||||
|
|
|
|
|
|
|
|
|
|
|
|
|
|||||||||||||||||||||
| Net income attributable to common shareholders |
$ | 198 | $ | 1 | $ | 199 | $ | 197 | $ | (2 | ) | $ | 195 | |||||||||||||||||||
|
|
|
|
|
|
|
|
|
|
|
|
|
|||||||||||||||||||||
| (a) | Results reported in accordance with GAAP. |
| (b) | Adjustment to exclude certain costs associated with mergers and acquisitions, including professional fees, employee-related expenses, integration activities, upfront credit facilities, merger commitments, and certain pre-acquisition contingencies related to the Constellation merger in 2013 and the pending PHI acquisition in 2014. |
15
EXELON CORPORATION
Reconciliation of Adjusted (non-GAAP) Operating Earnings to
GAAP Consolidated Statements of Operations
(unaudited)
(in millions)
| Other (a) | ||||||||||||||||||||||||||||
| Three Months Ended December 31, 2014 | Three Months Ended December 31, 2013 | |||||||||||||||||||||||||||
| GAAP (b) | Adjustments | Adjusted Non- GAAP |
GAAP (b) | Adjustments | Adjusted Non- GAAP |
|||||||||||||||||||||||
| Operating revenues |
$ | (137 | ) | $ | — | $ | (137 | ) | $ | (265 | ) | $ | — | $ | (265 | ) | ||||||||||||
| Operating expenses |
||||||||||||||||||||||||||||
| Purchased power and fuel |
(136 | ) | — | (136 | ) | (262 | ) | — | (262 | ) | ||||||||||||||||||
| Operating and maintenance |
— | (8 | ) | (c) | (8 | ) | (3 | ) | (1 | ) | (c) | (4 | ) | |||||||||||||||
| Depreciation and amortization |
13 | — | 13 | 12 | — | 12 | ||||||||||||||||||||||
| Taxes other than income |
(4 | ) | — | (4 | ) | 9 | — | 9 | ||||||||||||||||||||
|
|
|
|
|
|
|
|
|
|
|
|
|
|||||||||||||||||
| Total operating expenses |
(127 | ) | (8 | ) | (135 | ) | (244 | ) | (1 | ) | (245 | ) | ||||||||||||||||
|
|
|
|
|
|
|
|
|
|
|
|
|
|||||||||||||||||
| Gain on sales of assets |
(2 | ) | — | (2 | ) | — | — | — | ||||||||||||||||||||
|
|
|
|
|
|
|
|
|
|
|
|
|
|||||||||||||||||
| Operating loss |
(12 | ) | 8 | (4 | ) | (21 | ) | 1 | (20 | ) | ||||||||||||||||||
|
|
|
|
|
|
|
|
|
|
|
|
|
|||||||||||||||||
| Other income and (deductions) |
||||||||||||||||||||||||||||
| Interest expense |
(114 | ) | 102 | (c) | (12 | ) | (14 | ) | — | (14 | ) | |||||||||||||||||
| Other, net |
(1 | ) | — | (1 | ) | 10 | — | 10 | ||||||||||||||||||||
|
|
|
|
|
|
|
|
|
|
|
|
|
|||||||||||||||||
| Total other income and (deductions) |
(115 | ) | 102 | (13 | ) | (4 | ) | — | (4 | ) | ||||||||||||||||||
|
|
|
|
|
|
|
|
|
|
|
|
|
|||||||||||||||||
| Loss before income taxes |
(127 | ) | 110 | (17 | ) | (25 | ) | 1 | (24 | ) | ||||||||||||||||||
|
|
|
|
|
|
|
|
|
|
|
|
|
|||||||||||||||||
| Income (benefit) taxes |
(13 | ) | 33 | (c),(e), (f),(g) |
20 | 7 | (15 | ) | (g) | (8 | ) | |||||||||||||||||
|
|
|
|
|
|
|
|
|
|
|
|
|
|||||||||||||||||
| Net loss |
$ | (114 | ) | $ | 77 | $ | (37 | ) | $ | (32 | ) | $ | 16 | $ | (16 | ) | ||||||||||||
|
|
|
|
|
|
|
|
|
|
|
|
|
|||||||||||||||||
| Twelve Months Ended December 31, 2014 | Twelve Months Ended December 31, 2013 (b) | |||||||||||||||||||||||||||
| GAAP (c) | Adjustments | Adjusted Non- GAAP |
GAAP (c) | Adjustments | Adjusted Non- GAAP |
|||||||||||||||||||||||
| Operating revenues |
$ | (787 | ) | $ | — | $ | (787 | ) | $ | (1,371 | ) | $ | (6 | ) | (e) | $ | (1,377 | ) | ||||||||||
| Operating expenses |
||||||||||||||||||||||||||||
| Purchased power and fuel |
(777 | ) | — | (777 | ) | (1,368 | ) | — | (1,368 | ) | ||||||||||||||||||
| Operating and maintenance |
(10 | ) | (51 | ) | (c),(d) | (61 | ) | (14 | ) | (19 | ) | (c),(d) | (33 | ) | ||||||||||||||
| Depreciation and amortization |
53 | — | 53 | 52 | — | 52 | ||||||||||||||||||||||
| Taxes other than income |
16 | — | 16 | 36 | — | 36 | ||||||||||||||||||||||
|
|
|
|
|
|
|
|
|
|
|
|
|
|||||||||||||||||
| Total operating expenses |
(718 | ) | (51 | ) | (769 | ) | (1,294 | ) | (19 | ) | (1,313 | ) | ||||||||||||||||
|
|
|
|
|
|
|
|
|
|
|
|
|
|||||||||||||||||
| Gain on sale of assets |
(2 | ) | — | (2 | ) | — | — | — | ||||||||||||||||||||
| Operating loss |
(71 | ) | 51 | (20 | ) | (77 | ) | 13 | (64 | ) | ||||||||||||||||||
|
|
|
|
|
|
|
|
|
|
|
|
|
|||||||||||||||||
| Other income and (deductions) |
||||||||||||||||||||||||||||
| Interest expense |
(169 | ) | 131 | (c) | (38 | ) | (183 | ) | 81 | (h) | (102 | ) | ||||||||||||||||
| Other, net |
7 | — | 7 | 56 | — | 56 | ||||||||||||||||||||||
|
|
|
|
|
|
|
|
|
|
|
|
|
|||||||||||||||||
| Total other income and (deductions) |
(162 | ) | 131 | (31 | ) | (127 | ) | 81 | (46 | ) | ||||||||||||||||||
|
|
|
|
|
|
|
|
|
|
|
|
|
|||||||||||||||||
| Loss before income taxes |
(233 | ) | 182 | (51 | ) | (204 | ) | 94 | (110 | ) | ||||||||||||||||||
| Income taxes |
(63 | ) | 61 | (c),(d), (e),(f), |
(2 | ) | (19 | ) | (29 | ) | (c),(d), (e),(g), (h) |
(48 | ) | |||||||||||||||
|
|
|
|
|
|
|
|
|
|
|
|
|
|||||||||||||||||
| Net loss |
$ | (170 | ) | $ | 121 | $ | (49 | ) | $ | (185 | ) | $ | 123 | $ | (62 | ) | ||||||||||||
|
|
|
|
|
|
|
|
|
|
|
|
|
|||||||||||||||||
| (a) | Other primarily includes eliminating and consolidating adjustments, Exelon’s corporate operations, shared service entities and other financing and investment activities. |
| (b) | Results reported in accordance with GAAP. |
| (c) | Adjustment to exclude certain costs associated with mergers and acquisitions, including professional fees, employee-related expenses, integration activities, upfront credit facilities, merger commitments, and certain pre-acquisition contingencies, if and when applicable to the Constellation merger in 2013 and the Constellation merger, CENG integration, Integrys acquisition and pending PHI acquisition in 2014. |
| (d) | Adjustment to exclude a charge to earnings related to the impairment of investments in long-term leases in both 2014 and 2013. |
| (e) | Adjustment to exclude the mark-to-market impact of Exelon’s economic hedging activities, net of intercompany eliminations. |
| (f) | Adjustment to exclude the impacts associated with the sale or retirement of generating stations. |
| (g) | Adjustment to exclude the non-cash impact of the reassessment of state deferred income taxes, primarily as a result of changes in forecasted apportionment. |
| (h) | Adjustment to exclude a non-cash charge to earnings resulting from the first quarter 2013 remeasurement of a like-kind exchange tax position taken on ComEd’s 1999 sale of fossil generating assets. |
16
EXELON CORPORATION
Exelon Generation Statistics
| Three Months Ended, | ||||||||||||||||||||
| December 31, 2014 |
September 30, 2014 |
June 30, 2014 | March 31, 2014 | December 31, 2013 |
||||||||||||||||
| Supply (in GWhs) |
||||||||||||||||||||
| Nuclear Generation |
||||||||||||||||||||
| Mid-Atlantic (a) |
15,768 | 15,993 | 14,912 | 12,136 | 11,900 | |||||||||||||||
| Midwest |
23,777 | 24,379 | 22,719 | 23,125 | 23,429 | |||||||||||||||
| New York (a) |
4,988 | 4,891 | 3,766 | — | — | |||||||||||||||
|
|
|
|
|
|
|
|
|
|
|
|||||||||||
| Total Nuclear Generation |
44,533 | 45,263 | 41,397 | 35,261 | 35,329 | |||||||||||||||
| Fossil and Renewables (a) |
||||||||||||||||||||
| Mid-Atlantic |
2,268 | 2,385 | 3,165 | 3,207 | 2,951 | |||||||||||||||
| Midwest |
424 | 212 | 319 | 417 | 363 | |||||||||||||||
| New England |
411 | 1,789 | 1,299 | 1,734 | 1,763 | |||||||||||||||
| New York |
1 | 1 | 1 | 1 | — | |||||||||||||||
| ERCOT |
1,624 | 2,331 | 1,553 | 1,656 | 1,582 | |||||||||||||||
| Other (c) |
1,999 | 2,285 | 2,041 | 1,630 | 1,064 | |||||||||||||||
|
|
|
|
|
|
|
|
|
|
|
|||||||||||
| Total Fossil and Renewables |
6,727 | 9,003 | 8,378 | 8,645 | 7,723 | |||||||||||||||
| Purchased Power |
||||||||||||||||||||
| Mid-Atlantic (b) |
929 | 1,110 | 810 | 3,233 | 3,955 | |||||||||||||||
| Midwest |
513 | 260 | 520 | 711 | 498 | |||||||||||||||
| New England |
4,763 | 3,231 | 2,290 | 2,070 | 2,605 | |||||||||||||||
| New York (b) |
— | — | — | 2,857 | 3,493 | |||||||||||||||
| ERCOT |
1,966 | 2,184 | 2,518 | 3,440 | 2,792 | |||||||||||||||
| Other (c) |
3,389 | 4,397 | 3,654 | 3,355 | 2,986 | |||||||||||||||
|
|
|
|
|
|
|
|
|
|
|
|||||||||||
| Total Purchased Power |
11,560 | 11,182 | 9,792 | 15,666 | 16,329 | |||||||||||||||
| Total Supply/Sales by Region (e) |
||||||||||||||||||||
| Mid-Atlantic (d) |
18,965 | 19,488 | 18,887 | 18,576 | 18,806 | |||||||||||||||
| Midwest (d) |
24,714 | 24,851 | 23,558 | 24,253 | 24,290 | |||||||||||||||
| New England |
5,174 | 5,020 | 3,589 | 3,804 | 4,368 | |||||||||||||||
| New York |
4,989 | 4,892 | 3,767 | 2,858 | 3,493 | |||||||||||||||
| ERCOT |
3,590 | 4,515 | 4,071 | 5,096 | 4,374 | |||||||||||||||
| Other (c) |
5,388 | 6,682 | 5,695 | 4,985 | 4,050 | |||||||||||||||
|
|
|
|
|
|
|
|
|
|
|
|||||||||||
| Total Supply/Sales by Region |
62,820 | 65,448 | 59,567 | 59,572 | 59,381 | |||||||||||||||
|
|
|
|
|
|
|
|
|
|
|
|||||||||||
| Three Months Ended, | ||||||||||||||||||||
| December 31, 2014 |
September 30, 2014 |
June 30, 2014 | March 31, 2014 (g) |
December 31, 2013(g) |
||||||||||||||||
| Outage Days (f) |
||||||||||||||||||||
| Refueling |
97 | 18 | 108 | 52 | 94 | |||||||||||||||
| Non-refueling |
8 | 20 | 44 | 20 | 33 | |||||||||||||||
|
|
|
|
|
|
|
|
|
|
|
|||||||||||
| Total Outage Days |
105 | 38 | 152 | 72 | 127 | |||||||||||||||
|
|
|
|
|
|
|
|
|
|
|
|||||||||||
| (a) | Includes the proportionate share of output where Generation has an undivided ownership interest in jointly-owned generating plants and includes the total output of plants that are fully consolidated (e.g. CENG). Nuclear generation includes physical volumes of 3,902 GWh, 3,726 GWh, and 3,780 GWh in the Mid-Atlantic and 4,988 GWh, 4,891 GWh, and 3,766 GWh in New York for the three months ended December 31, 2014, September 30, 2014, and June 30, 2014, respectively for CENG. |
| (b) | Purchased power includes physical volumes of 2,489 GWh and 3,226 GWh in the Mid-Atlantic and 2,857 GWh and 3,051 GWh in New York as a result of the PPA with CENG for the three months ended March 31, 2014 and December 31, 2013, respectively. CENG volumes are included in nuclear generation beginning April 1, 2014. |
| (c) | Other Regions includes South, West and Canada, which are not considered individually significant. |
| (d) | Includes affiliate sales to PECO and BGE in the Mid-Atlantic region and affiliate sales to ComEd in the Midwest region. |
| (e) | Total sales do not include physical trading volumes of 2,442 GWh, 3,006 GWh, 2,629 GWh, 2,494 GWh, and 2,696 GWh for the three months ended December 31, 2014, September 30, 2014, June 30, 2014, March 31, 2014, and December 31, 2013, respectively. |
| (f) | Outage days exclude Salem. |
| (g) | Outage days exclude CENG |
17
EXELON CORPORATION
Exelon Generation Statistics
Twelve Months Ended December 31, 2014
| December 31, 2014 | December 31, 2013 | |||||||
| Supply (in GWhs) |
||||||||
| Nuclear Generation |
||||||||
| Mid-Atlantic (a) |
58,809 | 48,881 | ||||||
| Midwest |
94,000 | 93,245 | ||||||
| New York (a) |
13,645 | — | ||||||
|
|
|
|
|
|||||
| Total Nuclear Generation |
166,454 | 142,126 | ||||||
| Fossil and Renewables (a) |
||||||||
| Mid-Atlantic |
11,025 | 11,714 | ||||||
| Midwest |
1,372 | 1,478 | ||||||
| New England |
5,233 | 10,896 | ||||||
| New York |
4 | — | ||||||
| ERCOT |
7,164 | 6,453 | ||||||
| Other (c) |
7,955 | 6,664 | ||||||
|
|
|
|
|
|||||
| Total Fossil and Renewables |
32,753 | 37,205 | ||||||
| Purchased Power |
||||||||
| Mid-Atlantic (b) |
6,082 | 14,092 | ||||||
| Midwest |
2,004 | 4,408 | ||||||
| New England |
12,354 | 7,655 | ||||||
| New York (b) |
2,857 | 13,642 | ||||||
| ERCOT |
10,108 | 15,063 | ||||||
| Other (c) |
14,795 | 14,931 | ||||||
|
|
|
|
|
|||||
| Total Purchased Power |
48,200 | 69,791 | ||||||
| Total Supply/Sales by Region (e) |
||||||||
| Mid-Atlantic (d) |
75,916 | 74,687 | ||||||
| Midwest (d) |
97,376 | 99,131 | ||||||
| New England |
17,587 | 18,551 | ||||||
| New York |
16,506 | 13,642 | ||||||
| ERCOT |
17,272 | 21,516 | ||||||
| Other (c) |
22,750 | 21,595 | ||||||
|
|
|
|
|
|||||
| Total Supply/Sales by Region |
247,407 | 249,122 | ||||||
|
|
|
|
|
|||||
| (a) | Includes the proportionate share of output where Generation has an undivided ownership interest in jointly-owned generating plants and includes the total output of plants that are fully consolidated (e.g. CENG). Nuclear generation for the twelve months ended December 31, 2014 includes physical volumes of 11,408 GWh in Mid-Atlantic and 13,645 GWh in New York for CENG. |
| (b) | Purchased power includes physical volumes of 2,489 GWh and 12,067 GWh in the Mid-Atlantic and 2,857 GWh and 12,165 GWh in New York as a result of the PPA with CENG for the twelve months ended December 31, 2014 and 2013, respectively. |
| (c) | Other Regions includes South, West and Canada, which are not considered individually significant. |
| (d) | Includes affiliate sales to PECO and BGE in the Mid-Atlantic region and affiliate sales to ComEd in the Midwest region. |
| (e) | Total sales do not include physical proprietary trading volumes of 10,571 GWh and 8,762 GWh for the twelve months ended December 31, 2014 and 2013, respectively. |
18
EXELON CORPORATION
ComEd Statistics
Three Months Ended December 31, 2014 and 2013
| Electric Deliveries (in GWhs) | Revenue (in millions) | |||||||||||||||||||||||||||
| Weather- | ||||||||||||||||||||||||||||
| Normal | ||||||||||||||||||||||||||||
| 2014 | 2013 | % Change | % Change | 2014 | 2013 | % Change | ||||||||||||||||||||||
| Retail Deliveries and Sales (a) |
||||||||||||||||||||||||||||
| Residential |
6,310 | 6,646 | (5.1 | )% | (3.2 | )% | 502 | 485 | 3.5 | % | ||||||||||||||||||
| Small Commercial & Industrial |
7,690 | 7,920 | (2.9 | )% | (1.6 | )% | 301 | 303 | (0.7 | )% | ||||||||||||||||||
| Large Commercial & Industrial |
6,738 | 6,752 | (0.2 | )% | 1.2 | % | 91 | 100 | (9.0 | )% | ||||||||||||||||||
| Public Authorities & Electric Railroads |
357 | 358 | (0.3 | )% | 1.1 | % | 11 | 13 | (15.4 | )% | ||||||||||||||||||
|
|
|
|
|
|
|
|
|
|||||||||||||||||||||
| Total Retail |
21,095 | 21,676 | (2.7 | )% | (1.2 | )% | 905 | 901 | 0.4 | % | ||||||||||||||||||
|
|
|
|
|
|
|
|
|
|||||||||||||||||||||
| Other Revenue (b) |
174 | 167 | 4.2 | % | ||||||||||||||||||||||||
|
|
|
|
|
|||||||||||||||||||||||||
| Total Electric Revenue |
$ | 1,079 | $ | 1,068 | 1.0 | % | ||||||||||||||||||||||
|
|
|
|
|
|||||||||||||||||||||||||
| Purchased Power |
262 | 243 | 7.8 | % | ||||||||||||||||||||||||
|
|
|
|
|
|||||||||||||||||||||||||
| % Change | ||||||||||||||||||||
| 2014 | 2013 | Normal | From 2013 | From Normal | ||||||||||||||||
| Heating and Cooling Degree-Days |
||||||||||||||||||||
| Heating Degree-Days |
2,347 | 2,487 | 2,293 | (5.6 | )% | 2.4 | % | |||||||||||||
| Cooling Degree-Days |
3 | 25 | 11 | (88.0 | )% | (72.7 | )% | |||||||||||||
Twelve Months Ended December 31, 2014 and 2013
| Electric Deliveries (in GWhs) | Revenue (in millions) | |||||||||||||||||||||||||||
| Weather- | ||||||||||||||||||||||||||||
| Normal | ||||||||||||||||||||||||||||
| 2014 | 2013 | % Change | % Change | 2014 | 2013 | % Change | ||||||||||||||||||||||
| Retail Deliveries and Sales (a) |
||||||||||||||||||||||||||||
| Residential |
27,230 | 27,800 | (2.1 | )% | 0.3 | % | $ | 2,074 | $ | 2,073 | — | % | ||||||||||||||||
| Small Commercial & Industrial |
32,146 | 32,305 | (0.5 | )% | (0.3 | )% | 1,335 | 1,250 | 6.8 | % | ||||||||||||||||||
| Large Commercial & Industrial |
27,847 | 27,684 | 0.6 | % | 0.7 | % | 434 | 427 | 1.6 | % | ||||||||||||||||||
| Public Authorities & Electric Railroads |
1,358 | 1,355 | 0.2 | % | (0.7 | )% | 46 | 48 | (4.2 | )% | ||||||||||||||||||
|
|
|
|
|
|
|
|
|
|||||||||||||||||||||
| Total Retail |
88,581 | 89,144 | (0.6 | )% | 0.2 | % | 3,889 | 3,798 | 2.4 | % | ||||||||||||||||||
|
|
|
|
|
|
|
|
|
|||||||||||||||||||||
| Other Revenue (b) |
675 | 666 | 1.4 | % | ||||||||||||||||||||||||
|
|
|
|
|
|||||||||||||||||||||||||
| Total Electric Revenue |
$ | 4,564 | $ | 4,464 | 2.2 | % | ||||||||||||||||||||||
|
|
|
|
|
|||||||||||||||||||||||||
| Purchased Power |
$ | 1,177 | $ | 1,174 | 0.3 | % | ||||||||||||||||||||||
|
|
|
|
|
|||||||||||||||||||||||||
| % Change | ||||||||||||||||||||
| 2014 | 2013 | Normal | From 2013 | From Normal | ||||||||||||||||
| Heating and Cooling Degree-Days |
||||||||||||||||||||
| Heating Degree-Days |
7,027 | 6,603 | 6,341 | 6.4 | % | 10.8 | % | |||||||||||||
| Cooling Degree-Days |
799 | 933 | 842 | (14.4 | )% | (5.1 | )% | |||||||||||||
| 2014 | 2013 | |||||||
| Number of Electric Customers |
||||||||
| Residential |
3,502,386 | 3,480,398 | ||||||
| Small Commercial & Industrial |
369,053 | 367,569 | ||||||
| Large Commercial & Industrial |
1,998 | 1,984 | ||||||
| Public Authorities & Electric Railroads |
4,815 | 4,853 | ||||||
|
|
|
|
|
|||||
| Total |
3,878,252 | 3,854,804 | ||||||
|
|
|
|
|
|||||
| (a) | Reflects delivery volume and revenue from customers purchasing electricity directly from ComEd and customers purchasing electricity from a competitive electric generation supplier, as all customers are assessed delivery charges. For customers purchasing electricity from ComEd, revenue also reflects the cost of energy and transmission. |
| (b) | Other revenue primarily includes transmission revenue from PJM. Other items include rental revenue, revenue related to late payment charges, revenue from other utilities for mutual assistance programs and recoveries of environmental costs associated with MGP sites. |
19
EXELON CORPORATION
PECO Statistics
Three Months Ended December 31, 2014 and 2013
| Electric and Gas Deliveries | Revenue (in millions) | |||||||||||||||||||||||||||
| Weather- | ||||||||||||||||||||||||||||
| Normal | ||||||||||||||||||||||||||||
| 2014 | 2013 | % Change | % Change | 2014 | 2013 | % Change | ||||||||||||||||||||||
| Electric (in GWhs) |
||||||||||||||||||||||||||||
| Retail Deliveries and Sales (a) |
||||||||||||||||||||||||||||
| Residential |
3,022 | 3,207 | (5.8 | )% | (2.0 | )% | $ | 360 | $ | 395 | (8.9 | )% | ||||||||||||||||
| Small Commercial & Industrial |
1,927 | 1,990 | (3.2 | )% | (0.6 | )% | 104 | 109 | (4.6 | )% | ||||||||||||||||||
| Large Commercial & Industrial |
3,706 | 3,742 | (1.0 | )% | (0.3 | )% | 48 | 51 | (5.9 | )% | ||||||||||||||||||
| Public Authorities & Electric Railroads |
215 | 218 | (1.4 | )% | (1.4 | )% | 8 | 7 | 14.3 | % | ||||||||||||||||||
|
|
|
|
|
|
|
|
|
|||||||||||||||||||||
| Total Retail |
8,870 | 9,157 | (3.1 | )% | (1.0 | )% | 520 | 562 | (7.5 | )% | ||||||||||||||||||
|
|
|
|
|
|
|
|
|
|||||||||||||||||||||
| Other Revenue (b) |
56 | 60 | (6.7 | )% | ||||||||||||||||||||||||
|
|
|
|
|
|||||||||||||||||||||||||
| Total Electric Revenue |
576 | 622 | (7.4 | )% | ||||||||||||||||||||||||
|
|
|
|
|
|||||||||||||||||||||||||
| Gas (in mmcfs) |
||||||||||||||||||||||||||||
| Retail Deliveries and Sales |
||||||||||||||||||||||||||||
| Retail Sales (c) |
18,247 | 18,725 | (2.6 | )% | 2.3 | % | 164 | 176 | (6.8 | )% | ||||||||||||||||||
| Transportation and Other |
7,084 | 7,209 | (1.7 | )% | 0.8 | % | 10 | 7 | 42.9 | % | ||||||||||||||||||
|
|
|
|
|
|
|
|
|
|||||||||||||||||||||
| Total Gas |
25,331 | 25,934 | (2.3 | )% | 1.9 | % | 174 | 183 | (4.9 | )% | ||||||||||||||||||
|
|
|
|
|
|
|
|
|
|||||||||||||||||||||
| Total Electric and Gas Revenues |
$ | 750 | $ | 805 | (6.8 | )% | ||||||||||||||||||||||
|
|
|
|
|
|||||||||||||||||||||||||
| Purchased Power and Fuel |
$ | 301 | $ | 347 | (13.3 | )% | ||||||||||||||||||||||
|
|
|
|
|
|||||||||||||||||||||||||
| % Change | ||||||||||||||||||||
| 2014 | 2013 | Normal | From 2013 | From Normal | ||||||||||||||||
| Heating and Cooling Degree-Days |
||||||||||||||||||||
| Heating Degree-Days |
1,498 | 1,577 | 1,629 | (5.0 | )% | (8.0 | )% | |||||||||||||
| Cooling Degree-Days |
25 | 65 | 19 | (61.5 | )% | 31.6 | % | |||||||||||||
Twelve Months Ended December 31, 2014 and 2013
| Electric and Gas Deliveries | Revenue (in millions) | |||||||||||||||||||||||||||
| Weather- | ||||||||||||||||||||||||||||
| Normal | ||||||||||||||||||||||||||||
| 2014 | 2013 | % Change | % Change | 2014 | 2013 | % Change | ||||||||||||||||||||||
| Electric (in GWhs) |
||||||||||||||||||||||||||||
| Retail Deliveries and Sales (a) |
||||||||||||||||||||||||||||
| Residential |
13,222 | 13,341 | (0.9 | )% | 0.5 | % | $ | 1,555 | $ | 1,592 | (2.3 | )% | ||||||||||||||||
| Small Commercial & Industrial |
8,025 | 8,101 | (0.9 | )% | — | % | 423 | 433 | (2.3 | )% | ||||||||||||||||||
| Large Commercial & Industrial |
15,310 | 15,379 | (0.4 | )% | (0.1 | )% | 217 | 224 | (3.1 | )% | ||||||||||||||||||
| Public Authorities & Electric Railroads |
937 | 930 | 0.8 | % | 0.8 | % | 32 | 30 | 6.7 | % | ||||||||||||||||||
|
|
|
|
|
|
|
|
|
|||||||||||||||||||||
| Total Retail |
37,494 | 37,751 | (0.7 | )% | 0.1 | % | 2,227 | 2,279 | (2.3 | )% | ||||||||||||||||||
|
|
|
|
|
|
|
|
|
|||||||||||||||||||||
| Other Revenue (b) |
221 | 221 | — | % | ||||||||||||||||||||||||
|
|
|
|
|
|||||||||||||||||||||||||
| Total Electric Revenue |
2,448 | 2,500 | (2.1 | )% | ||||||||||||||||||||||||
|
|
|
|
|
|||||||||||||||||||||||||
| Gas (in mmcfs) |
||||||||||||||||||||||||||||
| Retail Deliveries and Sales |
||||||||||||||||||||||||||||
| Retail Sales (c) |
62,734 | 57,613 | 8.9 | % | 2.2 | % | 608 | 562 | 8.2 | % | ||||||||||||||||||
| Transportation and Other |
27,208 | 28,089 | (3.1 | )% | (1.0 | )% | 38 | 38 | — | % | ||||||||||||||||||
|
|
|
|
|
|
|
|
|
|||||||||||||||||||||
| Total Gas |
89,942 | 85,702 | 4.9 | % | 1.2 | % | 646 | 600 | 7.7 | % | ||||||||||||||||||
|
|
|
|
|
|
|
|
|
|||||||||||||||||||||
| Total Electric and Gas Revenues |
$ | 3,094 | $ | 3,100 | (0.2 | )% | ||||||||||||||||||||||
|
|
|
|
|
|||||||||||||||||||||||||
| Purchased Power and Fuel |
$ | 1,261 | $ | 1,300 | (3.0 | )% | ||||||||||||||||||||||
|
|
|
|
|
|||||||||||||||||||||||||
| % Change | ||||||||||||||||||||
| 2014 | 2013 | Normal | From 2013 | From Normal | ||||||||||||||||
| Heating and Cooling Degree-Days |
||||||||||||||||||||
| Heating Degree-Days |
4,749 | 4,474 | 4,603 | 6.1 | % | 3.2 | % | |||||||||||||
| Cooling Degree-Days |
1,311 | 1,411 | 1,301 | (7.1 | )% | 0.8 | % | |||||||||||||
| Number of Electric Customers |
2014 | 2013 | Number of Gas Customers |
2014 | 2013 | |||||||||||||
| Residential |
1,434,011 | 1,423,068 | Residential | 462,663 | 458,356 | |||||||||||||
| Small Commercial & Industrial |
149,149 | 149,117 | Commercial & Industrial | 42,686 | 42,174 | |||||||||||||
|
|
|
|
|
|||||||||||||||
| Large Commercial & Industrial |
3,103 | 3,105 | Total Retail | 505,349 | 500,530 | |||||||||||||
|
|
|
|
|
|||||||||||||||
| Public Authorities & Electric Railroads |
9,734 | 9,668 | Transportation | 855 | 909 | |||||||||||||
|
|
|
|
|
|
|
|
|
|||||||||||
| Total |
1,595,997 | 1,584,958 | Total | 506,204 | 501,439 | |||||||||||||
|
|
|
|
|
|
|
|
|
|||||||||||
| (a) | Reflects delivery volume and revenue from customers purchasing electricity directly from PECO and customers purchasing electricity from a competitive electric generation supplier as all customers are assessed distribution charges. For customers purchasing electricity from PECO, revenue also reflects the cost of energy and transmission. |
| (b) | Other revenue includes transmission revenue from PJM and wholesale electric revenue. |
| (c) | Reflects delivery volume and revenue from customers purchasing natural gas directly from PECO and customers purchasing natural gas from a competitive natural gas supplier as all customers are assessed distribution charges. For customers purchasing natural gas from PECO, revenue also reflects the cost of natural gas. |
20
EXELON CORPORATION
BGE Statistics
Three Months Ended December 31, 2014 and 2013
| Electric and Gas Deliveries | Revenue (in millions) | |||||||||||||||||||||||
| 2014 | 2013 | % Change | 2014 | 2013 | % Change | |||||||||||||||||||
| Electric (in GWhs) |
||||||||||||||||||||||||
| Retail Deliveries and Sales (a) |
||||||||||||||||||||||||
| Residential |
2,952 | 3,227 | (8.5 | )% | $ | 327 | $ | 347 | (5.8 | )% | ||||||||||||||
| Small Commercial & Industrial |
743 | 735 | 1.1 | % | 63 | 60 | 5.0 | % | ||||||||||||||||
| Large Commercial & Industrial |
3,311 | 3,293 | 0.5 | % | 114 | 106 | 7.5 | % | ||||||||||||||||
| Public Authorities & Electric Railroads |
75 | 78 | (3.8 | )% | 8 | 8 | — | % | ||||||||||||||||
|
|
|
|
|
|
|
|
|
|||||||||||||||||
| Total Retail |
7,081 | 7,333 | (3.4 | )% | 512 | 521 | (1.7 | )% | ||||||||||||||||
|
|
|
|
|
|
|
|
|
|||||||||||||||||
| Other Revenue (b) |
55 | 71 | (22.5 | )% | ||||||||||||||||||||
|
|
|
|
|
|||||||||||||||||||||
| Total Electric Revenue |
567 | 592 | (4.2 | )% | ||||||||||||||||||||
|
|
|
|
|
|||||||||||||||||||||
| Gas (in mmcfs) |
||||||||||||||||||||||||
| Retail Deliveries and Sales (c) |
||||||||||||||||||||||||
| Retail Sales |
27,716 | 28,166 | (1.6 | )% | 183 | 180 | 1.7 | % | ||||||||||||||||
| Transportation and Other (d) |
1,733 | 4,082 | (57.5 | )% | 11 | 22 | (50.0 | )% | ||||||||||||||||
|
|
|
|
|
|
|
|
|
|||||||||||||||||
| Total Gas |
29,449 | 32,248 | (8.7 | )% | 194 | 202 | (4.0 | )% | ||||||||||||||||
|
|
|
|
|
|
|
|
|
|||||||||||||||||
| Total Electric and Gas Revenues |
$ | 761 | $ | 794 | (4.2 | )% | ||||||||||||||||||
|
|
|
|
|
|||||||||||||||||||||
| Purchased Power and Fuel |
$ | 323 | $ | 362 | (10.8 | )% | ||||||||||||||||||
|
|
|
|
|
|||||||||||||||||||||
| % Change | ||||||||||||||||||||
| 2014 | 2013 | Normal | From 2013 | From Normal | ||||||||||||||||
| Heating and Cooling Degree-Days |
||||||||||||||||||||
| Heating Degree-Days |
1,652 | 1,690 | 1,681 | (2.2 | )% | (1.7 | )% | |||||||||||||
| Cooling Degree-Days |
16 | 39 | 25 | (59.0 | )% | (36.0 | )% | |||||||||||||
Twelve Months Ended December 31, 2014 and 2013
| Electric and Gas Deliveries | Revenue (in millions) | |||||||||||||||||||||||
| 2014 | 2013 | % Change | 2014 | 2013 | % Change | |||||||||||||||||||
| Electric (in GWhs) |
||||||||||||||||||||||||
| Retail Deliveries and Sales (a) |
||||||||||||||||||||||||
| Residential |
12,974 | 13,077 | (0.8 | )% | $ | 1,404 | $ | 1,404 | — | % | ||||||||||||||
| Small Commercial & Industrial |
3,086 | 3,035 | 1.7 | % | 271 | 257 | 5.4 | % | ||||||||||||||||
| Large Commercial & Industrial |
14,191 | 14,339 | (1.0 | )% | 491 | 439 | 11.8 | % | ||||||||||||||||
| Public Authorities & Electric Railroads |
311 | 317 | (1.9 | )% | 32 | 31 | 3.2 | % | ||||||||||||||||
|
|
|
|
|
|
|
|
|
|||||||||||||||||
| Total Retail |
30,562 | 30,768 | (0.7 | )% | 2,198 | 2,131 | 3.1 | % | ||||||||||||||||
|
|
|
|
|
|
|
|
|
|||||||||||||||||
| Other Revenue (b) |
262 | 274 | (4.4 | )% | ||||||||||||||||||||
|
|
|
|
|
|||||||||||||||||||||
| Total Electric Revenue |
2,460 | $ | 2,405 | 2.3 | % | |||||||||||||||||||
|
|
|
|
|
|||||||||||||||||||||
| Gas (in mmcfs) |
||||||||||||||||||||||||
| Retail Deliveries and Sales (c) |
||||||||||||||||||||||||
| Retail Sales |
99,194 | 94,020 | 5.5 | % | 622 | 592 | 5.1 | % | ||||||||||||||||
| Transportation and Other (d) |
9,242 | 12,210 | (24.3 | )% | 83 | 68 | 22.1 | % | ||||||||||||||||
|
|
|
|
|
|
|
|
|
|||||||||||||||||
| Total Gas |
108,436 | 106,230 | 2.1 | % | 705 | 660 | 6.8 | % | ||||||||||||||||
|
|
|
|
|
|
|
|
|
|||||||||||||||||
| Total Electric and Gas Revenues |
$ | 3,165 | $ | 3,065 | 3.3 | % | ||||||||||||||||||
|
|
|
|
|
|||||||||||||||||||||
| Purchased Power and Fuel |
$ | 1,417 | $ | 1,421 | (0.3 | )% | ||||||||||||||||||
|
|
|
|
|
|||||||||||||||||||||
| % Change | ||||||||||||||||||||
| 2014 | 2013 | Normal | From 2013 | From Normal | ||||||||||||||||
| Heating and Cooling Degree-Days |
||||||||||||||||||||
| Heating Degree-Days |
5,091 | 4,744 | 4,662 | 7.3 | % | 9.2 | % | |||||||||||||
| Cooling Degree-Days |
732 | 869 | 876 | (15.8 | )% | (16.4 | )% | |||||||||||||
| Number of Electric Customers |
2014 | 2013 | Number of Gas Customers |
2014 | 2013 | |||||||||||||
| Residential |
1,125,369 | 1,120,431 | Residential | 609,626 | 611,532 | |||||||||||||
| Small Commercial & Industrial |
112,972 | 112,850 | Commercial & Industrial | 44,200 | 44,162 | |||||||||||||
|
|
|
|
|
|||||||||||||||
| Large Commercial & Industrial |
11,730 | 11,652 | Total Retail | 653,826 | 655,694 | |||||||||||||
| Public Authorities & Electric Railroads |
290 | 292 | Transportation | — | — | |||||||||||||
|
|
|
|
|
|
|
|
|
|||||||||||
| Total |
1,250,361 | 1,245,225 | Total | 653,826 | 655,694 | |||||||||||||
|
|
|
|
|
|
|
|
|
|||||||||||
| (a) | Reflects delivery volume and revenue from customers purchasing electricity directly from BGE and customers purchasing electricity from a competitive electric generation supplier as all customers are assessed distribution charges. For customers purchasing electricity from BGE, revenue also reflects the cost of energy and transmission. |
| (b) | Other revenue includes wholesale transmission revenue and late payment charges. |
| (c) | Reflects delivery volume and revenue from customers purchasing natural gas directly from BGE and customers purchasing natural gas from a competitive natural gas supplier as all customers are assessed distribution charges. For customers purchasing natural gas from BGE, revenue also reflects the cost of natural gas. |
| (d) | Transportation and other gas revenue includes off-system revenue of 1,733 mmcfs ($11 million) and 4,082 mmcfs ($19 million) for the three months ended December 31, 2014 and 2013, respectively, and 9,242 mmcfs ($72 million) and 12,210 mmcfs ($55 million) for the twelve months ended December 31, 2014 and 2013, respectively. |
21
 Earnings Conference Call
4
th
Quarter 2014
February 13
th
, 2015
Exhibit 99.2 |
 1
2014 4Q Earnings Release Slides
Cautionary Statements Regarding Forward-Looking Information
This presentation contains certain forward-looking statements within the
meaning of the Private Securities Litigation Reform Act of 1995, that are
subject to risks and uncertainties. The factors that could cause actual
results to differ materially from the forward-looking statements
made by Exelon Corporation, Commonwealth Edison Company,
PECO
Energy
Company,
Baltimore
Gas
and
Electric
Company
and
Exelon
Generation Company, LLC (Registrants) include those factors discussed herein,
as well as the items discussed in (1) Exelon’s 2014 Annual
Report on Form 10-K (to be filed on February 13, 2015) in (a) ITEM
1A. Risk Factors, (b) ITEM 7. Management’s Discussion and Analysis
of Financial Condition and Results of Operations and (c) ITEM 8.
Financial Statements and Supplementary Data: Note 22 and (2) other factors
discussed in filings with the SEC by the Registrants. Readers are cautioned not
to place undue reliance on these forward-looking statements, which
apply only as of the date of this presentation. None of the Registrants
undertakes any obligation to publicly release any revision to its
forward-looking statements to reflect events or circumstances after
the date of this presentation. |
 2014 4Q Earnings Release Slides
2
•
Utilities
•
Top decile for safety; top quartile for
outage frequency
•
ExGen
•
Nuclear capacity factor over 94%
(2)
•
Power dispatch match nearly 97%
and renewables energy capture of
95%
•
2014 adjusted operating results of
$2.39/share
(1)
•
Total shareholder return of 41%
•
Successful ~$3B billion forward equity
and mandatory convertible offering
•
$75M in total savings from
consolidation of CENG plants
(3)
•
$675M ExGen Texas Power Financing
2014 In Review
(1)
Represents adjusted (non-GAAP) operating EPS. Refer to the Earnings
Release Attachments for additional details and to the Appendix for a reconciliation of adjusted (non-GAAP) operating
EPS to GAAP EPS.
(2)
Exelon operated plants at ownership
(3)
Total CapEx and O&M savings from consolidation. Includes EDF’s equity
ownership share of the CENG Joint Venture •
Delivered solid 2014 results at the mid-point of our guidance range
Financial
Discipline
Operational
Excellence
Growth
Investments
Regulatory
Advocacy
•
Utilities
•
$3.1 billion invested in technology
and infrastructure
•
PHI Acquisition
•
ExGen
•
Integrys and ProLiance Acquisitions
•
Texas CCGTs, Bloom & NetPower
partnership
•
Added 215 MW of clean generation
•
ComEd and BGE rate cases:
•
3
rd
consecutive rate case in which
ComEd
achieved
95%
of
its
ask
•
1
st
rate case settlement for BGE
since 1999
•
ExGen
•
HR 1146
•
Capacity Performance Product
•
EPA’s Clean Power Plan (111(d)) |
 3
2014 4Q Earnings Release Slides
HoldCo
ExGen
ComEd
PECO
BGE
HoldCo
ExGen
ComEd
PECO
BGE
2015 Guidance
$2.25 -
$2.55
(2)
$1.15 -
$1.35
$0.45 -
$0.55
$0.35 -
$0.45
$0.20 -
$0.30
$2.39
(1)
$1.34
$0.47
$0.41
$0.23
2015 Adjusted Operating Earnings Guidance
(1)
2014 results based on 2014 average outstanding shares of 864M. Refer to
Earnings Release Attachments for additional details and to the Appendix for a reconciliation of
adjusted (non-GAAP) operating EPS to GAAP EPS.
(2)
2015 earnings guidance based on expected average outstanding shares of ~866M. Earnings guidance for OpCos may not add up to consolidated EPS guidance. Refer to
the Appendix for a reconciliation of adjusted (non-GAAP) operating EPS
guidance to GAAP EPS. Expect
Q1
2015
Adjusted
Operating
Earnings
of
$0.60
-
$0.70
per
share
2014 Actual
Key Year-Over-Year Drivers
•
Total impact of asset divestitures:
$(0.12)
•
Additional planned nuclear outage
$(0.02)
•
ExGen Pension/OPEB: $(0.02)
•
ComEd: increased capital
investments in distribution and
transmission partially offset by
lower US Treasury Yields: $0.03
•
Capacity Prices: $0.07
•
Full year elimination of DOE fee:
$0.04 |
 4
2014 4Q Earnings Release Slides
Adjusted O&M Forecast
(2)
•
2015 forecast of $7.225B
(1)
•
Expect CAGR of ~0.2 % for
2015-2017
2015E
$7,225
(1)
$4,525
$1,250
$750
$775
2014 Actuals
$6,950
(1)
$4,350
$1,200
$750
$725
(in $M)
ExGen
ComEd
ComEd
PECO
PECO
BGE
Corp
(1)
Refer to the Appendix for a reconciliation of adjusted (non-GAAP) O&M
to GAAP O&M. Further, the Utilities adjusted O&M excludes regulatory O&M costs that are P&L neutral. ExGen adjusted
O&M excludes direct cost of sales for certain Constellation businesses,
P&L neutral decommissioning costs and the impact from O&M related to variable interest entities.
(2)
All amounts rounded to the nearest $25M.
(3)
Prior
to
consolidation
on
April
1,
2014,
CENG
was
under
the
equity
method
of
accounting.
CENG
0&M
prior
to
consolidation
is
not
included.
ExGen
(3)
BGE
Key Year-over-Year Drivers
(2)
•
Growth including Integrys & full
year of CENG: $250M
•
Inflation: $125M
•
Plant Divestitures: $(100M)
•
Pension/OPEB: $50M
•
PECO Storm Costs:
$(50M)
•
BGE & ComEd Storm Costs: $25M
Corp
-75
-75 |
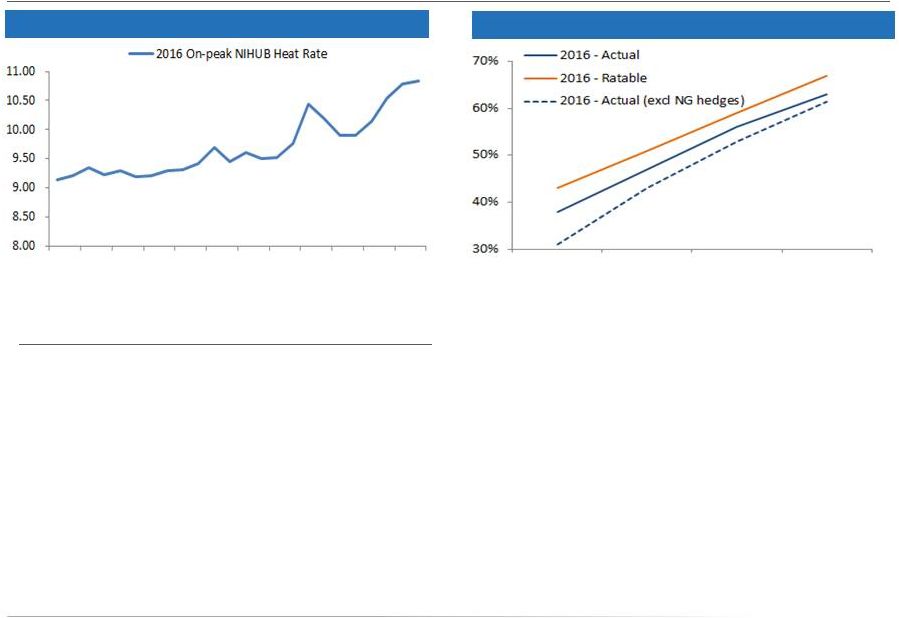 5
2014 4Q Earnings Release Slides
Hedging Activity and Market Fundamentals
Heat Rates have expanded throughout 2014
% of Expected Generation Hedged
(1)
Total Portfolio
(1)
Mid-point of disclosed hedge % ranges was used
Impacts of our view on our hedging activity
•
Over the last several quarters, power prices have increased and heat rates have
expanded •
We have adjusted our strategy by reducing our long heat rate position and
increasing our fixed-price length where we see remaining upside
•
During 4Q, we lowered our cross-commodity hedges monetizing our long heat
rate view as heat rates expanded
but
continued
to
stay
behind
ratable
by
carrying
a
long
fixed-price
position
1Q13
2Q13
3Q13
4Q13
1Q14
2Q14
3Q14
4Q14
1Q14
2Q14
3Q14
4Q14 |
 6
2014 4Q Earnings Release Slides
Exelon Generation: Gross Margin Update
December 31, 2014
Change from Sept 30, 2014
Gross Margin Category ($M)
(1)
2015
2016
2017
2015
2016
2017
Open Gross Margin
(3)
(including South, West, Canada hedged gross
margin)
$5,700
$5,850
$6,100
$(1,050)
$(650)
$(550)
Mark-to-Market of Hedges
(3,4)
$1,050
$550
$350
$1,050
$400
$200
Power New Business / To Go
$350
$550
$800
$(50)
-
$50
Non-Power Margins Executed
$200
$100
$50
$100
$50
-
Non-Power New Business / To Go
$250
$350
$400
$(50)
-
$50
Total Gross Margin
(2)
$7,550
$7,400
$7,700
-
$(200)
$(250)
•
Load
serving
business
had
strong
2014
and
is
off
to
a
good
start
in
2015
•
Cleared 195MW of new peaking generation in ISO-NE Forward Capacity Auction
9. Expected to be online in mid-2018
•
Natural gas and power prices declined during the fourth quarter
•
Aggressively hedged our PJM East and New England Portfolios in early Q4 when
prices were higher
Recent Developments
4)
Mark to Market of Hedges assumes mid-point of hedge percentages.
Note: Inclusive of all asset divestitures as of December 31, 2014 and
Quail Run, as well as the Integrys acquisition.
1)
Gross margin categories rounded to nearest $50M.
2)
Total Gross Margin (Non-GAAP) is defined as operating revenues less
purchased power and fuel expense, excluding revenue related to
decommissioning, gross receipts tax, Exelon Nuclear Partners, operating
services agreement with Fort Calhoun and variable interest entities.
Total Gross Margin is also net of direct cost of sales for certain Constellation
businesses. See Slide 36
for a Non-GAAP to GAAP reconciliation of Total Gross Margin.
3)
Excludes EDF’s equity ownership share of the CENG Joint Venture |
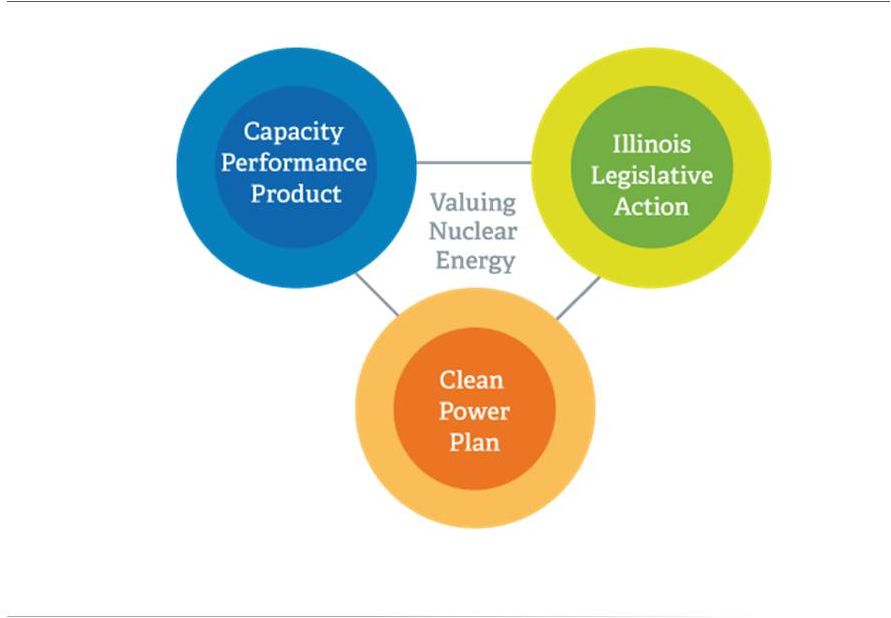 7
2014 4Q Earnings Release Slides
Properly Valuing Nuclear Energy |
 8
2014 4Q Earnings Release Slides
Exelon Generation Disclosures
December 31, 2014 |
 9
2014 4Q Earnings Release Slides
Portfolio Management Strategy
Protect Balance Sheet
Ensure Earnings Stability
Create Value
Exercising Market Views
Purely ratable
Actual hedge %
Market views on timing, product
allocation and regional spreads
reflected in actual hedge %
High End of Profit
Low End of Profit
% Hedged
Open Generation
with LT Contracts
Portfolio Management &
Optimization
Portfolio Management Over Time
Align Hedging & Financials
Establishing Minimum Hedge Targets
•Aligns hedging program with
financial policies and financial
outlook
•Establish minimum hedge targets
to meet financial objectives of the
company (dividend, credit rating)
•Hedge enough commodity risk to
meet future cash requirements
under a stress scenario
•Ensure stability in near-term cash
flows and earnings
•Disciplined approach to hedging
•Tenor aligns with customer
preferences and market liquidity
•Multiple channels to market that
allow us to maximize margins
•Large open position in outer years
to benefit from price upside
•Ability to exercise fundamental
market views to create value within
the ratable framework
•Modified timing of hedges versus
purely ratable
•Cross-commodity hedging (heat
rate positions, options, etc.)
•Delivery locations, regional and
zonal spread relationships
Credit Rating
Capital
Structure
Capital &
Operating
Expenditure
Dividend
Strategic Policy Alignment
Three-Year Ratable Hedging
Bull / Bear Program |
 10
2014 4Q Earnings Release Slides
Components of Gross Margin Categories
Margins move from new business to MtM of hedges over
the course of the year as sales are executed
(5)
Margins move from “Non power new business”
to
“Non power executed”
over the course of the year
Gross margin linked to power production and sales
Gross margin from
other business activities
Open Gross
Margin
MtM of
Hedges
(2)
“Power”
New
Business
“Non Power”
Executed
“Non Power”
New Business
•Generation Gross
Margin at current
market prices,
including capacity
and ancillary
revenues, nuclear
fuel amortization and
fossils fuels expense
•Exploration and
Production
(4)
•Power Purchase
Agreement (PPA)
Costs and Revenues
•Provided at a
consolidated level for
all regions (includes
hedged gross margin
for South, West and
Canada
(1)
)
•Mark to Market
(MtM) of power,
capacity and
ancillary hedges,
including cross
commodity, retail
and wholesale load
transactions
•Provided directly at
a consolidated level
for five major
regions. Provided
indirectly for each
of the five major
regions via Effective
Realized Energy
Price (EREP),
reference price,
hedge %, expected
generation
•Retail, Wholesale
planned electric
sales
•Portfolio
Management
new business
•Mid marketing
new business
•Retail, Wholesale
executed gas sales
•Load Response
•Energy Efficiency
(4)
•BGE Home
(4)
•Distributed Solar
•Retail, Wholesale
planned gas sales
•Load Response
•Energy Efficiency
(4)
•BGE Home
(4)
•Distributed Solar
•Portfolio
Management /
origination fuels new
business
•Proprietary trading
(3)
(1)
Hedged gross margins for South, West & Canada region will be included with
Open Gross Margin, and no expected generation, hedge %, EREP or reference prices provided for this region
(2)
MtM of hedges provided directly for the five larger regions; MtM of hedges is
not provided directly at the regional level but can be easily estimated using EREP, reference price and hedged MWh
(3)
Proprietary trading gross margins will generally remain within “Non
Power” New Business category and only move to “Non Power” Executed category upon management discretion
(4)
Gross margin for these businesses are net of direct “cost of sales”
(5)
Margins for South, West & Canada regions and optimization of fuel and PPA
activities captured in Open Gross Margin |
 11
2014 4Q Earnings Release Slides
ExGen Disclosures
Gross Margin Category ($M)
(1)
2015
2016
2017
Open Gross Margin
(including South, West & Canada hedged GM)
$5,700
$5,850
$6,100
Mark to Market of Hedges
(3,4)
$1,050
$550
$350
Power New Business / To Go
$350
$550
$800
Non-Power Margins Executed
$200
$100
$50
Non-Power New Business / To Go
$250
$350
$400
Total
Gross
Margin
$7,550
$7,400
$7,700
(1)
Gross margin categories rounded to nearest $50M
(2)
Total Gross Margin (Non-GAAP) is defined as operating revenues less
purchased power and fuel expense, excluding revenue related to
decommissioning, gross receipts tax, Exelon Nuclear Partners, operating
services agreement with Fort Calhoun and variable interest entities.
Total Gross Margin is also net of direct cost of sales for certain
Constellation businesses. See Slide 36 for a Non-GAAP to GAAP reconciliation of Total
Gross Margin
(3)
Excludes EDF’s equity ownership share of the CENG Joint Venture Reference Prices
(5)
2015
2016
2017
Henry Hub Natural Gas ($/MMbtu)
$3.03
$3.46
$3.76
Midwest: NiHub ATC prices ($/MWh)
$30.13
$30.96
$31.98
Mid-Atlantic: PJM-W ATC prices ($/MWh)
$37.76
$37.74
$37.83
ERCOT-N ATC Spark Spread ($/MWh)
HSC Gas, 7.2HR, $2.50 VOM
$6.38
$6.10
$5.93
New York: NY Zone A ($/MWh)
$36.12
$36.79
$36.64
New England: Mass Hub ATC Spark Spread($/MWh)
ALQN Gas, 7.5HR, $0.50 VOM
$10.25
$9.08
$8.02
(4)
Mark to Market of Hedges assumes mid-point of hedge percentages
(5)
Based on December 31, 2014 market conditions
(6)
Inclusive of all asset divestitures as of December 31, 2014, and Quail Run, as
well as Integrys acquisition (2,6) |
 12
2014 4Q Earnings Release Slides
ExGen Disclosures
Generation and Hedges
2015
2016
2017
Exp. Gen (GWh)
(1)
191,200
192,400
196,800
Midwest
97,100
97,400
95,900
Mid-Atlantic
(2)
62,400
62,900
60,700
ERCOT
16,800
17,300
25,700
New York
(2)
9,300
9,300
9,300
New England
5,600
5,500
5,200
% of Expected Generation Hedged
(3)
61%-64%
31%-34%
Midwest
88%-91%
55%-58%
23%-26%
Mid-Atlantic
(2)
99%-102%
67%-70%
36%-39%
ERCOT
94%-97%
77%-80%
48%-51%
New York
(2)
84%-87%
60%-63%
38%-41%
New England
118%-121%
68%-71%
32%-35%
Effective Realized Energy Price ($/MWh)
(4)
Midwest
$34.00
$34.50
$36.00
Mid-Atlantic
(2)
$45.00
$45.00
$47.00
ERCOT
(5)
$10.50
$7.50
$7.00
New York
(2)
$47.50
$43.50
$40.00
New England
(5)
$21.00
$14.50
$9.00
(1) Expected generation is the volume of energy that best represents our
commodity position in energy markets from owned or contracted for capacity based upon a simulated
dispatch model that makes assumptions regarding future market conditions, which
are calibrated to market quotes for power, fuel, load following products, and options.
Expected generation assumes 14 refueling outages in 2015, 12 in 2016, and 15 in
2017 at Exelon-operated nuclear plants, and Salem. Expected generation assumes
capacity factors of 93.5%, 94.1% and 93.4% in 2015 , 2016 and 2017
respectively at Exelon-operated nuclear plants, at ownership. These estimates of expected generation in
2015, 2016 and 2017 do not represent guidance or a forecast of future results
as Exelon has not completed its planning or optimization processes for those years. (2)
Excludes EDF’s equity ownership share of CENG Joint Venture. (3) Percent
of expected generation hedged is the amount of equivalent sales divided by expected
generation. Includes all hedging products, such as wholesale and retail
sales of power, options and swaps. (4) Effective realized energy price is representative of an all-in
hedged price, on a per MWh basis, at which expected generation has been
hedged. It is developed by considering the energy revenues and costs associated with our hedges
and by considering the fossil fuel that has been purchased to lock in margin.
It excludes uranium costs and RPM capacity revenue, but includes the mark-to-market value of
capacity contracted at prices other than RPM clearing prices including our load
obligations. It can be compared with the reference prices used to calculate open gross margin in
order to determine the mark-to-market value of Exelon Generation's
energy hedges. (5) Spark spreads shown for ERCOT and New England. (6) Inclusive of all asset divestitures
as of December 31,2014 and Quail Run, as well as Integrys acquisition
93%-96% |
 13
2014 4Q Earnings Release Slides
ExGen Hedged Gross Margin Sensitivities
Gross Margin Sensitivities (With Existing Hedges)
(1)
2015
2016
2017
Henry Hub Natural Gas ($/Mmbtu)
+ $1/Mmbtu
$25
$340
$730
-
$1/Mmbtu
$35
$(310)
$(710)
NiHub ATC Energy Price
+ $5/MWh
$35
$215
$370
-
$5/MWh
$(30)
$(215)
$(365)
PJM-W ATC Energy Price
+ $5/MWh
$(5)
$105
$205
-
$5/MWh
$10
$(100)
$(205)
NYPP Zone A ATC Energy Price
+ $5/MWh
$ -
$10
$25
-
$5/MWh
$(5)
$(15)
$(30)
Nuclear Capacity Factor
+/-
1%
+/-
$40
+/-
$45
+/-
$45
(1)
Based on December 31, 2014 market conditions and hedged position; Gas price
sensitivities are based on an assumed gas-power relationship derived from an internal model
that is updated periodically; Power prices sensitivities are derived by
adjusting the power price assumption while keeping all other prices inputs constant; Due to correlation of the
various assumptions, the hedged gross margin impact calculated by aggregating
individual sensitivities may not be equal to the hedged gross margin impact calculated when
correlations between the various assumptions are also considered; Sensitivities
based on commodity exposure which includes open generation and all committed transactions;
Excludes EDF’s equity share of CENG Joint Venture; Inclusive of all asset
divestitures as of December 31, 2014, and Quail Run, as well as Integrys acquisition |
 14
2014 4Q Earnings Release Slides
ExGen Hedged Gross Margin Upside/Risk
$7,800
$7,250
$8,350
$6,650
5,000
5,500
6,000
6,500
7,000
7,500
8,000
8,500
9,000
9,500
10,000
10,500
11,000
2015
2016
2017
$9,950
$6,050
14
2014 4Q Earnings Release Slides
(1)
Represents an approximate range of expected gross margin, taking into account
hedges in place, between the 5th and 95th percent confidence levels assuming
all unhedged supply is sold into the spot market; Approximate gross margin
ranges are based upon an internal simulation model and are subject to change based
upon market inputs, future transactions and potential modeling changes; These
ranges of approximate gross margin in 2015, 2016 and 2017 do not represent
earnings guidance or a forecast of future results as Exelon has not completed
its planning or optimization processes for those years; The price distributions that
generate this range are calibrated to market quotes for power, fuel, load
following products, and options as of December 31, 2014 (2) Gross Margin Upside/Risk based on commodity
exposure which includes open generation and all committed transactions
(3)
Gross Margin (Non-GAAP) is defined as operating revenues less purchased
power and fuel expense, excluding revenue related to decommissioning, gross
receipts tax, Exelon Nuclear Partners, operating services agreement with Fort
Calhoun and variable interest entities. Total Gross Margin is also net of direct cost
of sales for certain Constellation businesses. See Slide 36 for a
Non-GAAP to GAAP reconciliation of Total Gross Margin Excludes EDF’s equity ownership share of
the CENG Joint Venture
(4)
Inclusive of all asset divestitures as of December 31, 2014 and Quail Run, as
well as Integrys acquisition |
 15
2014 4Q Earnings Release Slides
Illustrative Example of Modeling Exelon
Generation
2016 Gross Margin
Row
Item
Midwest
Mid-
Atlantic
ERCOT
New York
New
England
South,
West &
Canada
(A)
Start with fleet-wide open gross margin
$5.85 billion
(B)
Expected Generation (TWh)
97.4
62.9
17.3
9.3
5.5
(C)
Hedge % (assuming mid-point of range)
56.5%
68.5%
78.5%
61.5%
69.5%
(D=B*C)
Hedged Volume (TWh)
55.0
43.1
13.6
5.7
3.8
(E)
Effective Realized Energy Price ($/MWh)
34.50
45.00
7.50
43.50
14.50
(F)
Reference Price ($/MWh)
30.96
37.74
6.10
36.79
9.08
(G=E-F)
Difference ($/MWh)
3.54
7.26
1.40
6.71
5.42
(H=D*G)
Mark-to-market value of hedges ($ million)
(1)
195
315
20
40
20
(I=A+H)
Hedged Gross Margin ($ million)
$6,400
(J)
Power New Business / To Go ($ million)
$550
(K)
Non-Power Margins Executed ($ million)
$100
(L)
Non-
Power New Business / To Go ($ million)
$350
(N=I+J+K+L)
Total Gross Margin
(2)
$7,400 million
(1)
Mark-to-market rounded to the nearest $5 million
(2)
Total Gross Margin (Non-GAAP) is defined as operating revenues less
purchased power and fuel expense, excluding revenue related to decommissioning, gross receipts
tax, Exelon Nuclear Partners, operating services agreement with Fort Calhoun
and variable interest entities. Total Gross Margin is also net of direct cost of sales for certain
Constellation businesses. See Slide 36 for a Non-GAAP to GAAP reconciliation of Total Gross Margin
Note: Inclusive of all asset divestitures as of December 31, 2014, and
Quail Run as well as Integrys acquisition |
 16
2014 4Q Earnings Release Slides
Additional Disclosures |
 17
2014 4Q Earnings Release Slides
2014 Adjusted Operating Earnings by Quarter
$ 0.30
$ 0.27
$ 0.27
$ 0.15
$ 0.50
$ 0.13
$ 0.11
$ 0.09
$ 0.10
$ 0.10
$ 0.11
$ 0.09
$ 0.06
$ 0.05
$ 0.10
ExGen
BGE
ComEd
PECO
Q4
$0.48
Q3
$0.78
Q2
$0.51
$ 0.02
Q1
$0.62
Refer to the Earnings Release Attachments for additional details and to the
Appendix for a reconciliation of adjusted (non-GAAP) operating EPS to GAAP EPS
Amounts may not add due to rounding |
 18
2014 4Q Earnings Release Slides
Exelon Utilities Adjusted Operating EPS Contribution
(1)
Key
Drivers
–
4Q14
vs.
4Q13
:
BGE
(+0.00):
•
Higher RNF offset by higher O&M: $(0.00)
PECO (-0.01):
•
Unfavorable weather conditions: $(0.01)
ComEd
(-0.04):
•
Impact of bonus depreciation on ComEd’s distribution and
transmission
(2)
earnings: $(0.02)
•
Unfavorable
weather
conditions
and
volume
(2)
:
$(0.01)
$0.13
4Q 2014
$0.26
$0.06
$0.11
$0.09
4Q 2013
$0.31
$0.06
$0.12
ComEd
PECO
BGE
(1)
(2)
Due to the distribution formula rate, changes in ComEd’s earnings are
driven primarily by changes in 30-year U.S. Treasury rates (inclusive of ROE), rate base and capital structure
in addition to weather, load and changes in customer mix.
Refer to the Earnings Release Attachments for additional details and to the
Appendix for a reconciliation of adjusted (non-GAAP) operating EPS to GAAP EPS.
Numbers may not add due to rounding.
|
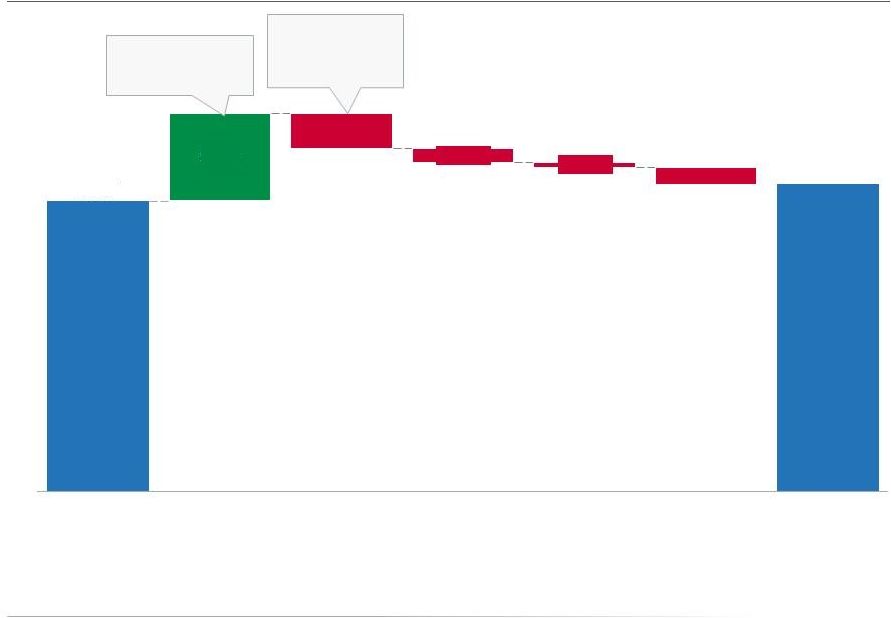 19
2014 4Q Earnings Release Slides
$0.45 -
$0.55
Other
($0.02)
Depreciation &
Amortization
($0.02)
O&M
(3)
($0.06)
RNF
(2)
2014
(1)
($0.01)
2015
(4)(5)
ComEd Adjusted Operating EPS Bridge 2014 to 2015
Interest
$0.14
$0.47
$0.11
Distribution
$0.02
Transmission
$0.01
Weather/Volumes
($0.01)
Storm
($0.02)
Inflation
($0.01)
Pension/OPEB
($0.01)
Other
(1) Refer to the Earnings Release Attachments for additional details and to the
Appendix for a reconciliation of adjusted (non-GAAP) operating EPS to GAAP EPS.
(2) Revenue net fuel (RNF) is defined as operating revenues less purchased
power and fuel expense.
(3) O&M excludes regulatory items that are P&L neutral.
(4) Shares Outstanding (diluted) are 866M in 2015 and 864M in 2014. Refer to slide 33 for a reconciliation of adjusted (non-GAAP) operating EPS guidance to GAAP EPS.
(5) Guidance assumes an effective tax rate for 2015 of 39.5%.
Note: Drivers add up to mid-point of 2015 adjusted operating EPS
range. |
 20
2014 4Q Earnings Release Slides
$0.41
RNF
(2)
($0.00)
2015
(4)(5)
$0.35 -
$0.45
Tax
($0.02)
Interest
($0.00)
Depreciation &
Amortization
(0.00)
O&M
(3)
$0.01
PECO Adjusted Operating EPS Bridge 2014 to 2015
2014
(1)
($0.02) Storm Tax Repairs
Benefit
$0.03 Storm
($0.01) Inflation
($0.01) Operational/IT Increases
Note: Drivers add up to mid-point of 2015 adjusted operating EPS range.
(1) Refer to the Earnings Release Attachments for additional details and to the
Appendix for a reconciliation of adjusted (non-GAAP) operating EPS to GAAP EPS.
e
(2) Revenue net fuel (RNF) is defined as operating revenues less purchased
power and fuel expense. (3) O&M excludes regulatory items that are P&L neutral.
(4) Shares Outstanding (diluted) are 864M in 2014 and
866M in 2015. Refer to slide 33 for a reconciliation of adjusted (non-GAAP) operating EPS guidance to GAAP EPS.
(5) Guidance assumes an effective tax rate for 2015 of
28.5%.
|
 21
2014 4Q Earnings Release Slides
$0.05
$0.23
Other
O&M
(3)
($0.04)
RNF
(2)
2014
(1)
$0.20 -
$0.30
$0.01
2015
(4)(5)
BGE Adjusted Operating EPS Bridge 2014 to 2015
($0.01) Storm Costs
($0.01) Preventative Maintenance
($0.01) Inflation
($0.01) Other
$0.04 Pricing/Mix
$0.01 Other RNF
Note: Drivers add up to mid-point of 2015 adjusted operating EPS range.
(1) Refer to the Earnings Release Attachments for additional details and
to the Appendix for a reconciliation of adjusted (non-GAAP) operating EPS to GAAP EPS.
(2) Revenue net fuel (RNF) is defined as operating revenues less purchased
power and fuel expense. (3) O&M excludes regulatory items that are
P&L neutral. (4) Shares Outstanding (diluted) are 864M in 2014 and 866M in 2015. Refer to slide 33 for a reconciliation of adjusted (non-GAAP) operating EPS guidance to GAAP EPS.
(5) Guidance assumes an effective tax rate for 2015 of
39.2%. |
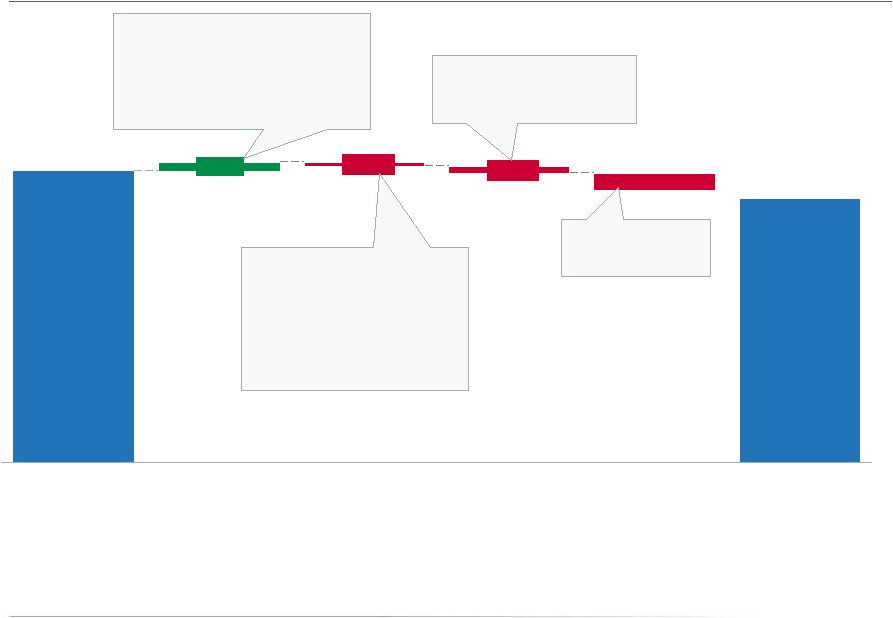 22
2014 4Q Earnings Release Slides
$0.08
$1.34
$1.15 -
$1.35
Other
2015
(5)(6)
Depreciation &
Amortization
(4)
$0.04
2014
(1)
Gross Margin
(2)
($0.03)
O&M
(3)
($0.02)
ExGen Adjusted Operating EPS Bridge 2014 to 2015
$0.22 Higher Capacity Revenue, Higher retail
volumes (primarily Integrys), Plant Performance
and Market Conditions
$0.04 Impact of full year DOE fee removal
($0.22) Plant Divestitures
($0.05) Depreciation Additions
$0.03 Plant Divestitures
($0.06) Generation Growth, including
Integrys
($0.05) Inflation
($0.02) Pension / OPEB
($0.02) Nuclear Outages
$0.07 Plant Divestitures
$0.02 Other Divestitures
$0.01 Asbestos Reserve
$0.03 Other
($0.05) Interest
($0.04) Decom, primarily
unregulated realized gains
Note: Drivers add up to mid-point of 2015 adjusted operating EPS range.
(1)
Refer to the Earnings Release Attachments for additional details and to the
Appendix for a reconciliation of adjusted (non-GAAP) operating EPS to GAAP EPS.
(2)
(3)
Gross Margin (Non-GAAP) is defined as operating revenues less purchased
power and fuel expense, excluding revenue related to decommissioning, gross receipts tax, Exelon Nuclear Partners, operating
services agreement with Fort Calhoun and variable interest entities. Total
Gross Margin is also net of direct cost of sales for certain Constellation businesses. See Slide 36 for a Non-GAAP to GAAP
reconciliation of Total Gross Margin.
(4)
O&M excludes items that are P&L neutral (including
decommissioning costs and variable interest entities) and direct cost of sales for certain Constellation businesses.
(5)
Depreciation & Amortization excludes cost of sales for certain
Constellation businesses, which are included in gross margin
(6)
Shares Outstanding (diluted) are 864M in 2014 and 866M in 2015. Refer to slide
33 for a reconciliation of adjusted (non-GAAP) operating EPS guidance to GAAP EPS.
(7)
Guidance assumes an effective tax rate for 2015 of 26%.
2014 Income statement categories have been normalized for a full year comparison
of CENG at ownership (50.01) (
) |
 23
2014 4Q Earnings Release Slides
2015 Projected Sources and Uses of Cash
($ in millions)
(1)
BGE
ComEd
PECO
ExGen
Exelon
(3)
2015E
Beginning Cash Balance
3,575
Adjusted Cash Flow from Operations
(4)
600
2,075
600
3,400
6,775
CapEx (excluding other items below):
(675)
(1,875)
(525)
(1,925)
(5,100)
Nuclear Fuel
n/a
n/a
n/a
(1,125)
(1,125)
Dividend
(5)
(1,075)
Nuclear Uprates
n/a
n/a
n/a
(100)
(100)
Wind
n/a
n/a
n/a
(100)
(100)
Solar
n/a
n/a
n/a
(125)
(125)
Upstream
n/a
n/a
n/a
(25)
(25)
Utility Smart Grid/Smart Meter
(25)
(325)
(25)
n/a
(400)
Net Financing (excluding Dividend):
Debt Issuances
250
700
350
750
2,050
Debt Retirements
(75)
(250)
0
(550)
(1,675)
Project Finance/Federal Financing Bank
Loan
n/a
n/a
n/a
200
200
Other Financing
(6)
0
(50)
0
1,075
1,250
Ending Cash Balance
4,125
(1)
All amounts rounded to the nearest $25M.
(2)
Excludes counterparty collateral posted of $1.7 billion at 12/31/2014. In addition, the
12/31/2015 ending cash balance does not include collateral.
(3)
Includes cash flow activity from Holding Company and other corporate entities. (4)
Adjusted Cash Flow from Operations (non-GAAP) primarily includes net cash flows from
operating activities and net cash flows from investing activities excluding capital expenditures.
(5)
Dividends are subject to declaration by the Board of Directors.
(6)
“Other Financing” primarily includes expected changes in short-term debt. (2)
(2) |
 24
2014 4Q Earnings Release Slides
Additional 2015 ExGen Modeling
P&L Item
2015 Estimate
ExGen Model Inputs
O&M
(2)
$4,525M
Taxes Other Than Income (TOTI)
(3)
$350M
Depreciation & Amortization
(4)
$925M
Interest Expense
$400M
(1)
ExGen amounts for O&M, TOTI and Depreciation & Amortization; excludes EDF’s equity ownership share of the CENG Joint Venture
(2)
ExGen adjusted O&M excludes direct cost of sales for certain Constellation
business, P&L neutral decommissioning costs and the impact from O&M related to variable interest entities.
Refer to the Appendix for a reconciliation of adjusted (non-GAAP) O&M
to GAAP O&M (3)
TOTI excludes gross receipts tax for retail of $125M.
(4)
ExGen Depreciation & Amortization excludes the cost of sales impact of
ExGen’s non-power businesses of $25. (1)
|
 25
2014 4Q Earnings Release Slides
2015 Regulatory and Legislative Timelines
ExGen
Exelon Utilities
PHI Acquisition
Illinois
Legislative
Session
Begins
(Jan 14)
Cert Petition
Filed in
EPSA v.
FERC (Order
745 –
Demand
Response)
(Jan 15)
Supreme
Court
decision on
cert in
EPSA v.
FERC
(Demand
Response)
(March-
April)
Supreme
Court
hearing on
Michigan v.
EPA
(MATS)
(March-
April)
FERC Ruling
on PJM
Capacity
Performance
Proposal
(April)
MATS Rule
in Effect
(April)
PJM BRA
Auction
(May 11)
PJM BRA
Auction
Results
(May 22)
Illinois
Legislative
Session
Adjourns
(May 31)
Supreme
Court
Decision in
Michigan
vs. EPA
(June)
Final Clean
Power Rule
(111d)
Issued
(Mid-
Summer)
Illinois
Legislative
Veto
Session
(Nov)
ComEd Formula Rate Filing
(April)
BGE Electric and Gas Rate
Case Filing (TBD) MD PSC
Ruling Expected 7 Months
after Filing
PECO Electric Rate Case
Filing (TBD) PaPUC Ruling
Expected within 9 Months of
Filing
ICC Rules on ComEd
Formula Rate Filing (Dec)
Settlement
Filed in New
Jersey (Jan 14)
Maryland
Hearings (Jan
26 –
Feb 6)
New Jersey
Approval
(Feb 11)
DC Hearings
(March 30-
April 8)
Maryland
Deadline (April
8)
Expected
Transaction
Close (Q2/Q3) |
 Exelon Utilities Load
2015E
2014
Large C&I
Small C&I
Residential
All Customers
2015E
2014
2014
2015E
Chicago GMP
1.6%
Chicago Unemployment
5.9%
Philadelphia GMP
0.8%
Philadelphia Unemployment
4.8%
Baltimore GMP
1.4%
Baltimore Unemployment
5.5%
Notes: Data is not adjusted for leap year. Source of economic outlook
data is Global Insight (December 2014 ) and Bureau of Economic Analysis. Assumes 2014 GDP of 2.4% and U.S.
unemployment of 5.6%.ComEd has the ROE collar as part of the distribution
formula rate and BGE is decoupled which mitigates the load risk. QTD and YTD actual data can be found in
earnings release tables. BGE amounts have been adjusted for unbilled /
true-up load from prior quarters ComEd
PECO
BGE
2015 load growth is similar to
2014, driven by slowly
improving economic conditions
and partially offset by energy
efficiency
2015 load growth is driven by
modest economic growth
coupled with increased shale
gas transportation and
production, partially offset by
energy efficiency
2015 load growth rate is
driven by weaker economic
conditions, primarily
reflected in residential and
small C&I, further decreased
by energy efficiency
0.4%
0.2%
0.8%
0.3%
0.4%
-0.3%
-0.1%
0.7%
0.8%
0.1%
0.4%
0.5%
-0.7%
0.0%
1.9%
-0.1%
-1.3%
-0.2%
-0.9%
-2.4%
0.1%
0.6%
-1.9%
-0.5%
26
2014 4Q Earnings Release Slides |
 27
2014 4Q Earnings Release Slides
ComEd April 2014 Distribution Formula Rate
Note: Disallowance of any items in the 2014 distribution formula rate
filing could impact 2014 earnings in the form of a regulatory asset adjustment. Total disallowances in the 2014
distribution formula rate filing include items that are recoverable via other
ratemaking mechanisms. Given the retroactive ratemaking provision in the
Energy Infrastructure Modernization Act (EIMA) legislation, ComEd net income during the year will
be based on actual costs with a regulatory asset/liability recorded to reflect
any under/over recovery reflected in rates. Revenue Requirement in
rate filings impacts cash flow.
The 2014 distribution formula rate filing established the net revenue requirement
used to set the rates that took effect in January 2015 after the Illinois
Commerce Commission's (ICC’s) review. There are two components to the annual
distribution formula rate filing: Filing Year: Based on prior year costs
(2013) and current year (2014) projected plant additions. Annual
Reconciliation:
For
the
prior
calendar
year
(2013),
this
amount
reconciles
the
revenue
requirement
reflected
in
rates
during
the
prior
year
(2013)
in
effect
to
the
actual
costs
for
that
year.
The
annual
reconciliation
impacts
cash
flow
in
the
following
year
(2015)
but
the earnings
impact has been recorded in the prior year (2013) as a regulatory asset.
|
 28
2014 4Q Earnings Release Slides
BGE Rate Case Settlement
(1)
Due to the “black box”
nature of the settlement, the Common Equity Ratio, Authorized Returns, and
Proposed Rate Base (adjusted) were not agreed upon by the parties in determining the
ultimate revenue requirement increase
(2)
Reflects BGE’s actual capital structure as of 8/31/2014
(3)
ROE and ROR stated in the settlement only apply to AFUDC and carrying costs on
regulatory assets (4)
BGE’s Proposed Adjusted rate base
First BGE rate case settlement agreement since 1999
Electric
Gas
Docket #
9355
Test Year
Common
Equity
Ratio
(1)(2)
52.3%
Authorized
Returns
(1)(3)
ROE: 9.75%; ROR: 7.46%
ROE: 9.65%; ROR: 7.41%
Requested Rate of Return
7.93%
7.88%
Proposed
Rate
Base
(adjusted)
(1)(4)
$2.9B
$1.2B
Revenue Requirement Increase
$22.0M
$38.0M
Distribution Increase as % of
overall bill
1%
5%
Timeline
•
07/02/14 BGE filed application with the MDPSC seeking increases in electric &
gas distribution base rates
•
210 Day Proceeding
•
7/08/14 –
Case delegated to the Public Utility Law Judge Division
•
10/17/14
–
BGE
filed
unanimous
“black
box”
settlement
with
MD
PSC
which
was approved by
the PSC
•
Increased rates effective with service on or after December 15, 2014
September 2013 - August 2014
|
 29
2014 4Q Earnings Release Slides
Appendix
Reconciliation of Non-GAAP
Measures |
 30
2014 4Q Earnings Release Slides
4Q GAAP EPS Reconciliation
Three Months Ended December 31, 2014
ExGen
ComEd
PECO
BGE
Other
Exelon
2014 Adjusted (non-GAAP) Operating Earnings (Loss) Per Share
$0.27
$0.09
$0.11
$0.06
$(0.04)
$0.48
Mark-to-market impact of economic hedging activities
(0.08)
-
-
-
-
(0.08)
Unrealized losses related to NDT fund investments
0.03
-
-
-
-
0.03
Merger and integration costs
(0.01)
-
-
-
(0.08)
(0.09)
Reassessment of state deferred income taxes
0.04
-
-
-
(0.01)
0.03
Amortization of commodity contract intangibles
(0.03)
-
-
-
-
(0.03)
Plant retirements and divestitures
0.06
-
-
-
-
0.06
Long-lived asset impairment
(0.39)
-
-
-
-
(0.39)
Bargain-purchase gain
0.03
-
-
-
-
0.03
Tax settlements
0.01
-
-
-
-
0.01
Non-controlling interest
(0.03)
-
-
-
-
(0.03)
4Q 2014 GAAP Earnings (Loss) Per Share
($0.11)
$0.09
$0.11
$0.06
$(0.13)
$0.02
Three Months Ended December 31, 2013
ExGen
ComEd
PECO
BGE
Other
Exelon
2013 Adjusted (non-GAAP) Operating Earnings (Loss) Per Share
$0.21
$0.13
$0.12
$0.06
$(0.02)
$0.50
Mark-to-market impact of economic hedging activities
0.16
-
-
-
-
0.16
Unrealized gains related to nuclear decommissioning trust funds
0.05
-
-
-
-
0.05
Constellation merger and integration costs
(0.02)
-
-
-
-
(0.02)
Reassessment of state deferred income taxes
0.02
-
-
-
(0.02)
-
Amortization of commodity contract intangibles
(0.09)
-
-
-
-
(0.09)
Midwest Generation bankruptcy charges
(0.02)
-
-
-
-
(0.02)
4Q 2013 GAAP Earnings (Loss) Per Share
$0.31
$0.13
$0.12
$0.06
$(0.04)
$0.58
NOTE: All amounts shown are per Exelon share and represent contributions
to Exelon's EPS. Amounts may not add due to rounding. |
 31
2014 4Q Earnings Release Slides
4Q YTD GAAP EPS Reconciliation
NOTE: All amounts shown are per Exelon share and represent contributions
to Exelon's EPS. Amounts may not add due to rounding. Year Ended
December 31, 2013 ExGen
ComEd
PECO
BGE
Other
Exelon
2013 Adjusted (non-GAAP) Operating Earnings (Loss) Per Share
$1.40
$0.49
$0.45
$0.23
$(0.07)
$2.50
Mark-to-market impact of economic hedging activities
0.35
-
-
-
(0.00)
0.35
Unrealized gains related to nuclear decommissioning trust funds
0.09
-
-
-
-
0.09
Asset retirement obligation
(0.01)
-
-
-
-
(0.01)
Plant retirements and divestiture
0.02
-
-
-
-
0.02
Long-lived asset impairment
(0.12)
-
-
-
(0.02)
(0.14)
Merger and integration costs
(0.08)
-
-
-
-
(0.08)
Amortization of commodity contract intangibles
(0.41)
-
-
-
-
(0.41)
Remeasurement of like kind exchange tax position
-
(0.20)
-
-
(0.11)
(0.31)
Amortization of the fair value of certain debt
0.01
-
-
-
-
0.01
Reassessment of state deferred income taxes
0.01
-
-
-
(0.01)
-
Midwest Generation bankruptcy charges
(0.02)
-
-
-
-
(0.02)
4Q 2013 GAAP Earnings (Loss) Per Share
$1.24
$0.29
$0.45
$0.23
$(0.21)
$2.00 |
 32
2014 4Q Earnings Release Slides
4Q YTD GAAP EPS Reconciliation -
continued
Year Ended December 31,
2014 ExGen
ComEd
PECO
BGE
Other
Exelon
2014 Adjusted (non-GAAP) Operating Earnings (Loss) Per Share
$1.34
$0.47
$0.41
$0.23
$(0.06)
$2.39
Mark-to-market impact of economic hedging activities
(0.42)
-
-
-
-
(0.42)
Unrealized gains related to NDT fund investments
0.10
-
-
-
-
0.10
Asset retirement obligation
0.02
-
-
-
-
0.02
Plant retirements and divestitures
0.28
-
-
-
-
0.28
Long-lived asset impairment
(0.49)
-
-
-
(0.02)
(0.50)
Gain on CENG integration
0.18
-
-
-
-
0.18
Merger and integration costs
(0.10)
-
-
-
(0.11)
(0.21)
Amortization of commodity contract intangibles
(0.07)
-
-
-
-
(0.07)
Tax settlements
0.12
-
-
-
-
0.12
Reassessment of state deferred income taxes
0.04
-
-
-
(0.01)
0.03
Bargain-purchase gain
0.03
-
-
-
-
0.03
Non-controlling interest
(0.07)
-
-
-
-
(0.07)
4Q 2014 GAAP Earnings Per Share
$0.97
$0.47
$0.41
$0.23
($0.20)
$1.88
NOTE: All amounts shown are per Exelon share and represent contributions
to Exelon's EPS. Amounts may not add due to rounding. |
 33
2014 4Q Earnings Release Slides
GAAP to Operating Adjustments
NOTE: All amounts shown are per Exelon share and represent contributions
to Exelon's EPS. Amounts may not add due to rounding. •
Exelon’s 2015 adjusted (non-GAAP) operating earnings excludes the
earnings effects of the following: –
Mark-to-market adjustments from economic hedging activities
–
Unrealized gains and losses from NDT fund investments to the extent not offset
by contractual accounting as described in the notes to the consolidated
financial statements –
Financial impacts associated with the sale of interests in generating
stations –
Certain costs incurred associated with the Integrys acquisition and Pepco
Holdings, Inc. merger and integration initiatives
–
Non-cash amortization of intangible assets, net, related to commodity
contracts recorded at fair value at the date of acquisition of Integrys
Energy Services in 2014 –
Other unusual items |
 2014 4Q Earnings Release Slides
34
Adjusted O&M Reconciliations to GAAP
2014 Adjusted O&M Reconciliation (in $M)
(3)
ExGen
ComEd
PECO
BGE
Other
Exelon
GAAP O&M
$5,575
$1,450
$875
$700
$(25)
$8,575
PHI Merger and Acquisition Costs
-
-
-
-
(25)
(25)
Regulatory O&M
(1)
-
(250)
(100)
-
-
(350)
Upstream and Power Impairments
(525)
-
-
-
(25)
(525)
Constellation Merger Commitments
(50)
-
-
-
-
(50)
Direct cost of sales incurred to generate revenues for
certain Constellation businesses
(2)
(325)
-
-
-
-
(325)
O&M for managed plants that are partially owned
(300)
-
-
-
-
(300)
Other
(25)
-
-
-
-
(25)
Adjusted O&M (Non-GAAP, as shown on slide 4)
$4,350
$1,200
$750
$700
$(75)
$6,950
(1)
Reflects P&L neutral O&M.
(2)
Reflects the direct cost of sales of certain Constellation businesses of
Generation, which are included in Total Gross Margin. (3)
All amounts rounded to the nearest $25M. |
 35
2014 4Q Earnings Release Slides
Adjusted O&M Reconciliations to GAAP
2015 Adjusted O&M Reconciliation (in $M)
(3)
ExGen
ComEd
PECO
BGE
Other
Exelon
GAAP O&M
$5,225
$1,550
$850
$775
$(75)
$8,350
PHI Acquisition Costs
(25)
-
-
-
-
(25)
Regulatory O&M
(1)
-
$(300)
(100)
-
-
(425)
Decommissioning
25
-
-
-
-
25
Direct cost of sales incurred to generate revenues for certain
Constellation businesses
(2)
(300)
-
-
-
-
(300)
O&M for managed plants that are partially owned
(400)
-
-
-
-
(400)
Adjusted O&M (Non-GAAP, as shown on slide 4)
$4,525
$1,250
$750
$775
$(75)
$7,225
(1)
Reflects P&L neutral O&M.
(2)
Reflects the direct cost of sales of certain Constellation businesses of
Generation, which are included in Total Gross Margin. (3)
All amounts rounded to the nearest $25M. |
 36
2014 4Q Earnings Release Slides
ExGen Total Gross Margin Reconciliation to GAAP
Total Gross Margin Reconciliation (in $M)
(4)
2015
2016
2017
Revenue
Net
of
Purchased
Power
and
Fuel
Expense
(1)(5)
$8,100
$8,000
$8,400
Other Revenues
(2)
$(250)
$(250)
$(250)
Direct cost of sales incurred to generate revenues for certain
Constellation businesses
(3)
$(300)
$(350)
$(450)
Total Gross Margin (Non-GAAP, as shown on slide 6)
$7,550
$7,400
$7,700
(1)
Revenue net of purchased power and fuel expense (RNF), a non-GAAP measure,
is calculated as the GAAP measure of operating revenue less the GAAP
measure of purchased power and fuel expense . ExGen does not forecast the
GAAP components of RNF separately. RNF also includes the RNF of our
proportionate ownership share of CENG.
(2)
Reflects revenues from operating services agreement with Fort Calhoun, variable
interest entities, funds collected through revenues for decommissioning
the former PECO nuclear plants through regulated rates and gross receipts tax
revenues.
(3)
Reflects the cost of sales and depreciation expense of certain Constellation
businesses of Generation.
(4)
All amounts rounded to the nearest $50M.
(5)
Excludes the impact of the operating exclusion for mark-to-market due
to the volatility and unpredictability of the future changes to power prices.
2014 4Q Earnings Release Slides |
Serious News for Serious Traders! Try StreetInsider.com Premium Free!
You May Also Be Interested In
- Exelon Corp. (EXC) May 38 calls and June 39 calls active
- Millicom (Tigo) share repurchase activity
- U.S. Federal Magistrate Judge Recommends Invalidation of Jetaire Patents in Lawsuit Against AerSale
Create E-mail Alert Related Categories
SEC FilingsSign up for StreetInsider Free!
Receive full access to all new and archived articles, unlimited portfolio tracking, e-mail alerts, custom newswires and RSS feeds - and more!
