

Form 8-K EXA CORP For: Dec 14
 Tweet
Tweet Share
Share
SECURITIES AND EXCHANGE COMMISSION
Washington, D.C. 20549
FORM 8-K
CURRENT REPORT
PURSUANT TO SECTION 13 OR 15(d) OF THE
SECURITIES EXCHANGE ACT OF 1934
Date of Report (Date of earliest event reported): December 14, 2016
EXA CORPORATION
(Exact Name of Registrant as Specified in Charter)
| Delaware | 001-35584 | 04-3139906 | ||
| (State or other jurisdiction of incorporation) |
(Commission File Number) |
(IRS Employer Identification Number) |
55 Network Drive, Burlington, Massachusetts 01803
(Address of principal executive offices) (Zip Code)
(781) 564-0200
(Registrant’s telephone number, including area code)
Not Applicable
(Former Name or Former Address, if Changed Since Last Report)
Check the appropriate box below if the Form 8-K filing is intended to simultaneously satisfy the filing obligation of the registrant under any of the following provisions (see General Instruction A.2. below).
| ☐ | Written communications pursuant to Rule 425 under the Securities Act (17 CFR 230.425) |
| ☐ | Soliciting material pursuant to Rule 14a-12 under the Exchange Act (17 CFR 240.14a-12) |
| ☐ | Pre-commencement communications pursuant to Rule 14d-2(b) under the Exchange Act (17 CFR 240.14d-2(b)) |
| ☐ | Pre-commencement communications pursuant to Rule 13e-4(c) under the Exchange Act (17 CFR 240.13e-4(c)) |
| Item 7.01 | Regulation FD Disclosure. |
A copy of the Company’s December 14, 2016 Analyst and Investor Day presentation is attached to this Current Report on Form 8-K as Exhibit 99.1. A copy of the presentation is also available on the Company’s website.
In accordance with General Instruction B.2 of Form 8-K, the information contained in Item 7.01 of this Current Report on Form 8-K, including the Exhibit attached hereto, shall not be deemed “filed” for the purposes of Section 18 of the Securities Exchange Act of 1934, as amended, or otherwise subject to the liabilities of that Section. The information in Item 7.01 of this Current Report on Form 8-K shall not be incorporated by reference into any filing or other document pursuant to the Securities Act of 1933, as amended, except as shall be expressly set forth by specific reference in such filing or document.
| Item 9.01 | Financial Statements and Exhibits |
(d) Exhibits.
| 99.1 | December 14, 2016 Analyst and Investor Day Presentation |
SIGNATURES
Pursuant to the requirements of the Securities Exchange Act of 1934, the Registrant has duly caused this report to be signed on its behalf by the undersigned thereunto duly authorized.
| EXA CORPORATION | ||
| By: | /s/ Richard F. Gilbody | |
| Richard F. Gilbody Chief Financial Officer | ||
Date: December 14, 2016
EXHIBIT INDEX
| Exhibit No. |
Description | |
| 99.1 | December 14, 2016 Analyst and Investor Day Presentation | |
| Exhibit 99.1
|
EXA INVESTOR DAY
Steve Remondi | December 2016
|
|

EXA CORPORATE VIDEO
|
|
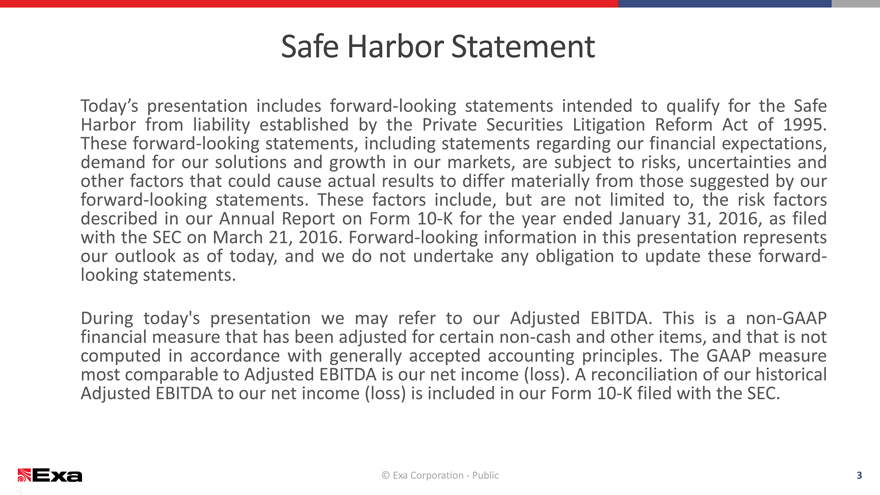
Safe Harbor Statement
Today’s presentation includes forward-looking statements intended to qualify for the Safe Harbor from liability established by the Private Securities Litigation Reform Act of 1995. These forward-looking statements, including statements regarding our financial expectations, demand for our solutions and growth in our markets, are subject to risks, uncertainties and other factors that could cause actual results to differ materially from those suggested by our forward-looking statements. These factors include, but are not limited to, the risk factors described in our Annual Report on Form 10-K for the year ended January 31, 2016, as filed with the SEC on March 21, 2016. Forward-looking information in this presentation represents our outlook as of today, and we do not undertake any obligation to update these forward-looking statements.
During today’s presentation we may refer to our Adjusted EBITDA. This is a non-GAAP financial measure that has been adjusted for certain non-cash and other items, and that is not computed in accordance with generally accepted accounting principles. The GAAP measure most comparable to Adjusted EBITDA is our net income (loss). A reconciliation of our historical Adjusted EBITDA to our net income (loss) is included in our Form 10-K filed with the SEC.
© Exa Corporation—Public 3
|
|
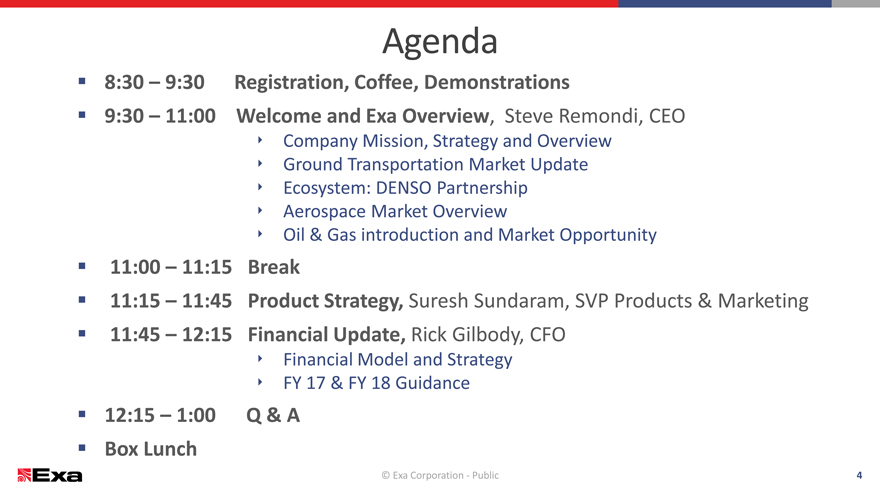
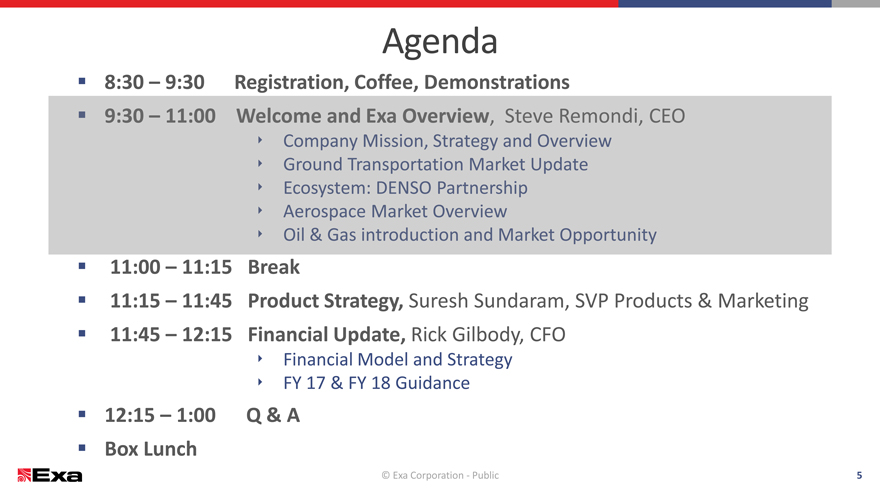
Agenda
8:30 – 9:30 Registration, Coffee, Demonstrations
9:30 – 11:00 Welcome and Exa Overview, Steve Remondi, CEO
? Company Mission, Strategy and Overview
? Ground Transportation Market Update
? Ecosystem: DENSO Partnership
? Aerospace Market Overview
? Oil & Gas introduction and Market Opportunity
11:00 – 11:15 Break
11:15 – 11:45 Product Strategy, Suresh Sundaram, SVP Products & Marketing
11:45 – 12:15 Financial Update, Rick Gilbody, CFO
? Financial Model and Strategy
? FY 17 & FY 18 Guidance
12:15 – 1:00 Q & A
Box Lunch
© Exa Corporation—Public 4
|
|
Agenda
8:30 – 9:30 Registration, Coffee, Demonstrations
11:00 – 11:15 Break
11:15 – 11:45 Product Strategy, Suresh Sundaram, SVP Products & Marketing
11:45 – 12:15 Financial Update, Rick Gilbody, CFO
? Financial Model and Strategy
? FY 17 & FY 18 Guidance
12:15 – 1:00 Q & A
Box Lunch
© Exa Corporation—Public 5
|
|
OUR MISSION
Enabling better products through simulation–driven design
|
|
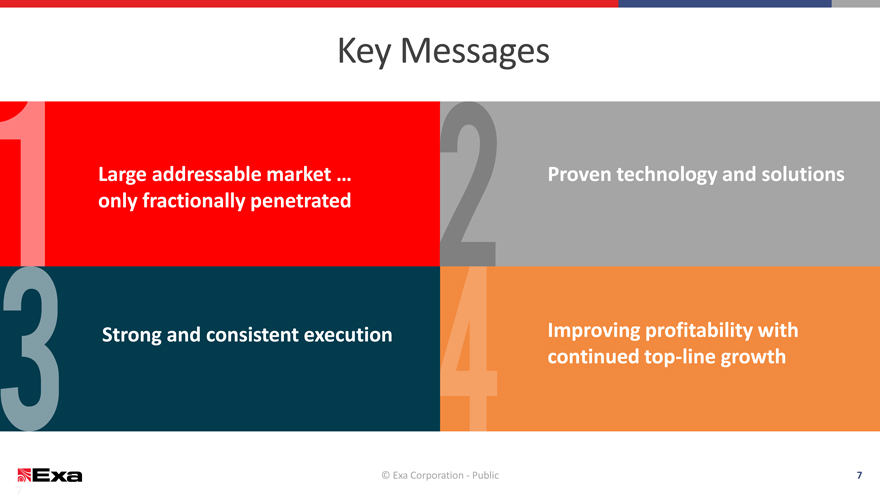
Key Messages
Large addressable market … Proven technology and solutions
only fractionally penetrated
Strong and consistent execution Improving profitability with
continued top-line growth
© Exa Corporation—Public 7
|
|
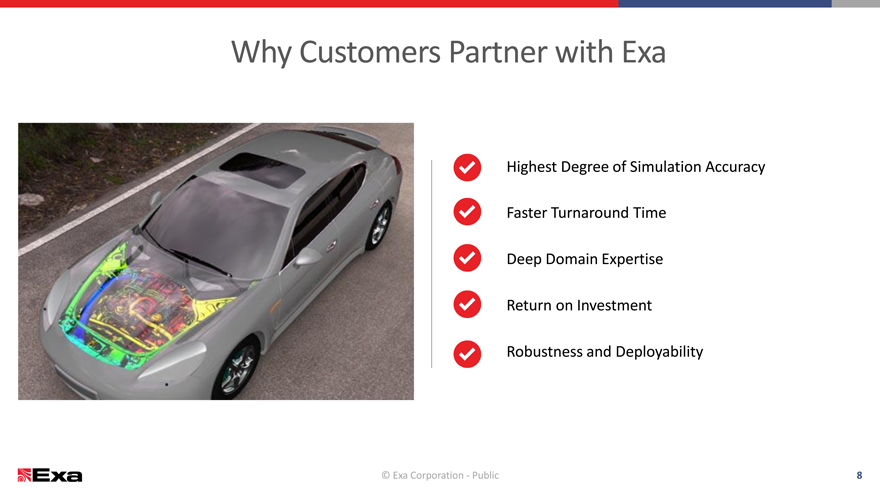
Why Customers Partner with Exa
Highest Degree of Simulation Accuracy Faster Turnaround Time Deep Domain Expertise Return on Investment Robustness and Deployability
© Exa Corporation—Public 8
|
|
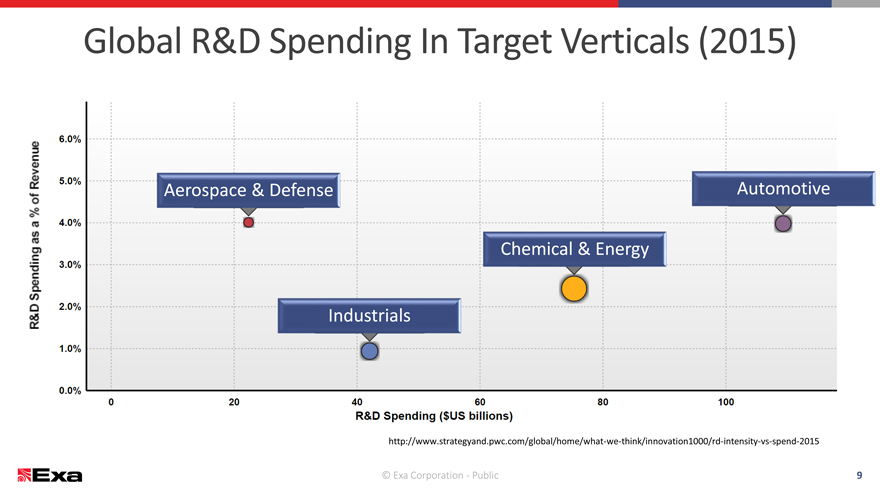
Global R&D Spending In Target Verticals (2015)
Aerospace & Defense Automotive
Chemical & Energy
Industrials
http://www.strategyand.pwc.com/global/home/what-we-think/innovation1000/rd-intensity-vs-spend-2015
© Exa Corporation—Public 9
|
|
GT MARKET UPDATE
© Exa Corporation—Public 10
|
|

Exa Ground Transportation Market
$500 to $700M GT Revenue Opportunity
$30-$40M $30-$40M
Defense
M/Sport Passenger
Supplier Car
$60-$100M $250-$300M
Off-Highway
Truck Highway
$80-$120M Truck
$50-$100M
© Exa Corporation—Public 11
|
|
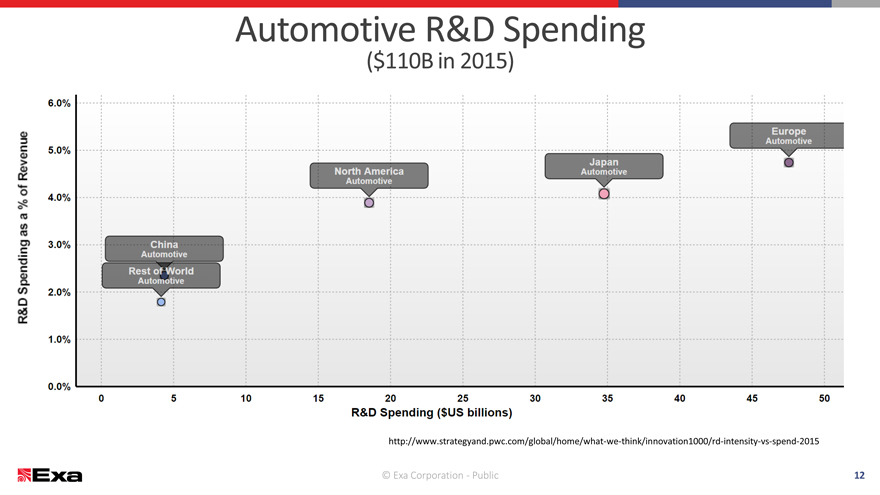
Automotive R&D Spending
($110B in 2015)
http://www.strategyand.pwc.com/global/home/what-we-think/innovation1000/rd-intensity-vs-spend-2015
© Exa Corporation—Public 12
|
|
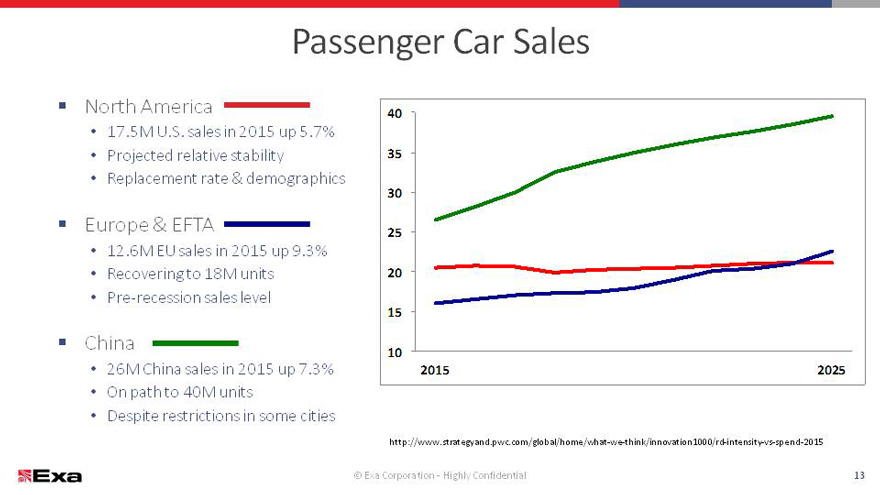
Passenger Car Sales
North America 40
17.5M U.S. sales in 2015 up 5.7%
Projected relative stability35
Replacement rate & demographics
30
Europe & EFTA 25
12.6M EU sales in 2015 up 9.3%
Recovering to 18M units2020
Pre-recession sales level
1515
China
1010
26M China sales in 2015 up 7.3%201520152025
On path to 40M units
Despite restrictions in some cities
http://www.strategyand.pwc.com/global/home/what-we-think/innovation1000/rd-intensity-vs-spend-2015
© Exa Corporation—Public13
|
|
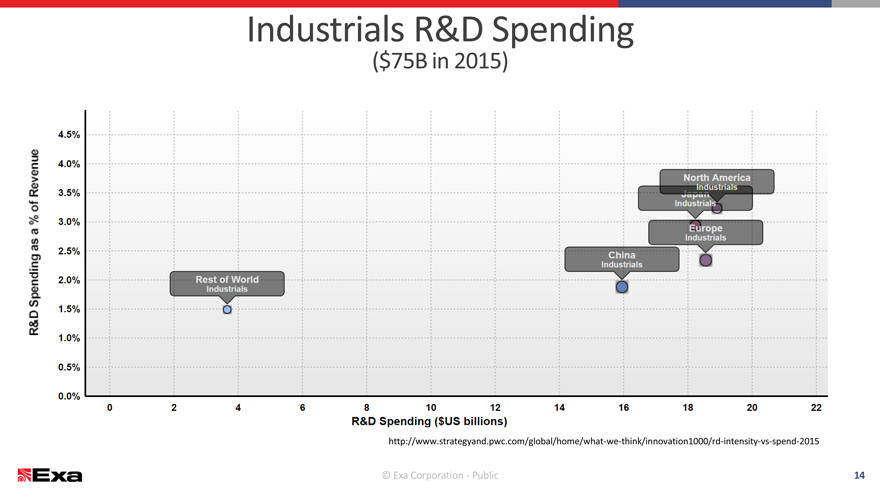
Industrials R&D Spending
($75B in 2015)
http://www.strategyand.pwc.com/global/home/what-we-think/innovation1000/rd-intensity-vs-spend-2015
© Exa Corporation—Public 14
|
|
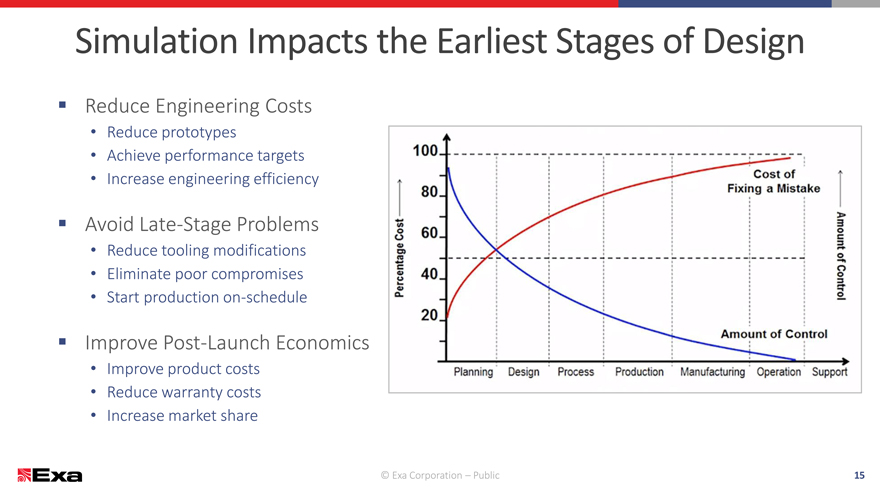
Simulation Impacts the Earliest Stages of Design
Reduce Engineering Costs
Reduce prototypes
Achieve performance targets
Increase engineering efficiency
Avoid Late-Stage Problems
Reduce tooling modifications
Eliminate poor compromises
Start production on-schedule
Improve Post-Launch Economics
Improve product costs
Reduce warranty costs
Increase market share
© Exa Corporation – Public15
|
|
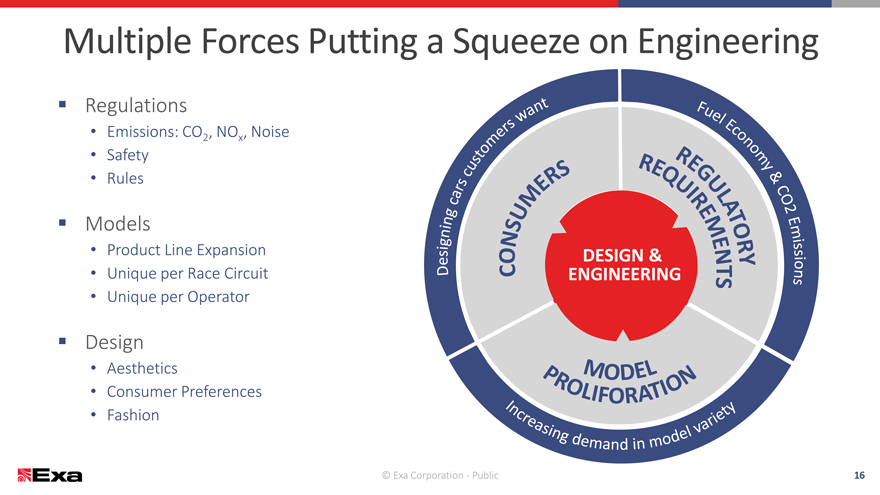
Multiple Forces Putting a Squeeze on Engineering
Regulations
Emissions: CO2 , NOx , Noise
Safety
Rules
Models
Product Line Expansion DESIGN &
Unique per Race Circuit ENGINEERING
Unique per Operator
Design
Aesthetics
Consumer Preferences
Fashion
© Exa Corporation—Public 16
|
|
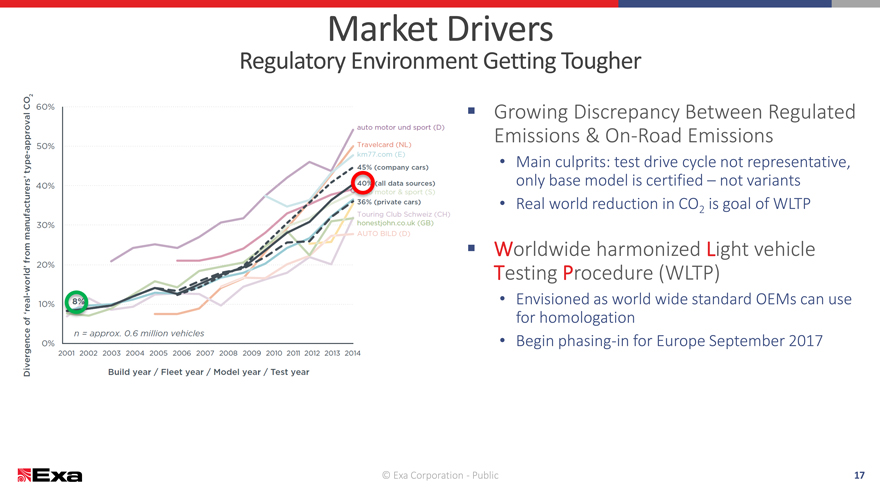
Market Drivers
Regulatory Environment Getting Tougher
Growing Discrepancy Between Regulated
Emissions & On-Road Emissions
Main culprits: test drive cycle not representative,
only base model is certified – not variants
Real world reduction in CO2 is goal of WLTP
Worldwide harmonized Light vehicle
Testing Procedure (WLTP)
Envisioned as world wide standard OEMs can use
for homologation
Begin phasing-in for Europe September 2017
© Exa Corporation—Public 17
|
|
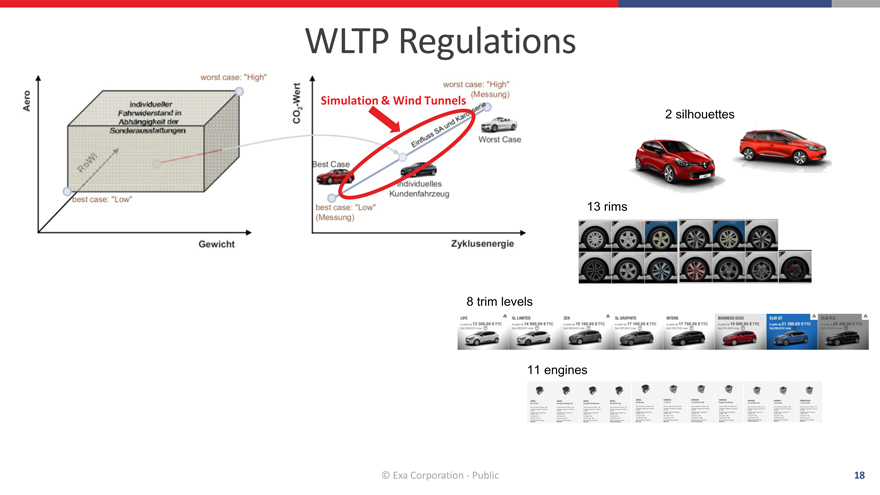
WLTP Regulations
Simulation & Wind Tunnels
2 silhouettes
13 rims
8 trim levels
11 engines
© Exa Corporation—Public 18
|
|
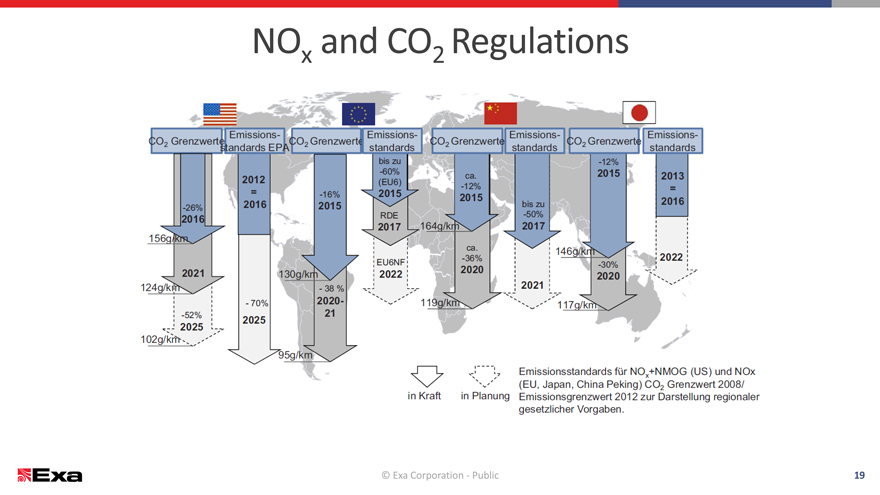
NOx and CO2 Regulations
© Exa Corporation—Public19
|
|
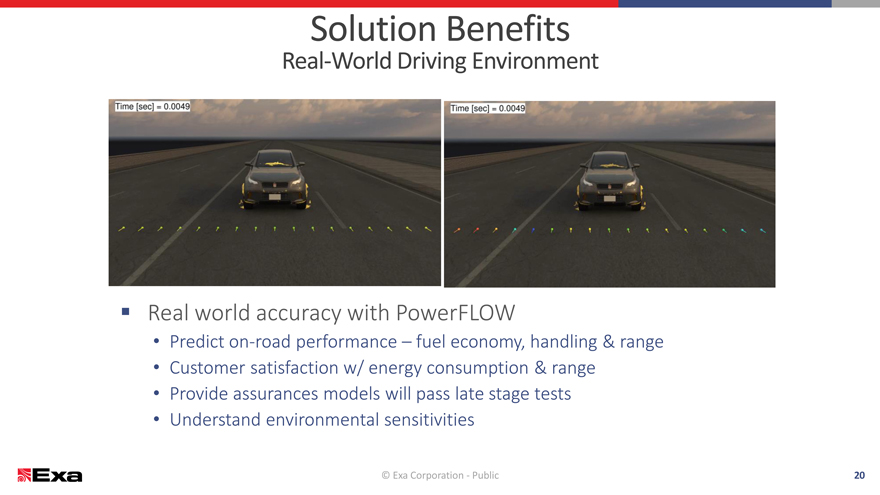
Solution Benefits
Real-World Driving Environment
Real world accuracy with PowerFLOW
Predict on-road performance – fuel economy, handling & range
Customer satisfaction w/ energy consumption & range
Provide assurances models will pass late stage tests
Understand environmental sensitivities
© Exa Corporation—Public 20
|
|
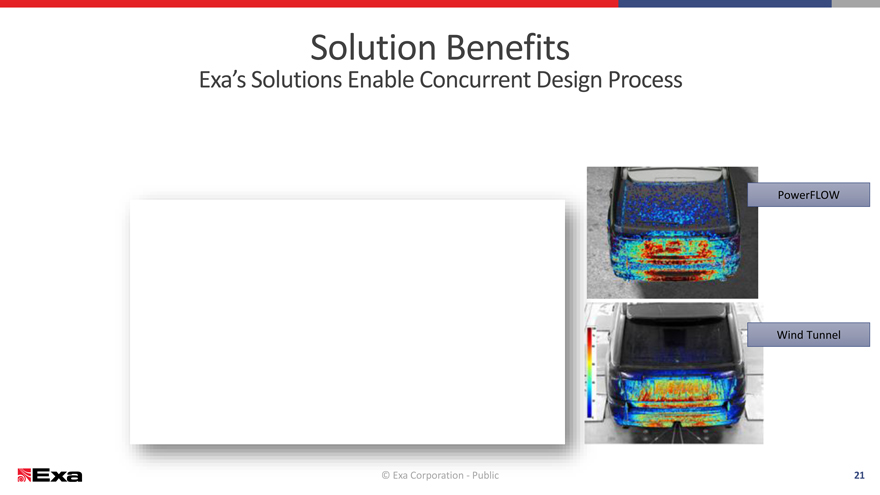
Solution Benefits
Exa’s Solutions Enable Concurrent Design Process
PowerFLOW
Wind Tunnel
© Exa Corporation—Public 21
|
|
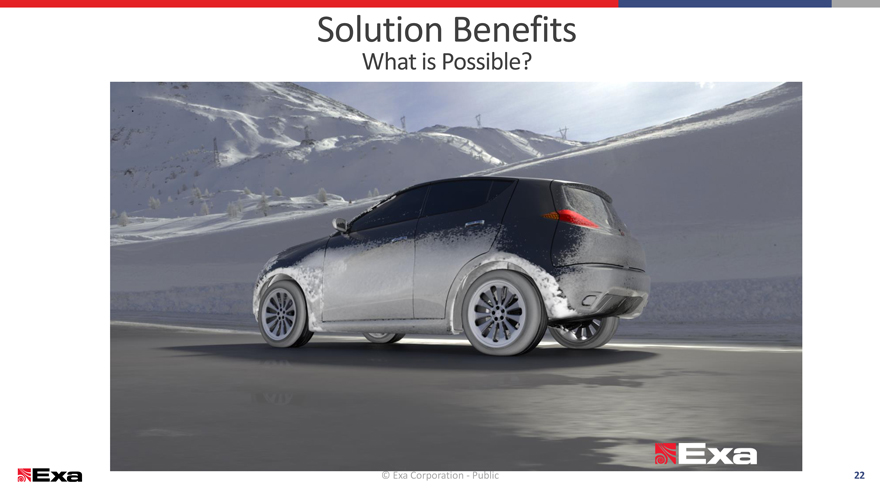
Solution Benefits
What is Possible?
© Exa Corporation—Public 22
|
|
Aerodynamics Solution Overview
Soiling/Water Management – Wind Screen
23
|
|

MOTORSPORTS
|
|

MOTORSPORTS
|
|

OFF-HIGHWAY
|
|
© Exa Corporation—Public
|
|
ECOSYSTEM
© Exa Corporation—Public 28
|
|
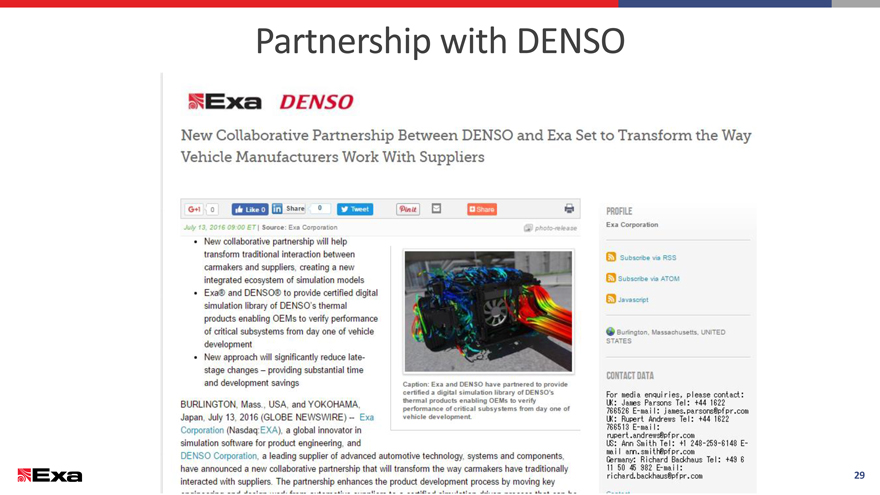
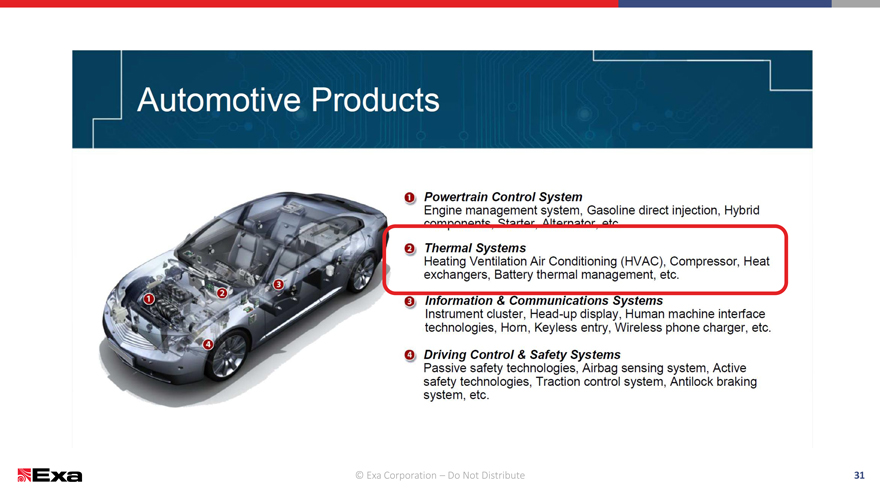
Partnership with DENSO
29
|
|
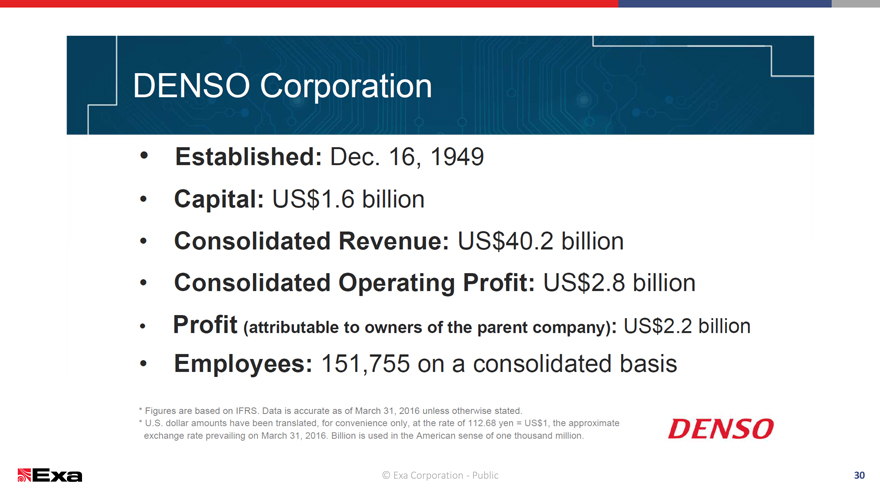
© Exa Corporation—Public 30
|
|
© Exa Corporation – Do Not Distribute 31
|
|
© Exa Corporation – Do Not Distribute 32
|
|

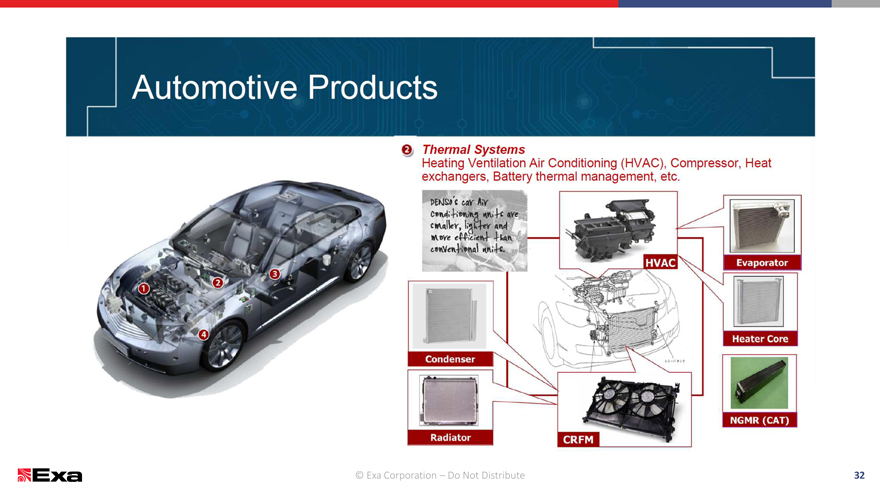
Air-Conditioning Unit
|
|
DENSO Statement to Investors
© Exa Corporation—Public 34
|
|
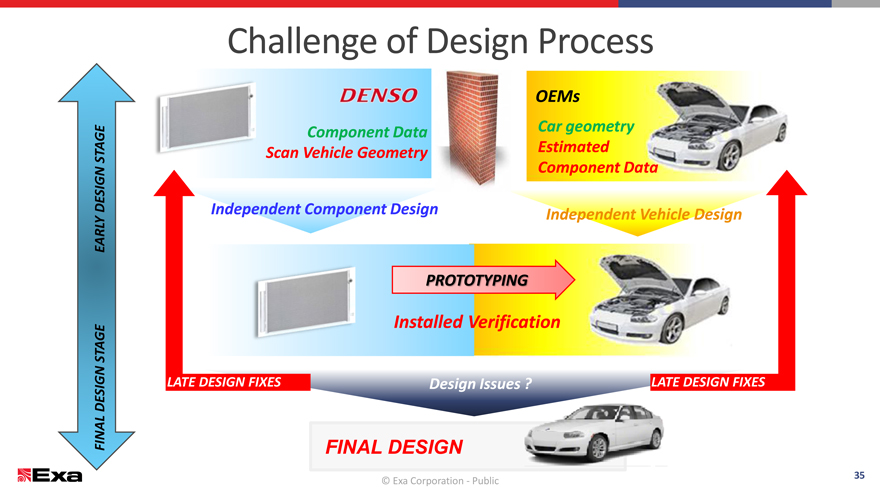
Challenge of Design Process
OEMs
Component DataCar geometry
STAGE Scan Vehicle Geometry Estimated
GN Component Data
DESI Independent Component Design Independent Vehicle Design
EARLY
PROTOTYPING
Installed Verification
STAGE
N
DESIG LATE DESIGN FIXES Design Issues ?LATE DESIGN FIXES
FINAL FINAL DESIGN
© Exa Corporation—Public35
|
|
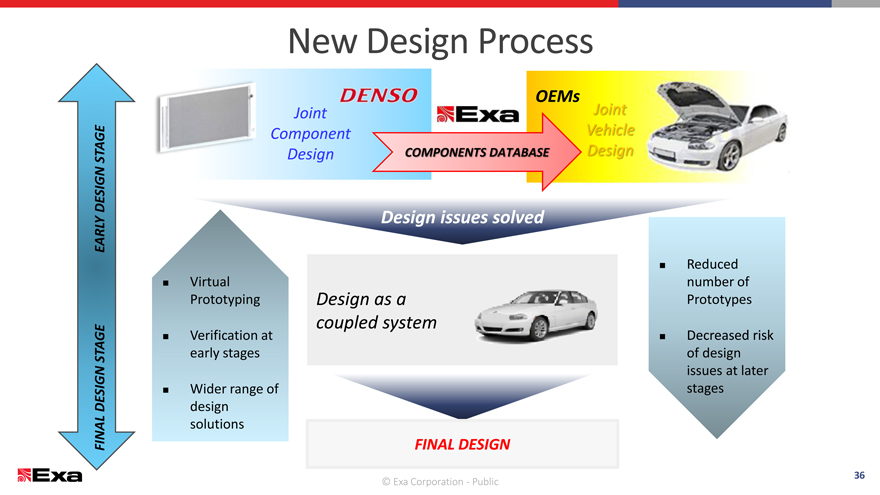
New Design Process
OEMs
JointJoint
ComponentVehicle
STAGE DesignCOMPONENTS DATABASEDesign
GN
DESI
EARLY Design issues solved
?Reduced
? Virtualnumber of
PrototypingDesign as aPrototypes
coupled system
? Verification at?Decreased risk
STAGE early stagesof design
N issues at later
? Wider range ofstages
DESIG design
solutions
FINAL FINAL DESIGN
36
© Exa Corporation—Public
|
|
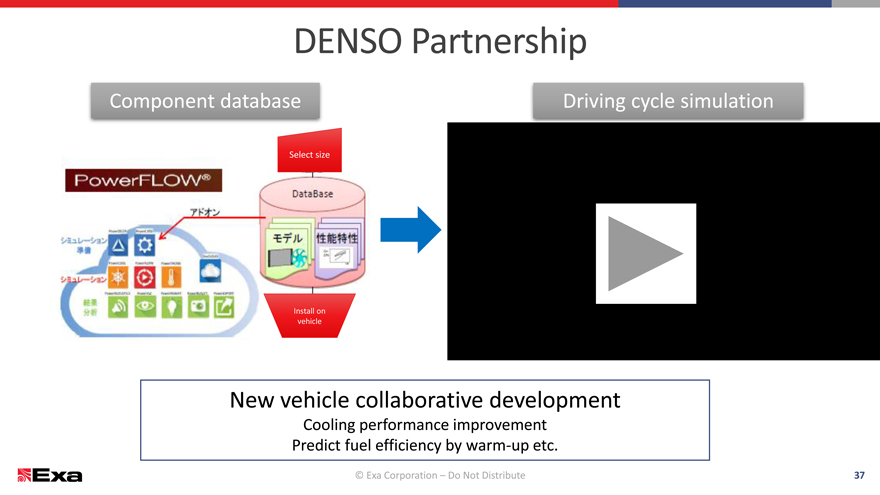
DENSO Partnership
Component database Driving cycle simulation
Select size
Install on
vehicle
New vehicle collaborative development
Cooling performance improvement
Predict fuel efficiency by warm-up etc.
© Exa Corporation – Do Not Distribute 37
|
|
AEROSPACE
© Exa Corporation—Public 38
|
|

AEROSPACE MARKET OVERVIEW
December 14, 2016
© Exa Corporation—Public
|
|
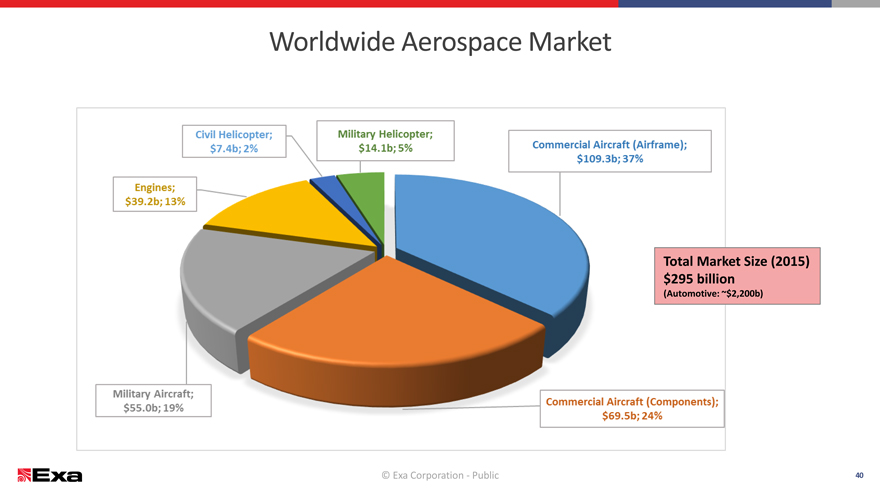
Worldwide Aerospace Market
Total Market Size (2015)
$295 billion
(Automotive: ~$2,200b)
© Exa Corporation—Public 40
|
|
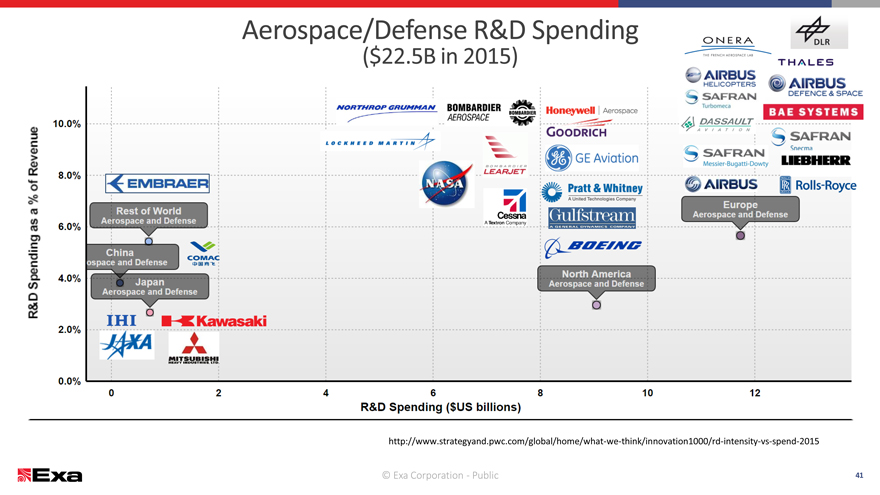
Aerospace/Defense R&D Spending
($22.5B in 2015)
http://www.strategyand.pwc.com/global/home/what-we-think/innovation1000/rd-intensity-vs-spend-2015
© Exa Corporation—Public 41
|
|
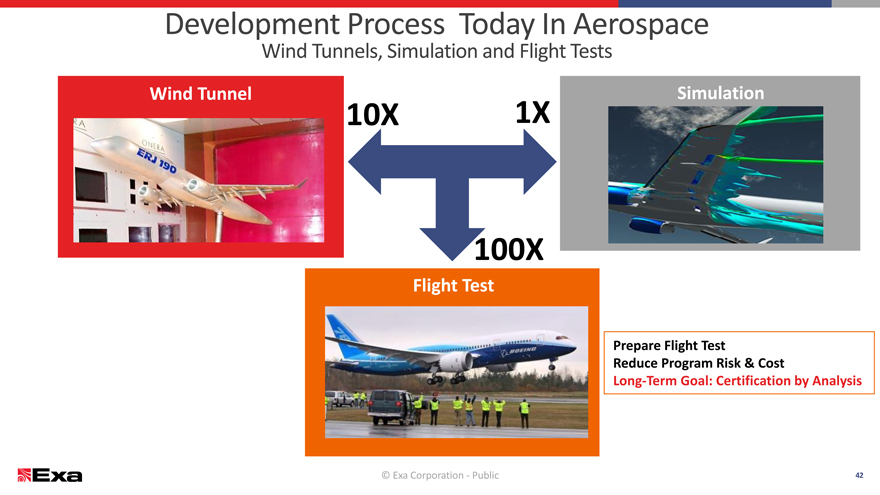
Development Process Today In Aerospace
Wind Tunnels, Simulation and Flight Tests
Wind Tunnel Simulation
10X 1X
100X
Flight Test
Prepare Flight Test
Reduce Program Risk & Cost
Long-Term Goal: Certification by Analysis
© Exa Corporation—Public 42
|
|
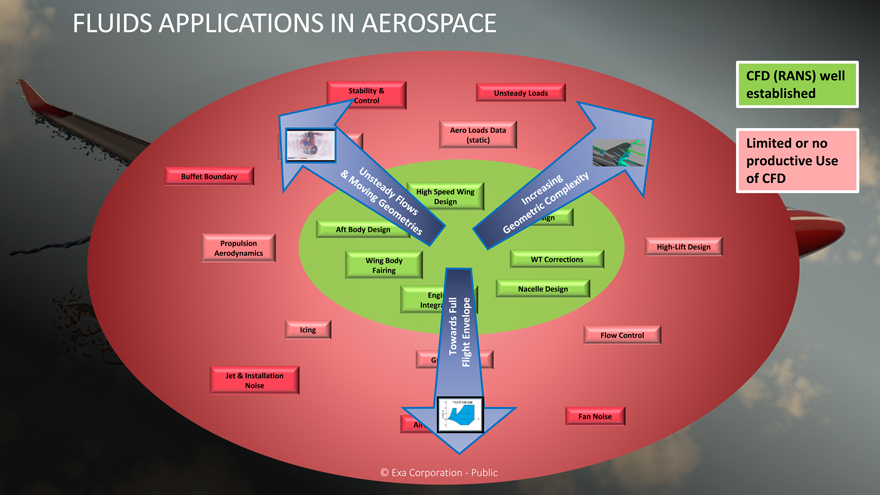
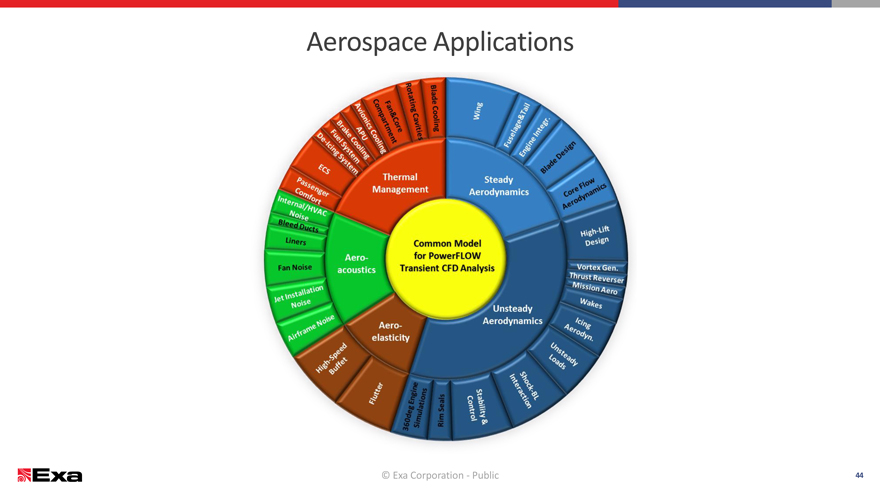
FLUIDS APPLICATIONS IN AEROSPACE
CFD (RANS) well
Stability & Unsteady Loads established
Control
Aero Loads Data
ces & (static) Limited or no
productive Use
Buffet Boundary of CFD
High Speed Wing
Design
Inlet Design
Aft Body Design
Propulsion High-Lift Design
Aerodynamics
Wing Body WT Corrections
Fairing
Nacelle Design
Engine
IntegrationFull
Icing
Towards Envelope Flow Control
Ground EffectFlight
Jet & Installation
Noise
Fan Noise
Airfram
© Exax Corporationti — Publicic
|
|
|
|
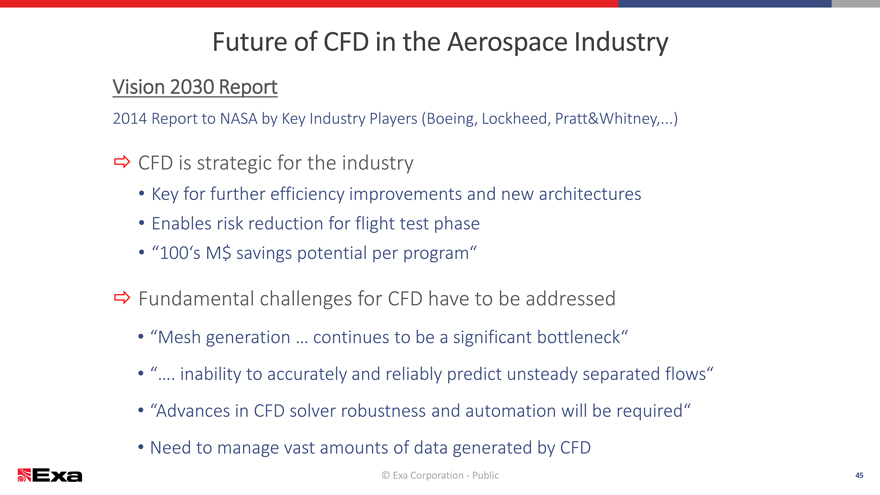
Future of CFD in the Aerospace Industry
Vision 2030 Report
2014 Report to NASA by Key Industry Players (Boeing, Lockheed, Pratt&Whitney,...)
? CFD is strategic for the industry
Key for further efficiency improvements and new architectures
Enables risk reduction for flight test phase
“100‘s M$ savings potential per program“
? Fundamental challenges for CFD have to be addressed
“Mesh generation … continues to be a significant bottleneck“
“…. inability to accurately and reliably predict unsteady separated flows“
“Advances in CFD solver robustness and automation will be required“
Need to manage vast amounts of data generated by CFD
© Exa Corporation—Public 45
|
|
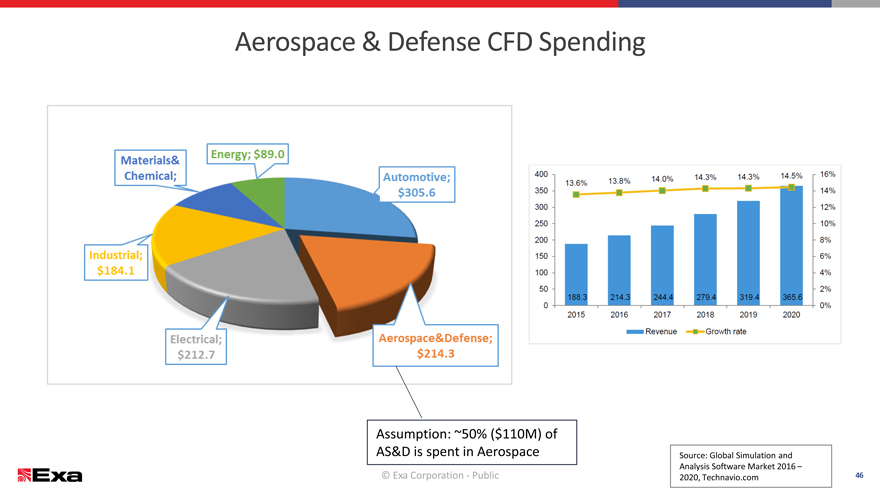
Assumption: ~50% ($110M) of
AS&D
is spent in Aerospace
© Exa Corporation—Public
|
|
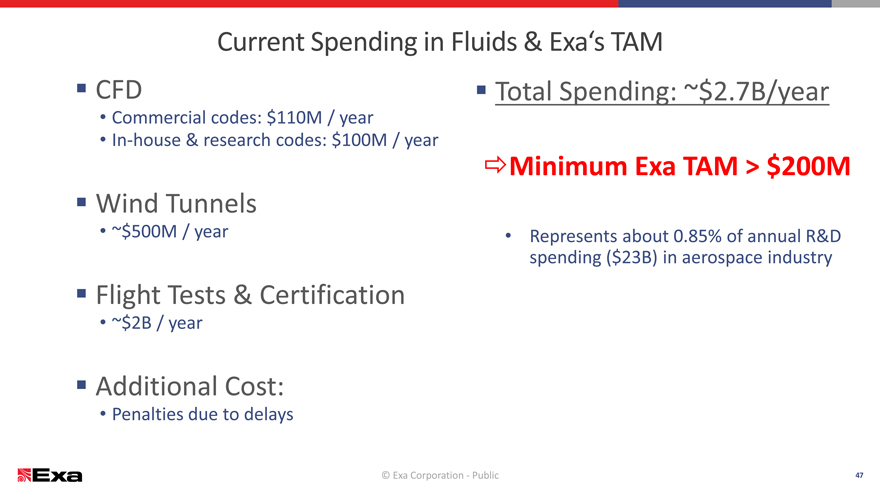
Current Spending in Fluids & Exa‘s TAM
CFD Total Spending: ~$2.7B/year
Commercial codes: $110M / year
In-house & research codes: $100M / year
?Minimum Exa TAM > $200M
Wind Tunnels
~$500M / year Represents about 0.85% of annual R&D
spending ($23B) in aerospace industry
Flight Tests & Certification
~$2B / year
Additional Cost:
Penalties due to delays
© Exa Corporation—Public47
|
|
© Exa Corporation—Public
|
|
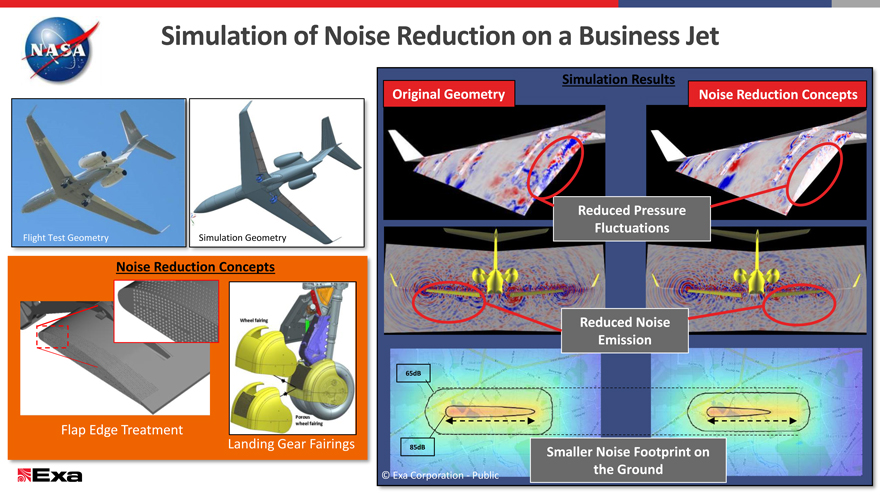
a Business Jet
Simulation Results
Original Geometry Noise Reduction Concepts
Reduced Pressure
Fluctuations
Reduced Noise
Emission
65dB
85dB Smaller Noise Footprint on
© Exa Corporation—Public the Ground
|
|
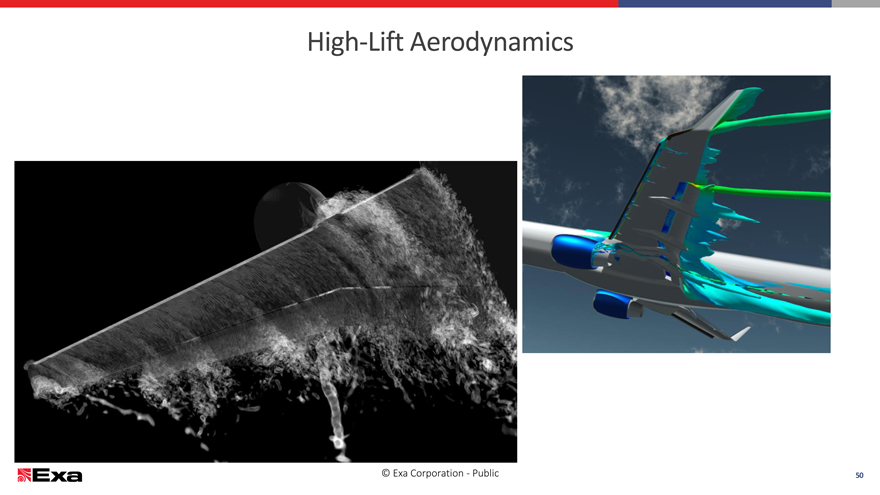
High-Lift Aerodynamics
© Exa Corporation—Public 50
|
|
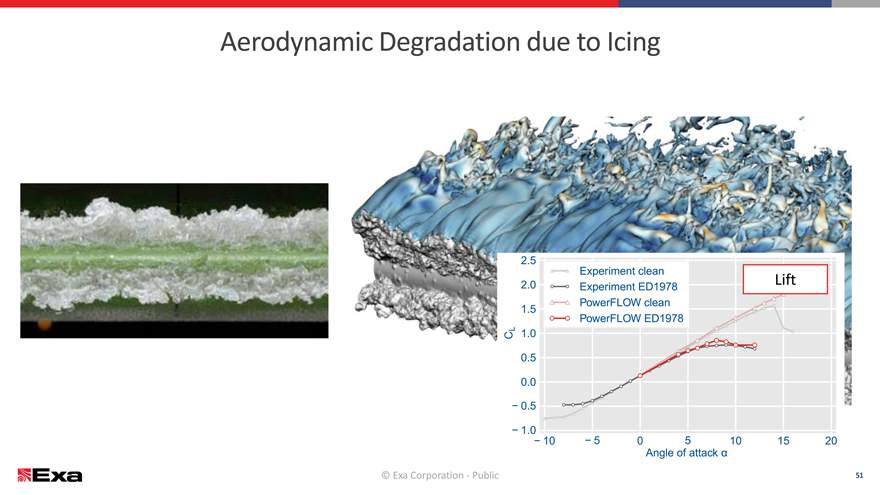
Aerodynamic Degradation due to Icing
Lift
© Exa Corporation—Public 51
|
|
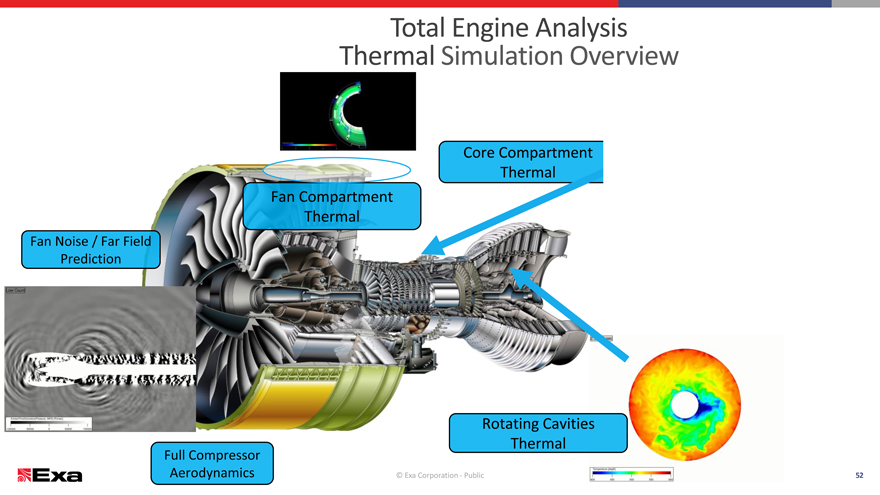
Total Engine Analysis
Thermal Simulation Overview
Core Compartment Thermal Fan Compartment Thermal
Fan Noise / Far Field Prediction
Rotating Cavities
Full Compressor Thermal
Aerodynamics © Exa Corporation—Public 52
|
|
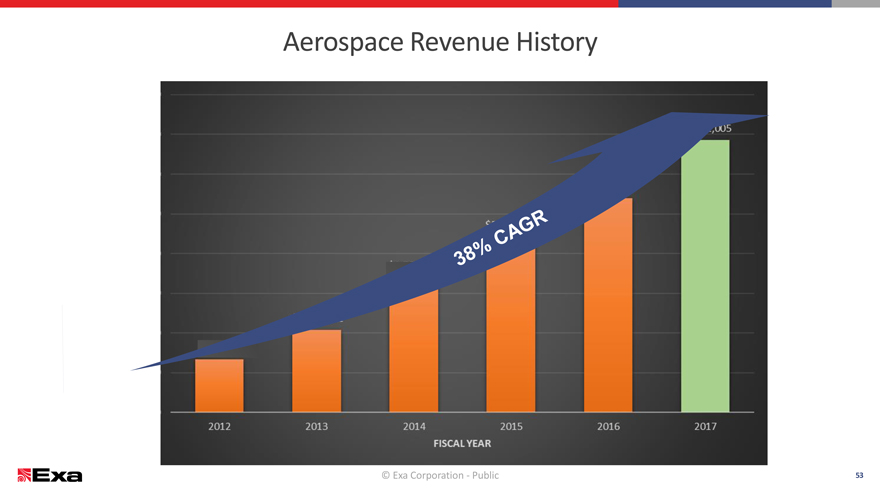
Aerospace Revenue History
© Exa Corporation—Public 53
|
|
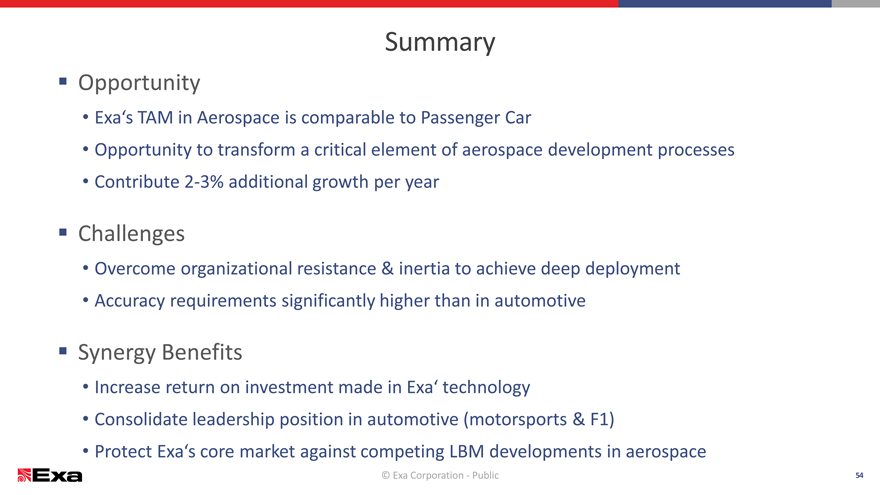
Summary
Opportunity
Exa‘s TAM in Aerospace is comparable to Passenger Car
Opportunity to transform a critical element of aerospace development processes
Contribute 2-3% additional growth per year
Challenges
Overcome organizational resistance & inertia to achieve deep deployment
Accuracy requirements significantly higher than in automotive
Synergy Benefits
Increase return on investment made in Exa‘ technology
Consolidate leadership position in automotive (motorsports & F1)
Protect Exa‘s core market against competing LBM developments in aerospace
© Exa Corporation—Public 54
|
|
OIL & GAS
© Exa Corporation—Public 55
|
|
OIL & GAS INTRODUCTION
December 14, 2016
© Exa Corporation—Public
|
|
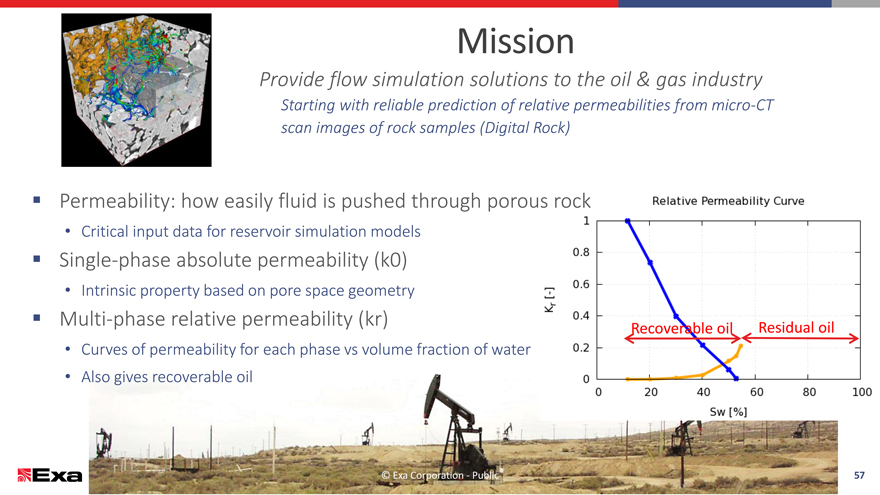
Mission
Provide flow simulation solutions to the oil & gas industry
Starting with reliable prediction of relative permeabilities from micro-CT
scan images of rock samples (Digital Rock)
Permeability: how easily fluid is pushed through porous rock
Critical input data for reservoir simulation models
Single-phase absolute permeability (k0)
Intrinsic property based on pore space geometry
Multi-phase relative permeability (kr) Recoverable oilResidual oil
Curves of permeability for each phase vs volume fraction of water
Also gives recoverable oil
© Exa Corporation—Public57
|
|
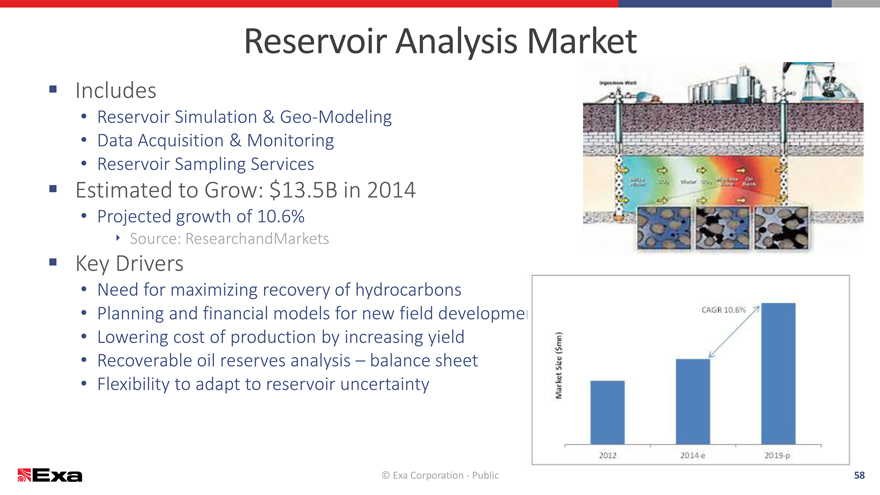
Reservoir Analysis Market
Includes
Reservoir Simulation & Geo-Modeling
Data Acquisition & Monitoring
Reservoir Sampling Services
Estimated to Grow: $13.5B in 2014
Projected growth of 10.6%
? Source: ResearchandMarkets
Key Drivers
Need for maximizing recovery of hydrocarbons
Planning and financial models for new field developmen
Lowering cost of production by increasing yield
Recoverable oil reserves analysis – balance sheet
Flexibility to adapt to reservoir uncertainty
© Exa Corporation—Public58
|
|
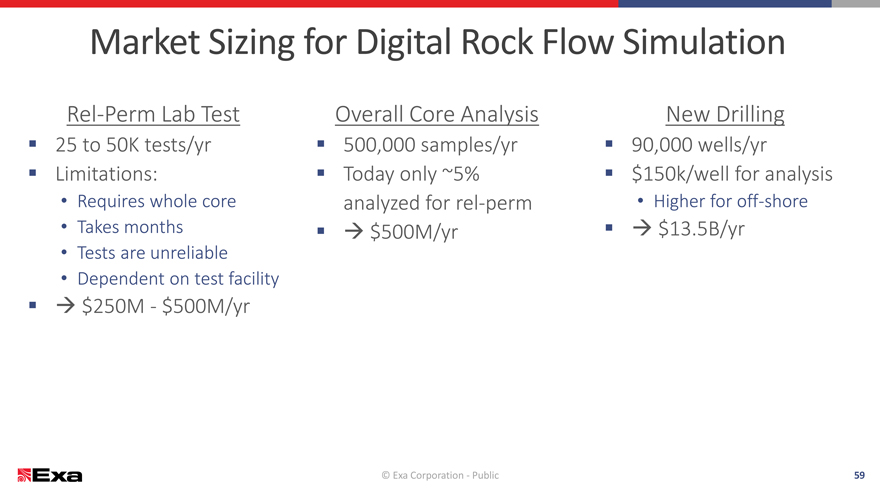
Market Sizing for Digital Rock Flow Simulation
Rel-Perm Lab Test Overall Core AnalysisNew Drilling
25 to 50K tests/yr 500,000 samples/yr 90,000 wells/yr
Limitations: Today only ~5% $150k/well for analysis
Requires whole coreanalyzed for rel-perm Higher for off-shore
Takes months ? $500M/yr ? $13.5B/yr
Tests are unreliable
Dependent on test facility
? $250M—$500M/yr
© Exa Corporation—Public59
|
|
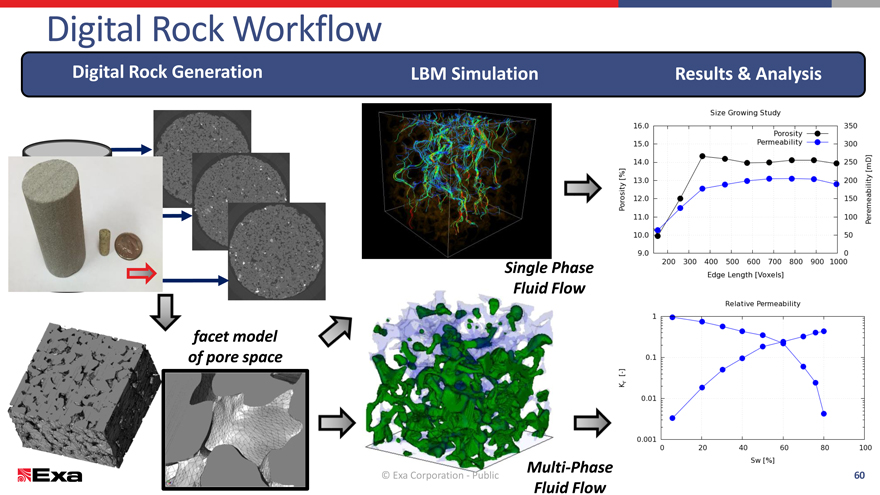
Digital Rock Workflow
Digital Rock Generation LBM Simulation Results & Analysis
Single Phase
Fluid Flow
facet model
of pore space
Multi-Phase
© Exa Corporation—Public 60
Fluid Flow
|
|
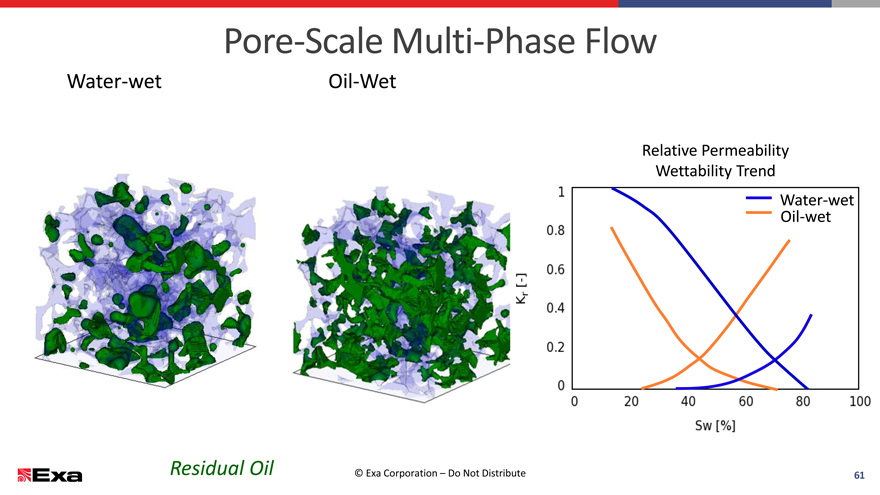
Pore-Scale Multi-Phase Flow
Water-wet Oil-Wet
Relative Permeability
Wettability Trend
Water-wet
Oil-wet
Residual Oil © Exa Corporation – Do Not Distribute61
|
|

Exa Digital Rock Positioning: kr
Capillary Number Trend
Capable Multi-Phase Solver
Accurate physics(%)50
40
Extensive validation
Better Than Physical Testing Saturation30
Faster: days instead of monthsOil20
Consistent: user-independent, reproducible10
Reliable: controlled conditionsResidual0
Application to EOR 1Capillary 10 Number 100 (??106 )1000
Enhanced oil recovery
Screen candidate methods
(steam injection, chemicals)
Test sensitivity to key parameters
(Ca, wettability, viscosity ratio)
© Exa Corporation—Public62
|
|
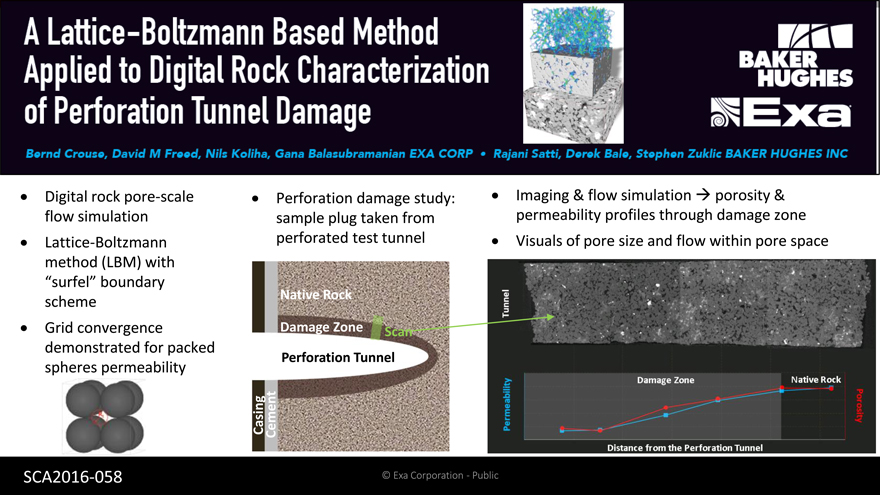
e study: ? Imaging & flow simulation ? porosity &
rom permeability profiles through damage zone
nel ? Visuals of pore size and flow within pore space
n
© Exa Corporation—Public
|
|
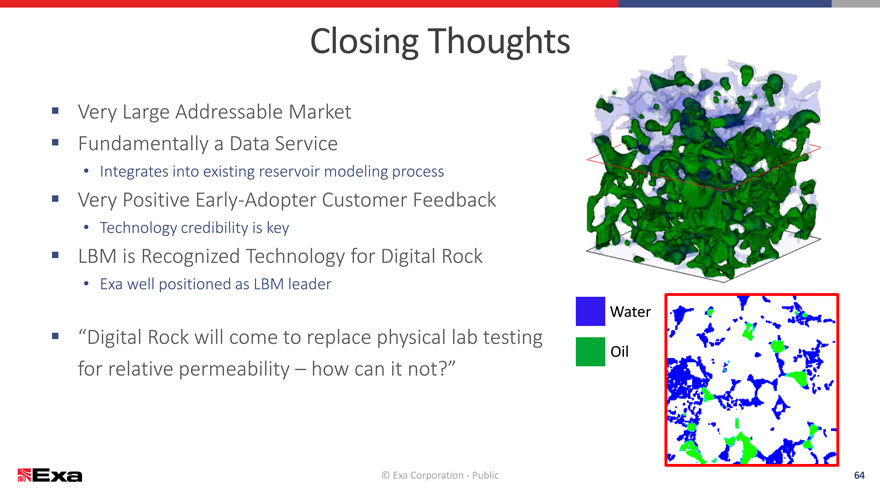
Closing Thoughts
Very Large Addressable Market
Fundamentally a Data Service
Integrates into existing reservoir modeling process
Very Positive Early-Adopter Customer Feedback
Technology credibility is key
LBM is Recognized Technology for Digital Rock
Exa well positioned as LBM leader
Water
“Digital Rock will come to replace physical lab testing
Oil
for relative permeability – how can it not?”
© Exa Corporation—Public 64
|
|
Agenda
8:30 – 9:30 Registration, Coffee, Demonstrations
9:30 – 11:00 Welcome and Exa Overview, Steve Remondi, CEO
? Company Mission, Strategy and Overview
? Ground Transportation Market Update
? Ecosystem: DENSO Partnership
? Aerospace Market Overview
? Oil & Gas introduction and Market Opportunity
11:15 – 11:45 Product Strategy, Suresh Sundaram, SVP Products & Marketing
11:45 – 12:15 Financial Update, Rick Gilbody, CFO
? Financial Model and Strategy
? FY 17 & FY 18 Guidance
12:15 – 1:00 Q & A
Box Lunch
© Exa Corporation—Public 65
|
|
Agenda
8:30 – 9:30 Registration, Coffee, Demonstrations
9:30 – 11:00 Welcome and Exa Overview, Steve Remondi, CEO
? Company Mission, Strategy and Overview
? Ground Transportation Market Update
? Ecosystem: DENSO Partnership
? Aerospace Market Overview
? Oil & Gas introduction and Market Opportunity
11:00 – 11:15 Break
11:45 – 12:15 Financial Update, Rick Gilbody, CFO
? Financial Model and Strategy
? FY 17 & FY 18 Guidance
12:15 – 1:00 Q & A
Box Lunch
© Exa Corporation—Public 66
|
|

PRODUCT STRATEGY
Suresh Sundaram | SVP Products and Marketing | Dec-14-2016
© Exa Corporation—Public
|
|
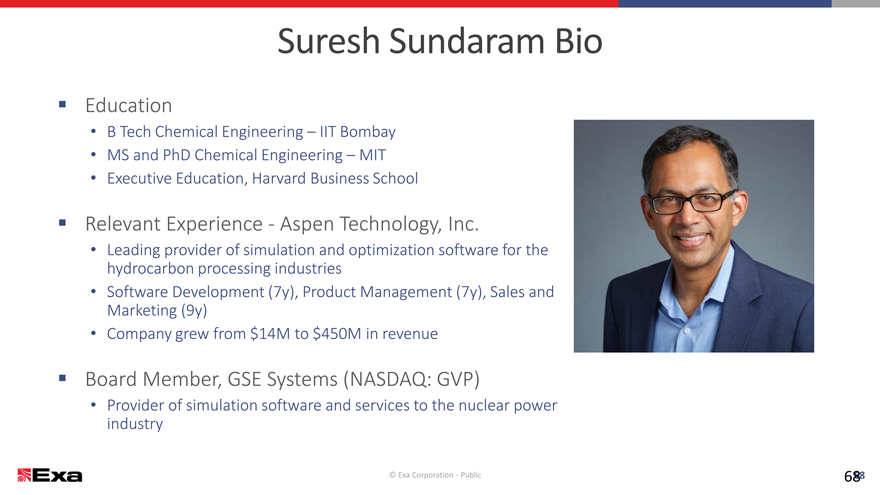
Suresh Sundaram Bio
Education
B Tech Chemical Engineering – IIT Bombay
MS and PhD Chemical Engineering – MIT
Executive Education, Harvard Business School
Relevant Experience—Aspen Technology, Inc.
Leading provider of simulation and optimization software for the hydrocarbon processing industries
Software Development (7y), Product Management (7y), Sales and Marketing (9y)
Company grew from $14M to $450M in revenue
Board Member, GSE Systems (NASDAQ: GVP)
Provider of simulation software and services to the nuclear power industry
© Exa Corporation—Public 68 68
|
|
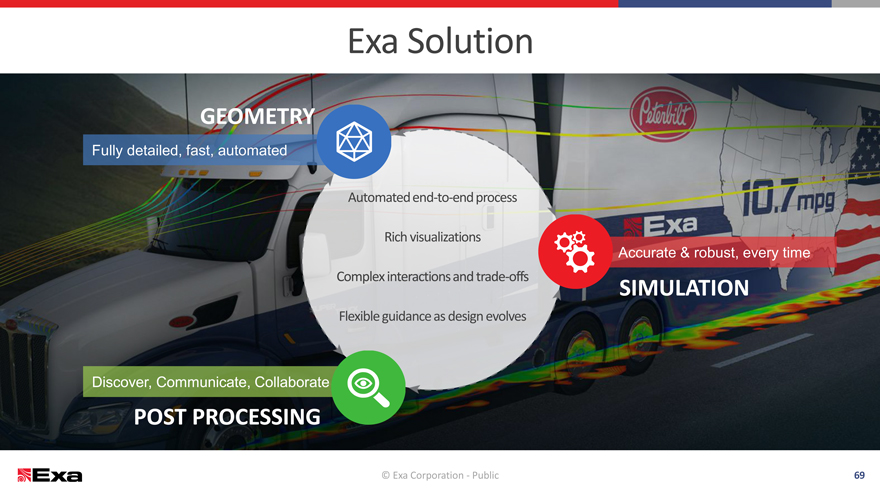
Exa Solution
GEOMETRY
Fully detailed, fast, automated
Automated end-to-end process
Rich visualizations
Accurate & robust, every time
Complex interactions and trade-offs
SIMULATION
Flexible guidance as design evolves
Discover, Communicate, Collaborate
POST PROCESSING
© Exa Corporation—Public 69
|
|
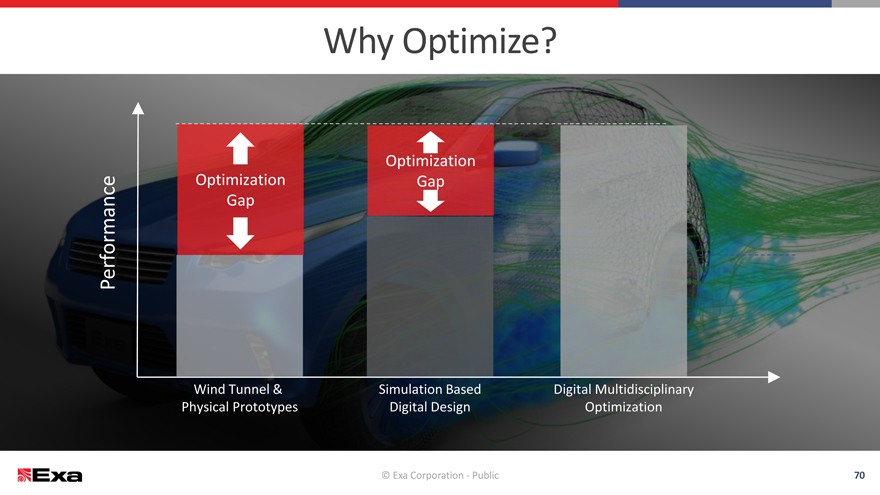
Why Optimize?
Optimization
Optimization Gap
Performance Gap
Wind Tunnel & Simulation BasedDigital Multidisciplinary
Physical Prototypes Digital DesignOptimization
© Exa Corporation—Public70
|
|
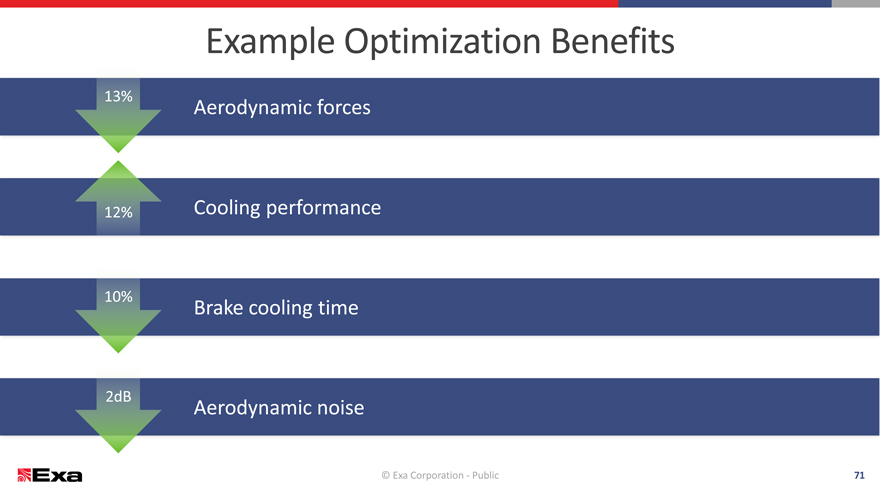
Example Optimization Benefits
13%
Aerodynamic forces
12% Cooling performance
10%
Brake cooling time
2dB
Aerodynamic noise
© Exa Corporation—Public 71
|
|
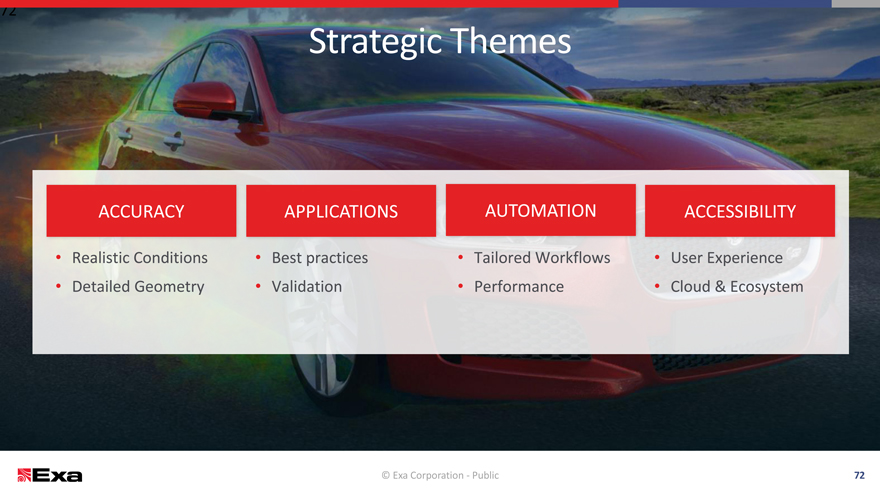
Strategic Themes
ACCURACY APPLICATIONS AUTOMATIONACCESSIBILITY
Realistic Conditions Best practices Tailored Workflows User Experience
Detailed Geometry Validation Performance Cloud & Ecosystem
© Exa Corporation—Public 72
|
|
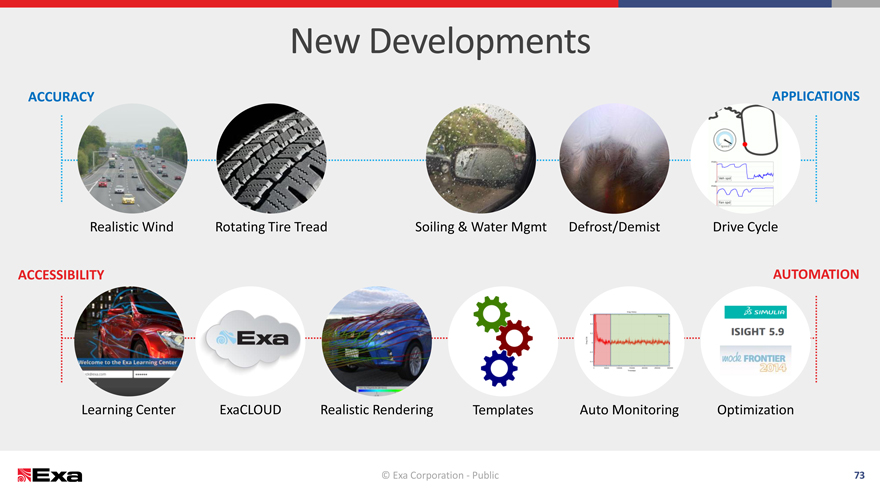
NewDevelopments
ACCURACY APPLICATIONS
Realistic Wind Rotating Tire Tread Soiling & Water MgmtDefrost/DemistDrive Cycle
ACCESSIBILITY AUTOMATION
Learning Center ExaCLOUD Realistic RenderingTemplatesAuto MonitoringOptimization
© Exa Corporation—Public73
|
|
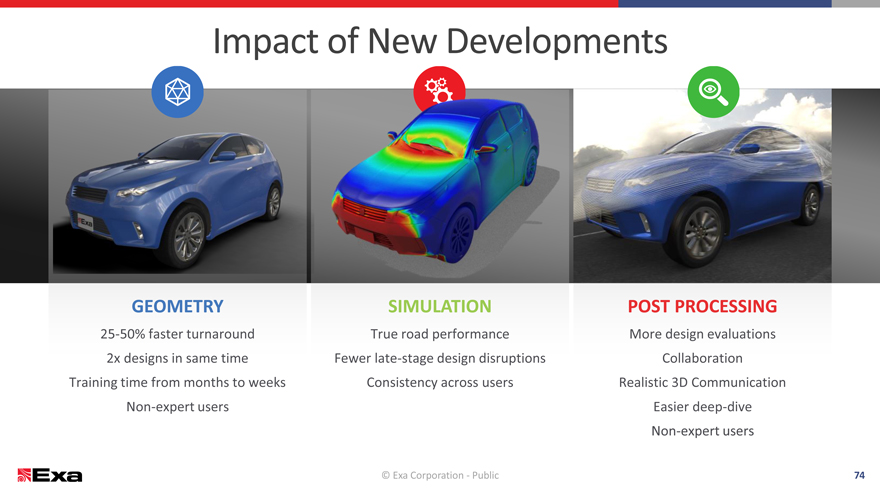
Impact of New Developments
GEOMETRY SIMULATION POST PROCESSING
25-50% faster turnaround True road performance More design evaluations
2x designs in same time Fewer late-stage design disruptions Collaboration
Training time from months to weeks Consistency across users Realistic 3D Communication
Non-expert users Easier deep-dive
Non-expert users
© Exa Corporation—Public 74
|
|
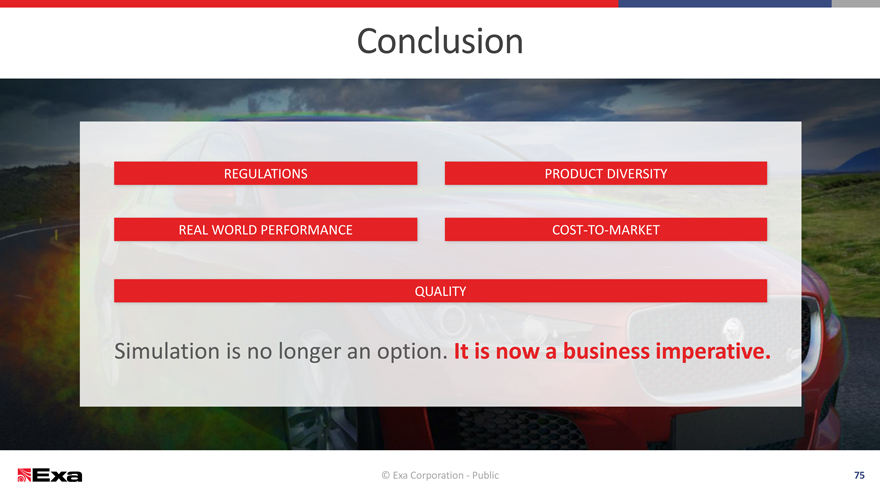
Conclusion
REGULATIONS PRODUCT DIVERSITY
REAL WORLD PERFORMANCE COST-TO-MARKET
QUALITY
Simulation is no longer an option. It is now a business imperative.
© Exa Corporation—Public 75
|
|
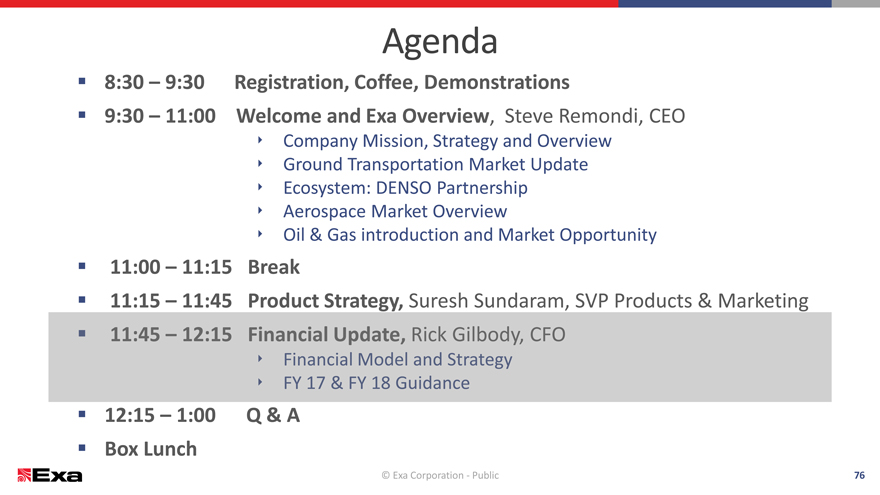
Agenda
8:30 – 9:30 Registration, Coffee, Demonstrations
9:30 – 11:00 Welcome and Exa Overview, Steve Remondi, CEO
? Company Mission, Strategy and Overview
? Ground Transportation Market Update
? Ecosystem: DENSO Partnership
? Aerospace Market Overview
? Oil & Gas introduction and Market Opportunity
11:00 – 11:15 Break
11:15 – 11:45 Product Strategy, Suresh Sundaram, SVP Products & Marketing
12:15 – 1:00 Q & A
Box Lunch
© Exa Corporation—Public 76
|
|
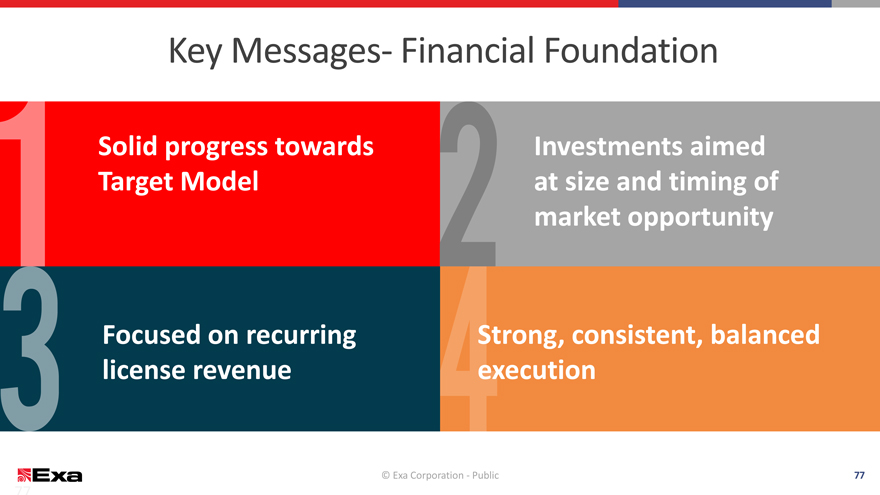
Key Messages- Financial Foundation
Solid progress towards Investments aimed Target Model at size and timing of market opportunity
Focused on recurring Strong, consistent, balanced license revenue execution
© Exa Corporation—Public 77
© Exa Corporation. All rights reserved.
|
|
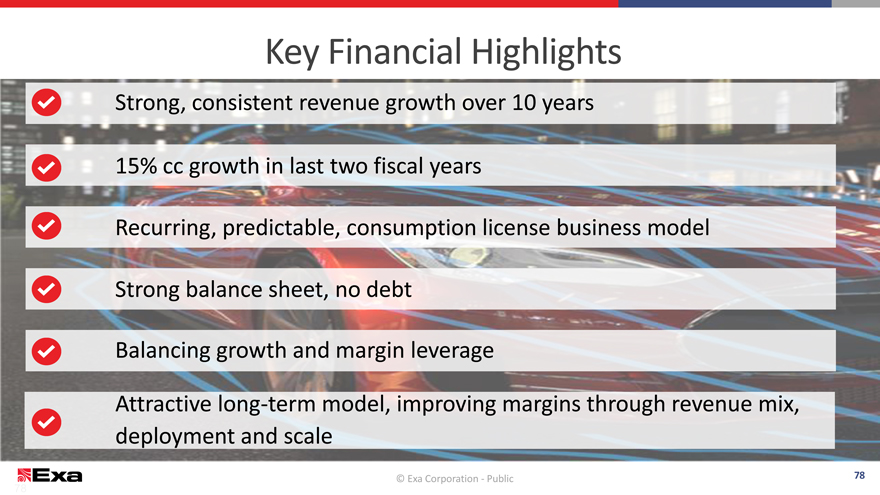
Key Financial Highlights
Strong, consistent revenue growth over 10 years
15% cc growth in last two fiscal years
Recurring, predictable, consumption license business model
Strong balance sheet, no debt
Balancing growth and margin leverage
Attractive long-term model, improving margins through revenue mix, deployment and scale
© Exa Corporation. © Exa Corporation All rights —Public reserved. 78
|
|
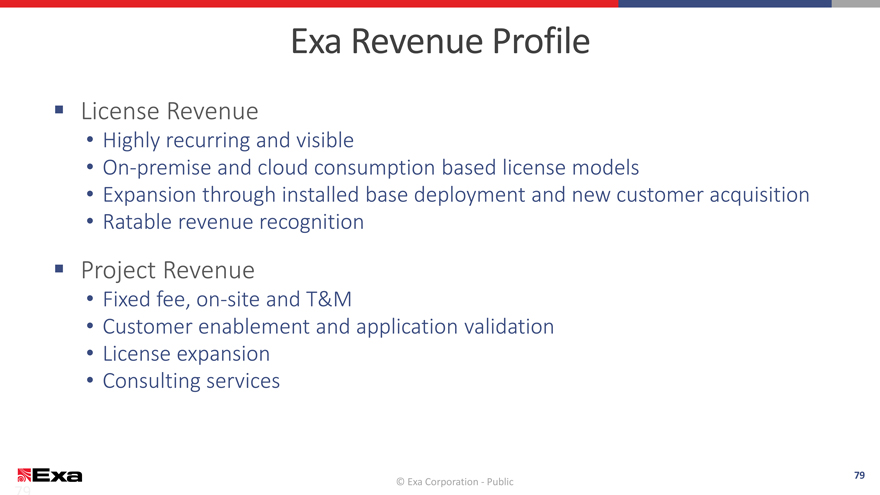
Exa Revenue Profile
License Revenue
Highly recurring and visible
On-premise and cloud consumption based license models
Expansion through installed base deployment and new customer acquisition
Ratable revenue recognition
Project Revenue
Fixed fee, on-site and T&M
Customer enablement and application validation
License expansion
Consulting services
© Exa Corporation. All rights reserved. 79
© Exa Corporation—Public
|
|
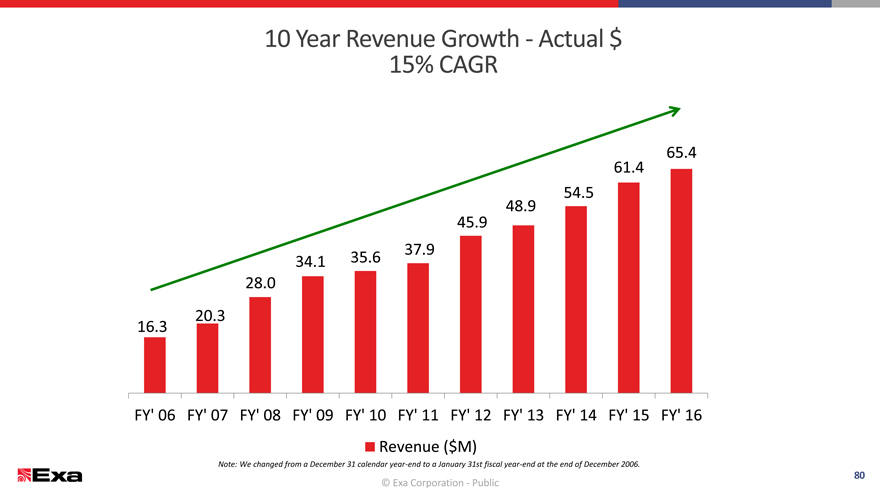
10 Year Revenue Growth—Actual $
15% CAGR
65.4
61.4
54.5
48.9
45.9
34.1 35.637.9
28.0
20.3
16.3
FY’ 06 FY’ 07 FY’ 08 FY’ 09 FY’ 10FY’ 11FY’ 12 FY’ 13 FY’ 14 FY’ 15FY’ 16
Revenue($M)
Note: We changed from a December 31 calendar year-end to a January 31st fiscal year-end at the end of December 2006.
80
© Exa ©Corporation. Exa Corporation All rights—Public reserved.
|
|
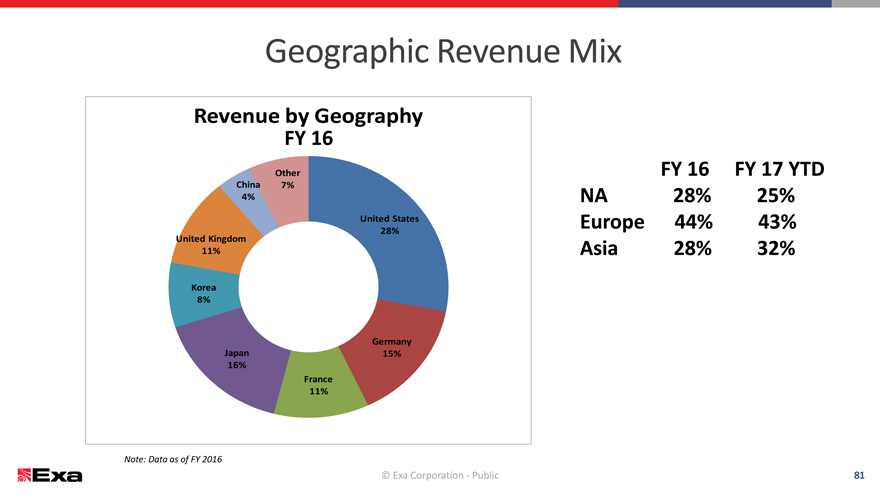
Geographic Revenue Mix
Revenue by Geography
FY 16
Other FY 16FY 17 YTD
China 7%
4% NA28%25%
United States Europe44%43%
28%
United Kingdom
11% Asia28%32%
Korea
8%
Germany
Japan 15%
16%
France
11%
Note: Data as of FY 2016
© Exa Corporation—Public 81
Exa Highly Confidential- Board of Directors Only
|
|
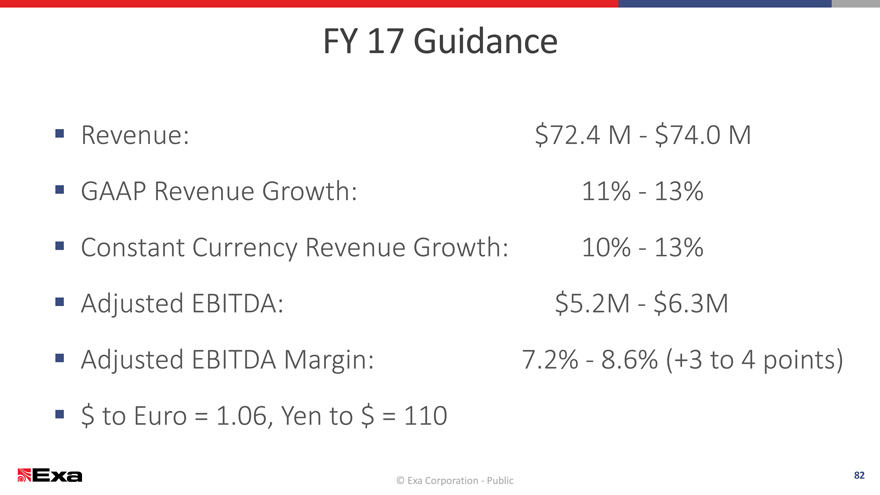
FY 17 Guidance
Revenue: $72.4 M—$74.0 M
GAAP Revenue Growth: 11%—13%
Constant Currency Revenue Growth:10%—13%
Adjusted EBITDA: $5.2M—$6.3M
Adjusted EBITDA Margin: 7.2%—8.6% (+3 to 4points)
$ to Euro = 1.06, Yen to $ = 110
© Exa Corporation. All rights reserved. 82
© Exa Corporation—Public
|
|
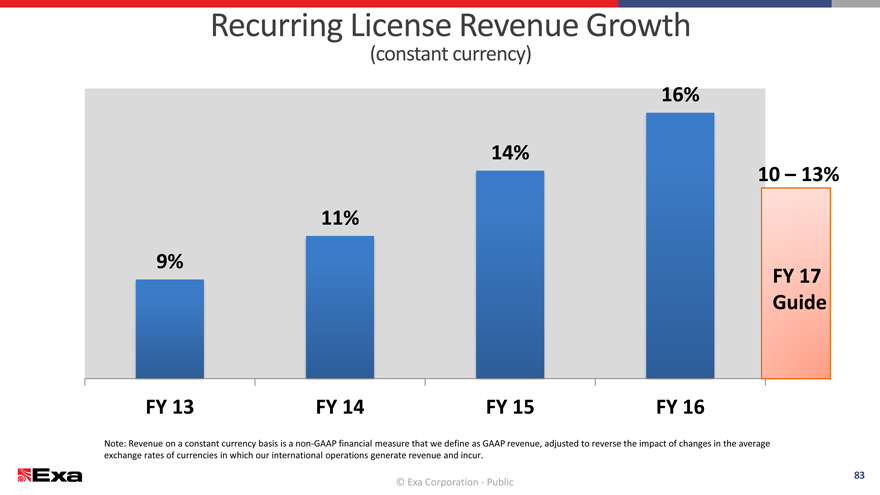
Recurring License Revenue Growth
(constant currency)
16%
14%
10 – 13%
11%
9%
FY 17
Guide
FY 13 FY 14 FY 15FY 16
Note: Revenue on a constant currency basis is a non-GAAP financial measure that we define as GAAP revenue, adjusted to reverse the impact of changes in the average
exchange rates of currencies in which our international operations generate revenue and incur.
© Exa Corporation. All rights reserved. 83
© Exa Corporation—Public
|
|
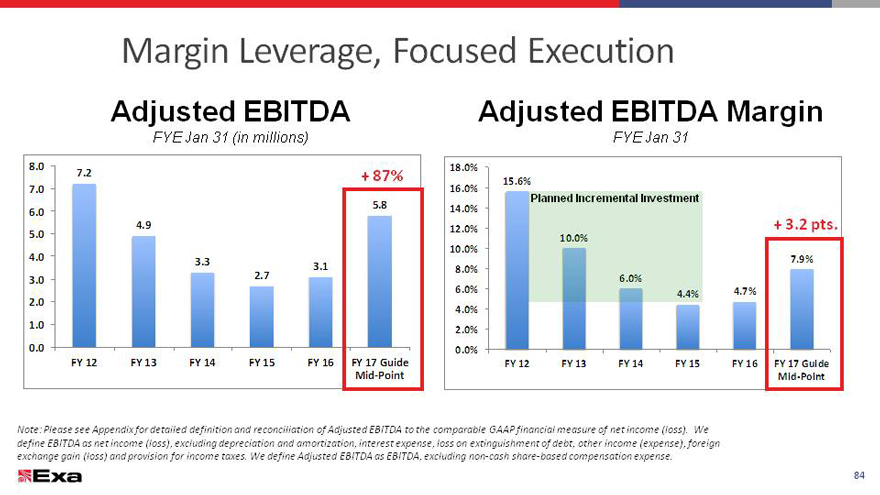
Margin Leverage, Focused Execution
Adjusted EBITDA Adjusted EBITDA Margin
FYE Jan 31 (in millions) FYE Jan 31
8.0 18.0%
7.2 + 87%15.6%
7.0 16.0%
5.814.0%
6.0
4.9 12.0%+ 3.2 pts.
5.0
10.0%
4.0 3.37.9%
3.18.0%
3.0 2.7
6.0%4.7%
2.0
4.0%
1.0 .0%
0.0 .0%
FY 12 FY 13 FY 14FY 15FY 16 FY 17 GuideFY 13FY 14FY 15FY 16 FY 17 Guide
Mid-PointMid-Point
Note: Please see Appendix for detailed definition and reconciliation of Adjusted EBITDA to the comparable GAAP financial measure of net income (loss). We
define EBITDA as net income (loss), excluding depreciation and amortization, interest expense, loss on extinguishment of debt, other income (expense), foreign
exchange gain (loss) and provision for income taxes. We define Adjusted EBITDA as EBITDA, excluding non-cash share-based compensation expense.
© Exa Corporation. All rights reserved.84
84
|
|
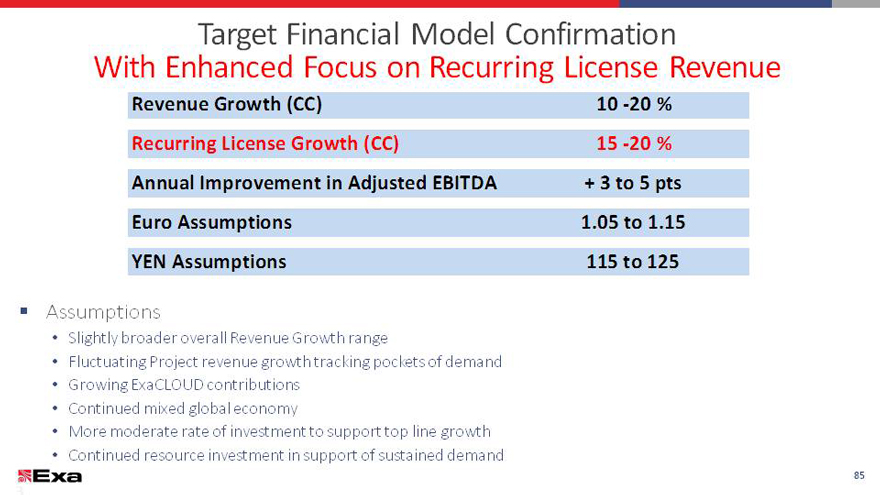
Target Financial Model Confirmation
With Enhanced Focus on Recurring License Revenue
Revenue Growth (CC)10 -20 %
Recurring License Growth (CC)15 -20 %
Annual Improvement in Adjusted EBITDA+ 3 to 5 pts
Euro Assumptions1.05 to 1.15
YEN Assumptions115 to 125
Assumptions
Slightly broader overall Revenue Growth range
Fluctuating Project revenue growth tracking pockets of demand
Growing ExaCLOUD contributions
Continued mixed global economy
More moderate rate of investment to support top line growth
Continued resource investment in support of sustained demand
© Exa Corporation. All rights reserved.85
© Exa Corporation—Public
85
|
|
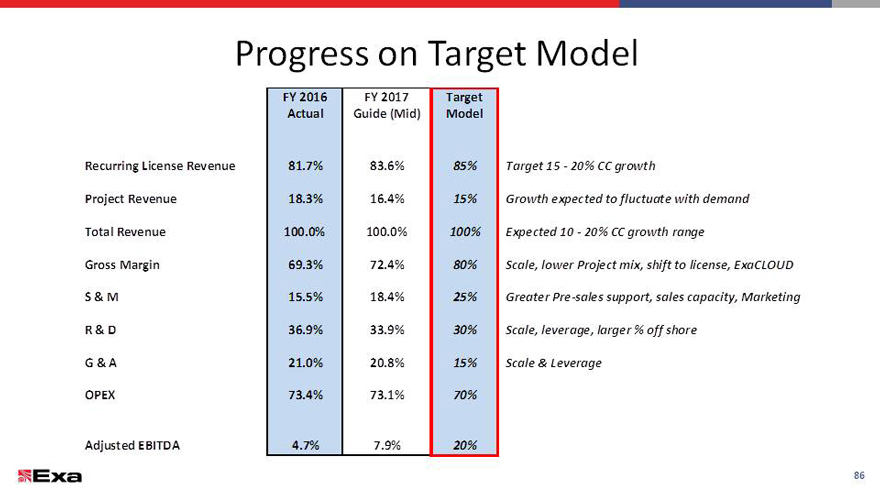
Progress on Target Model
FY 2016 FY 2017Target
Actual Guide (Mid)Model
Recurring License Revenue 81.7% 83.6%85%Target 15—20% CC growth
Project Revenue 18.3% 16.4%15%Growth expected to fluctuate with demand
Total Revenue 100.0% 100.0%100%Expected 10—20% CC growth range
Gross Margin 69.3% 72.4%80%Scale, lower Project mix, shift to license, ExaCLOUD
S & M 15.5% 18.4%25%Greater Pre-sales support, sales capacity, Marketing
R & D 36.9% 33.9%30%Scale, leverage, larger % off shore
G & A 21.0% 20.8%15%Scale & Leverage
OPEX 73.4% 73.1%70%
Adjusted EBITDA 4.7% 7.9%20%
86
|
|
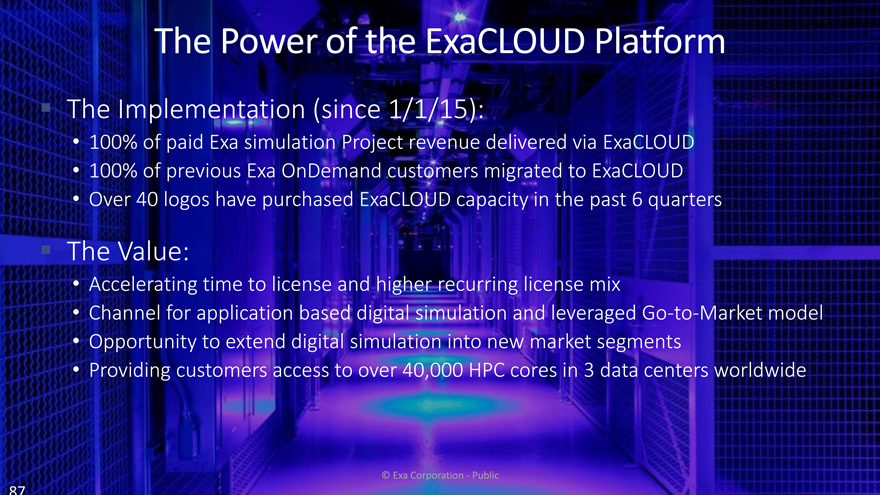
The Power of the ExaCLOUD Platform
The Implementation (since 1/1/15):
100% of paid Exa simulation Project revenue delivered via ExaCLOUD
100% of previous Exa OnDemand customers migrated to ExaCLOUD
Over 40 logos have purchased ExaCLOUD capacity in the past 6 quarters
The Value:
Accelerating time to license and higher recurring license mix
Channel for application based digital simulation and leveraged Go-to-Market model
Opportunity to extend digital simulation into new market segments
Providing customers access to over 40,000 HPC cores in 3 data centers worldwide
© Exa Corporation—Public
|
|
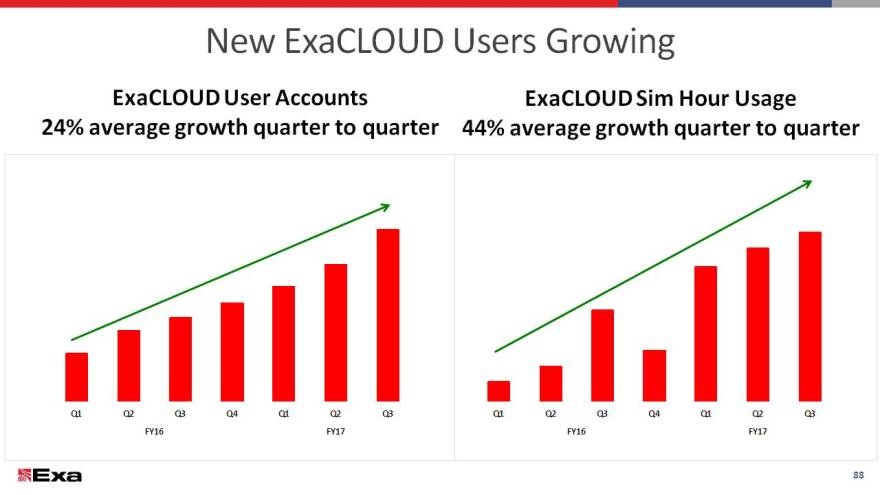
NewExaCLOUD UsersGrowing
ExaCLOUD User Accounts ExaCLOUD Sim-Hour Usage
24% average growth quarter to quarter 44% average growth quarter to quarter
Q1 Q2 Q3Q4Q1Q2Q3Q1Q2Q3Q4Q1Q2Q3
FY16FY17FY16FY17
© Exa Corporation—Public88
|
|
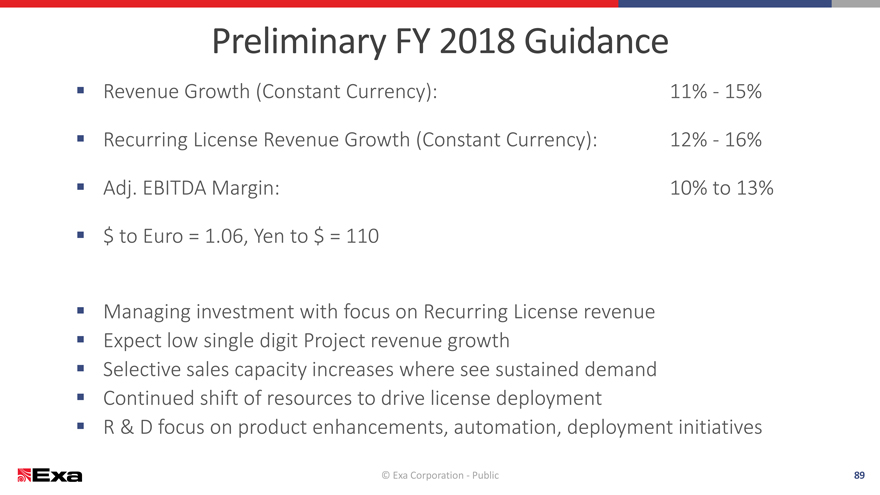
Preliminary FY 2018 Guidance
Revenue Growth (Constant Currency): 11%- 15%
Recurring License Revenue Growth (Constant Currency): 12%- 16%
Adj. EBITDA Margin: 10%to 13%
$ to Euro = 1.06, Yen to $ = 110
Managing investment with focus on Recurring License revenue
Expect low single digit Project revenue growth
Selective sales capacity increases where see sustained demand
Continued shift of resources to drive license deployment
R & D focus on product enhancements, automation, deployment initiatives
© Exa Corporation—Public 89
|
|
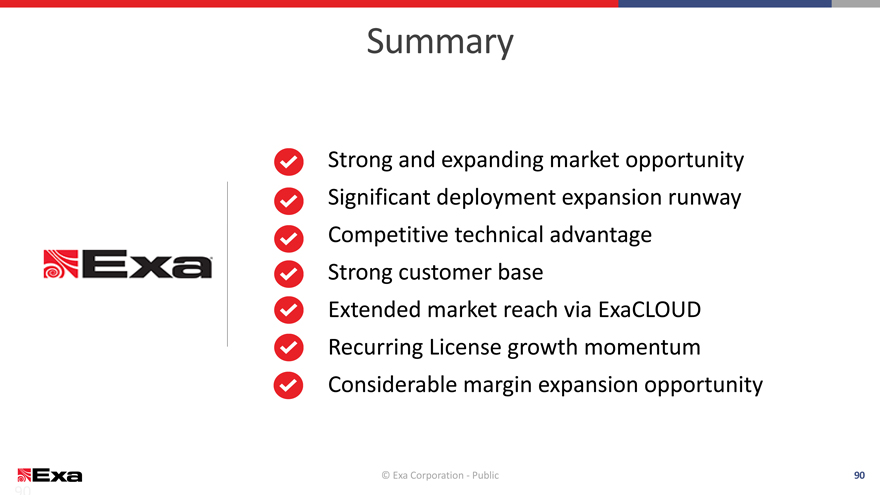
Summary
Strong and expanding market opportunity Significant deployment expansion runway Competitive technical advantage Strong customer base Extended market reach via ExaCLOUD Recurring License growth momentum Considerable margin expansion opportunity
© Exa Corporation—Public 90
|
|
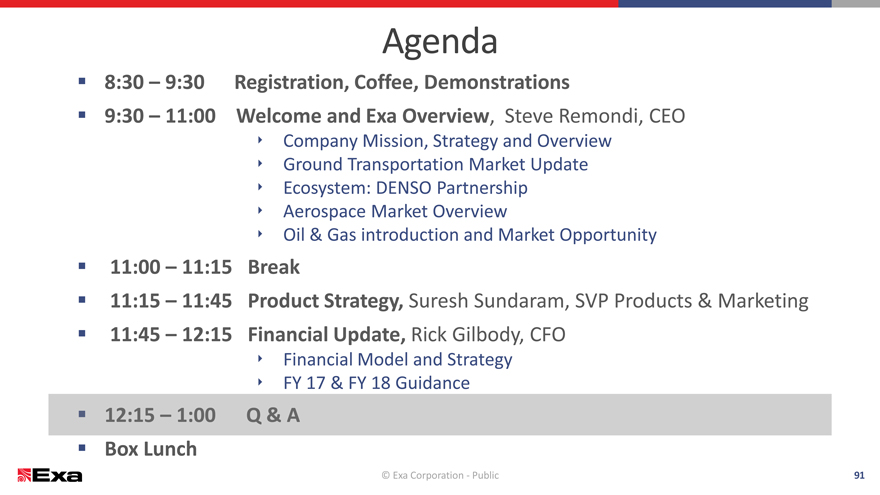
Agenda
8:30 – 9:30 Registration, Coffee, Demonstrations
9:30 – 11:00 Welcome and Exa Overview, Steve Remondi, CEO
? Company Mission, Strategy and Overview
? Ground Transportation Market Update
? Ecosystem: DENSO Partnership
? Aerospace Market Overview
? Oil & Gas introduction and Market Opportunity
11:00 – 11:15 Break
11:15 – 11:45 Product Strategy, Suresh Sundaram, SVP Products & Marketing
11:45 – 12:15 Financial Update, Rick Gilbody, CFO
? Financial Model and Strategy
? FY 17 & FY 18 Guidance
Box Lunch
© Exa Corporation—Public 91
|
|
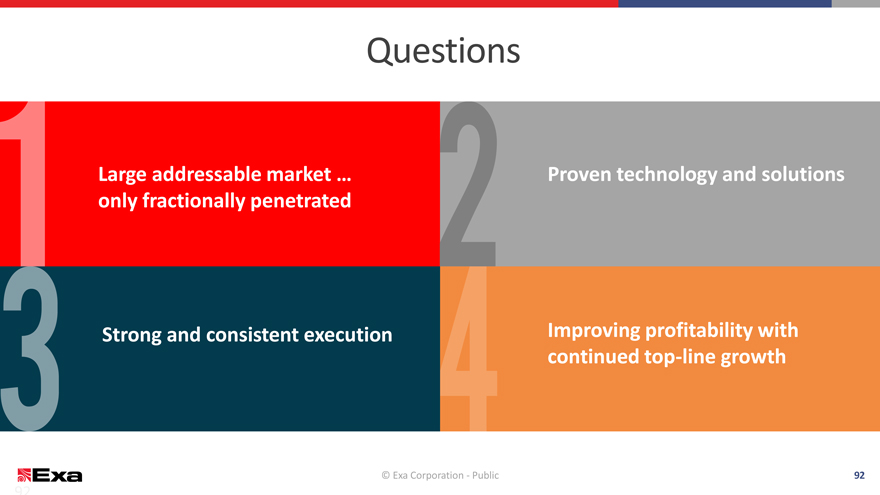
Questions
Large addressable market … Proven technology and solutions
only fractionally penetrated
Strong and consistent execution Improving profitability with
continued top-line growth
© Exa Corporation—Public 92
© Exa Corporation. All rights reserved.
|
|

THANK YOU
© Exa Corporation—Public
|
|

Appendix
© Exa Corporation—Public
|
|
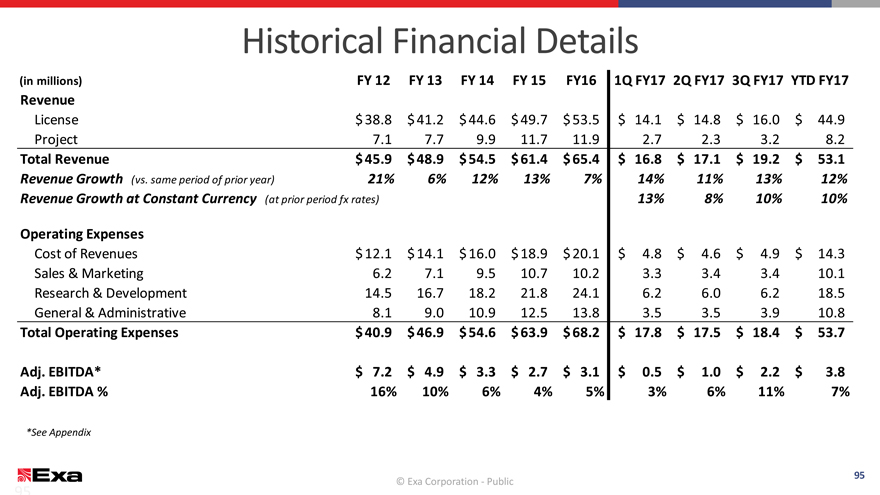
Historical Financial Details
(in millions) FY 12 FY 13FY 14FY 15FY161Q FY172Q FY173Q FY17YTD FY17
Revenue
License $38.8$ 41.2$ 44.6$ 49.7$ 53.5$14.1$14.8$16.0$44.9
Project 7.17.79.911.711.92.72.33.28.2
Total Revenue $45.9$ 48.9$ 54.5$ 61.4$ 65.4$16.8$17.1$19.2$53.1
Revenue Growth (vs. same period of prior year) 21%6%12%13%7%14%11%13%12%
Revenue Growth at Constant Currency (at prior period fx rates) 13%8%10%10%
Operating Expenses
Cost of Revenues $12.1$ 14.1$ 16.0$ 18.9$ 20.1$4.8$4.6$4.9$14.3
Sales & Marketing 6.27.19.510.710.23.33.43.410.1
Research & Development 14.516.718.221.824.16.26.06.218.5
General & Administrative 8.19.010.912.513.83.53.53.910.8
Total Operating Expenses $40.9$ 46.9$ 54.6$ 63.9$ 68.2$17.8$17.5$18.4$53.7
Adj. EBITDA* $7.2$4.9$3.3$2.7$ 3.1$0.5$1.0$2.2$3.8
Adj. EBITDA % 16%10%6%4%5%3%6%11%7%
*See Appendix
© Exa Corporation. All rights reserved. 95
© Exa Corporation—Public
95
|
|
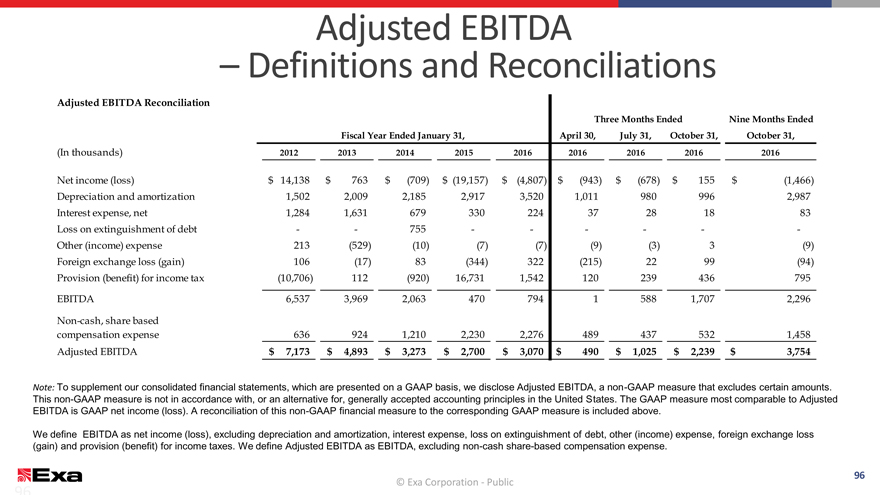
Adjusted EBITDA
– Definitions and Reconciliations
Adjusted EBITDA Reconciliation
Three Months EndedNine Months Ended
Fiscal Year Ended January 31,April 30,July 31,October 31,October 31,
(In thousands) 201220132014201520162016201620162016
Net income (loss) $14,138$763$(709)$(19,157)$(4,807)$(943)$(678)$155$(1,466)
Depreciation and amortization 1,5022,0092,1852,9173,5201,0119809962,987
Interest expense, net 1,2841,63167933022437281883
Loss on extinguishment of debt --755------
Other (income) expense 213(529)(10)(7)(7)(9)(3)3(9)
Foreign exchange loss (gain) 106(17)83(344)322(215)2299(94)
Provision (benefit) for income tax (10,706)112(920)16,7311,542120239436795
EBITDA 6,5373,9692,06347079415881,7072,296
Non-cash, share based
compensation expense 6369241,2102,2302,2764894375321,458
Adjusted EBITDA $7,173$4,893$3,273$2,700$3,070$490$1,025$2,239$3,754
Note: To supplement our consolidated financial statements, which are presented on a GAAP basis, we disclose Adjusted EBITDA, a non-GAAP measure that excludes certain amounts.
This non-GAAP measure is not in accordance with, or an alternative for, generally accepted accounting principles in the United States. The GAAP measure most comparable to Adjusted
EBITDA is GAAP net income (loss). A reconciliation of this non-GAAP financial measure to the corresponding GAAP measure is included above.
We define EBITDA as net income (loss), excluding depreciation and amortization, interest expense, loss on extinguishment of debt, other (income) expense, foreign exchange loss
(gain) and provision (benefit) for income taxes. We define Adjusted EBITDA as EBITDA, excluding non-cash share-based compensation expense.
© Exa Corporation. All rights reserved.96
© Exa Corporation—Public
96
Serious News for Serious Traders! Try StreetInsider.com Premium Free!
You May Also Be Interested In
- 420 with CNW — Study Enumerates Therapeutic Effects, Quality of Life Benefits of Medical Cannabis
- Lincoln Avenue Communities Breaks Ground on Affordable Housing Development in Casa Grande, Arizona
- Publication of 2023 Annual Report of Azerion Group N.V.
Create E-mail Alert Related Categories
SEC FilingsSign up for StreetInsider Free!
Receive full access to all new and archived articles, unlimited portfolio tracking, e-mail alerts, custom newswires and RSS feeds - and more!
