Form 8-K EPIQ SYSTEMS INC For: May 03
UNITED STATES
SECURITIES AND EXCHANGE COMMISSION
Washington, D.C. 20549
FORM 8-K
CURRENT REPORT
Pursuant to Section 13 or 15(d)
of the Securities Exchange Act of 1934
Date of Report (Date of earliest event reported): May 3, 2016
EPIQ SYSTEMS, INC.
(Exact name of registrant as specified in its charter)
| Missouri | 001-36633 | 48-1056429 | ||
| (State or other jurisdiction of incorporation) |
(Commission File Number) |
(IRS Employer Identification Number) |
501 Kansas Avenue
Kansas City, Kansas 66105
(Address of principal executive offices, including zip code)
(913) 621-9500
(Registrant’s telephone number, including area code)
Check the appropriate box below if the Form 8-K filing is intended to simultaneously satisfy the filing obligation of the registrant under any of the following provisions (see General Instruction A.2. below):
| ¨ | Written communications pursuant to Rule 425 under the Securities Act (17 CFR 230.425). |
| ¨ | Soliciting material pursuant to Rule 14a-12 under the Exchange Act (17 CFR 240.14a-12). |
| ¨ | Pre-commencement communications pursuant to Rule 14d-2(b) under the Exchange Act (17 CFR 240.14d-2(b)). |
| ¨ | Pre-commencement communications pursuant to Rule 13e-4(c) under the Exchange Act (17 CFR 240.13e-4(c)). |
| Item 2.02. | Results of Operations and Financial Condition. |
On May 3, 2016, Epiq Systems, Inc. (“Epiq Systems”) issued a press release announcing its financial results for the three months ended March 31, 2016. The full text of the press release (including financial tables) as well as the investor presentation with respect to Epiq Systems’ financial results for the three months ended March 31, 2016 for use in connection with an earnings conference call are being furnished as Exhibit 99.1 and Exhibit 99.2 to this Current Report on Form 8-K, respectively, and are incorporated herein by reference.
The press release and the investor presentation include the following non-GAAP financial measures: (i) adjusted net income (net income adjusted for amortization of acquisition intangibles, intangible asset impairment, share-based compensation expense, contingent equity award expense, acquisition and related expense, loan fee amortization, litigation (recovery) expense, timing of recognition of expense, reorganization expense, (gain) loss on disposition of assets, strategic and financial review expense, and the effect of tax adjustments that are outside of Epiq Systems’ anticipated effective tax rate, all net of tax), (ii) adjusted net income per share, calculated as adjusted net income on a fully diluted per share basis, and (iii) adjusted EBITDA (net income adjusted for depreciation and amortization, share-based compensation expense, contingent equity award expense, acquisition and related expense, net expense related to financing, litigation (recovery) expense, timing of recognition of expense, reorganization expense, (gain) loss on disposition of assets, strategic and financial review expense, and income tax expense (benefit)). Income taxes typically represent a complex element of a company’s income statement and effective tax rates can vary widely between different periods. Epiq Systems uses an approximate statutory tax rate of 40% to reflect income tax effects in the presentation of its adjusted net income and adjusted net income per share. Utilization of an approximate statutory tax rate for presentation of the non-GAAP measures is done to allow a consistent basis for investors to understand financial performance of the company across historical periods.
These non-GAAP financial measures are intended to supplement the GAAP financial information by providing additional insight regarding results of operations and to allow a comparison with other companies, many of whom use similar non-GAAP financial measures to supplement their GAAP results. These non-GAAP financial measures are reconciled in the press release and the investor presentation slides to the most directly comparable measures as reported in accordance with GAAP, and should be viewed in addition to, and not in lieu of, such comparable financial measures.
Management of Epiq Systems uses these non-GAAP financial measures, together with GAAP results, as it assesses current and prospective operating results and for assessing anticipated operating results for potential acquisitions. The compensation committee has used non-GAAP financial measures in evaluating the performance of management and in determining executive bonuses. Management of Epiq Systems believes these non-GAAP measures may be useful to investors by comparing the results of operations of Epiq Systems without the effect of these items. Certain items are excluded from these non-GAAP financial measures to provide additional comparability measures from period to period. These non-GAAP financial measures will not be defined in the same manner by all companies and may not be comparable to other companies.
The information in this Current Report on Form 8-K, including Exhibit 99.1 and Exhibit 99.2, shall not be deemed “filed” for purposes of Section 18 of the Securities Exchange Act of 1934, as amended (the “Exchange Act”), or otherwise subject to the liabilities of that section, and shall not be deemed to be incorporated by reference into any registration statement or other filing with the Securities and Exchange Commission made by Epiq Systems under the Securities Act of 1933, as amended, or the Exchange Act, whether filed before or after the date hereof, except as otherwise expressly stated by specific reference in such filing.
| Item 9.01. | Financial Statements and Exhibits. |
(d) Exhibits.
The following exhibits are furnished as part of this report:
| Exhibit 99.1. |
Epiq Systems, Inc. Press Release issued May 3, 2016, reporting Epiq Systems, Inc.’s financial results for the three months ended March 31, 2016. | |
| Exhibit 99.2. |
Investor presentation with respect to Epiq Systems, Inc.’s financial results for the three months ended March 31, 2016 for use on the earnings conference call on May 3, 2016. | |
SIGNATURES
Pursuant to the requirements of the Securities Exchange Act of 1934, the registrant has duly caused this report to be signed on its behalf by the undersigned hereunto duly authorized.
| EPIQ SYSTEMS, INC. | ||||||
| Date: May 3, 2016 | ||||||
| By: | /s/ Tom W. Olofson | |||||
| Name: | Tom W. Olofson | |||||
| Title: | Chairman of the Board, Chief Executive Officer and Director | |||||
Exhibit 99.1

|
Press Release |
Epiq Reports First Quarter 2016 Results, Reaffirms 2016 Outlook
Conference Call Today at 4:30 pm ET
| • | Adjusted EPS (non-GAAP) of $0.20(1) |
| • | Adjusted EBITDA of $26.7 million(1) |
| • | Operating Revenue of $131.5 million |
Kansas City, Kan. (May 3, 2016) — Epiq Systems, Inc. (“Epiq”) (NASDAQ: EPIQ), a leading global provider of integrated technology and services for the legal profession, today announced results for its first quarter ended March 31, 2016. Epiq will hold an investor conference call today at 4:30 pm ET (information below).
Summary Results (Unaudited)
| Three months ended March 31, |
||||||||
| (In millions, except share count and per share data) |
2016 | 2015 | ||||||
| Segment Operating Revenue |
||||||||
| Technology |
$ | 93.2 | $ | 70.1 | ||||
| Bankruptcy & Settlement Administration |
$ | 38.3 | $ | 37.7 | ||||
| Total Operating Revenue |
$ | 131.5 | $ | 107.8 | ||||
| Net Income (Loss) |
($ | 0.1 | ) | $ | 1.7 | |||
| Net Income Per Diluted Share |
$ | 0.0 | $ | 0.05 | ||||
| Adjusted EBITDA(1) |
$ | 26.7 | $ | 21.4 | ||||
| Adjusted Net Income(1) |
$ | 7.3 | $ | 5.7 | ||||
| Adjusted Earnings Per Diluted Share(1) |
$ | 0.20 | $ | 0.15 | ||||
| Adjusted Diluted Shares (in thousands) |
37,357 | 36,914 | ||||||
| Net Cash provided by (used in) Operating Activities |
($ | 10.3 | ) | $ | 3.8 | |||
| (1) | Adjusted EBITDA, adjusted net income and adjusted earnings per share are all non-GAAP financial measures. See the accompanying tables herein for information regarding these measures and reconciliation to the most comparable GAAP measure. |
First Quarter 2016 Financial Overview
Quarterly consolidated operating revenue increased 22% to $131.5 million compared to $107.8 million in first quarter 2015. Adjusted EBITDA rose 25% to $26.7 million and adjusted earnings per diluted share increased 33% to $0.20 compared to the prior year quarter. The increases reflect Technology segment
1
operating revenue growth of 33% primarily driven by domestic and international ESI (electronically stored information), which includes operating revenue from Iris Data Services, and North American document review services. The increase in operating revenue was complemented by operating efficiency and cost control initiatives.
First quarter 2016 adjusted net income increased 28% to $7.3 million compared to $5.7 million in first quarter 2015. Quarterly net income decreased by $1.8 million to a net loss of $0.1 million compared to net income of $1.7 million in the prior year quarter. The quarterly net loss reflects increases in amortization of identifiable intangible assets of $1.1 million and interest expense of $1.2 million primarily related to the acquisition of Iris Data Services in 2015 and an increase of $1.3 million related to Epiq’s ongoing review of strategic and financial alternatives. Increases in the aforementioned areas were partially offset by quarterly operating revenue gains.
First quarter 2016 capital expenditures, including property and equipment and software development, declined 38% to $5.3 million compared to $8.6 million in the prior year quarter. Quarterly net cash from operating activities declined $14.2 million compared to the prior year quarter reflecting higher accounts receivables resulting from increased revenue in prior quarters and the timing of revenue and collections.
Recent Company Highlights
| • | Won significant eDiscovery engagements across verticals, including financial services and automotive, as well as other multi-jurisdictional matters with global law firms, including activity originating from Frankfurt, Germany. The Frankfurt office, launched in September 2015, is Epiq’s fastest growing new market to date in terms of operating revenue. |
| • | Unveiled DMXTM (DocuMatrix®), a new proprietary business intelligence platform that offers Epiq’s eDiscovery clients unprecedented insight to all of their case data and ultimately makes them more productive. |
| • | Released an enhanced ArcSM managed services offering tailored to corporate clients that addresses specific challenges in conducting eDiscovery, such as forecasting and cost control. |
| • | Appointed Deirdre McGuinness as managing director to focus on enterprise-wide initiatives to strengthen and expand law firm and corporate client relationships. Ms. McGuinness was previously managing director of corporate restructuring services at Kurtzman Carson Consultants, LLP (KCC). |
| • | Declared dividend of $0.09 per share and paid on May 2, 2016 to shareholders of record at the close of business on April 4, 2016. |
2
“We are pleased to report a strong start to 2016 for Epiq and one that followed a solid close to 2015. Epiq has demonstrated the benefits of our global scale, successful integration of Iris and company-wide cost control initiatives over the last few quarters,” said Tom W. Olofson, chairman and chief executive officer.
Mr. Olofson continued, “We had stronger than expected operating revenue relative to our first quarter forecast. Given that it is early in the year—and quarterly fluctuations in revenue are inherent in our business—we are maintaining our 2016 outlook at this time. We will continue executing our strategic plan for achievement this year, particularly in the areas of margin and profitability.”
Segment Review
Technology Segment (eDiscovery)
| Three months ended March 31, |
||||||||
| (In millions)(Unaudited) |
2016 | 2015 | ||||||
| Operating Revenue |
$ | 93.2 | $ | 70.1 | ||||
| Adjusted EBITDA |
$ | 25.8 | $ | 18.2 | ||||
| Segment Operating Revenue Mix By Service Type |
||||||||
| Electronically Stored Information (ESI) |
62 | % | 60 | % | ||||
| Document Review |
38 | % | 40 | % | ||||
| Segment Operating Revenue Mix By Region |
||||||||
| North America |
$ | 71.2 | $ | 53.7 | ||||
| Europe and Asia |
$ | 22.0 | $ | 16.4 | ||||
Epiq’s Technology segment provides integrated technology solutions for electronic discovery (eDiscovery), including ESI, document review and eDiscovery managed services. First quarter 2016 Technology segment operating revenue grew 33% compared to the prior year period. The increase reflects significant retentions and expansions of ongoing projects in global ESI and document review services related to M&A second requests, corporate litigation and regulatory investigations. Quarterly operating revenue from Epiq’s international eDiscovery operations increased 34% on a year-over-year basis mostly from new clients and retentions in Europe and Asia. International eDiscovery comprised 24% of Technology segment revenue compared to 23% in the prior year quarter.
Segment adjusted EBITDA grew 42% versus the prior year period reflecting an operating revenue mix shift to higher margin ESI in domestic and international operations relative to document review, in addition to the aforementioned increase in Technology operating revenue. The increases were complemented by improved margin in document review services and reduced capital spending and IT costs.
3
Bankruptcy and Settlement Administration (“B&SA”) Segment
| Three months ended March 31 |
||||||||
| (In millions)(Unaudited) |
2016 | 2015 | ||||||
| Operating Revenue |
$ | 38.3 | $ | 37.7 | ||||
| Adjusted EBITDA |
$ | 11.7 | $ | 12.7 | ||||
First quarter 2016 B&SA segment operating revenues increased 1.6%, primarily driven by growth in data breach response engagements, including the Office of Personnel Management case initially announced last fall. Settlement administration operating revenue growth of 29% offset a year-over-year operating revenue decline of 23% in bankruptcy solutions, which was in-line with company estimates. The decrease in bankruptcy solutions operating revenue reflects a lower level of activity related to a large Ch. 11 engagement and non-traditional bankruptcy clients compared to the prior year period, and a competitive corporate restructuring market amid a persistent low level of bankruptcy filings. Quarterly segment adjusted EBITDA decreased 8% on a year over year basis reflecting an increase in lower margin noticing and mailing services relative to higher margin bankruptcy services compared to the same period last year.
2016 Financial Outlook
Based on current expectations, Epiq maintains its initial 2016 financial outlook and estimates operating revenue for 2016 between $520 million and $540 million, adjusted EBITDA between $112 million and $118 million, and adjusted earnings per share between $0.87 and $0.90. This guidance includes a number of assumptions based on current facts and expectations, which are subject to change.
It is not possible to provide a reconciliation of estimated adjusted EBITDA or adjusted net income (used to calculate adjusted earnings per share) to estimated net income due to the unknown effect, timing and potential significance of certain income statement items. The methodology to reconcile adjusted EBITDA and adjusted net income to net income and the calculation of adjusted earnings per share is included in the accompanying tables.
INVESTOR CONFERENCE CALL INFORMATION
Management will host an investor conference call today at 4:30 p.m. ET (3:30 p.m. CT).
| Call Dial in: |
(877) 303-6311 or (631) 813-4730 | |
| Webcast URL: |
http://www.epiqsystems.com/investors/corporate-overview/ | |
| Audio replay: |
(855) 859-2056, ID# 93486746, available through May 10, 2016 | |
4
About Epiq Systems
Epiq (NASDAQ: EPIQ) is a leading global provider of professional services and integrated technology for the legal profession. Our innovative solutions are designed to streamline the administration of litigation, investigations, financial transactions and regulatory compliance, corporate restructuring and bankruptcies, class action and mass tort proceedings, federal regulatory actions and data breach responses. Epiq’s subject-matter experts bring clarity to complexity, create efficiency through expertise and deliver confidence to our clients around the world. For more information, visit us at www.epiqsystems.com.
Use of Non-GAAP Financial Measures
This press release includes the following non-GAAP financial measures: (i) adjusted net income (net income (loss) adjusted for amortization of acquisition intangibles, share-based compensation expense, contingent equity award expense, acquisition and related expense, loan fee amortization and write off, litigation (recovery) expense, timing of recognition of expense, reorganization expense, gain or loss on disposition of assets, strategic and financial review expense, and the effect of tax adjustments that are outside of Epiq Systems’ anticipated effective tax rate, all net of tax), (ii) adjusted earnings per share, calculated as adjusted net income on a fully diluted per share basis, and (iii) adjusted EBITDA (net income (loss) adjusted for depreciation and amortization expense, share-based compensation expense, contingent equity award expense, acquisition and related expense, net expense related to financing, litigation (recovery) expense, timing of recognition of expense, reorganization expense, gain or loss on disposition of assets, strategic and financial review expense, and income tax expense (benefit)). Income taxes typically represent a complex element of a company’s income statement and effective tax rates can vary widely between different periods. Epiq Systems uses an approximate statutory tax rate of 40% to reflect income tax effects in the presentation of its adjusted net income and adjusted net income per share. Utilization of an approximate statutory tax rate for presentation of the non-GAAP measures is done to allow a consistent basis for investors to understand financial performance of the company across historical periods.
Although Epiq Systems reports its results using GAAP, Epiq Systems also uses non-GAAP financial measures when management believes those measures provide useful information for its shareholders. These non-GAAP financial measures are intended to supplement the GAAP financial information by providing additional insight regarding results of operations and to allow a comparison with other companies, many of whom use similar non-GAAP financial measures to supplement their GAAP results. Certain items are excluded from these non-GAAP financial measures to provide additional comparability measures from period to period. These non-GAAP financial measures will not be defined in the same manner by all companies and may not be comparable to other companies. These non-GAAP financial measures are reconciled in the accompanying tables to the most directly comparable measures as reported in accordance with GAAP, and should be viewed in addition to, and not in lieu of, such comparable financial measures.
Forward-looking and Cautionary Statements
This press release includes forward-looking statements. These forward-looking statements include, but are not limited to any projection or expectation of earnings, revenue or other financial items; the plans, strategies and objectives of management for future operations; factors that may affect our operating results; new products or services; the demand for our products and services; our ability to consummate acquisitions, successfully integrate them into our operations and achieve expected synergies; future capital expenditures; effects of current or future economic conditions or performance; industry trends and other matters that do not relate strictly to historical facts or statements of assumptions underlying any of the foregoing. These forward-looking statements are based on our current expectations. In this press release, we make statements that plan for or anticipate the future. Forward-looking statements may be identified by words or phrases such as “believe,” “expect,” “anticipate,” “should,” “planned,” “may,” “estimated,” “goal,” “objective,” “seeks,” and “potential” and variations of these words and similar expressions or negatives of these words. Section 27A of the Securities Act of 1933, as amended, and
5
Section 21E of the Securities Exchange Act of 1934, as amended, provide a “safe harbor” for forward-looking statements. Because forward-looking statements involve future risks and uncertainties, listed below are a variety of factors that could cause actual results and experience to differ materially from the anticipated results or other expectations expressed in our forward-looking statements. These factors include (1) failure to keep pace with technological changes and significant changes in the competitive environment, (2) risks associated with cyber-attacks, interruptions or delays in services at data centers, (3) general economic conditions and the cyclical nature of certain markets; (4) risks of errors or fraud related to our business processes, (5) interruptions or delays in service at data centers we utilize for delivery of our services, (6) undetected errors in, and failure of operation of, software products releases, (7) unavailability of third-party technology, (8) failure of our financial, operating and information systems to operate as intended, (9) our inability to attract, develop and retain executives and other qualified employees, (10) risks associated with the integration of acquisitions into our existing business operations, (11) risks associated with our international operations, (12) risks of litigation for infringement of proprietary rights, (13) future government legislation or changes in judicial interpretations, (14) any material non-cash write-downs based on impairment of our goodwill, (15) fluctuations in our quarterly results that could cause fluctuations in the market price of our common stock, (16) volatility of the market price of our common stock, (17) the impact of our current review process of strategic alternatives, (18) the impact of potential proxy contests and related litigation, (19) our failure to pay cash dividends, (20) our inability to raise additional capital to fund our operations because of our level of indebtedness, (21) our inability to maintain compliance with debt covenant ratios, (22) risks associated with indebtedness and interest rate fluctuations, (23) risks associated with provisions of our articles of incorporation that prevent a takeover of Epiq, and (24) other risks detailed from time to time in our filings with the Securities and Exchange Commission, including our Annual Report on Form 10-K, Quarterly Reports on Form 10-Q and Current Reports on Form 8-K. In addition, there may be other factors not included in our Securities and Exchange Commission filings that may cause actual results to differ materially from any forward-looking statements. We undertake no obligation to update publicly or revise any forward-looking statements contained herein to reflect future events or developments, except as required by law.
| Investor Contacts Kelly Bailey Epiq Systems 913-621-9500 |
Chris Eddy Catalyst Global 212-924-9800 |
###
6
EPIQ SYSTEMS, INC. AND SUBSIDIARIES
CONDENSED CONSOLIDATED STATEMENTS OF OPERATIONS
(Unaudited)
(In thousands, except per share data)
| Three Months Ended | ||||||||
| March 31, | ||||||||
| 2016 | 2015 | |||||||
| Revenue: |
||||||||
| Operating revenue |
$ | 131,528 | $ | 107,755 | ||||
| Reimbursable expenses |
15,003 | 11,273 | ||||||
|
|
|
|
|
|||||
| Total revenue |
146,531 | 119,028 | ||||||
| Operating Expense: |
||||||||
| Direct cost of operating revenue (exclusive of depreciation and amortization shown separately below) |
65,153 | 51,029 | ||||||
| Reimbursable expenses |
14,908 | 10,504 | ||||||
| Selling, general and administrative expense |
47,742 | 39,064 | ||||||
| Depreciation and software and leasehold amortization |
9,534 | 8,765 | ||||||
| Amortization of identifiable intangible assets |
3,774 | 2,685 | ||||||
| Other operating expense, net |
53 | 137 | ||||||
|
|
|
|
|
|||||
| Total operating expense |
141,164 | 112,184 | ||||||
| Operating income |
5,367 | 6,844 | ||||||
| Interest expense (income): |
||||||||
| Interest expense |
5,408 | 4,229 | ||||||
| Interest income |
(33 | ) | (4 | ) | ||||
|
|
|
|
|
|||||
| Net Interest expense |
5,375 | 4,225 | ||||||
| Income (loss) before income taxes |
(8 | ) | 2,619 | |||||
| Income tax expense |
57 | 886 | ||||||
|
|
|
|
|
|||||
| Net income (loss) |
($ | 65 | ) | $ | 1,733 | |||
|
|
|
|
|
|||||
| Net income (loss) per common share: |
||||||||
| Basic |
— | $ | 0.05 | |||||
| Diluted |
— | $ | 0.05 | |||||
| Weighted average common shares outstanding: |
||||||||
| Basic |
37,068 | 36,281 | ||||||
| Diluted |
37,068 | 36,914 | ||||||
7
EPIQ SYSTEMS, INC. AND SUBSIDIARIES
CONDENSED CONSOLIDATED BALANCE SHEETS
(Unaudited)
(In thousands)
| March 31, | December 31, | |||||||
| 2016 | 2015 | |||||||
| ASSETS: |
||||||||
| Cash and cash equivalents |
$ | 20,223 | $ | 27,620 | ||||
| Trade accounts receivable, net |
163,464 | 140,597 | ||||||
| Property and equipment, net |
72,846 | 77,715 | ||||||
| Internally developed software, net |
16,429 | 15,971 | ||||||
| Goodwill |
477,319 | 477,479 | ||||||
| Other intangibles, net |
41,169 | 44,943 | ||||||
| Other |
37,974 | 39,572 | ||||||
|
|
|
|
|
|||||
| Total Assets |
$ | 829,424 | $ | 823,897 | ||||
|
|
|
|
|
|||||
| LIABILITIES: |
||||||||
| Current liabilities (excluding debt) |
$ | 61,300 | $ | 72,686 | ||||
| Indebtedness |
399,522 | 383,578 | ||||||
| Other non-current liabilities |
59,342 | 59,512 | ||||||
| Total equity |
309,260 | 308,121 | ||||||
|
|
|
|
|
|||||
| Total Liabilities and Equity |
$ | 829,424 | $ | 823,897 | ||||
|
|
|
|
|
|||||
8
EPIQ SYSTEMS, INC. AND SUBSIDIARIES
CONDENSED CONSOLIDATED STATEMENTS OF CASH FLOWS
(Unaudited)
(In thousands)
| Three Months Ended | ||||||||
| March 31, | ||||||||
| 2016 | 2015 | |||||||
| Cash Flows From Operating Activities: |
||||||||
| Net income (loss) |
(65 | ) | 1,733 | |||||
| Non-cash adjustments to net income (loss): |
||||||||
| Depreciation and amortization |
13,308 | 11,450 | ||||||
| Other, net |
2,689 | 2,662 | ||||||
| Changes in operating assets and liabilities, net |
||||||||
| Trade accounts receivable |
(23,784 | ) | (13,349 | ) | ||||
| Other, net |
(2,489 | ) | 1,328 | |||||
|
|
|
|
|
|||||
| Net cash provided by (used in) operating activities |
(10,341 | ) | 3,824 | |||||
|
|
|
|
|
|||||
| Cash Flows From Investing Activities: |
||||||||
| Property and equipment; and internally developed software |
(5,342 | ) | (8,618 | ) | ||||
| Other |
458 | 1 | ||||||
|
|
|
|
|
|||||
| Net cash used in investing activities |
(4,884 | ) | (8,617 | ) | ||||
|
|
|
|
|
|||||
| Cash Flows From Financing Activities: |
||||||||
| Net change in indebtedness |
15,653 | (2,496 | ) | |||||
| Common stock repurchases |
(4,416 | ) | (4,017 | ) | ||||
| Cash dividends paid |
(3,382 | ) | (3,340 | ) | ||||
| Payment of acquisition-related liabilities |
— | (18 | ) | |||||
| Debt issuance costs |
— | (612 | ) | |||||
| Other, net |
108 | 506 | ||||||
|
|
|
|
|
|||||
| Net cash provided by (used in) financing activities |
7,963 | (9,977 | ) | |||||
|
|
|
|
|
|||||
| Effect of exchange rate changes on cash |
(135 | ) | (1,148 | ) | ||||
|
|
|
|
|
|||||
| Net decrease in cash and cash equivalents |
($ | 7,397 | ) | ($ | 15,918 | ) | ||
|
|
|
|
|
|||||
9
EPIQ SYSTEMS, INC. AND SUBSIDIARIES
RECONCILIATION OF NET INCOME (LOSS)
TO ADJUSTED EBITDA
(Unaudited)
(In thousands)
| Three Months Ended | ||||||||
| March 31, | ||||||||
| 2016 | 2015 | |||||||
| Net Income (Loss) |
($ | 65 | ) | $ | 1,733 | |||
| Plus: |
||||||||
| Depreciation and amortization expense |
13,308 | 11,450 | ||||||
| Share-based compensation expense |
2,516 | 1,621 | ||||||
| Contingent equity award expense(1) |
2,946 | — | ||||||
| Acquisition and related expense (2) |
52 | 203 | ||||||
| Expense related to financing, net (3) |
5,375 | 4,111 | ||||||
| Litigation (recovery) expense, net (4) |
22 | (520 | ) | |||||
| Timing of recognition of expense (5) |
— | (290 | ) | |||||
| Reorganization expense (6) |
— | 1,182 | ||||||
| Loss on disposition of assets |
180 | 18 | ||||||
| Strategic and financial review expense(7) |
2,301 | 1,047 | ||||||
| Income tax expense |
57 | 886 | ||||||
|
|
|
|
|
|||||
| 26,757 | 19,708 | |||||||
|
|
|
|
|
|||||
| Adjusted EBITDA |
$ | 26,692 | $ | 21,441 | ||||
|
|
|
|
|
|||||
| (1) | Expense related to restricted stock awards issued to our executive officers and directors and annual incentive awards that Epiq has historically paid in common stock that are contingent upon shareholder approval of an amendment and restatement of our equity compensation plan at our 2016 annual shareholder meeting. If shareholder approval is not obtained, these awards would convert to a cash expense and would reduce our Adjusted EBITDA. |
| (2) | Acquisition and related expense includes one-time costs associated with acquisitions. |
| (3) | Expense related to financing is net of interest income. |
| (4) | Litigation expense and recovery related to significant one-time matters. |
| (5) | Adjustment to match timing of expenses to be consistent with timing of GAAP revenue and recoveries for settlement administration matters. |
| (6) | Expenses primarily related to one-time charges for post-employment benefits. |
| (7) | Includes legal and other professional expenses incurred in connection with our strategic and financial review process and expenses related to a legal dispute with a shareholder. |
10
EPIQ SYSTEMS, INC. AND SUBSIDIARIES
RECONCILIATION OF NET INCOME (LOSS)
TO ADJUSTED NET INCOME (NON-GAAP)
(Unaudited)
(In thousands, except per share data)
| Three months ended | ||||||||
| March 31 | ||||||||
| 2016 | 2015 | |||||||
| Net Income (Loss) |
($ | 65 | ) | $ | 1,733 | |||
| Plus (net of tax) (1) : |
||||||||
| Amortization of acquisition intangibles |
2,265 | 1,611 | ||||||
| Share-based compensation expense |
1,510 | 973 | ||||||
| Contingent equity award expense(2) |
1,767 | — | ||||||
| Acquisition and related expense (3) |
31 | 146 | ||||||
| Loan fee amortization and write-off |
237 | 362 | ||||||
| Litigation (recovery) expense, net (4) |
13 | (172 | ) | |||||
| Timing of recognition of expense (5) |
— | (174 | ) | |||||
| Reorganization expense (6) |
— | 709 | ||||||
| Loss on disposition of assets |
108 | 11 | ||||||
| Strategic and financial review expense(7) |
1,380 | 628 | ||||||
| Effective tax rate adjustment (8) |
60 | (162 | ) | |||||
|
|
|
|
|
|||||
| 7,371 | 3,932 | |||||||
|
|
|
|
|
|||||
| Adjusted Net Income |
$ | 7,306 | $ | 5,665 | ||||
|
|
|
|
|
|||||
| Adjusted Earnings Per Share - Diluted |
$ | 0.20 | $ | 0.15 | ||||
|
|
|
|
|
|||||
| (1) | Individual adjustments are calculated using a tax rate of 40%. |
| (2) | Expense related to restricted stock awards issued to our executive officers and directors and annual incentive awards that Epiq has historically paid in common stock that are contingent upon shareholder approval of an amendment and restatement of our equity compensation plan at our 2016 annual shareholder meeting. If shareholder approval is not obtained, these awards would convert to a cash expense and accordingly would reduce our Adjusted Net Income and Adjusted Earnings per Share-Diluted. |
| (3) | Acquisition and related expense includes one-time costs associated with acquisitions. |
| (4) | Litigation expense or recovery related to significant one-time matters. |
| (5) | Adjustment to match timing of expenses to be consistent with timing of GAAP revenue and recoveries for settlement administration matters. |
| (6) | Expenses primarily related to one-time charges for post-employment benefits. |
| (7) | Includes legal and other professional expenses incurred in connection with our strategic and financial review process and expenses related to a legal dispute with a shareholder. |
| (8) | The effective tax rate adjustment reflects a non-GAAP provision for income taxes at a tax rate of 40%. |
11
EPIQ SYSTEMS, INC. AND SUBSIDIARIES
OPERATING REVENUE
(Unaudited)
(In thousands)
| Three months ended | ||||||||
| March 31, | ||||||||
| 2016 | 2015 | |||||||
| Technology |
$ | 93,257 | $ | 70,023 | ||||
| Bankruptcy |
15,469 | 20,082 | ||||||
| Settlement Administration |
22,802 | 17,650 | ||||||
|
|
|
|
|
|||||
| Total Bankruptcy and Settlement Administration |
38,271 | 37,732 | ||||||
|
|
|
|
|
|||||
| Total Operating Revenue |
$ | 131,528 | $ | 107,755 | ||||
|
|
|
|
|
|||||
EPIQ SYSTEMS, INC. AND SUBSIDIARIES
ADJUSTED EBITDA
(Unaudited)
(In thousands)
| Three months ended | ||||||||
| March 31, | ||||||||
| 2016 | 2015 | |||||||
| Technology |
$ | 25,817 | $ | 18,208 | ||||
| Bankruptcy and Settlement Administration |
11,738 | 12,704 | ||||||
| Unallocated Expenses |
(10,863 | ) | (9,471 | ) | ||||
|
|
|
|
|
|||||
| Total Adjusted EBITDA(1) |
$ | 26,692 | $ | 21,441 | ||||
|
|
|
|
|
|||||
| (1) | Adjusted EBITDA excludes expenses related to depreciation and amortization, share-based compensation, contingent equity award expense, acquisition and related expense, financing expense, litigation expense or recovery, timing of recognition of expense, gain or loss on disposition of assets, strategic and financial review expense, and income tax expense or benefit. See footnote 1 to the Reconciliation of Net Income (Loss) to Adjusted EBITDA for additional information related to contingent equity awards. |
12
EPIQ SYSTEMS, INC. AND SUBSIDIARIES
CALCULATION OF NET INCOME PER SHARE AND
DILUTED ADJUSTED EARNINGS PER SHARE (NON-GAAP)
(Unaudited)
(In thousands, except per share data)
| Three months ended | ||||||||
| March 31, | ||||||||
| 2016 | 2015 | |||||||
| Net Income (Loss) |
($ | 65 | ) | $ | 1,733 | |||
| Basic Weighted Average Shares |
37,068 | 36,281 | ||||||
| Adjustment to reflect share-based awards |
— | 633 | ||||||
|
|
|
|
|
|||||
| Diluted Weighted Average Shares(1) |
37,068 | 36,914 | ||||||
|
|
|
|
|
|||||
| Net Income (Loss) Per Share - Diluted |
— | $ | 0.05 | |||||
|
|
|
|
|
|||||
| Adjusted Net Income(2) |
$ | 7,306 | $ | 5,665 | ||||
| Basic Weighted Average Shares |
37,068 | 36,281 | ||||||
| Adjustment to reflect share-based awards |
289 | 633 | ||||||
|
|
|
|
|
|||||
| Diluted Weighted Average Shares |
37,357 | 36,914 | ||||||
|
|
|
|
|
|||||
| Adjusted Earnings Per Share - Diluted |
$ | 0.20 | $ | 0.15 | ||||
|
|
|
|
|
|||||
| (1) | Diluted weighted average shares outstanding for the three months ended March 31, 2016 excludes the impact of share-based awards due to the GAAP Net Loss reported for the period. |
| (2) | Adjusted net income excludes amortization of acquisition intangibles, share-based compensation expense, contingent equity award expense, acquisition and related expense, loan fee amortization and write off, litigation (recovery) expense, timing of recognition of expense, reorganization expense, gain or loss on disposition of assets, strategic and financial review expense, and the effect of tax adjustments that are outside of Epiq Systems’ anticipated effective tax rate, all net of tax. |
13

First Quarter 2016 Earnings Conference Call May 3, 2016 NASDAQ: EPIQ Exhibit 99.2
Forward-Looking Statements & Use of Non-GAAP Measures This presentation includes forward-looking statements. These forward-looking statements include, but are not limited to, any projection or expectation of earnings, revenue or other financial items; the plans, strategies and objectives of management for future operations; factors that may affect our operating results; new products or services; the demand for our products and services; our ability to consummate acquisitions, successfully integrate them into our operations and achieve expected synergies; future capital expenditures; effects of current or future economic conditions or performance; industry trends and other matters that do not relate strictly to historical facts or statements of assumptions underlying any of the foregoing. These forward-looking statements are based on our current expectations. In this press release, we make statements that plan for or anticipate the future. Forward-looking statements may be identified by words or phrases such as “believe,” “expect,” “anticipate,” “should,” “planned,” “may,” “estimated,” “goal,” “objective,” “seeks,” and “potential” and variations of these words and similar expressions or negatives of these words. Section 27A of the Securities Act of 1933, as amended, and Section 21E of the Securities Exchange Act of 1934, as amended, provide a “safe harbor” for forward-looking statements. Because forward-looking statements involve future risks and uncertainties, listed below are a variety of factors that could cause actual results and experience to differ materially from the anticipated results or other expectations expressed in our forward-looking statements. These factors include (1) failure to keep pace with technological changes and significant changes in the competitive environment, (2) risks associated with cyber-attacks, interruptions or delays in services at data centers, (3) general economic conditions and the cyclical nature of certain markets; (4) risks of errors or fraud related to our business processes, (5) interruptions or delays in service at data centers we utilize for delivery of our services, (6) undetected errors in, and failure of operation of, software products releases, (7) unavailability of third-party technology, (8) failure of our financial, operating and information systems to operate as intended, (9) our inability to attract, develop and retain executives and other qualified employees, (10) risks associated with the integration of acquisitions into our existing business operations, (11) risks associated with our international operations, (12) risks of litigation for infringement of proprietary rights, (13) future government legislation or changes in judicial interpretations, (14) any material non-cash write-downs based on impairment of our goodwill, (15) fluctuations in our quarterly results that could cause fluctuations in the market price of our common stock, (16) volatility of the market price of our common stock, (17) the impact of our current review process of strategic alternatives, (18) the impact of potential proxy contests and related litigation, (19) our failure to pay cash dividends, (20) our inability to raise additional capital to fund our operations because of our level of indebtedness, (21) our inability to maintain compliance with debt covenant ratios, (22) risks associated with indebtedness and interest rate fluctuations, (23) risks associated with provisions of our articles of incorporation that prevent a takeover of Epiq, and (24) other risks detailed from time to time in our filings with the Securities and Exchange Commission, including our Annual Report on Form 10-K, Quarterly Reports on Form 10-Q and Current Reports on Form 8-K. In addition, there may be other factors not included in our Securities and Exchange Commission filings that may cause actual results to differ materially from any forward-looking statements. We undertake no obligation to update publicly or revise any forward-looking statements contained herein to reflect future events or developments, except as required by law. This presentation includes the following non-GAAP financial measures: (i) adjusted net income (net income (loss) adjusted for amortization of acquisition intangibles, share-based compensation expense, contingent equity award expense, acquisition and related expense, loan fee amortization and write off, litigation (recovery) expense, timing of recognition of expense, reorganization expense, gain or loss on disposition of assets, strategic and financial review expense and the effect of tax adjustments that are outside of Epiq Systems’ anticipated effective tax rate, all net of tax), (ii) adjusted earnings per share, calculated as adjusted net income on a fully diluted per share basis, and (iii) adjusted EBITDA (net income (loss) adjusted for depreciation and amortization, share-based compensation expense, contingent equity award expense, acquisition and related expense, net expense related to financing, litigation (recovery) expense, timing of recognition of expense, reorganization expense, gain or loss on disposition of assets, strategic and financial review expense and income tax expense (benefit)). Income taxes typically represent a complex element of a company’s income statement and effective tax rates can vary widely between different periods. Epiq Systems uses an approximate statutory tax rate of 40% to reflect income tax effects in the presentation of its adjusted net income and adjusted net income per share. Utilization of an approximate statutory tax rate for presentation of the non-GAAP measures is done to allow a consistent basis for investors to understand financial performance of the company across historical periods. Although Epiq Systems reports its results using GAAP, Epiq Systems also uses non-GAAP financial measures when management believes those measures provide useful information for its shareholders. These non-GAAP financial measures are intended to supplement the GAAP financial information by providing additional insight regarding results of operations and to allow a comparison with other companies, many of whom use similar non-GAAP financial measures to supplement their GAAP results. Certain items are excluded from these non-GAAP financial measures to provide additional comparability measures from period to period. These non-GAAP financial measures will not be defined in the same manner by all companies and may not be comparable to other companies. These non-GAAP financial measures are reconciled in the accompanying tables to the most directly comparable measures as reported in accordance with GAAP, and should be viewed in addition to, and not in lieu of, such comparable financial measures.
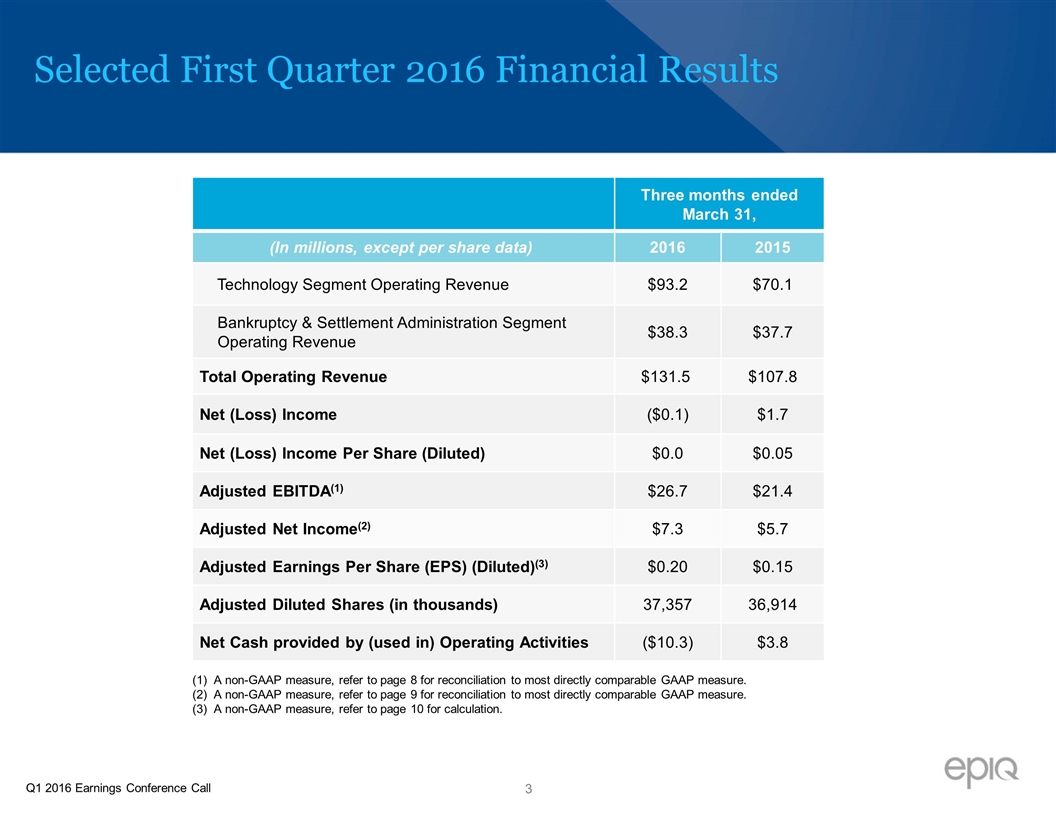
Selected First Quarter 2016 Financial Results Three months ended March 31, (In millions, except per share data) 2016 2015 Technology Segment Operating Revenue $93.2 $70.1 Bankruptcy & Settlement Administration Segment Operating Revenue $38.3 $37.7 Total Operating Revenue $131.5 $107.8 Net (Loss) Income ($0.1) $1.7 Net (Loss) Income Per Share (Diluted) $0.0 $0.05 Adjusted EBITDA(1) $26.7 $21.4 Adjusted Net Income(2) $7.3 $5.7 Adjusted Earnings Per Share (EPS) (Diluted)(3) $0.20 $0.15 Adjusted Diluted Shares (in thousands) 37,357 36,914 Net Cash provided by (used in) Operating Activities ($10.3) $3.8 (1) A non-GAAP measure, refer to page 8 for reconciliation to most directly comparable GAAP measure. (2) A non-GAAP measure, refer to page 9 for reconciliation to most directly comparable GAAP measure. (3) A non-GAAP measure, refer to page 10 for calculation. Q1 2016 Earnings Conference Call
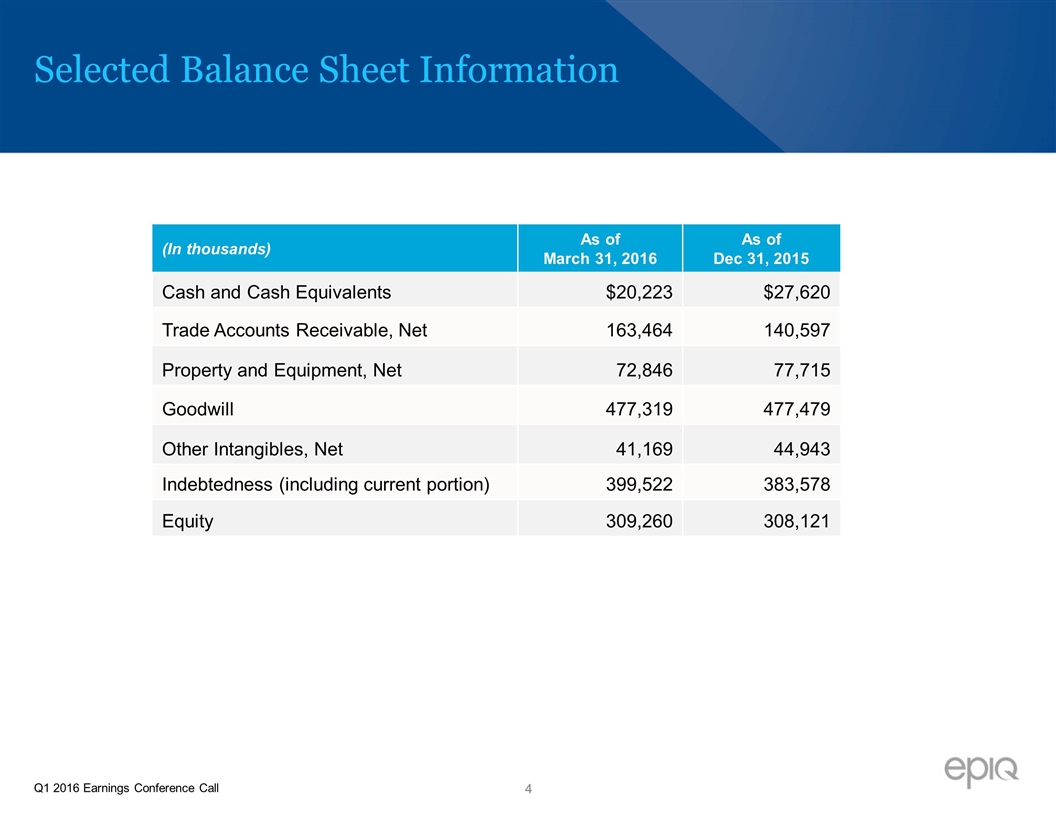
Selected Balance Sheet Information (In thousands) As of March 31, 2016 As of Dec 31, 2015 Cash and Cash Equivalents $20,223 $27,620 Trade Accounts Receivable, Net 163,464 140,597 Property and Equipment, Net 72,846 77,715 Goodwill 477,319 477,479 Other Intangibles, Net 41,169 44,943 Indebtedness (including current portion) 399,522 383,578 Equity 309,260 308,121 Q1 2016 Earnings Conference Call
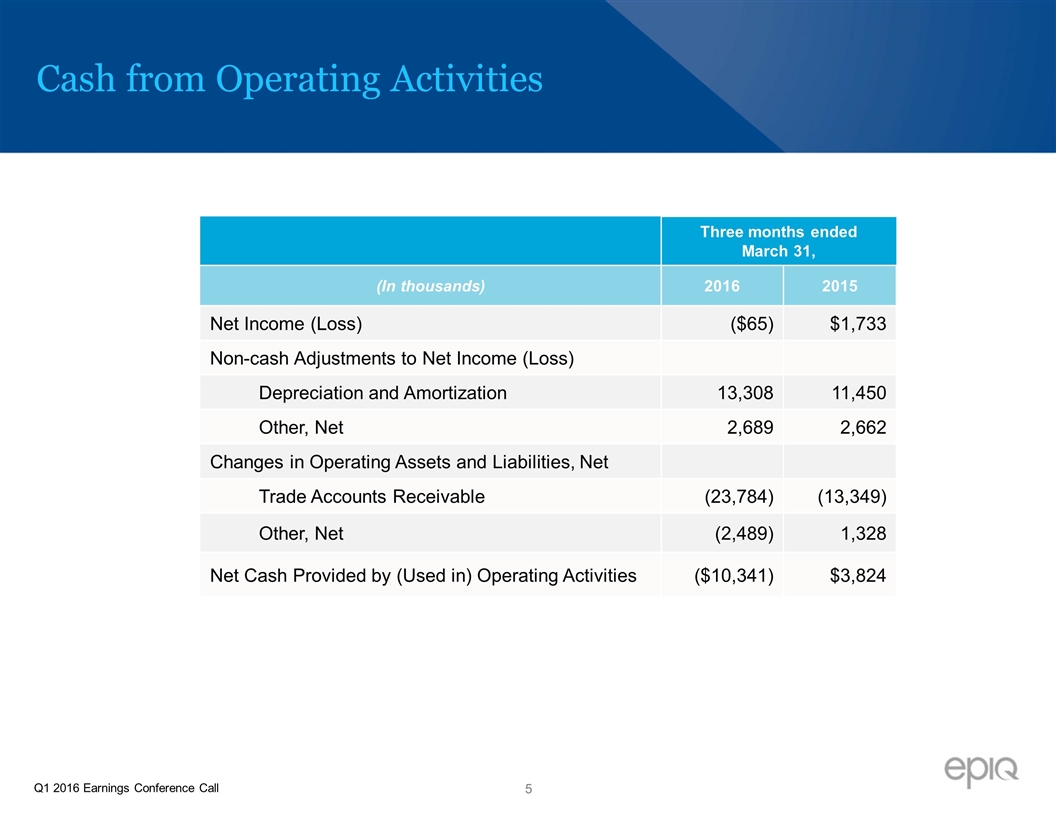
Cash from Operating Activities Three months ended March 31, (In thousands) 2016 2015 Net Income (Loss) ($65) $1,733 Non-cash Adjustments to Net Income (Loss) Depreciation and Amortization 13,308 11,450 Other, Net 2,689 2,662 Changes in Operating Assets and Liabilities, Net Trade Accounts Receivable (23,784) (13,349) Other, Net (2,489) 1,328 Net Cash Provided by (Used in) Operating Activities ($10,341) $3,824 Q1 2016 Earnings Conference Call
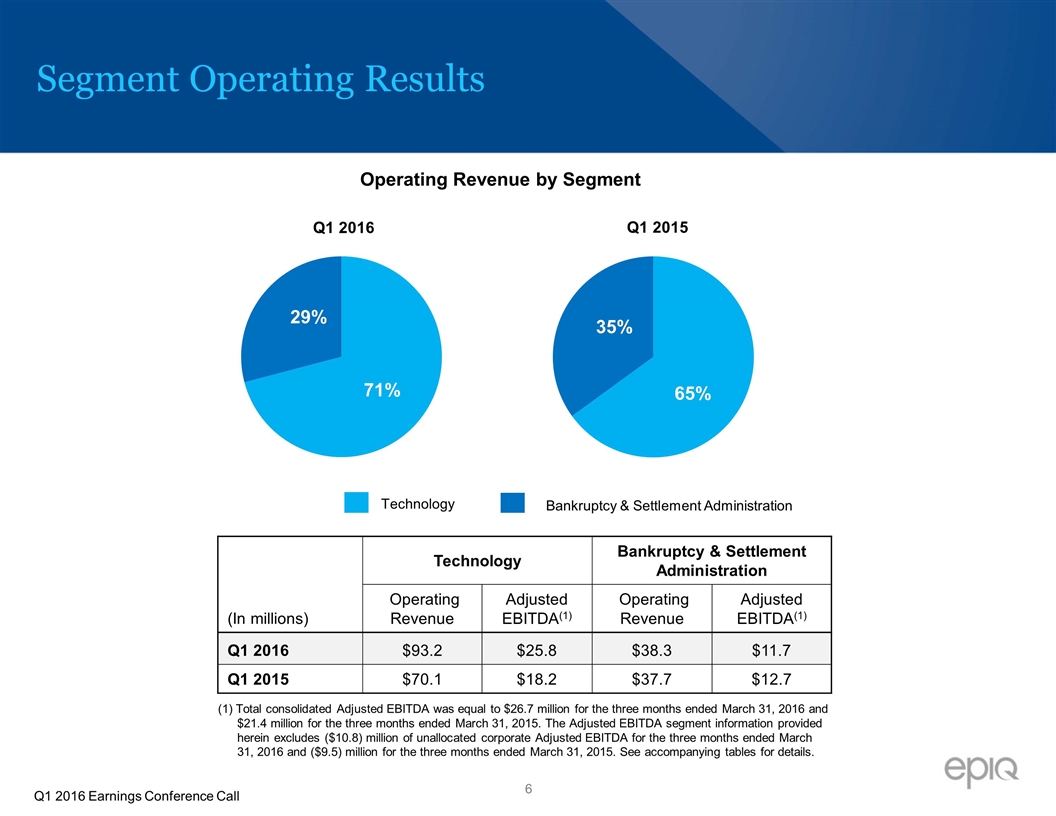
Segment Operating Results Technology Bankruptcy & Settlement Administration (In millions) Technology Bankruptcy & Settlement Administration Operating Revenue Adjusted EBITDA(1) Operating Revenue Adjusted EBITDA(1) Q1 2016 $93.2 $25.8 $38.3 $11.7 Q1 2015 $70.1 $18.2 $37.7 $12.7 Operating Revenue by Segment (1) Total consolidated Adjusted EBITDA was equal to $26.7 million for the three months ended March 31, 2016 and $21.4 million for the three months ended March 31, 2015. The Adjusted EBITDA segment information provided herein excludes ($10.8) million of unallocated corporate Adjusted EBITDA for the three months ended March 31, 2016 and ($9.5) million for the three months ended March 31, 2015. See accompanying tables for details. Q1 2016 Earnings Conference Call
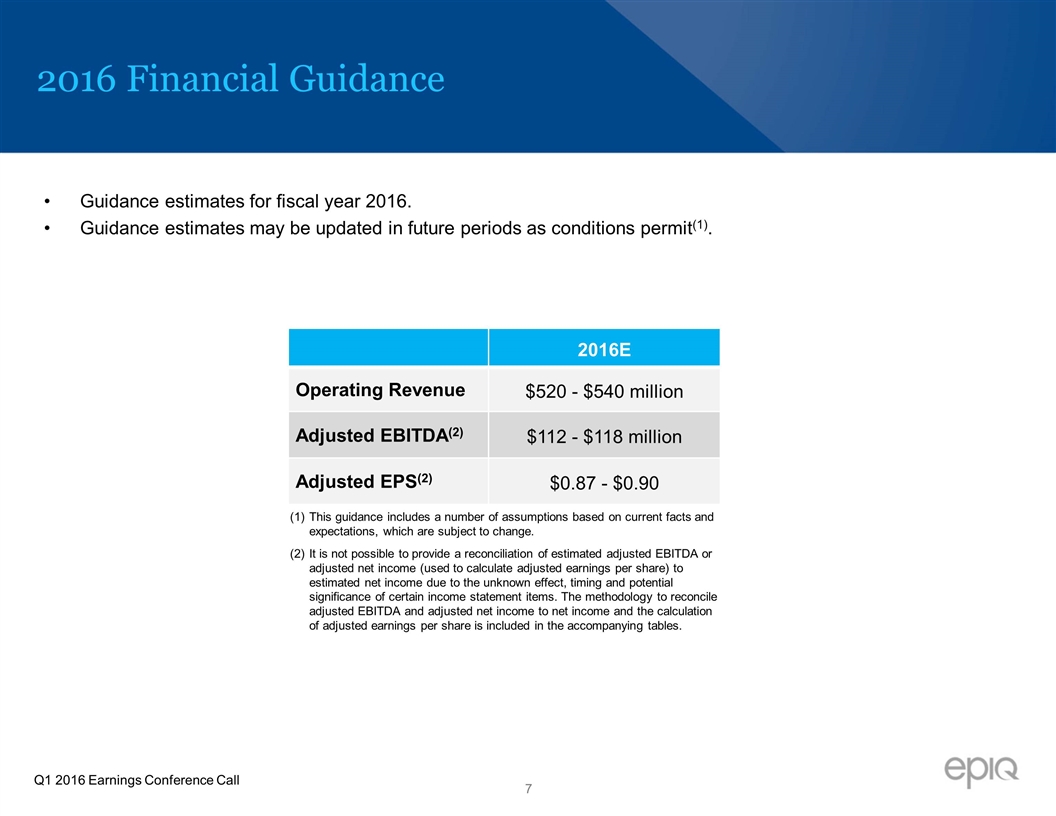
2016 Financial Guidance Guidance estimates for fiscal year 2016. Guidance estimates may be updated in future periods as conditions permit(1). 2016E Operating Revenue $520 - $540 million Adjusted EBITDA(2) $112 - $118 million Adjusted EPS(2) $0.87 - $0.90 This guidance includes a number of assumptions based on current facts and expectations, which are subject to change. It is not possible to provide a reconciliation of estimated adjusted EBITDA or adjusted net income (used to calculate adjusted earnings per share) to estimated net income due to the unknown effect, timing and potential significance of certain income statement items. The methodology to reconcile adjusted EBITDA and adjusted net income to net income and the calculation of adjusted earnings per share is included in the accompanying tables. Q1 2016 Earnings Conference Call
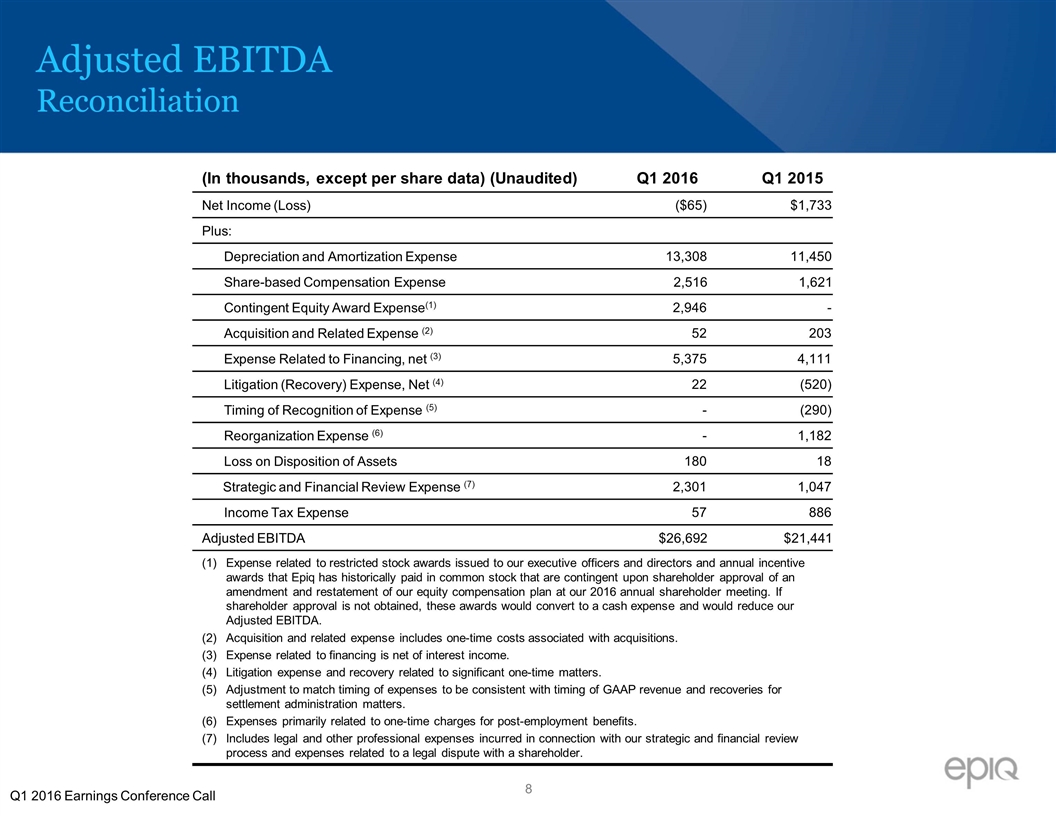
Adjusted EBITDA Reconciliation (In thousands, except per share data) (Unaudited) Q1 2016 Q1 2015 Net Income (Loss) ($65) $1,733 Plus: Depreciation and Amortization Expense 13,308 11,450 Share-based CompensationExpense 2,516 1,621 Contingent Equity Award Expense(1) 2,946 - Acquisition and Related Expense (2) 52 203 Expense Related to Financing, net (3) 5,375 4,111 Litigation (Recovery) Expense, Net (4) 22 (520) Timing of Recognition of Expense (5) - (290) Reorganization Expense (6) - 1,182 Loss on Disposition of Assets 180 18 Strategic and Financial Review Expense (7) 2,301 1,047 Income Tax Expense 57 886 Adjusted EBITDA $26,692 $21,441 Expense related to restricted stock awards issued to our executive officers and directors and annual incentive awards that Epiq has historically paid in common stock that are contingent upon shareholder approval of an amendment and restatement of our equity compensation plan at our 2016 annual shareholder meeting. If shareholder approval is not obtained, these awards would convert to a cash expense and would reduce our Adjusted EBITDA. Acquisition and related expense includes one-time costs associated with acquisitions. Expense related to financing is net of interest income. Litigation expense and recovery related to significant one-time matters. Adjustment to match timing of expenses to be consistent with timing of GAAP revenue and recoveries for settlement administration matters. Expenses primarily related to one-time charges for post-employment benefits. Includes legal and other professional expenses incurred in connection with our strategic and financial review process and expenses related to a legal dispute with a shareholder. Q1 2016 Earnings Conference Call
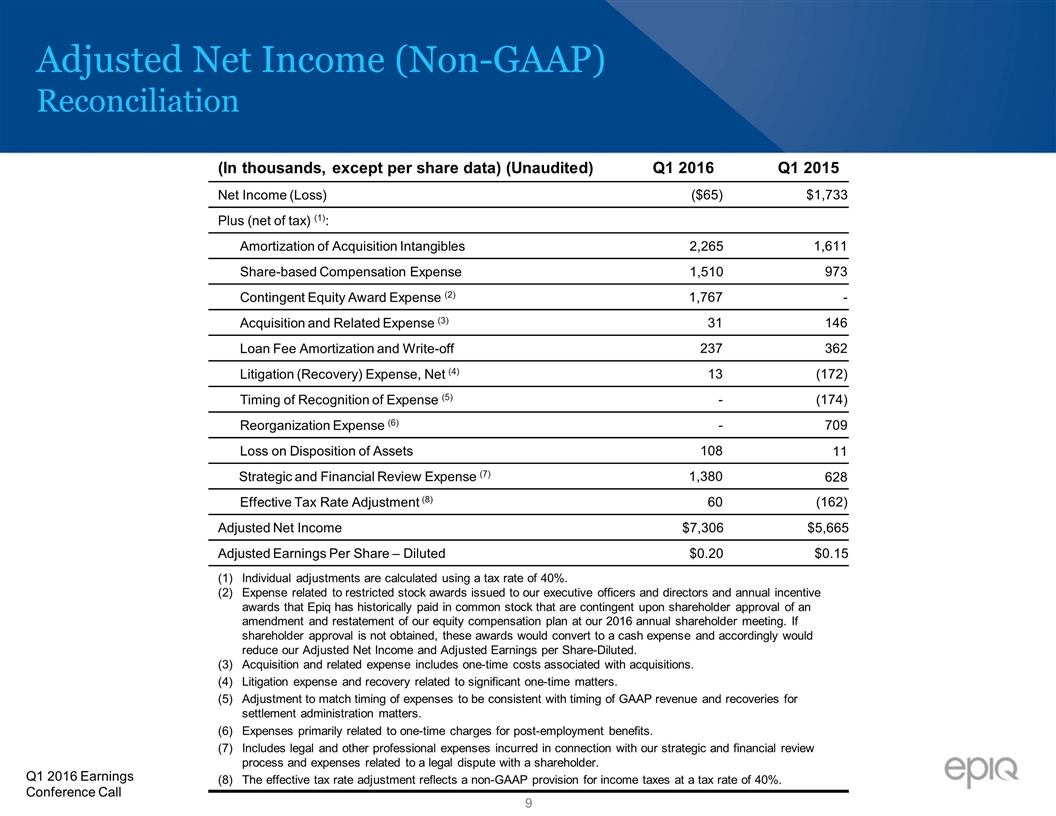
Adjusted Net Income (Non-GAAP) Reconciliation (In thousands, except per share data) (Unaudited) Q1 2016 Q1 2015 Net Income (Loss) ($65) $1,733 Plus (net of tax) (1): Amortization of Acquisition Intangibles 2,265 1,611 Share-based CompensationExpense 1,510 973 Contingent Equity Award Expense (2) 1,767 - Acquisition and Related Expense (3) 31 146 Loan Fee Amortization and Write-off 237 362 Litigation (Recovery) Expense, Net (4) 13 (172) Timing of Recognition of Expense (5) - (174) Reorganization Expense (6) - 709 Loss on Disposition of Assets 108 11 Strategic and Financial Review Expense (7) 1,380 628 Effective Tax Rate Adjustment (8) 60 (162) Adjusted Net Income $7,306 $5,665 Adjusted Earnings Per Share – Diluted $0.20 $0.15 Individual adjustments are calculated using a tax rate of 40%. Expense related to restricted stock awards issued to our executive officers and directors and annual incentive awards that Epiq has historically paid in common stock that are contingent upon shareholder approval of an amendment and restatement of our equity compensation plan at our 2016 annual shareholder meeting. If shareholder approval is not obtained, these awards would convert to a cash expense and accordingly would reduce our Adjusted Net Income and Adjusted Earnings per Share-Diluted. Acquisition and related expense includes one-time costs associated with acquisitions. Litigation expense and recovery related to significant one-time matters. Adjustment to match timing of expenses to be consistent with timing of GAAP revenue and recoveries for settlement administration matters. Expenses primarily related to one-time charges for post-employment benefits. Includes legal and other professional expenses incurred in connection with our strategic and financial review process and expenses related to a legal dispute with a shareholder. The effective tax rate adjustment reflects a non-GAAP provision for income taxes at a tax rate of 40%. Q1 2016 Earnings Conference Call
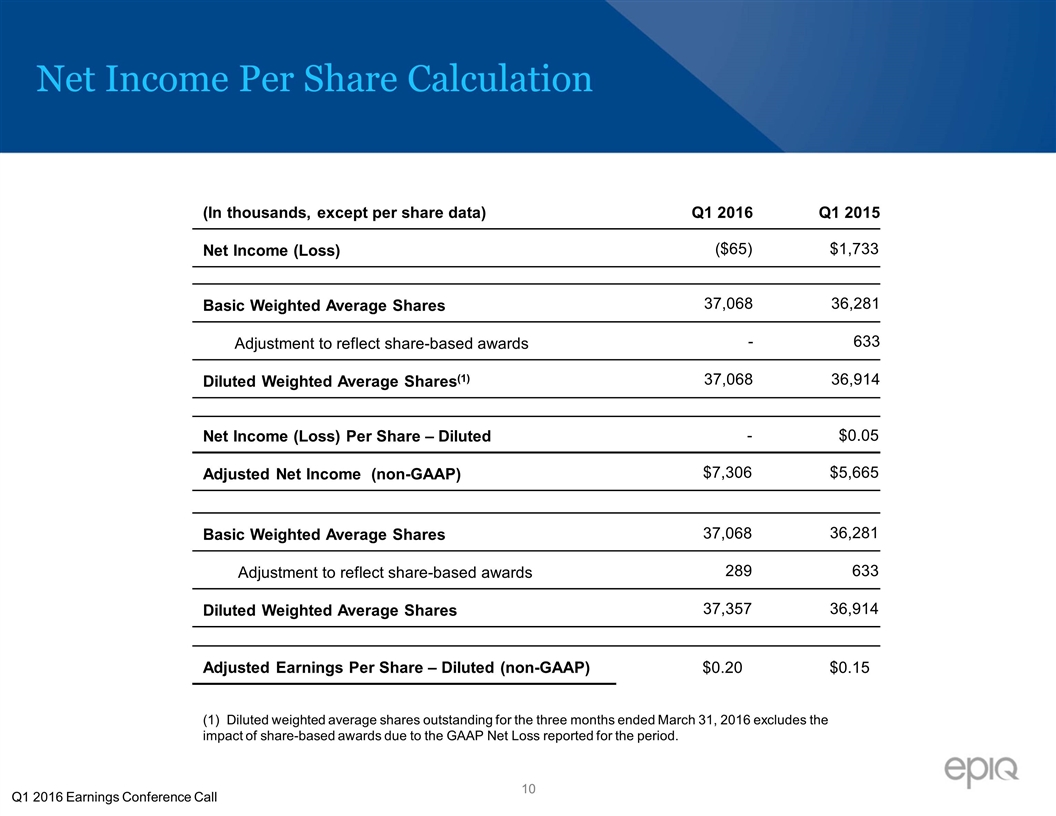
Net Income Per Share Calculation (In thousands, except per share data) Q1 2016 Q1 2015 Net Income (Loss) ($65) $1,733 Basic Weighted Average Shares 37,068 36,281 Adjustment to reflect share-based awards - 633 Diluted Weighted Average Shares(1) 37,068 36,914 Net Income (Loss) Per Share – Diluted - $0.05 Adjusted Net Income (non-GAAP) $7,306 $5,665 Basic Weighted Average Shares 37,068 36,281 Adjustment to reflect share-based awards 289 633 Diluted Weighted Average Shares 37,357 36,914 Adjusted Earnings Per Share – Diluted (non-GAAP) $0.20 $0.15 (1) Diluted weighted average shares outstanding for the three months ended March 31, 2016 excludes the impact of share-based awards due to the GAAP Net Loss reported for the period. Q1 2016 Earnings Conference Call
Epiq (NASDAQ: EPIQ) is a leading global provider of integrated technology and services for the legal profession, including electronic discovery, bankruptcy, class action and mass tort administration, federal regulatory actions and data breach responses. Our innovative solutions are designed to streamline the administration of litigation, investigations, financial transactions, regulatory compliance and other legal matters. Epiq’s subject-matter experts bring clarity to complexity, create efficiency through expertise and deliver confidence to our clients around the world. For more information, visit us at www.epiqsystems.com.
Investor Contacts Kelly Bailey Epiq Systems (913) 621-9500 [email protected] Chris Eddy Catalyst Global (212) 924-9800 [email protected] NASDAQ: EPIQ
Serious News for Serious Traders! Try StreetInsider.com Premium Free!
You May Also Be Interested In
- Lincoln Electric Reports First Quarter 2024 Results
- Good Times Restaurants to Release Financial Results on May 2, 2024 for the Second Fiscal Quarter 2024 Ended March 26, 2024
- PDD Holdings Files Annual Report on Form 20-F for Fiscal Year 2023
Create E-mail Alert Related Categories
SEC FilingsSign up for StreetInsider Free!
Receive full access to all new and archived articles, unlimited portfolio tracking, e-mail alerts, custom newswires and RSS feeds - and more!


 Tweet
Tweet Share
Share