

Form 8-K ENDURANCE SPECIALTY HOLD For: Nov 12
 Tweet
Tweet Share
Share
SECURITIES AND EXCHANGE COMMISSION
WASHINGTON, D.C. 20549
FORM 8-K
Current Report
Pursuant to Section 13 or 15(d)
of the Securities Exchange Act of 1934
November 12, 2015
Date of Report (Date of earliest event reported)
Endurance Specialty Holdings Ltd.
(Exact name of registrant as specified in its charter)
| Bermuda | 1-31599 | 98-0392908 | ||
| (State or Other Jurisdiction of Incorporation) |
(Commission File Number) |
(I.R.S. Employer Identification No.) |
Waterloo House, 100 Pitts Bay Road, Pembroke HM 08, Bermuda
(Address of principal executive offices, including zip code)
(441) 278-0400
(Registrant’s telephone number, including area code)
Not Applicable
(Former name or former address, if changed since last report)
Check the appropriate box below if the Form 8-K filing is intended to simultaneously satisfy the filing obligation of the registrant under any of the following provisions:
| ¨ | Written communications pursuant to Rule 425 under the Securities Act (17 CFR 230.425) |
| ¨ | Soliciting material pursuant to Rule 14a-12 under the Exchange Act (17 CFR 240.14a-12) |
| ¨ | Pre-commencement communications pursuant to Rule 14d-2(b) under the Exchange Act (17 CFR 240.14d-2(b)) |
| ¨ | Pre-commencement communications pursuant to Rule 13e-4(c) under the Exchange Act (17 CFR 240.13e-4(c)) |
| Item 7.01. | Regulation FD Disclosure. |
Beginning on November 13, 2015, executives of Endurance Specialty Holdings Ltd. (the “Company”) will present the information about the Company described in the slides attached to this report as Exhibit 99.1 to various investors. The slides set forth in Exhibit 99.1 are incorporated by reference herein.
In accordance with general instruction B.2 of Form 8-K, the information in this Item 7.01 of this Current Report on Form 8-K, including exhibits, furnished pursuant to Item 7.01 shall not be deemed “filed” for the purposes of Section 18 of the Securities Exchange Act of 1934, or otherwise subject to the liability of that section. Accordingly, the information in Item 7.01 of this Current Report on Form 8-K will not be incorporated by reference into any registration statement filed by the Company under the Securities Act of 1933, as amended, unless specifically identified therein as being incorporated therein by reference. The furnishing of the information in this Current Report on Form 8-K is not intended to, and does not, constitute a determination or admission by the Company that the information in this Current Report on Form 8-K is material or complete, or that investors should consider this information before making an investment decision with respect to any security of the Company or any of its affiliates.
| Item 9.01. | Financial Statements and Exhibits |
| (c) | Exhibits |
The following exhibit is filed as part of this report:
| Exhibit |
Description | |
| 99.1 | Slides from Presentation by Management | |
SIGNATURES
Pursuant to the requirements of the Securities Exchange Act of 1934, the registrant has duly caused this report to be signed on its behalf by the undersigned thereunto duly authorized.
Dated: November 12, 2015
| By: |
/s/ John V. Del Col | |
| Name: |
John V. Del Col | |
| Title: |
General Counsel & Secretary |
EXHIBIT INDEX
| Exhibit |
Description | |
| 99.1 | Slides from Presentation by Management | |
Exhibit 99.1
|
|
Endurance Specialty Holdings
Investor Presentation
September 30, 2015
Exhibit 99.1
|
|
Forward Looking Statements and Regulation G Disclaimer
Safe Harbor for Forward Looking Statements
Some of the statements in this presentation may include forward-looking statements which reflect our current views with respect to future events and financial performance. Such statements include forward-looking statements both with respect to us in general and the insurance and reinsurance sectors specifically, both as to underwriting and investment matters. Statements which include the words “should, “expect, “intend, “plan, “believe, “project, “anticipate, “seek, “will, and similar statements of a future or forward-looking nature identify forward-looking statements in this presentation for purposes of the U.S. federal securities laws or otherwise. We intend these forward-looking statements to be covered by the safe harbor provisions for forward-looking statements in the Private Securities Litigation Reform Act of 1995.
All forward-looking statements address matters that involve risks and uncertainties. Accordingly, there are or may be important factors that could cause actual results to differ materially from those indicated in the forward-looking statements. These factors include, but are not limited to, the effects of competitors pricing policies, greater frequency or severity of claims and loss activity, changes in market conditions in the agriculture insurance industry, termination of or changes in the terms of the U.S. multiple peril crop insurance program, a decreased demand for property and casualty insurance or reinsurance, changes in the availability, cost or quality of reinsurance or retrocessional coverage, our inability to renew business previously underwritten or acquired, our inability to maintain our applicable financial strength ratings, our inability to effectively integrate acquired operations, uncertainties in our reserving process, changes to our tax status, changes in insurance regulations, reduced acceptance of our existing or new products and services, a loss of business from and credit risk related to our broker counterparties, assessments for high risk or otherwise uninsured individuals, possible terrorism or the outbreak of war, a loss of key personnel, political conditions, changes in insurance regulation, changes in accounting policies, our investment performance, the valuation of our invested assets, a breach of our investment guidelines, the unavailability of capital in the future, developments in the world_s financial and capital markets and our access to such markets, government intervention in the insurance and reinsurance industry, illiquidity in the credit markets, changes in general economic conditions and other factors described in our Annual Report on Form 10-K and for the year ended December 31, 2104 and Quarterly Report on Form 10-Q for the period ended September 30, 2015. Forward-looking statements speak only as of the date on which they are made, and we undertake no obligation publicly to update or revise any forward-looking statement, whether as a result of new information, future developments or otherwise.
Regulation G Disclaimer
In this presentation, management has included and discussed certain non-GAAP measures. Management believes that these non-GAAP measures, which may be defined differently by other companies, better explain the Company’s results of operations in a manner that allows for a more complete understanding of the underlying trends in the Company’s business. However, these measures should not be viewed as a substitute for those determined in accordance with GAAP. For a complete description of non-GAAP measures and reconciliations, please review the Investor Financial Supplement on our web site at www.endurance.bm.
The combined ratio is the sum of the loss, acquisition expense and general and administrative expense ratios. Endurance presents the combined ratio as a measure that is commonly recognized as a standard of performance by investors, analysts, rating agencies and other users of its financial information. The combined ratio, excluding prior year net loss reserve development, enables investors, analysts, rating agencies and other users of its financial information to more easily analyze Endurance_s results of underwriting activities in a manner similar to how management analyzes Endurance_s underlying business performance. The combined ratio, excluding prior year net loss reserve development, should not be viewed as a substitute for the combined ratio. Net premiums written is a non-GAAP internal performance measure used by Endurance in the management of its operations. Net premiums written represents net premiums written and deposit premiums, which are premiums on contracts that are deemed as either transferring only significant timing risk or transferring only significant underwriting risk and thus are required to be accounted for under GAAP as deposits. Endurance believes these amounts are significant to its business and underwriting process and excluding them distorts the analysis of its premium trends. In addition to presenting gross premiums written determined in accordance with GAAP, Endurance believes that net premiums written enables investors, analysts, rating agencies and other users of its financial information to more easily analyze Endurance_s results of underwriting activities in a manner similar to how management analyzes Endurance_s underlying business performance. Net premiums written should not be viewed as a substitute for gross premiums written determined in accordance with GAAP. Return on Equity (ROE) is comprised using the average common equity calculated as the arithmetic average of the beginning and ending common equity balances by quarter for stated periods. The Company presents various measures of Return on Equity that are commonly recognized as a standard of performance by investors, analysts, rating agencies and other users of its financial information.
2
|
|
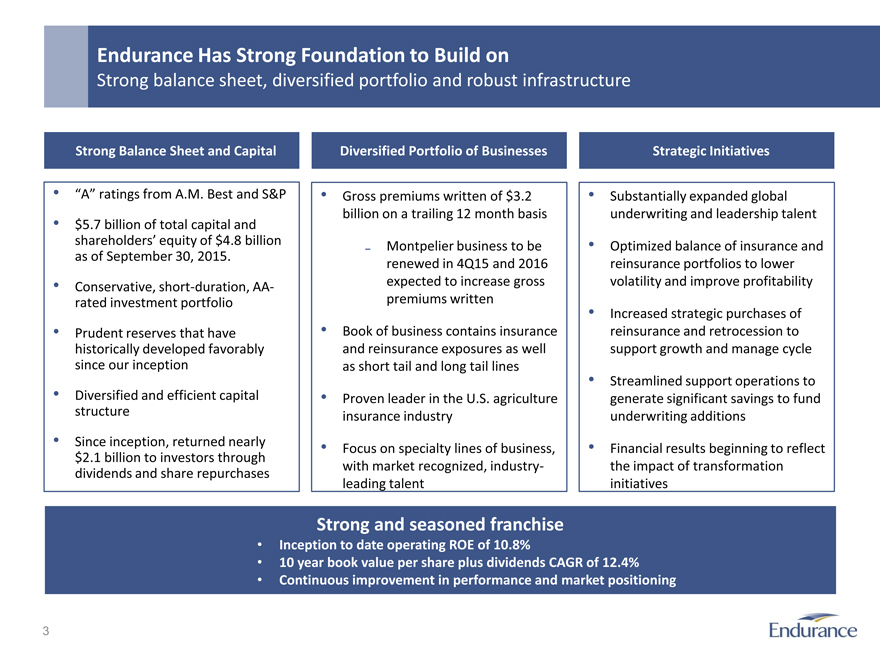
Endurance Has Strong Foundation to Build on
Strong balance sheet, diversified portfolio and robust infrastructure
Strong Balance Sheet and Capital
“A ratings from A.M. Best and S&P
$5.7 billion of total capital and shareholders equity of $4.8 billion as of September 30, 2015.
Conservative, short-duration, AA- rated investment portfolio
Prudent reserves that have historically developed favorably since our inception
Diversified and efficient capital structure
Since inception, returned nearly $2.1 billion to investors through dividends and share repurchases
Diversified Portfolio of Businesses
Gross premiums written of $3.2 billion on a trailing 12 month basis
Montpelier business to be renewed in 4Q15 and 2016 expected to increase gross premiums written
Book of business contains insurance and reinsurance exposures as well as short tail and long tail lines
Proven leader in the U.S. agriculture insurance industry
Focus on specialty lines of business, with market recognized, industry- leading talent
Strategic Initiatives
Substantially expanded global underwriting and leadership talent
Optimized balance of insurance and reinsurance portfolios to lower volatility and improve profitability
Increased strategic purchases of reinsurance and retrocession to support growth and manage cycle
Streamlined support operations to generate significant savings to fund underwriting additions
Financial results beginning to reflect the impact of transformation initiatives
Strong and seasoned franchise
Inception to date operating ROE of 10.8%
10 year book value per share plus dividends CAGR of 12.4%
Continuous improvement in performance and market positioning
3
|
|
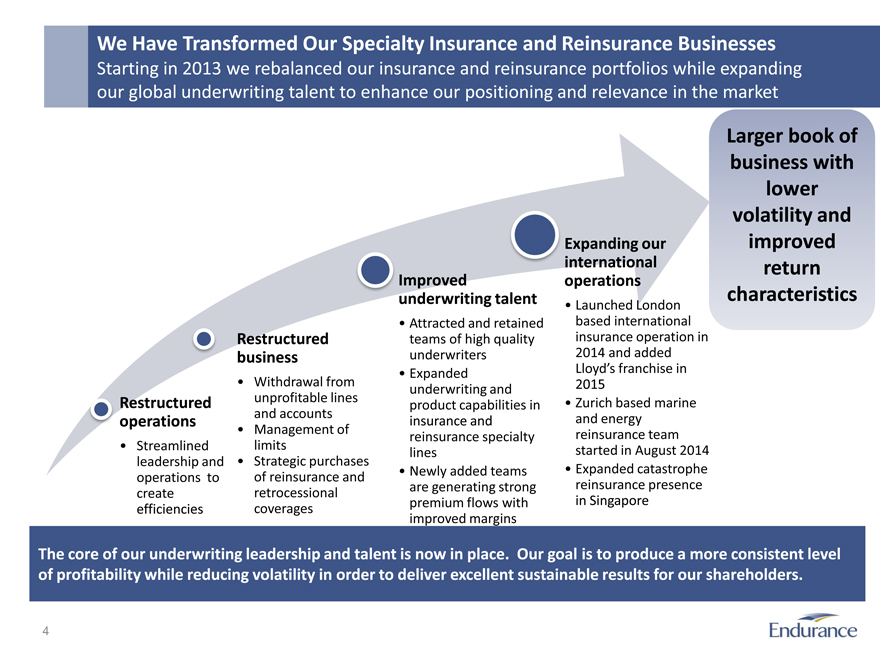
We Have Transformed Our Specialty Insurance and Reinsurance Businesses
Starting in 2013 we rebalanced our insurance and reinsurance portfolios while expanding our global underwriting talent to enhance our positioning and relevance in the market
Larger book of business with lower volatility and improved return characteristics
Restructured operations
Streamlined leadership and operations to create efficiencies
Restructured business
Withdrawal from unprofitable lines and accounts
Management of limits
Strategic purchases of reinsurance and retrocessional coverages
Improved underwriting talent
Attracted and retained teams of high quality underwriters
Expanded underwriting and product capabilities in insurance and reinsurance specialty lines
Newly added teams are generating strong premium flows with improved margins
Expanding our international operations
Launched London based international insurance operation in 2014 and added
Lloyd_s franchise in
2015
Zurich based marine and energy reinsurance team started in August 2014
Expanded catastrophe reinsurance presence in Singapore
The core of our underwriting leadership and talent is now in place. Our goal is to produce a more consistent level of profitability while reducing volatility in order to deliver excellent sustainable results for our shareholders.
4
|
|
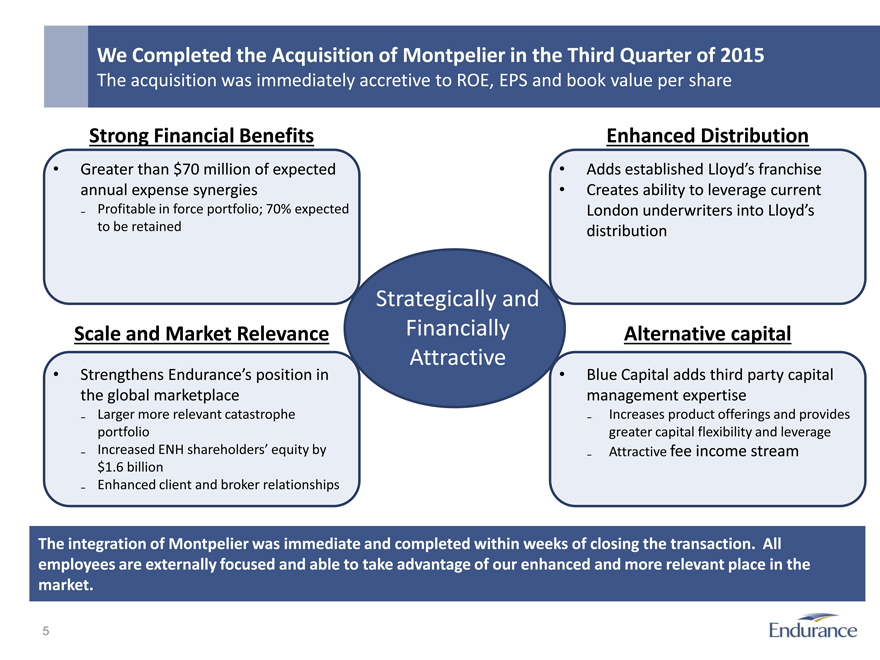
We Completed the Acquisition of Montpelier in the Third Quarter of 2015
The acquisition was immediately accretive to ROE, EPS and book value per share
Strategically and Financially Attractive
Strong Financial Benefits
Greater than $70 million of expected annual expense synergies
Profitable in force portfolio; 70% expected to be retained
Enhanced Distribution
Adds established Lloyd_s franchise
Creates ability to leverage current
London underwriters into Lloyd_s distribution
Scale and Market Relevance
Strengthens Endurance_s position in the global marketplace
Larger more relevant catastrophe portfolio
Increased ENH shareholders equity by $1.6 billion
Enhanced client and broker relationships
Alternative capital
Blue Capital adds third party capital management expertise
Increases product offerings and provides greater capital flexibility and leverage
Attractive fee income stream
The integration of Montpelier was immediate and completed within weeks of closing the transaction. All employees are externally focused and able to take advantage of our enhanced and more relevant place in the market.
5
|
|
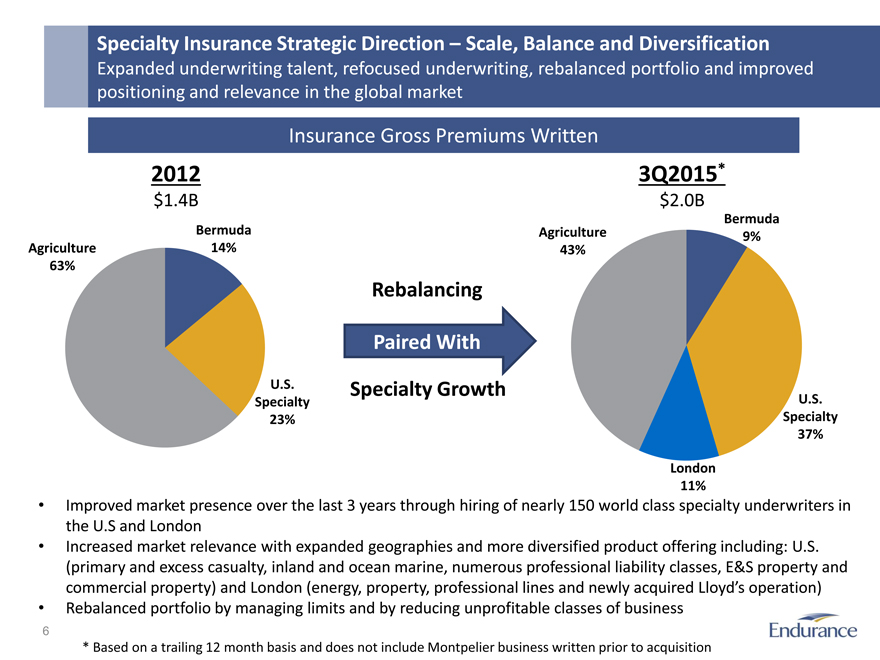
Insurance Gross Premiums Written
Specialty Insurance Strategic Direction Scale, Balance and Diversification
Expanded underwriting talent, refocused underwriting, rebalanced portfolio and improved positioning and relevance in the global market
Rebalancing
Paired With
Specialty Growth
2012 3Q2015*
$1.4B $2.0B
Bermuda 9%
Bermuda 14% Agriculture 43%
Agriculture 63%
U.S.
Specialty U.S.
23% Specialty
37%
London
11%
• Improved market presence over the last 3 years through hiring of nearly 150 world class specialty underwriters in the U.S and London Increased market relevance with expanded geographies and more diversified product offering including: U.S. (primary and excess casualty, inland and ocean marine, numerous professional liability classes, E&S property and commercial property) and London (energy, property, professional lines and newly acquired Lloyd_s operation)
Rebalanced portfolio by managing limits and by reducing unprofitable classes of business
* Based on a trailing 12 month basis and does not include Montpelier business written prior to acquisition
6
|
|
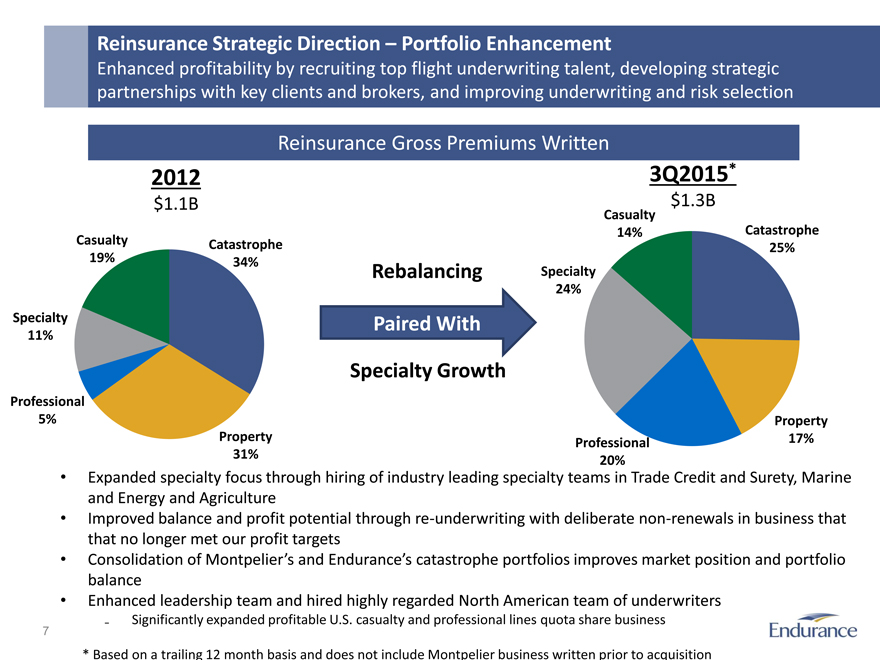
Reinsurance Strategic Direction Portfolio Enhancement
Enhanced profitability by recruiting top flight underwriting talent, developing strategic partnerships with key clients and brokers, and improving underwriting and risk selection
* Based on a trailing 12 month basis and does not include Montpelier business written prior to acquisition
Rebalancing Paired With Specialty Growth
Reinsurance Gross Premiums Written
2012 3Q2015*
$1.1B $1.3B
Casualty
14% Catastrophe 25%
Casualty 19% Catastrophe 34%
Specialty 24%
Specialty 11%
Professional 5%
Property 17%
Property 31% Professional 20%
• Expanded specialty focus through hiring of industry leading specialty teams in Trade Credit and Surety, Marine and Energy and Agriculture
Improved balance and profit potential through re-underwriting with deliberate non-renewals in business that that no longer met our profit targets
Consolidation of Montpelier_s and Endurance_s catastrophe portfolios improves market position and portfolio balance
Enhanced leadership team and hired highly regarded North American team of underwriters
Significantly expanded profitable U.S. casualty and professional lines quota share business
7
|
|
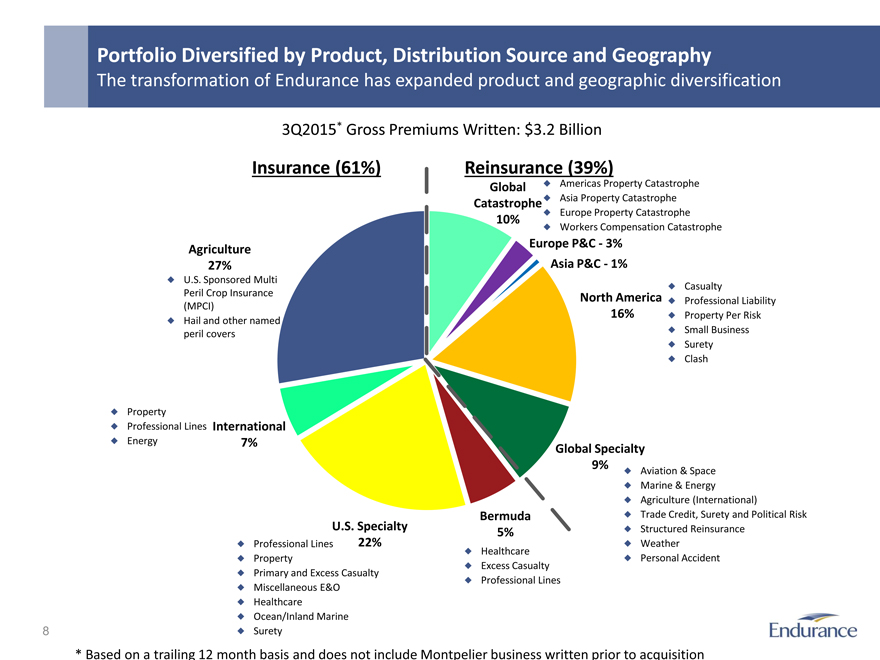
Portfolio Diversified by Product, Distribution Source and Geography
The transformation of Endurance has expanded product and geographic diversification
3Q2015* Gross Premiums Written: $3.2 Billion
Insurance (61%) Reinsurance (39%)
Global Catastrophe 10%
Americas Property Catastrophe
Asia Property Catastrophe
Europe Property Catastrophe
Workers Compensation Catastrophe
Agriculture 27% Europe P&C—3%
Asia P&C—1%
U.S. Sponsored Multi
Hail and other named peril covers
Peril Crop Insurance
(MPCI)
North America 16%
Casualty
Professional Liability
Property Per Risk
Small Business
Surety
Clash
International 7%
Property
Professional Lines
Energy
Global Specialty 9%
Aviation & Space
Marine & Energy
Agriculture (International)
Structured Reinsurance
Trade Credit, Surety and Political Risk
Weather
Personal Accident
Bermuda 5%
Healthcare
Excess Casualty
Professional Lines
U.S. Specialty 22%
Professional Lines
Property
Primary and Excess Casualty
Miscellaneous E&O
Healthcare
Ocean/Inland Marine
Surety
* Based on a trailing 12 month basis and does not include Montpelier business written prior to acquisition
8
|
|
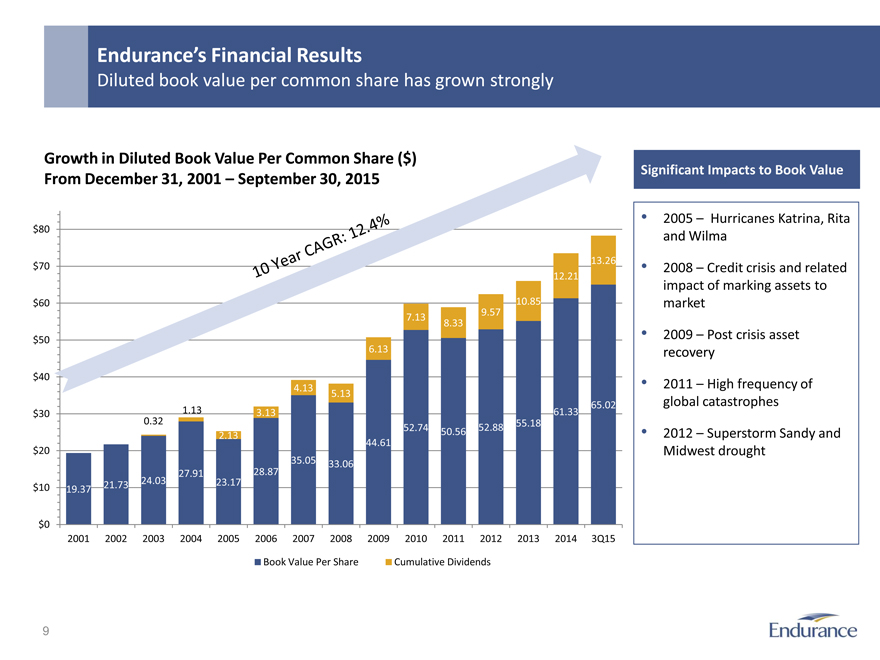
Endurance_s Financial Results
Diluted book value per common share has grown strongly
Growth in Diluted Book Value Per Common Share ($)
From December 31, 2001 September 30, 2015
$80
$70 13.26
12.21
$60 10.85
7.13 9.57
8.33
$50
6.13
$40
4.13 5.13
$30 1.13 3.13 61.33 65.02
0.32 55.18
52.74 50.56 52.88
2.13
44.61
$20
35.05 33.06
27.91 28.87
21.73 24.03 23.17
$10 19.37
$0
2001 2002 2003 2004 2005 2006 2007 2008 2009 2010 2011 2012 2013 2014 3Q15
Book Value Per Share Cumulative Dividends
Significant Impacts to Book Value
2005 Hurricanes Katrina, Rita and Wilma
2008 Credit crisis and related impact of marking assets to market
2009 Post crisis asset recovery
2011 High frequency of global catastrophes
2012 Superstorm Sandy and Midwest drought
9
|
|
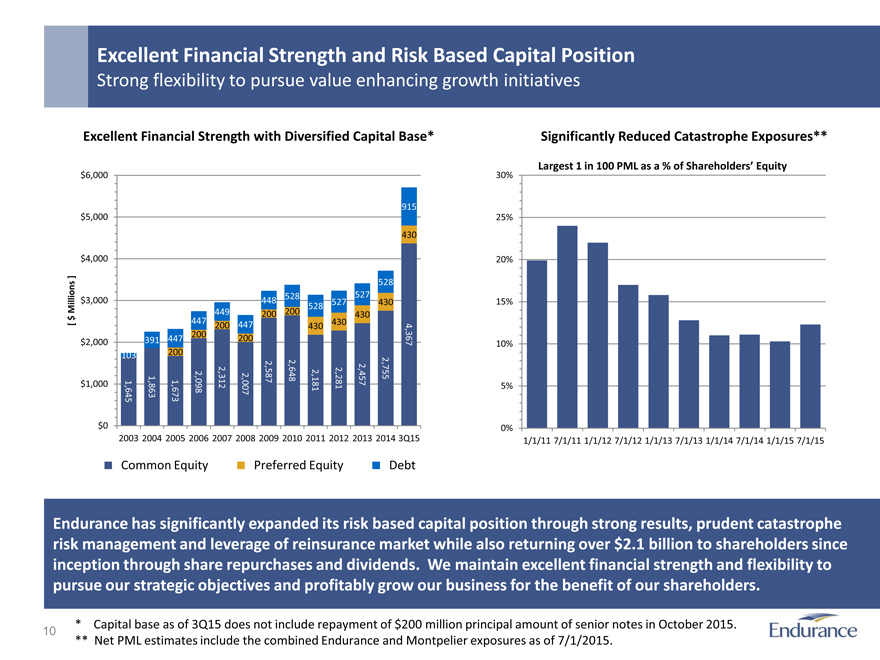
Excellent Financial Strength and Risk Based Capital Position
Strong flexibility to pursue value enhancing growth initiatives
Excellent Financial Strength with Diversified Capital Base* Significantly Reduced Catastrophe Exposures**
Largest 1 in 100 PML as a % of Shareholders Equity
$6,000 30%
915
$5,000 25%
430
$4,000 20%
528
528 527
$3,000 448 527 430 15%
528
449 200 200 430
[ $ Millions ] 447 200 447 430 430
200
$2,000 391 447 200 4,367 10%
103 200
$1,000 1,645 1,863 1,673 2,098 2,312 2,007 2,587 2,648 2,181 2,281 2,457 2,755 5%
$0 0%
2003 2004 2005 2006 2007 2008 2009 2010 2011 2012 2013 2014 3Q15 1/1/11 7/1/11 1/1/12 7/1/12 1/1/13 7/1/13 1/1/14 7/1/14 1/1/15 7/1/15
Common Equity Preferred Equity Debt
Endurance has significantly expanded its risk based capital position through strong results, prudent catastrophe risk management and leverage of reinsurance market while also returning over $2.1 billion to shareholders since inception through share repurchases and dividends. We maintain excellent financial strength and flexibility to pursue our strategic objectives and profitably grow our business for the benefit of our shareholders.
* Capital base as of 3Q15 does not include repayment of $200 million principal amount of senior notes in October 2015. ** Net PML estimates include the combined Endurance and Montpelier exposures as of 7/1/2015.
10
|
|
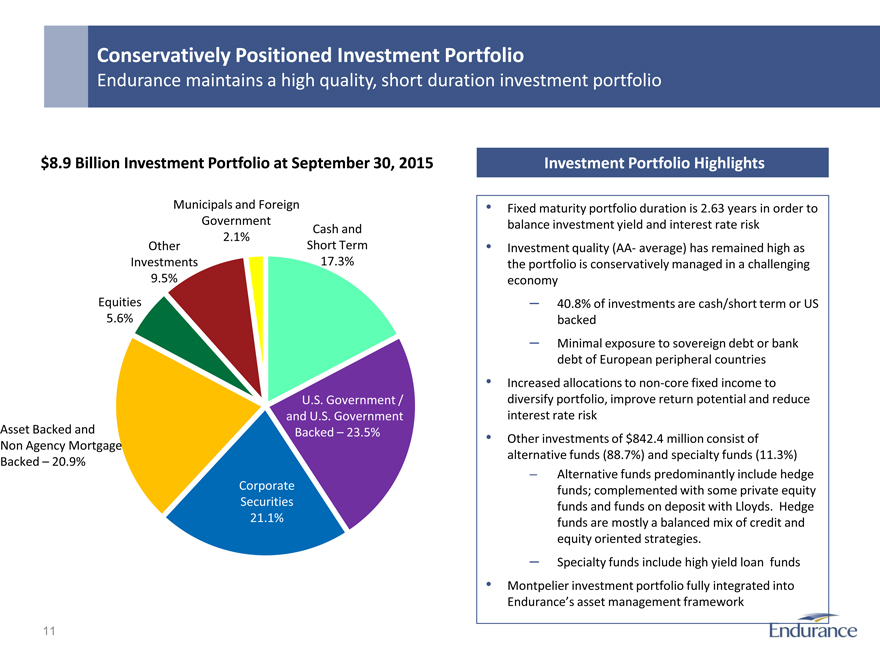
Conservatively Positioned Investment Portfolio
Endurance maintains a high quality, short duration investment portfolio
Investment Portfolio Highlights
Fixed maturity portfolio duration is 2.63 years in order to balance investment yield and interest rate risk
Investment quality (AA- average) has remained high as the portfolio is conservatively managed in a challenging economy
40.8% of investments are cash/short term or US backed
Minimal exposure to sovereign debt or bank debt of European peripheral countries
Increased allocations to non-core fixed income to diversify portfolio, improve return potential and reduce interest rate risk
Other investments of $842.4 million consist of alternative funds (88.7%) and specialty funds (11.3%)
Alternative funds predominantly include hedge funds; complemented with some private equity funds and funds on deposit with Lloyds. Hedge funds are mostly a balanced mix of credit and equity oriented strategies.
Specialty funds include high yield loan funds
Montpelier investment portfolio fully integrated into
Endurance_s asset management framework
$8.9 Billion Investment Portfolio at September 30, 2015
Municipals and Foreign
Government
Cash and
2.1%
Other Short Term
Investments 17.3%
9.5%
Equities
5.6%
U.S. Government /
and U.S. Government
Asset Backed and Backed 23.5%
Non Agency Mortgage
Backed 20.9%
Corporate
Securities
21.1%
11
|
|
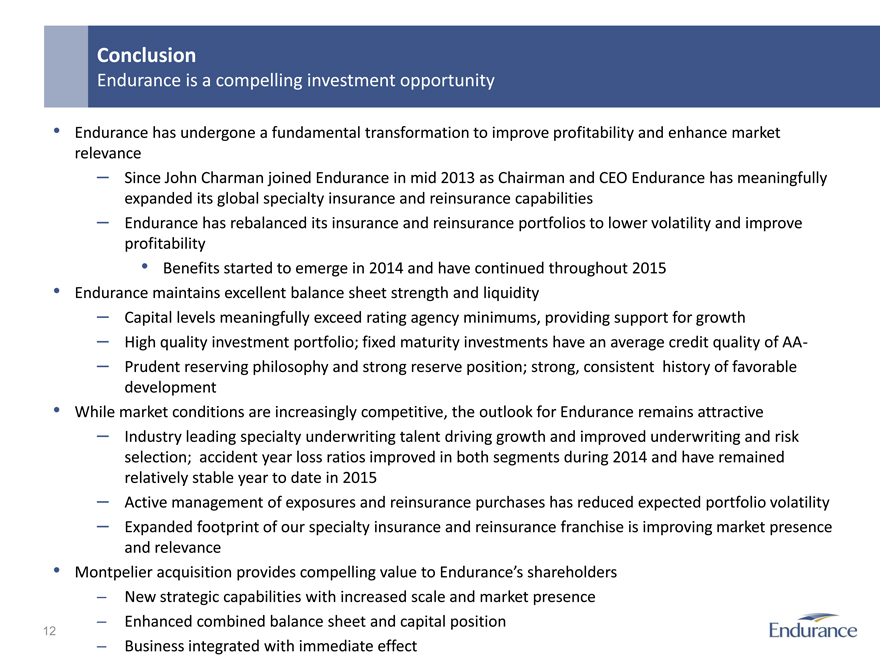
Conclusion
Endurance is a compelling investment opportunity
Endurance has undergone a fundamental transformation to improve profitability and enhance market relevance
Since John Charman joined Endurance in mid 2013 as Chairman and CEO Endurance has meaningfully expanded its global specialty insurance and reinsurance capabilities
Endurance has rebalanced its insurance and reinsurance portfolios to lower volatility and improve profitability
Benefits started to emerge in 2014 and have continued throughout 2015
Endurance maintains excellent balance sheet strength and liquidity
Capital levels meaningfully exceed rating agency minimums, providing support for growth
High quality investment portfolio; fixed maturity investments have an average credit quality of AA-
Prudent reserving philosophy and strong reserve position; strong, consistent history of favorable development
While market conditions are increasingly competitive, the outlook for Endurance remains attractive
Industry leading specialty underwriting talent driving growth and improved underwriting and risk selection; accident year loss ratios improved in both segments during 2014 and have remained relatively stable year to date in 2015
Active management of exposures and reinsurance purchases has reduced expected portfolio volatility
Expanded footprint of our specialty insurance and reinsurance franchise is improving market presence and relevance
Montpelier acquisition provides compelling value to Endurance_s shareholders
New strategic capabilities with increased scale and market presence
Enhanced combined balance sheet and capital position
Business integrated with immediate effect
12
|
|
Appendix
|
|

Overview of ARMtech
|
|
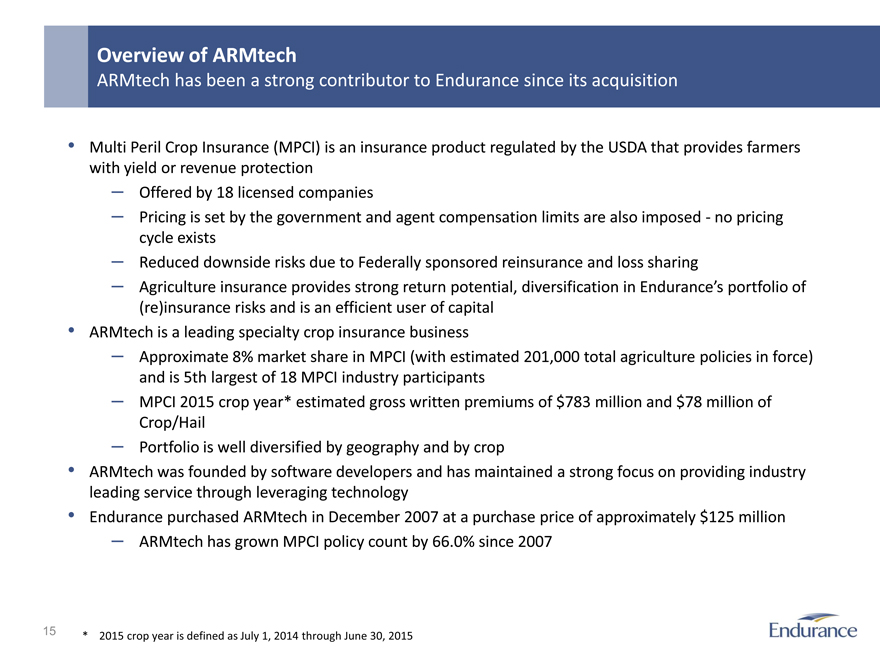
Overview of ARMtech
ARMtech has been a strong contributor to Endurance since its acquisition
Multi Peril Crop Insurance (MPCI) is an insurance product regulated by the USDA that provides farmers with yield or revenue protection Offered by 18 licensed companies Pricing is set by the government and agent compensation limits are also imposed—no pricing cycle exists Reduced downside risks due to Federally sponsored reinsurance and loss sharing
Agriculture insurance provides strong return potential, diversification in Endurance_s portfolio of (re)insurance risks and is an efficient user of capital ARMtech is a leading specialty crop insurance business
Approximate 8% market share in MPCI (with estimated 201,000 total agriculture policies in force) and is 5th largest of 18 MPCI industry participants MPCI 2015 crop year* estimated gross written premiums of $783 million and $78 million of Crop/Hail Portfolio is well diversified by geography and by crop ARMtech was founded by software developers and has maintained a strong focus on providing industry leading service through leveraging technology
Endurance purchased ARMtech in December 2007 at a purchase price of approximately $125 million
ARMtech has grown MPCI policy count by 66.0% since 2007
* 2015 crop year is defined as July 1, 2014 through June 30, 2015
15
|
|
ARMtech is a Leader in Crop Insurance
ARMtech_s focus on technology and service has allowed it to steadily grow its business
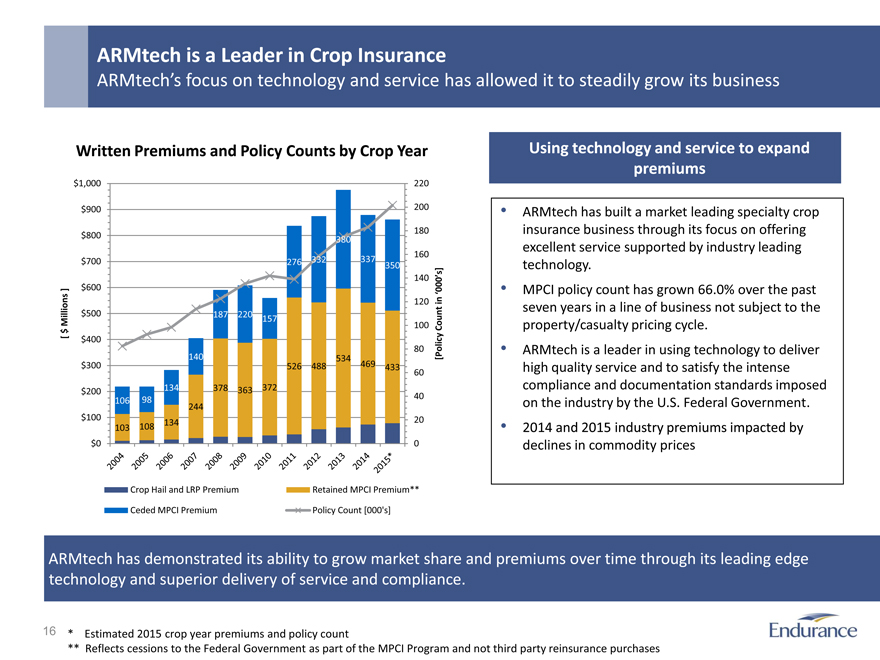
Written Premiums and Policy Counts by Crop Year
[ $ Millions ]
$1,000 220
$900 200
180
$800 380
160
$700 276 332 337 350
140
$600
120
$500 187 220 157
100
$400
80
140 534
$300 526 488 469 433 60
$200 134 378 363 372
106 98 40
244
$100 134 20
103 108
$0 0
[Policy Count in _000_s]
Crop Hail and LRP Premium
Ceded MPCI Premium
Retained MPCI Premium**
Policy Count [000’s]
Using technology and service to expand premiums
ARMtech has built a market leading specialty crop insurance business through its focus on offering excellent service supported by industry leading technology.
MPCI policy count has grown 66.0% over the past seven years in a line of business not subject to the property/casualty pricing cycle.
ARMtech is a leader in using technology to deliver high quality service and to satisfy the intense compliance and documentation standards imposed on the industry by the U.S. Federal Government.
2014 and 2015 industry premiums impacted by declines in commodity prices
ARMtech has demonstrated its ability to grow market share and premiums over time through its leading edge technology and superior delivery of service and compliance.
* Estimated 2015 crop year premiums and policy count
** Reflects cessions to the Federal Government as part of the MPCI Program and not third party reinsurance purchases
16
|
|
ARMtech is Increasing Market Share and Geographic Diversification
2012 through 2015 were very strong marketing years for ARMtech
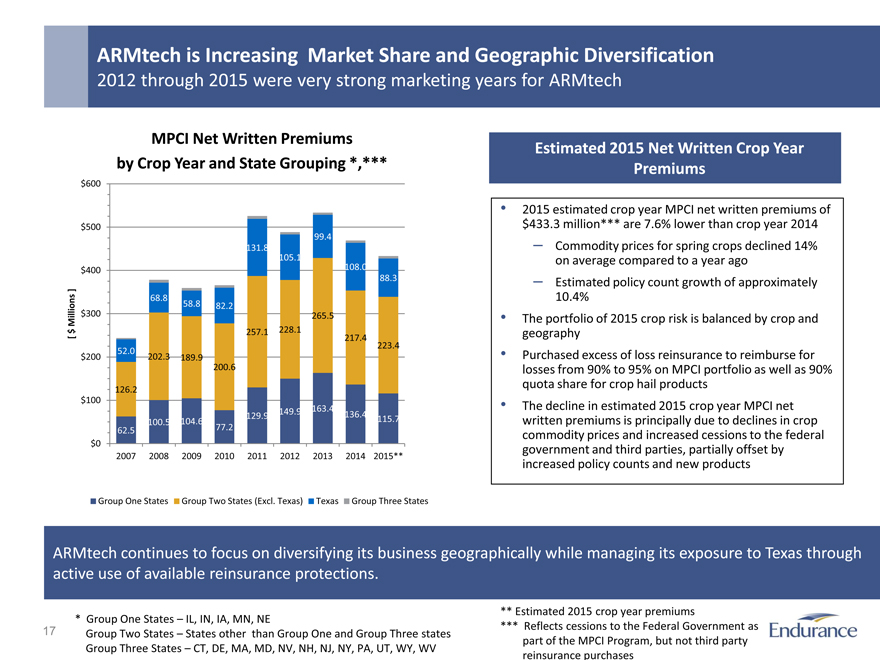
MPCI Net Written Premiums by Crop Year and State Grouping *,***
[$ Millions]
$600
$500
99.4
131.8
105.1
$400 108.0
88.3
68.8
58.8 82.2
$300 265.5
257.1 228.1
217.4
52.0 223.4
$200 202.3 189.9
200.6
126.2
$100
149.9 163.4
129.9 136.4
100.5 104.6 115.7
62.5 77.2
$0
2007 2008 2009 2010 2011 2012 2013 2014 2015**
Group One States Group Two States (Excl. Texas) Texas Group Three States
Estimated 2015 Net Written Crop Year Premiums
2015 estimated crop year MPCI net written premiums of $433.3 million*** are 7.6% lower than crop year 2014
Commodity prices for spring crops declined 14% on average compared to a year ago
Estimated policy count growth of approximately 10.4%
The portfolio of 2015 crop risk is balanced by crop and geography
Purchased excess of loss reinsurance to reimburse for losses from 90% to 95% on MPCI portfolio as well as 90% quota share for crop hail products
The decline in estimated 2015 crop year MPCI net written premiums is principally due to declines in crop commodity prices and increased cessions to the federal government and third parties, partially offset by increased policy counts and new products
ARMtech continues to focus on diversifying its business geographically while managing its exposure to Texas through active use of available reinsurance protections.
* Group One States IL, IN, IA, MN, NE
Group Two States States other than Group One and Group Three states Group Three States CT, DE, MA, MD, NV, NH, NJ, NY, PA, UT, WY, WV
** Estimated 2015 crop year premiums
*** Reflects cessions to the Federal Government as part of the MPCI Program, but not third party reinsurance purchases
17
|
|
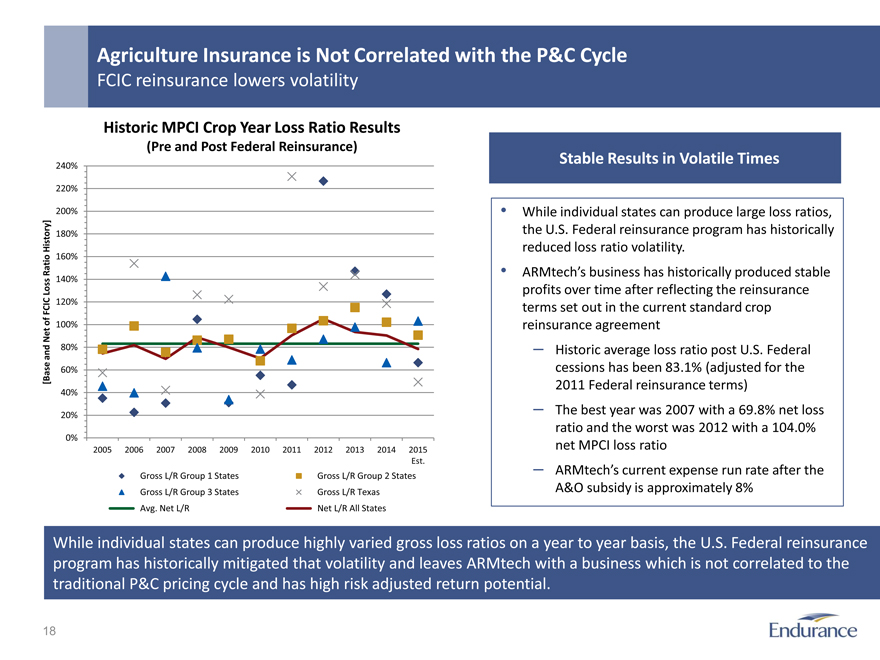
Agriculture Insurance is Not Correlated with the P&C Cycle
FCIC reinsurance lowers volatility
Historic MPCI Crop Year Loss Ratio Results
(Pre and Post Federal Reinsurance)
[Base and Net of FCIC Loss Ratio History]
240%
220%
200%
180%
160%
140%
120%
100%
80%
60%
40%
20%
0%
2005 2006 2007 2008 2009 2010 2011 2012 2013 2014 2015
Est.
Gross L/R Group 1 States Gross L/R Group 2 States
Gross L/R Group 3 States Gross L/R Texas
Avg. Net L/R Net L/R All States
Stable Results in Volatile Times
While individual states can produce large loss ratios, the U.S. Federal reinsurance program has historically reduced loss ratio volatility.
ARMtech_s business has historically produced stable profits over time after reflecting the reinsurance terms set out in the current standard crop reinsurance agreement
Historic average loss ratio post U.S. Federal cessions has been 83.1% (adjusted for the 2011 Federal reinsurance terms)
The best year was 2007 with a 69.8% net loss ratio and the worst was 2012 with a 104.0% net MPCI loss ratio
ARMtech_s current expense run rate after the A&O subsidy is approximately 8%
While individual states can produce highly varied gross loss ratios on a year to year basis, the U.S. Federal reinsurance program has historically mitigated that volatility and leaves ARMtech with a business which is not correlated to the traditional P&C pricing cycle and has high risk adjusted return potential.
18
|
|
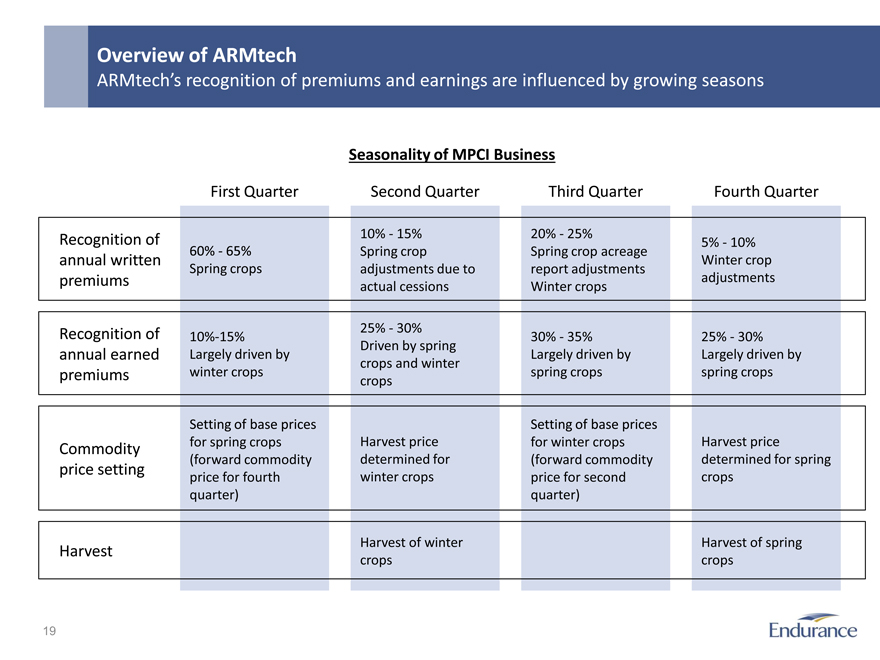
Overview of ARMtech
ARMtech_s recognition of premiums and earnings are influenced by growing seasons
Seasonality of MPCI Business
First Quarter Second Quarter Third Quarter Fourth Quarter
Recognition of 10%—15% 20%—25% 5%—10%
60%—65% Spring crop Spring crop acreage
annual written Winter crop
Spring crops adjustments due to report adjustments
premiums actual cessions Winter crops adjustments
Recognition of 10%-15% 25%—30% 30%—35% 25%—30%
Driven by spring
annual earned Largely driven by Largely driven by Largely driven by
crops and winter
premiums winter crops crops spring crops spring crops
Setting of base prices Setting of base prices
Commodity for spring crops Harvest price for winter crops Harvest price
(forward commodity determined for(forward commodity determined for spring
price setting price for fourth winter crops price for second crops
quarter) quarter)
Harvest Harvest of winter Harvest of spring
crops crops
19
|
|
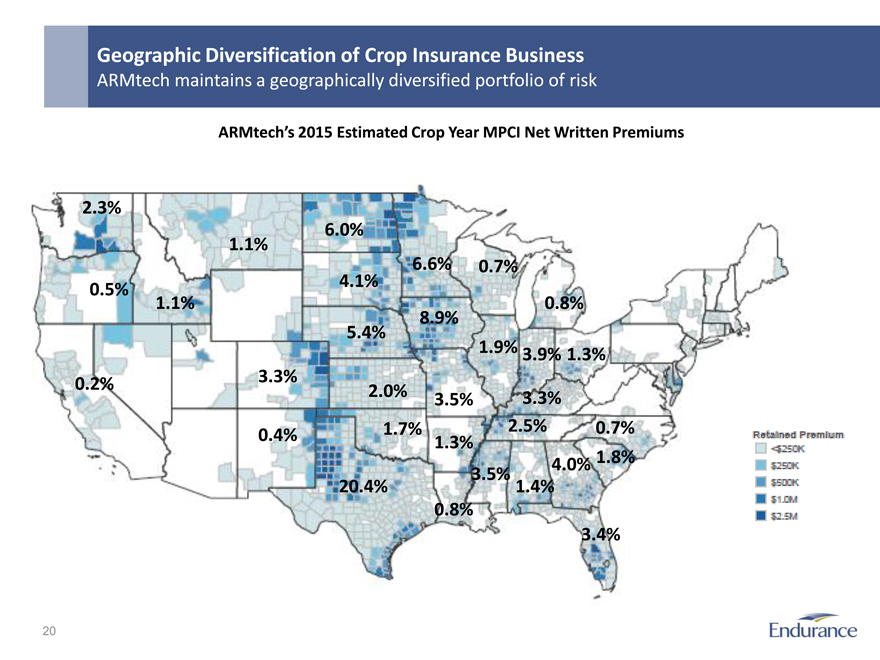
Geographic Diversification of Crop Insurance Business
ARMtech maintains a geographically diversified portfolio of risk
ARMtech_s 2015 Estimated Crop Year MPCI Net Written Premiums
2.3%
6.0%
1.1%
6.6% 0.7%
0.5% 4.1%
1.1% 0.8%
8.9%
5.4%
1.9% 3.9% 1.3%
3.3%
0.2% 2.0% 3.5% 3.3%
0.4% 1.7% 2.5% 0.7%
1.3%
4.0% 1.8%
20.4% 3.5% 1.4%
0.8%
3.4%
|
|
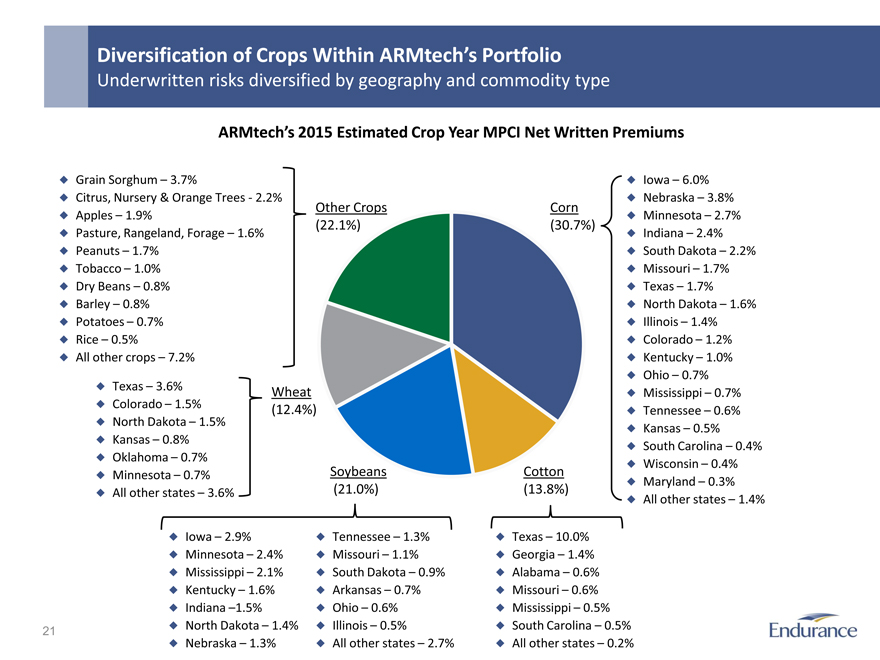
Diversification of Crops Within ARMtech_s Portfolio
Underwritten risks diversified by geography and commodity type
ARMtech_s 2015 Estimated Crop Year MPCI Net Written Premiums
Grain Sorghum 3.7% Iowa 6.0%
Citrus, Nursery & Orange Trees—2.2% Nebraska 3.8%
Other Crops Corn
Apples 1.9% Minnesota 2.7%
(22.1%)(30.7%)
Pasture, Rangeland, Forage 1.6% Indiana 2.4%
Peanuts 1.7% South Dakota 2.2%
Tobacco 1.0% Missouri 1.7%
Dry Beans 0.8% Texas 1.7%
Barley 0.8% North Dakota 1.6%
Potatoes 0.7% Illinois 1.4%
Rice 0.5% Colorado 1.2%
All other crops 7.2% Kentucky 1.0%
Ohio 0.7%
Texas 3.6% Wheat Mississippi 0.7%
Colorado 1.5%(12.4%) Tennessee 0.6%
North Dakota 1.5% Kansas 0.5%
Kansas 0.8% South Carolina 0.4%
Oklahoma 0.7% Wisconsin 0.4%
Minnesota 0.7% Soybeans Cotton Maryland 0.3%
All other states 3.6%(21.0%)(13.8%) All other states 1.4%
Iowa 2.9% Tennessee 1.3% Texas 10.0%
Minnesota 2.4% Missouri 1.1% Georgia 1.4%
Mississippi 2.1% South Dakota 0.9% Alabama 0.6%
Kentucky 1.6% Arkansas 0.7% Missouri 0.6%
Indiana _1.5% Ohio 0.6% Mississippi 0.5%
North Dakota 1.4% Illinois 0.5% South Carolina 0.5%
Nebraska 1.3% All other states 2.7% All other states 0.2%
21
|
|
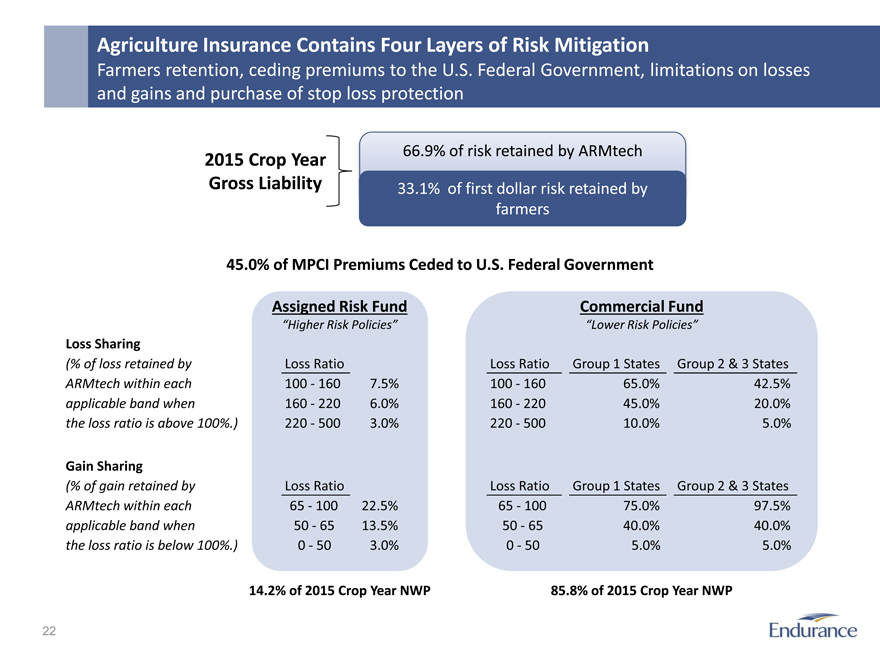
Agriculture Insurance Contains Four Layers of Risk Mitigation
Farmers retention, ceding premiums to the U.S. Federal Government, limitations on losses and gains and purchase of stop loss protection
2015 Crop Year Gross Liability
66.9% of risk retained by ARMtech
33.1% of first dollar risk retained by farmers
45.0% of MPCI Premiums Ceded to U.S. Federal Government
Assigned Risk Fund Commercial Fund
_Higher Risk Policies Lower Risk Policies_
Loss Sharing
(% of loss retained by Loss Ratio Loss Ratio Group 1 States Group 2 & 3 States
ARMtech within each 100—160 7.5% 100—160 65.0% 42.5%
applicable band when 160—220 6.0% 160—220 45.0% 20.0%
the loss ratio is above 100%.) 220—500 3.0% 220—500 10.0% 5.0%
Gain Sharing
(% of gain retained by Loss Ratio Loss Ratio Group 1 States Group 2 & 3 States
ARMtech within each 65—100 22.5% 65—100 75.0% 97.5%
applicable band when 50—65 13.5% 50—65 40.0% 40.0%
the loss ratio is below 100%.) 0—50 3.0% 0—50 5.0% 5.0%
14.2% of 2015 Crop Year NWP 85.8% of 2015 Crop Year NWP
22
|
|
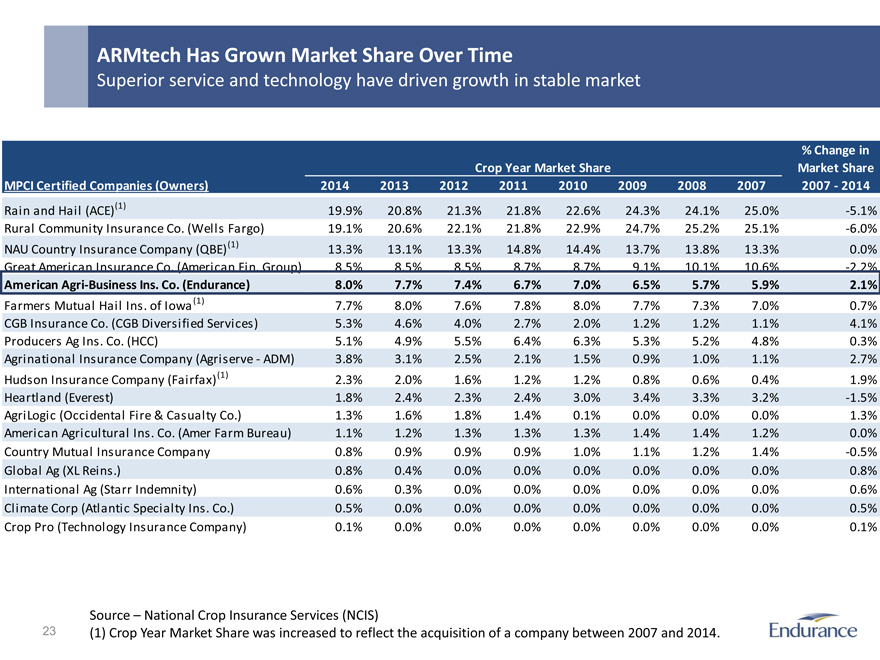
ARMtech Has Grown Market Share Over Time
Superior service and technology have driven growth in stable market
% Change in
Crop Year Market Share Market Share
MPCI Certified Companies (Owners) 2014 2013 2012 2011 2010 2009 2008 2007 2007—2014
Rain and Hail (ACE)(1) 19.9% 20.8% 21.3% 21.8% 22.6% 24.3% 24.1% 25.0% -5.1%
Rural Community Insurance Co. (Wells Fargo) 19.1% 20.6% 22.1% 21.8% 22.9% 24.7% 25.2% 25.1% -6.0%
NAU Country Insurance Company (QBE)(1) 13.3% 13.1% 13.3% 14.8% 14.4% 13.7% 13.8% 13.3% 0.0%
Great American Insurance Co. (American Fin. Group) 8.5% 8.5% 8.5% 8.7% 8.7% 9.1% 10.1% 10.6% -2.2%
American Agri-Business Ins. Co. (Endurance) 8.0% 7.7% 7.4% 6.7% 7.0% 6.5% 5.7% 5.9% 2.1%
Farmers Mutual Hail Ins . of Iowa (1) 7.7% 8.0% 7.6% 7.8% 8.0% 7.7% 7.3% 7.0% 0.7%
CGB Insurance Co. (CGB Diversified Services) 5.3% 4.6% 4.0% 2.7% 2.0% 1.2% 1.2% 1.1% 4.1%
Producers Ag Ins . Co. (HCC) 5.1% 4.9% 5.5% 6.4% 6.3% 5.3% 5.2% 4.8% 0.3%
Agrinational Insurance Company (Agriserve—ADM) 3.8% 3.1% 2.5% 2.1% 1.5% 0.9% 1.0% 1.1% 2.7%
Hudson Insurance Company (Fairfax)(1) 2.3% 2.0% 1.6% 1.2% 1.2% 0.8% 0.6% 0.4% 1.9%
Heartland (Everest) 1.8% 2.4% 2.3% 2.4% 3.0% 3.4% 3.3% 3.2% -1.5%
AgriLogic (Occidental Fire & Casualty Co.) 1.3% 1.6% 1.8% 1.4% 0.1% 0.0% 0.0% 0.0% 1.3%
American Agricultural Ins . Co. (Amer Farm Bureau) 1.1% 1.2% 1.3% 1.3% 1.3% 1.4% 1.4% 1.2% 0.0%
Country Mutual Insurance Company 0.8% 0.9% 0.9% 0.9% 1.0% 1.1% 1.2% 1.4% -0.5%
Global Ag (XL Reins .) 0.8% 0.4% 0.0% 0.0% 0.0% 0.0% 0.0% 0.0% 0.8%
International Ag (Starr Indemnity) 0.6% 0.3% 0.0% 0.0% 0.0% 0.0% 0.0% 0.0% 0.6%
Climate Corp (Atlantic Specialty Ins . Co.) 0.5% 0.0% 0.0% 0.0% 0.0% 0.0% 0.0% 0.0% 0.5%
Crop Pro (Technology Insurance Company) 0.1% 0.0% 0.0% 0.0% 0.0% 0.0% 0.0% 0.0% 0.1%
Source National Crop Insurance Services (NCIS)
(1) Crop Year Market Share was increased to reflect the acquisition of a company between 2007 and 2014.
23
|
|

Other Miscellaneous Information
|
|
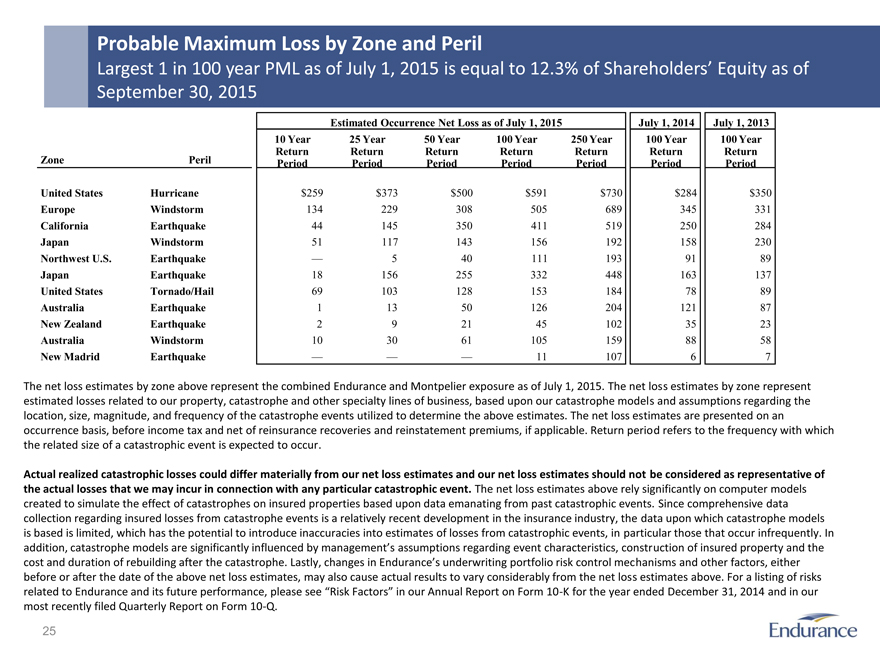
Probable Maximum Loss by Zone and Peril
Largest 1 in 100 year PML as of July 1, 2015 is equal to 12.3% of Shareholders Equity as of
September 30, 2015
Estimated Occurrence Net Loss as of July 1, 2015 July 1, 2014 July 1, 2013
Zone Peril 10 Year Return Period 25 Year Return Period 50 Year Return Period 100 Year Return Period 250 Year Return Period 100 Year Return Period 100 Year Return Period
United States Hurricane $259 $373 $500 $591 $730 $284 $350
Europe Windstorm 134 229 308 505 689 345 331
California Earthquake 44 145 350 411 519 250 284
Japan Windstorm 51 117 143 156 192 158 230
Northwest U.S. Earthquake _ 5 40 111 193 91 89
Japan Earthquake 18 156 255 332 448 163 137
United States Tornado/Hail 69 103 128 153 184 78 89
Australia Earthquake 1 13 50 126 204 121 87
New Zealand Earthquake 2 9 21 45 102 35 23
Australia Windstorm 10 30 61 105 159 88 58
New Madrid Earthquake 11 107 6 7
The net loss estimates by zone above represent the combined Endurance and Montpelier exposure as of July 1, 2015. The net loss estimates by zone represent estimated losses related to our property, catastrophe and other specialty lines of business, based upon our catastrophe models and assumptions regarding the location, size, magnitude, and frequency of the catastrophe events utilized to determine the above estimates. The net loss estimates are presented on an occurrence basis, before income tax and net of reinsurance recoveries and reinstatement premiums, if applicable. Return period refers to the frequency with which the related size of a catastrophic event is expected to occur.
Actual realized catastrophic losses could differ materially from our net loss estimates and our net loss estimates should not be considered as representative of the actual losses that we may incur in connection with any particular catastrophic event. The net loss estimates above rely significantly on computer models created to simulate the effect of catastrophes on insured properties based upon data emanating from past catastrophic events. Since comprehensive data collection regarding insured losses from catastrophe events is a relatively recent development in the insurance industry, the data upon which catastrophe models is based is limited, which has the potential to introduce inaccuracies into estimates of losses from catastrophic events, in particular those that occur infrequently. In addition, catastrophe models are significantly influenced by management_s assumptions regarding event characteristics, construction of insured property and the cost and duration of rebuilding after the catastrophe. Lastly, changes in Endurance_s underwriting portfolio risk control mechanisms and other factors, either before or after the date of the above net loss estimates, may also cause actual results to vary considerably from the net loss estimates above. For a listing of risks related to Endurance and its future performance, please see _Risk Factors in our Annual Report on Form 10-K for the year ended December 31, 2014 and in our most recently filed Quarterly Report on Form 10-Q.
25
|
|
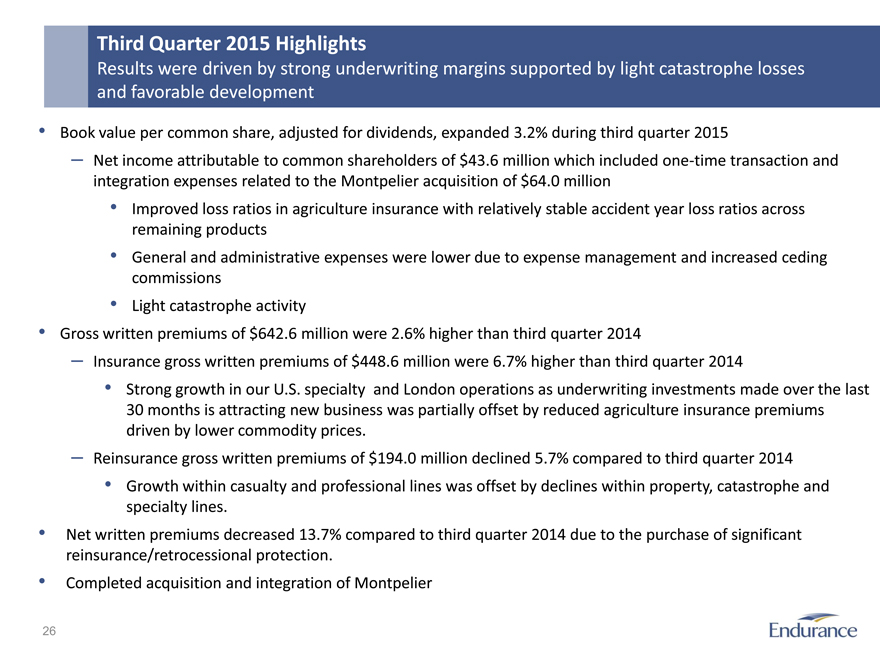
Third Quarter 2015 Highlights
Results were driven by strong underwriting margins supported by light catastrophe losses and favorable development
Book value per common share, adjusted for dividends, expanded 3.2% during third quarter 2015
Net income attributable to common shareholders of $43.6 million which included one-time transaction and integration expenses related to the Montpelier acquisition of $64.0 million
Improved loss ratios in agriculture insurance with relatively stable accident year loss ratios across remaining products
General and administrative expenses were lower due to expense management and increased ceding commissions
Light catastrophe activity
Gross written premiums of $642.6 million were 2.6% higher than third quarter 2014
Insurance gross written premiums of $448.6 million were 6.7% higher than third quarter 2014
Strong growth in our U.S. specialty and London operations as underwriting investments made over the last
30 months is attracting new business was partially offset by reduced agriculture insurance premiums driven by lower commodity prices.
Reinsurance gross written premiums of $194.0 million declined 5.7% compared to third quarter 2014
Growth within casualty and professional lines was offset by declines within property, catastrophe and specialty lines.
Net written premiums decreased 13.7% compared to third quarter 2014 due to the purchase of significant reinsurance/retrocessional protection.
Completed acquisition and integration of Montpelier
26
|
|
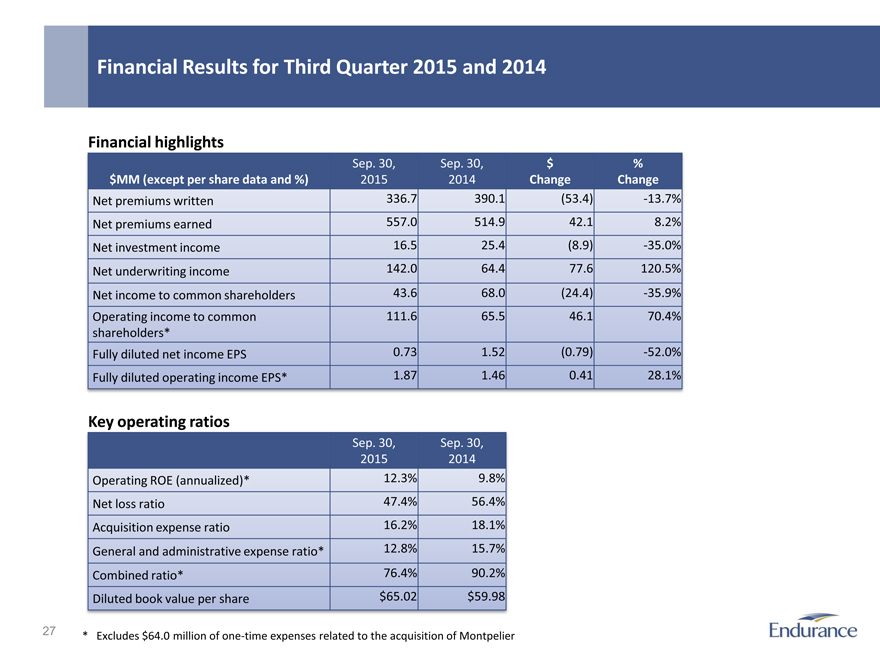
Financial Results for Third Quarter 2015 and 2014
Financial highlights
Sep. 30, Sep. 30, $%
$MM (except per share data and %) 2015 2014 Change Change
Net premiums written 336.7 390.1(53.4) -13.7%
Net premiums earned 557.0 514.9 42.1 8.2%
Net investment income 16.5 25.4(8.9) -35.0%
Net underwriting income 142.0 64.4 77.6 120.5%
Net income to common shareholders 43.6 68.0(24.4) -35.9%
Operating income to common 111.6 65.5 46.1 70.4%
shareholders*
Fully diluted net income EPS 0.73 1.52(0.79) -52.0%
Fully diluted operating income EPS* 1.87 1.46 0.41 28.1%
Key operating ratios
Sep. 30, 2015 Sep. 30, 2014
Operating ROE (annualized)* 12.3% 9.8%
Net loss ratio 47.4% 56.4%
Acquisition expense ratio 16.2% 18.1%
General and administrative expense ratio* 12.8% 15.7%
Combined ratio* 76.4% 90.2%
Diluted book value per share $65.02 $59.98
*Excludes $64.0 million of one-time expenses related to the acquisition of Montpelier
27
|
|
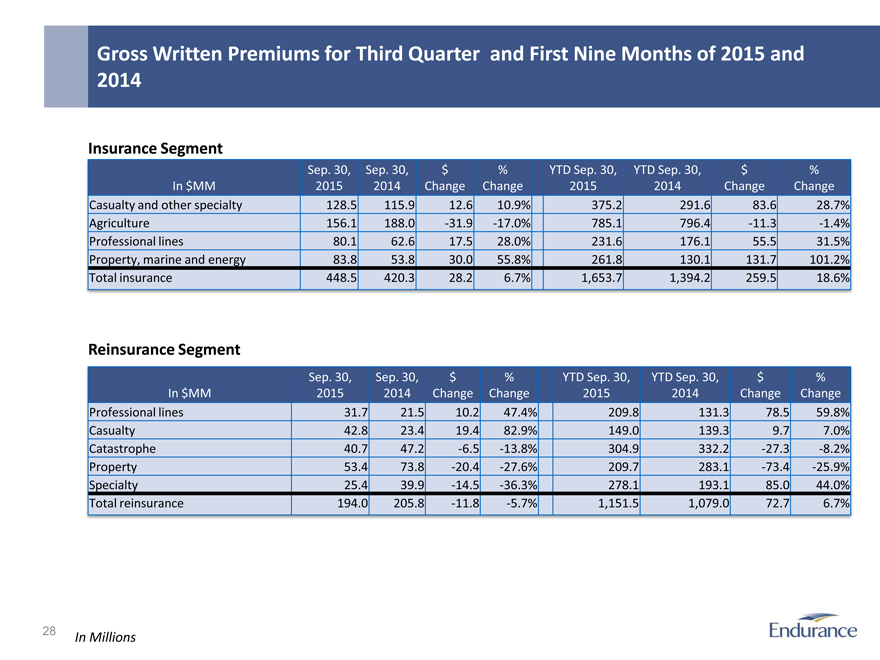
Gross Written Premiums for Third Quarter and First Nine Months of 2015 and 2014
Insurance Segment
In $MM Sep. 30, 2015 Sep. 30, 2014 $ Change% Change YTD Sep. 30, 2015 YTD Sep. 30, 2014 $ Change% Change
Casualty and other specialty 128.5 115.9 12.6 10.9% 375.2 291.6 83.6 28.7%
Agriculture 156.1 188.0 -31.9 -17.0% 785.1 796.4 -11.3 -1.4%
Professional lines 80.1 62.6 17.5 28.0% 231.6 176.1 55.5 31.5%
Property, marine and energy 83.8 53.8 30.0 55.8% 261.8 130.1 131.7 101.2%
Total insurance 448.5 420.3 28.2 6.7% 1,653.7 1,394.2 259.5 18.6%
Reinsurance Segment
In $MM Sep. 30, 2015 Sep. 30, 2014 $ Change% Change YTD Sep. 30, 2015 YTD Sep. 30, 2014 $ Change% Change
Professional lines 31.7 21.5 10.2 47.4% 209.8 131.3 78.5 59.8%
Casualty 42.8 23.4 19.4 82.9% 149.0 139.3 9.7 7.0%
Catastrophe 40.7 47.2 -6.5 -13.8% 304.9 332.2 -27.3 -8.2%
Property 53.4 73.8 -20.4 -27.6% 209.7 283.1 -73.4 -25.9%
Specialty 25.4 39.9 -14.5 -36.3% 278.1 193.1 85.0 44.0%
Total reinsurance 194.0 205.8 -11.8 -5.7% 1,151.5 1,079.0 72.7 6.7%
In Millions
28
|
|
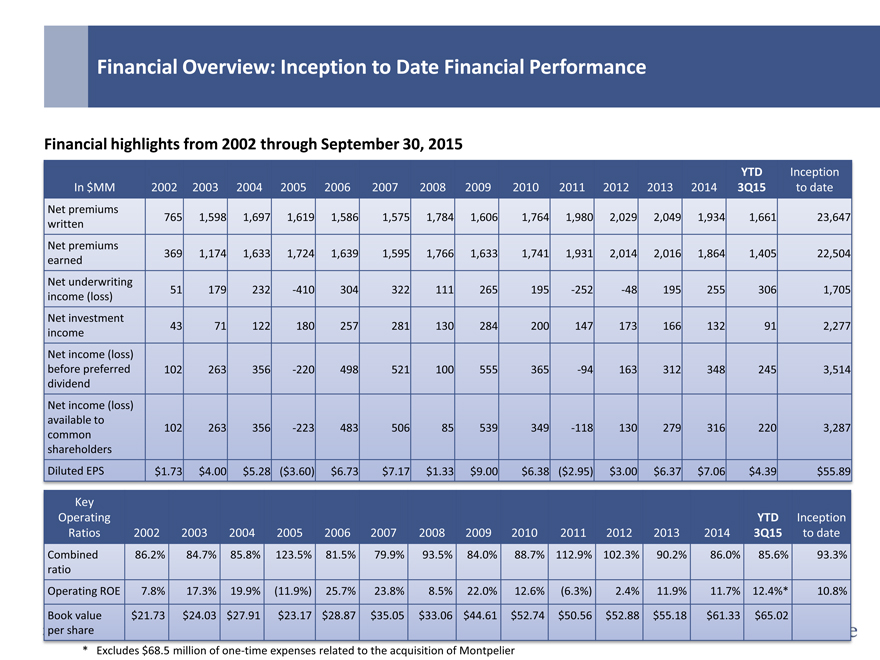
Financial Overview: Inception to Date Financial Performance
Financial highlights from 2002 through September 30, 2015
In $MM 2002 2003 2004 2005 2006 2007 2008 2009 2010 2011 2012 2013 2014 YTD 3Q15 Inception to date
Net premiums
written 765 1,598 1,697 1,619 1,586 1,575 1,784 1,606 1,764 1,980 2,029 2,049 1,934 1,661 23,647
Net premiums
earned 369 1,174 1,633 1,724 1,639 1,595 1,766 1,633 1,741 1,931 2,014 2,016 1,864 1,405 22,504
Net underwriting
income (loss) 51 179 232 -410 304 322 111 265 195 -252 -48 195 255 306 1,705
Net investment
income 43 71 122 180 257 281 130 284 200 147 173 166 132 91 2,277
Net income (loss)
before preferred 102 263 356 -220 498 521 100 555 365 -94 163 312 348 245 3,514
dividend
Net income (loss)
available to
common 102 263 356 -223 483 506 85 539 349 -118 130 279 316 220 3,287
shareholders
Diluted EPS $1.73 $4.00 $5.28($3.60) $6.73 $7.17 $1.33 $9.00 $6.38($2.95) $3.00 $6.37 $7.06 $4.39 $55.89
Key Operating Ratios 2002 2003 2004 2005 2006 2007 2008 2009 2010 2011 2012 2013 2014 YTD 3Q15 Inception to date
Combined 86.2% 84.7% 85.8% 123.5% 81.5% 79.9% 93.5% 84.0% 88.7% 112.9% 102.3% 90.2% 86.0% 85.6% 93.3%
ratio
Operating ROE 7.8% 17.3% 19.9%(11.9%) 25.7% 23.8% 8.5% 22.0% 12.6%(6.3%) 2.4% 11.9% 11.7% 12.4%* 10.8%
Book value $21.73 $24.03 $27.91 $23.17 $28.87 $35.05 $33.06 $44.61 $52.74 $50.56 $52.88 $55.18 $61.33 $65.02
per share
*Excludes $68.5 million of one-time expenses related to the acquisition of Montpelier
Serious News for Serious Traders! Try StreetInsider.com Premium Free!
You May Also Be Interested In
- Nationwide Insurance to Showcase How they are Driving Proactive Risk Management Using iLearningEngines’ Enterprise AI Platform at the 2024 Insurance Innovators Conference
- HMN FINANCIAL, INC. ANNOUNCES FIRST QUARTER RESULTS
- RAJANT’S REIOS IoT SOLUTIONS TRANSFORM ENERGY EFFICIENCY AND SAFETY
Create E-mail Alert Related Categories
SEC FilingsSign up for StreetInsider Free!
Receive full access to all new and archived articles, unlimited portfolio tracking, e-mail alerts, custom newswires and RSS feeds - and more!
