

Form 8-K DIME COMMUNITY BANCSHARE For: Nov 11
 Tweet
Tweet Share
ShareUNITED STATES
SECURITIES AND EXCHANGE COMMISSION
Washington, D.C. 20549
FORM 8-K
CURRENT REPORT
PURSUANT TO SECTION 13 OR 15(d) OF THE
SECURITIES EXCHANGE ACT OF 1934
Date of Report (Date of earliest event reported): November 11, 2015
DIME COMMUNITY BANCSHARES, INC.
(Exact name of registrant as specified in its charter)
|
Delaware
|
0-27782
|
11-3297463
|
||
|
(State or other jurisdiction of incorporation)
|
(Commission File Number)
|
(IRS Employer
Identification No.)
|
209 Havemeyer Street, Brooklyn, New York 11211
(Address of principal executive offices, including zip code)
Registrant's telephone number, including area code:(718) 782-6200
None
(Former name or former address, if changed since last report)
Check the appropriate box below if the Form 8-K filing is intended to simultaneously satisfy the filing obligation of the registrant under any of the following provisions:
| r |
Written communications pursuant to Rule 425 under the Securities Act (17 CFR 230.425)
|
| r |
Soliciting material pursuant to Rule 14a-12 under the Exchange Act (17 CFR 240.14d-2(b))
|
| r |
Pre-commencement communications pursuant to Rule 14d-2(b) under the Exchange Act (17 CFR 240.14d-2(b))
|
| r |
Pre-commencement communications pursuant to Rule 13e-4(c) under the Exchange Act (17 CFR 240.13e-4(c))
|
Item 7.01 Regulation FD Disclosure.
On November 11, 2015, management of Dime Community Bancshares, Inc. provided a financial presentation to investors. A copy of the presentation is attached as Exhibit 99.1.
Dime Community Bancshares, Inc. does not intend for this Item 7.01 or Exhibit 99.1 to be treated as "filed" for purposes of the Securities Exchange Act of 1934, as amended, or incorporated into its filings under the Securities Act of 1933, as amended.
Item 9.01.Financial Statements and Exhibits.
(d) Exhibits
Exhibit No.Description
| 99.1 |
Financial presentation made to investors on November 11, 2015.
|
SIGNATURES
Pursuant to the requirements of the Securities Exchange Act of 1934, the registrant has duly caused this report to be signed on its behalf by the undersigned hereunto duly authorized.
DIME COMMUNITY BANCSHARES, INC.
/s/ MICHAEL PUCELLA
By: ___________________________________________
Michael Pucella
Executive Vice President and Chief Accounting Officer (Principal Financial Officer)
Dated: November 12, 2015
EXHIBIT 99.1

INVESTOR PRESENTATIONNovember 2015 “Lending for the Way New Yorkers Live”
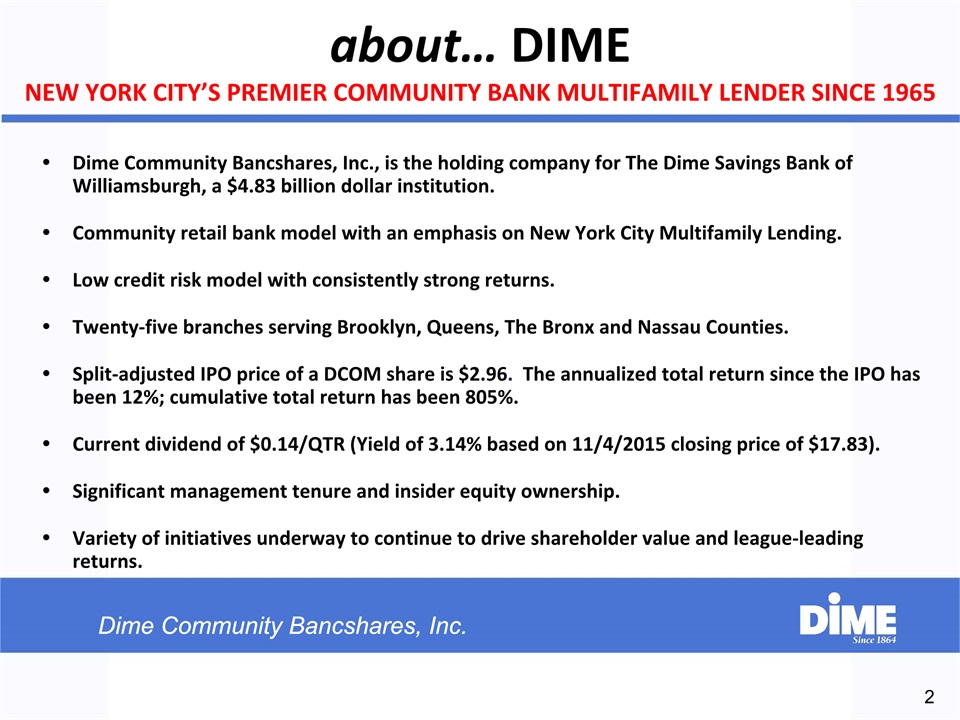
2 about… DIMENEW YORK CITY’S PREMIER COMMUNITY BANK MULTIFAMILY LENDER SINCE 1965 Dime Community Bancshares, Inc., is the holding company for The Dime Savings Bank of Williamsburgh, a $4.83 billion dollar institution.Community retail bank model with an emphasis on New York City Multifamily Lending.Low credit risk model with consistently strong returns.Twenty-five branches serving Brooklyn, Queens, The Bronx and Nassau Counties.Split-adjusted IPO price of a DCOM share is $2.96. The annualized total return since the IPO has been 12%; cumulative total return has been 805%.Current dividend of $0.14/QTR (Yield of 3.14% based on 11/4/2015 closing price of $17.83).Significant management tenure and insider equity ownership.Variety of initiatives underway to continue to drive shareholder value and league-leading returns.

Branch Network 3 25 Branches in New York City metropolitan area. Average branch size = $121.2 million as of September 30, 2015 (1) Data as of September 30, 2015 Source: FDIC(2) As of September 30, 2015 County 2015 Market Share Rank (1) Number of Dime Branches (2) Deposits in Market ($mm) Total Market Share (%) Brooklyn 11 10 $ 1,215 2.77% Queens 13 7 845 1.64% Nassau 14 7 902 1.25% Bronx 18 1 68 0.62%

Key Officers & Directors 4 * Amounts per page 4 of the Company’s proxy statement dated April 13, 2015. Name Title Tenure Inside Ownership* EXECUTIVE OFFICERS and DIRECTORS: Vincent F. Palagiano Chairman & CEO 45 years 2.9% (966,592 shares) Michael P. Devine (retiring Dec. 31st) Vice Chairman & President 44 years 1.8% (595,978 shares) Kenneth J. Mahon (President effective Jan 1 2016) Senior Executive Vice President & COO 35 years 1.1% (368,202 shares) Total Directors and Executive Officers Ownership 14.0% (4,901,720 shares) OTHER OPERATING OFFICERS: Daniel Harris Chief Lending Officer 7 years with 30 years prior bank experience Timothy King Chief Risk Officer 32 years Terence Mitchell Chief Retail Officer 4 years with 30 years prior bank experience Michael Pucella Chief Accounting Officer 34 years Timothy Lenhoff Chief Technology Officer Recent hire. 30 years IT industry experience Robert Volino Chief Investment Officer 16 years
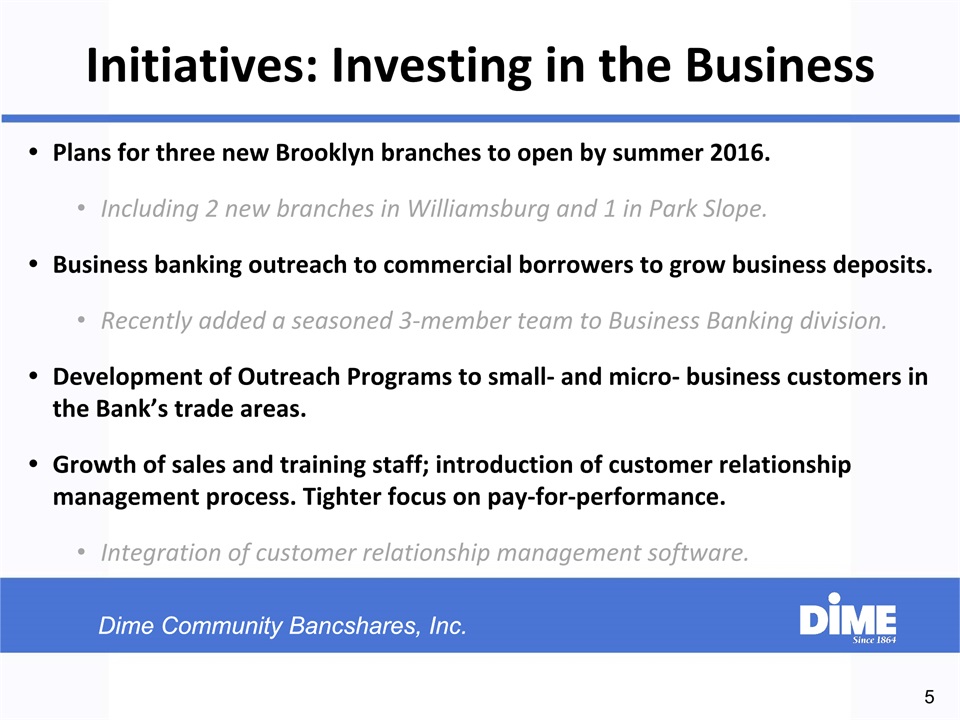
Initiatives: Investing in the Business 5 Plans for three new Brooklyn branches to open by summer 2016.Including 2 new branches in Williamsburg and 1 in Park Slope.Business banking outreach to commercial borrowers to grow business deposits.Recently added a seasoned 3-member team to Business Banking division.Development of Outreach Programs to small- and micro- business customers in the Bank’s trade areas.Growth of sales and training staff; introduction of customer relationship management process. Tighter focus on pay-for-performance.Integration of customer relationship management software.

Initiatives: Investing in the Business 6 Investments in technology and staffing; major focus on e-banking, internet and cybersecurity.Mobile banking for consumers and small business.Development of the internet banking channel to grow deposits more efficiently and rapidly than brick-and-mortar.Cost-cutting initiatives to pay for new project implementations.Internal restructuring to create a leaner, more customer-responsive operations department.Monetization of owned real estate in Williamsburg, Brooklyn, creates significant book value and free capital.
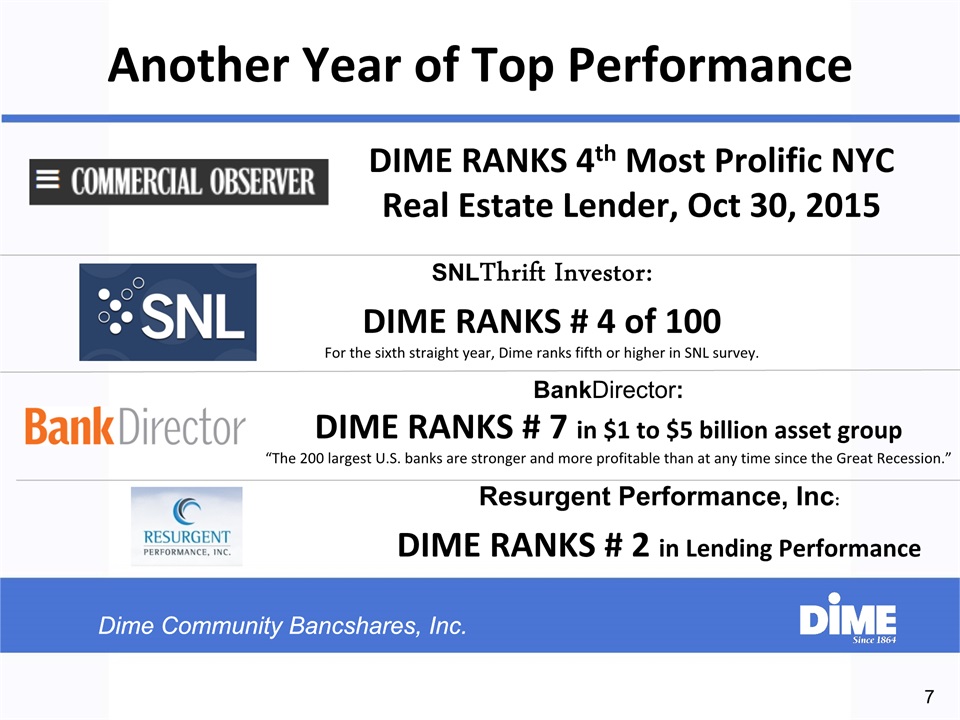
7 Another Year of Top Performance BankDirector: DIME RANKS # 7 in $1 to $5 billion asset group“The 200 largest U.S. banks are stronger and more profitable than at any time since the Great Recession.” SNLThrift Investor:DIME RANKS # 4 of 100For the sixth straight year, Dime ranks fifth or higher in SNL survey. Resurgent Performance, Inc:DIME RANKS # 2 in Lending Performance DIME RANKS 4th Most Prolific NYC Real Estate Lender, Oct 30, 2015

Focus on GrowthStrong Multifamily ExpertiseLow Cost OperatorShareholder ValueRisk Management 8 Investor Highlights

9 Tangible Common Equity / Tangible Assets (%) Grow assets 15% on average over the next 3 years (goal of 12% growth for 2015)Decrease the loan to deposit ratioRemain focused on NYC commercial real estate lendingMaintain tangible common equity sufficient to support growthRaise additional capital from monetization of Williamsburg real estateIncrease lower cost commercial and business deposits. 3 to 5 Year Goals DIME 3 to 5 Year GoalsFocus on Asset Growth Total Risk Weighted Capital Ratio (%)
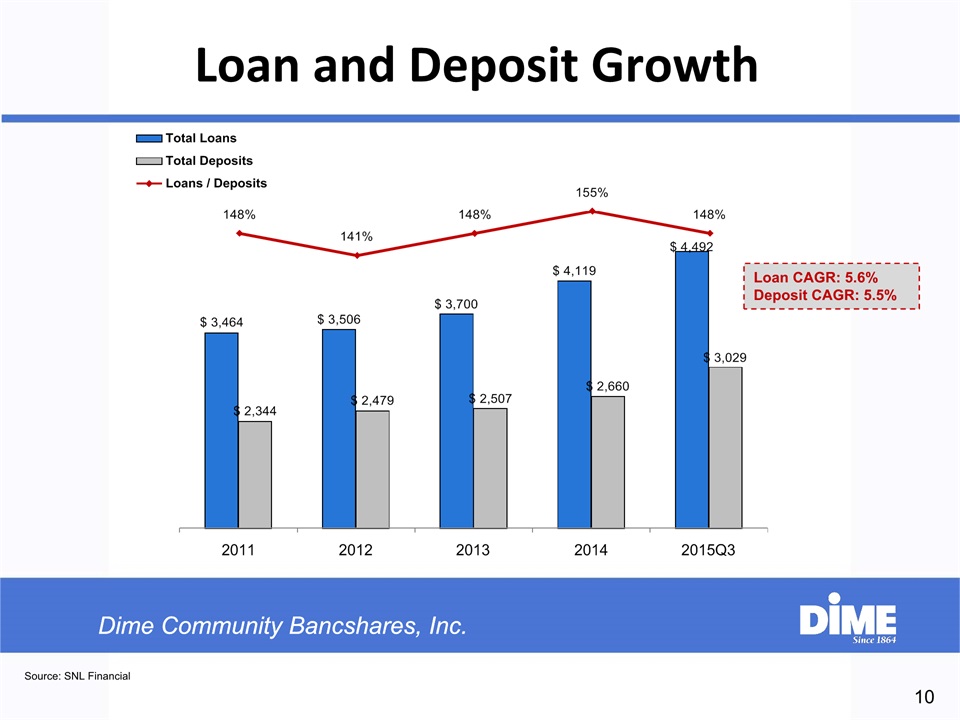
10 Source: SNL Financial Loan CAGR: 5.6%Deposit CAGR: 5.5% Loan and Deposit Growth

11 Category (000's) Sep-14 Avg. Cost Sep-15 Avg. Cost % Growth CRE Deposits $ 114,911 0.10% $ 179,631 0.13% 56% Business Deposits 81,512 0.13% 91,670 0.12% 12% Branch Consumer Deposits 2,426,190 0.80% 2,758,195 0.85% 14% TOTAL 2,622,613 0.75% 3,029,497 0.85% 16% Deposit Growth InitiativesIncrease Percentage of Commercial and Small Business Deposits 2015 - 2017 Deposit Change from 2014 - 2015

Focus on GrowthStrong Multifamily ExpertiseLow Cost OperatorShareholder ValueRisk Management 12 Investor Highlights

New York City Housing Stock* 13 Source: 2014 New York City Housing and Vacancy Survey and census data. * Total housing stock equals 3,124,138 units. As shown in the adjacent chart, New York City is a city of apartment dwellers. Only 18% of the City’s housing stock is classified 1 – 4 family.Dime has historically been one of the primary lenders in the small (10 – 75 unit, rent-regulated) apartment house market in New York City, which is summed up in our mission statement: Lending for the Way New Yorkers Live.

14 Certain statements contained in this quarterly report on Form 10-Q that are not statements of historical fact constitute forward-looking statements within the meaning of the Private Securities Litigation Reform Act of 1995 (the “Act”), notwithstanding that such statements are not specifically identified as such. In addition, certain statements may be contained in future filings with the U.S. Securities and Exchange Commission ("SEC"), in press releases, and in oral and written statements made by management or with their approval that are not statements of historical fact and constitute forward-looking statements within the meaning of the Act. Examples of forward-looking statements include, but are not limited to: (i) projections of revenues, expenses, income or loss, earnings or loss per share, the payment or nonpayment of dividends, capital structure and other financial items; (ii) statements of plans, objectives and expectations of Dime Community Bancshares, Inc. and its subsidiaries (the "Company") or those of its management or board of directors, including those relating to products or services; (iii) statements of future economic performance; and (iv) statements of assumptions underlying such statements. Forward-looking statements include information concerning possible or assumed future results of operations and statements preceded by, followed by or that include the words “believes,” “expects,” “feels,” “anticipates,” “intends,” “plans,” “estimates,” “predicts,” “projects,” “potential,” “outlook,” “could,” “will,” “may” or similar expressions. Forward-looking statements are not guarantees of future performance and are subject to risks, uncertainties and assumptions. Actual results may differ materially from those expressed in or implied by these forward-looking statements. Factors that could cause actual results to differ from these forward-looking statements include, but are not limited to, the following, as well as those discussed elsewhere in this report and the documents incorporated by reference herein: Undue reliance should not be placed on any forward-looking statements. Forward-looking statements speak only as of the date they are made, and the Company undertakes no obligation to update them in light of new information or future events except to the extent required by Federal securities laws. Real Estate Loan Portfolio Portfolio Risk Segmentation $ Amount (In Thousands) % of Portfolio Current LTV Loans Underlying Coops $ 226,463 5.0% 18% 1-4 Family and Small Mixed Use 69,618 1.6% 48% 100% Multifamily 2,057,105 45.8% 56% Multifamily w/ commercial 1,283,805 28.6% 55% Commercial w/ residential 380,422 8.5% 50% Pure Commercial 473,211 10.5% 52% The perceived risk profile of the loan portfolio by major segment, from "least" to "highest" risk. * As of September 30, 2015. Excludes allowance for loan losses. Dime’s real estate loan collateral: Approximately 2/3rds of residential units are rent regulated.
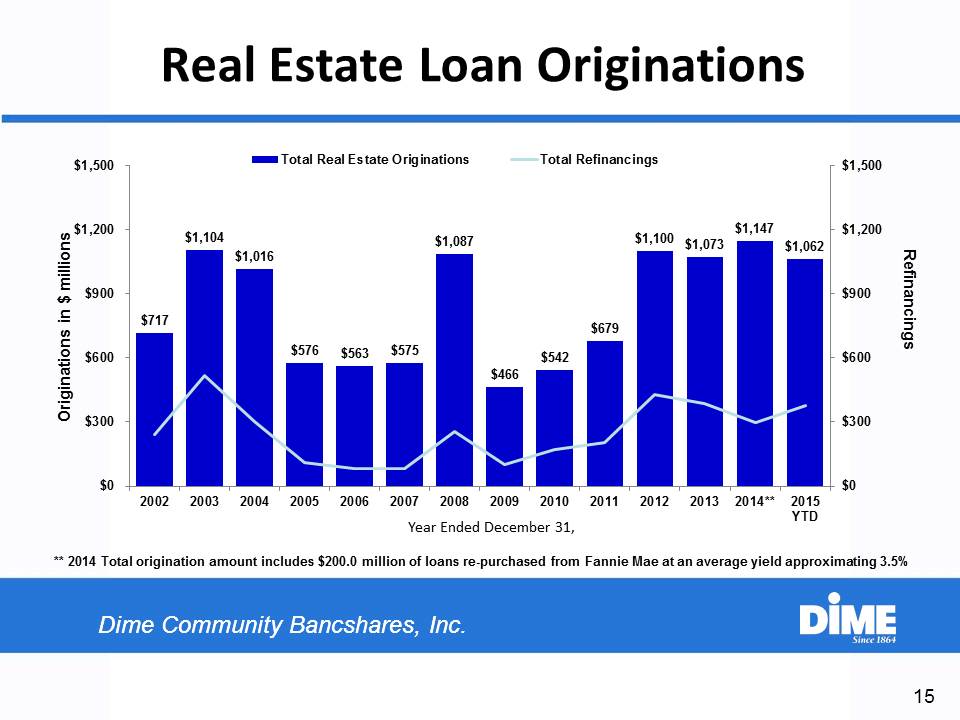
Real Estate Loan Originations 15 Originations in $ millions Year Ended December 31, ** 2014 Total origination amount includes $200.0 million of loans re-purchased from Fannie Mae at an average yield approximating 3.5% Refinancings

Focus on GrowthStrong Multifamily ExpertiseLow Cost OperatorShareholder ValueRisk Management 16 Investor Highlights
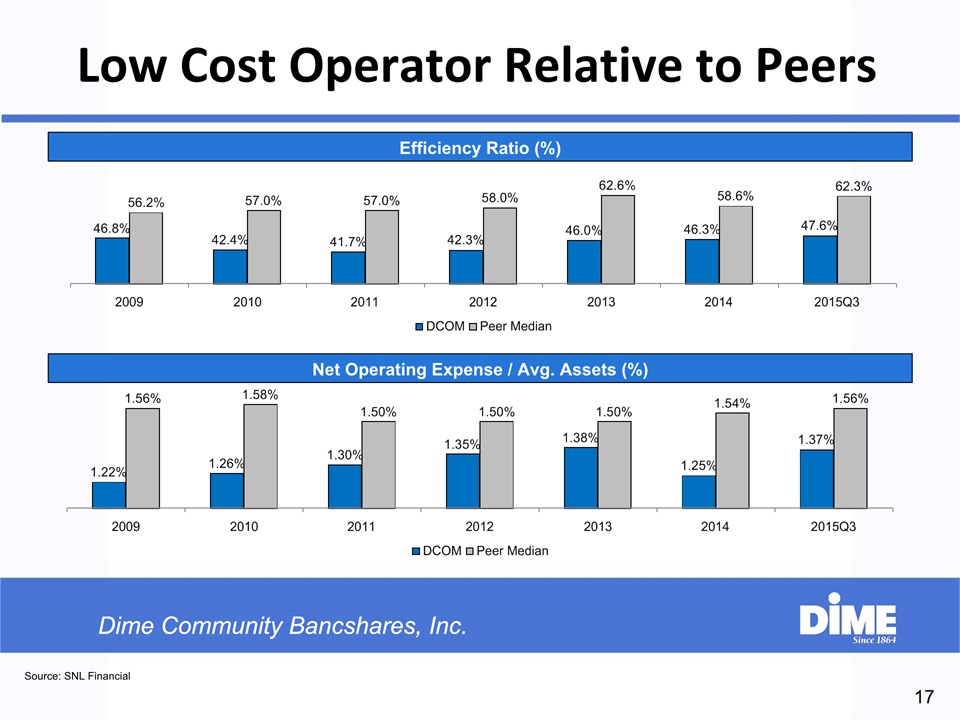
17 Source: SNL Financial Efficiency Ratio (%) Net Operating Expense / Avg. Assets (%) Low Cost Operator Relative to Peers

Focus on GrowthStrong Multifamily ExpertiseLow Cost OperatorShareholder ValueRisk Management 18 Investor Highlights

19 CAGR: 8.4% Creating Shareholder Value

DCOM – Ten Year Price Performance 20 Source: SNL Financial; Data as of 11/3/2015

Focus on GrowthStrong Multifamily ExpertiseLow Cost OperatorShareholder ValueRisk Management 21 Investor Highlights

22 Risk Management In 2008, Dime created the position of CHIEF RISK OFFICER, encompassing the fields of : Enterprise Risk, Credit Administration, Compliance, Audit, and Cybersecurity Risk.Credit: Concentration in low-risk NYC multifamily market.Interest Rate: Nature of loans is short-term (5- and 7-year).Liquidity: Stable sources of available liquidity.

23 Credit Risk Management Dime has a long, successful history of managing its highly concentrated “CRE” portfolio, mainly because multifamily loans are residential housing loans.Dime has historically been one of the leading lenders in the small (10 – 75 unit) rent-regulated multifamily housing market in New York City.NYC rent regulations provide a level of stability in the marketplace, especially to conservative lenders such as Dime (with loans reliant almost solely upon occupancy for debt service).From 2009 to the most recent quarter-end, the average debt service ratio on newly originated “commercial real estate ” loans was 2.19x, and the average loan-to-value ratio was 54%.Dime’s “Texas ratio” (a popular measure of a bank’s ability to absorb credit losses) was 1.2% as of the most recent quarter-end, one of the lowest nationally.

Credit Metrics since the onset of the financial crisis 24 Undue reliance should not be placed on any forward-looking statements. Forward-looking statements speak only as of the date they are made, and the Company undertakes no obligation to update them in light of new information or future events except to the extent required by Federal securities laws. 2009 2010 2011 2012 2013 2014 2015 (1) ($ in thousands) Total Loans $3,391,658 $3,468,479 $3,458,416 $3,506,368 $3,699,519 $4,119,240 $4,492,092 Non-Performing Loans $11,294 $20,168 $28,973 $8,888 $12,549 $6,198 $1,590 NPLs to Total Loans 0.33% 0.58% 0.84% 0.25% 0.34% 0.15% 0.04% Net Charge Offs (Recoveries) $8,993 $13,821 $5,925 $3,707 $766 $(212) $10 NCOs to Total Loans 0.27% 0.40% 0.17% 0.11% 0.02% -0.01% 0.00% Allowance as a % of Loans 0.53% 0.54% 0.58% 0.59% 0.54% 0.45% 0.42% "Texas" ratio (2) end of period end 4.0% 8.4% 8.9% 2.6% 3.7% 2.5% 1.2% (1) At September 30, 2015 or for the period then ended.(2) "Texas" ratio = sum of non-performing assets + accruing loans past due 90 days or more as a % of Tangible Capital + ALLL.

Credit Metrics vs Peer Group 25 Undue reliance should not be placed on any forward-looking statements. Forward-looking statements speak only as of the date they are made, and the Company undertakes no obligation to update them in light of new information or future events except to the extent required by Federal securities laws. For purposes of this chart, Dime Community Bancshares, Inc.'s peer group consists of the following: Astoria Financial Corporation (AF), Flushing Savings Bank (FFIC),Investors Bank (ISBC), Kearny Federal Savings Bank (KRNY), OceanFirst Bank (OCFC), Oritani Bank (ORIT), Signature Bank (SBNY), Sterling National Bank (STL), Sun National Bank (SNBC), The Provident Bank (PFS), TrustCo Bank (TRST), Valley National Bank (VLY). (% of Average Total Loans) Dime’s conservative underwriting has resulted in consistent out-performance of its peers in credit loss experience.

26 Certain statements contained in this quarterly report on Form 10-Q that are not statements of historical fact constitute forward-looking statements within the meaning of the Private Securities Litigation Reform Act of 1995 (the “Act”), notwithstanding that such statements are not specifically identified as such. In addition, certain statements may be contained in future filings with the U.S. Securities and Exchange Commission ("SEC"), in press releases, and in oral and written statements made by management or with their approval that are not statements of historical fact and constitute forward-looking statements within the meaning of the Act. Examples of forward-looking statements include, but are not limited to: (i) projections of revenues, expenses, income or loss, earnings or loss per share, the payment or nonpayment of dividends, capital structure and other financial items; (ii) statements of plans, objectives and expectations of Dime Community Bancshares, Inc. and its subsidiaries (the "Company") or those of its management or board of directors, including those relating to products or services; (iii) statements of future economic performance; and (iv) statements of assumptions underlying such statements. Forward-looking statements include information concerning possible or assumed future results of operations and statements preceded by, followed by or that include the words “believes,” “expects,” “feels,” “anticipates,” “intends,” “plans,” “estimates,” “predicts,” “projects,” “potential,” “outlook,” “could,” “will,” “may” or similar expressions. Forward-looking statements are not guarantees of future performance and are subject to risks, uncertainties and assumptions. Actual results may differ materially from those expressed in or implied by these forward-looking statements. Factors that could cause actual results to differ from these forward-looking statements include, but are not limited to, the following, as well as those discussed elsewhere in this report and the documents incorporated by reference herein: Undue reliance should not be placed on any forward-looking statements. Forward-looking statements speak only as of the date they are made, and the Company undertakes no obligation to update them in light of new information or future events except to the extent required by Federal securities laws. Interest Rate Risk Management 13.5% CAGR in non-interest bearing deposits from 2011 through 2015.Non-interest bearing accounts to provide significant protection from rising interest rates.5.5% CAGR in deposits (as discussed previously), and greater emphasis upon deposit growth in 3 to 5 year business plan.Emphasis on deposits for shorter-term funding should permit more longer-term borrowing activity for interest rate risk management. CAGR: 13.5%

27 Certain statements contained in this quarterly report on Form 10-Q that are not statements of historical fact constitute forward-looking statements within the meaning of the Private Securities Litigation Reform Act of 1995 (the “Act”), notwithstanding that such statements are not specifically identified as such. In addition, certain statements may be contained in future filings with the U.S. Securities and Exchange Commission ("SEC"), in press releases, and in oral and written statements made by management or with their approval that are not statements of historical fact and constitute forward-looking statements within the meaning of the Act. Examples of forward-looking statements include, but are not limited to: (i) projections of revenues, expenses, income or loss, earnings or loss per share, the payment or nonpayment of dividends, capital structure and other financial items; (ii) statements of plans, objectives and expectations of Dime Community Bancshares, Inc. and its subsidiaries (the "Company") or those of its management or board of directors, including those relating to products or services; (iii) statements of future economic performance; and (iv) statements of assumptions underlying such statements. Forward-looking statements include information concerning possible or assumed future results of operations and statements preceded by, followed by or that include the words “believes,” “expects,” “feels,” “anticipates,” “intends,” “plans,” “estimates,” “predicts,” “projects,” “potential,” “outlook,” “could,” “will,” “may” or similar expressions. Forward-looking statements are not guarantees of future performance and are subject to risks, uncertainties and assumptions. Actual results may differ materially from those expressed in or implied by these forward-looking statements. Factors that could cause actual results to differ from these forward-looking statements include, but are not limited to, the following, as well as those discussed elsewhere in this report and the documents incorporated by reference herein: $467.6 million of CD’s with maturities beyond 2016 Maturity in Year Ending Dec. 31st * As of September 30, 2015. Dollars in thousands. Excludes trust preferred corporate debt. Interest Rate Risk Management $515.7 million of borrowings with maturities beyond 2016 $ in Thousands
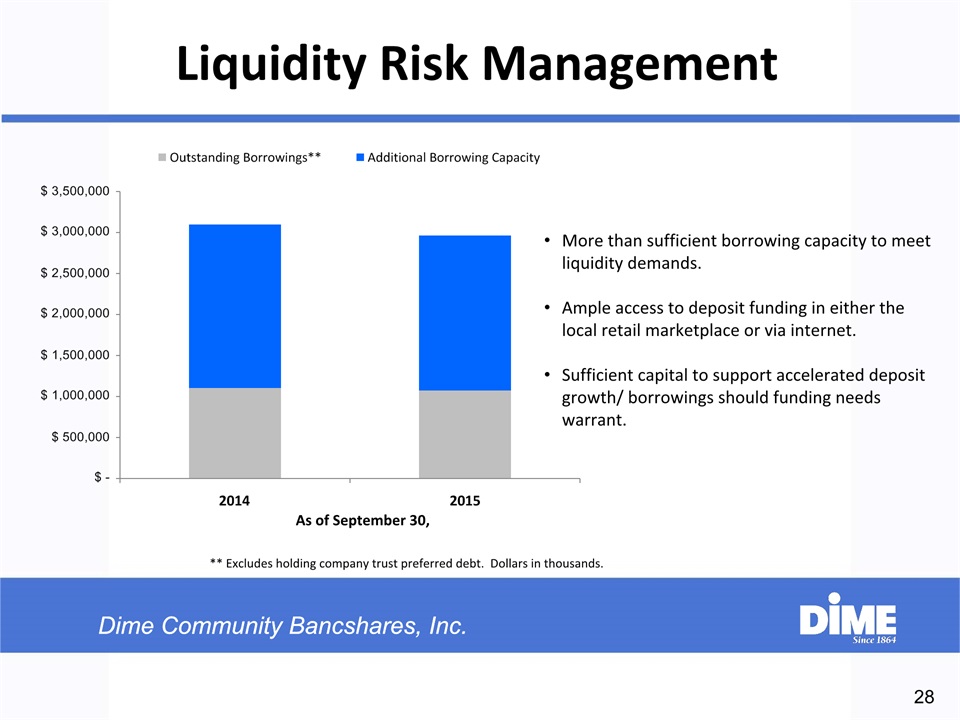
28 Certain statements contained in this quarterly report on Form 10-Q that are not statements of historical fact constitute forward-looking statements within the meaning of the Private Securities Litigation Reform Act of 1995 (the “Act”), notwithstanding that such statements are not specifically identified as such. In addition, certain statements may be contained in future filings with the U.S. Securities and Exchange Commission ("SEC"), in press releases, and in oral and written statements made by management or with their approval that are not statements of historical fact and constitute forward-looking statements within the meaning of the Act. Examples of forward-looking statements include, but are not limited to: (i) projections of revenues, expenses, income or loss, earnings or loss per share, the payment or nonpayment of dividends, capital structure and other financial items; (ii) statements of plans, objectives and expectations of Dime Community Bancshares, Inc. and its subsidiaries (the "Company") or those of its management or board of directors, including those relating to products or services; (iii) statements of future economic performance; and (iv) statements of assumptions underlying such statements. Forward-looking statements include information concerning possible or assumed future results of operations and statements preceded by, followed by or that include the words “believes,” “expects,” “feels,” “anticipates,” “intends,” “plans,” “estimates,” “predicts,” “projects,” “potential,” “outlook,” “could,” “will,” “may” or similar expressions. Forward-looking statements are not guarantees of future performance and are subject to risks, uncertainties and assumptions. Actual results may differ materially from those expressed in or implied by these forward-looking statements. Factors that could cause actual results to differ from these forward-looking statements include, but are not limited to, the following, as well as those discussed elsewhere in this report and the documents incorporated by reference herein: Liquidity Risk Management ** Excludes holding company trust preferred debt. Dollars in thousands. As of September 30, More than sufficient borrowing capacity to meet liquidity demands.Ample access to deposit funding in either the local retail marketplace or via internet.Sufficient capital to support accelerated deposit growth/ borrowings should funding needs warrant.
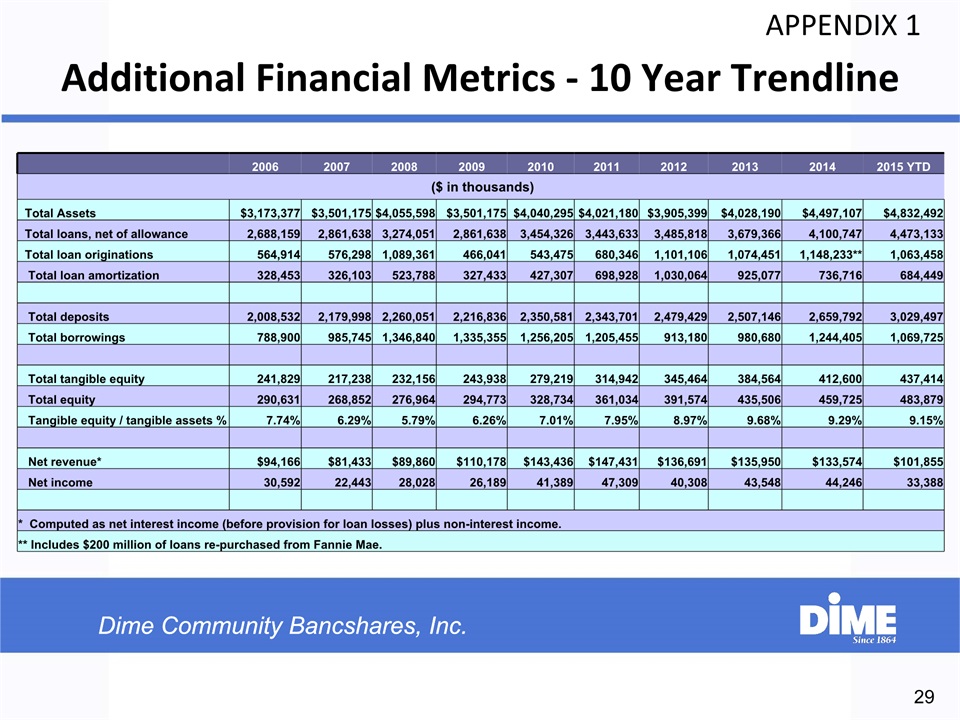
29 APPENDIX 1 Additional Financial Metrics - 10 Year Trendline 2006 2007 2008 2009 2010 2011 2012 2013 2014 2015 YTD ($ in thousands) Total Assets $3,173,377 $3,501,175 $4,055,598 $3,501,175 $4,040,295 $4,021,180 $3,905,399 $4,028,190 $4,497,107 $4,832,492 Total loans, net of allowance 2,688,159 2,861,638 3,274,051 2,861,638 3,454,326 3,443,633 3,485,818 3,679,366 4,100,747 4,473,133 Total loan originations 564,914 576,298 1,089,361 466,041 543,475 680,346 1,101,106 1,074,451 1,148,233** 1,063,458 Total loan amortization 328,453 326,103 523,788 327,433 427,307 698,928 1,030,064 925,077 736,716 684,449 Total deposits 2,008,532 2,179,998 2,260,051 2,216,836 2,350,581 2,343,701 2,479,429 2,507,146 2,659,792 3,029,497 Total borrowings 788,900 985,745 1,346,840 1,335,355 1,256,205 1,205,455 913,180 980,680 1,244,405 1,069,725 Total tangible equity 241,829 217,238 232,156 243,938 279,219 314,942 345,464 384,564 412,600 437,414 Total equity 290,631 268,852 276,964 294,773 328,734 361,034 391,574 435,506 459,725 483,879 Tangible equity / tangible assets % 7.74% 6.29% 5.79% 6.26% 7.01% 7.95% 8.97% 9.68% 9.29% 9.15% Net revenue* $94,166 $81,433 $89,860 $110,178 $143,436 $147,431 $136,691 $135,950 $133,574 $101,855 Net income 30,592 22,443 28,028 26,189 41,389 47,309 40,308 43,548 44,246 33,388 * Computed as net interest income (before provision for loan losses) plus non-interest income. ** Includes $200 million of loans re-purchased from Fannie Mae.
Serious News for Serious Traders! Try StreetInsider.com Premium Free!
You May Also Be Interested In
- Dime Community Bancshares (DCOM) Tops Q1 EPS by 1c
- Media Advisory: Day of Mourning 2024 - CLC Executive Vice-President Siobhán Vipond to attend Ottawa-area events
- BOK Financial Corporation Reports Quarterly Earnings of $84 million, or $1.29 Per Share, in the First Quarter
Create E-mail Alert Related Categories
SEC FilingsSign up for StreetInsider Free!
Receive full access to all new and archived articles, unlimited portfolio tracking, e-mail alerts, custom newswires and RSS feeds - and more!
