Form 8-K CapStar Financial Holdin For: Oct 27
UNITED STATES
SECURITIES AND EXCHANGE COMMISSION
WASHINGTON, D.C. 20549
______________________________
FORM 8-K
CURRENT REPORT PURSUANT TO
SECTION 13 OR 15(d) OF THE
SECURITIES EXCHANGE ACT OF 1934
Date of Report (Date of earliest event reported): October 27, 2016
______________________________
CAPSTAR FINANCIAL HOLDINGS, INC.
(Exact name of registrant as specified in its charter)
|
Tennessee |
|
001-37886 |
|
81-1527911 |
|
(State or other jurisdiction of incorporation) |
|
(Commission File Number) |
|
(IRS Employer Identification No.)
|
|
|
201 4th Avenue North, Suite 950 Nashville, Tennessee |
|
37219 |
|
|
|
(Address of principal executive offices) |
|
(Zip Code) |
|
Registrant’s telephone number, including area code (615) 732-6400
Check the appropriate box below if the Form 8-K filing is intended to simultaneously satisfy the filing obligation of the registrant under any of the following provisions (see General Instruction A.2. below):
[ ] Written communications pursuant to Rule 425 under the Securities Act (17 CFR 230.425)
[ ] Soliciting material pursuant to Rule 14a-12 under the Exchange Act (17 CFR 240.14a-12)
[ ] Pre-commencement communications pursuant to Rule 14d-2(b) under the Exchange Act (17 CFR 240.14d-2(b))
[ ] Pre-commencement communications pursuant to Rule 13e-4(c) under the Exchange Act (17 CFR 240.13e-4(c))
Section 2 – Financial Information
Item 2.02. Results of Operations and Financial Condition.
On October 27, 2016, CapStar Financial Holdings, Inc. (the “Company”) issued an earnings release announcing its financial results for the third quarter ended September 30, 2016. A copy of the earnings release is furnished as Exhibit 99.1 to this Current Report on Form 8-K (this “Report”) and is incorporated herein by reference in its entirety.
Section 7 – Regulation FD
Item 7.01. Regulation FD Disclosure.
The Company will conduct a conference call at 9:00 a.m. (Central Time) on October 28, 2016 to discuss its financial results for the third quarter ended September 30, 2016. A copy of the presentation to be used for the conference call is furnished as Exhibit 99.2 to this Report and is incorporated herein by reference in its entirety.
Section 9 – Financial Statements and Exhibits
Item 9.01. Financial Statements and Exhibits.
|
|
(d) |
Exhibits. |
2
SIGNATURES
Pursuant to the requirements of the Securities Exchange Act of 1934, the registrant has duly caused this report to be signed on its behalf by the undersigned hereunto duly authorized.
|
CAPSTAR FINANCIAL HOLDINGS, INC. |
|
|
|
|
|
By: |
/s/ Robert B. Anderson |
|
|
Robert B. Anderson |
|
|
Chief Financial Officer and Chief Administrative Officer |
Date: October 27, 2016
3
|
Exhibit Number |
|
Description |
|
|
|
|
|
99.1 |
|
Earnings release issued on October 27, 2016 by CapStar Financial Holdings, Inc. |
|
99.2 |
|
Presentation for conference call to be conducted by CapStar Financial Holdings, Inc. on October 28, 2016 |
Exhibit 99.1
EARNINGS RELEASE
CONTACT
Rob Anderson
Chief Financial Officer and Chief Administrative Officer
(615) 732-6470

CAPSTAR FINANCIAL HOLDINGS, INC. ANNOUNCES THIRD QUARTER 2016 RESULTS
NASHVILLE, Tenn., October 27, 2016 /PRNewswire/ -- CapStar Financial Holdings, Inc. (“CapStar”) (NASDAQ: CSTR) reported net income of $2.1 million, or $0.20 per diluted common share for the three months ended September 30, 2016, compared to $2.0 million, or $0.20 per diluted common share, for the three months ended September 30, 2015. For the nine months ended September 30, 2016, CapStar reported net income of $6.2 million, or $0.58 per diluted common share, compared to $5.5 million, or $0.53 per diluted common share, for the nine months ended September 30, 2015.
“Our emphasis has always been on the principles of sound, profitable growth, which is evident in CapStar’s results this quarter,” said Claire Tucker president and chief executive officer of CapStar Financial Holdings, Inc. “With the completion of our initial public offering on September 27, 2016 and the injection of new capital, we will continue to emphasize the importance of these principles in order to realize our future growth objectives and enhance long-term shareholder value.”
Soundness
|
|
• |
The allowance for loan and lease losses represented 1.25% of total loans at September 30, 2016 compared to 1.24% at September 30, 2015. |
|
|
• |
Non-performing assets as a percent of gross loans and other real estate owned was 0.45% at September 30, 2016 compared to 0.42% at September 30, 2015. |
|
|
• |
Net charge-offs (quarters annualized) totaled 0.25% for the three months ended September 30, 2016, compared to -0.10% for the same period in 2015. |
|
|
• |
The total risk based capital ratio increased to 12.45% at September 30, 2016, compared to 11.43% at September 30, 2015. |
“While the third quarter is typically one of our strongest performances of the year due to the seasonality in our mortgage business, we are pleased with the core earnings of the company,” said Rob Anderson, chief financial officer and chief administrative officer.
Profitability
|
|
• |
Return on average assets for the three months ended September 30, 2016 was 0.65% compared to 0.71% for the same period in 2015. |
|
|
• |
Return on average equity for the three months ended September 30, 2016 was 7.15% compared to 7.50% for the same period in 2015. |
|
|
• |
The net interest margin (“NIM”) for the three months ended September 30, 2016 was 3.23% compared to 3.45% for the same period in 2015. Additionally, the NIM was up 14 basis points over the linked quarter. |
|
|
• |
The efficiency ratio for the three months ended September 30, 2016 was 64.0% compared to 71.4% for the same period in 2015. |
Growth
|
|
• |
Average gross loans and leases (including loans held for sale) increased 27%, to $982 million at September 30, 2016 compared to $774 million at September 30, 2015. |
|
|
• |
Average total deposits increased 17%, to $1.1 billion at September 30, 2016 compared to $971 million at September 30, 2015. |
|
|
• |
Non-interest bearing and NOW deposits increased 53%, to $491 million at September 30, 2016 compared to $321 million at September 30, 2015. |
|
|
• |
Originations of mortgage loans held for sale increased 51%, to $156 million at September 30, 2016 compared to $103 million at September 30, 2015. |
Conference Call and Webcast Information
CapStar will host a conference call and webcast at 9:00 a.m. Central Time on Friday, October 28, 2016. During the call, management will review the third quarter results and operational highlights. Interested parties may listen to the call by dialing (844) 412-1102. The conference ID number is 96905694. A simultaneous webcast may be accessed on CapStar’s website at www.capstarbank.com. An archived version of the webcast will be available in the same location shortly after the live call has ended.
About CapStar Financial Holdings, Inc.
CapStar Financial Holdings, Inc. is a bank holding company headquartered in Nashville, Tennessee, and operates primarily through its wholly owned subsidiary, CapStar Bank, a Tennessee-chartered state bank. CapStar Bank is a commercial bank that seeks to establish and maintain comprehensive relationships with its clients by delivering customized and creative banking solutions and superior client service. As of September 30, 2016, on a consolidated basis, CapStar had total assets of $1.3 billion, net loans of $912.5 million, total deposits of $1.1 billion, and shareholders’ equity of $138.0 million. Visit www.capstarbank.com for more information.
Forward-Looking Statements
Certain statements in this earnings release are forward-looking statements that reflect CapStar’s current views with respect to, among other things, future events and CapStar’s financial performance. These statements are often, but not always, made through the use of words or phrases such as “may,” “should,” “could,” “predict,” “potential,” “believe,” “will likely result,” “expect,” “continue,” “will,” “anticipate,” “seek,” “estimate,” “intend,” “plan,” “project,” “projection,” “forecast,” “goal,” “target,” “would,” and “outlook,” or the negative version of those words or other comparable words of a future or forward-looking nature. These forward-looking statements are not historical facts, and are based on current expectations, estimates and projections about CapStar’s industry, management’s beliefs and certain assumptions made by management, many of which, by their nature, are inherently uncertain and beyond CapStar’s control. The inclusion of these forward-looking statements should not be regarded as a representation by CapStar or any other person that such expectations, estimates and projections will be achieved. Accordingly, CapStar cautions you that any such forward-looking statements are not guarantees of future performance and are subject to risks, assumptions and uncertainties that are difficult to predict. Although CapStar believes that the expectations reflected in these forward-looking statements are reasonable as of the date made, actual results may prove to be materially different from the results expressed or implied by the forward-
looking statements. There are or will be important factors that could cause CapStar’s actual results to differ materially from those indicated in these forward-looking statements, including, but are not limited to, the risk factors previously disclosed in the “Risk Factors” section included in our prospectus filed with the SEC on September 23, 2016 pursuant to Rule 424(b)(4) under the Securities Act. If one or more events related to these or other risks or uncertainties materialize, or if CapStar’s underlying assumptions prove to be incorrect, actual results may differ materially from our forward-looking statements. Accordingly, you should not place undue reliance on any such forward-looking statements. Any forward-looking statement speaks only as of the date of this earnings release, and CapStar does not undertake any obligation to publicly update or review any forward-looking statement, whether as a result of new information, future developments or otherwise, except as required by law. New risks and uncertainties may emerge from time to time, and it is not possible for CapStar to predict their occurrence or how they will affect CapStar.
CAPSTAR FINANCIAL HOLDINGS, INC. AND SUBSIDIARY
Consolidated Statements of Income (unaudited)
Third Quarter 2016 Earnings Release
|
|
|
Three Months Ended |
|
|
Nine Months Ended |
|
||||||||||
|
|
|
September 30, |
|
|
September 30, |
|
||||||||||
|
|
|
2016 |
|
|
2015 |
|
|
2016 |
|
|
2015 |
|
||||
|
Interest income: |
|
|
|
|
|
|
|
|
|
|
|
|
|
|
|
|
|
Loans, including fees |
|
$ |
10,658,758 |
|
|
$ |
9,428,826 |
|
|
$ |
29,531,404 |
|
|
$ |
25,834,421 |
|
|
Securities: |
|
|
|
|
|
|
|
|
|
|
|
|
|
|
|
|
|
Taxable |
|
|
787,076 |
|
|
|
993,485 |
|
|
|
2,596,059 |
|
|
|
3,277,535 |
|
|
Tax-exempt |
|
|
291,110 |
|
|
|
277,365 |
|
|
|
841,264 |
|
|
|
802,029 |
|
|
Federal funds sold |
|
|
3,597 |
|
|
|
3,089 |
|
|
|
12,107 |
|
|
|
13,138 |
|
|
Restricted equity securities |
|
|
70,609 |
|
|
|
67,528 |
|
|
|
209,654 |
|
|
|
200,174 |
|
|
Interest-bearing deposits in financial institutions |
|
|
63,455 |
|
|
|
32,354 |
|
|
|
197,033 |
|
|
|
105,063 |
|
|
Total interest income |
|
|
11,874,605 |
|
|
|
10,802,647 |
|
|
|
33,387,521 |
|
|
|
30,232,360 |
|
|
Interest expense: |
|
|
|
|
|
|
|
|
|
|
|
|
|
|
|
|
|
Interest-bearing deposits |
|
|
404,040 |
|
|
|
184,162 |
|
|
|
1,095,984 |
|
|
|
533,747 |
|
|
Savings and money market accounts |
|
|
689,382 |
|
|
|
650,735 |
|
|
|
2,140,405 |
|
|
|
2,039,751 |
|
|
Time deposits |
|
|
545,733 |
|
|
|
492,178 |
|
|
|
1,566,373 |
|
|
|
1,564,751 |
|
|
Federal funds purchased |
|
|
13,097 |
|
|
|
7,510 |
|
|
|
20,917 |
|
|
|
14,604 |
|
|
Securities sold under agreements to repurchase |
|
|
— |
|
|
|
3,715 |
|
|
|
1,311 |
|
|
|
12,731 |
|
|
Federal Home Loan Bank advances |
|
|
96,838 |
|
|
|
47,333 |
|
|
|
279,586 |
|
|
|
131,000 |
|
|
Total interest expense |
|
|
1,749,090 |
|
|
|
1,385,633 |
|
|
|
5,104,576 |
|
|
|
4,296,584 |
|
|
Net interest income |
|
|
10,125,515 |
|
|
|
9,417,014 |
|
|
|
28,282,945 |
|
|
|
25,935,776 |
|
|
Provision for loan and lease losses |
|
|
1,638,669 |
|
|
|
580,000 |
|
|
|
2,758,749 |
|
|
|
1,300,675 |
|
|
Net interest income after provision for loan and lease losses |
|
|
8,486,846 |
|
|
|
8,837,014 |
|
|
|
25,524,196 |
|
|
|
24,635,101 |
|
|
Noninterest income: |
|
|
|
|
|
|
|
|
|
|
|
|
|
|
|
|
|
Service charges on deposit accounts |
|
|
276,751 |
|
|
|
235,035 |
|
|
|
805,322 |
|
|
|
667,415 |
|
|
Loan commitment fees |
|
|
328,785 |
|
|
|
306,231 |
|
|
|
901,524 |
|
|
|
631,130 |
|
|
Net gain (loss) on sale of securities |
|
|
(3,964 |
) |
|
|
38,673 |
|
|
|
120,873 |
|
|
|
95,584 |
|
|
Net gain on sale of loans |
|
|
2,339,310 |
|
|
|
1,748,883 |
|
|
|
5,341,605 |
|
|
|
4,699,177 |
|
|
Other noninterest income |
|
|
250,581 |
|
|
|
305,837 |
|
|
|
961,103 |
|
|
|
872,047 |
|
|
Total noninterest income |
|
|
3,191,463 |
|
|
|
2,634,659 |
|
|
|
8,130,427 |
|
|
|
6,965,353 |
|
|
Noninterest expense: |
|
|
|
|
|
|
|
|
|
|
|
|
|
|
|
|
|
Salaries and employee benefits |
|
|
5,119,356 |
|
|
|
5,205,896 |
|
|
|
15,275,494 |
|
|
|
14,628,293 |
|
|
Data processing and software |
|
|
627,335 |
|
|
|
562,544 |
|
|
|
1,830,553 |
|
|
|
1,776,955 |
|
|
Professional fees |
|
|
390,862 |
|
|
|
374,496 |
|
|
|
1,147,733 |
|
|
|
1,113,776 |
|
|
Occupancy |
|
|
351,691 |
|
|
|
381,522 |
|
|
|
1,132,664 |
|
|
|
1,172,163 |
|
|
Equipment |
|
|
458,053 |
|
|
|
442,899 |
|
|
|
1,300,793 |
|
|
|
1,201,084 |
|
|
Regulatory fees |
|
|
250,424 |
|
|
|
227,053 |
|
|
|
742,308 |
|
|
|
688,965 |
|
|
Other real estate expense |
|
|
— |
|
|
|
6,562 |
|
|
|
13,880 |
|
|
|
33,812 |
|
|
Other operating |
|
|
1,329,084 |
|
|
|
1,402,927 |
|
|
|
3,043,915 |
|
|
|
3,038,706 |
|
|
Total noninterest expense |
|
|
8,526,805 |
|
|
|
8,603,899 |
|
|
|
24,487,340 |
|
|
|
23,653,754 |
|
|
Income before income taxes |
|
|
3,151,504 |
|
|
|
2,867,774 |
|
|
|
9,167,283 |
|
|
|
7,946,700 |
|
|
Income tax expense |
|
|
1,042,282 |
|
|
|
831,307 |
|
|
|
2,997,965 |
|
|
|
2,480,231 |
|
|
Net income |
|
$ |
2,109,222 |
|
|
$ |
2,036,467 |
|
|
$ |
6,169,318 |
|
|
$ |
5,466,469 |
|
|
Per share information: |
|
|
|
|
|
|
|
|
|
|
|
|
|
|
|
|
|
Basic net income per common share |
|
$ |
0.24 |
|
|
$ |
0.24 |
|
|
$ |
0.71 |
|
|
$ |
0.64 |
|
|
Diluted net income per common share |
|
$ |
0.20 |
|
|
$ |
0.20 |
|
|
$ |
0.58 |
|
|
$ |
0.53 |
|
|
Weighted average shares outstanding: |
|
|
|
|
|
|
|
|
|
|
|
|
|
|
|
|
|
Basic |
|
|
8,792,665 |
|
|
|
8,554,802 |
|
|
|
8,701,596 |
|
|
|
8,526,840 |
|
|
Diluted |
|
|
10,799,536 |
|
|
|
10,407,721 |
|
|
|
10,682,976 |
|
|
|
10,364,278 |
|
This information is preliminary and based on company data available at the time of the presentation.
CAPSTAR FINANCIAL HOLDINGS, INC. AND SUBSIDIARY
Selected Quarterly Financial Data (unaudited)
Third Quarter 2016 Earnings Release
|
|
|
Five Quarter Comparison |
|
|||||||||||||||||
|
|
|
9/30/16 |
|
|
6/30/16 |
|
|
3/31/16 |
|
|
12/31/15 |
|
|
9/30/15 |
|
|||||
|
Income Statement Data: |
|
|
|
|
|
|
|
|
|
|
|
|
|
|
|
|
|
|
|
|
|
Net interest income |
|
$ |
10,125,515 |
|
|
$ |
9,201,155 |
|
|
$ |
8,956,275 |
|
|
$ |
8,837,446 |
|
|
$ |
9,417,014 |
|
|
Provision for loan and lease losses |
|
|
1,638,669 |
|
|
|
182,863 |
|
|
|
937,216 |
|
|
|
350,000 |
|
|
|
580,000 |
|
|
Net interest income after provision for loan and lease losses |
|
|
8,486,845 |
|
|
|
9,018,292 |
|
|
|
8,019,059 |
|
|
|
8,487,446 |
|
|
|
8,837,014 |
|
|
Service charges on deposit accounts |
|
|
276,751 |
|
|
|
303,144 |
|
|
|
225,427 |
|
|
|
242,282 |
|
|
|
235,035 |
|
|
Loan commitment fees |
|
|
328,785 |
|
|
|
142,618 |
|
|
|
430,122 |
|
|
|
191,032 |
|
|
|
306,231 |
|
|
Net gain (loss) on sale of securities |
|
|
(3,964 |
) |
|
|
85,876 |
|
|
|
38,961 |
|
|
|
(40,561 |
) |
|
|
38,673 |
|
|
Net gain on sale of loans |
|
|
2,339,310 |
|
|
|
1,654,843 |
|
|
|
1,347,452 |
|
|
|
1,262,590 |
|
|
|
1,748,883 |
|
|
Other noninterest income |
|
|
250,582 |
|
|
|
381,711 |
|
|
|
328,809 |
|
|
|
262,814 |
|
|
|
305,837 |
|
|
Total noninterest income |
|
|
3,191,463 |
|
|
|
2,568,192 |
|
|
|
2,370,772 |
|
|
|
1,918,157 |
|
|
|
2,634,659 |
|
|
Salaries and employee benefits |
|
|
5,119,356 |
|
|
|
4,938,383 |
|
|
|
5,217,755 |
|
|
|
4,650,035 |
|
|
|
5,205,896 |
|
|
Data processing and software |
|
|
627,335 |
|
|
|
634,742 |
|
|
|
568,477 |
|
|
|
539,752 |
|
|
|
562,544 |
|
|
Professional fees |
|
|
390,862 |
|
|
|
426,132 |
|
|
|
330,738 |
|
|
|
355,255 |
|
|
|
374,496 |
|
|
Occupancy |
|
|
351,691 |
|
|
|
371,092 |
|
|
|
409,881 |
|
|
|
365,994 |
|
|
|
381,522 |
|
|
Equipment |
|
|
458,053 |
|
|
|
436,168 |
|
|
|
406,571 |
|
|
|
397,072 |
|
|
|
442,899 |
|
|
Regulatory fees |
|
|
250,424 |
|
|
|
264,625 |
|
|
|
227,260 |
|
|
|
225,994 |
|
|
|
227,053 |
|
|
Other real estate expense |
|
|
0 |
|
|
|
6,080 |
|
|
|
7,800 |
|
|
|
1,784 |
|
|
|
6,562 |
|
|
Other operating |
|
|
1,329,084 |
|
|
|
873,572 |
|
|
|
841,259 |
|
|
|
787,134 |
|
|
|
1,402,927 |
|
|
Total noninterest expense |
|
|
8,526,805 |
|
|
|
7,950,794 |
|
|
|
8,009,741 |
|
|
|
7,323,020 |
|
|
|
8,603,899 |
|
|
Net income before income tax expense |
|
|
3,151,504 |
|
|
|
3,635,690 |
|
|
|
2,380,090 |
|
|
|
3,082,583 |
|
|
|
2,867,773 |
|
|
Income tax expense |
|
|
1,042,282 |
|
|
|
1,159,438 |
|
|
|
796,245 |
|
|
|
989,615 |
|
|
|
831,307 |
|
|
Net income |
|
$ |
2,109,222 |
|
|
$ |
2,476,252 |
|
|
$ |
1,583,845 |
|
|
$ |
2,092,968 |
|
|
$ |
2,036,467 |
|
|
Weighted average shares - basic |
|
|
8,792,665 |
|
|
|
8,682,438 |
|
|
|
8,628,683 |
|
|
|
8,574,965 |
|
|
|
8,554,803 |
|
|
Weighted average shares - diluted |
|
|
10,799,536 |
|
|
|
10,675,916 |
|
|
|
10,572,193 |
|
|
|
10,434,171 |
|
|
|
10,407,722 |
|
|
Net income per share, basic |
|
$ |
0.24 |
|
|
$ |
0.29 |
|
|
$ |
0.18 |
|
|
$ |
0.24 |
|
|
$ |
0.24 |
|
|
Net income per share, diluted |
|
|
0.20 |
|
|
|
0.23 |
|
|
|
0.15 |
|
|
|
0.20 |
|
|
|
0.20 |
|
|
Balance Sheet Data (at period end): |
|
|
|
|
|
|
|
|
|
|
|
|
|
|
|
|
|
|
|
|
|
Cash and cash equivalents |
|
$ |
73,450,735 |
|
|
$ |
97,546,046 |
|
|
$ |
76,706,579 |
|
|
$ |
100,184,841 |
|
|
$ |
64,133,775 |
|
|
Securities available for sale |
|
|
167,213,109 |
|
|
|
171,336,596 |
|
|
|
189,807,985 |
|
|
|
173,382,957 |
|
|
|
170,219,581 |
|
|
Securities held to maturity |
|
|
46,227,968 |
|
|
|
43,331,042 |
|
|
|
42,953,364 |
|
|
|
43,093,951 |
|
|
|
43,322,469 |
|
|
Loans held for sale |
|
|
61,251,662 |
|
|
|
57,014,256 |
|
|
|
29,530,174 |
|
|
|
35,729,353 |
|
|
|
28,769,990 |
|
|
Total loans and leases |
|
|
924,030,515 |
|
|
|
887,437,485 |
|
|
|
837,690,395 |
|
|
|
808,396,064 |
|
|
|
782,436,559 |
|
|
Allowance for loan and lease losses |
|
|
(11,510,464 |
) |
|
|
(10,453,603 |
) |
|
|
(10,298,559 |
) |
|
|
(10,131,729 |
) |
|
|
(9,700,040 |
) |
|
Total assets |
|
|
1,318,057,325 |
|
|
|
1,310,417,841 |
|
|
|
1,223,179,646 |
|
|
|
1,206,800,280 |
|
|
|
1,135,471,317 |
|
|
Non-interest-bearing deposits |
|
|
191,469,462 |
|
|
|
193,541,662 |
|
|
|
220,686,364 |
|
|
|
190,580,468 |
|
|
|
187,104,757 |
|
|
Interest-bearing deposits |
|
|
944,590,330 |
|
|
|
949,759,113 |
|
|
|
865,650,400 |
|
|
|
847,879,843 |
|
|
|
787,906,354 |
|
|
Federal Home Loan Bank advances |
|
|
30,000,000 |
|
|
|
40,000,000 |
|
|
|
15,000,000 |
|
|
|
45,000,000 |
|
|
|
35,000,000 |
|
|
Total liabilities |
|
|
1,179,630,825 |
|
|
|
1,196,099,660 |
|
|
|
1,112,320,842 |
|
|
|
1,098,214,173 |
|
|
|
1,027,765,928 |
|
|
Shareholders' equity |
|
|
138,426,500 |
|
|
|
114,318,181 |
|
|
|
110,858,804 |
|
|
|
108,586,107 |
|
|
|
107,705,389 |
|
|
Total common shares outstanding |
|
|
11,191,021 |
|
|
|
8,683,902 |
|
|
|
8,677,902 |
|
|
|
8,577,051 |
|
|
|
8,565,051 |
|
|
Total preferred shares outstanding |
|
|
878,049 |
|
|
|
1,609,756 |
|
|
|
1,609,756 |
|
|
|
1,609,756 |
|
|
|
1,609,756 |
|
|
Book value per common share |
|
|
11.57 |
|
|
|
11.26 |
|
|
|
10.87 |
|
|
|
10.74 |
|
|
|
10.65 |
|
|
Market value per common share (1) |
|
|
16.92 |
|
|
|
- |
|
|
|
- |
|
|
|
- |
|
|
|
- |
|
|
Capital ratios: |
|
|
|
|
|
|
|
|
|
|
|
|
|
|
|
|
|
|
|
|
|
Total risk based capital |
|
|
12.45 |
% |
|
|
10.67 |
% |
|
|
11.26 |
% |
|
|
11.42 |
% |
|
|
11.43 |
% |
|
Tier 1 risk based capital |
|
|
11.46 |
% |
|
|
9.73 |
% |
|
|
10.26 |
% |
|
|
10.41 |
% |
|
|
10.44 |
% |
|
Common equity tier 1 capital |
|
|
10.75 |
% |
|
|
8.34 |
% |
|
|
8.75 |
% |
|
|
8.89 |
% |
|
|
8.88 |
% |
|
Leverage |
|
|
10.47 |
% |
|
|
8.90 |
% |
|
|
9.16 |
% |
|
|
9.33 |
% |
|
|
9.18 |
% |
(1) CapStar Financial Holdings, Inc. completed its initial public offering during the third quarter of 2016. As such, market values per share of common stock are not provided for previous periods.
This information is preliminary and based on company data available at the time of the presentation.
CAPSTAR FINANCIAL HOLDINGS, INC. AND SUBSIDIARY
Selected Quarterly Financial Data (unaudited)
Third Quarter 2016 Earnings Release
|
|
|
Five Quarter Comparison |
|
|||||||||||||||||
|
|
|
9/30/16 |
|
|
6/30/16 |
|
|
3/31/16 |
|
|
12/31/15 |
|
|
9/30/15 |
|
|||||
|
Average Balance Sheet Data: |
|
|
|
|
|
|
|
|
|
|
|
|
|
|
|
|
|
|
|
|
|
Average cash and cash equivalents |
|
|
55,054,076 |
|
|
|
56,458,924 |
|
|
|
67,706,162 |
|
|
|
63,187,062 |
|
|
|
65,209,244 |
|
|
Average investment securities |
|
|
218,462,999 |
|
|
|
232,587,954 |
|
|
|
220,281,801 |
|
|
|
216,982,746 |
|
|
|
252,504,136 |
|
|
Average loans held for sale |
|
|
63,640,373 |
|
|
|
43,055,160 |
|
|
|
29,798,738 |
|
|
|
27,338,722 |
|
|
|
32,836,386 |
|
|
Average loans and leases |
|
|
918,301,556 |
|
|
|
873,984,373 |
|
|
|
822,111,590 |
|
|
|
790,899,319 |
|
|
|
741,454,925 |
|
|
Average assets |
|
|
1,296,870,515 |
|
|
|
1,247,076,866 |
|
|
|
1,181,427,683 |
|
|
|
1,140,126,959 |
|
|
|
1,134,200,077 |
|
|
Average interest bearing deposits |
|
|
944,794,017 |
|
|
|
909,027,610 |
|
|
|
837,952,639 |
|
|
|
781,893,266 |
|
|
|
788,820,905 |
|
|
Average total deposits |
|
|
1,132,037,604 |
|
|
|
1,093,452,418 |
|
|
|
1,027,457,215 |
|
|
|
973,109,277 |
|
|
|
971,402,676 |
|
|
Average Federal Home Loan Bank advances |
|
|
29,565,217 |
|
|
|
27,417,582 |
|
|
|
28,021,978 |
|
|
|
39,891,304 |
|
|
|
35,000,000 |
|
|
Average liabilities |
|
|
1,179,480,497 |
|
|
|
1,134,506,177 |
|
|
|
1,070,607,967 |
|
|
|
1,030,995,222 |
|
|
|
1,026,417,411 |
|
|
Average shareholders' equity |
|
|
117,390,018 |
|
|
|
112,570,689 |
|
|
|
110,819,715 |
|
|
|
109,131,737 |
|
|
|
107,782,666 |
|
|
Performance Ratios: |
|
|
|
|
|
|
|
|
|
|
|
|
|
|
|
|
|
|
|
|
|
Annualized return on average assets |
|
|
0.65 |
% |
|
|
0.80 |
% |
|
|
0.54 |
% |
|
|
0.73 |
% |
|
|
0.71 |
% |
|
Annualized return on average equity |
|
|
7.15 |
% |
|
|
8.85 |
% |
|
|
5.75 |
% |
|
|
7.61 |
% |
|
|
7.50 |
% |
|
Net interest margin |
|
|
3.23 |
% |
|
|
3.09 |
% |
|
|
3.18 |
% |
|
|
3.22 |
% |
|
|
3.45 |
% |
|
Annualized Non-interest income to average assets |
|
|
0.98 |
% |
|
|
0.83 |
% |
|
|
0.81 |
% |
|
|
0.67 |
% |
|
|
0.92 |
% |
|
Efficiency ratio |
|
|
64.0 |
% |
|
|
67.6 |
% |
|
|
70.7 |
% |
|
|
68.1 |
% |
|
|
71.4 |
% |
|
Loans by Type: |
|
|
|
|
|
|
|
|
|
|
|
|
|
|
|
|
|
|
|
|
|
Commercial and industrial |
|
|
389,717,893 |
|
|
|
389,087,927 |
|
|
|
381,548,046 |
|
|
|
353,442,069 |
|
|
|
350,023,393 |
|
|
Commercial real estate - owner occupied |
|
|
108,920,619 |
|
|
|
104,345,021 |
|
|
|
104,243,080 |
|
|
|
108,132,048 |
|
|
|
95,118,531 |
|
|
Commercial real estate - non-owner occupied |
|
|
163,625,512 |
|
|
|
171,426,074 |
|
|
|
161,466,867 |
|
|
|
143,064,438 |
|
|
|
138,486,067 |
|
|
Construction and development |
|
|
91,366,437 |
|
|
|
63,744,151 |
|
|
|
52,479,785 |
|
|
|
52,521,802 |
|
|
|
48,928,400 |
|
|
Consumer real estate |
|
|
96,918,661 |
|
|
|
91,090,508 |
|
|
|
90,393,165 |
|
|
|
93,785,260 |
|
|
|
92,240,059 |
|
|
Consumer |
|
|
7,045,978 |
|
|
|
7,486,178 |
|
|
|
8,291,223 |
|
|
|
8,668,242 |
|
|
|
8,813,950 |
|
|
Other |
|
|
67,805,899 |
|
|
|
61,669,965 |
|
|
|
40,698,880 |
|
|
|
50,196,845 |
|
|
|
50,114,909 |
|
|
Asset Quality Data: |
|
|
|
|
|
|
|
|
|
|
|
|
|
|
|
|
|
|
|
|
|
Allowance for loan and lease losses to total loans |
|
|
1.25 |
% |
|
|
1.18 |
% |
|
|
1.23 |
% |
|
|
1.25 |
% |
|
|
1.24 |
% |
|
Allowance for loan and lease losses to non-performing loans |
|
|
279 |
% |
|
|
179 |
% |
|
|
184 |
% |
|
|
377 |
% |
|
|
328 |
% |
|
Nonaccrual loans |
|
|
4,122,942 |
|
|
|
5,829,423 |
|
|
|
5,586,503 |
|
|
|
2,689,000 |
|
|
|
2,961,529 |
|
|
Troubled debt restructurings |
|
|
1,288,324 |
|
|
|
- |
|
|
|
- |
|
|
|
125,000 |
|
|
|
133,326 |
|
|
Loans - 90 days past due & still accruing |
|
|
- |
|
|
|
- |
|
|
|
- |
|
|
|
- |
|
|
|
- |
|
|
Total non-performing loans |
|
|
4,122,942 |
|
|
|
5,829,423 |
|
|
|
5,586,503 |
|
|
|
2,689,000 |
|
|
|
2,961,529 |
|
|
OREO and repossessed assets |
|
|
- |
|
|
|
- |
|
|
|
- |
|
|
|
216,254 |
|
|
|
335,254 |
|
|
Total non-performing assets |
|
|
4,122,942 |
|
|
|
5,829,423 |
|
|
|
5,586,503 |
|
|
|
2,905,000 |
|
|
|
3,296,783 |
|
|
Non-performing loans to total loans |
|
|
0.45 |
% |
|
|
0.66 |
% |
|
|
0.67 |
% |
|
|
0.33 |
% |
|
|
0.38 |
% |
|
Non-performing assets to total assets |
|
|
0.31 |
% |
|
|
0.44 |
% |
|
|
0.46 |
% |
|
|
0.24 |
% |
|
|
0.29 |
% |
|
Non-performing assets to total loans and OREO |
|
|
0.45 |
% |
|
|
0.66 |
% |
|
|
0.67 |
% |
|
|
0.36 |
% |
|
|
0.42 |
% |
|
Annualized net charge-offs to average loans |
|
|
0.25 |
% |
|
|
0.01 |
% |
|
|
0.38 |
% |
|
|
-0.04 |
% |
|
|
-0.10 |
% |
|
Net charge-offs (recoveries) |
|
|
581,809 |
|
|
|
27,819 |
|
|
|
770,386 |
|
|
|
(81,689 |
) |
|
|
(181,522 |
) |
|
Other Information: |
|
|
|
|
|
|
|
|
|
|
|
|
|
|
|
|
|
|
|
|
|
Full-time equivalent employees |
|
168 |
|
|
166 |
|
|
163 |
|
|
162 |
|
|
159 |
|
|||||
This information is preliminary and based on company data available at the time of the presentation.

Third Quarter 2016 Earnings Call October 28, 2016 Exhibit 99.2
Terminology The terms “we,” “our,” “us,” “the Company,” “CSTR” and “CapStar” that appear in this presentation refer to CapStar Financial Holdings, Inc. and its wholly-owned subsidiary, CapStar Bank. The terms “CapStar Bank,” “the bank” and “our bank” that appear in this presentation refer CapStar Bank. Contents of Presentation Except as is otherwise expressly stated in this presentation, the contents of this presentation are presented as of the date on the front cover of this presentation. Market Data Market data used in this presentation has been obtained from government and independent industry sources and publications available to the public, sometimes with a subscription fee, as well as from research reports prepared for other purposes. Industry publications and surveys and forecasts generally state that the information contained therein has been obtained from sources believed to be reliable. CSTR did not commission the preparation of any of the sources or publications referred to in this presentation. CSTR has not independently verified the data obtained from these sources, and, although CSTR believes such data to be reliable as of the dates presented, it could prove to be inaccurate. Forward-looking information obtained from these sources is subject to the same qualifications and the additional uncertainties regarding the other forward-looking statements in this presentation. Non-GAAP Disclaimer This presentation includes the following financial measures that have been prepared other than in accordance with generally accepted accounting principles in the United States (“non-GAAP financial measures”): pre-tax, pre-provision net income, pre-tax, pre-provision return on average assets, tangible equity, tangible common equity, tangible assets, return on average tangible equity, book value per share (as adjusted), tangible book value per share (as reported and as adjusted), tangible equity to tangible assets and adjusted shares outstanding at end of period. CSTR non-GAAP financial measures (i) provide useful information to management and investors that is supplementary to its financial condition, results of operations and cash flows computed in accordance with GAAP, (ii) enable a more complete understanding of factors and trends affecting the Company’s business, and (iii) allow investors to evaluate the Company’s performance in a manner similar to management, the financial services industry, bank stock analysts and bank regulators; however, CSTR acknowledges that its non-GAAP financial measures have a number of limitations. As such, you should not view these disclosures as a substitute for results determined in accordance with GAAP, and they are not necessarily comparable to non-GAAP financial measures that other companies use. See the Appendix to this presentation for a reconciliation of non-GAAP financial measures to the most directly comparable GAAP financial measures. Disclaimer

Certain statements in this presentation are forward-looking statements that reflect our current views with respect to, among other things, future events and our financial performance. These statements are often, but not always, made through the use of words or phrases such as “may,” “should,” “could,” “predict,” “potential,” “believe,” “will likely result,” “expect,” “continue,” “will,” “anticipate,” “seek,” “estimate,” “intend,” “plan,” “project,” “projection,” “forecast,” “goal,” “target,” “would,” and “outlook,” or the negative version of those words or other comparable words of a future or forward-looking nature. These forward-looking statements are not historical facts, and are based on current expectations, estimates and projections about our industry, management’s beliefs and certain assumptions made by management, many of which, by their nature, are inherently uncertain and beyond our control. The inclusion of these forward-looking statements should not be regarded as a representation by us or any other person that such expectations, estimates and projections will be achieved. Accordingly, we caution you that any such forward-looking statements are not guarantees of future performance and are subject to risks, assumptions and uncertainties that are difficult to predict. Although we believe that the expectations reflected in these forward-looking statements are reasonable as of the date made, actual results may prove to be materially different from the results expressed or implied by the forward-looking statements. There are or will be important factors that could cause our actual results to differ materially from those indicated in these forward-looking statements, including, but are not limited to, the following: Economic conditions (including interest rate environment, government economic and monetary policies, the strength of global financial markets and inflation and deflation) that impact the financial services industry as a whole and/or our business; the concentration of our business in the Nashville metropolitan statistical area (“MSA”) and the effect of changes in the economic, political and environmental conditions on this market; increased competition in the financial services industry, locally, regionally or nationally, which may adversely affect pricing and the other terms offered to our clients; our dependence on our management team and board of directors and changes in our management and board composition; our reputation in the community; our ability to execute our strategy and to achieve loan and deposit growth through organic growth and strategic acquisitions; credit risks related to the size of our borrowers and our ability to adequately assess and limit our credit risk; our concentration of large loans to a small number of borrowers; the significant portion of our loan portfolio that originated during the past two years and therefore may less reliably predict future collectability than older loans; the adequacy of reserves (including our allowance for loan and lease losses) and the appropriateness of our methodology for calculating such reserves; adverse trends in the healthcare service industry, which is an integral component of our market’s economy; our management of risks inherent in our commercial real estate loan portfolio, and the risk of a prolonged downturn in the real estate market, which could impair the value of our collateral and our ability to sell collateral upon any foreclosure; governmental legislation and regulation, including changes in the nature and timing of the adoption and effectiveness of new requirements under the Dodd-Frank Act of 2010, as amended, Basel guidelines, capital requirements, accounting regulation or standards and other applicable laws and regulations; the loss of large depositor relationships, which could force us to fund our business through more expensive and less stable sources; operational and liquidity risks associated with our business, including liquidity risks inherent in correspondent banking; volatility in interest rates and our overall management of interest rate risk, including managing the sensitivity of our interest-earning assets and interest-bearing liabilities to interest rates, and the impact to our earnings from a change in interest rates; the potential for our bank’s regulatory lending limits and other factors related to our size to restrict our growth and prevent us from effectively implementing our business strategy; strategic acquisitions we may undertake to achieve our goals; the sufficiency of our capital, including sources of capital and the extent to which we may be required to raise additional capital to meet our goals; fluctuations to the fair value of our investment securities that are beyond our control; deterioration in the fiscal position of the U.S. government and downgrades in Treasury and federal agency securities; potential exposure to fraud, negligence, computer theft and cyber-crime; the adequacy of our risk management framework; our dependence on our information technology and telecommunications systems and the potential for any systems failures or interruptions; our dependence upon outside third parties for the processing and handling of our records and data; our ability to adapt to technological change; the financial soundness of other financial institutions; our exposure to environmental liability risk associated with our lending activities; our engagement in derivative transactions; our involvement from time to time in legal proceedings and examinations and remedial actions by regulators; the susceptibility of our market to natural disasters and acts of God; and the effectiveness of our internal controls over financial reporting and our ability to remediate any future material weakness in our internal controls over financial reporting. The foregoing factors should not be construed as exhaustive and should be read in conjunction with the section entitled “Risk Factors” included in the Company’s prospectus filed with the United States Securities and Exchange Commission on September 23, 2016. If one or more events related to these or other risks or uncertainties materialize, or if our underlying assumptions prove to be incorrect, actual results may differ materially from our forward-looking statements. Accordingly, you should not place undue reliance on any such forward-looking statements. Any forward-looking statement speaks only as of the date of this presentation, and we do not undertake any obligation to publicly update or review any forward-looking statement, whether as a result of new information, future developments or otherwise, except as required by law. New risks and uncertainties may emerge from time to time, and it is not possible for us to predict their occurrence or how they will affect us. Safe Harbor Statements
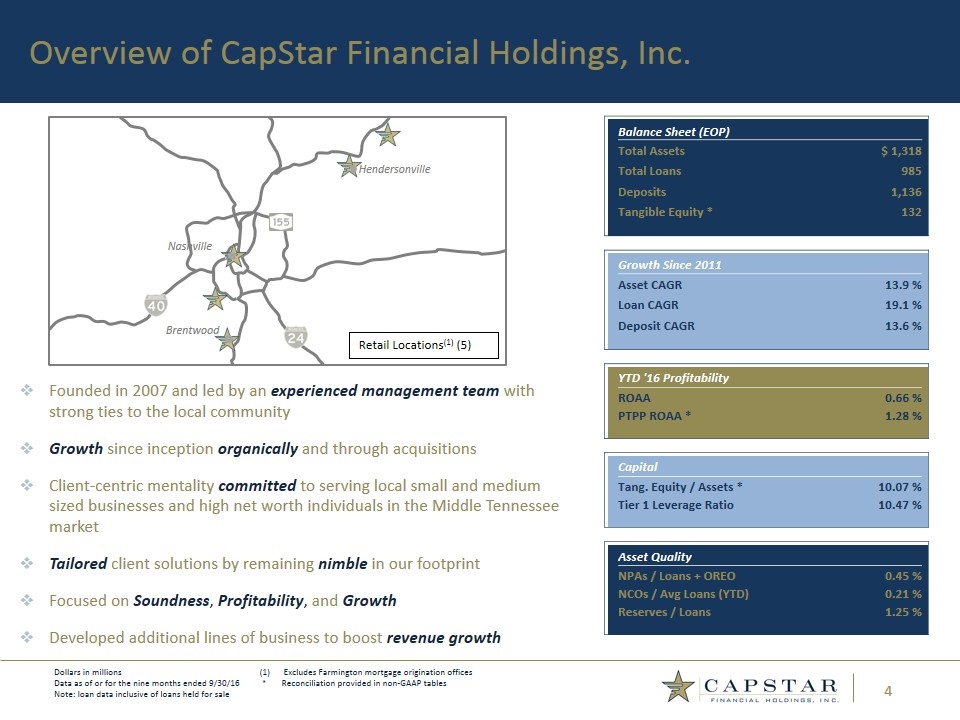
Overview of CapStar Financial Holdings, Inc. Founded in 2007 and led by an experienced management team with strong ties to the local community Growth since inception organically and through acquisitions Client-centric mentality committed to serving local small and medium sized businesses and high net worth individuals in the Middle Tennessee market Tailored client solutions by remaining nimble in our footprint Focused on Soundness, Profitability, and Growth Developed additional lines of business to boost revenue growth Dollars in millions Data as of or for the nine months ended 9/30/16 Note: loan data inclusive of loans held for sale Excludes Farmington mortgage origination offices * Reconciliation provided in non-GAAP tables Brentwood Nashville Hendersonville Retail Locations(1) (5) Balance Sheet (EOP) Total Assets $ 1,318 Total Loans 985 Deposits 1,136 Tangible Equity * 132 Growth Since 2011 Asset CAGR 13.9 % Loan CAGR 19.1 % Deposit CAGR 13.6 % YTD '16 Profitability ROAA 0.66 % PTPP ROAA * 1.28 % Capital Tang. Equity / Assets * 10.07 % Tier 1 Leverage Ratio 10.47 % Asset Quality NPAs / Loans + OREO 0.45 % NCOs / Avg Loans (YTD) 0.21 % Reserves / Loans 1.25 %
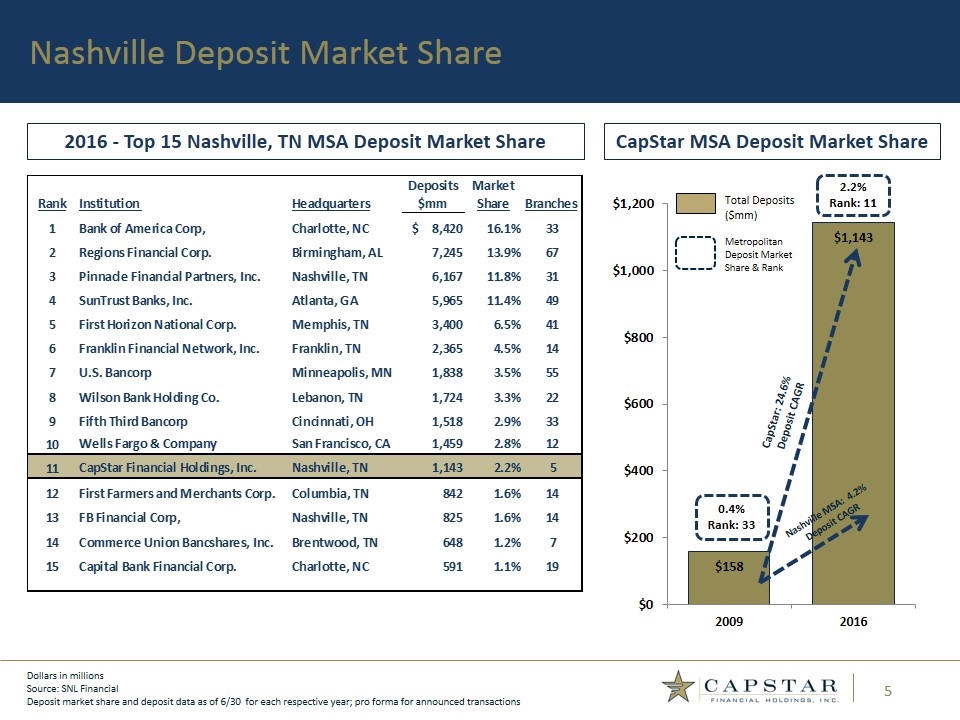
Nashville Deposit Market Share Dollars in millions Source: SNL Financial Deposit market share and deposit data as of 6/30 for each respective year; pro forma for announced transactions 2016 - Top 15 Nashville, TN MSA Deposit Market Share CapStar MSA Deposit Market Share 2.2% Rank: 11 CapStar: 24.6% Deposit CAGR Nashville MSA: 4.2% Deposit CAGR
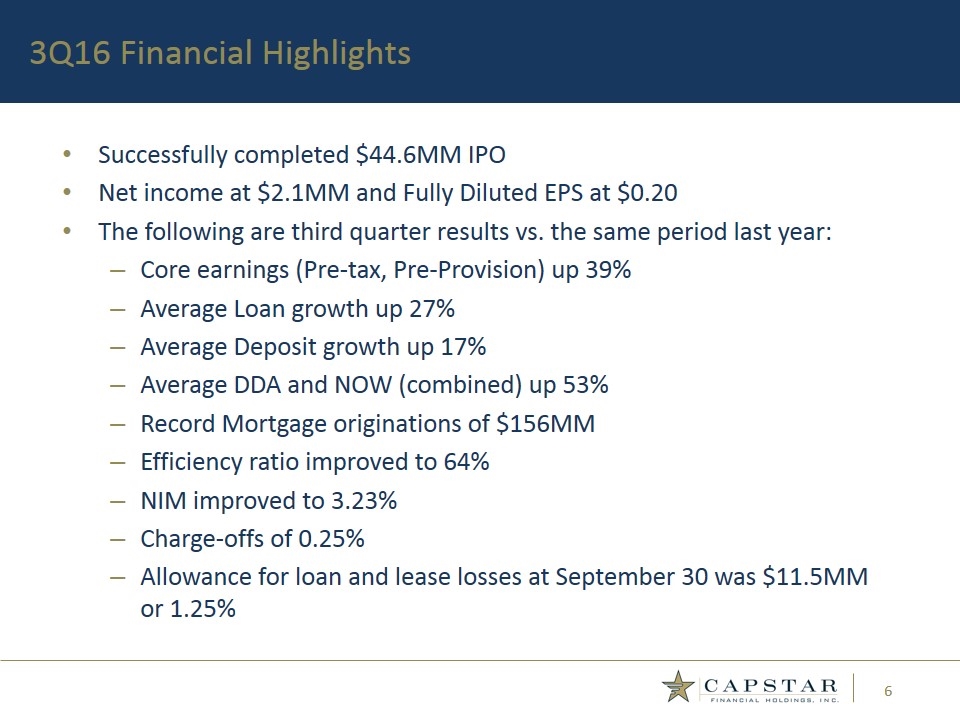
Successfully completed $44.6MM IPO Net income at $2.1MM and Fully Diluted EPS at $0.20 The following are third quarter results vs. the same period last year: Core earnings (Pre-tax, Pre-Provision) up 39% Average Loan growth up 27% Average Deposit growth up 17% Average DDA and NOW (combined) up 53% Record Mortgage originations of $156MM Efficiency ratio improved to 64% NIM improved to 3.23% Charge-offs of 0.25% Allowance for loan and lease losses at September 30 was $11.5MM or 1.25% 3Q16 Financial Highlights
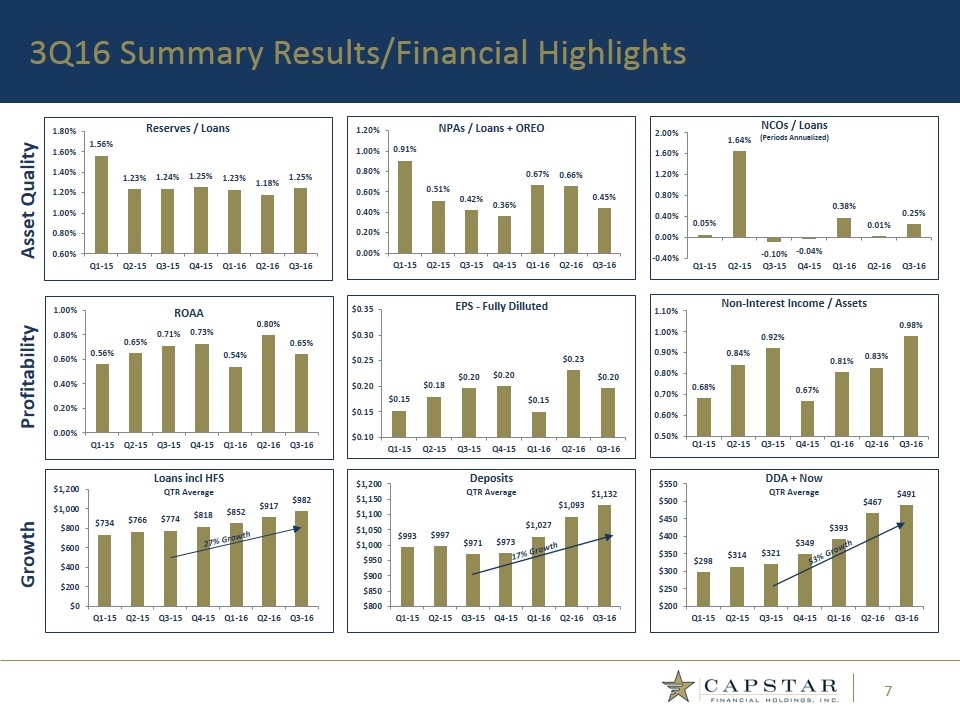
3Q16 Summary Results/Financial Highlights Asset Quality Profitability Growth 17% Growth 27% Growth 53% Growth
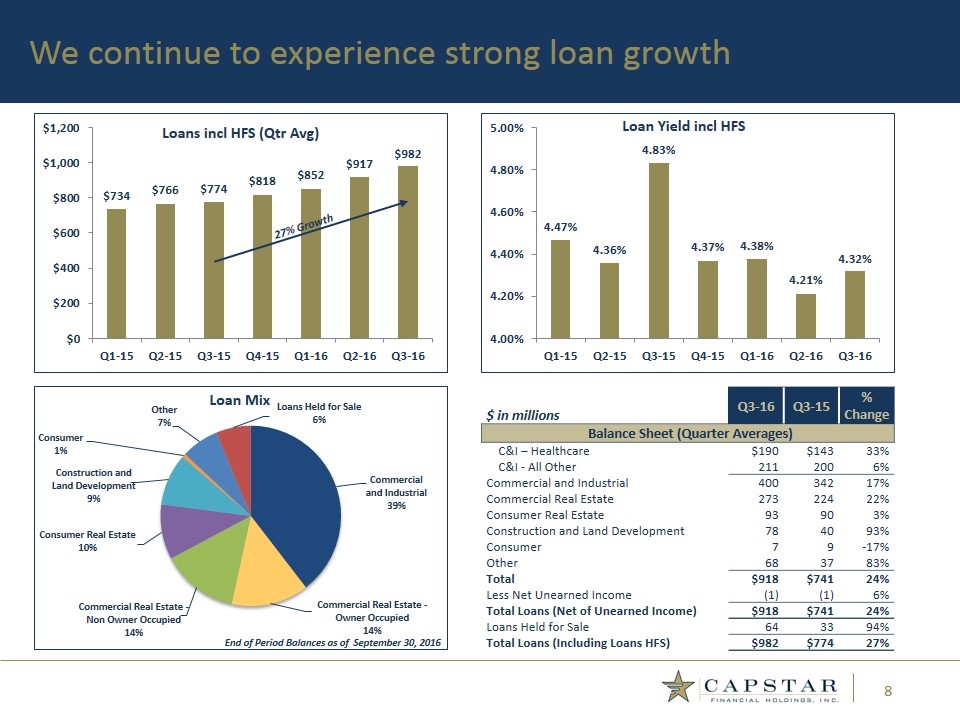
We continue to experience strong loan growth End of Period Balances as of September 30, 2016 $ in millions Q3-16 Q3-15 % Change Balance Sheet (Quarter Averages) C&I – Healthcare $190 $143 33% C&I - All Other 211 200 6% Commercial and Industrial 400 342 17% Commercial Real Estate 273 224 22% Consumer Real Estate 93 90 3% Construction and Land Development 78 40 93% Consumer 7 9 -17% Other 68 37 83% Total $918 $741 24% Less Net Unearned Income (1) (1) 6% Total Loans (Net of Unearned Income) $918 $741 24% Loans Held for Sale 64 33 94% Total Loans (Including Loans HFS) $982 $774 27% 27% Growth
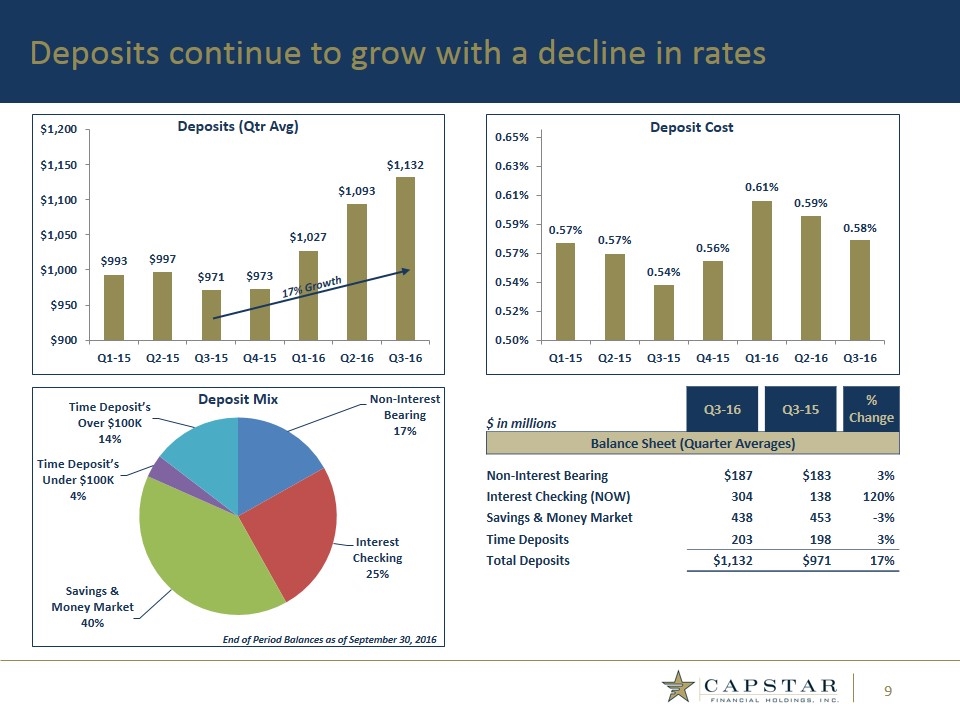
Deposits continue to grow with a decline in rates End of Period Balances as of September 30, 2016 $ in millions Q3-16 Q3-15 % Change Balance Sheet (Quarter Averages) Non-Interest Bearing $187 $183 3% Interest Checking (NOW) 304 138 120% Savings & Money Market 438 453 -3% Time Deposits 203 198 3% Total Deposits $1,132 $971 17% 17% Growth
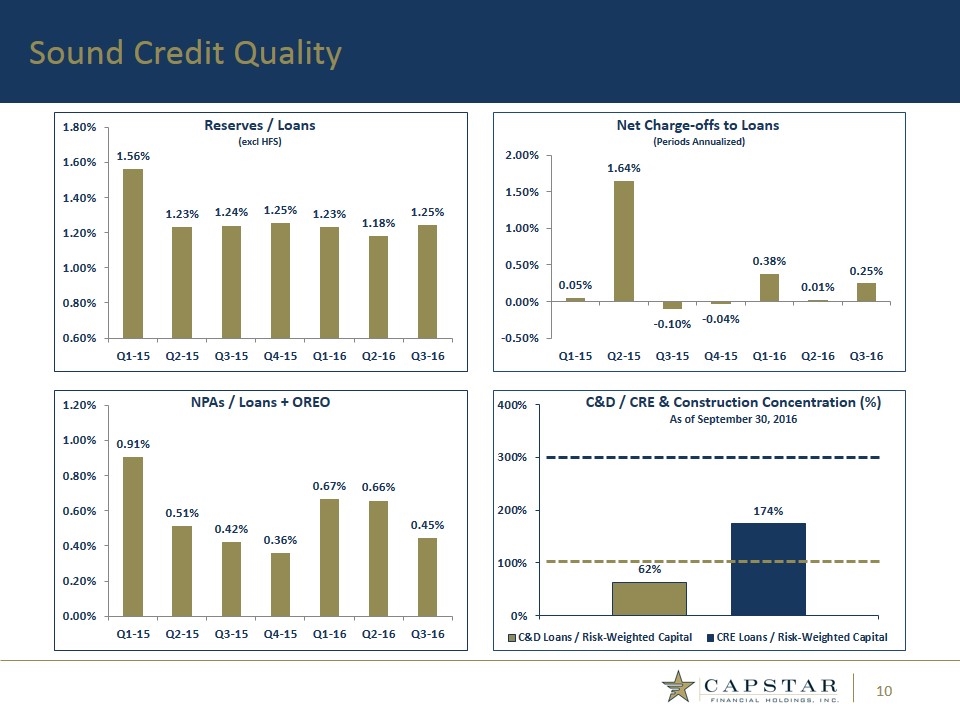
Sound Credit Quality
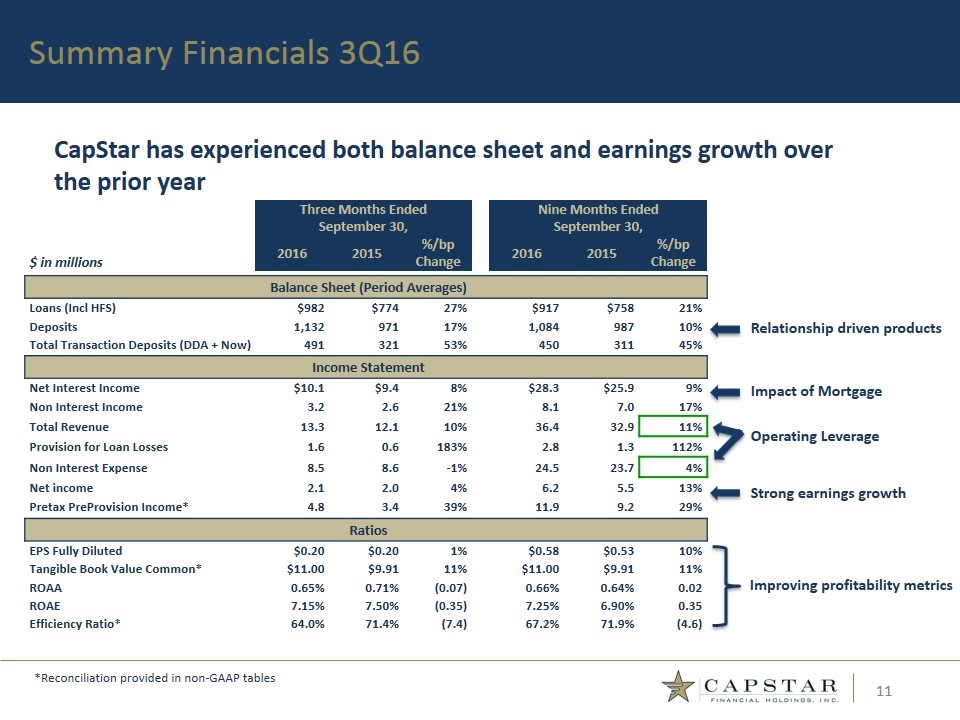
Summary Financials 3Q16 CapStar has experienced both balance sheet and earnings growth over the prior year Relationship driven products Impact of Mortgage Strong earnings growth Improving profitability metrics Operating Leverage Three Months Ended September 30, Nine Months Ended September 30, $ in millions 2016 2015 %/bp Change 2016 2015 %/bp Change Balance Sheet (Period Averages) Loans (Incl HFS) $982 $774 27% $917 $758 21% Deposits 1,132 971 17% 1,084 987 10% Total Transaction Deposits (DDA + Now) 491 321 53% 450 311 45% Income Statement Net Interest Income $10.1 $9.4 8% $28.3 $25.9 9% Non Interest Income 3.2 2.6 21% 8.1 7.0 17% Total Revenue 13.3 12.1 10% 36.4 32.9 11% Provision for Loan Losses 1.6 0.6 183% 2.8 1.3 112% Non Interest Expense 8.5 8.6 -1% 24.5 23.7 4% Net income 2.1 2.0 4% 6.2 5.5 13% Pretax PreProvision Income* 4.8 3.4 39% 11.9 9.2 29% Ratios EPS Fully Diluted $0.20 $0.20 1% $0.58 $0.53 10% Tangible Book Value Common* $11.00 $9.91 11% $11.00 $9.91 11% ROAA 0.65% 0.71% (0.07) 0.66% 0.64% 0.02 ROAE 7.15% 7.50% (0.35) 7.25% 6.90% 0.35 Efficiency Ratio* 64.0% 71.4% (7.4) 67.2% 71.9% (4.6) *Reconciliation provided in non-GAAP tables
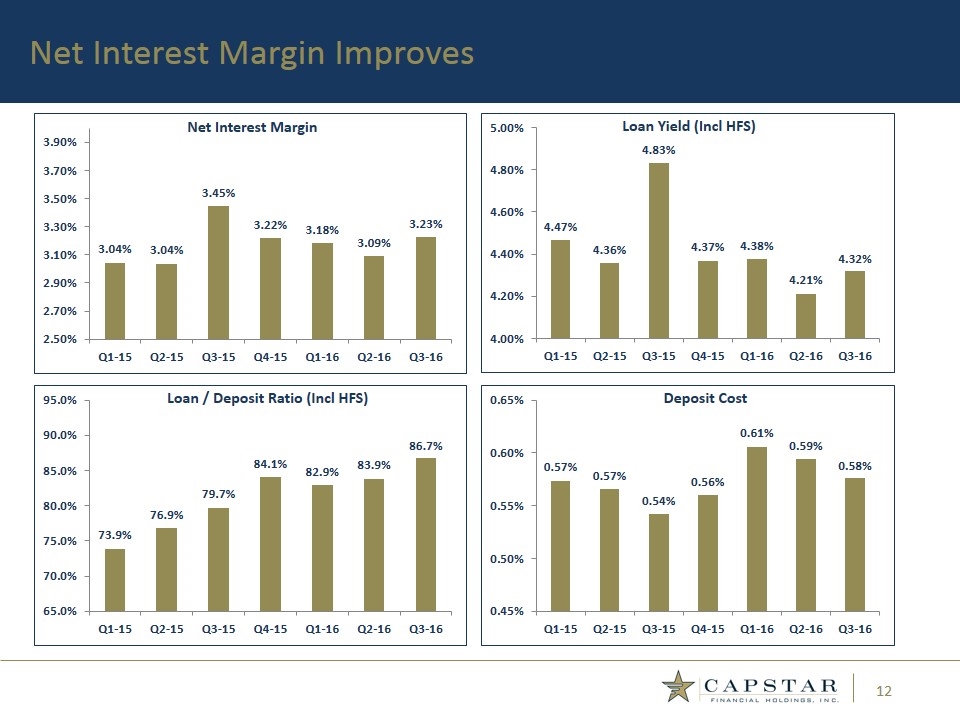
Net Interest Margin Improves
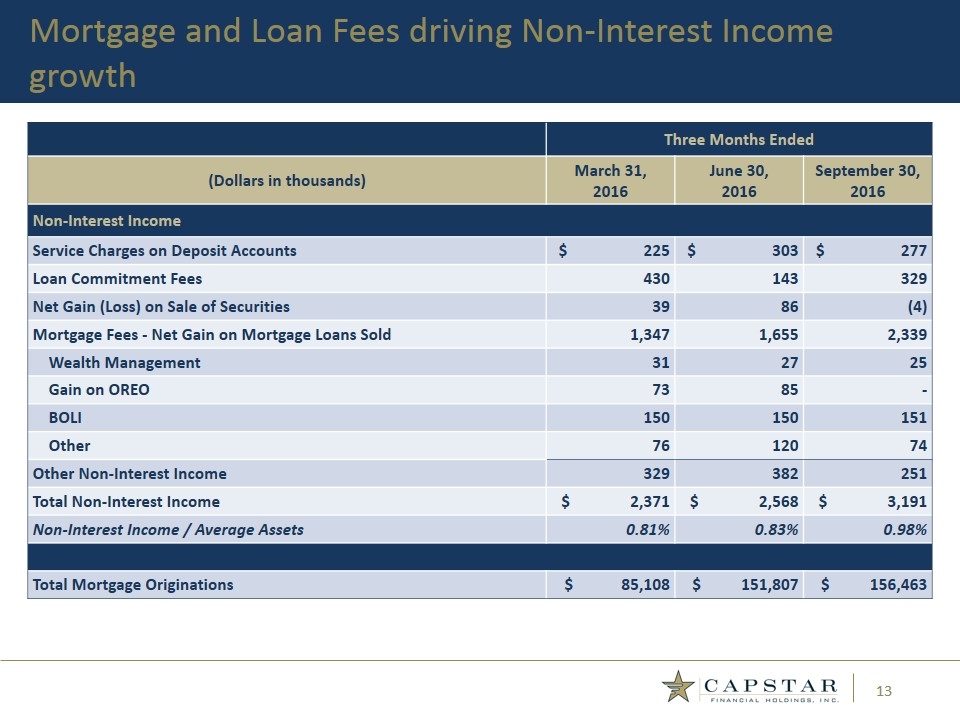
Mortgage and Loan Fees driving Non-Interest Income growth Three Months Ended (Dollars in thousands) March 31, June 30, September 30, 2016 2016 2016 Non-Interest Income Service Charges on Deposit Accounts $ 225 $ 303 $ 277 Loan Commitment Fees 430 143 329 Net Gain (Loss) on Sale of Securities 39 86 (4) Mortgage Fees - Net Gain on Mortgage Loans Sold 1,347 1,655 2,339 Wealth Management 31 27 25 Gain on OREO 73 85 - BOLI 150 150 151 Other 76 120 74 Other Non-Interest Income 329 382 251 Total Non-Interest Income $ 2,371 $ 2,568 $ 3,191 Non-Interest Income / Average Assets 0.81% 0.83% 0.98% Total Mortgage Originations $ 85,108 $ 151,807 $ 156,463
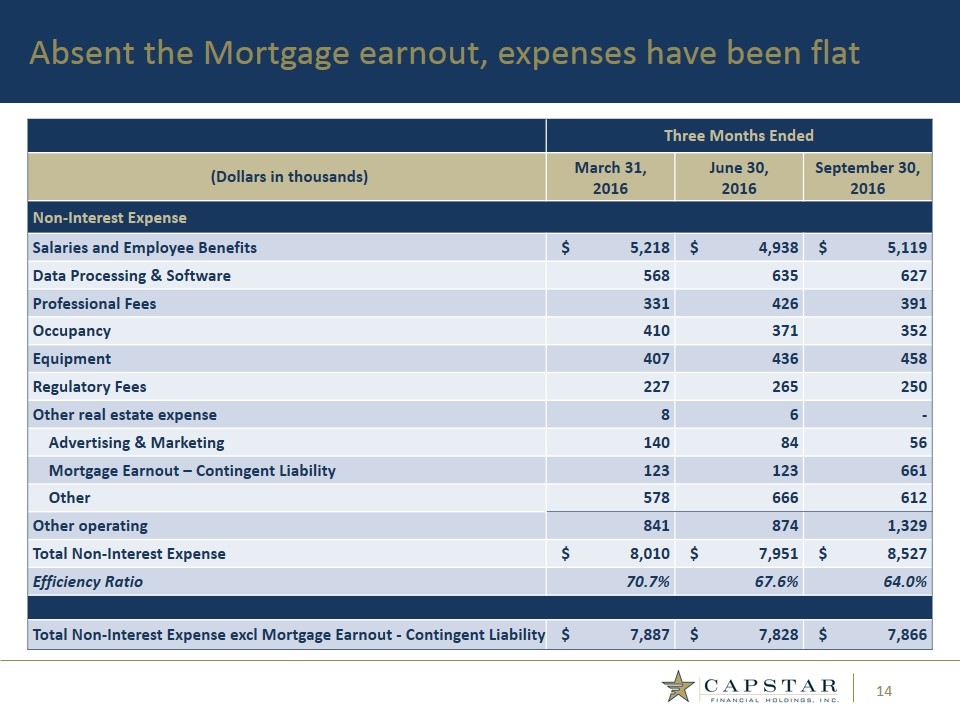
Absent the Mortgage earnout, expenses have been flat Three Months Ended (Dollars in thousands) March 31, June 30, September 30, 2016 2016 2016 Non-Interest Expense Salaries and Employee Benefits $ 5,218 $ 4,938 $ 5,119 Data Processing & Software 568 635 627 Professional Fees 331 426 391 Occupancy 410 371 352 Equipment 407 436 458 Regulatory Fees 227 265 250 Other real estate expense 8 6 - Advertising & Marketing 140 84 56 Mortgage Earnout – Contingent Liability 123 123 661 Other 578 666 612 Other operating 841 874 1,329 Total Non-Interest Expense $ 8,010 $ 7,951 $ 8,527 Efficiency Ratio 70.7% 67.6% 64.0% Total Non-Interest Expense excl Mortgage Earnout - Contingent Liability $ 7,887 $ 7,828 $ 7,866
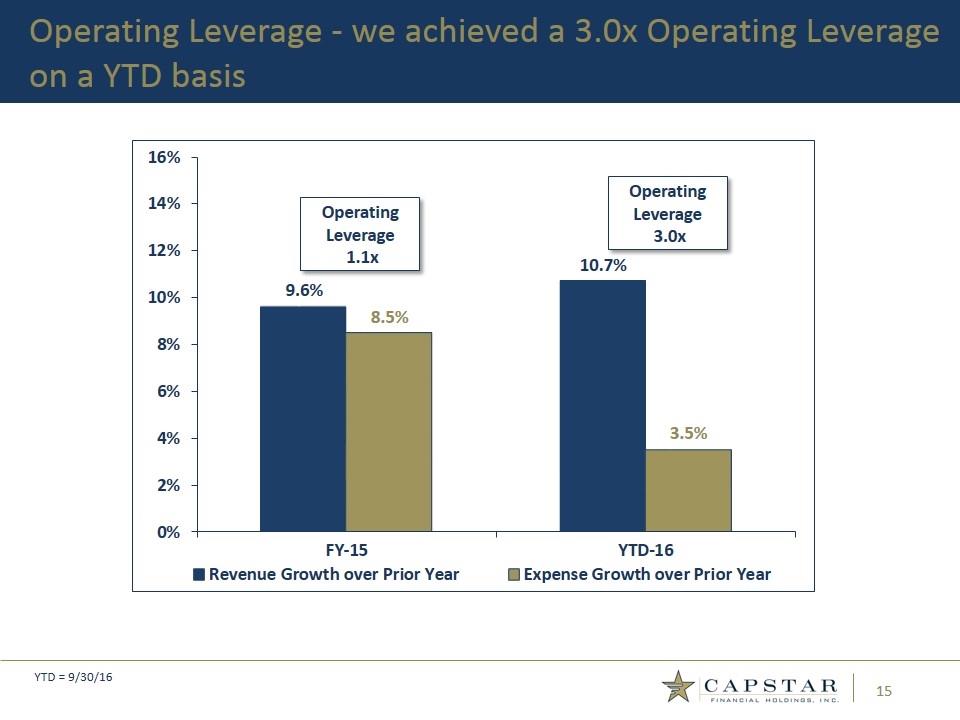
Operating Leverage - we achieved a 3.0x Operating Leverage on a YTD basis YTD = 9/30/16
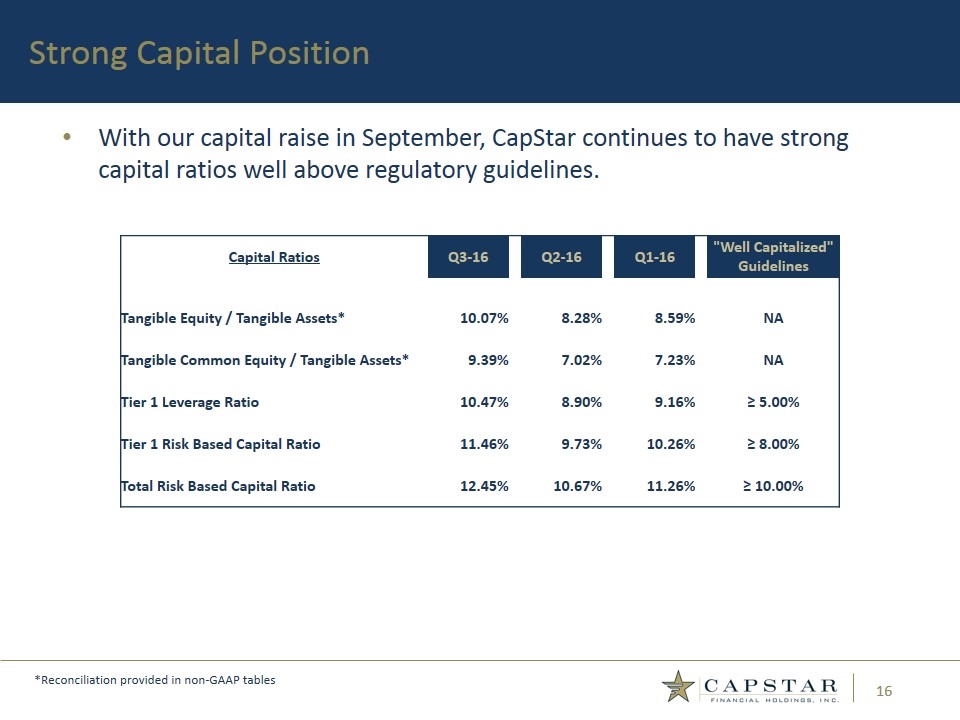
With our capital raise in September, CapStar continues to have strong capital ratios well above regulatory guidelines. Strong Capital Position *Reconciliation provided in non-GAAP tables Capital Ratios Q3-16 Q2-16 Q1-16 "Well Capitalized" Guidelines Tangible Equity / Tangible Assets* 10.07% 8.28% 8.59% NA Tangible Common Equity / Tangible Assets* 9.39% 7.02% 7.23% NA Tier 1 Leverage Ratio 10.47% 8.90% 9.16% ≥ 5.00% Tier 1 Risk Based Capital Ratio 11.46% 9.73% 10.26% ≥ 8.00% Total Risk Based Capital Ratio 12.45% 10.67% 11.26% ≥ 10.00%
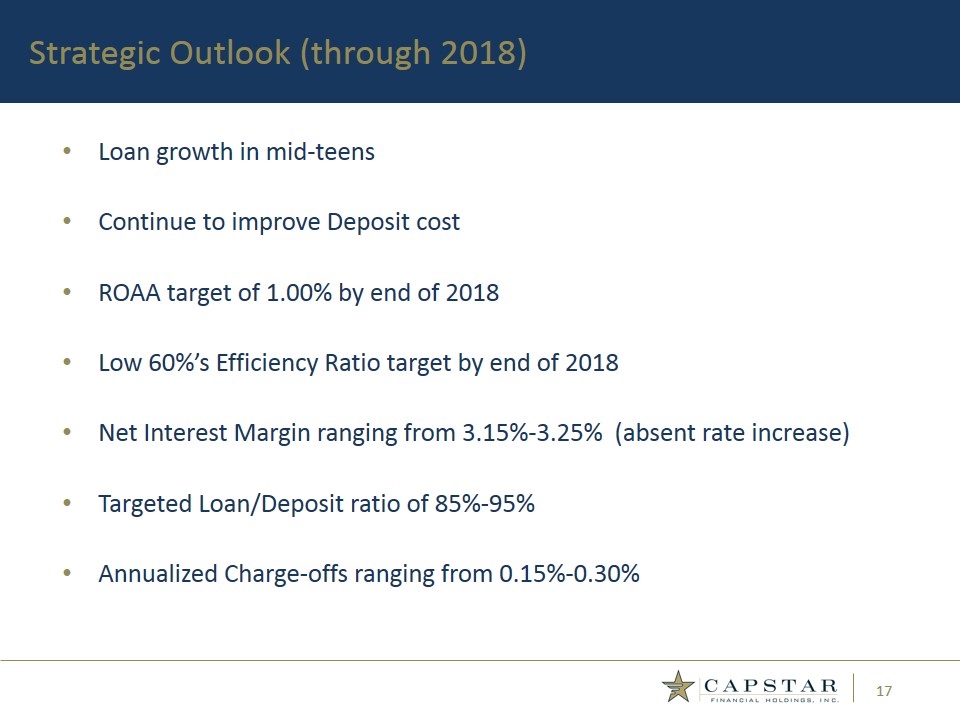
Loan growth in mid-teens Continue to improve Deposit cost ROAA target of 1.00% by end of 2018 Low 60%’s Efficiency Ratio target by end of 2018 Net Interest Margin ranging from 3.15%-3.25% (absent rate increase) Targeted Loan/Deposit ratio of 85%-95% Annualized Charge-offs ranging from 0.15%-0.30% Strategic Outlook (through 2018)
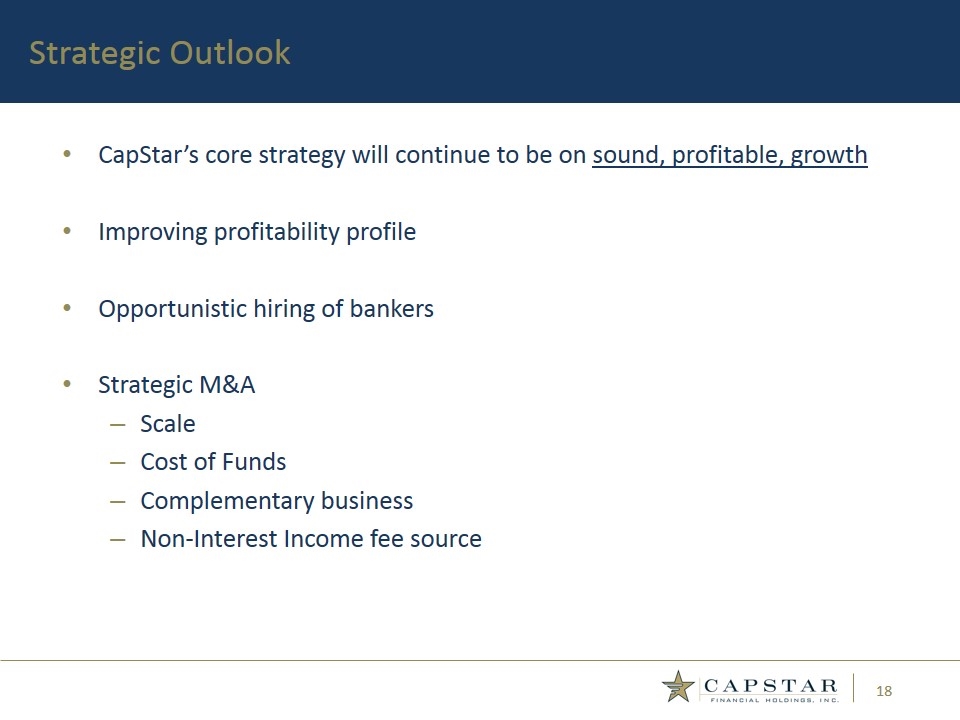
CapStar’s core strategy will continue to be on sound, profitable, growth Improving profitability profile Opportunistic hiring of bankers Strategic M&A Scale Cost of Funds Complementary business Non-Interest Income fee source Strategic Outlook
Appendix: Historical Financials
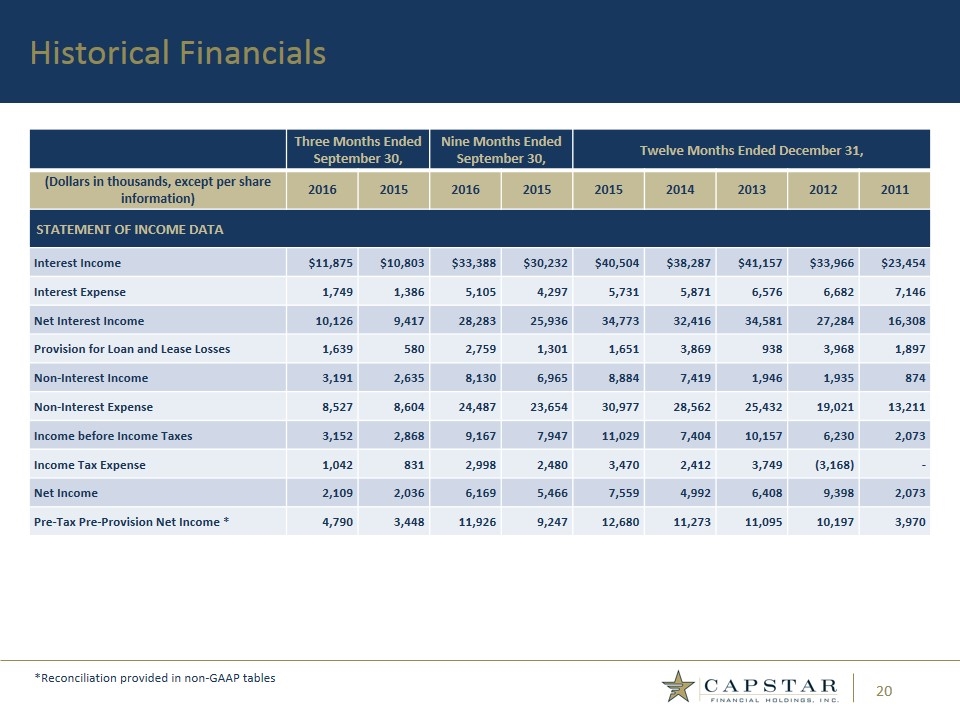
Three Months Ended September 30, Nine Months Ended September 30, Twelve Months Ended December 31, (Dollars in thousands, except per share information) 2016 2015 2016 2015 2015 2014 2013 2012 2011 STATEMENT OF INCOME DATA Interest Income $11,875 $10,803 $33,388 $30,232 $40,504 $38,287 $41,157 $33,966 $23,454 Interest Expense 1,749 1,386 5,105 4,297 5,731 5,871 6,576 6,682 7,146 Net Interest Income 10,126 9,417 28,283 25,936 34,773 32,416 34,581 27,284 16,308 Provision for Loan and Lease Losses 1,639 580 2,759 1,301 1,651 3,869 938 3,968 1,897 Non-Interest Income 3,191 2,635 8,130 6,965 8,884 7,419 1,946 1,935 874 Non-Interest Expense 8,527 8,604 24,487 23,654 30,977 28,562 25,432 19,021 13,211 Income before Income Taxes 3,152 2,868 9,167 7,947 11,029 7,404 10,157 6,230 2,073 Income Tax Expense 1,042 831 2,998 2,480 3,470 2,412 3,749 (3,168) - Net Income 2,109 2,036 6,169 5,466 7,559 4,992 6,408 9,398 2,073 Pre-Tax Pre-Provision Net Income * 4,790 3,448 11,926 9,247 12,680 11,273 11,095 10,197 3,970 Historical Financials *Reconciliation provided in non-GAAP tables
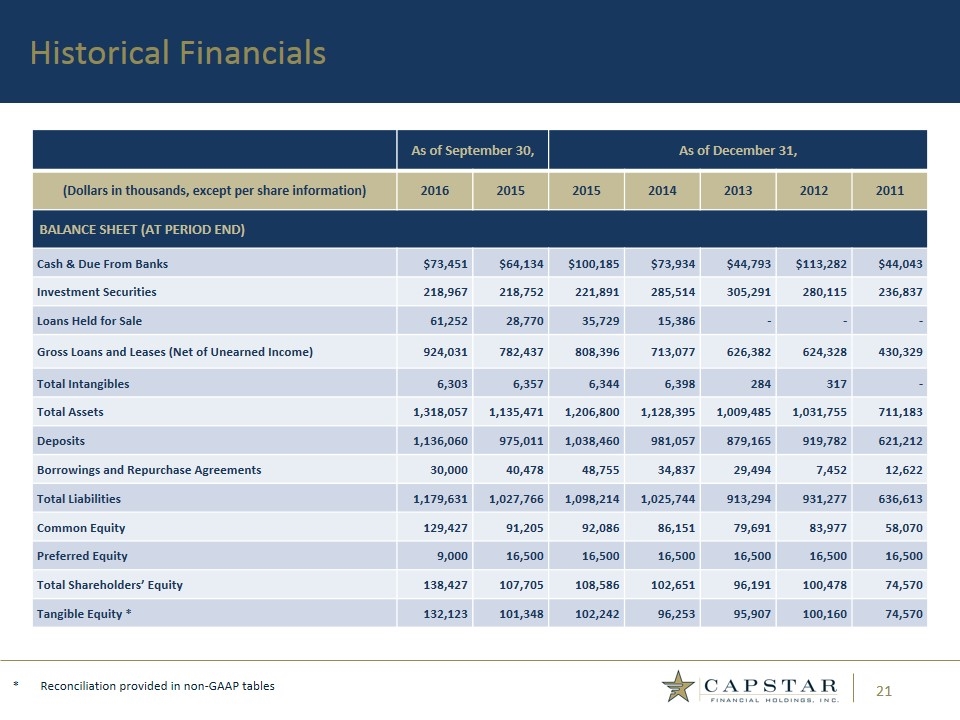
As of September 30, As of December 31, (Dollars in thousands, except per share information) 2016 2015 2015 2014 2013 2012 2011 BALANCE SHEET (AT PERIOD END) Cash & Due From Banks $73,451 $64,134 $100,185 $73,934 $44,793 $113,282 $44,043 Investment Securities 218,967 218,752 221,891 285,514 305,291 280,115 236,837 Loans Held for Sale 61,252 28,770 35,729 15,386 - - - Gross Loans and Leases (Net of Unearned Income) 924,031 782,437 808,396 713,077 626,382 624,328 430,329 Total Intangibles 6,303 6,357 6,344 6,398 284 317 - Total Assets 1,318,057 1,135,471 1,206,800 1,128,395 1,009,485 1,031,755 711,183 Deposits 1,136,060 975,011 1,038,460 981,057 879,165 919,782 621,212 Borrowings and Repurchase Agreements 30,000 40,478 48,755 34,837 29,494 7,452 12,622 Total Liabilities 1,179,631 1,027,766 1,098,214 1,025,744 913,294 931,277 636,613 Common Equity 129,427 91,205 92,086 86,151 79,691 83,977 58,070 Preferred Equity 9,000 16,500 16,500 16,500 16,500 16,500 16,500 Total Shareholders’ Equity 138,427 107,705 108,586 102,651 96,191 100,478 74,570 Tangible Equity * 132,123 101,348 102,242 96,253 95,907 100,160 74,570 Historical Financials * Reconciliation provided in non-GAAP tables
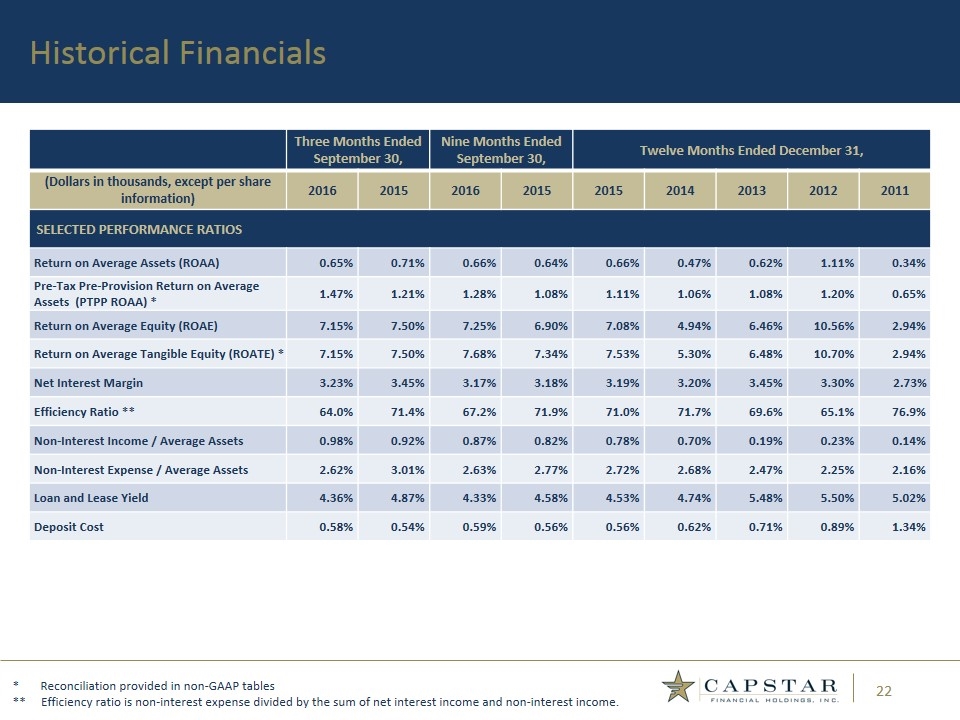
Three Months Ended September 30, Nine Months Ended September 30, Twelve Months Ended December 31, (Dollars in thousands, except per share information) 2016 2015 2016 2015 2015 2014 2013 2012 2011 SELECTED PERFORMANCE RATIOS Return on Average Assets (ROAA) 0.65% 0.71% 0.66% 0.64% 0.66% 0.47% 0.62% 1.11% 0.34% Pre-Tax Pre-Provision Return on Average Assets (PTPP ROAA) * 1.47% 1.21% 1.28% 1.08% 1.11% 1.06% 1.08% 1.20% 0.65% Return on Average Equity (ROAE) 7.15% 7.50% 7.25% 6.90% 7.08% 4.94% 6.46% 10.56% 2.94% Return on Average Tangible Equity (ROATE) * 7.15% 7.50% 7.68% 7.34% 7.53% 5.30% 6.48% 10.70% 2.94% Net Interest Margin 3.23% 3.45% 3.17% 3.18% 3.19% 3.20% 3.45% 3.30% 2.73% Efficiency Ratio ** 64.0% 71.4% 67.2% 71.9% 71.0% 71.7% 69.6% 65.1% 76.9% Non-Interest Income / Average Assets 0.98% 0.92% 0.87% 0.82% 0.78% 0.70% 0.19% 0.23% 0.14% Non-Interest Expense / Average Assets 2.62% 3.01% 2.63% 2.77% 2.72% 2.68% 2.47% 2.25% 2.16% Loan and Lease Yield 4.36% 4.87% 4.33% 4.58% 4.53% 4.74% 5.48% 5.50% 5.02% Deposit Cost 0.58% 0.54% 0.59% 0.56% 0.56% 0.62% 0.71% 0.89% 1.34% Historical Financials * Reconciliation provided in non-GAAP tables ** Efficiency ratio is non-interest expense divided by the sum of net interest income and non-interest income.
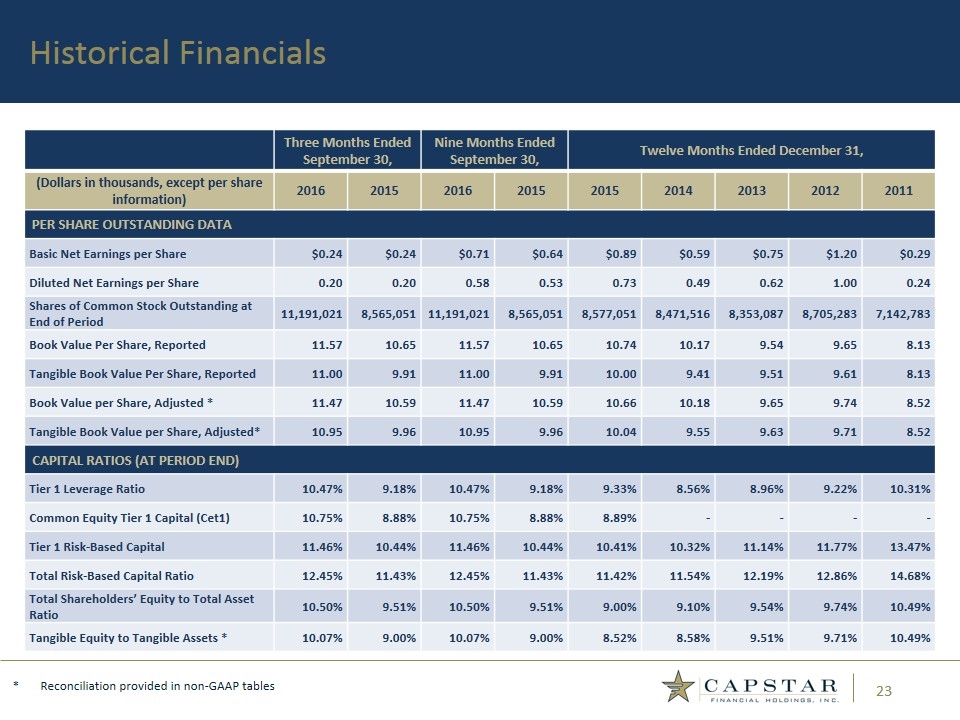
Three Months Ended September 30, Nine Months Ended September 30, Twelve Months Ended December 31, (Dollars in thousands, except per share information) 2016 2015 2016 2015 2015 2014 2013 2012 2011 PER SHARE OUTSTANDING DATA Basic Net Earnings per Share $0.24 $0.24 $0.71 $0.64 $0.89 $0.59 $0.75 $1.20 $0.29 Diluted Net Earnings per Share 0.20 0.20 0.58 0.53 0.73 0.49 0.62 1.00 0.24 Shares of Common Stock Outstanding at End of Period 11,191,021 8,565,051 11,191,021 8,565,051 8,577,051 8,471,516 8,353,087 8,705,283 7,142,783 Book Value Per Share, Reported 11.57 10.65 11.57 10.65 10.74 10.17 9.54 9.65 8.13 Tangible Book Value Per Share, Reported 11.00 9.91 11.00 9.91 10.00 9.41 9.51 9.61 8.13 Book Value per Share, Adjusted * 11.47 10.59 11.47 10.59 10.66 10.18 9.65 9.74 8.52 Tangible Book Value per Share, Adjusted* 10.95 9.96 10.95 9.96 10.04 9.55 9.63 9.71 8.52 CAPITAL RATIOS (AT PERIOD END) Tier 1 Leverage Ratio 10.47% 9.18% 10.47% 9.18% 9.33% 8.56% 8.96% 9.22% 10.31% Common Equity Tier 1 Capital (Cet1) 10.75% 8.88% 10.75% 8.88% 8.89% - - - - Tier 1 Risk-Based Capital 11.46% 10.44% 11.46% 10.44% 10.41% 10.32% 11.14% 11.77% 13.47% Total Risk-Based Capital Ratio 12.45% 11.43% 12.45% 11.43% 11.42% 11.54% 12.19% 12.86% 14.68% Total Shareholders’ Equity to Total Asset Ratio 10.50% 9.51% 10.50% 9.51% 9.00% 9.10% 9.54% 9.74% 10.49% Tangible Equity to Tangible Assets * 10.07% 9.00% 10.07% 9.00% 8.52% 8.58% 9.51% 9.71% 10.49% Historical Financials * Reconciliation provided in non-GAAP tables
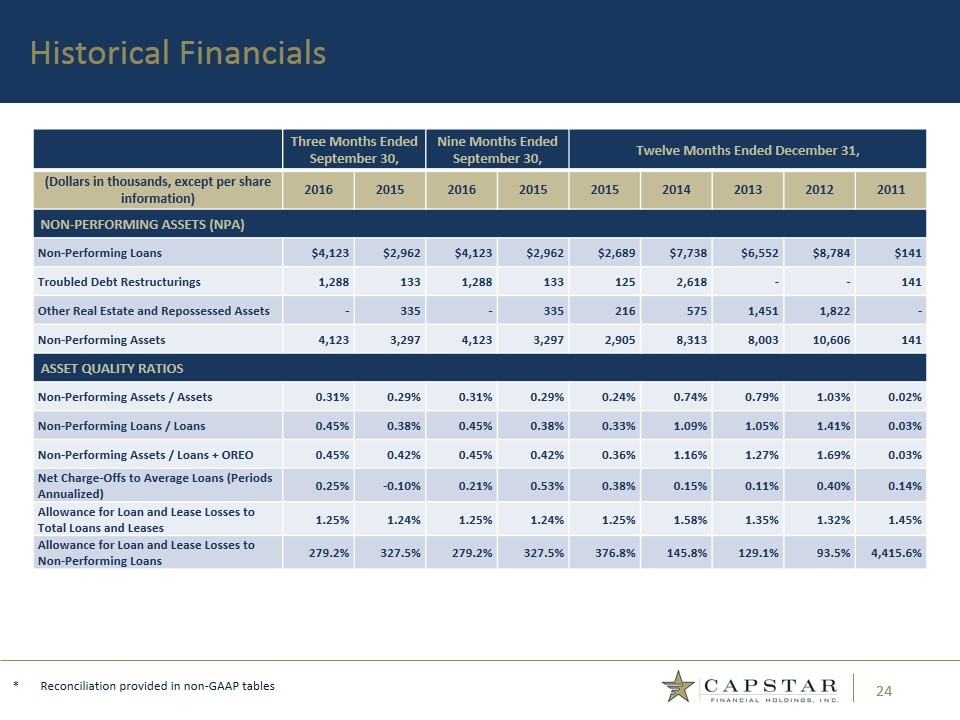
Three Months Ended September 30, Nine Months Ended September 30, Twelve Months Ended December 31, (Dollars in thousands, except per share information) 2016 2015 2016 2015 2015 2014 2013 2012 2011 NON-PERFORMING ASSETS (NPA) Non-Performing Loans $4,123 $2,962 $4,123 $2,962 $2,689 $7,738 $6,552 $8,784 $141 Troubled Debt Restructurings 1,288 133 1,288 133 125 2,618 - - 141 Other Real Estate and Repossessed Assets - 335 - 335 216 575 1,451 1,822 - Non-Performing Assets 4,123 3,297 4,123 3,297 2,905 8,313 8,003 10,606 141 ASSET QUALITY RATIOS Non-Performing Assets / Assets 0.31% 0.29% 0.31% 0.29% 0.24% 0.74% 0.79% 1.03% 0.02% Non-Performing Loans / Loans 0.45% 0.38% 0.45% 0.38% 0.33% 1.09% 1.05% 1.41% 0.03% Non-Performing Assets / Loans + OREO 0.45% 0.42% 0.45% 0.42% 0.36% 1.16% 1.27% 1.69% 0.03% Net Charge-Offs to Average Loans (Periods Annualized) 0.25% -0.10% 0.21% 0.53% 0.38% 0.15% 0.11% 0.40% 0.14% Allowance for Loan and Lease Losses to Total Loans and Leases 1.25% 1.24% 1.25% 1.24% 1.25% 1.58% 1.35% 1.32% 1.45% Allowance for Loan and Lease Losses to Non-Performing Loans 279.2% 327.5% 279.2% 327.5% 376.8% 145.8% 129.1% 93.5% 4,415.6% Historical Financials * Reconciliation provided in non-GAAP tables
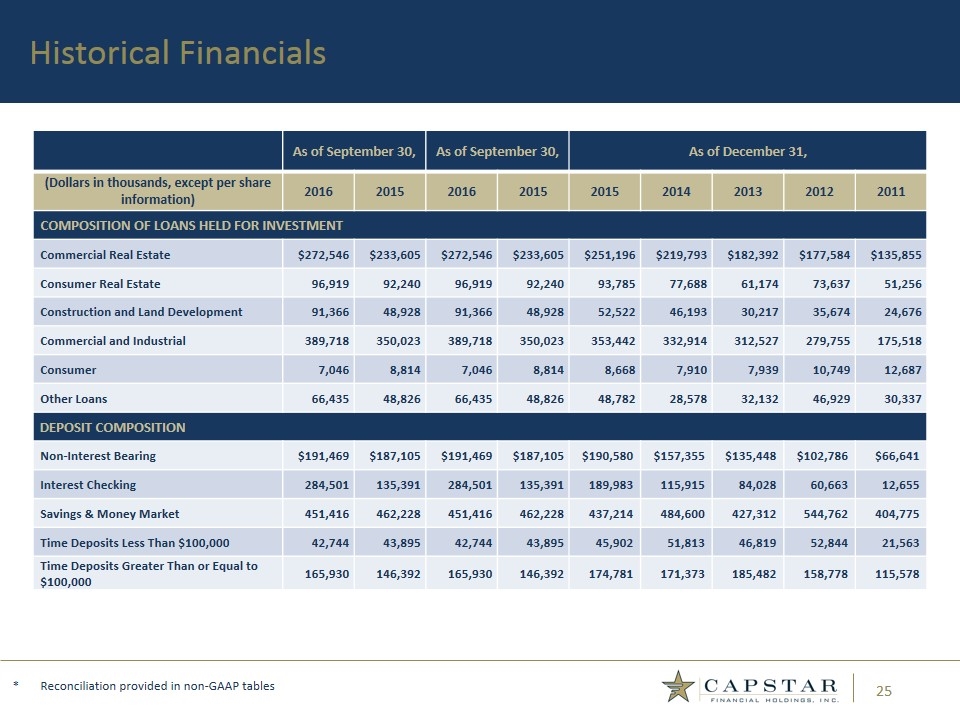
As of September 30, As of September 30, As of December 31, (Dollars in thousands, except per share information) 2016 2015 2016 2015 2015 2014 2013 2012 2011 COMPOSITION OF LOANS HELD FOR INVESTMENT Commercial Real Estate $272,546 $233,605 $272,546 $233,605 $251,196 $219,793 $182,392 $177,584 $135,855 Consumer Real Estate 96,919 92,240 96,919 92,240 93,785 77,688 61,174 73,637 51,256 Construction and Land Development 91,366 48,928 91,366 48,928 52,522 46,193 30,217 35,674 24,676 Commercial and Industrial 389,718 350,023 389,718 350,023 353,442 332,914 312,527 279,755 175,518 Consumer 7,046 8,814 7,046 8,814 8,668 7,910 7,939 10,749 12,687 Other Loans 66,435 48,826 66,435 48,826 48,782 28,578 32,132 46,929 30,337 DEPOSIT COMPOSITION Non-Interest Bearing $191,469 $187,105 $191,469 $187,105 $190,580 $157,355 $135,448 $102,786 $66,641 Interest Checking 284,501 135,391 284,501 135,391 189,983 115,915 84,028 60,663 12,655 Savings & Money Market 451,416 462,228 451,416 462,228 437,214 484,600 427,312 544,762 404,775 Time Deposits Less Than $100,000 42,744 43,895 42,744 43,895 45,902 51,813 46,819 52,844 21,563 Time Deposits Greater Than or Equal to $100,000 165,930 146,392 165,930 146,392 174,781 171,373 185,482 158,778 115,578 Historical Financials * Reconciliation provided in non-GAAP tables
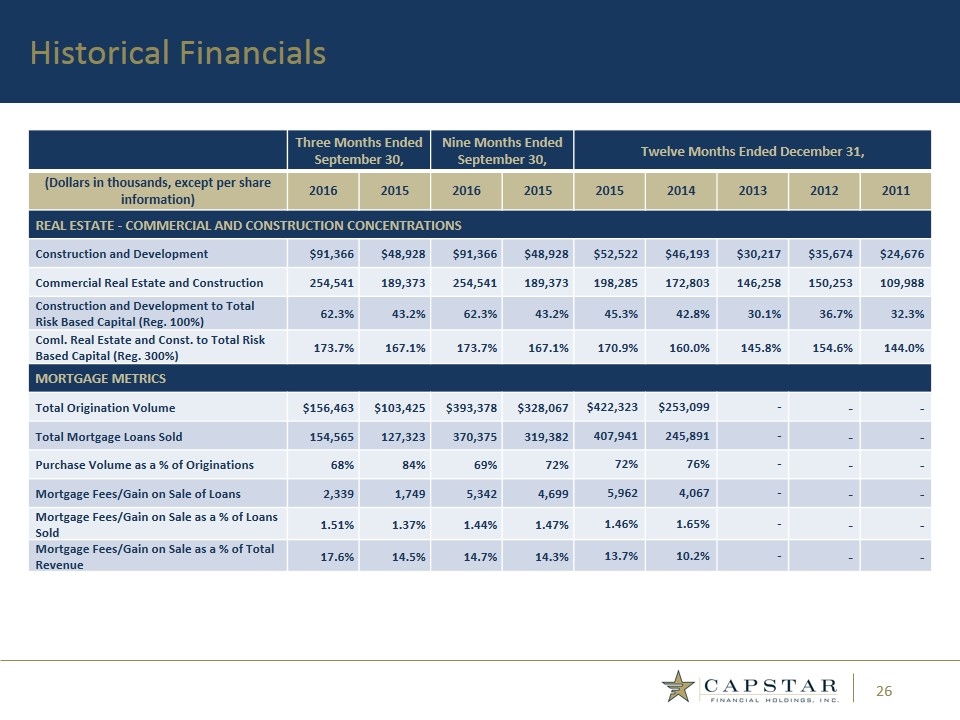
Three Months Ended September 30, Nine Months Ended September 30, Twelve Months Ended December 31, (Dollars in thousands, except per share information) 2016 2015 2016 2015 2015 2014 2013 2012 2011 REAL ESTATE - COMMERCIAL AND CONSTRUCTION CONCENTRATIONS Construction and Development $91,366 $48,928 $91,366 $48,928 $52,522 $46,193 $30,217 $35,674 $24,676 Commercial Real Estate and Construction 254,541 189,373 254,541 189,373 198,285 172,803 146,258 150,253 109,988 Construction and Development to Total Risk Based Capital (Reg. 100%) 62.3% 43.2% 62.3% 43.2% 45.3% 42.8% 30.1% 36.7% 32.3% Coml. Real Estate and Const. to Total Risk Based Capital (Reg. 300%) 173.7% 167.1% 173.7% 167.1% 170.9% 160.0% 145.8% 154.6% 144.0% MORTGAGE METRICS Total Origination Volume $156,463 $103,425 $393,378 $328,067 $422,323 $253,099 - - - Total Mortgage Loans Sold 154,565 127,323 370,375 319,382 407,941 245,891 - - - Purchase Volume as a % of Originations 68% 84% 69% 72% 72% 76% - - - Mortgage Fees/Gain on Sale of Loans 2,339 1,749 5,342 4,699 5,962 4,067 - - - Mortgage Fees/Gain on Sale as a % of Loans Sold 1.51% 1.37% 1.44% 1.47% 1.46% 1.65% - - - Mortgage Fees/Gain on Sale as a % of Total Revenue 17.6% 14.5% 14.7% 14.3% 13.7% 10.2% - - - Historical Financials
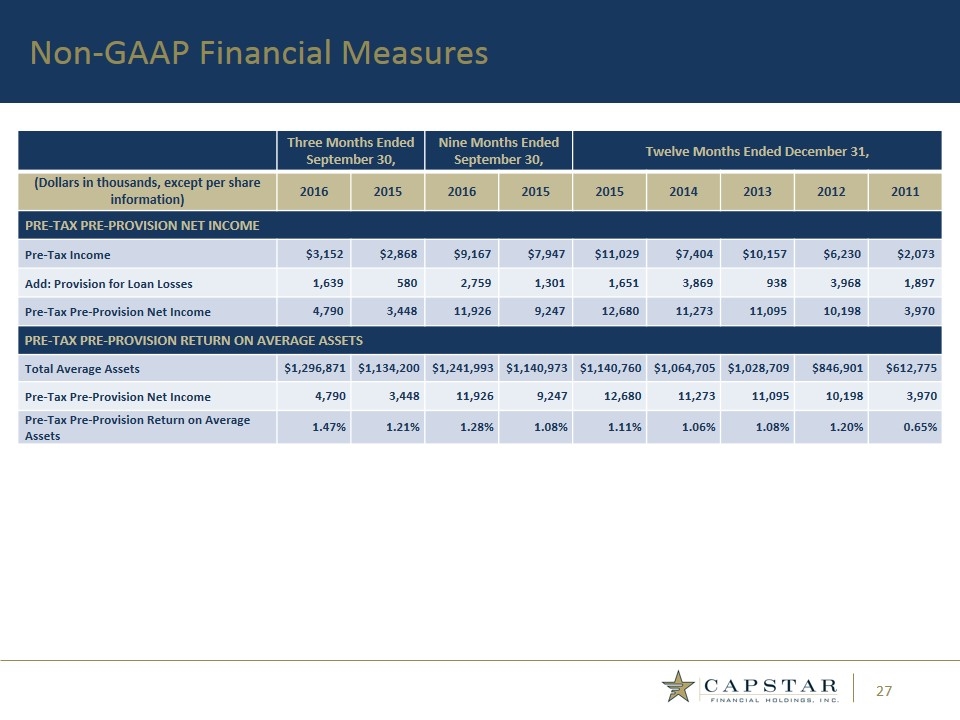
Three Months Ended September 30, Nine Months Ended September 30, Twelve Months Ended December 31, (Dollars in thousands, except per share information) 2016 2015 2016 2015 2015 2014 2013 2012 2011 PRE-TAX PRE-PROVISION NET INCOME Pre-Tax Income $3,152 $2,868 $9,167 $7,947 $11,029 $7,404 $10,157 $6,230 $2,073 Add: Provision for Loan Losses 1,639 580 2,759 1,301 1,651 3,869 938 3,968 1,897 Pre-Tax Pre-Provision Net Income 4,790 3,448 11,926 9,247 12,680 11,273 11,095 10,198 3,970 PRE-TAX PRE-PROVISION RETURN ON AVERAGE ASSETS Total Average Assets $1,296,871 $1,134,200 $1,241,993 $1,140,973 $1,140,760 $1,064,705 $1,028,709 $846,901 $612,775 Pre-Tax Pre-Provision Net Income 4,790 3,448 11,926 9,247 12,680 11,273 11,095 10,198 3,970 Pre-Tax Pre-Provision Return on Average Assets 1.47% 1.21% 1.28% 1.08% 1.11% 1.06% 1.08% 1.20% 0.65% Non-GAAP Financial Measures
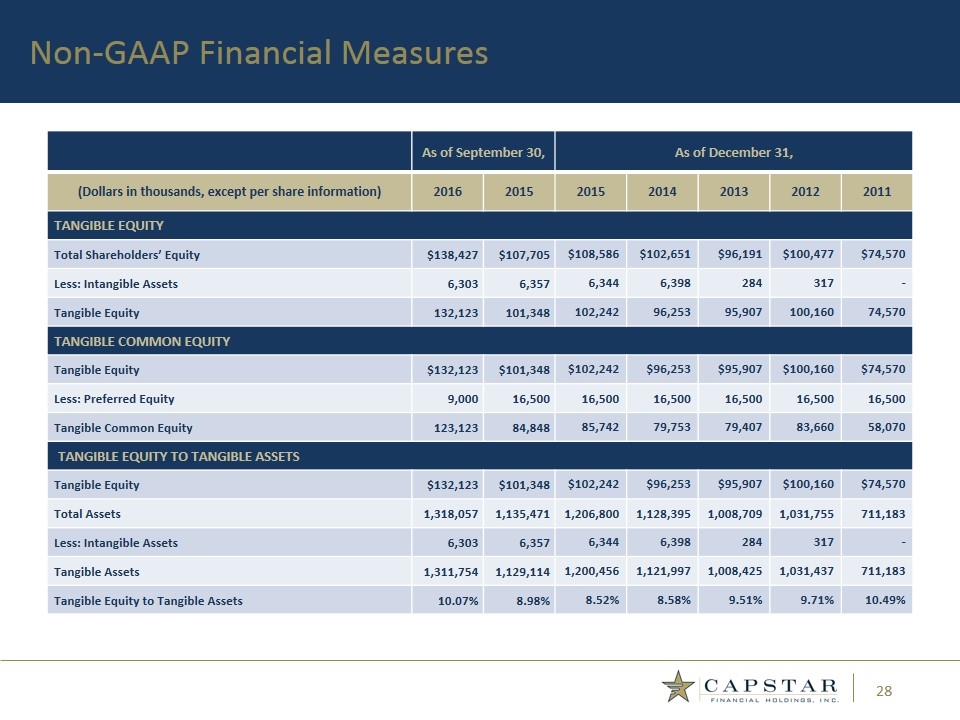
As of September 30, As of December 31, (Dollars in thousands, except per share information) 2016 2015 2015 2014 2013 2012 2011 TANGIBLE EQUITY Total Shareholders’ Equity $138,427 $107,705 $108,586 $102,651 $96,191 $100,477 $74,570 Less: Intangible Assets 6,303 6,357 6,344 6,398 284 317 - Tangible Equity 132,123 101,348 102,242 96,253 95,907 100,160 74,570 TANGIBLE COMMON EQUITY Tangible Equity $132,123 $101,348 $102,242 $96,253 $95,907 $100,160 $74,570 Less: Preferred Equity 9,000 16,500 16,500 16,500 16,500 16,500 16,500 Tangible Common Equity 123,123 84,848 85,742 79,753 79,407 83,660 58,070 TANGIBLE EQUITY TO TANGIBLE ASSETS Tangible Equity $132,123 $101,348 $102,242 $96,253 $95,907 $100,160 $74,570 Total Assets 1,318,057 1,135,471 1,206,800 1,128,395 1,008,709 1,031,755 711,183 Less: Intangible Assets 6,303 6,357 6,344 6,398 284 317 - Tangible Assets 1,311,754 1,129,114 1,200,456 1,121,997 1,008,425 1,031,437 711,183 Tangible Equity to Tangible Assets 10.07% 8.98% 8.52% 8.58% 9.51% 9.71% 10.49% Non-GAAP Financial Measures
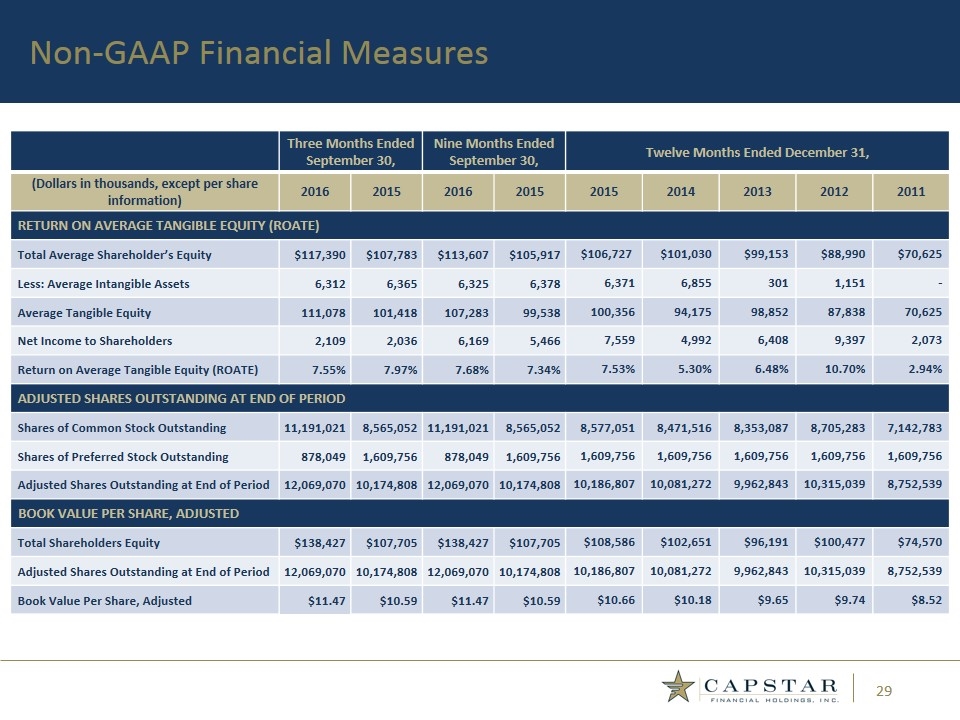
Three Months Ended September 30, Nine Months Ended September 30, Twelve Months Ended December 31, (Dollars in thousands, except per share information) 2016 2015 2016 2015 2015 2014 2013 2012 2011 RETURN ON AVERAGE TANGIBLE EQUITY (ROATE) Total Average Shareholder’s Equity $117,390 $107,783 $113,607 $105,917 $106,727 $101,030 $99,153 $88,990 $70,625 Less: Average Intangible Assets 6,312 6,365 6,325 6,378 6,371 6,855 301 1,151 - Average Tangible Equity 111,078 101,418 107,283 99,538 100,356 94,175 98,852 87,838 70,625 Net Income to Shareholders 2,109 2,036 6,169 5,466 7,559 4,992 6,408 9,397 2,073 Return on Average Tangible Equity (ROATE) 7.55% 7.97% 7.68% 7.34% 7.53% 5.30% 6.48% 10.70% 2.94% ADJUSTED SHARES OUTSTANDING AT END OF PERIOD Shares of Common Stock Outstanding 11,191,021 8,565,052 11,191,021 8,565,052 8,577,051 8,471,516 8,353,087 8,705,283 7,142,783 Shares of Preferred Stock Outstanding 878,049 1,609,756 878,049 1,609,756 1,609,756 1,609,756 1,609,756 1,609,756 1,609,756 Adjusted Shares Outstanding at End of Period 12,069,070 10,174,808 12,069,070 10,174,808 10,186,807 10,081,272 9,962,843 10,315,039 8,752,539 BOOK VALUE PER SHARE, ADJUSTED Total Shareholders Equity $138,427 $107,705 $138,427 $107,705 $108,586 $102,651 $96,191 $100,477 $74,570 Adjusted Shares Outstanding at End of Period 12,069,070 10,174,808 12,069,070 10,174,808 10,186,807 10,081,272 9,962,843 10,315,039 8,752,539 Book Value Per Share, Adjusted $11.47 $10.59 $11.47 $10.59 $10.66 $10.18 $9.65 $9.74 $8.52 Non-GAAP Financial Measures
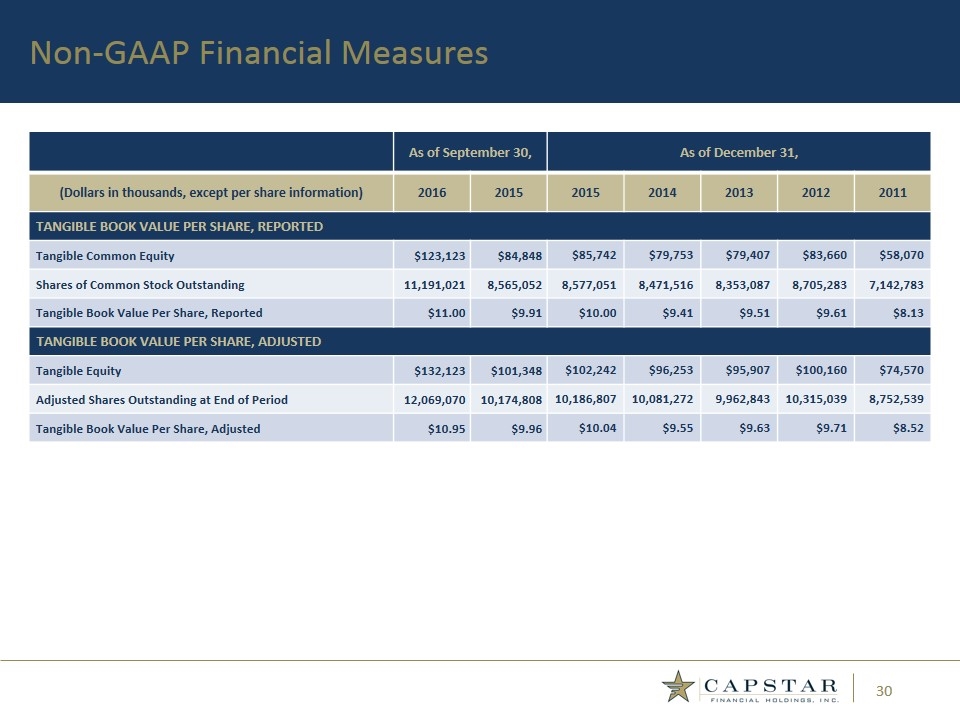
As of September 30, As of December 31, (Dollars in thousands, except per share information) 2016 2015 2015 2014 2013 2012 2011 TANGIBLE BOOK VALUE PER SHARE, REPORTED Tangible Common Equity $123,123 $84,848 $85,742 $79,753 $79,407 $83,660 $58,070 Shares of Common Stock Outstanding 11,191,021 8,565,052 8,577,051 8,471,516 8,353,087 8,705,283 7,142,783 Tangible Book Value Per Share, Reported $11.00 $9.91 $10.00 $9.41 $9.51 $9.61 $8.13 TANGIBLE BOOK VALUE PER SHARE, ADJUSTED Tangible Equity $132,123 $101,348 $102,242 $96,253 $95,907 $100,160 $74,570 Adjusted Shares Outstanding at End of Period 12,069,070 10,174,808 10,186,807 10,081,272 9,962,843 10,315,039 8,752,539 Tangible Book Value Per Share, Adjusted $10.95 $9.96 $10.04 $9.55 $9.63 $9.71 $8.52 Non-GAAP Financial Measures
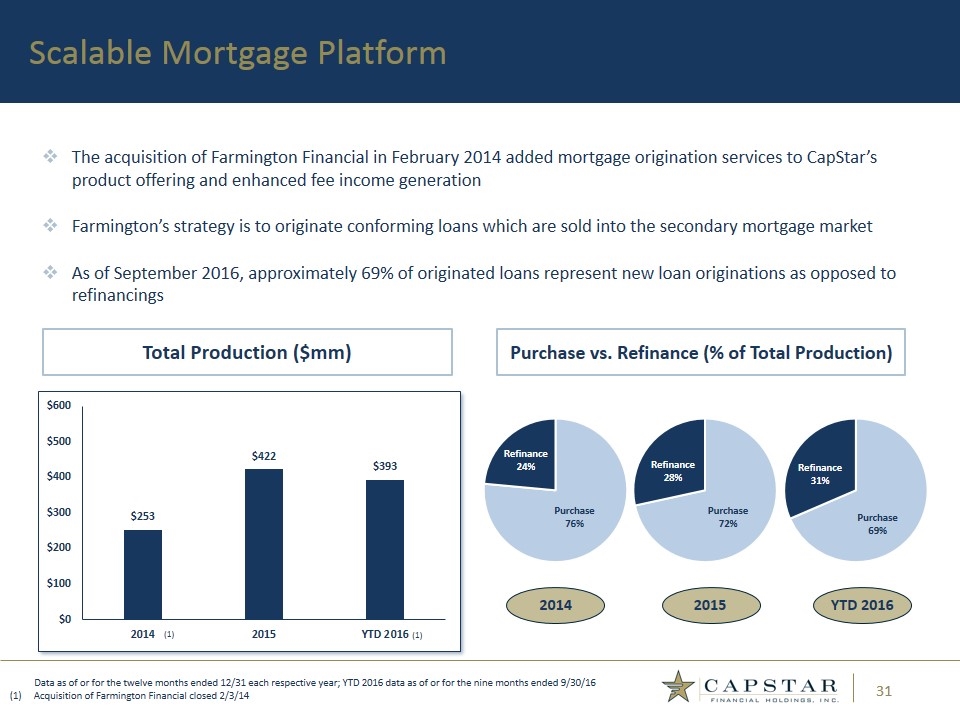
2014 Total Production ($mm) Scalable Mortgage Platform Purchase vs. Refinance (% of Total Production) Data as of or for the twelve months ended 12/31 each respective year; YTD 2016 data as of or for the nine months ended 9/30/16 Acquisition of Farmington Financial closed 2/3/14 The acquisition of Farmington Financial in February 2014 added mortgage origination services to CapStar’s product offering and enhanced fee income generation Farmington’s strategy is to originate conforming loans which are sold into the secondary mortgage market As of September 2016, approximately 69% of originated loans represent new loan originations as opposed to refinancings 2015 YTD 2016 (1)
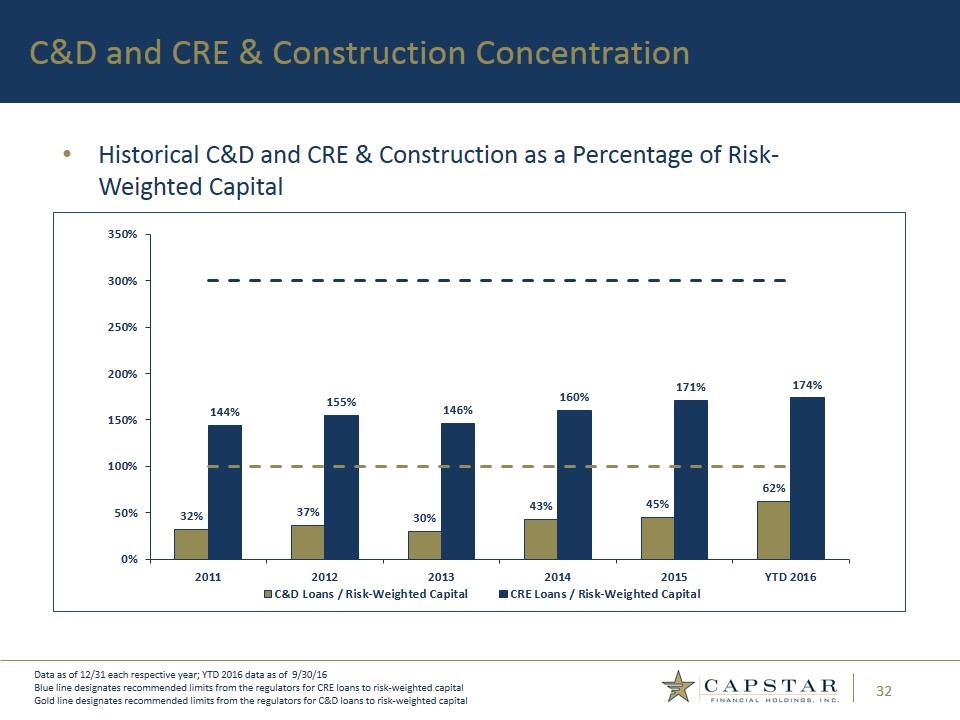
Historical C&D and CRE & Construction as a Percentage of Risk-Weighted Capital C&D and CRE & Construction Concentration Data as of 12/31 each respective year; YTD 2016 data as of 9/30/16 Blue line designates recommended limits from the regulators for CRE loans to risk-weighted capital Gold line designates recommended limits from the regulators for C&D loans to risk-weighted capital
CapStar Financial Holdings, Inc. 201 Fourth Avenue North, Suite 950 Nashville, TN 37219 (615) 732-6400 Telephone www.capstarbank.com (615) 732-6455 Email: [email protected] Contact Information Investor Relations Executive Leadership Claire W. Tucker Chief Executive Officer CapStar Financial Holdings, Inc. (615) 732-6402 Email: [email protected] Rob Anderson Chief Financial and Administrative Officer CapStar Financial Holdings, Inc. (615) 732-6470 Email: [email protected] Corporate Headquarters

Serious News for Serious Traders! Try StreetInsider.com Premium Free!
You May Also Be Interested In
- Form 8.5 (EPT/RI) - Accrol Group Holdings Plc
- Michelin: Publication of the preparatory documentation for the Annual Shareholders Meeting of May 17, 2024
- Zayo Group Appoints New CEO of Zayo Europe
Create E-mail Alert Related Categories
SEC FilingsSign up for StreetInsider Free!
Receive full access to all new and archived articles, unlimited portfolio tracking, e-mail alerts, custom newswires and RSS feeds - and more!


 Tweet
Tweet Share
Share