

Form 8-K CSX CORP For: Oct 13
 Tweet
Tweet Share
ShareUNITED STATES
SECURITIES AND EXCHANGE COMMISSION
Washington, D.C. 20549
Form 8-K
Current Report
Pursuant to Section 13 or 15(d) of
the Securities Exchange Act of 1934
Date of Report (Date of earliest event reported): October 13, 2015

CSX CORPORATION
(Exact name of registrant as specified in its charter)
Virginia
(State or other jurisdiction of
incorporation or organization)
1-8022 | 62-1051971 | |
(Commission File No.) | (I.R.S. Employer | |
Identification No.) | ||
500 Water Street, C900, Jacksonville, FL 32202
(Address of principal executive offices) (Zip Code)
Registrant's telephone number, including area code:
(904) 359-3200
Check the appropriate box below if the Form 8-K filing is intended to simultaneously satisfy the filing obligation of the registrant under any of the following provisions:
__ Written communications pursuant to Rule 425 under the Securities Act (17 CFR 230.425)
__ Soliciting material pursuant to Rule 14a-12 under the Exchange Act (17 CFR 240.14a-12)
__ Pre-commencement communications pursuant to Rule 14d-2(b) under the Exchange Act (17 CFR 240.14d-2(b))
__ Pre-commencement communications pursuant to Rule 13e-4(c) under the Exchange Act (17 CFR 240.13e-4(c))
ITEM 2.02. | RESULTS OF OPERATIONS AND FINANCIAL CONDITION |
On October 13, 2015, CSX Corporation issued a press release and its CSX Quarterly Financial Report on financial and operating results for the quarter ended September 25, 2015. A copy of the press release is attached as Exhibit 99.1 and a copy of the CSX Quarterly Financial Report is attached as Exhibit 99.2, each of which is incorporated by reference herein. These documents are available on the Company's website, www.csx.com.*
The information contained in this Current Report on Form 8-K, including Exhibits 99.1 and 99.2 hereto, has been “furnished” and shall not be deemed “filed” for purposes of Section 18 of the Securities Exchange Act of 1934, as amended, or otherwise subject to liability under that section. The information in this Current Report shall not be incorporated by reference into any filing or other document pursuant to the Securities Act of 1933, as amended, except as shall be expressly set forth by specific reference in such filing or document.
ITEM 9.01. EXHIBITS
(d) The following exhibits are being furnished herewith:
99.1 | Press Release dated October 13, 2015 from CSX Corporation |
99.2 | CSX Quarterly Financial Report. |
* | Internet addresses are provided for informational purposes only and are not intended to be hyperlinks. |
Signature
Pursuant to the requirements of the Securities and Exchange Act of 1934, the registrant has duly caused this report to be signed on its behalf by the undersigned hereunto duly authorized.
CSX CORPORATION
By: /s/ CAROLYN T. SIZEMORE
Carolyn T. Sizemore
Vice President and Controller
(Principal Accounting Officer)
Date: October 13, 2015
Exhibit 99.1

CSX Corporation Announces Record Third Quarter Financial Results
Highlights:
• | Third quarter record earnings per share of $0.52 and operating ratio of 68.3 percent |
• | Strong service performance |
• | Remain an industry leader in safety |
JACKSONVILLE, Fla. - October 13, 2015 - CSX Corporation (NYSE: CSX) today announced net earnings of $507 million for the third quarter of 2015, versus $509 million for the same period in 2014, which translates to a third quarter record $0.52 per share, compared to $0.51 in the prior year.
Revenue declined nine percent in the quarter, as gains in price were more than offset by the combination of lower fuel recovery, a three percent volume decline and continued transition in CSX’s business mix. At the same time, expenses declined 11 percent on the collective effect of continued low fuel prices, cost reductions reflecting lower volume and savings from efficiency initiatives. The resulting $933 million in operating income drove a third quarter record operating ratio of 68.3 percent.
“CSX’s third quarter results demonstrate the company’s ability to leverage improving service while controlling costs in a dynamic environment where commodity prices and the strength of the U.S. dollar are challenging many of our markets,” said Michael J. Ward, chairman and chief executive officer. “Our performance supports strong pricing and continued efficiency gains as we continue to drive value for customers and shareholders.”
CSX is still targeting its full-year expectations for earnings per share growth in the mid-single digits and meaningful margin expansion as it progresses toward its longer-term goal of a full-year operating ratio in the mid-60s. These targets remain intact despite expectations for 2015 coal revenue to decline approximately $450 million primarily due to continued low natural gas prices and high inventory levels. In that regard, the company now expects domestic coal volume to decline by more than 10 percent in 2015, while the full-year outlook for export coal volume remains approximately 30 million tons. These significant coal headwinds are now also expected to continue in 2016.
Exhibit 99.1
CSX executives will conduct a quarterly earnings conference call with the investment community on October 14, 2015, from 8:30 a.m. to 9:30 a.m. Eastern time. Investors, media and the public may listen to the conference call by dialing 1-888-EARN-CSX (888-327-6279) and asking for the CSX earnings call. Callers outside the U.S., dial 1-773-756-0199. Participants should dial in 10 minutes prior to the call. In conjunction with the call, a live webcast will be accessible and presentation materials will be posted on the company's website at http://investors.csx.com. Following the earnings call, an internet replay of the presentation will be archived on the company website.
This earnings announcement, as well as additional detailed financial information, is contained in the CSX Quarterly Financial Report available through the company’s website at http://investors.csx.com and on Form 8-K with the Securities and Exchange Commission.
About CSX and its Disclosures
CSX, based in Jacksonville, Florida, is a premier transportation company. It provides rail, intermodal and rail-to-truck transload services and solutions to customers across a broad array of markets, including energy, industrial, construction, agricultural, and consumer products. For nearly 190 years, CSX has played a critical role in the nation's economic expansion and industrial development. Its network connects every major metropolitan area in the eastern United States, where nearly two-thirds of the nation's population resides. It also links more than 240 short-line railroads and more than 70 ocean, river and lake ports with major population centers and farming towns alike.
This announcement, as well as additional financial information, is available on the company's website at http://investors.csx.com. CSX also uses social media channels to communicate information about the company. Although social media channels are not intended to be the primary method of disclosure for material information, it is possible that certain information CSX posts on social media could be deemed to be material.
Therefore, we encourage investors, the media, and others interested in the company to review the information we post on Twitter (http://twitter.com/CSX) and on Slideshare (http://www.slideshare.net/HowTomorrowMoves). The social media channels used by CSX may be updated from time to time.
More information about CSX Corporation and its subsidiaries is available at www.csx.com and on Facebook (http://www.facebook.com/OfficialCSX).
Forward-looking Statements
This information and other statements by the company may contain forward-looking statements within the meaning of the Private Securities Litigation Reform Act with respect to, among other items: projections and estimates of earnings, revenues, margins, volumes, rates, cost-savings, expenses, taxes, liquidity, capital expenditures, dividends, share repurchases or other financial items, statements of management's plans, strategies and objectives for future operations, and management's expectations as to future performance and operations and the time by which objectives will be achieved, statements concerning proposed new services, and statements regarding future economic, industry or market conditions or performance. Forward-looking statements are typically identified by words or phrases such as “will,” “should,” “believe,” “expect,” “anticipate,” “project,” “estimate,” “preliminary” and similar expressions. Forward-looking statements speak only as of the date they are made, and the company undertakes no obligation to update or revise any forward-looking statement. If the company updates any forward-looking statement, no inference should be drawn that the company will make additional updates with respect to that statement or any other forward-looking statements.
Forward-looking statements are subject to a number of risks and uncertainties, and actual performance or results could differ materially from that anticipated by any forward-looking statements. Factors that may cause actual results to differ materially from those contemplated by any forward- looking statements include, among others; (i) the company's success in implementing its financial and operational initiatives; (ii) changes in domestic or international economic, political or business conditions, including those affecting the transportation industry (such as the impact of industry competition, conditions, performance and consolidation); (iii) legislative or regulatory changes; (iv) the inherent business risks associated with safety and security; (v) the outcome of claims and litigation involving or affecting the company; (vi) natural events such as severe weather conditions or pandemic health crises; and (vii) the inherent uncertainty associated with projecting economic and business conditions.
Other important assumptions and factors that could cause actual results to differ materially from those in the forward-looking statements are specified in the company's SEC reports, accessible on the SEC's website at www.sec.gov and the company's website at www.csx.com.
Exhibit 99.2

CSX Corporation Announces Record Third Quarter Financial Results
Highlights:
• | Third quarter record earnings per share of $0.52 and operating ratio of 68.3 percent |
• | Strong service performance |
• | Remain an industry leader in safety |
JACKSONVILLE, Fla. - October 13, 2015 - CSX Corporation (NYSE: CSX) today announced net earnings of $507 million for the third quarter of 2015, versus $509 million for the same period in 2014, which translates to a third quarter record $0.52 per share, compared to $0.51 in the prior year.
Revenue declined nine percent in the quarter, as gains in price were more than offset by the combination of lower fuel recovery, a three percent volume decline and continued transition in CSX’s business mix. At the same time, expenses declined 11 percent on the collective effect of continued low fuel prices, cost reductions reflecting lower volume and savings from efficiency initiatives. The resulting $933 million in operating income drove a third quarter record operating ratio of 68.3 percent.
“CSX’s third quarter results demonstrate the company’s ability to leverage improving service while controlling costs in a dynamic environment where commodity prices and the strength of the U.S. dollar are challenging many of our markets,” said Michael J. Ward, chairman and chief executive officer. “Our performance supports strong pricing and continued efficiency gains as we continue to drive value for customers and shareholders.”
CSX is still targeting its full-year expectations for earnings per share growth in the mid-single digits and meaningful margin expansion as it progresses toward its longer-term goal of a full-year operating ratio in the mid-60s. These targets remain intact despite expectations for 2015 coal revenue to decline approximately $450 million primarily due to continued low natural gas prices and high inventory levels. In that regard, the company now expects domestic coal volume to decline by more than 10 percent in 2015, while the full-year outlook for export coal volume remains approximately 30 million tons. These significant coal headwinds are now also expected to continue in 2016.
CSX executives will conduct a quarterly earnings conference call with the investment community on October 14, 2015, from 8:30 a.m. to 9:30 a.m. Eastern time. Investors, media and the public may listen to the conference call by dialing 1-888-EARN-CSX (888-327-6279) and asking for the CSX earnings call. Callers outside the U.S., dial 1-773-756-0199. Participants should dial in 10 minutes prior to the call. In conjunction with the call, a live webcast will be accessible and presentation materials will be posted on the company's website at http://investors.csx.com. Following the earnings call, an internet replay of the presentation will be archived on the company website.
This earnings announcement, as well as additional detailed financial information, is contained in the CSX Quarterly Financial Report available through the company’s website at http://investors.csx.com and on Form 8-K with the Securities and Exchange Commission.
Table of Contents | The accompanying unaudited | CSX CORPORATION | CONTACTS: |
financial information should be | 500 Water Street, C900 | ||
read in conjunction with the | Jacksonville, FL 32202 | INVESTOR RELATIONS | |
Company’s most recent | www.csx.com | David Baggs | |
Annual Report on Form 10-K, | (904) 359-4812 | ||
Quarterly Reports on Form | MEDIA | ||
10-Q, and any Current | Melanie Cost | ||
Reports on Form 8-K. | (904) 359-1702 | ||
1
About CSX and its Disclosures
CSX, based in Jacksonville, Florida, is a premier transportation company. It provides rail, intermodal and rail-to-truck transload services and solutions to customers across a broad array of markets, including energy, industrial, construction, agricultural, and consumer products. For nearly 190 years, CSX has played a critical role in the nation's economic expansion and industrial development. Its network connects every major metropolitan area in the eastern United States, where nearly two-thirds of the nation's population resides. It also links more than 240 short-line railroads and more than 70 ocean, river and lake ports with major population centers and farming towns alike.
This announcement, as well as additional financial information, is available on the company's website at http://investors.csx.com. CSX also uses social media channels to communicate information about the company. Although social media channels are not intended to be the primary method of disclosure for material information, it is possible that certain information CSX posts on social media could be deemed to be material.
Therefore, we encourage investors, the media, and others interested in the company to review the information we post on Twitter (http://twitter.com/CSX) and on Slideshare (http://www.slideshare.net/HowTomorrowMoves). The social media channels used by CSX may be updated from time to time.
More information about CSX Corporation and its subsidiaries is available at www.csx.com and on Facebook (http://www.facebook.com/OfficialCSX).
Forward-looking Statements
This information and other statements by the company may contain forward-looking statements within the meaning of the Private Securities Litigation Reform Act with respect to, among other items: projections and estimates of earnings, revenues, margins, volumes, rates, cost-savings, expenses, taxes, liquidity, capital expenditures, dividends, share repurchases or other financial items, statements of management's plans, strategies and objectives for future operations, and management's expectations as to future performance and operations and the time by which objectives will be achieved, statements concerning proposed new services, and statements regarding future economic, industry or market conditions or performance. Forward-looking statements are typically identified by words or phrases such as “will,” “should,” “believe,” “expect,” “anticipate,” “project,” “estimate,” “preliminary” and similar expressions. Forward-looking statements speak only as of the date they are made, and the company undertakes no obligation to update or revise any forward-looking statement. If the company updates any forward-looking statement, no inference should be drawn that the company will make additional updates with respect to that statement or any other forward-looking statements.
Forward-looking statements are subject to a number of risks and uncertainties, and actual performance or results could differ materially from that anticipated by any forward-looking statements. Factors that may cause actual results to differ materially from those contemplated by any forward- looking statements include, among others; (i) the company's success in implementing its financial and operational initiatives; (ii) changes in domestic or international economic, political or business conditions, including those affecting the transportation industry (such as the impact of industry competition, conditions, performance and consolidation); (iii) legislative or regulatory changes; (iv) the inherent business risks associated with safety and security; (v) the outcome of claims and litigation involving or affecting the company; (vi) natural events such as severe weather conditions or pandemic health crises; and (vii) the inherent uncertainty associated with projecting economic and business conditions.
Other important assumptions and factors that could cause actual results to differ materially from those in the forward-looking statements are specified in the company's SEC reports, accessible on the SEC's website at www.sec.gov and the company's website at www.csx.com.
2
CSX Corporation
CONSOLIDATED INCOME STATEMENTS (Unaudited)
(Dollars in millions, except per share amounts)
Quarters Ended | Nine Months Ended | ||||||||||||||||||||||
Sep. 25, 2015 | Sep. 26, 2014 | $ Change | % Change | Sep. 25, 2015 | Sep. 26, 2014 | $ Change | % Change | ||||||||||||||||
Revenue | $ | 2,939 | $ | 3,221 | $ | (282 | ) | (9 | )% | $ | 9,030 | $ | 9,477 | $ | (447 | ) | (5 | )% | |||||
Expense | |||||||||||||||||||||||
Labor and Fringe | 787 | 845 | 58 | 7 | 2,491 | 2,468 | (23 | ) | (1 | ) | |||||||||||||
Materials, Supplies and Other | 580 | 610 | 30 | 5 | 1,766 | 1,860 | 94 | 5 | |||||||||||||||
Fuel | 223 | 393 | 170 | 43 | 756 | 1,255 | 499 | 40 | |||||||||||||||
Depreciation | 302 | 291 | (11 | ) | (4 | ) | 896 | 861 | (35 | ) | (4 | ) | |||||||||||
Equipment and Other Rents | 114 | 106 | (8 | ) | (8 | ) | 328 | 321 | (7 | ) | (2 | ) | |||||||||||
Total Expense | 2,006 | 2,245 | 239 | 11 | 6,237 | 6,765 | 528 | 8 | |||||||||||||||
Operating Income | 933 | 976 | (43 | ) | (4 | ) | 2,793 | 2,712 | 81 | 3 | |||||||||||||
Interest Expense | (136 | ) | (137 | ) | 1 | 1 | (404 | ) | (412 | ) | 8 | 2 | |||||||||||
Other Income (Expense) - Net (a) | 2 | (26 | ) | 28 | 108 | 8 | (31 | ) | 39 | 126 | |||||||||||||
Earnings Before Income Taxes | 799 | 813 | (14 | ) | (2 | ) | 2,397 | 2,269 | 128 | 6 | |||||||||||||
Income Tax Expense | (292 | ) | (304 | ) | 12 | 4 | (895 | ) | (833 | ) | (62 | ) | (7 | ) | |||||||||
Net Earnings | $ | 507 | $ | 509 | $ | (2 | ) | — | % | $ | 1,502 | $ | 1,436 | $ | 66 | 5 | % | ||||||
Operating Ratio | 68.3 | % | 69.7 | % | 69.1 | % | 71.4 | % | |||||||||||||||
Per Common Share | |||||||||||||||||||||||
Net Earnings Per Share, Assuming Dilution | $ | 0.52 | $ | 0.51 | $ | 0.01 | 2 | % | $ | 1.52 | $ | 1.43 | $ | 0.09 | 6 | % | |||||||
Average Shares Outstanding, Assuming Dilution (millions) | 982 | 999 | 987 | 1,004 | |||||||||||||||||||
Cash Dividends Paid Per Common Share | $ | 0.18 | $ | 0.16 | $ | 0.52 | $ | 0.47 | |||||||||||||||
3
CSX Corporation
CONDENSED CONSOLIDATED BALANCE SHEETS
(Dollars in millions)
(Unaudited) | ||||||
Sep. 25, 2015 | Dec. 26, 2014 | |||||
ASSETS | ||||||
Cash and Cash Equivalents | $ | 541 | $ | 669 | ||
Short-term Investments | 425 | 292 | ||||
Other Current Assets | 1,536 | 1,611 | ||||
Properties - Net | 29,637 | 28,584 | ||||
Investment in Affiliates and Other Companies | 1,376 | 1,356 | ||||
Other Long-term Assets | 500 | 541 | ||||
Total Assets | $ | 34,015 | $ | 33,053 | ||
LIABILITIES AND SHAREHOLDERS' EQUITY | ||||||
Current Maturities of Long-term Debt | $ | 18 | $ | 228 | ||
Other Current Liabilities | 1,904 | 1,879 | ||||
Long-term Debt | 10,088 | 9,514 | ||||
Deferred Income Taxes | 8,957 | 8,858 | ||||
Other Long-term Liabilities | 1,388 | 1,398 | ||||
Total Liabilities | 22,355 | 21,877 | ||||
Total Shareholders' Equity | 11,660 | 11,176 | ||||
Total Liabilities and Shareholders' Equity | $ | 34,015 | $ | 33,053 | ||
4
CSX Corporation
CONDENSED CONSOLIDATED CASH FLOW STATEMENTS (Unaudited)
(Dollars in millions)
Nine Months Ended | ||||||
Sep. 25, 2015 | Sep. 26, 2014 | |||||
OPERATING ACTIVITIES | ||||||
Net Earnings | $ | 1,502 | $ | 1,436 | ||
Depreciation | 896 | 861 | ||||
Deferred Income Taxes | 82 | 90 | ||||
Gains on Property Dispositions | (20 | ) | (5 | ) | ||
Other Operating Activities - Net | 52 | (80 | ) | |||
Net Cash Provided by Operating Activities | 2,512 | 2,302 | ||||
INVESTING ACTIVITIES | ||||||
Property Additions | (1,909 | ) | (1,557 | ) | ||
Purchase of Short-term Investments | (1,170 | ) | (1,170 | ) | ||
Proceeds from Sales of Short-term Investments | 1,040 | 1,102 | ||||
Other Investing Activities | 88 | 5 | ||||
Net Cash Used in Investing Activities | (1,951 | ) | (1,620 | ) | ||
FINANCING ACTIVITIES | ||||||
Long-term Debt Issued | 600 | 1,000 | ||||
Long-term Debt Repaid | (228 | ) | (932 | ) | ||
Dividends Paid | (512 | ) | (470 | ) | ||
Shares Repurchased (b) | (546 | ) | (388 | ) | ||
Other Financing Activities - Net | (3 | ) | (5 | ) | ||
Net Cash Used in Financing Activities | (689 | ) | (795 | ) | ||
Net Decrease in Cash and Cash Equivalents | (128 | ) | (113 | ) | ||
CASH AND CASH EQUIVALENTS | ||||||
Cash and Cash Equivalents at Beginning of Period | 669 | 592 | ||||
Cash and Cash Equivalents at End of Period | $ | 541 | $ | 479 | ||
5
CSX Corporation
NOTES TO CONSOLIDATED FINANCIAL STATEMENTS (Unaudited)
Income Statement
a) | Other Income (Expense) - Net: Other income increased $28 million primarily as a result of a prior year early redemption of long-term debt, which resulted in $16 million of associated costs, as well as an environmental cleanup cost of $13 million related to non-operating activities that did not repeat in the current quarter. |
Cash Flow Statement
b) | Shares repurchased: During the third quarter and nine months ended of 2015 and 2014, the Company repurchased the following number of shares: |
Quarters Ended | Nine Months Ended | ||||||||||||
Sep. 25, 2015 | Sep. 26, 2014 | Sep. 25, 2015 | Sep. 26, 2014 | ||||||||||
Shares Repurchased (Millions) | 9 | 4 | 17 | 13 | |||||||||
Cost of Shares (Dollars in millions) | $ | 262 | $ | 131 | $ | 546 | $ | 388 | |||||
6
CSX Corporation
VOLUME AND REVENUE (Unaudited) | |||||||||||||||||||||||||||
Volume (Thousands of units); Revenue (Dollars in millions); Revenue Per Unit (Dollars) | |||||||||||||||||||||||||||
Quarters Ended September 25, 2015 and September 26, 2014 | |||||||||||||||||||||||||||
Volume | Revenue | Revenue Per Unit | |||||||||||||||||||||||||
2015 | 2014 | % Change | 2015 | 2014 | % Change | 2015 | 2014 | % Change | |||||||||||||||||||
Agricultural | |||||||||||||||||||||||||||
Agricultural Products | 98 | 98 | — | % | $ | 257 | $ | 260 | (1 | )% | $ | 2,622 | $ | 2,653 | (1 | )% | |||||||||||
Phosphates and Fertilizers | 71 | 82 | (13 | ) | 111 | 127 | (13 | ) | 1,563 | 1,549 | 1 | ||||||||||||||||
Food and Consumer | 23 | 23 | — | 64 | 64 | — | 2,783 | 2,783 | — | ||||||||||||||||||
Industrial | |||||||||||||||||||||||||||
Chemicals | 159 | 159 | — | 529 | 558 | (5 | ) | 3,327 | 3,509 | (5 | ) | ||||||||||||||||
Automotive | 109 | 109 | — | 287 | 305 | (6 | ) | 2,633 | 2,798 | (6 | ) | ||||||||||||||||
Metals | 60 | 71 | (15 | ) | 155 | 183 | (15 | ) | 2,583 | 2,577 | — | ||||||||||||||||
Housing and Construction | |||||||||||||||||||||||||||
Forest Products | 73 | 77 | (5 | ) | 203 | 209 | (3 | ) | 2,781 | 2,714 | 2 | ||||||||||||||||
Minerals | 88 | 83 | 6 | 128 | 127 | 1 | 1,455 | 1,530 | (5 | ) | |||||||||||||||||
Waste and Equipment | 39 | 46 | (15 | ) | 85 | 94 | (10 | ) | 2,179 | 2,043 | 7 | ||||||||||||||||
Total Merchandise | 720 | 748 | (4 | ) | 1,819 | 1,927 | (6 | ) | 2,526 | 2,576 | (2 | ) | |||||||||||||||
Coal | 261 | 319 | (18 | ) | 583 | 721 | (19 | ) | 2,234 | 2,260 | (1 | ) | |||||||||||||||
Intermodal | 731 | 691 | 6 | 451 | 455 | (1 | ) | 617 | 658 | (6 | ) | ||||||||||||||||
Other | — | — | — | 86 | 118 | (27 | ) | — | — | — | |||||||||||||||||
Total | 1,712 | 1,758 | (3 | )% | $ | 2,939 | $ | 3,221 | (9 | )% | $ | 1,717 | $ | 1,832 | (6 | )% | |||||||||||
Nine Months Ended September 25, 2015 and September 26, 2014 | |||||||||||||||||||||||||||
Volume | Revenue | Revenue Per Unit | |||||||||||||||||||||||||
2015 | 2014 | % Change | 2015 | 2014 | % Change | 2015 | 2014 | % Change | |||||||||||||||||||
Agricultural | |||||||||||||||||||||||||||
Agricultural Products | 308 | 309 | — | % | $ | 814 | $ | 829 | (2 | )% | $ | 2,643 | $ | 2,683 | (1 | )% | |||||||||||
Phosphates and Fertilizers | 227 | 251 | (10 | ) | 369 | 404 | (9 | ) | 1,626 | 1,610 | 1 | ||||||||||||||||
Food and Consumer | 70 | 71 | (1 | ) | 196 | 199 | (2 | ) | 2,800 | 2,803 | — | ||||||||||||||||
Industrial | |||||||||||||||||||||||||||
Chemicals | 472 | 462 | 2 | 1,593 | 1,630 | (2 | ) | 3,375 | 3,528 | (4 | ) | ||||||||||||||||
Automotive | 330 | 321 | 3 | 867 | 901 | (4 | ) | 2,627 | 2,807 | (6 | ) | ||||||||||||||||
Metals | 182 | 210 | (13 | ) | 465 | 532 | (13 | ) | 2,555 | 2,533 | 1 | ||||||||||||||||
Housing and Construction | |||||||||||||||||||||||||||
Forest Products | 220 | 230 | (4 | ) | 603 | 613 | (2 | ) | 2,741 | 2,665 | 3 | ||||||||||||||||
Minerals | 232 | 217 | 7 | 354 | 345 | 3 | 1,526 | 1,590 | (4 | ) | |||||||||||||||||
Waste and Equipment | 111 | 117 | (5 | ) | 225 | 232 | (3 | ) | 2,027 | 1,983 | 2 | ||||||||||||||||
Total Merchandise | 2,152 | 2,188 | (2 | ) | 5,486 | 5,685 | (4 | ) | 2,549 | 2,598 | (2 | ) | |||||||||||||||
Coal | 845 | 942 | (10 | ) | 1,851 | 2,127 | (13 | ) | 2,191 | 2,258 | (3 | ) | |||||||||||||||
Intermodal | 2,109 | 2,029 | 4 | 1,316 | 1,325 | (1 | ) | 624 | 653 | (4 | ) | ||||||||||||||||
Other | — | — | — | 377 | 340 | 11 | — | — | — | ||||||||||||||||||
Total | 5,106 | 5,159 | (1 | )% | $ | 9,030 | $ | 9,477 | (5 | )% | $ | 1,769 | $ | 1,837 | (4 | )% | |||||||||||
7
CSX Corporation
VOLUME AND REVENUE
Revenue was down by $282 million to $2.9 billion from the prior year's third quarter due to $175 million lower fuel surcharge revenue and volume declines, partially offset by pricing gains.
Same Store Sales Pricing Year-Over-Year Change | |||
% Change | |||
All-In | 4.6 | % | |
Merchandise and Intermodal | 4.4 | % | |
Same store sales is defined as shipments with the same customer, commodity and car type, and the same origin and destination.
Revenue per unit was down 6% as pricing gains in the quarter were more than offset by negative mix and lower fuel recoveries. Same store sales increased across all major markets. Coal pricing in the quarter was positively impacted by the fixed/variable contract structure, as a result of declining volume on those contracts.
MERCHANDISE
Agricultural Sector
Volume (Thousands of units); Revenue (Dollars in millions); Revenue Per Unit (Dollars) | |||||||||||||||||||||||||
Volume | Revenue | Revenue Per Unit | |||||||||||||||||||||||
2015 | 2014 | % Change | 2015 | 2014 | % Change | 2015 | 2014 | % Change | |||||||||||||||||
192 | 203 | (5 | ) | $ | 432 | $ | 451 | (4 | ) | $ | 2,250 | $ | 2,222 | 1 | |||||||||||
% of Carloads
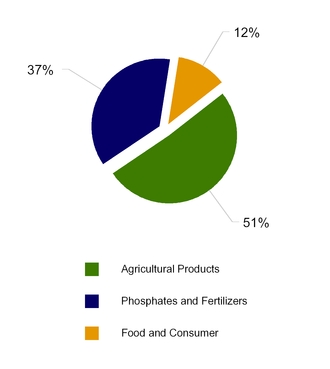
Agricultural Products - Volume was flat, with growth led by feed grain and domestic soybean moves closing out last year’s record harvest. This growth was offset by ethanol declines as a result of oversupply and import sourcing.
Phosphates and Fertilizers - As a result of low corn prices, fertilizer demand remained weak, resulting in 13% lower volume.
Food and Consumer - Volume was flat, as weakness in canned goods was offset by strength in rice and beans, reflecting changing consumer preferences.
8
CSX Corporation
Industrial Sector
Volume (Thousands of units); Revenue (Dollars in millions); Revenue Per Unit (Dollars) | ||||||||||||||||||||||||||
Volume | Revenue | Revenue Per Unit | ||||||||||||||||||||||||
2015 | 2014 | % Change | 2015 | 2014 | % Change | 2015 | 2014 | % Change | ||||||||||||||||||
328 | 339 | (3 | ) | $ | 971 | $ | 1,046 | (7 | ) | $ | 2,960 | $ | 3,086 | (4 | ) | |||||||||||
% of Carloads
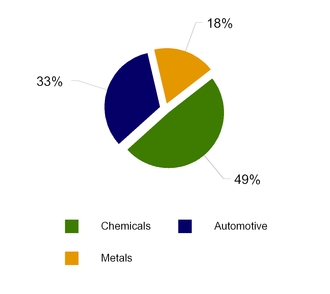
Chemicals - Volume was flat as growth from new business and strong gains in LPG were offset by the slowdown in crude oil and frac sand due to reduced drilling activity.
Automotive - Volume was flat, as North American light vehicle production generated growth, particularly in trucks and SUVs, reflecting recent purchase trends. This growth was offset by the cycling of shorter summer shutdowns in 2014, as compared to the more typical seasonal shutdown this year.
Metals - High levels of steel imports, due to strength of the U.S. dollar, led to lower domestic steel production, in turn lowering rail volumes by 15%.
Housing and Construction Sector
Volume (Thousands of units); Revenue (Dollars in millions); Revenue Per Unit (Dollars) | ||||||||||||||||||||||||||
Volume | Revenue | Revenue Per Unit | ||||||||||||||||||||||||
2015 | 2014 | % Change | 2015 | 2014 | % Change | 2015 | 2014 | % Change | ||||||||||||||||||
200 | 206 | (3 | ) | $ | 416 | $ | 430 | (3 | ) | $ | 2,080 | $ | 2,087 | — | ||||||||||||
% of Carloads

Forest Products - Volume declined due to excess supply in the housing materials market and continued softening demand for printing paper.
Minerals - Growth reflects strength in aggregates (which includes crushed stone, sand and gravel) from increased infrastructure development activity in Florida and the Mid-Atlantic region.
Waste and Equipment - Volume declined due to the cycling of an industrial waste project and reduced military vehicle shipments as military activity is moderating.
9
CSX Corporation
COAL
Volume (Thousands of units); Revenue (Dollars in millions); Revenue Per Unit (Dollars) | ||||||||||||||||||||||||||
Volume | Revenue | Revenue Per Unit | ||||||||||||||||||||||||
2015 | 2014 | % Change | 2015 | 2014 | % Change | 2015 | 2014 | % Change | ||||||||||||||||||
261 | 319 | (18 | ) | $ | 583 | $ | 721 | (19 | ) | $ | 2,234 | $ | 2,260 | (1 | ) | |||||||||||
% of Tons

Domestic Utility Coal - Volume declined as a result of mild weather, high stockpiles and low natural gas prices favoring natural gas power generation. Domestic Utility tonnage was down 16%.
Domestic Coke, Iron Ore and Other - Declines in the coke and industrial markets reflect the weak metal and coal environment. The volume decrease was partially offset by gains with a new customer in the iron ore segment. Tonnage was down 11%.
Export Coal - Reductions in both metallurgical and thermal coal volume resulted from ongoing weak market conditions due to global oversupply and the strength of the U.S. dollar. Export tonnage declined 24%.
Quarters Ended | Nine Months Ended | |||||||||||||
Sep. 25, 2015 | Sep. 26, 2014 | % Change | Sep. 25, 2015 | Sep. 26, 2014 | % Change | |||||||||
(Millions of Tons) | ||||||||||||||
Domestic | ||||||||||||||
Utility | 16.8 | 20.1 | (16 | )% | 52.6 | 58.8 | (11 | )% | ||||||
Coke, Iron Ore and Other | 6.5 | 7.3 | (11 | ) | 18.9 | 18.3 | 3 | |||||||
Total Domestic | 23.3 | 27.4 | (15 | ) | 71.5 | 77.1 | (7 | ) | ||||||
Export | ||||||||||||||
Metallurgical | 4.3 | 5.5 | (22 | ) | 15.3 | 17.5 | (13 | ) | ||||||
Thermal | 2.3 | 3.2 | (28 | ) | 9.5 | 12.0 | (21 | ) | ||||||
Total Export | 6.6 | 8.7 | (24 | ) | 24.8 | 29.5 | (16 | ) | ||||||
Total Coal | 29.9 | 36.1 | (17 | )% | 96.3 | 106.6 | (10 | )% | ||||||
10
CSX Corporation
INTERMODAL
Volume (Thousands of units); Revenue (Dollars in millions); Revenue Per Unit (Dollars) | |||||||||||||||||||||||||
Volume | Revenue | Revenue Per Unit | |||||||||||||||||||||||
2015 | 2014 | % Change | 2015 | 2014 | % Change | 2015 | 2014 | % Change | |||||||||||||||||
731 | 691 | 6 | $ | 451 | $ | 455 | (1 | ) | $ | 617 | $ | 658 | (6 | ) | |||||||||||
% of Units
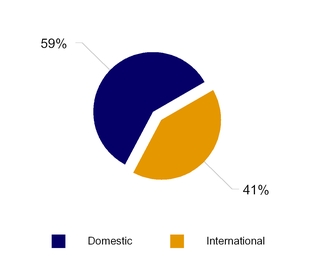
Domestic - Domestic volume increased 15%, driven by customer growth, continued success with CSX’s highway-to-rail (H2R) conversion program and new service offerings.
International - International volume declined 5%, as strength in shipments moving to inland destinations was more than offset by competitive losses.
Intermodal Network


11
CSX Corporation
OTHER REVENUE
Other revenue decreased $32 million versus prior year primarily due to an adjustment to reserves related to volume-based refunds as well as a decline in revenue recognized from customers who did not meet minimum contractual volumes.
FUEL SURCHARGE
Fuel surcharge revenue is included in the individual markets detailed within the volume and revenue explanations above. Fuel lag is the difference between highway diesel prices in the quarter and the prices used for fuel surcharge, which are generally on a two month lag.
Quarters Ended | Nine Months Ended | ||||||||||||||||||
(Dollars in millions) | Sep. 25, 2015 | Sep. 26, 2014 | $ Change | Sep. 25, 2015 | Sep. 26, 2014 | $ Change | |||||||||||||
Fuel Surcharge Revenue | $ | 128 | $ | 303 | $ | (175 | ) | $ | 452 | $ | 900 | $ | (448 | ) | |||||
Fuel Lag Benefit | $ | 18 | $ | 8 | $ | 10 | $ | 55 | $ | 3 | $ | 52 | |||||||
12
CSX Corporation
EXPENSE
Expenses of $2.0 billion decreased $239 million, or 11% year over year, primarily driven by lower fuel costs of $170 million. Also included in the quarter were lower volume-related costs and efficiency savings. Variances are described below.
LABOR AND FRINGE
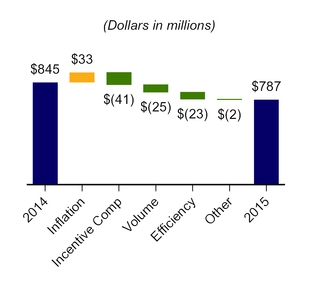
• | Inflation resulted in $33 million of additional cost driven by wages partially offset by reduced health and welfare costs. |
• | Incentive compensation was $41 million lower reflecting the expected award payouts on existing plans. |
• | Volume-related costs were $25 million lower. |
• | Efficiency savings of $23 million were primarily a result of reduced crew starts due to the Company's train length initiatives, lower operating support costs, and reduced management headcount as a result of the Q4 2014 restructuring initiative. |
• | Other costs decreased $2 million. |
EMPLOYEE COUNTS (Estimated) | ||||||||
2015 | 2014 (a) | Change | ||||||
July | 31,444 | 31,460 | (16 | ) | ||||
August | 30,780 | 31,518 | (738 | ) | ||||
September | 30,405 | 31,793 | (1,388 | ) | ||||
Average | 30,876 | 31,590 | (714 | ) | ||||
(a) 2014 employee counts were corrected by an immaterial omission of approximately 100 employees.
MATERIALS, SUPPLIES AND OTHER
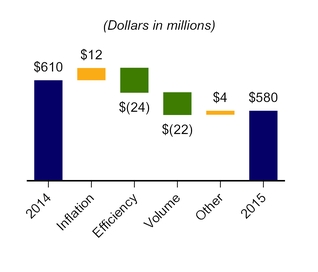
• | Inflation resulted in $12 million of additional cost. |
• | Efficiency savings of $24 million were driven by a reduction in professional costs as well as lower costs supporting operations. |
• | Volume-related costs were $22 million lower. |
• | Other costs increased $4 million primarily due to train accident costs partially offset by prior year casualty expenses that did not repeat in the current period. |
13
CSX Corporation
FUEL

• | Efficiency losses of $7 million were due to unfavorable traffic mix. |
• | Locomotive fuel price decreased 41% and reduced expense by $145 million. |
• | Volume-related costs were $24 million lower. |
• | Other fuel savings of $8 million were primarily due to lower non-locomotive fuel price. |
Quarters Ended | Nine Months Ended | |||||||||||||||||||
(Dollars and Gallons In Millions, Except Price per Gallon) | Sep. 25, 2015 | Sep. 26, 2014 | Fav / (Unfav) | Sep. 25, 2015 | Sep. 26, 2014 | Fav / (Unfav) | ||||||||||||||
Estimated Locomotive Fuel Consumption (Gallons) | 116.7 | 122.3 | 5.6 | 370.7 | 379.1 | 8.4 | ||||||||||||||
Price per Gallon (Dollars) | $ | 1.76 | $ | 3.00 | $ | 1.24 | $ | 1.87 | $ | 3.07 | $ | 1.20 | ||||||||
Total Locomotive Fuel Expense | $ | 205 | $ | 367 | $ | 162 | $ | 693 | $ | 1,163 | $ | 470 | ||||||||
Other | 18 | 26 | 8 | 63 | 92 | 29 | ||||||||||||||
Total Fuel Expense | $ | 223 | $ | 393 | $ | 170 | $ | 756 | $ | 1,255 | $ | 499 | ||||||||
DEPRECIATION
Depreciation expense increased $11 million due to a larger asset base.
EQUIPMENT AND OTHER RENTS
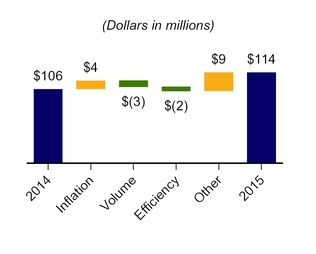
• | Inflation resulted in $4 million additional cost related to rates on automotive and intermodal cars. |
• | Volume-related costs were $3 million lower. |
• | Efficiency savings of $2 million were due to improved car cycle times. |
• | Other costs increased $9 million primarily due to increased intermodal and equipment rents, which includes increased maintenance on rented railcars. |
14
CSX Corporation
OPERATING STATISTICS (Estimated)
TON MILES
Quarters Ended | Nine Months Ended | |||||||||||||
Sep. 25, 2015 | Sep. 26, 2014 | Improvement / (Deterioration) | Sep. 25, 2015 | Sep. 26, 2014 | Improvement / (Deterioration) | |||||||||
Revenue Ton-Miles (Billions) | ||||||||||||||
Merchandise | 36.0 | 37.4 | (4 | )% | 108.9 | 110.7 | (2 | )% | ||||||
Coal | 13.6 | 17.4 | (22 | ) | 45.6 | 51.7 | (12 | ) | ||||||
Intermodal | 7.1 | 6.8 | 4 | 21.2 | 20.1 | 5 | ||||||||
Total | 56.7 | 61.6 | (8 | )% | 175.7 | 182.5 | (4 | )% | ||||||
Gross Ton-Miles (Billions) | ||||||||||||||
Total Gross Ton-Miles | 105.4 | 112.4 | (6 | )% | 323.7 | 331.3 | (2 | )% | ||||||
(Excludes locomotive gross ton-miles) | ||||||||||||||
SAFETY AND SERVICE
CSX remains an industry leader in key safety measures. The FRA reportable personal injury frequency index improved 21 percent year over year to 0.91, while the reported FRA train accident frequency rate deteriorated 2 percent year over year to 2.73. CSX is committed to safety and is focusing on continuously improving the Company's safety performance. Safety programs continue to emphasize avoiding catastrophic events and minimizing inconvenience to the communities we serve.
CSX’s operating performance continued to improve in the third quarter. On-time originations improved 41 percent year over year to 76 percent, and on-time arrivals increased to 54 percent, a 26 percent increase year over year. Average train velocity was 20.5 miles per hour, a 1 percent improvement from last year. Terminal dwell was 25.2 hours, a 4 percent improvement from last year, and is continuing to improve as the year progresses. The Company expects to build upon this service performance while driving continued service gains and productivity savings. Productivity gains will result from the Company’s continued focus on increasing train length, improving employee efficiency and improving network fluidity.
Quarters Ended | Nine Months Ended | |||||||||||||
Sep. 25, 2015 | Sep. 26, 2014 | Improvement / (Deterioration) | Sep. 25, 2015 | Sep. 26, 2014 | Improvement / (Deterioration) | |||||||||
Safety and Service Measurements | ||||||||||||||
FRA Personal Injury Frequency Index | 0.91 | 1.15 | 21 | % | 0.80 | 1.02 | 22 | % | ||||||
(Number of FRA-reportable injuries per 200,000 man-hours) | ||||||||||||||
FRA Train Accident Rate | 2.73 | 2.68 | (2 | )% | 2.36 | 2.50 | 6 | % | ||||||
(Number of FRA-reportable train accidents per million train miles) | ||||||||||||||
On-Time Originations | 76 | % | 54 | % | 41 | % | 64 | % | 57 | % | 12 | % | ||
On-Time Arrivals | 54 | % | 43 | % | 26 | % | 48 | % | 45 | % | 7 | % | ||
Train Velocity (Miles per hour) | 20.5 | 20.2 | 1 | % | 20.3 | 20.0 | 2 | % | ||||||
Dwell (Hours) | 25.2 | 26.3 | 4 | % | 25.9 | 26.3 | 2 | % | ||||||
Cars-On-Line | 204,082 | 205,964 | 1 | % | 206,075 | 203,339 | (1 | )% | ||||||
15
CSX Rail Network

16
Serious News for Serious Traders! Try StreetInsider.com Premium Free!
You May Also Be Interested In
- CSX (CSX) PT Lowered to $38 at Jefferies
- Glow Announces Late Filing of Financial Statements
- BMO Capital Reiterates Outperform Rating on CSX (CSX)
Create E-mail Alert Related Categories
SEC FilingsSign up for StreetInsider Free!
Receive full access to all new and archived articles, unlimited portfolio tracking, e-mail alerts, custom newswires and RSS feeds - and more!
