

Form 8-K CSX CORP For: Jul 13
 Tweet
Tweet Share
ShareUNITED STATES
SECURITIES AND EXCHANGE COMMISSION
Washington, D.C. 20549
Form 8-K
Current Report
Pursuant to Section 13 or 15(d) of
the Securities Exchange Act of 1934
Date of Report (Date of earliest event reported): July 13, 2016

CSX CORPORATION
(Exact name of registrant as specified in its charter)
Virginia
(State or other jurisdiction of
incorporation or organization)
1-8022 | 62-1051971 | |
(Commission File No.) | (I.R.S. Employer | |
Identification No.) | ||
500 Water Street, C900, Jacksonville, FL 32202
(Address of principal executive offices) (Zip Code)
Registrant's telephone number, including area code:
(904) 359-3200
Check the appropriate box below if the Form 8-K filing is intended to simultaneously satisfy the filing obligation of the registrant under any of the following provisions:
__ Written communications pursuant to Rule 425 under the Securities Act (17 CFR 230.425)
__ Soliciting material pursuant to Rule 14a-12 under the Exchange Act (17 CFR 240.14a-12)
__ Pre-commencement communications pursuant to Rule 14d-2(b) under the Exchange Act (17 CFR 240.14d-2(b))
__ Pre-commencement communications pursuant to Rule 13e-4(c) under the Exchange Act (17 CFR 240.13e-4(c))
ITEM 2.02. | RESULTS OF OPERATIONS AND FINANCIAL CONDITION |
On July 13, 2016, CSX Corporation issued a press release and its CSX Quarterly Financial Report on financial and operating results for the quarter ended June 24, 2016. That press release corrected information released on Twitter. A copy of the press release is attached as Exhibit 99.1 and a copy of the CSX Quarterly Financial Report is attached as Exhibit 99.2, each of which is incorporated by reference herein. These documents are available on the Company's website, www.csx.com.*
The information contained in this Current Report on Form 8-K, including Exhibits 99.1 and 99.2 hereto, has been “furnished” and shall not be deemed “filed” for purposes of Section 18 of the Securities Exchange Act of 1934, as amended, or otherwise subject to liability under that section. The information in this Current Report shall not be incorporated by reference into any filing or other document pursuant to the Securities Act of 1933, as amended, except as shall be expressly set forth by specific reference in such filing or document.
ITEM 9.01. EXHIBITS
(d) The following exhibits are being furnished herewith:
99.1 | Press Release dated July 13, 2016 from CSX Corporation |
99.2 | CSX Quarterly Financial Report. |
* | Internet addresses are provided for informational purposes only and are not intended to be hyperlinks. |
Signature
Pursuant to the requirements of the Securities and Exchange Act of 1934, the registrant has duly caused this report to be signed on its behalf by the undersigned hereunto duly authorized.
CSX CORPORATION
By: /s/ Carolyn T. Sizemore
Carolyn T. Sizemore
Vice President and Controller
(Principal Accounting Officer)
Date: July 13, 2016
Exhibit 99.1
CSX Corporation Announces Second Quarter Earnings
Highlights:
• | Delivered earnings per share of $0.47 and an operating ratio of 68.9 percent |
• | Strong U.S. dollar, low commodity prices and energy market transition continue to challenge financial performance and are expected to impact full-year earnings |
JACKSONVILLE, Fla. - July 13, 2016 - CSX Corporation (Nasdaq: CSX) today announced second quarter 2016 net earnings of $445 million, or $0.47 per share, down from $553 million, or $0.56 per share, in the same period of last year.
“CSX continued to drive strong customer service and network efficiency in a challenging market, which is expected to persist throughout this year,” said Michael J. Ward, chairman and chief executive officer. “In this environment, the company continues to right-size resources while making strategic investments to transform the company and capitalize on market opportunities to drive long-term value creation.”
Revenue for the quarter declined 12 percent, driven primarily by an overall 9 percent volume decline that impacted nearly all markets, including coal declines of more than 30 percent, which more than offset pricing gains from an improving service product.
Expenses improved 9 percent in the quarter, driven by efficiency gains of $96 million, lower volume-related costs of $86 million as CSX further aligned its cost structure with current and future market dynamics, and $56 million from reduced fuel prices.
Despite the strong efficiency performance in the quarter, operating income decreased 17 percent to $840 million and the operating ratio increased 210 basis points year-over-year to 68.9 percent.
Looking forward, CSX continues to expect 2016 full-year earnings per share to decline, reflecting the ongoing transition in the energy markets, along with the impact of the strong U.S. dollar and low commodity prices. As the company positions itself to serve the markets of tomorrow, CSX remains focused on maximizing shareholder value and achieving a mid-60s operating ratio longer term.
This release corrects information released via Twitter earlier today. CSX executives will conduct a quarterly earnings conference call with the investment community on July 14, 2016, from 8:30 a.m. to 9:30 a.m. Eastern time. Investors, media and the public may listen to the conference call by dialing 1-888-EARN-CSX (888-327-6279) and asking for the CSX earnings call. Callers outside the U.S., dial 1-773-756-0199. Participants should dial in 10 minutes prior to the call. In conjunction with the call, a live webcast will be accessible and presentation materials will be posted on the company's website at http://investors.csx.com. Following the earnings call, an internet replay of the presentation will be archived on the company website.
This earnings announcement, as well as additional detailed financial information, is contained in the CSX Quarterly Financial Report available through the company’s website at http://investors.csx.com and on Form 8-K with the Securities and Exchange Commission.
About CSX and its Disclosures
CSX, based in Jacksonville, Florida, is a premier transportation company. It provides rail, intermodal and rail-to-truck transload services and solutions to customers across a broad array of markets, including energy, industrial, construction, agricultural, and consumer products. For nearly 190 years, CSX has played a critical role in the nation's economic expansion and industrial development. Its network connects every major metropolitan area in the eastern United States, where nearly two-thirds of the nation's population resides. It also links more than 240 short-line railroads and more than 70 ocean, river and lake ports with major population centers and farming towns alike.
This announcement, as well as additional financial information, is available on the company's website at http://investors.csx.com. CSX also uses social media channels to communicate information about the company. Although social media channels are not intended to be the primary method of disclosure for material information, it is possible that certain information CSX posts on social media could be deemed to be material. Therefore, we encourage investors, the media, and others interested in the company to review the information we post on Twitter (http://twitter.com/CSX) and on Slideshare (http://www.slideshare.net/HowTomorrowMoves). The social media channels used by CSX may be updated from time to time.
More information about CSX Corporation and its subsidiaries is available at www.csx.com and on Facebook (http://www.facebook.com/OfficialCSX).
Forward-looking Statements
This information and other statements by the company may contain forward-looking statements within the meaning of the Private Securities Litigation Reform Act with respect to, among other items: projections and estimates of earnings, revenues, margins, volumes, rates, cost-savings, expenses, taxes, liquidity, capital expenditures, dividends, share repurchases or other financial items, statements of management's plans, strategies and objectives for future operations, and management's expectations as to future performance and operations and the time by which objectives will be achieved, statements concerning proposed new services, and statements regarding future economic, industry or market conditions or performance. Forward-looking statements are typically identified by words or phrases such as “will,” “should,” “believe,” “expect,” “anticipate,” “project,” “estimate,” “preliminary” and similar expressions. Forward-looking statements speak only as of the date they are made, and the company undertakes no obligation to update or
revise any forward-looking statement. If the company updates any forward-looking statement, no inference should be drawn that the company will make additional updates with respect to that statement or any other forward-looking statements.
Forward-looking statements are subject to a number of risks and uncertainties, and actual performance or results could differ materially from that anticipated by any forward-looking statements. Factors that may cause actual results to differ materially from those contemplated by any forward- looking statements include, among others; (i) the company's success in implementing its financial and operational initiatives; (ii) changes in domestic or international economic, political or business conditions, including those affecting the transportation industry (such as the impact of industry competition, conditions, performance and consolidation); (iii) legislative or regulatory changes; (iv) the inherent business risks associated with safety and security; (v) the outcome of claims and litigation involving or affecting the company; (vi) natural events such as severe weather conditions or pandemic health crises; and (vii) the inherent uncertainty associated with projecting economic and business conditions.
Other important assumptions and factors that could cause actual results to differ materially from those in the forward-looking statements are specified in the company's SEC reports, accessible on the SEC's website at www.sec.gov and the company's website at www.csx.com.
Exhibit 99.2


CSX Corporation Announces Second Quarter Earnings
Highlights:
• | Delivered earnings per share of $0.47 and an operating ratio of 68.9 percent |
• | Strong U.S. dollar, low commodity prices and energy market transition continue to challenge financial performance and are expected to impact full-year earnings |
JACKSONVILLE, Fla. - July 13, 2016 - CSX Corporation (Nasdaq: CSX) today announced second quarter 2016 net earnings of $445 million, or $0.47 per share, down from $553 million, or $0.56 per share, in the same period of last year.
“CSX continued to drive strong customer service and network efficiency in a challenging market, which is expected to persist throughout this year,” said Michael J. Ward, chairman and chief executive officer. “In this environment, the company continues to right-size resources while making strategic investments to transform the company and capitalize on market opportunities to drive long-term value creation.”
Revenue for the quarter declined 12 percent, driven primarily by an overall 9 percent volume decline that impacted nearly all markets, including coal declines of more than 30 percent, which more than offset pricing gains from an improving service product.
Expenses improved 9 percent in the quarter, driven by efficiency gains of $96 million, lower volume-related costs of $86 million as CSX further aligned its cost structure with current and future market dynamics, and $56 million from reduced fuel prices.
Despite the strong efficiency performance in the quarter, operating income decreased 17 percent to $840 million and the operating ratio increased 210 basis points year-over-year to 68.9 percent.
Looking forward, CSX continues to expect 2016 full-year earnings per share to decline, reflecting the ongoing transition in the energy markets, along with the impact of the strong U.S. dollar and low commodity prices. As the company positions itself to serve the markets of tomorrow, CSX remains focused on maximizing shareholder value and achieving a mid-60s operating ratio longer term.
Table of Contents | The accompanying unaudited | CSX CORPORATION | CONTACTS: |
financial information should be | 500 Water Street, C900 | ||
read in conjunction with the | Jacksonville, FL 32202 | INVESTOR RELATIONS | |
Company’s most recent | www.csx.com | David Baggs | |
Annual Report on Form 10-K, | (904) 359-4812 | ||
Quarterly Reports on Form | MEDIA | ||
10-Q, and any Current | Melanie Cost | ||
Reports on Form 8-K. | (904) 359-1702 | ||
1
This release corrects information released via Twitter earlier today. CSX executives will conduct a quarterly earnings conference call with the investment community on July 14, 2016, from 8:30 a.m. to 9:30 a.m. Eastern time. Investors, media and the public may listen to the conference call by dialing 1-888-EARN-CSX (888-327-6279) and asking for the CSX earnings call. Callers outside the U.S., dial 1-773-756-0199. Participants should dial in 10 minutes prior to the call. In conjunction with the call, a live webcast will be accessible and presentation materials will be posted on the company's website at http://investors.csx.com. Following the earnings call, an internet replay of the presentation will be archived on the company website.
This earnings announcement, as well as additional detailed financial information, is contained in the CSX Quarterly Financial Report available through the company’s website at http://investors.csx.com and on Form 8-K with the Securities and Exchange Commission.
About CSX and its Disclosures
CSX, based in Jacksonville, Florida, is a premier transportation company. It provides rail, intermodal and rail-to-truck transload services and solutions to customers across a broad array of markets, including energy, industrial, construction, agricultural, and consumer products. For nearly 190 years, CSX has played a critical role in the nation's economic expansion and industrial development. Its network connects every major metropolitan area in the eastern United States, where nearly two-thirds of the nation's population resides. It also links more than 240 short-line railroads and more than 70 ocean, river and lake ports with major population centers and farming towns alike.
This announcement, as well as additional financial information, is available on the company's website at http://investors.csx.com. CSX also uses social media channels to communicate information about the company. Although social media channels are not intended to be the primary method of disclosure for material information, it is possible that certain information CSX posts on social media could be deemed to be material. Therefore, we encourage investors, the media, and others interested in the company to review the information we post on Twitter (http://twitter.com/CSX) and on Slideshare (http://www.slideshare.net/HowTomorrowMoves). The social media channels used by CSX may be updated from time to time.
More information about CSX Corporation and its subsidiaries is available at www.csx.com and on Facebook (http://www.facebook.com/OfficialCSX).
Forward-looking Statements
This information and other statements by the company may contain forward-looking statements within the meaning of the Private Securities Litigation Reform Act with respect to, among other items: projections and estimates of earnings, revenues, margins, volumes, rates, cost-savings, expenses, taxes, liquidity, capital expenditures, dividends, share repurchases or other financial items, statements of management's plans, strategies and objectives for future operations, and management's expectations as to future performance and operations and the time by which objectives will be achieved, statements concerning proposed new services, and statements regarding future economic, industry or market conditions or performance. Forward-looking statements are typically identified by words or phrases such as “will,” “should,” “believe,” “expect,” “anticipate,” “project,” “estimate,” “preliminary” and similar expressions. Forward-looking statements speak only as of the date they are made, and the company undertakes no obligation to update or revise any forward-looking statement. If the company updates any forward-looking statement, no inference should be drawn that the company will make additional updates with respect to that statement or any other forward-looking statements.
Forward-looking statements are subject to a number of risks and uncertainties, and actual performance or results could differ materially from that anticipated by any forward-looking statements. Factors that may cause actual results to differ materially from those contemplated by any forward- looking statements include, among others; (i) the company's success in implementing its financial and operational initiatives; (ii) changes in domestic or international economic, political or business conditions, including those affecting the transportation industry (such as the impact of industry competition, conditions, performance and consolidation); (iii) legislative or regulatory changes; (iv) the inherent business risks associated with safety and security; (v) the outcome of claims and litigation involving or affecting the company; (vi) natural events such as severe weather conditions or pandemic health crises; and (vii) the inherent uncertainty associated with projecting economic and business conditions.
Other important assumptions and factors that could cause actual results to differ materially from those in the forward-looking statements are specified in the company's SEC reports, accessible on the SEC's website at www.sec.gov and the company's website at www.csx.com.
2
CSX Corporation
CONSOLIDATED INCOME STATEMENTS (Unaudited)
(Dollars in millions, except per share amounts)
Quarters Ended | Six Months Ended | ||||||||||||||||||||||
Jun. 24, 2016 | Jun. 26, 2015 | $ Change | % Change | Jun. 24, 2016 | Jun. 26, 2015 | $ Change | % Change | ||||||||||||||||
Revenue | $ | 2,704 | $ | 3,064 | $ | (360 | ) | (12 | )% | $ | 5,322 | $ | 6,091 | $ | (769 | ) | (13 | )% | |||||
Expense | |||||||||||||||||||||||
Labor and Fringe | 749 | 825 | 76 | 9 | 1,545 | 1,704 | 159 | 9 | |||||||||||||||
Materials, Supplies and Other | 519 | 559 | 40 | 7 | 1,069 | 1,186 | 117 | 10 | |||||||||||||||
Fuel | 172 | 263 | 91 | 35 | 322 | 533 | 211 | 40 | |||||||||||||||
Depreciation | 319 | 299 | (20 | ) | (7 | ) | 632 | 594 | (38 | ) | (6 | ) | |||||||||||
Equipment and Other Rents | 105 | 101 | (4 | ) | (4 | ) | 210 | 214 | 4 | 2 | |||||||||||||
Total Expense | 1,864 | 2,047 | 183 | 9 | 3,778 | 4,231 | 453 | 11 | |||||||||||||||
Operating Income | 840 | 1,017 | (177 | ) | (17 | ) | 1,544 | 1,860 | (316 | ) | (17 | ) | |||||||||||
Interest Expense | (141 | ) | (134 | ) | (7 | ) | (5 | ) | (284 | ) | (268 | ) | (16 | ) | (6 | ) | |||||||
Other Income - Net | 8 | 4 | 4 | 100 | 15 | 6 | 9 | (150 | ) | ||||||||||||||
Earnings Before Income Taxes | 707 | 887 | (180 | ) | (20 | ) | 1,275 | 1,598 | (323 | ) | (20 | ) | |||||||||||
Income Tax Expense | (262 | ) | (334 | ) | 72 | 22 | (474 | ) | (603 | ) | 129 | 21 | |||||||||||
Net Earnings | $ | 445 | $ | 553 | $ | (108 | ) | (20 | )% | $ | 801 | $ | 995 | $ | (194 | ) | (19 | )% | |||||
Operating Ratio | 68.9 | % | 66.8 | % | 71.0 | % | 69.5 | % | |||||||||||||||
Per Common Share | |||||||||||||||||||||||
Net Earnings Per Share, Assuming Dilution | $ | 0.47 | $ | 0.56 | $ | (0.09 | ) | (16 | )% | $ | 0.84 | $ | 1.00 | $ | (0.16 | ) | (16 | )% | |||||
Average Shares Outstanding, Assuming Dilution (millions) | 952 | 989 | 958 | 990 | |||||||||||||||||||
Cash Dividends Paid Per Common Share | $ | 0.18 | $ | 0.18 | $ | 0.36 | $ | 0.34 | |||||||||||||||
3
CSX Corporation
CONDENSED CONSOLIDATED BALANCE SHEETS
(Dollars in millions)
(Unaudited) | ||||||
Jun. 24, 2016 | Dec. 25, 2015 | |||||
ASSETS | ||||||
Cash and Cash Equivalents | $ | 566 | $ | 628 | ||
Short-term Investments | 262 | 810 | ||||
Other Current Assets | 1,400 | 1,402 | ||||
Properties - Net | 30,607 | 30,174 | ||||
Investment in Affiliates and Other Companies | 1,413 | 1,394 | ||||
Other Long-term Assets | 302 | 337 | ||||
Total Assets | $ | 34,550 | $ | 34,745 | ||
LIABILITIES AND SHAREHOLDERS' EQUITY | ||||||
Current Maturities of Long-term Debt | $ | 632 | $ | 20 | ||
Other Current Liabilities | 1,650 | 1,932 | ||||
Long-term Debt | 9,905 | 10,515 | ||||
Deferred Income Taxes - Net | 9,355 | 9,179 | ||||
Other Long-term Liabilities | 1,383 | 1,431 | ||||
Total Liabilities | 22,925 | 23,077 | ||||
Total Shareholders' Equity | 11,625 | 11,668 | ||||
Total Liabilities and Shareholders' Equity | $ | 34,550 | $ | 34,745 | ||
Certain prior year data has been reclassified to conform to the current presentation.
4
CSX Corporation
CONDENSED CONSOLIDATED CASH FLOW STATEMENTS (Unaudited)
(Dollars in millions)
Six Months Ended | ||||||
Jun. 24, 2016 | Jun. 26, 2015 | |||||
OPERATING ACTIVITIES | ||||||
Net Earnings | $ | 801 | $ | 995 | ||
Depreciation | 632 | 594 | ||||
Deferred Income Taxes | 165 | 33 | ||||
Gains on Property Dispositions | — | (19 | ) | |||
Other Operating Activities - Net | (6 | ) | (21 | ) | ||
Net Cash Provided by Operating Activities | 1,592 | 1,582 | ||||
INVESTING ACTIVITIES | ||||||
Property Additions | (1,066 | ) | (1,288 | ) | ||
Purchase of Short-term Investments | (260 | ) | (775 | ) | ||
Proceeds from Sales of Short-term Investments | 810 | 390 | ||||
Proceeds from Property Dispositions | 8 | 47 | ||||
Other Investing Activities | 27 | 52 | ||||
Net Cash Used in Investing Activities | (481 | ) | (1,574 | ) | ||
FINANCING ACTIVITIES | ||||||
Long-term Debt Issued | — | 600 | ||||
Long-term Debt Repaid | — | (210 | ) | |||
Dividends Paid | (344 | ) | (336 | ) | ||
Shares Repurchased (a) | (515 | ) | (284 | ) | ||
Other Financing Activities - Net (b) | (314 | ) | (9 | ) | ||
Net Cash Used in Financing Activities | (1,173 | ) | (239 | ) | ||
Net Decrease in Cash and Cash Equivalents | (62 | ) | (231 | ) | ||
CASH AND CASH EQUIVALENTS | ||||||
Cash and Cash Equivalents at Beginning of Period | 628 | 669 | ||||
Cash and Cash Equivalents at End of Period | $ | 566 | $ | 438 | ||
5
CSX Corporation
NOTES TO CONSOLIDATED FINANCIAL STATEMENTS (Unaudited)
Cash Flow Statement
a) | Shares Repurchased: During the second quarter and six months ended of 2016 and 2015, the Company repurchased the following number of shares: |
Quarters Ended | Six Months Ended | ||||||||||||
Jun. 24, 2016 | Jun. 26, 2015 | Jun. 24, 2016 | Jun. 26, 2015 | ||||||||||
Shares Repurchased (Millions) | 10 | 4 | 20 | 8 | |||||||||
Cost of Shares (Dollars in millions) | $ | 266 | $ | 157 | $ | 515 | $ | 284 | |||||
b) | Other Financing Activities - Net: Included within Other Financing Activities - Net are payments of $307 million for locomotives which were purchased using seller financing in 2015. |
6
CSX Corporation
VOLUME AND REVENUE (Unaudited) | |||||||||||||||||||||||||||
Volume (Thousands of units); Revenue (Dollars in millions); Revenue Per Unit (Dollars) | |||||||||||||||||||||||||||
Quarters Ended June 24, 2016 and June 26, 2015 | |||||||||||||||||||||||||||
Volume | Revenue | Revenue Per Unit | |||||||||||||||||||||||||
2016 | 2015 | % Change | 2016 | 2015 | % Change | 2016 | 2015 | % Change | |||||||||||||||||||
Agricultural | |||||||||||||||||||||||||||
Agricultural Products | 93 | 101 | (8 | )% | $ | 243 | $ | 266 | (9 | )% | $ | 2,613 | $ | 2,634 | (1 | )% | |||||||||||
Phosphates and Fertilizers | 72 | 78 | (8 | ) | 114 | 122 | (7 | ) | 1,583 | 1,564 | 1 | ||||||||||||||||
Food and Consumer | 23 | 24 | (4 | ) | 64 | 68 | (6 | ) | 2,783 | 2,833 | (2 | ) | |||||||||||||||
Industrial | |||||||||||||||||||||||||||
Chemicals | 138 | 158 | (13 | ) | 478 | 530 | (10 | ) | 3,464 | 3,354 | 3 | ||||||||||||||||
Automotive | 121 | 120 | 1 | 313 | 313 | — | 2,587 | 2,608 | (1 | ) | |||||||||||||||||
Metals | 56 | 61 | (8 | ) | 146 | 156 | (6 | ) | 2,607 | 2,557 | 2 | ||||||||||||||||
Housing and Construction | |||||||||||||||||||||||||||
Forest Products | 68 | 74 | (8 | ) | 192 | 202 | (5 | ) | 2,824 | 2,730 | 3 | ||||||||||||||||
Minerals | 95 | 84 | 13 | 137 | 123 | 11 | 1,442 | 1,464 | (2 | ) | |||||||||||||||||
Waste and Equipment | 40 | 41 | (2 | ) | 85 | 78 | 9 | 2,125 | 1,902 | 12 | |||||||||||||||||
Total Merchandise | 706 | 741 | (5 | ) | 1,772 | 1,858 | (5 | ) | 2,510 | 2,507 | — | ||||||||||||||||
Coal | 195 | 295 | (34 | ) | 416 | 630 | (34 | ) | 2,133 | 2,136 | — | ||||||||||||||||
Intermodal | 694 | 723 | (4 | ) | 419 | 450 | (7 | ) | 604 | 622 | (3 | ) | |||||||||||||||
Other | — | — | — | 97 | 126 | (23 | ) | — | — | — | |||||||||||||||||
Total | 1,595 | 1,759 | (9 | )% | $ | 2,704 | $ | 3,064 | (12 | )% | $ | 1,695 | $ | 1,742 | (3 | )% | |||||||||||
Six Months Ended June 24, 2016 and June 26, 2015 | |||||||||||||||||||||||||||
Volume | Revenue | Revenue Per Unit | |||||||||||||||||||||||||
2016 | 2015 | % Change | 2016 | 2015 | % Change | 2016 | 2015 | % Change | |||||||||||||||||||
Agricultural | |||||||||||||||||||||||||||
Agricultural Products | 192 | 210 | (9 | )% | $ | 506 | $ | 557 | (9 | )% | $ | 2,635 | $ | 2,652 | (1 | )% | |||||||||||
Phosphates and Fertilizers | 148 | 156 | (5 | ) | 241 | 258 | (7 | ) | 1,628 | 1,654 | (2 | ) | |||||||||||||||
Food and Consumer | 45 | 47 | (4 | ) | 124 | 132 | (6 | ) | 2,756 | 2,809 | (2 | ) | |||||||||||||||
Industrial | |||||||||||||||||||||||||||
Chemicals | 288 | 313 | (8 | ) | 979 | 1,064 | (8 | ) | 3,399 | 3,399 | — | ||||||||||||||||
Automotive | 234 | 221 | 6 | 603 | 580 | 4 | 2,577 | 2,624 | (2 | ) | |||||||||||||||||
Metals | 106 | 122 | (13 | ) | 284 | 310 | (8 | ) | 2,679 | 2,541 | 5 | ||||||||||||||||
Housing and Construction | |||||||||||||||||||||||||||
Forest Products | 136 | 147 | (7 | ) | 381 | 400 | (5 | ) | 2,801 | 2,721 | 3 | ||||||||||||||||
Minerals | 157 | 144 | 9 | 237 | 226 | 5 | 1,510 | 1,569 | (4 | ) | |||||||||||||||||
Waste and Equipment | 73 | 72 | 1 | 151 | 140 | 8 | 2,068 | 1,944 | 6 | ||||||||||||||||||
Total Merchandise | 1,379 | 1,432 | (4 | ) | 3,506 | 3,667 | (4 | ) | 2,542 | 2,561 | (1 | ) | |||||||||||||||
Coal | 395 | 584 | (32 | ) | 815 | 1,268 | (36 | ) | 2,063 | 2,171 | (5 | ) | |||||||||||||||
Intermodal | 1,372 | 1,378 | — | 824 | 865 | (5 | ) | 601 | 628 | (4 | ) | ||||||||||||||||
Other | — | — | — | 177 | 291 | (39 | ) | — | — | — | |||||||||||||||||
Total | 3,146 | 3,394 | (7 | )% | $ | 5,322 | $ | 6,091 | (13 | )% | $ | 1,692 | $ | 1,795 | (6 | )% | |||||||||||
7
CSX Corporation
VOLUME AND REVENUE
Revenue was down $360 million to $2.7 billion from the prior year's second quarter as price gains were more than offset by volume declines, lower fuel surcharge revenue and negative business mix.
Same Store Sales Pricing Year-Over-Year Change | |||
% Change | |||
All-In | 2.9 | % | |
Merchandise and Intermodal | 4.0 | % | |
Same store sales is defined as customer shipments with the same commodity and car type, and the same origin and destination.
Revenue per unit was down 3 percent as pricing gains in the quarter were more than offset by lower fuel recoveries and negative mix. Same store sales increased across all markets with the exception of export coal.
MERCHANDISE
Agricultural Sector
Volume (Thousands of units); Revenue (Dollars in millions); Revenue Per Unit (Dollars) | ||||||||||||||||||||||||||
Volume | Revenue | Revenue Per Unit | ||||||||||||||||||||||||
2016 | 2015 | % Change | 2016 | 2015 | % Change | 2016 | 2015 | % Change | ||||||||||||||||||
188 | 203 | (7 | ) | $ | 421 | $ | 456 | (8 | ) | $ | 2,239 | $ | 2,246 | — | ||||||||||||
% of Carloads
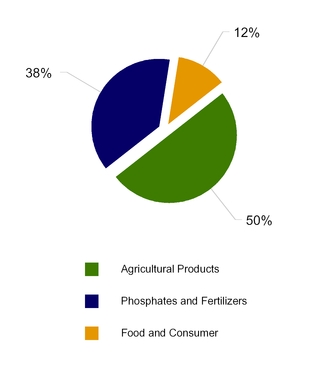
Agricultural Products - Volume decreased in products used for animal feeding due to high inventories and a strong U.S. dollar that both challenged export moves and allowed for more import displacement of domestic product. Additionally, ethanol market dynamics favored Gulf region destinations for storage and export, which precluded CSX participation in shipments from Western origins.
Phosphates and Fertilizers - Volume declines were concentrated in phosphate due to customer production curtailments that reflect an anticipated weaker market for phosphate rock and sulfur inputs, partially a result of import phosphate displacement.
Food and Consumer - Lower volume was a result of weaker Western fruit and vegetable crop yields, which reduced refrigerated product moves. This decline was partially offset by increased alcoholic beverage volume reflecting increased demand for Mexican beer and growth in an expedited rail product into the Northeast.
8
CSX Corporation
Industrial Sector
Volume (Thousands of units); Revenue (Dollars in millions); Revenue Per Unit (Dollars) | |||||||||||||||||||||||||
Volume | Revenue | Revenue Per Unit | |||||||||||||||||||||||
2016 | 2015 | % Change | 2016 | 2015 | % Change | 2016 | 2015 | % Change | |||||||||||||||||
315 | 339 | (7 | ) | $ | 937 | $ | 999 | (6 | ) | $ | 2,975 | $ | 2,947 | 1 | |||||||||||
% of Carloads

Chemicals - While non-energy related chemicals volume increased slightly, low prices of crude oil and gas products led to significant volume decline in energy-related markets, including crude oil and frac sand.
Automotive - Volume increased, consistent with North American light vehicle production, with growth across several customers. Volume mix continued to favor trucks and SUV’s over passenger cars aligned with consumer buying patterns.
Metals - Despite continued sequential improvement, volume remained challenged versus last year due to domestic mill closures brought on by steel import levels that remain above average reflecting a strong U.S. dollar.
Housing and Construction Sector
Volume (Thousands of units); Revenue (Dollars in millions); Revenue Per Unit (Dollars) | |||||||||||||||||||||||
Volume | Revenue | Revenue Per Unit | |||||||||||||||||||||
2016 | 2015 | % Change | 2016 | 2015 | % Change | 2016 | 2015 | % Change | |||||||||||||||
203 | 199 | 2 | $ | 414 | $ | 403 | 3 | $ | 2,039 | $ | 2,025 | 1 | |||||||||||
% of Carloads

Forest Products - Volume declined in paper products due to continued industry consolidation, electronic substitution and near-term losses to truck as a result of excess capacity and low prices. Further, a strong U.S. dollar challenged exports and increased imports that do not move by rail.
Minerals - Growth in volume resulted from the continued onboarding of shipments in fly ash, a by-product of burning coal that requires environmental remediation, and ongoing strength in aggregates used in construction.
Waste and Equipment - Volume decreased as the cycling of prior year soil remediation projects more than offset increased equipment and military moves.
9
CSX Corporation
COAL
Volume (Thousands of units); Revenue (Dollars in millions); Revenue Per Unit (Dollars) | ||||||||||||||||||||||||||
Volume | Revenue | Revenue Per Unit | ||||||||||||||||||||||||
2016 | 2015 | % Change | 2016 | 2015 | % Change | 2016 | 2015 | % Change | ||||||||||||||||||
195 | 295 | (34 | ) | $ | 416 | $ | 630 | (34 | ) | $ | 2,133 | $ | 2,136 | — | ||||||||||||
% of Tons

Domestic Utility Coal - Volume declined as natural gas prices continued to favor gas burn and kept utility inventory levels of coal high.
Domestic Coke, Iron Ore and Other - Lower volume resulted from an oversupplied coke market driven by softer domestic integrated steel production and the idling of a customer facility.
Export Coal - Volume decreased as a result of a strong U.S. dollar and global oversupply which impacted U.S. competitiveness in the world market for both metallurgical and thermal coal.
Quarters Ended | Six Months Ended | |||||||||||||
Jun. 24, 2016 | Jun. 26, 2015 | % Change | Jun. 24, 2016 | Jun. 26, 2015 | % Change | |||||||||
(Millions of Tons) | ||||||||||||||
Domestic | ||||||||||||||
Utility | 11.5 | 18.2 | (37 | )% | 23.9 | 35.8 | (33 | )% | ||||||
Coke, Iron Ore and Other | 4.7 | 7.1 | (34 | ) | 9.4 | 12.4 | (24 | ) | ||||||
Total Domestic | 16.2 | 25.3 | (36 | ) | 33.3 | 48.2 | (31 | ) | ||||||
Export | ||||||||||||||
Metallurgical | 4.5 | 5.2 | (13 | ) | 8.9 | 11.0 | (19 | ) | ||||||
Thermal | 1.8 | 3.2 | (44 | ) | 3.3 | 7.2 | (54 | ) | ||||||
Total Export | 6.3 | 8.4 | (25 | ) | 12.2 | 18.2 | (33 | ) | ||||||
Total Coal | 22.5 | 33.7 | (33 | )% | 45.5 | 66.4 | (31 | )% | ||||||
10
CSX Corporation
INTERMODAL
Volume (Thousands of units); Revenue (Dollars in millions); Revenue Per Unit (Dollars) | ||||||||||||||||||||||||||
Volume | Revenue | Revenue Per Unit | ||||||||||||||||||||||||
2016 | 2015 | % Change | 2016 | 2015 | % Change | 2016 | 2015 | % Change | ||||||||||||||||||
694 | 723 | (4 | ) | $ | 419 | $ | 450 | (7 | ) | $ | 604 | $ | 622 | (3 | ) | |||||||||||
% of Units

Domestic - Volume increased 5 percent driven by growth with existing customers, ongoing success with CSX’s highway-to-rail conversion program, and network service offerings enhanced by service levels and investment.
International - Volume decreased 16 percent as a result of prior competitive losses in international accounts, difficult comparisons from cycling the 2015 West Coast port recovery and the weaker global freight environment.
Intermodal Network

11
CSX Corporation
OTHER REVENUE
Other revenue decreased $29 million primarily due to lower incidental charges and affiliate coal-related revenue.
FUEL SURCHARGE
Fuel surcharge revenue is included in the individual markets detailed within the volume and revenue explanations above. Fuel lag is the estimated difference between highway diesel prices in the quarter and the prices used for fuel surcharge, which are generally on a two month lag.
Quarters Ended | Six Months Ended | ||||||||||||||||||
(Dollars in millions) | Jun. 24, 2016 | Jun. 26, 2015 | $ Change | Jun. 24, 2016 | Jun. 26, 2015 | $ Change | |||||||||||||
Fuel Surcharge Revenue | $ | 36 | $ | 134 | $ | (98 | ) | $ | 88 | $ | 325 | $ | (237 | ) | |||||
Fuel Lag (Expense) Benefit | $ | (10 | ) | $ | (1 | ) | $ | (9 | ) | $ | 8 | $ | 36 | $ | (28 | ) | |||
12
CSX Corporation
EXPENSE
Expenses of $1.9 billion decreased $183 million, or 9 percent year over year, primarily driven by efficiency savings and lower volume-related costs.
EXPENSE
(Dollars in millions)

LABOR AND FRINGE

• | Inflation resulted in $19 million of additional cost driven by increased health and welfare costs. |
• | Volume-related costs were $53 million lower. |
• | Efficiency savings of $50 million were driven by lower operating and non-operating support costs driven by structural changes, the Company’s train length initiative that began in the second quarter of the prior year, lower overtime and reduced crew training. |
• | Other costs increased $8 million. |
EMPLOYEE COUNTS (Estimated) | |||||
2016 | 2015 (a) | Change | |||
April | 27,868 | 32,425 | (4,557) | ||
May | 27,777 | 32,264 | (4,487) | ||
June | 27,461 | 31,885 | (4,424) | ||
Average | 27,702 | 32,191 | (4,489) | ||
(a) 2015 average employee counts were corrected by an immaterial omission of approximately 100 employees.
13
CSX Corporation
MATERIALS, SUPPLIES AND OTHER

• | Inflation resulted in $9 million of additional cost. |
• | Efficiency savings of $32 million were primarily related to lower operating support costs, driven by structural changes and broad cost containment. |
• | Volume-related costs were $7 million lower. |
• | Other costs decreased $10 million due to a continuing decline in the severity of injuries in addition to various other cost reductions, which more than offset a prior year real estate gain of $17 million. |
FUEL
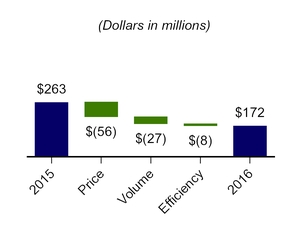
• | A 25 percent price decline was the primary driver for $56 million in fuel expense savings. |
• | Volume-related costs were $27 million lower. |
• | Efficiency savings of $8 million were primarily related to locomotive fuel reduction technology and process improvement. |
Quarters Ended | Six Months Ended | |||||||||||||||||||
(Dollars and Gallons In Millions, Except Price per Gallon) | Jun. 24, 2016 | Jun. 26, 2015 | Fav / (Unfav) | Jun. 24, 2016 | Jun. 26, 2015 | Fav / (Unfav) | ||||||||||||||
Estimated Locomotive Fuel Consumption (Gallons) | 106.1 | 122.1 | 16.0 | 219.2 | 254.0 | 34.8 | ||||||||||||||
Price per Gallon (Dollars) | $ | 1.49 | $ | 1.99 | $ | 0.50 | $ | 1.33 | $ | 1.92 | $ | 0.59 | ||||||||
Total Locomotive Fuel Expense | $ | 158 | $ | 243 | $ | 85 | $ | 292 | $ | 488 | $ | 196 | ||||||||
Other | 14 | 20 | 6 | 30 | 45 | 15 | ||||||||||||||
Total Fuel Expense | $ | 172 | $ | 263 | $ | 91 | $ | 322 | $ | 533 | $ | 211 | ||||||||
14
CSX Corporation
DEPRECIATION
Depreciation expense increased $20 million due to a larger asset base.
EQUIPMENT AND OTHER RENTS

• | Inflation resulted in $5 million additional cost primarily related to rates on automotive cars. |
• | Volume-related costs were $1 million higher due to increases in automotive activity. |
• | Efficiency savings of $6 million were due to improved car cycle times. |
• | Other costs increased $4 million. |
15
CSX Corporation
OPERATING STATISTICS (Estimated)
TON MILES
Quarters Ended | Six Months Ended | |||||||||||||
Jun. 24, 2016 | Jun. 26, 2015 | Improvement / (Deterioration) | Jun. 24, 2016 | Jun. 26, 2015 | Improvement / (Deterioration) | |||||||||
Revenue Ton-Miles (Billions) | ||||||||||||||
Merchandise | 33.9 | 36.8 | (8 | )% | 68.3 | 72.8 | (6 | )% | ||||||
Coal | 11.0 | 15.8 | (30 | ) | 21.5 | 31.9 | (33 | ) | ||||||
Intermodal | 6.9 | 7.4 | (7 | ) | 13.5 | 14.2 | (5 | ) | ||||||
Total | 51.8 | 60.0 | (14 | )% | 103.3 | 118.9 | (13 | )% | ||||||
Gross Ton-Miles (Billions) | ||||||||||||||
Total Gross Ton-Miles | 98.4 | 111.0 | (11 | )% | 195.6 | 218.3 | (10 | )% | ||||||
(Excludes locomotive gross ton-miles) | ||||||||||||||
SAFETY AND SERVICE
CSX’s FRA train accident rate of 1.88 for the quarter improved 10 percent from the prior year, while the FRA reportable personal injury frequency index of 0.90 is 14 percent unfavorable due to the significant decline in man-hours. The Company remains committed to ongoing improvement, with a focus on avoiding catastrophic events.
CSX’s operating performance continues to improve. On-time originations increased to 88 percent and on-time arrivals increased to 69 percent. Average train velocity was 21.1 miles per hour, up 4 percent versus last year, and terminal dwell was 25.0 hours, or flat to the prior year. The Company expects to sustain or improve this level of performance while continuing to drive productivity and resource efficiency.
Quarters Ended | Six Months Ended | |||||||||||||
Jun. 24, 2016 | Jun. 26, 2015 | Improvement / (Deterioration) | Jun. 24, 2016 | Jun. 26, 2015 | Improvement / (Deterioration) | |||||||||
Safety and Service Measurements | ||||||||||||||
FRA Personal Injury Frequency Index | 0.90 | 0.79 | (14 | )% | 0.90 | 0.80 | (13 | )% | ||||||
(Number of FRA-reportable injuries per 200,000 man-hours) | ||||||||||||||
FRA Train Accident Rate | 1.88 | 2.09 | 10 | % | 2.37 | 2.33 | (2 | )% | ||||||
(Number of FRA-reportable train accidents per million train miles) | ||||||||||||||
On-Time Originations | 88 | % | 66 | % | 33 | % | 84 | % | 58 | % | 45 | % | ||
On-Time Arrivals | 69 | % | 48 | % | 44 | % | 67 | % | 45 | % | 49 | % | ||
Train Velocity (Miles per hour) | 21.1 | 20.3 | 4 | % | 21.1 | 20.2 | 4 | % | ||||||
Dwell (Hours) | 25.0 | 25.0 | — | % | 25.5 | 26.3 | 3 | % | ||||||
Cars-On-Line | 205,945 | 205,239 | — | % | 206,651 | 207,088 | — | % | ||||||
Certain operating statistics are estimated and can continue to be updated as actuals settle.
16
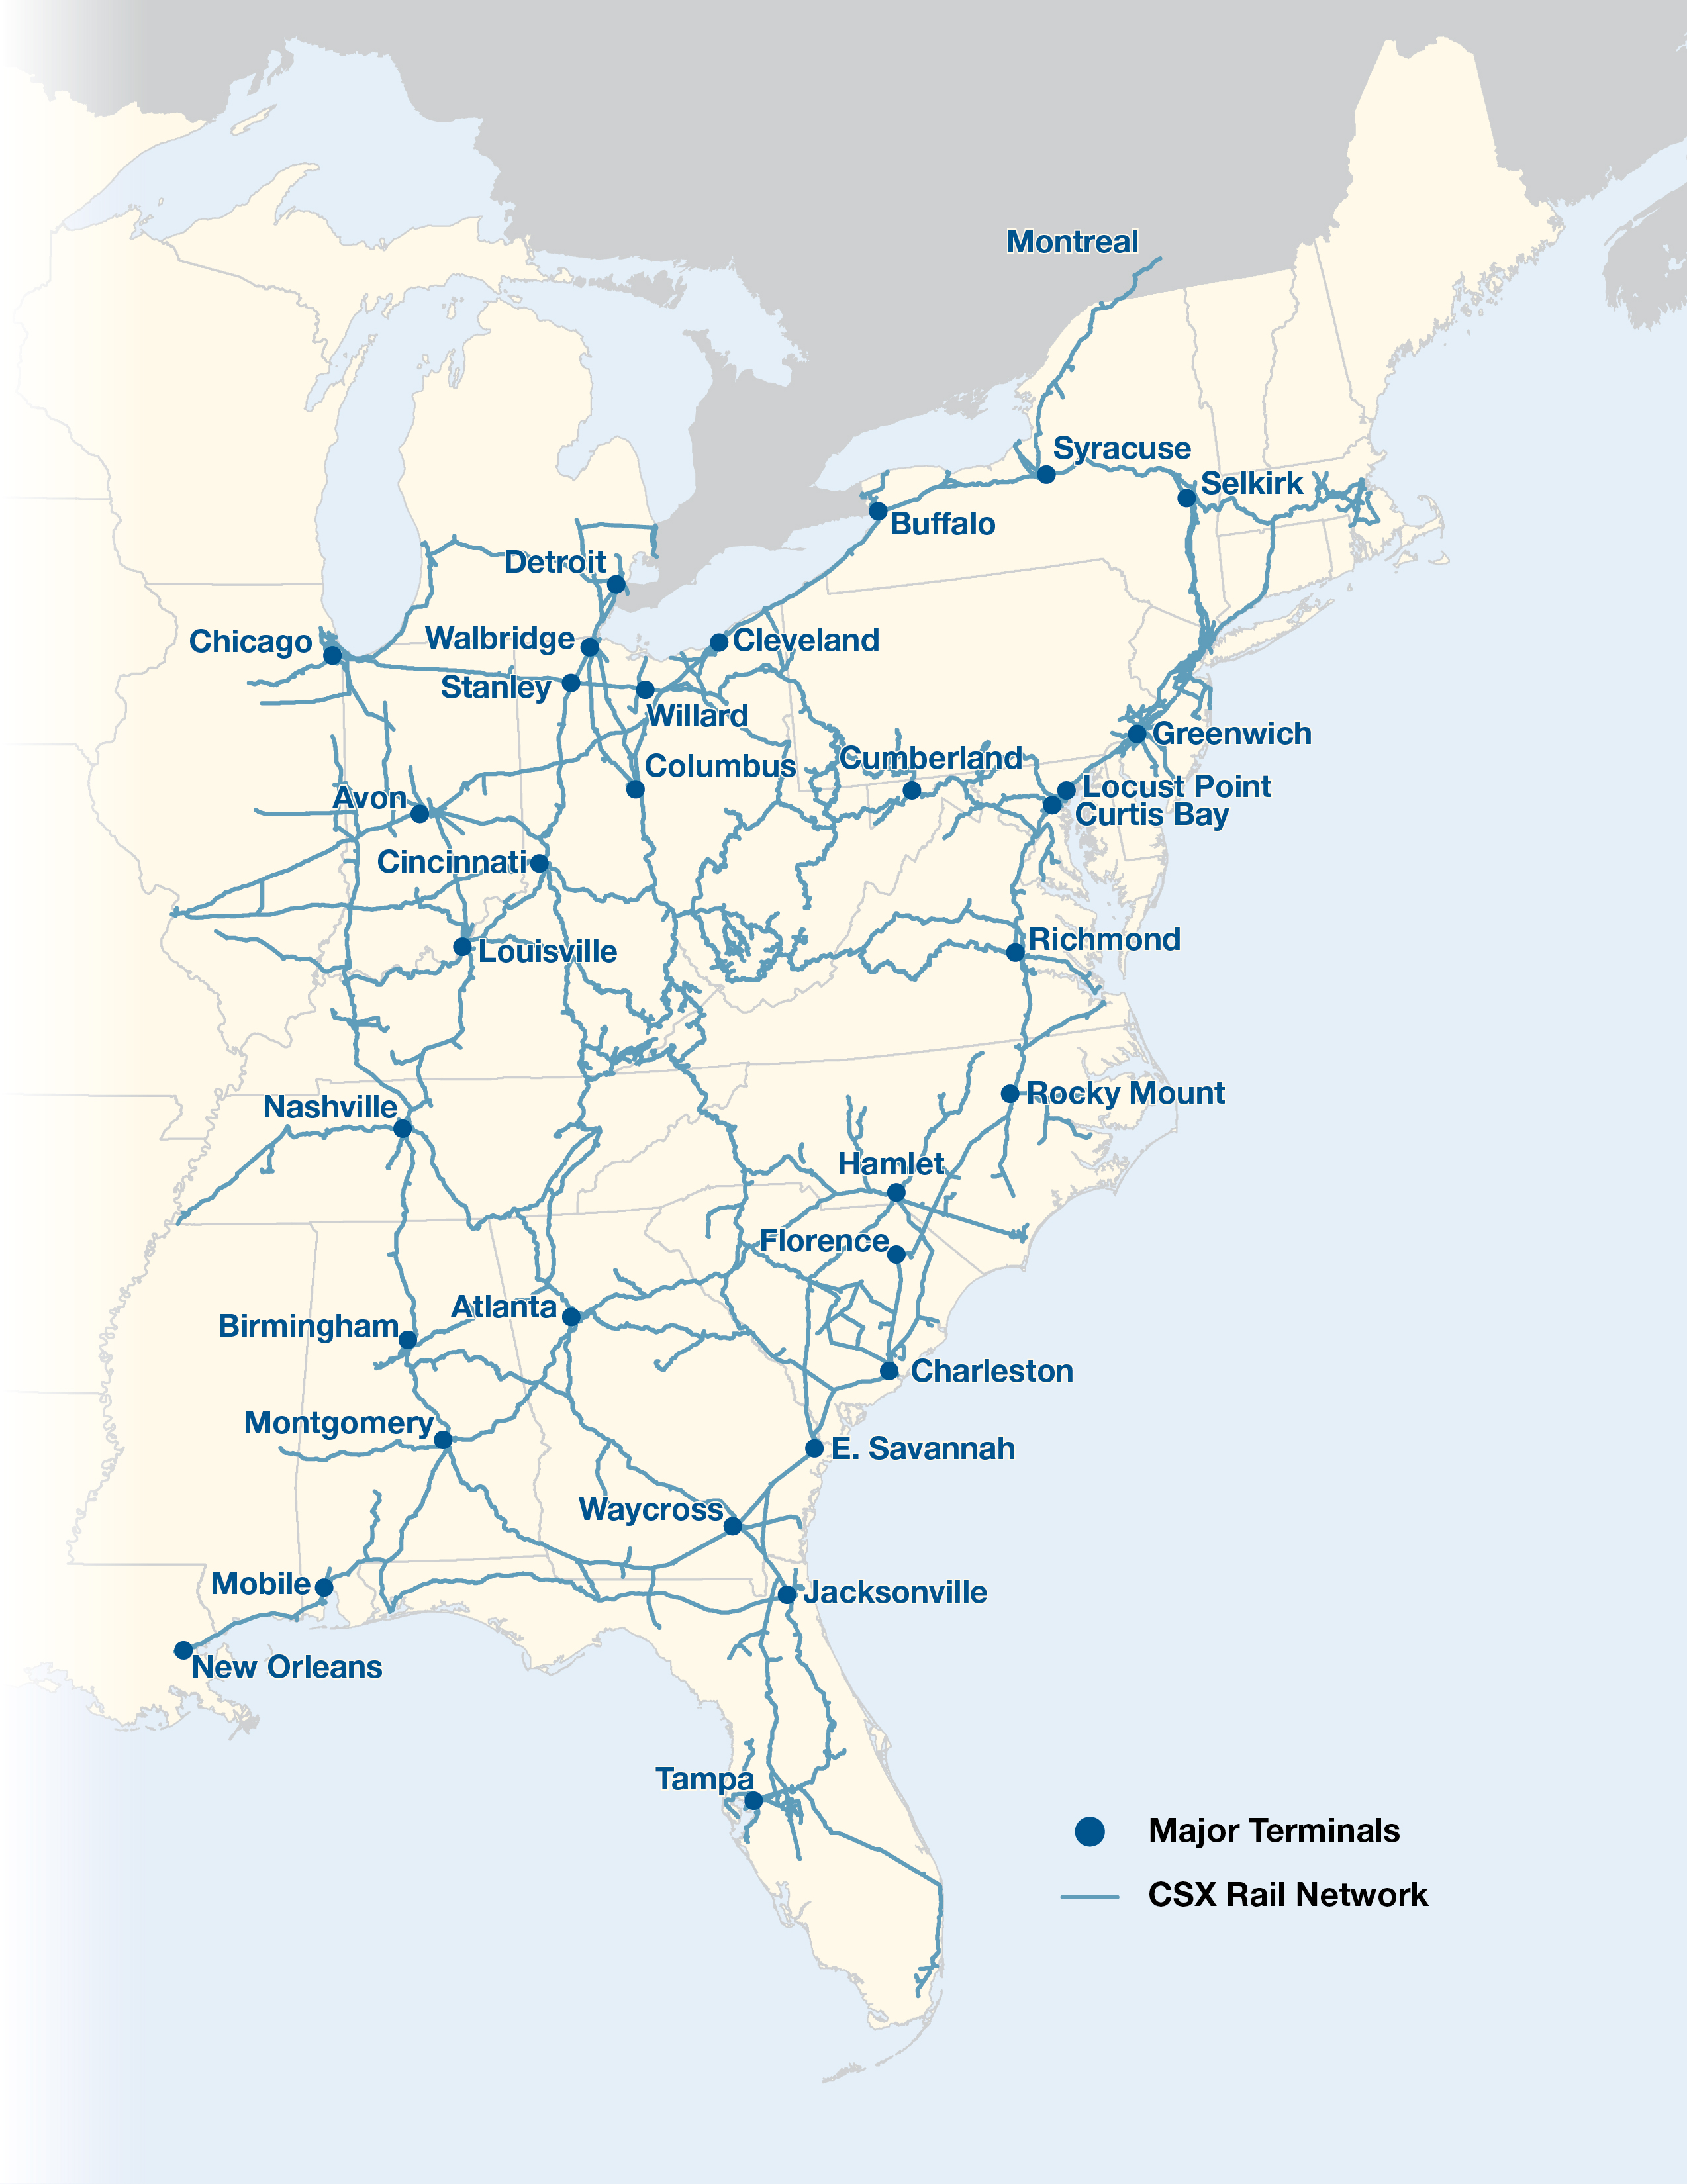
CSX Rail Network
17
Serious News for Serious Traders! Try StreetInsider.com Premium Free!
You May Also Be Interested In
- CSX (CSX) PT Lowered to $38 at Jefferies
- MYTILINEOS ENERGY & METALS: FIRST QUARTER 2024 TRADING UPDATE
- Midday movers: Tesla, Blackstone, Las Vegas Sands fall; DR Horton rises
Create E-mail Alert Related Categories
SEC FilingsSign up for StreetInsider Free!
Receive full access to all new and archived articles, unlimited portfolio tracking, e-mail alerts, custom newswires and RSS feeds - and more!
