

Form 8-K COMMUNITY TRUST BANCORP For: Mar 31
 Tweet
Tweet Share
ShareSECURITIES AND EXCHANGE COMMISSION
Washington, D.C. 20549
FORM 8-K
CURRENT REPORT
Pursuant to Section 13 or 15 (d)
of the Securities Exchange Act of 1934
Date of Report (Date of earliest event reported)
March 31, 2015
Community Trust Bancorp, Inc.
(Exact name of registrant as specified in its charter)
|
Kentucky
|
61-0979818
|
|
(State or other jurisdiction of
|
(IRS Employer Identification Number)
|
|
Incorporation or organization)
|
|
|
346 North Mayo Trail
|
|
|
Pikeville, Kentucky
|
41501
|
|
(Address of principal executive offices)
|
(Zip code)
|
(606) 432-1414
(Registrant's telephone number, including area code)
Check the appropriate box below if the Form 8-K filing is intended to simultaneously satisfy the filing obligation of the registrant under any of the following provisions:
| [ ] | Written communications pursuant to Rule 425 under the Securities Act (17 CFR 230.425) |
| [ ] | Soliciting material pursuant to Rule 425 under the Securities Act (17 CFR 240.14a-12) |
| [ ] | Pre-commencement communications pursuant to Rule 14d-2(b) under the Exchange Act (17 CFR 240.14d-2(b)) |
| [ ] | Pre-commencement communications pursuant to Rule 13e-4(c) under the Exchange Act (17 CFR 240.13e-4(c)) |
Item 7.01 – Regulation FD Disclosure
On April 28, 2015, Community Trust Bancorp, Inc. (the "Company") is holding its 2015 Annual Meeting of Shareholders. In connection with this meeting, a presentation is being made by the Company's Chairman, President and CEO, Jean R. Hale, that is accompanied by a series of slides. These slides include information relating to the Company's 2014 and first quarter 2015 financial results, as well as future performance goals. A copy of these slides is being furnished to the Securities and Exchange Commission pursuant to Item 7.01 – Regulation FD Disclosure of Form 8-K and is attached hereto as Exhibit 99.1. The information in this Form 8-K and in Exhibit 99.1 attached hereto shall not be deemed filed for purposes of Section 18 of the Securities Act of 1934, nor shall it be deemed incorporated by reference in any filing under the Securities Act of 1933, except as shall be expressly set forth by specific reference.
Item 9.01 – Financial Statements and Exhibits
(d) Exhibits
The following exhibit is filed with this report:
|
99.1
|
2015 Annual Shareholders' Meeting Presentation
|
Signatures
Pursuant to the requirements of the Securities Exchange Act of 1934, the registrant has duly caused this report to be signed on its behalf by the undersigned thereunto duly authorized.
|
COMMUNITY TRUST BANCORP, INC.
|
|||
|
Date: April 28, 2015
|
By:
|
/s/ Jean R. Hale | |
| Jean R. Hale | |||
|
Chairman, President and Chief Executive Officer
|
|||
Exhibit Index
|
Exhibit No.
|
Description
|
|
99.1
|
2015 Annual Shareholders' Meeting Presentation
|
Exhibit 99.1

2015 Annual Shareholders’ Presentation

Cautionary Statement Information provided herein by CTBI contains “forward-looking” information. CTBI cautions that any forward-looking statements made are not guarantees of future performance and that actual results may differ materially from those in the forward-looking statements. Please refer to CTBI’s 2014 Annual Report on Form 10-K, Cautionary Statement Regarding Forward Looking Statements for additional information. 2

Market Capitalization $639.4 millionDividend Yield 3.28%P/E Ratio 14.6xCompetitive Position2nd largest Kentucky domiciled bank holding company#1 in Kentucky in deposit market share of all Kentucky domiciled FDIC insured institutions 6th largest bank in Kentucky in terms of deposit market share of all FDIC insured institutions Key Metrics Financial data as of December 31, 2014 3

Our Banking Franchise Serving customers in 81 branch locations in 35 counties throughout Kentucky, Tennessee, and West Virginia, including 5 trust offices in Kentucky and Tennessee 4

Our Banking Franchise Central Region Eastern Region Northeastern RegionLoans - $628 million Loans - $848 million Loans - $348 millionDeposits - $683 million Deposits - $1.2 billion Deposits - $505 million• Danville • Floyd/Knott/Johnson • Advantage Valley• Lexington • Hazard • Ashland• Mt. Sterling • Pikeville • Flemingsburg• Richmond • Tug Valley • Summersville• Versailles • Whitesburg• Winchester South Central Region CTICLoans - $591 million Assets Under Management - $2.0 billion (including $0.6 bill CTB)Deposits - $657 million Revenues - $12.9 million• Campbellsville • Ashland• LaFollette • LaFollette• Middlesboro • Lexington• Mt. Vernon • Pikeville• Williamsburg • Versailles Financial data as of December 31, 2014 5
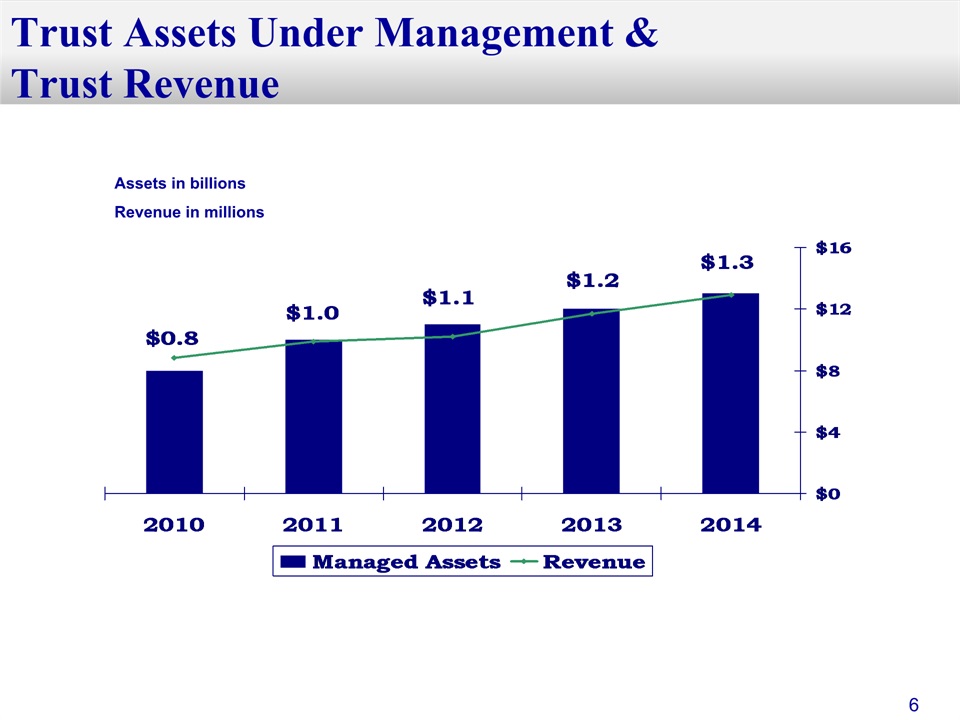
Trust Assets Under Management &Trust Revenue Assets in billionsRevenue in millions 6

2014 Performance 7

2014 Performance Summary Budget ResultsEarnings $46.9 million $43.3 millionEPS $2.70 per share $2.50 per shareROAA 1.28% 1.18%ROAE 10.82% 9.94%Assets $3.71 billion $3.72 billionLoans $2.70 billion $2.73 billionDeposits $3.16 billion $3.11 billionShareholders’ equity $443.7 million $447.9 million 8

Shareholder Value 9

Dividends Per Share *2015 is projected DPS 1.6% 2014 cash dividends increased 2.3%1.6% compound growth rate for past five yearsDecember 31, 2014 cash dividend yield was 3.28%Cash dividend increased to $0.30 per share effective October 1, 2014 10

Shareholders’ Equity (in millions) Shareholders’ equity has increased 32.3% during the past five years6.9% compound growth rate for the past five years2015 goal for shareholders’ equity - $467 to $475 million 6.9% 11

Book ValuePer Share Tangible Common Equity/Assets 12

Total Market Capitalization All data is as of year-end except 2015 which is as of March 31, 2015. Peer data not available as of March 31, 2015.Peer data obtained from SNL Financial; peer group consists of publicly traded regional bank holding companies with an average asset size of $3.7 billion, as defined in our Proxy Statement. (in millions) Price to Tangible Book Value 2010 2011 2012 2013 2014 3/31/15 CTBI 1.63x 1.51x 1.53x 2.06x 1.67x 1.48x Peer 1.29x 1.19x 1.39x 1.72x 1.72x N/A 13

5 Year Cumulative Total ReturnComparison of CTBI, NASDAQ Stock Market (U.S.), and NASDAQ Bank Stocks An investment in CTBI stock on December 31, 2009 would have outperformed the NASDAQ Bank Stocks Index but not the NASDAQ Stock Market (U.S.) at December 31, 2014. 14

Comparison to Russell 2000 Indexof Small Cap Companies Return to Investors 3-, 5-, and 10-year total returns annualized December 31, 2014 15
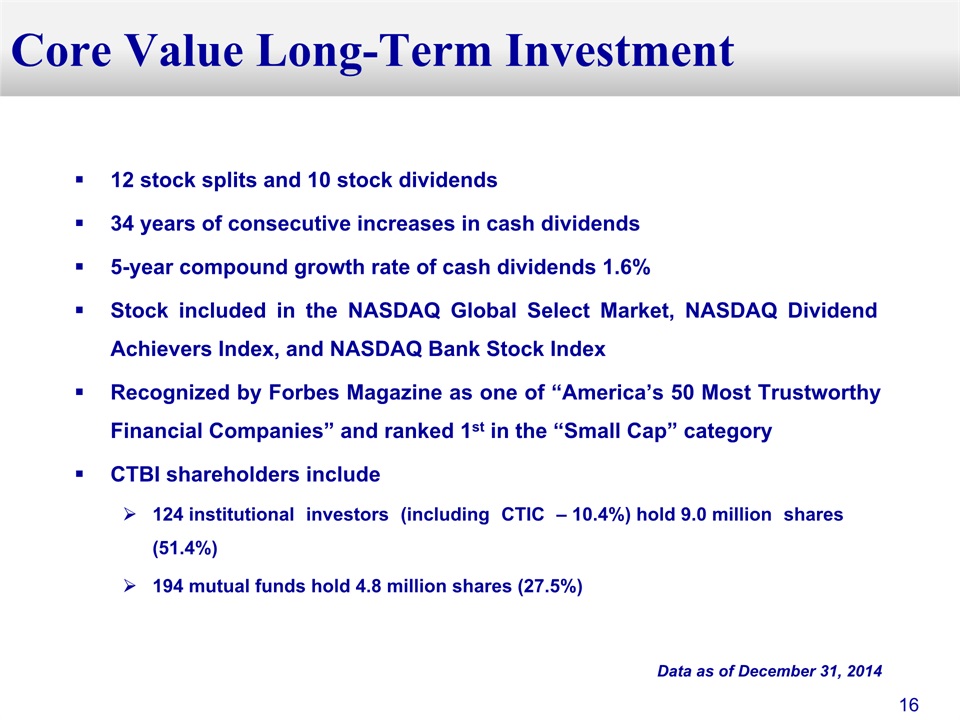
Core Value Long-Term Investment 12 stock splits and 10 stock dividends34 years of consecutive increases in cash dividends5-year compound growth rate of cash dividends 1.6%Stock included in the NASDAQ Global Select Market, NASDAQ Dividend Achievers Index, and NASDAQ Bank Stock IndexRecognized by Forbes Magazine as one of “America’s 50 Most Trustworthy Financial Companies” and ranked 1st in the “Small Cap” categoryCTBI shareholders include124 institutional investors (including CTIC – 10.4%) hold 9.0 million shares (51.4%)194 mutual funds hold 4.8 million shares (27.5%) Data as of December 31, 2014 16

Earnings Review 17

EPS decreased 4.9% from 2013 to 20142015 EPS goal - $2.55 to $2.65 per share Earnings Per Share 18

Return on Average Assets Peer data obtained from the Federal Reserve Bank Holding Company Performance Report as of 12/31/2014 for bank holding companies with consolidated assets of $3 billion to $10 billion. 19

(in millions) Net Income Net income decreased 4.3% from 2013 to 20142015 goal for net income - $44.0 to $47.0 million 20

Revenues (in millions) 2014 revenues decreased 3.7% from 20132015 goal for revenues - $178.5 to $184.5 million 21

2014 noninterest income decreased 8.6% from 2013Decreases in gains on sales of loans, deposit service charges, loan related fees, and other noninterest income due to the prior year death benefits received in bank owned life insurance2015 goal for noninterest revenue – 22.0% to 26.0% of total revenue Noninterest Incomeas a % of Total Revenue (in millions) 22

2014 net interest revenue decreased by 1.9% from 2013Net interest margin decreased 11 basis pointsAverage earning assets increased $38.2 million, or 1.1% (in millions) Net Interest Revenue 23

Net Interest Margin Pressure on the margin1-year cumulative gap position at 12/31/14 – (5.81)% % of assets repricingWithin 30 days 33.02%% of liabilities repricing Within 30 days 16.25%Within 90 days 27.43%Within 180 days 38.32% Peer data obtained from the Federal Reserve Bank Holding Company Performance Report as of 12/31/2014 for bank holding companies with consolidated assets of $3 billion to $10 billion. 24

Net Noninterest Expenseas a % of Average Earning Assets Noninterest Expense & Efficiency Ratio (in millions) (in millions) Peer data obtained from the Federal Reserve Bank Holding Company Performance Report as of 12/31/2014 for bank holding companies with consolidated assets of $3 billion to $10 billion. 25

Balance Sheet Review 26

Total assets at 12/31/14 increased $142.0 million, or 4.0%, from 12/31/2013Loans increased $118.5 million or 4.5%Investment portfolio growth $30.8 million or 5.0%Deposits growth $46.3 million or 1.5%2015 goal for total assets - $3.70 to $3.90 billion (in billions) Total Assets 27

(in billions) Total Loans Total loans at 12/31/14 increased 4.5% from 12/31/13Loan production for the year totaled $0.7 billion2015 goal for total loans - $2.80 to $2.85 billion December 31, 2014 Loan PortfolioMix 28

Concentrations of Creditas a % of Total Loans December 31, 2014 * As a percentage of funded exposure 29

Net Charge-offsas a % of Average Loans NonperformingLoansas a % of Total Loans Peer data obtained from the Federal Reserve Bank Holding Company Performance Report as of 12/31/2014 for bank holding companies with consolidated assets of $3 billion to $10 billion. December 31, 2014 30

Nonperforming Assetsas a % of Total Assets Loan Loss Reserveas a % of Net Loans $36.8 million in other real estate owned Peer data obtained from the Federal Reserve Bank Holding Company Performance Report as of 12/31/2014 for bank holding companies with consolidated assets of $3 billion to $10 billion. 31

Total Other Real Estate Owned Sales of foreclosed properties for the year ended 12/31/14 $12.9 millionNew bookings in 2014 $12.2 millionProperties under contract to sell $2.0 million (in millions) 32
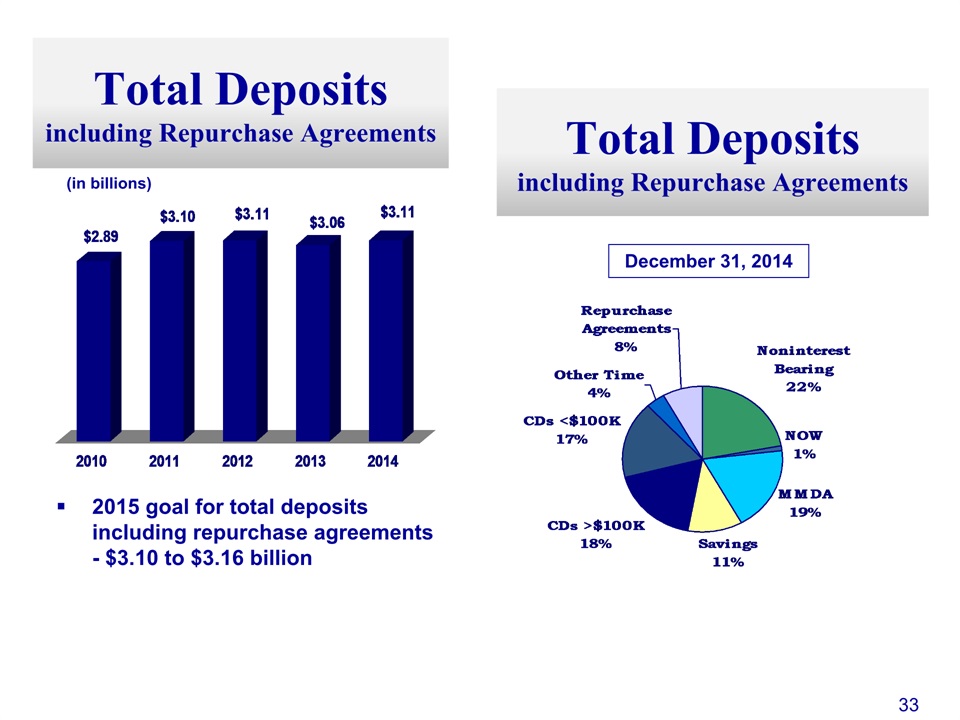
(in billions) Total Depositsincluding Repurchase Agreements 2015 goal for total deposits including repurchase agreements - $3.10 to $3.16 billion Total Depositsincluding Repurchase Agreements December 31, 2014 33

1st Quarter 2015 Review 34

Earnings Per Share 35

(in millions) Net Income 36

Net interest incomeIncreased $0.2 million year over yearDecreased $0.6 million quarter over quarterProvision for loan lossesIncreased $0.6 million year over yearDecreased $1.5 million quarter over quarterNoninterest incomeIncreased $0.7 million year over yearDecreased $1.3 million quarter over quarterNoninterest expenseDecreased $1.0 million year over yearDecreased $2.2 million quarter over quarter Net Income 37

(in millions) Noninterest Income Q-O-QDecreases in gains on sales of loans, deposit service charges, trust revenue, and loan related feesImpacted by fewer number of days and substantial inclement weather in 1st quarter 2015Y-O-YIncreases in gains on sales of loans, deposit service charges, trust revenue, and loan related fees 38
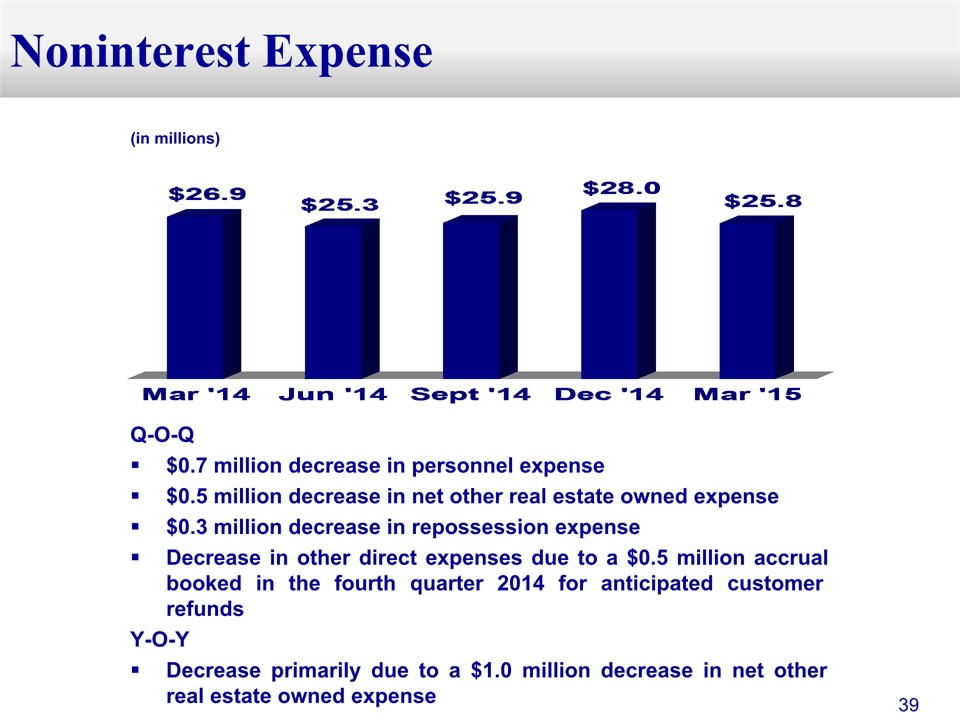
(in millions) Noninterest Expense Q-O-Q$0.7 million decrease in personnel expense$0.5 million decrease in net other real estate owned expense$0.3 million decrease in repossession expenseDecrease in other direct expenses due to a $0.5 million accrual booked in the fourth quarter 2014 for anticipated customer refundsY-O-YDecrease primarily due to a $1.0 million decrease in net other real estate owned expense 39

Loan portfolio increased at an annualized rate of 1.9% during the quarterCommercial loans increased $4.9 millionIndirect loans increased $17.0 millionResidential loans decreased $7.1 millionConsumer direct loans decreased $2.1 millionLoan increase from prior year first quarter 6.2% (in billions) Total Loans 40
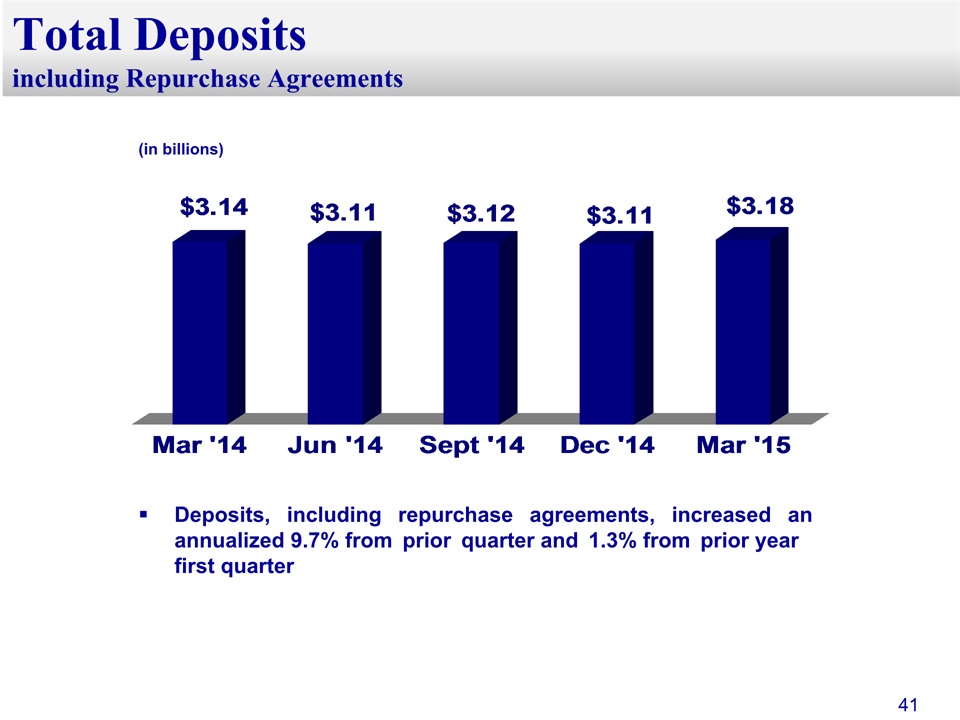
Deposits, including repurchase agreements, increased an annualized 9.7% from prior quarter and 1.3% from prior year first quarter (in billions) Total Depositsincluding Repurchase Agreements 41

Nonperforming Loansas a % of Total Loans 42

Nonperforming Assetsas a % of Total Assets 43

Net Charge-offsas a % of Average Loans (annualized) 44

Efficiency Ratio 45

Key Strategic Initiatives 46

Operational Priorities Continuing focus on improving asset qualityLiquidation of other real estate ownedBuild core earnings capacityQuality loan growthLow cost deposit growthIncrease noninterest incomeWealth managementBrokerageLife insuranceMaintain net interest marginExpense control 47

CTBI: 2015 Outlook Net Income $44 - $47 millionEarnings Per Share $2.55 - $2.65 per shareROAA 1.18% - 1.24% ROAE 9.30% - 10.30% Assets $3.70 - $3.90 billionLoans $2.80 - $2.85 billionDeposits $3.10 - $3.16 billionShareholders’ Equity $467 - $475 million 48

CTBI’s Franchise Value History of solid investor returnsHistorically strong capital positionCommunity banking strategyGrowth and good financial performance in slow growth marketsGrowth strategiesStrong experienced management team and over 1,000 dedicated employeesOur shareholders 49
To Our Shareholders Your management has a Strategic Plan for the performance and operations of your company. Success will be attained by the execution of this plan, not just by management, but by approximately 1,000 employees. The continuing support by you, our shareholders, by referring your friends, neighbors, and business associates to do business with your bank, is invaluable to the execution of our plans for the performance of your Company. 50

Serious News for Serious Traders! Try StreetInsider.com Premium Free!
You May Also Be Interested In
- Community Trust Bancorp (CTBI) Declares $0.46 Quarterly Dividend; 4.3% Yield
- Tufts Medicine, Navvis Partner to Accelerate Value-Based Care, Driving Healthcare Transformation in Massachusetts
- BOK Financial Corporation Reports Quarterly Earnings of $84 million, or $1.29 Per Share, in the First Quarter
Create E-mail Alert Related Categories
SEC FilingsSign up for StreetInsider Free!
Receive full access to all new and archived articles, unlimited portfolio tracking, e-mail alerts, custom newswires and RSS feeds - and more!
