

Form 8-K COMERICA INC /NEW/ For: Oct 20
 Tweet
Tweet Share
ShareUNITED STATES
SECURITIES AND EXCHANGE COMMISSION
Washington, D.C. 20549
---------------
FORM 8-K
CURRENT REPORT
Pursuant to Section 13 or 15(d) of the Securities Exchange Act of 1934
Date of Report (Date of earliest event reported): October 20, 2016
COMERICA INCORPORATED
(Exact name of registrant as specified in its charter)
Delaware ------------ | 1-10706 ---------- | 38-1998421 --------------- |
(State or other Jurisdiction of Incorporation) | (Commission File Number) | (IRS Employer Identification Number) |
Comerica Bank Tower
1717 Main Street, MC 6404
Dallas, Texas 75201
--------------------------------------------------------------------
(Address of principal executive offices) (zip code)
(214) 462-6831
------------------------------------------------------------------------
(Registrant's telephone number, including area code)
Check the appropriate box below if the Form 8-K filing is intended to simultaneously satisfy the filing obligation of the registrant under any of the following provisions:
[ ] Written communications pursuant to Rule 425 under the Securities Act (17 CFR 230.425)
[ ] Soliciting material pursuant to Rule 14a-12 under the Exchange Act (17 CFR 240.14a-12)
[ ] Pre-commencement communications pursuant to Rule 14d-2(b) under the Exchange Act (17 CFR 240.14d-2(b))
[ ] Pre-commencement communications pursuant to Rule 13e-4(c) under the Exchange Act (17 CFR 240.13e-4(c))
ITEM 7.01 | REGULATION FD DISCLOSURE. |
Comerica Incorporated (“Comerica”) today issued a press release announcing that it has reported its 2016 mid-year company-run stress test results, as required under the Dodd-Frank Wall Street Reform and Consumer Protection Act of 2010. The information is available in the Investor Relations section of Comerica's website at investor.comerica.com, on the “Regulatory Disclosures” page under "Financial Reports." A copy of the summary results that will be posted on Comerica’s website and a copy of the press release are being furnished as Exhibit 99.1 and 99.2, respectively, to this report and are incorporated by reference under this Item 7.01. Information contained on Comerica's website is not incorporated by reference into this report.
The information in Items 7.01 and 9.01 of this report (including Exhibits 99.1 and 99.2 hereto) is being “furnished” and shall not be deemed “filed” for the purposes of Section 18 of the Securities Exchange Act of 1934, as amended, is not subject to the liabilities of that section and is not deemed incorporated by reference in any filing under the Securities Act of 1933, as amended, or the Securities Exchange Act of 1934, as amended, except as shall be expressly set forth by specific reference in such a filing.
ITEM 9.01 FINANCIAL STATEMENTS AND EXHIBITS.
(d) Exhibits
99.1 Summary Results of Dodd-Frank Act Stress Test
99.2 Press Release dated October 20, 2016
SIGNATURES
Pursuant to the requirements of the Securities Exchange Act of 1934, as amended, the registrant has duly caused this report to be signed on its behalf by the undersigned hereunto duly authorized.
By: | /s/ John D. Buchanan____________________ |
Name: | John D. Buchanan |
Title: | Executive Vice President - Chief Legal Officer and Corporate Secretary |
Date: October 20, 2016
EXHIBIT INDEX
Exhibit No. | Description |
99.1 | Summary Results of Dodd-Frank Act Stress Test |
99.2 | Press Release dated October 20, 2016 |
Summary Results of Dodd-Frank Act Stress Test 1
Dallas/October 20, 2016 – Comerica Announces Summary Results of its Dodd-Frank Act Stress Test
1 | Introduction |
The 2016 Mid-Year Dodd-Frank Act Stress Test (DFAST) results of Comerica Incorporated (Comerica or the Corporation) indicate that Comerica would maintain sufficient capital ratios throughout the nine-quarter forecasting horizon.
Pursuant to CFR §252.148, the following is a summary of the results of the 2016 Mid-Year DFAST Severely Adverse scenario of Comerica, based upon the scenario and assumptions discussed below.
Loss Projections BHC Severely Adverse Scenario | 9-Quarter Total | |
$ in Billions | % | |
Total Loan Losses % of Average Loans | $2.28 | 4.9% |
Pre-Provision Net Revenue (PPNR) % of Average Assets | 1.42 | 2.1% |
Pre-Tax Income % of Average Assets | (1.51) | (2.2)% |
Capital Ratios BHC Severely Adverse Scenario | Actual 2Q2016 | Minimum* |
Common Equity Tier 1 Capital Ratio | 10.5% | 9.4% |
Tier 1 Risk - Based Capital Ratio | 10.5% | 9.4% |
Total Risk - Based Capital Ratio | 12.7% | 11.8% |
Tier 1 Leverage Ratio | 10.4% | 8.7% |
* "Minimum" means Comerica's lowest result for any quarter over the 9-quarter forecast period. The Federal Reserve Board clarified on November 6, 2014, that the Comprehensive Capital Analysis and Review (CCAR) minimum regulatory capital ratios do not apply in the DFAST scenarios, and therefore there are no minimum capital requirements in the DFAST.
The Dodd-Frank Wall Street Reform and Consumer Protection Act (Dodd-Frank Act), pursuant to section 165(i)(2), requires all bank holding companies (BHCs) with total consolidated assets of $50 billion or more to develop a set of forward-looking stress tests twice each year. This includes a mid-year stress test based upon hypothetical economic scenarios developed internally by the BHC and a year-end stress test based upon hypothetical economic scenarios developed both internally and by the Federal Reserve Board (FRB). The estimated financial results of the stress test will identify the projected capital position of a corporation under hypothetical severely adverse economic conditions that include both systemic
Summary Results of Dodd-Frank Act Stress Test 2
and BHC-specific risks, as defined by the BHC, to determine if there is sufficient capital to absorb losses and support operations.
For the DFAST forecasts, subjected BHCs are required to use a uniform set of capital assumptions over the nine-quarter planning period, which includes using actual capital actions for the first quarter of the planning horizon, and using the following assumptions for the second through the ninth quarters of the planning horizon: (i) no issuances or redemptions of regulatory capital instruments (except for issuances related to expensed employee compensation), (ii) quarterly common stock dividend distributions equal to the average quarterly amount of common stock dividends paid in the prior year (plus dividends attributable to issuances related to expensed employee compensation), and (iii) capital instrument payments that must be equal to the previously stated expectations of dividends, interest, or principal payments.
2 | Economic Scenario |
Comerica has developed the BHC Severely Adverse scenario working with its Economics Department and in conjunction with a third-party macroeconomic forecasting service. The BHC Severely Adverse scenario reflects a hypothetical low-probability, distressed macroeconomic environment. The impact of certain Comerica idiosyncratic vulnerabilities were further added on to the BHC Severely Adverse scenario.
The BHC Severely Adverse scenario is characterized by a severe six-quarter recession. The hypothetical recession is launched in mid-2016 from a drop-off in U.S. exports and business investment. Additionally, the stock market plunges as negotiations over the U.K.'s departure from the EU break down, causing other nations to consider leaving and global trade to weaken. As a result, oil prices decline steeply, lowering business investment and energy exploration. Consumer sentiment and spending decrease sharply due to reduced household wealth and high unemployment. More specifically, the unemployment rate increases to a maximum of approximately 10.0% in 1Q2018, but then gradually recedes. Inflation is negative from mid-2016 through mid-2017, with the Consumer Price Index declining through the recession. To prevent the economy from sliding further, the federal funds rate is projected to be anchored near zero throughout the forecast.
The BHC Severely Adverse scenario also includes idiosyncratic elements, including the use of a hyper-stressed technology and life sciences market with a corresponding impact on the Northern California real estate market, and a Houston real estate market that has been impacted by depressed energy prices. An operational scenario event related to Comerica's retail debit card portfolio was considered, along with a liquidity crisis event in which Comerica experiences a significant run-off of deposits and draws on unused loan commitments, which leads to higher credit losses.
3 | Risks accounted for in stress-testing results |
Comerica developed its capital management process, leveraging its existing risk management structure in order to ensure that capital adequacy was assessed based on all of its material risks and its associated risk profile. Comerica assumes various types of risk in the normal course of business. While management classifies its key risk exposures into seven areas: (i) credit, (ii) market, (iii) liquidity, (iv) operational,
Summary Results of Dodd-Frank Act Stress Test 3
(v) compliance, (vi) financial reporting, and (vii) strategic risks, it also evaluates its total portfolio risk exposures through its enterprise-wide risk management structure.
3.1 | Enterprise Risk Management |
Comerica's Enterprise Risk Division, headed by the Chief Risk Officer (CRO), represents Comerica's second line of defense, which provides objective oversight and support to the organization as it continually re-assesses and mitigates risk. The Enterprise Risk Division ensures that appropriate risk management practices and processes are in place to maintain risk levels within the requirements of the risk appetite laid out by the Board of Directors through the implementation of the Corporation's enterprise risk management framework. Specialized risk managers, along with the risk management committees for each of the seven major risk categories, are responsible for the day-to-day management and governance of those respective risks.
The monitoring and coordination of the Corporation's risk resides with Comerica’s Enterprise-Wide Risk Management (EWRM) Committee. The EWRM Committee is responsible for monitoring governance over the enterprise-wide risk management processes and providing oversight in managing Comerica’s aggregate risk position. The EWRM Committee is principally made up of various senior managers from the different risk areas and business units. The EWRM Committee has reporting responsibility to the Enterprise Risk Committee (ERC) of the Board of Directors.
In order to facilitate the enterprise-wide risk management process, the Enterprise Risk Division provides the resources for the EWRM Committee to carry out its responsibilities. The Enterprise Risk Division is responsible for processes supporting risk identification and assessment, planning and coordinating the enterprise stress-testing activities, and the production of the Capital Plan. In addition, the Model Risk Management Department, under the CRO, provides a recurring independent validation function of the various risk-management models that work in concert with Comerica’s internal audit processes (third line of defense).
3.2 | Credit Risk Management |
Comerica considers credit risk to be, in aggregate, its most significant risk. Credit risk is the risk of loss due to the failure of customers or counterparties to meet their financial obligations to Comerica in accordance with contractual terms.
At the relationship level, Comerica manages credit risk through conservative underwriting, skilled and experienced relationship management, oversight by an objective Credit Administration function, approval and periodic review of all significant credit exposures, early identification and elevated management of increasing credit risk, and detailed credit policies and guidelines. At the portfolio level, Comerica mitigates the impact of credit risk through loan portfolio diversification. In addition to geographic diversification naturally achieved through Comerica's multi-state footprint, Comerica limits exposure to any single industry, customer, high risk loan type, or guarantor.
The governance of the credit risk process begins with the Strategic Credit Committee, which is chaired by the Chief Credit Officer and is supported by various other corporate resources. Credit Administration
Summary Results of Dodd-Frank Act Stress Test 4
provides the resources to help manage business line transactional credit risk by ensuring that all credit exposure is properly underwritten and risk rated according to the requirements of the Credit Risk Rating Policy. Credit Administration also provides business segment reporting as necessary.
Portfolio Risk Analytics, a part of the Enterprise Risk Division, provides comprehensive reporting on the status and migration of portfolio credit risks, continuous assessment and verification of risk rating models, methodology to determine the quarterly calculation of the allowance for loan losses and the allowance for credit losses on off-balance-sheet items, quarterly calculation of credit risk economic capital, and periodic stress testing of the credit risk portfolio.
The Corporation's Asset Quality Review function, a division of Internal Audit, audits the accuracy of internal risk ratings that are assigned by the lending and credit groups.
The Special Assets Group is responsible for managing the recovery process of distressed or defaulted loans and loan sales.
3.3 | Market and Liquidity Risk Management |
Market risk represents the risk of loss due to adverse movements in financial markets, including interest and foreign exchange rates, as well as commodity and equity prices. Liquidity risk represents (i) the failure to meet financial obligations, when due, that results from an inability to liquidate assets or obtain adequate funding and (ii) the inability to easily unwind or offset specific exposures without taking a significant loss due to market disruptions or inadequate market depth.
The Asset Liability Policy Committee (ALCO) establishes and monitors compliance with the policies and risk limits pertaining to market and liquidity risk management activities. Comerica’s Enterprise Risk Division and Treasury Department support ALCO in measuring, monitoring, and managing interest rate risk and liquidity risk, and in coordinating all other market risks. This encompasses a variety of key activities, from analysis of risk positions and balance sheet structures to recommendations on risk mitigants. More specifically, the Enterprise Risk Division and the Treasury Department monitor risk levels, anticipate potential needs, and devise solutions for ALCO’s consideration, including actions such as interest rate risk hedging (both on- and off-balance sheet), debt and capital issuance for liquidity management, and security portfolio size and composition. In addition, the Enterprise Risk Division and the Treasury Department support ALCO through the development of economic capital estimates for market risk and the monitoring of capital adequacy in accordance with Comerica’s Capital Management Policy.
3.4 | Operational Risk Management |
Operational risk represents the risk of loss resulting from inadequate or failed internal processes, people, systems, or external events. Operational risk is mitigated through a system of internal controls that are designed to keep operating risks at appropriate levels. This system of controls is tailored to each business unit’s specific risk profile and is comprised of a combination of system controls and manual controls (including management review and oversight) designed specifically to detect and prevent operational failures.
Summary Results of Dodd-Frank Act Stress Test 5
For governance purposes, Comerica established an Operational Risk Management Committee to help ensure that appropriate risk management techniques and systems are maintained. Comerica has developed a framework that includes a centralized operational risk management function and support personnel who are responsible for managing operational risk specific to the respective business lines. In addition, Internal Audit staff monitor and assess, through extensive audit testing, the overall effectiveness of the system of internal controls on an ongoing basis.
3.5 | Compliance Risk Management |
Compliance risk represents the risk of regulatory sanctions or financial loss resulting from failure to comply with regulations and standards of prudent banking practice. Activities that may expose Comerica to compliance risk include, but are not limited to, those dealing with the prevention of money laundering, privacy and data protection, community reinvestment initiatives, fair lending, consumer protection, employment and tax matters, over-the-counter derivative activities, and other activities regulated by the Dodd-Frank Act. Comerica established an Enterprise-Wide Compliance Committee (EWCC) consisting of senior business unit managers, as well as managers responsible for a broad array of risk and audit management. This enterprise-wide approach provides a consistent view of compliance across the organization. The EWCC also ensures that appropriate actions are implemented in business units to mitigate risk to an acceptable level.
3.6 | Financial Reporting Risk Management |
Financial reporting risk represents the risk of loss or other adverse impacts to Comerica arising from material inaccuracies or misstatements in financial reporting. These risks are mitigated through a comprehensive system of governance and controls that ensure accurate results are provided for internal and external reporting purposes. Additionally, the Disclosure Sign-Off Committee, consisting of senior representatives from all lines of business, ensures that appropriate processes and controls have occurred to produce accurate financial results.
3.7 Strategic Risk Management
Strategic risk represents the risk of loss due to the impairment of reputation; failure to fully develop and execute business plans; failure to assess current and new business, market, and product opportunities; failure to require appropriate compensation for risk taken; and any other event not identified in the defined risk categories of credit, market, liquidity, operational, compliance, or financial reporting risks. Mitigation of the various elements that represent strategic risk is achieved through initiatives to help the Corporation better understand and report on the various risks.
All risks faced by Comerica fall into one of the seven categories discussed above and are incorporated into the stress-testing process through a variety of quantitative models and qualitative considerations where statistical models are not capable.
4 | Methodologies used and resulting stress-test estimates |
Comerica employs numerous quantitative and qualitative methods in the stress-testing processes to forecast the impact of the risks over a nine-quarter forecast period. The methods developed are focused
Summary Results of Dodd-Frank Act Stress Test 6
on a repeatable, transparent process that ties forecast results to macroeconomic variables to ensure Comerica’s ability to forecast using given economic scenarios. Methods include statistical modeling techniques (regression models, Monte Carlo simulations, actuarial models, mathematical finance models, etc.) for primary forecasts, along with challenger models for benchmark forecasts, historical trend analysis, scenario analysis, and calibration with expert management judgment, where appropriate. There are many core statistical models used to generate forecast results sensitive to macroeconomic scenarios throughout the stress-testing process. Key models employed were back-tested by comparing forecasts against Comerica’s historical results and industry performance to ensure relevance and consistency. Key models are subject to sensitivity analysis entailing both parameter stability analysis and data sensitivity analysis.
An independent model risk governance team reviews and validates the components of the model development, the reasonability of the forecast results, and the accuracy of model and mathematical calculations. Additionally, the organization involves a collection of various committees consisting of differing levels of management and business expertise that provide input into the model development process and challenge the stress-testing results from a business perspective to ensure alignment with business expectations given the economic scenario. Quantitative and qualitative overlays and buffers are incorporated into the forecast estimates to account for internal strategic initiatives, tactical business decisions, or identified model weaknesses and limitations, where appropriate.
Final results and submissions to the Federal Reserve are reviewed, challenged, and formally approved by Comerica’s Board of Directors.
Comerica’s Economics Department and the Enterprise Risk Division manage a broad collection of macroeconomic variables that are part of the overall forecasting process. These variables include a broad spectrum of income, interest rate, market, and housing variables.
The methodologies used for each major component of the stress-testing process and the resulting model estimates are summarized below.
4.1 | Credit Losses and Allowance for Loan and Lease Losses (ALLL): Model Development and Estimates |
4.1.1 | Credit Loss Forecasts - Commercial Loans |
Commercial loans represent more than 90% of Comerica's credit risk exposure. Commercial and Industrial (C&I) loans are dominated by exposures to middle market and large corporate borrowers, small business companies, and private banking customers, which are primarily located in Comerica's operating footprint. The C&I portfolio also includes exposures to an assortment of specialty industries and, to a lesser extent, international businesses.
Comerica's Commercial Real Estate (CRE) loans include the financing of construction projects and income-producing properties located primarily in Comerica's operating footprint. CRE also includes credit exposures to real estate investment trusts, real estate developers, national homebuilders, and other entities deemed to represent commercial real estate risk, even though the financing may not be project or property specific.
Summary Results of Dodd-Frank Act Stress Test 7
Comerica utilized several internally developed quantitative models to forecast credit losses for its C&I and CRE portfolios, as well as related exposures to derivative and foreign exchange product counterparties. Core loss-forecasting models were developed at granular levels for C&I business segments and CRE product segments that had historically demonstrated different degrees of sensitivity to the macroeconomic environment. Exposure to owner-occupied CRE was modeled in the owner's C&I segment due to the nature of the collateral and underwritten repayment sources. Unsecured exposures to entities deemed to be primarily related to CRE (i.e., national developers and real estate investment trusts) were modeled as C&I, since they are managed similarly to large corporate borrowers. Certain personal purpose loans that are underwritten and have the same cash flow repayment source as wholesale loans, such as loans to owners of C&I customers, were modeled in the relevant C&I or CRE segment.
Core models for each of these segments were developed to generate loss forecasts by projecting quarterly probability of default (PD), loss given default (LGD), exposure at default (EAD), and changes in the risk profile of the portfolio under different economic conditions. The models used (i) the credit exposure and risk profile of each segment at the outset of the forecast period, (ii) forecasts of the outstanding balance for each segment through the forecast period, and (iii) combinations of predictive macroeconomic variables demonstrated to have been specifically relevant to each C&I and CRE segment's credit loss drivers (PD, LGD, and EAD). For each of the C&I and CRE segments, default forecasting is based on actual, historical risk migration patterns and sensitivity to the macroeconomic environment. LGD and EAD projections for each of the segments are based on historically demonstrated sensitivity of those factors to changes in the macroeconomic environment.
In addition to the core credit loss forecasting models based on the performance history of Comerica's own portfolio, Comerica has constructed macroeconomic sensitive challenger models using relevant external data and alternative modeling methodologies. The output of these challenger models serves to benchmark and influence the final credit loss forecasts in the stressed scenarios. Incorporating the results of these challenger models served to amplify the loss forecasts generated by the core models and resulted in losses greater than Comerica's credit loss history.
4.1.2 | Credit Loss Forecasts - Retail Loans |
The Retail portfolios mainly consist of loans secured by residential real estate originated directly from borrowers in Comerica's footprint. Over 70% of retail outstanding loans are associated with customers who have other Comerica relationships.
Retail portfolios were modeled in two segments, Residential Mortgage and Home Equity. Together, these loans represent over 90% of the total Retail portfolio. The remainder of the Retail portfolio consists of exposures to product segments too small to serve as the basis for separate models. Loss forecasts for these small segments are based on the more sensitive Home Equity model.
Models for each of these segments were developed using Comerica's historic portfolio performance to generate loss forecasts by projecting monthly payment status (current, 30/60/90 days past due, defaulted and paid-in-full), exposure at default, loss given default and changes in those risk metrics under different economic conditions. Loss forecasts incorporate the outstanding balance (and unused
Summary Results of Dodd-Frank Act Stress Test 8
availability for home equity lines of credit) and risk profile of each segment at the outset of the forecast period, forecasts of new business volume and the outstanding balances for each segment through the forecast period, together with macroeconomic variables with demonstrated predictive power specific to each Retail segment and risk driver.
In addition to the core credit loss forecasting models based on the performance history of Comerica's own Retail portfolios, Comerica constructed macroeconomic sensitive challenger models using relevant external data and alternative modeling methodology. The output of these challenger models serves to benchmark and influence the final credit-loss forecasts in the stressed scenario. Incorporating the results of these challenger models served to amplify the loss forecasts generated by the core models to levels not previously experienced in Comerica's credit loss history.
4.1.3 | Allowance for Loan and Lease Losses (ALLL) and Provision |
The Comerica ALLL forecasting models and related provision expense are driven by modeled balances, risk distribution, portfolio losses, and select macroeconomic variables over the nine-quarter forecast period. Several key ratios are employed to ensure that the modeled results of ALLL are appropriate and provide sufficient coverage of expected losses.
The table below identifies the cumulative nine-quarter forecasted loan loss estimates for Comerica based upon the hypothetical BHC Severely Adverse economic scenario.
Projected Loan Losses, by Type of Loan, 3Q2016-3Q2018
Loan Loss Rates BHC Severely Adverse Scenario | 9-Qtr Total | |
$ in Billions | Portfolio Loss Rate | |
Loan Losses | 2.28 | 4.9% |
First Lien Mortgages, Domestic | 0.04 | 2.7% |
Junior Liens and HELOCs, Domestic | 0.05 | 2.9% |
Commercial and Industrial | 1.82 | 5.0% |
Commercial Real Estate | 0.36 | 5.6% |
Credit Cards | — | —% |
Other Consumer | 0.01 | 2.8% |
Other Loans | — | —% |
The above-referenced charge-offs and loss rates are based upon Comerica’s internal credit segmentation and do not necessarily align with regulatory reporting segments. Comerica models owner-occupied CRE as a C&I loss type due to the nature of the collateral and repayment sources in addition to its loss history. Owner-occupied CRE is reported as CRE exposure in regulatory reporting.
Summary Results of Dodd-Frank Act Stress Test 9
4.2 | Pre-Provision Net Revenue (PPNR) and Other Risks: Model Development and Estimates |
The development of PPNR components is integral to estimating credit losses and capital impacts for the stress-testing process. Major balance sheet and income statement items, including loans, deposits, noninterest income, and noninterest expense, are forecasted based upon the outputs of statistical regression models that properly quantify the relationship between macroeconomic variables and internal historical results at a granular level of product or business line segmentation. Macroeconomic variables used in the models are selected based upon business and statistical reviews. Final model selection includes both a business and a statistical review, ensuring that forecasts are in line with management expectations and that the model passes a collection of statistical tests to confirm reliable and stable results. The forecasts used for stress testing are reviewed from a business perspective with overlays of management expertise where justified by identified strategic plans, tactical business changes, or other model limitations.
4.2.1 | Balance Sheet Projections |
Balance sheet forecasts are based upon a combination of statistical models for each major asset and liability component, combined with other mathematical formulas and management judgment for estimates of balances in smaller balance sheet components.
Total accruing loans are divided into granular commercial loan segments by major business lines and retail segments by product type, with statistical regression models tied to macroeconomic variables used to forecast monthly balances in a given economic scenario. The smallest segments of the Commercial and Retail loan portfolios, which combined equate to less than 1% of total accruing loans, are modeled based upon a rolling 12-month average as opposed to a statistical regression model, due to the small size and limited activity.
Total deposits are divided by major product type, with statistical regression models tied to macroeconomic variables used to predict monthly period ending balances in a given economic scenario.
The remaining balance sheet categories that are not driven by macroeconomic variables are estimated using a combination of quantitative relationships tied to internal variables and management judgment.
4.2.2 | Income Statement Projections |
Net interest income is forecasted by using modeled balance estimates of Commercial loans, Retail loans, and deposits noted above and applying forecasted loan and other asset yields, deposit and other liability costs. These are developed based upon a combination of the interest rate environment and management insights.
Noninterest income is forecasted using statistical regression models tied to macroeconomic variables. Noninterest income model segment development used major product categories that were statistically analyzed and examined by subject matter experts for business consistency, in an effort to group the product lines into classes that would resonate similarly to macroeconomic factors.
Summary Results of Dodd-Frank Act Stress Test 10
Noninterest expenses were forecasted in a similar manner to noninterest income, with granular segmentation based on major expense category. A few expense segments were modeled with quantitative historical financial relationships to a macroeconomic variable or scenario as opposed to a statistical regression model, which more appropriately captured the response in a given economic scenario.
In mid-July, the Corporation announced the implementation of its growth in efficiency and revenue initiative ("GEAR Up"). The initiative has identified meaningful opportunities for the Corporation to operate more efficiently and lower expenses, as well as drive increased revenue. The Corporation is taking a timely, yet thoughtful approach to executing GEAR Up, which is expected to allow the enterprise to build a stronger, more competitive, and more profitable organization. For Mid-Year DFAST 2016 results, consideration was given to the Corporation's GEAR Up initiative.
Classification of operational risk losses follows the Basel arrangement with the seven event types (such as internal loss, external loss, etc.) serving as the unit of measure, and each unit of measure follows the actuarially-based Loss Distribution Approach (LDA).
The LDA methodology indicates separate models for frequency and severity. In this process, a scarcity of tail events (events that are rare and very severe) were mitigated by augmenting internal loss tail data with results from internal survey data. Macroeconomic variables act as drivers of a unit of measure frequency, and the frequency was dialed up or down depending on the severity of the specific scenario. This algorithm was applied to each event type and aggregated to obtain a total stressed expected loss for the given scenario.
Other unique risks were captured in loss estimates based upon the distinctive characteristics of each individual portfolio.
The table below identifies the cumulative nine-quarter forecasted estimates of revenues and expenses for Comerica based upon the hypothetical BHC Severely Adverse economic scenario.
Summary Results of Dodd-Frank Act Stress Test 11
Projected Losses, Revenue, and Net Income Before Taxes through 3Q2018
BHC Severely Adverse Scenario | 9-Qtr Total | |
$ in Billions | % of Average Assets | |
Pre-Provision Net Revenue (PPNR) | $1.42 | 2.1% |
Other Revenue | — | |
Less | ||
Provision | 2.83 | 4.2% |
Realized (Gains)/Losses on Securities (AFS/HTM) | 0.00 | 0.0% |
Trading and Counter Party Losses | — | —% |
Other Losses/(Gains) | 0.09 | 0.1% |
Equals | ||
Net Income/(Loss) Before Taxes | (1.51) | (2.2)% |
Total net income/(loss) before taxes over the nine-quarter period in the hypothetical BHC Severely Adverse scenario was estimated at $(1.51) billion, primarily attributable to high levels of credit losses and provisions driven largely by the impact of the six-quarter severe recession on the general economy compounded by losses related to idiosyncratic risk events. Total estimated net losses were also impacted by lower loan volume and lower noninterest income. The capital impact of these estimates is discussed and identified below.
4.3 | Capital: Methodology and Results Summary |
Under the hypothetical 2016 mid-year BHC Severely Adverse scenario, which was performed under DFAST rules, Comerica’s capital position and capital ratios were calculated by analyzing the impact to capital from:
• | Changes in business mix (on- and off-balance sheet); |
• | Changes in projected earnings; |
• | Capital actions as prescribed by the DFAST regulations; and |
• | Any adjustments for regulatory rules. |
The pro forma balance sheet was then risk weighted using the "Standardized Approach for Risk Weighted Assets," the regulatory rules to which Comerica is subject. The change in the level of the total risk-weighted assets from one quarter to the next reflects changes in the overall balance sheet size and mix and changes in off-balance sheet exposures. Risk-weighted asset projections were based on applicable risk weightings pertaining to each type of asset category. The resulting regulatory capital and risk-weighted asset estimates were used to generate pro forma quarterly capital ratios.
Summary Results of Dodd-Frank Act Stress Test 12
Comerica is not an advanced approaches BHC and thus became subject to the Basel III rules beginning in the first quarter of 2015. Comerica's projected capital ratios were calculated in accordance with the final Basel III capital rules and based on the instructions issued by the FRB for the hypothetical DFAST scenarios.
As required by the DFAST rules, certain capital actions and capital distributions assumptions were prescribed by the FRB and do not necessarily represent the actual capital actions that Comerica would intend to take. Instead, DFAST requires BHCs to calculate their pro forma capital ratios using the following assumptions regarding their capital actions over the planning horizon:
• | For the first quarter of the planning horizon, a BHC must take into account its actual capital actions for that quarter; |
• | For each of the second through ninth quarters of the planning horizon, a BHC must include in the projections of capital: |
◦ | Common stock dividends equal to the quarterly average dollar amount of common stock dividends that the BHC paid in the previous year plus common stock dividends attributable to issuances related to expensed employee compensation; |
◦ | Payments on any other instrument that is eligible for inclusion in the numerator of a regulatory capital ratio equal to the stated dividend, interest, or principal due on such instrument during the quarter; and |
◦ | An assumption of no issuance, redemption, or repurchase of any capital instrument that is eligible for inclusion in the numerator of a regulatory capital ratio (which would include an assumption of no common share repurchases), except for issuances related to expensed employee compensation. |
The impact of the aforementioned rules, assumptions, and balance sheet and income statement results on capital ratios in the hypothetical BHC Severely Adverse scenario over the cumulative nine-quarter forecasting period are identified in the table below:
Actual 2Q2016 and Projected Stressed Capital Ratios through 3Q2018
BHC Severely Adverse Scenario | Stressed Capital Ratios | ||
Actual 2Q2016 | 3Q2018 | Minimum * | |
Common Equity Tier 1 Capital Ratio | 10.5% | 9.4% | 9.4% |
Tier 1 Risk-Based Capital Ratio | 10.5% | 9.4% | 9.4% |
Total Risk-Based Capital Ratio | 12.7% | 11.8% | 11.8% |
Tier 1 Leverage Ratio | 10.4% | 8.7% | 8.7% |
* "Minimum" means Comerica's lowest result for any quarter over the 9-quarter forecast period. The Federal Reserve Board clarified on November 6, 2014, that the CCAR minimum regulatory capital ratios do not apply in the DFAST scenarios, and therefore there are no minimum capital requirements in the DFAST.
Summary Results of Dodd-Frank Act Stress Test 13
Actual 2Q2016 and Projected 3Q2018 Risk-Weighted Assets
BHC Severely Adverse Scenario | Actual 2Q2016 | Projected 3Q2018 Basel III Standardized Approach |
Risk-Weighted Assets | 70.1 | 63.1 |
Comerica maintains sufficient levels of capital throughout the forecast horizon, as shown in the table above. In the DFAST BHC Severely Adverse scenario, Common Equity Tier 1 capital declines approximately 110 basis points over the forecast horizon to 9.4%. This decline is primarily driven by an expectation of deterioration in core earnings, as well as rising credit costs exceeding pre-provision net revenues (PPNR) over the nine-quarter forecast horizon. As detailed in the PPNR table, this leads to a forecasted pre-tax net loss of approximately $1.5 billion over the forecast horizon. The aforementioned forecasted net loss is partially mitigated by lower risk-weighted assets, primarily due to lower loan balances over the course of the forecast horizon. In summary, in the 2016 Mid-Year DFAST BHC Severely Adverse scenario, Comerica maintains sufficient capital ratios throughout the forecast horizon, as shown in the above table.
The chart below shows key drivers of Comerica's Common Equity Tier 1 ratio under the 2016 Mid-Year DFAST BHC Severely Adverse scenario.
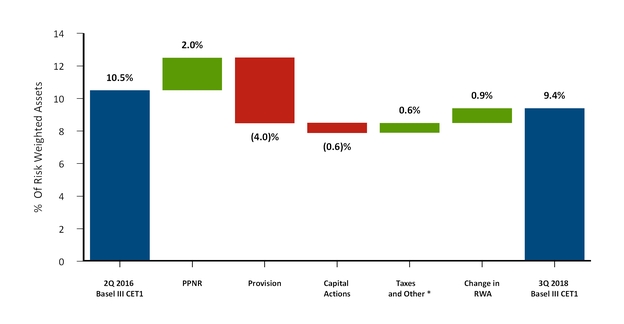
* Represents other items including disallowed deferred tax assets, changes in equity related to equity-based compensation, and other risks.
5 | Forward Looking Statements |
Any statements in this document that are not historical facts are forward-looking statements as defined in the Private Securities Litigation Reform Act of 1995. Words such as “anticipates,” “believes,”
Summary Results of Dodd-Frank Act Stress Test 14
“contemplates,” “feels,” “expects,” “estimates,” “seeks,” “strives,” “plans,” “intends,” “outlook,” “forecast,” “position,” “target,” “mission,” “assume,” “achievable,” “potential,” “strategy,” “goal,” “aspiration,” “opportunity,” “initiative,” “outcome,” “continue,” “remain,” “maintain,” “on course,” “trend,” “objective,” “looks forward,” “projects,” “models” and variations of such words and similar expressions, or future or conditional verbs such as “will,” “would,” “should,” “could,” “might,” “can,” “may” or similar expressions, as they relate to Comerica or its management, are intended to identify forward-looking statements. These forward-looking statements are predicated on the beliefs and assumptions of Comerica's management based on information known to Comerica's management as of the date of this document and do not purport to speak as of any other date. Forward-looking statements may include descriptions of plans and objectives of Comerica's management for future or past operations, products or services, including the GEAR Up initiative, and forecasts of Comerica's revenue, earnings or other measures of economic performance, including statements of profitability, business segments and subsidiaries as well as estimates of the economic benefits of the GEAR Up initiative, estimates of credit trends and global stability. Such statements reflect the view of Comerica's management as of this date with respect to future events and are subject to risks and uncertainties. Should one or more of these risks materialize or should underlying beliefs or assumptions prove incorrect, Comerica's actual results could differ materially from those discussed. Factors that could cause or contribute to such differences are changes in general economic, political or industry conditions; changes in monetary and fiscal policies, including changes in interest rates; changes in regulation or oversight; Comerica's ability to maintain adequate sources of funding and liquidity; the effects of more stringent capital or liquidity requirements; declines or other changes in the businesses or industries of Comerica's customers, in particular the energy industry; unfavorable developments concerning credit quality; operational difficulties, failure of technology infrastructure or information security incidents; reliance on other companies to provide certain key components of business infrastructure; factors impacting noninterest expenses which are beyond Comerica's control; changes in the financial markets, including fluctuations in interest rates and their impact on deposit pricing; reductions in Comerica's credit rating; whether Comerica may achieve opportunities for revenue enhancements and efficiency improvements under the GEAR Up initiative, or changes in the scope or assumptions underlying the GEAR Up initiative; the interdependence of financial service companies; the implementation of Comerica's strategies and business initiatives; damage to Comerica's reputation; Comerica's ability to utilize technology to efficiently and effectively develop, market and deliver new products and services; competitive product and pricing pressures among financial institutions within Comerica's markets; changes in customer behavior; any future strategic acquisitions or divestitures; management's ability to maintain and expand customer relationships; management's ability to retain key officers and employees; the impact of legal and regulatory proceedings or determinations; the effectiveness of methods of reducing risk exposures; the effects of terrorist activities and other hostilities; the effects of catastrophic events including, but not limited to, hurricanes, tornadoes, earthquakes, fires, droughts and floods; changes in accounting standards and the critical nature of Comerica's accounting policies. Comerica cautions that the foregoing list of factors is not exclusive. For discussion of factors that may cause actual results to differ from expectations, please refer to our filings with the Securities and Exchange Commission. In particular, please refer to “Item 1A. Risk Factors” beginning on page 12 of Comerica's Annual Report on Form 10-K for the year ended December 31, 2015 and “Item 1A. Risk Factors” beginning on page 62 of the Corporation’s Quarterly Report on Form 10-Q for the quarter ended June 30, 2016. Forward-looking statements speak only as of the date they are made. Comerica does not undertake to update forward-looking statements to reflect facts, circumstances, assumptions or events that occur after the date the forward-looking statements are made. For any forward-looking statements made in this document or in any other documents, Comerica claims the protection of the safe harbor for forward-looking statements contained in the Private Securities Litigation Reform Act of 1995.
Summary Results of Dodd-Frank Act Stress Test 15
Media Contacts: | Investor Contacts: |
Wendy Bridges | Darlene Persons |
(214) 462-4443 | (214) 462-6831 |
Wayne Mielke | Chelsea Smith |
(214) 462-4463 | (214) 462-6834 |

Comerica Reports 2016 Mid-Year Company-Run Stress Test Results
DALLAS/October 20, 2016 - Comerica Incorporated (NYSE: CMA) today announced that it has reported its 2016 mid-year company-run stress test results, as required under the Dodd-Frank Wall Street Reform and Consumer Protection Act of 2010. The information is available in the Investor Relations section of Comerica’s website at investor.comerica.com, on the “Regulatory Disclosures” page under “Financial Reports.”
Comerica Incorporated is a financial services company headquartered in Dallas, Texas, and strategically aligned by three business segments: The Business Bank, The Retail Bank, and Wealth Management. Comerica focuses on relationships, and helping people and businesses be successful. In addition to Texas, Comerica Bank locations can be found in Arizona, California, Florida and Michigan, with select businesses operating in several other states, as well as in Canada and Mexico. Comerica reported total assets of $74.1 billion at September 30, 2016.
Media Contact: | Investor Contacts: |
Wayne Mielke | Darlene Persons |
(214) 462-4463 | (214) 462-6831 |
Chelsea Smith | |
(214) 462-6834 | |
Serious News for Serious Traders! Try StreetInsider.com Premium Free!
You May Also Be Interested In
- Comerica (CMA) PT Raised to $72 at Baird
- NV Gold Announces Secured Loan Terms
- mF International Limited Announces Pricing of Initial Public Offering
Create E-mail Alert Related Categories
SEC FilingsSign up for StreetInsider Free!
Receive full access to all new and archived articles, unlimited portfolio tracking, e-mail alerts, custom newswires and RSS feeds - and more!
