

Form 8-K CMS ENERGY CORP For: Jul 28 Filed by: CONSUMERS ENERGY CO
 Tweet
Tweet Share
Share
UNITED STATES
SECURITIES AND EXCHANGE COMMISSION
Washington, D.C. 20549
FORM 8-K
CURRENT REPORT
PURSUANT TO SECTION 13 OR 15(d)
OF THE SECURITIES EXCHANGE ACT OF 1934
Date of Report (Date of earliest event reported) July 28, 2016
| Commission File Number |
Registrant; State of Incorporation; Address; and Telephone Number |
IRS Employer Identification No. | ||
| 1-9513 | CMS ENERGY CORPORATION (A Michigan Corporation) One Energy Plaza Jackson, Michigan 49201 (517) 788-0550 |
38-2726431 | ||
| 1-5611 | CONSUMERS ENERGY COMPANY (A Michigan Corporation) One Energy Plaza Jackson, Michigan 49201 (517) 788-0550 |
38-0442310 | ||
Check the appropriate box below if the Form 8-K filing is intended to simultaneously satisfy the filing obligation of the registrant under any of the following provisions:
| ¨ | Written communications pursuant to Rule 425 under the Securities Act (17 CFR 230.425) |
| ¨ | Soliciting material pursuant to Rule 14a-12 under the Exchange Act (17 CFR 240.14a-12) |
| ¨ | Pre-commencement communications pursuant to Rule 14d-2(b) under the Exchange Act (17 CFR 240.14d-2(b)) |
| ¨ | Pre-commencement communications pursuant to Rule 13e-4(c) under the Exchange Act (17 CFR 240.13e-4(c)) |
| Item 7.01. | Regulation FD Disclosure. |
CMS Energy Corporation (“CMS Energy”) will hold a webcast to discuss its 2016 second quarter results and provide a business and financial outlook on July 28 at 10:00 AM (EDT). A copy of the CMS Energy presentation is furnished as Exhibit 99.1 to this report. A webcast of the presentation will be available on the CMS Energy website, www.cmsenergy.com.
In accordance with General Instruction B.2 of Form 8-K, the information in this Current Report on Form 8-K, including Exhibit 99.1, shall not be deemed “filed” for the purposes of Section 18 of the Securities Exchange Act of 1934, or otherwise subject to the liabilities of that section, nor shall it be deemed incorporated by reference in any filing under the Securities Act of 1933.
Investors and others should note that CMS Energy routinely posts important information on its website and considers the Investor Relations section, www.cmsenergy.com/investor-relations, a channel of distribution.
| Item 9.01. | Financial Statements and Exhibits. |
(d) Exhibits.
| 99.1 | CMS Energy presentation dated July 28, 2016 |
SIGNATURES
Pursuant to the requirements of the Securities Exchange Act of 1934, the Registrants have duly caused this report to be signed on their behalf by the undersigned hereunto duly authorized.
| CMS ENERGY CORPORATION | ||||||||
| Dated: July 28, 2016 | By: | /s/ Thomas J. Webb |
||||||
| Thomas J. Webb | ||||||||
| Executive Vice President and | ||||||||
| Chief Financial Officer | ||||||||
| CONSUMERS ENERGY COMPANY | ||||||||
| Dated: July 28, 2016 | By: | /s/ Thomas J. Webb |
||||||
| Thomas J. Webb | ||||||||
| Executive Vice President and | ||||||||
| Chief Financial Officer | ||||||||
Exhibit Index
| 99.1 | CMS Energy presentation dated July 28, 2016 |
Exhibit 99.1
|
|
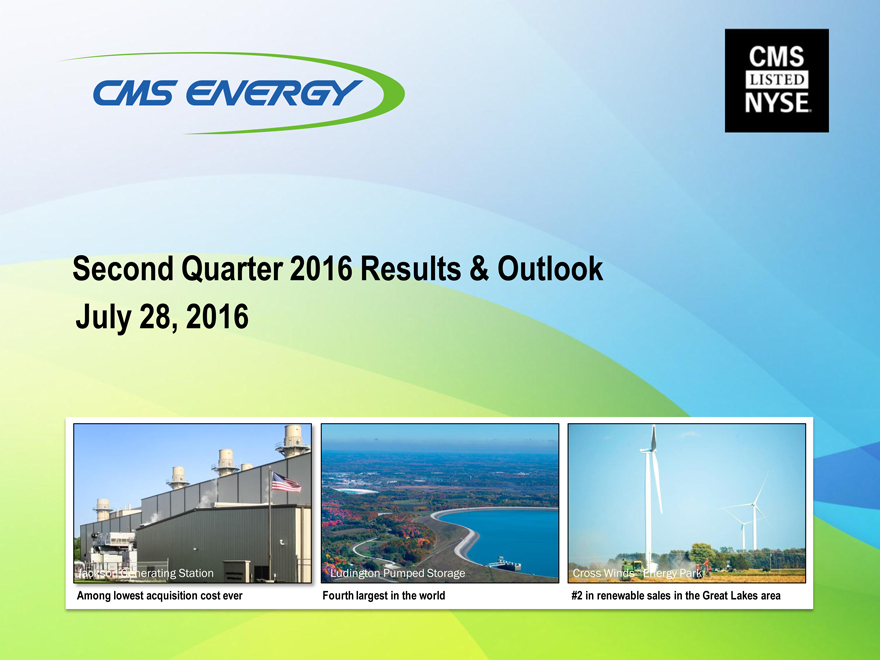
Second Quarter 2016 Results & Outlook July 28, 2016
Jackson Generating Station Ludington Pumped Storage Cross Winds âEnergy Park
Among lowest acquisition cost ever Fourth largest in the world #2 in renewable sales in the Great Lakes area
|
|
This presentation is made as of the date hereof and contains “forward-looking statements” as defined in Rule 3b-6 of the
Securities Exchange Act of 1934, Rule 175 of the Securities Act of 1933, and relevant legal decisions. The forward-looking statements are subject to risks and uncertainties. All forward-looking statements should be considered in the context of the risk and other factors detailed from time to time in CMS Energy’s and Consumers Energy’s Securities and Exchange Commission filings. Forward-looking statements should be read in conjunction with “FORWARD-LOOKING STATEMENTS AND
INFORMATION” and “RISK FACTORS” sections of CMS Energy’s and Consumers Energy’s Form 10-K for the year ended
December 31, 2015 and as updated in subsequent 10-Qs. CMS Energy’s and Consumers Energy’s “FORWARD-LOOKING
STATEMENTS AND INFORMATION” and “RISK FACTORS” sections are incorporated herein by reference and discuss important factors that could cause CMS Energy’s and Consumers Energy’s results to differ materially from those anticipated in such statements. CMS Energy and Consumers Energy undertake no obligation to update any of the information presented herein to reflect facts, events or circumstances after the date hereof.
The presentation also includes non-GAAP measures when describing CMS Energy’s results of operations and financial performance. A reconciliation of each of these measures to the most directly comparable GAAP measure is included in the appendix and posted on our website at www.cmsenergy.com.
CMS Energy provides historical financial results on both a reported (GAAP) and adjusted (non-GAAP) basis and provides forward-looking guidance on an adjusted basis. Adjustments could include items such as, discontinued operations, asset sales, impairments, restructuring costs, regulatory items from prior years, or other items. Management views adjusted earnings as a key measure of the company’s present operating financial performance and uses adjusted earnings for external communications with analysts and investors. Internally, the company uses adjusted earnings to measure and assess performance. Because the company is not able to estimate the impact of specific line items, which have the potential to significantly impact, favorably or unfavorably, the company’s reported earnings in future periods, the company is not providing reported earnings guidance nor is it providing a reconciliation for the comparable future period earnings. The adjusted earnings should be considered supplemental information to assist in fully understanding our business results, rather than as a substitute for the reported earnings.
Investors and others should note that CMS Energy routinely posts important information on its website and considers the Investor Relations section, www.cmsenergy.com/investor-relations, a channel of distribution.
| 1 |
|
|
|
Overview
Second Quarter Results
First Half Checklist Consumers Energy Way
Financial Results & Outlook
Second Quarter; Full Year
Unique Model Brexit Impact
Patti Poppe President & CEO
Tom Webb
Executive VP & CFO
| 2 |
|
|
|
a
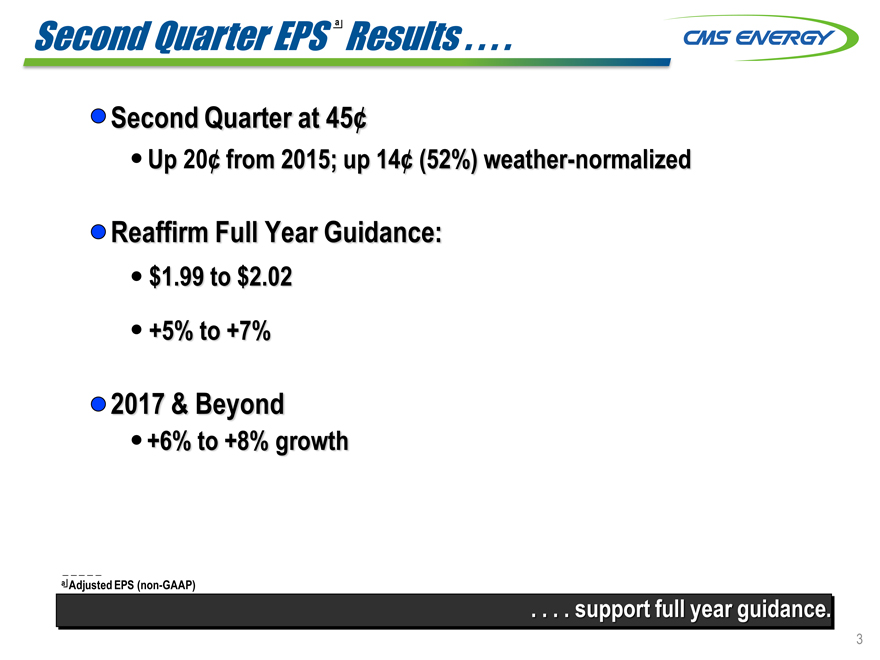
Second Quarter EPS Results . . . .
Second Quarter at 45¢
Up 20¢ from 2015; up 14¢ (52%) weather-normalized
Reaffirm Full Year Guidance:
$1.99 to $2.02 +5% to +7%
2017 & Beyond
+6% to +8% growth
a Adjusted EPS (non-GAAP)
. . . . support full year guidance.
| 3 |
|
|
|
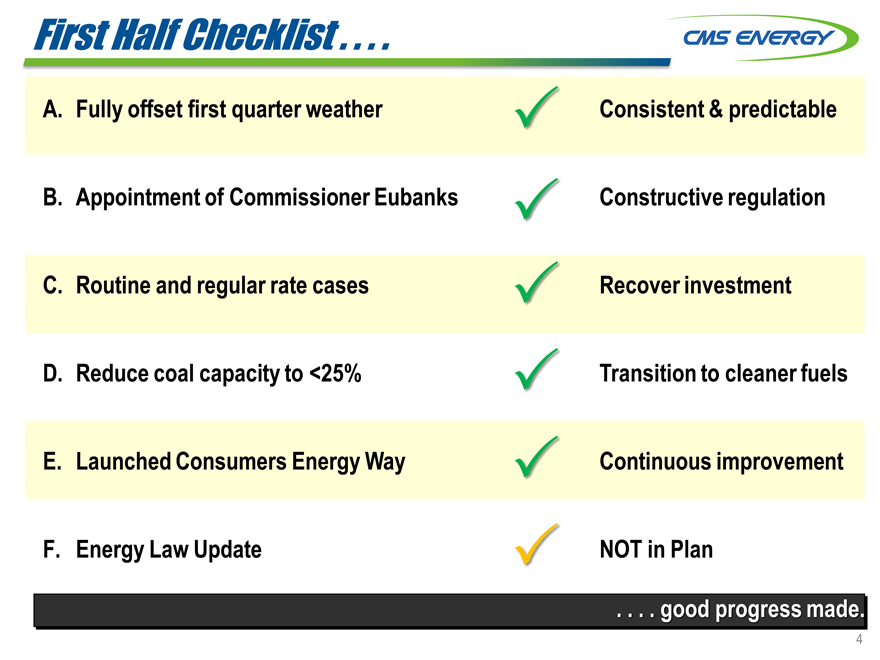
First Half Checklist . . . .
A. Fully offset first quarter weather
B. Appointment of Commissioner Eubanks C. Routine and regular rate cases D. Reduce coal capacity to <25% E. Launched Consumers Energy Way F. Energy Law Update
consistent & predictable constructive regulation recover investment transition to cleaner fuels continuous improvement NOT in Plan
. . .. good progress made.
| 4 |
|
|
|

Constructive Regulation . . . .
Commission
Sally Talberg (I) Chairman
Term Ends: July 2, 2019
Norm Saari (R)
Term Ends: July 2, 2021
Rachael Eubanks (I) Term Ends: July 2, 2017
Newly appointed!
Tier 1 State Ranking
Michigan
| 1 |
|
2 3 4 5 6 9 18 9 6 Barclays Research, 2016 state rankings |
. . . . is supported by a quality Commission and a strong existing Law.
| 5 |
|
|
|
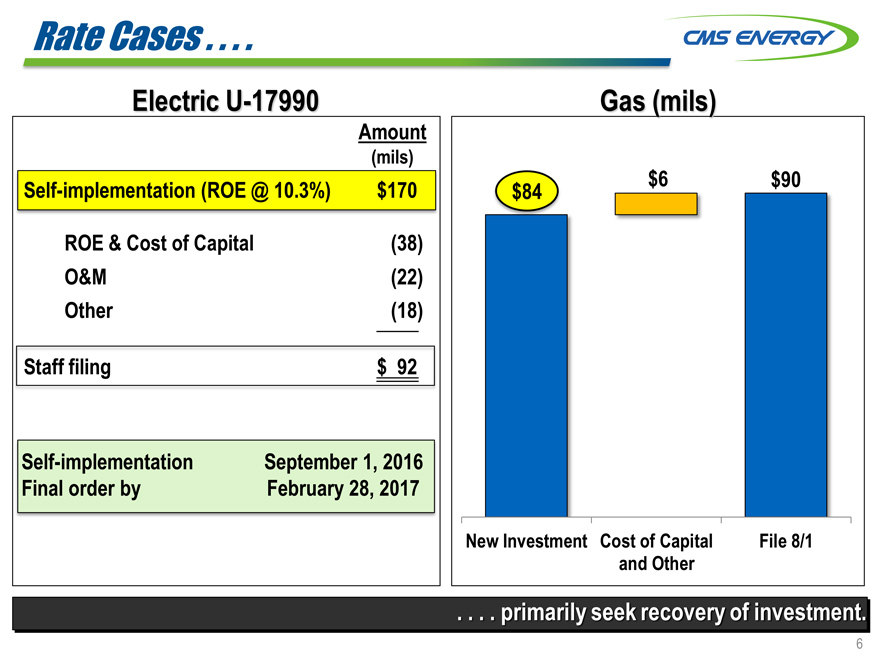
Rate Cases . . . .
Electric U-17990
Amount
(mils)
Self-implementation (ROE @ 10.3%) $170
ROE & Cost of Capital(38)
O&M(22)
Other(18)
Self-implementation September 1, 2016
Final order by February 28, 2017
Staff filing $92
Gas (mils)
$6 $90 $84 New Investment Cost of Capital File 8/1 and Other
. . . . primarily seek recovery of investment.
| 6 |
|
|
|
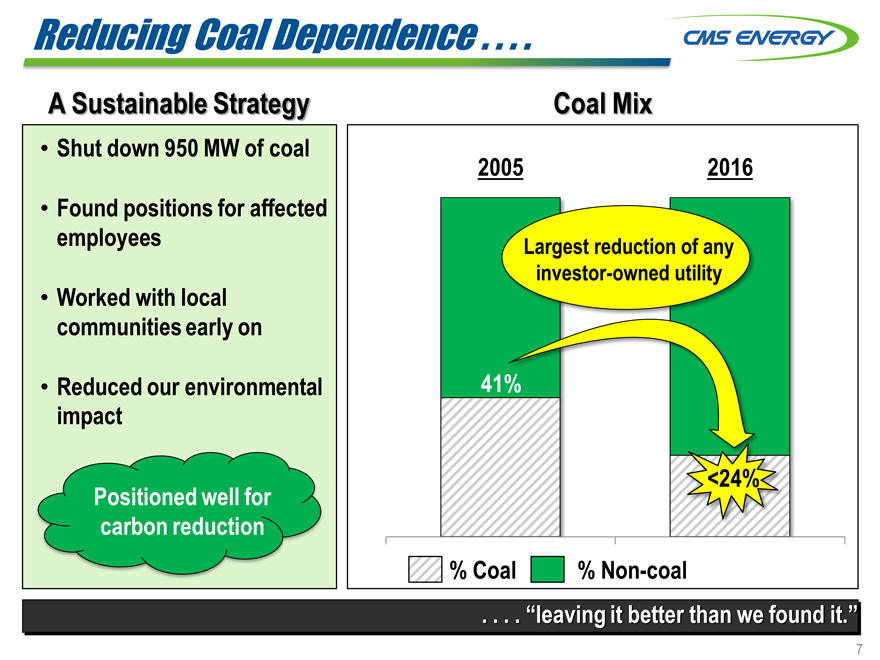
Reducing Coal Dependence . . . .
A Sustainable Strategy
Shut down 950 MW of coal
Found positions for affected employees
Worked with local communities early on
Reduced our environmental impact
Positioned well for carbon reduction
Coal Mix
2005 2016
Largest reduction of any investor-owned utility
41%
<24%
% Coal % Non-coal
. . . . “leaving it better than we found it.”
| 7 |
|
|
|
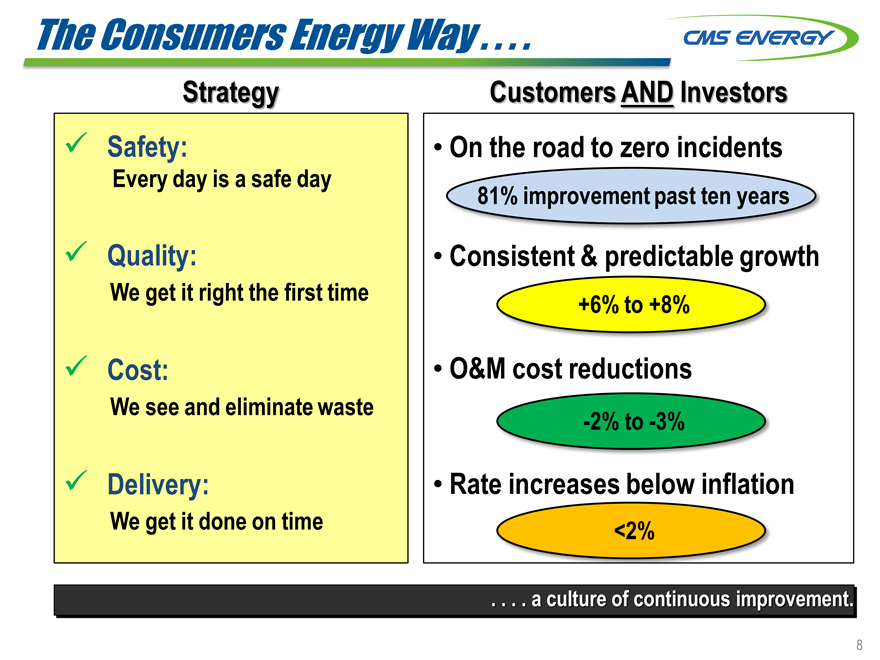
The Consumers Energy Way . . . .
Strategy Safety:
Every day is a safe day
Quality:
We get it right the first time
Cost:
We see and eliminate waste
Delivery:
We get it done on time
Customers AND Investors
On the road to zero incidents
81% improvement past ten years
Consistent & predictable growth
+6% to +8%
O&M cost reductions
-2% to -3%
Rate increases below inflation
<2%
. . . . a culture of continuous improvement.
| 8 |
|
|
|

O&M Cost Performance . . . .
Room to Improve
(Electric Distribution Cost Per Customer)
2014 2015
$30 mil to go until st Quartile 1st Quartile
2nd Quartile
Co ers
($97) Consumers
($100)
3rd Quartile Source: SNL, Form 1, Electric Non-fuel O&M, 2014 DCO normalized for Polar Vortex
Here’s How
Build the job as designed
Accurately schedule the job
“Field services” project
. . . . opportunities to improve even more.
9
|
|
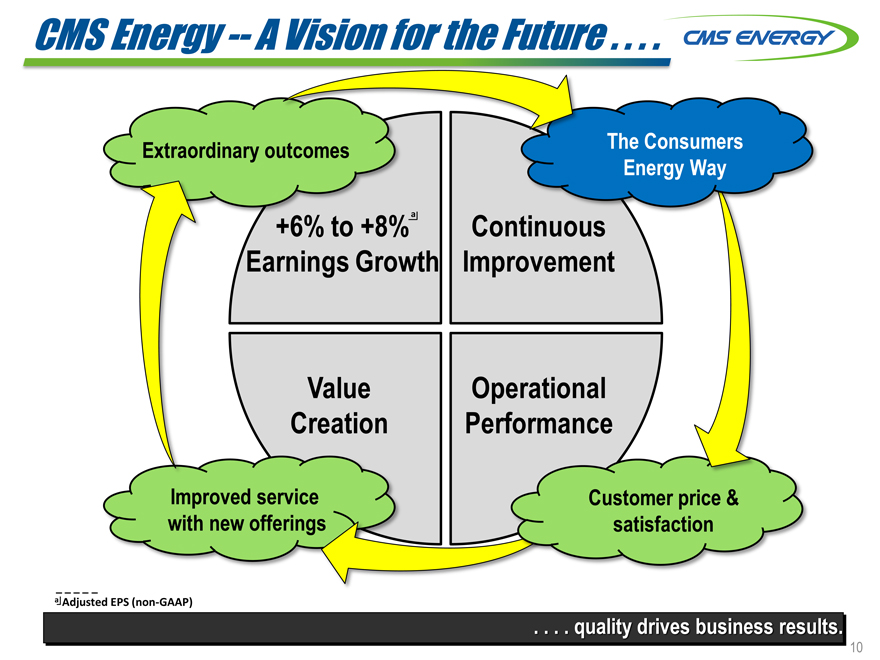
CMS Energy — A Vision for the Future . . . .
Extraordinary outcomes The Consumers Energy Way
a
+6% to +8% Continuous
Earnings Growth Improvement
Value Operational
Creation Performance
Improved service Customer price & with new offerings satisfaction
a Adjusted EPS (non-GAAP)
. . . . quality drives business results.
4th Quartile
10
|
|
a
2016 Second Quarter EPS
Results
2015 2016
Second Quarter $0.25 $0.45
+20¢
$0.27
+14¢
| $0.41 |
|
+52% |
First Half
EPS $0.98 $1.04
+6¢
Weather-normalized 26¢
a Adjusted EPS (non-GAAP)
By Business Segment
First Half EPS
Better
Actual than Plan
Utility $1.09 $ 0.05
Enterprises 0.04 0.02
Interest & other(0.09) 0.03
Company $1.04 $ 0.10
Above Plan +11%
. . . . more than offsets mild weather earlier in year.
11
|
|
a
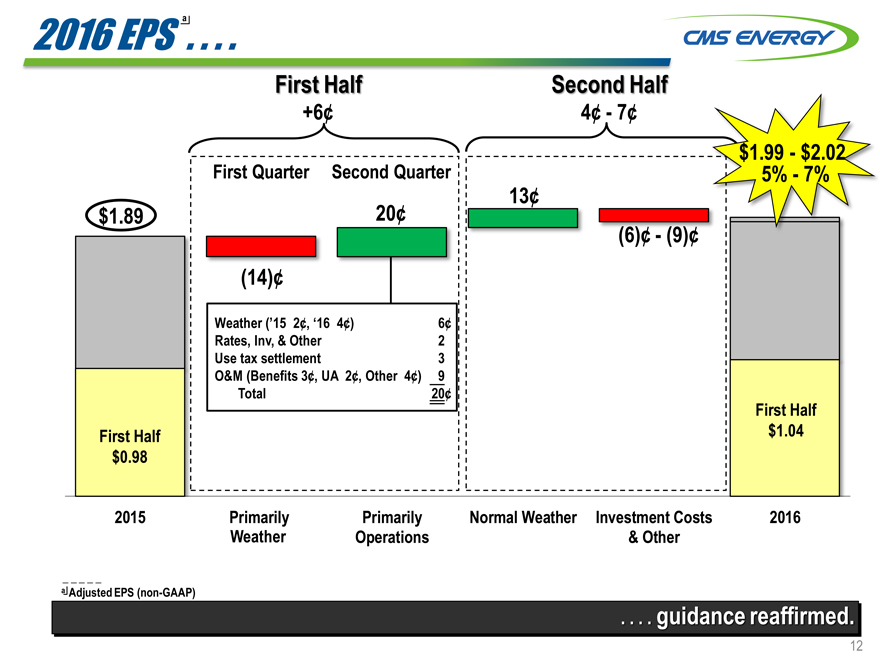
2016 EPS . . . .
First Half Second Half
+6¢ 4¢—7¢
| $1.99—$2.02 |
|
First Quarter Second Quarter 5%—7%
| 13¢ |
|
| $1.89 |
|
20¢ |
| (6)¢—(9)¢ |
|
| (14)¢ |
|
Weather (’15 2¢, ‘16 4¢) 6¢
Rates, Inv, & Other 2
Use tax settlement 3
O&M (Benefits 3¢, UA 2¢, Other 4¢) 9
Total 20¢
First Half
First Half $1.04
$0.98
2015 Primarily Primarily Normal Weather Investment Costs 2016
Weather Operations & Other
a Adjusted EPS (non-GAAP)
. . . . guidance reaffirmed.
12
|
|
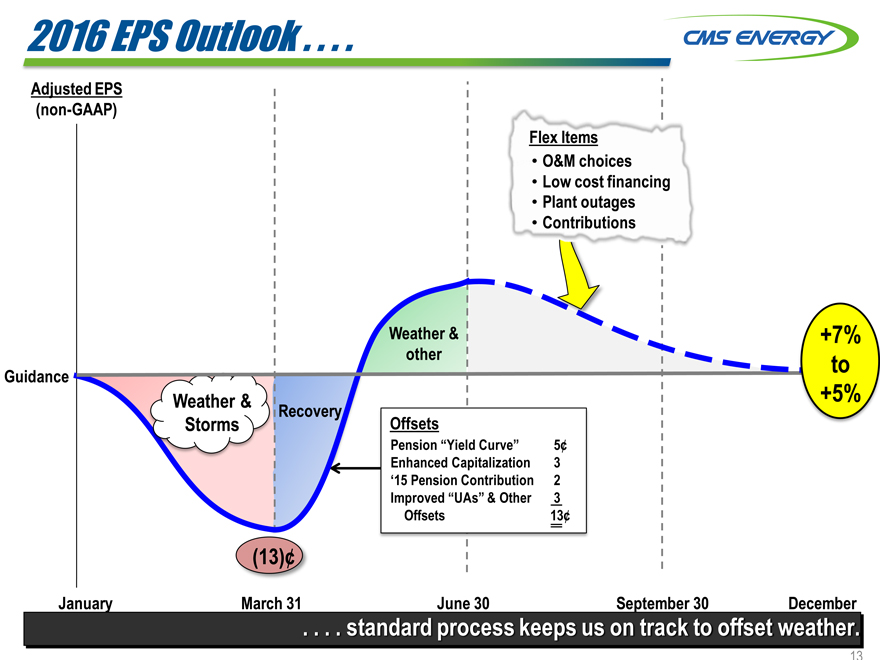
2016 EPS Outlook . . . .
Adjusted EPS
(non-GAAP)
Flex Items
O&M choices
Low cost financing
Plant outages
Contributions
Weather & +7%
other to
Guidance
Weather & +5%
Recovery
Storms Offsets
Pension “Yield Curve” 5¢
Enhanced Capitalization 3
‘15 Pension Contribution 2
Improved “UAs” & Other 3
Offsets 13¢
| (13)¢ |
|
January March 31 June 30 September 30 December
. . . . standard process keeps us on track to offset weather.
13
|
|
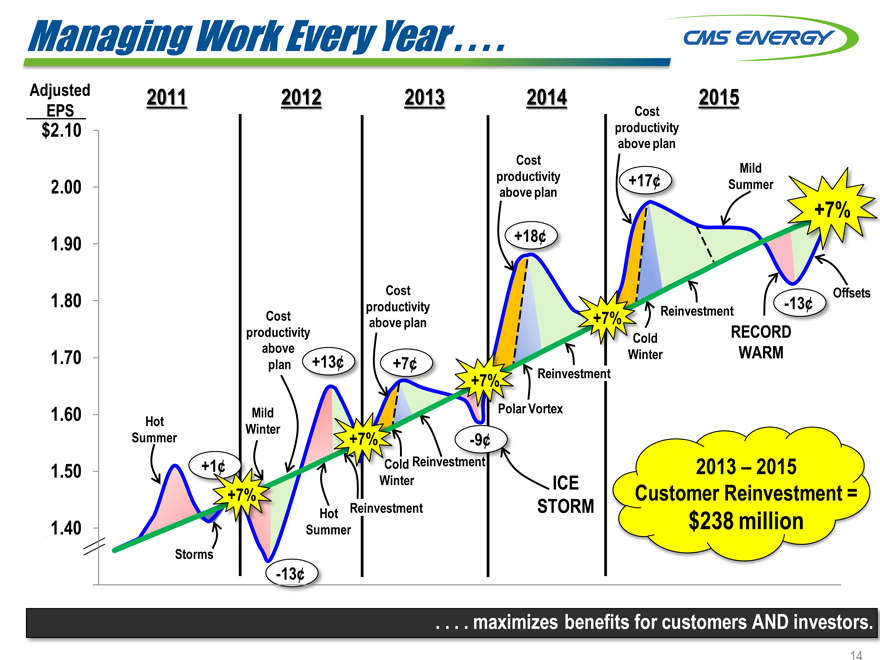
Managing Work Every Year . . . .
Adjusted 2011 2012 2013 2014 2015
EPS Cost
| $2.10 |
|
productivity |
above plan
Cost Mild
| 2.00 |
|
productivity above plan +17¢ Summer |
+7%
| 1.90 |
|
+18¢ |
| 1.80 |
|
Cost -13¢ Offsets |
productivity Reinvestment
Cost above plan +7%
productivity ld RECORD
| 1.70 |
|
above plan +13¢ +7¢ Winter WARM |
+7% Reinvestment
| 1.60 |
|
Hot Mild r Vortex |
Winter
Summer +7% -9¢
| 1.50 |
|
+1¢ ld Reinves 2013 – 2015 |
+7% Winter ICE Customer Reinvestment =
Reinvestment STORM
| 1.40 |
|
Summer Hot $238 million |
Storms
-13¢
. . . . maximizes benefits for customers AND investors.
14
|
|
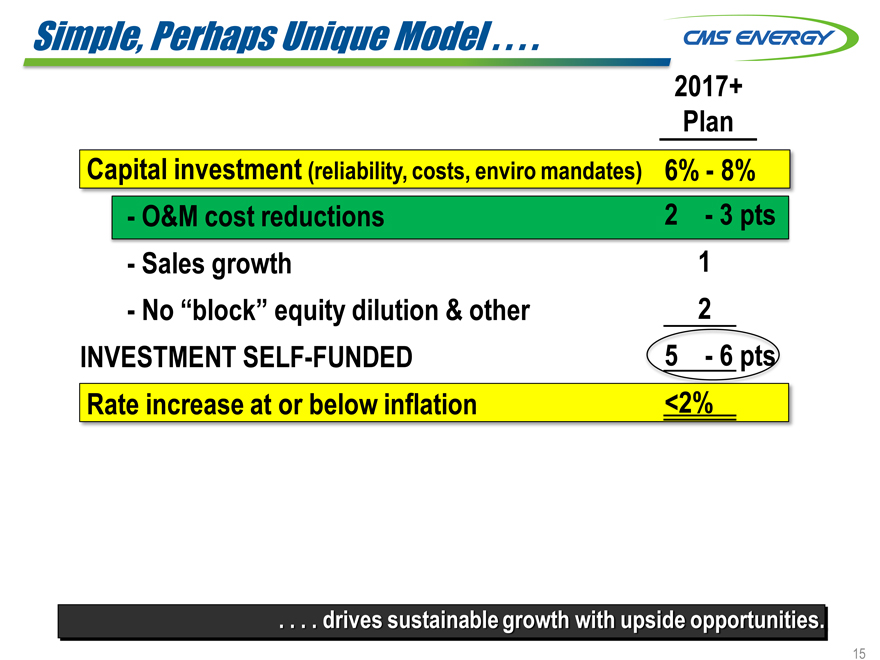
Simple, Perhaps Unique Model . . . .
2017+
Plan
Capital investment (reliability, costs, enviro mandates) 6%—8%
- O&M cost reductions 2—3 pts
- Sales growth 1
- No “block” equity dilution & other 2
INVESTMENT SELF-FUNDED 5—6 pts
Rate increase at or below inflation <2%
. . . .. drives sustainable growth with upside opportunities.
15
|
|
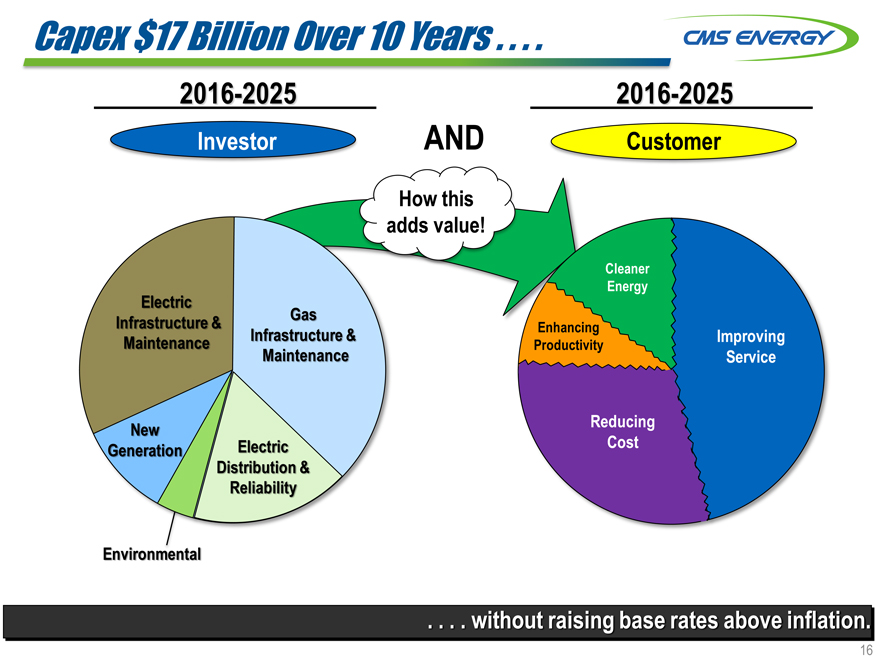
Capex $17 Billion Over 10 Years . . . .
2016-2025 2016-2025
Investor AND Customer
How this
adds value!
Cleaner
Energy
Electric
Gas
Infrastructure & Enhancing
Maintenance Infrastructure & Productivity Improving
Maintenance Service
New Reducing
Generation Electric Cost
Distribution &
Reliability
Environmental
. . . . without raising base rates above inflation.
16
|
|
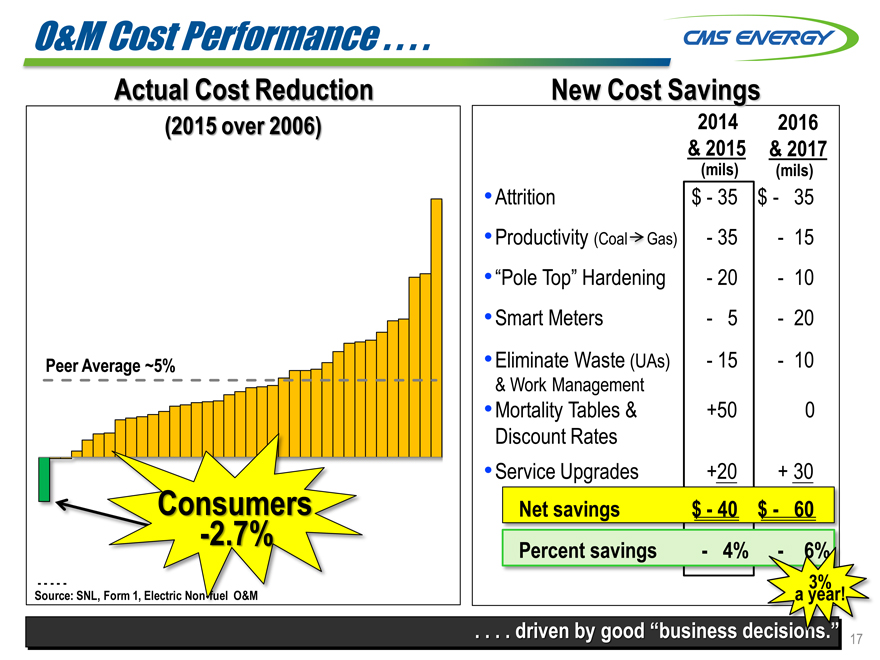
O&M Cost Performance . . . .
Actual Cost Reduction
(2015 over 2006)
Peer Average ~5%
Consumers -2.7%
Source: SNL, Form 1, Electric Non-fuel O&M
New Cost Savings
2014 2016
& 2015 & 2017
(mils)(mils)
Attrition $—35 $—35
Productivity (Coal Gas)—35—15
“Pole Top” Hardening—20—10
Smart Meters—5—20
Eliminate Waste (UAs)—15—10
& Work Management
Mortality Tables & +50 0
Discount Rates
Service Upgrades +20 + 30
Net savings $—40 $—60
Percent savings—4%
3%
a year!
. . . . driven by good “business decision.”
17
|
|
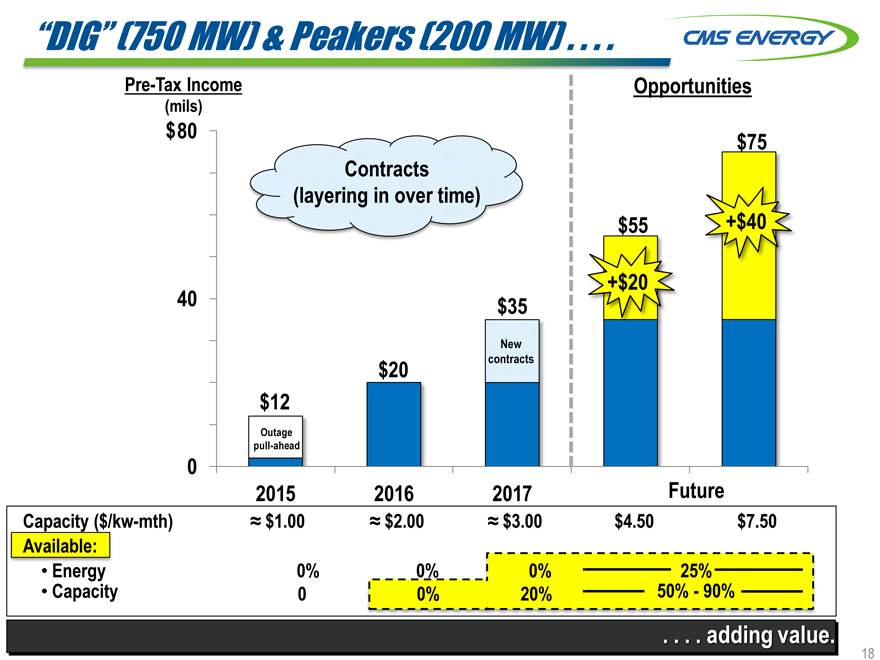
“DIG” (750 MW) & Peakers (200 MW) . . . .
Pre-Tax Income Opportunities
(mils)
$ 80 $75
Contracts
(layering in over time)
$55 +$40
+$20
| 40 |
|
$35 |
New
$20 contracts
$12
Outage
pull-ahead
0
2015 2016 2017 Future
Capacity ($/kw-mth) ? $1.00 ? $2.00 ? $3.00 $4.50 $ 7.50
Available:
Energy 0% 0% 0% 25%
Capacity 0 0% 20% 50%—90%
. . . . adding value.
18
|
|
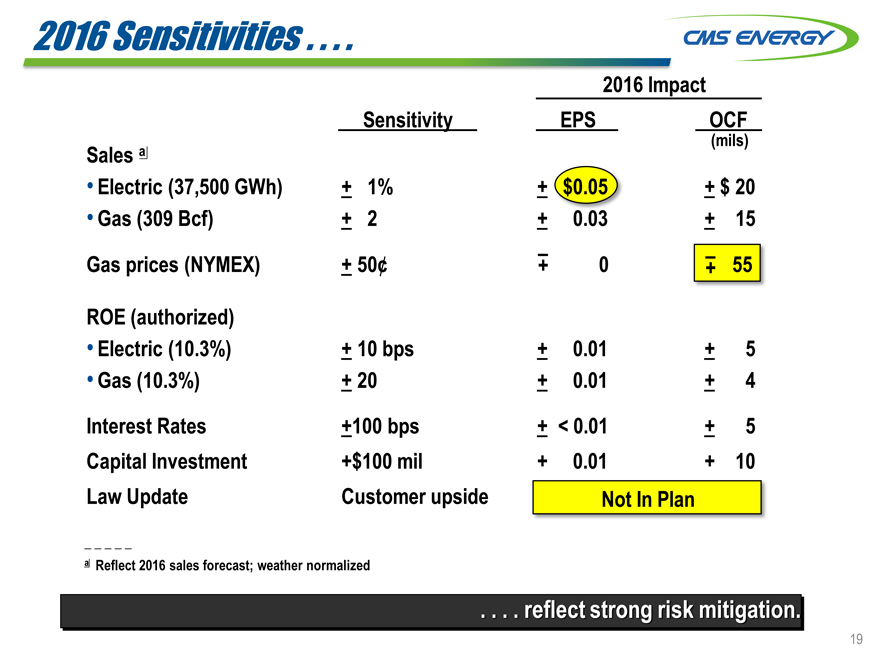
2016 Sensitivities . . . .
2016 Impact
Sensitivity EPS OCF
(mils)
Sales a
Electric (37,500 GWh) + 1% + $0.05 + $ 20
Gas (309 Bcf) + 2 + 0.03 + 15
Gas prices (NYMEX) + 50¢ + – 0 + – 55
ROE (authorized)
Electric (10.3%) + 10 bps + 0.01 + 5
Gas (10.3%) + 20 + 0.01 + 4
Interest Rates +100 bps + < 0.01 + 5
Capital Investment +$100 mil + 0.01 + 10
_ Law Update Customer upside Not In Plan
a Reflect 2016 sales forecast; weather normalized
. . . . reflect strong risk mitigation.
19
|
|
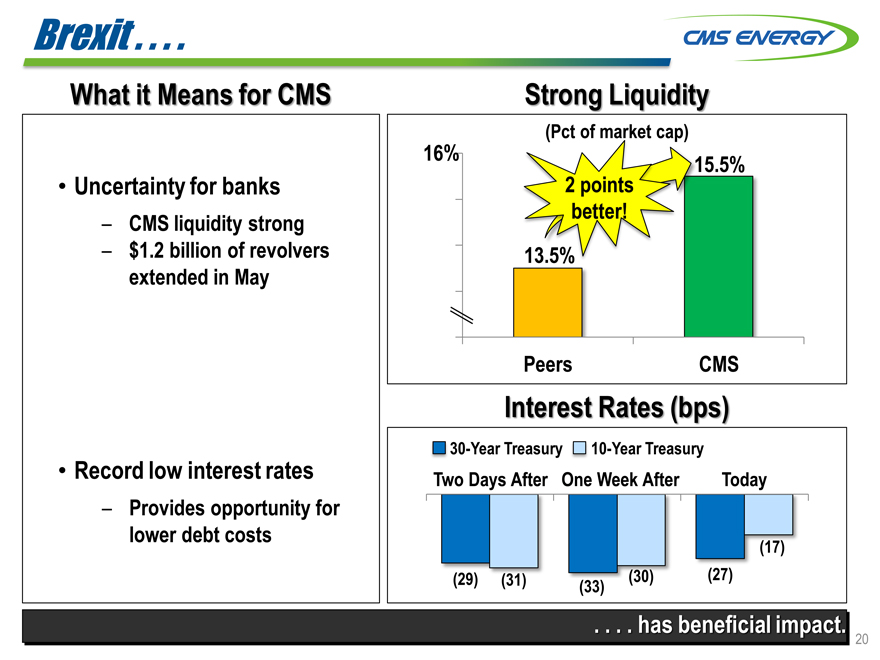
Brexit . . . .
What it Means for CMS
Uncertainty for banks
– CMS liquidity strong
– $1.2 billion of revolvers extended in May
Record low interest rates
– Provides opportunity for lower debt costs
Strong Liquidity
(Pct of market cap)
16% 5.5%
| 2 |
|
points |
better!
Peers CMS
Interest Rates (bps)
30-Year Treasury 10-Year Treasury
Two Days After One Week After Today
| (17) |
|
(29)(31)(33)(30)(27)
. . . . has beneficial impact.
20
|
|
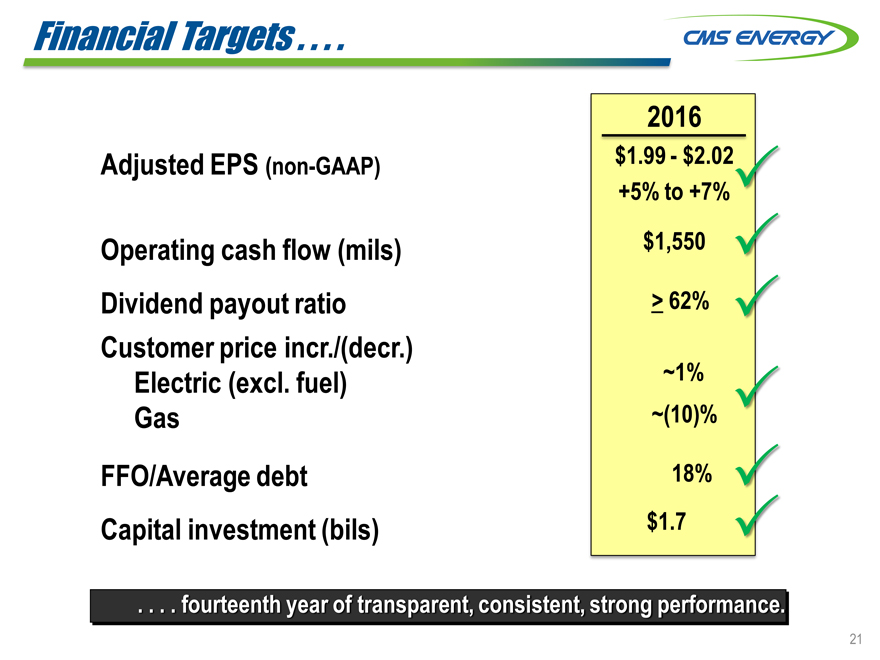
Financial Targets . . . .
Adjusted EPS (non-GAAP)
Operating cash flow (mils)
Dividend payout ratio Customer price incr./(decr.) Electric (excl. fuel) Gas
FFO/Average debt
Capital investment (bils)
2016
$1.99—$2.02
+5% to $1,550
> 62%
~1%
~(10)%
18%
$1.7
. . . . fourteenth year of transparent, consistent, strong performance.
21
|
|
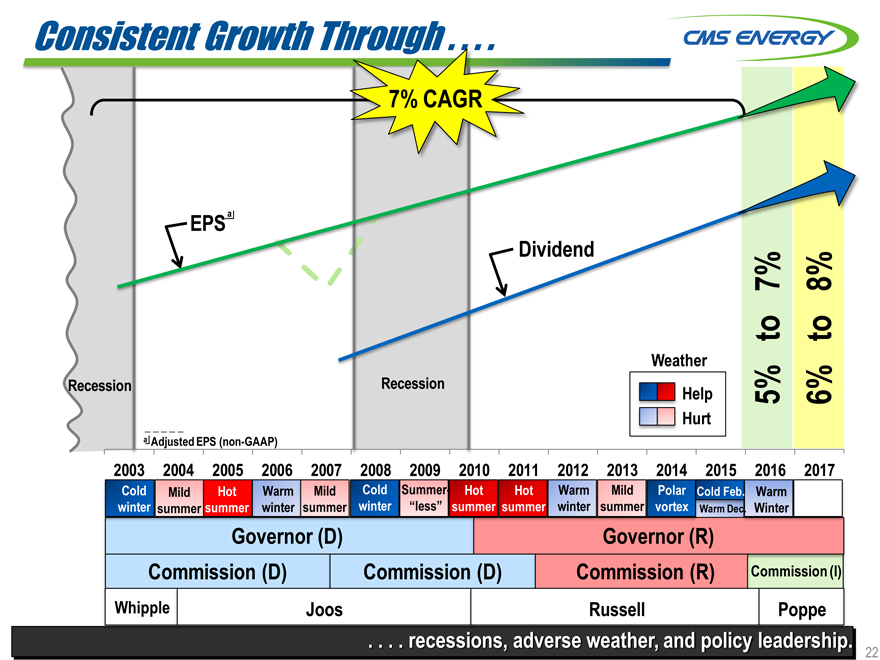
Consistent Growth Through
7% CAGR
7% 8%
to to
Weather
Recession Recession Help 5% 6%
Hurt
a Adjusted EPS (non-GAAP)
2003 2004 2005 2006 2007 2008 2009 2010 2011 2012 2013 2014 2015 2016 2017 Cold Feb
Cold Mild Hot Warm Mild Cold Summer- Hot Hot Warm Mild Polar Cold Feb. Warm
winter summe summer winter summer winter “less” summer summer winter summer vortex Warm Dec. Winter
Governor (D) Governor (R)
Commission(D) Commission (D) Commission (R) Commission (I)
Whipple Joos Russell Poppe
. . . . recessions, adverse weather, and policy leadership.
22
|
|

Q & A
|
|

Appendix
|
|
Operating Cash Flow
Amount Up $0.7
(bils) Billion
Gross operating cash flowa 8
$ 2.9 up > $0.1 billion per year
2.4
| $2.1 |
|
taxes |
$1.9
1.9
$1.55
| 1.4 |
|
Operating cash flow |
| 0.9 |
|
Investment |
0.4
(0.2)
Cash flow before dividend
| (0.7) |
|
a Non-GAAP |
2015 2016 2017 2018 2019 2020 2021
NOLs & Credits $0.7 $0.9 $0.8 $0.7 $0.4 $0.4 $0.1
up $0.7 billion or 34% over five years.
25
|
|
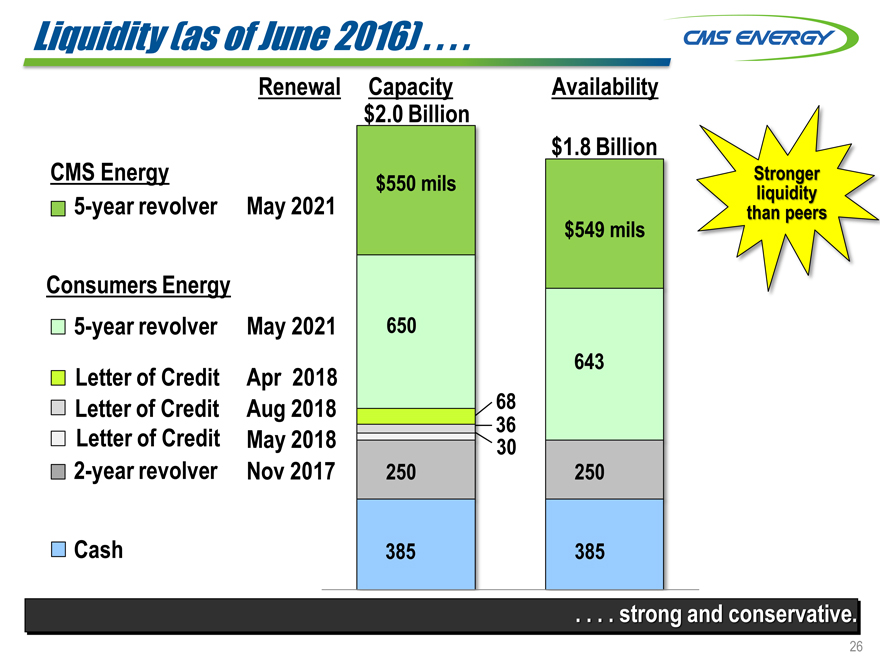
Liquidity (as of June 2016)
Renewal Capacity Availability
| $2.0 |
|
Billion |
| $1.8 |
|
Billion |
CMS Energy $550 mils
5-year revolver May 2021
$549 mils
Consumers Energy
5-year revolver May 2021 650
Letter of Credit Apr 2018 643
Letter of Credit Aug 2018 68
| 36 |
|
Letter of Credit May 2018 30
2-year revolver Nov 2017 250 250
Cash 385 385
. . . . strong and conservative.
26
|
|
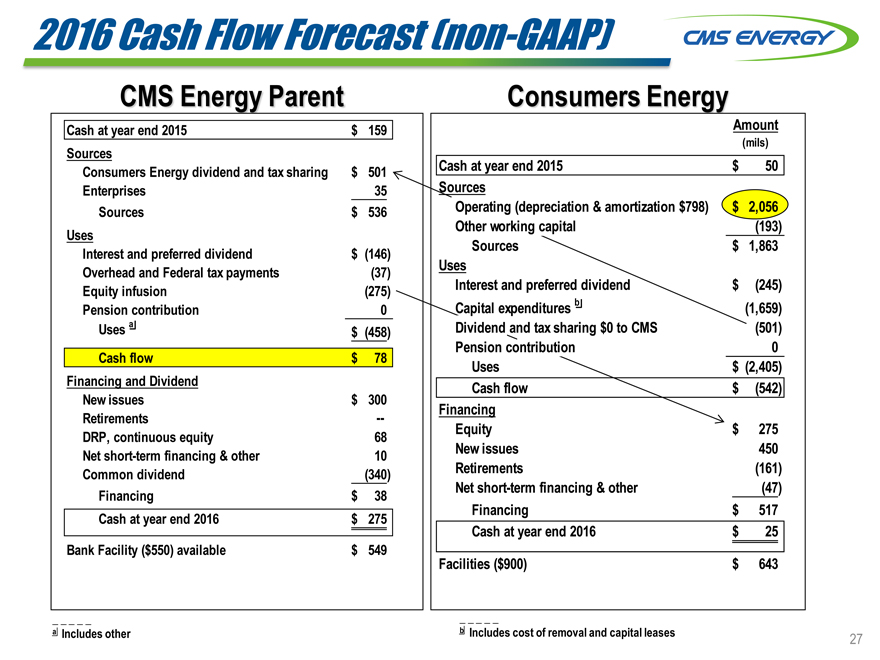
2016 Cash Flow Forecast (non-GAAP)
CMS Energy Parent Consumers Energy
Cash at year end 2015 $ 159 Amount
(mils)
Sources
Consumers Energy dividend and tax sharing $ 501 Cash at year end 2015 $ 50
Enterprises 35 Sources
Sources $ 536 Operating (depreciation & amortization $798) $ 2,056
Uses Other working capital(193)
Interest and preferred dividend $ (146) Sources $ 1,863
Overhead and Federal tax payments(37) Uses
Equity infusion(275) Interest and preferred dividend $ (245)
Pension contribution 0 Capital expenditures b(1,659)
Uses a $ (458) Dividend and tax sharing $0 to CMS(501)
Pension contribution 0
Cash flow $ 78 Uses $ (2,405)
Financing and Dividend Cash flow $ (542)
New issues $ 300
Retirements — Financing
DRP, continuous equity 68 Equity $ 275
Net short-term financing & other 10 New issues 450
Common dividend(340) Retirements(161)
Financing $ 38 Net short-term financing & other(47)
Cash at year end 2016 $ 275 Financing $ 517
Cash at year end 2016 $ 25
Bank Facility ($550) available $ 549
Facilities ($900) $ 643
a Includes other b Includes cost of removal and capital leases
27
|
|
GAAP Reconciliation
|
|
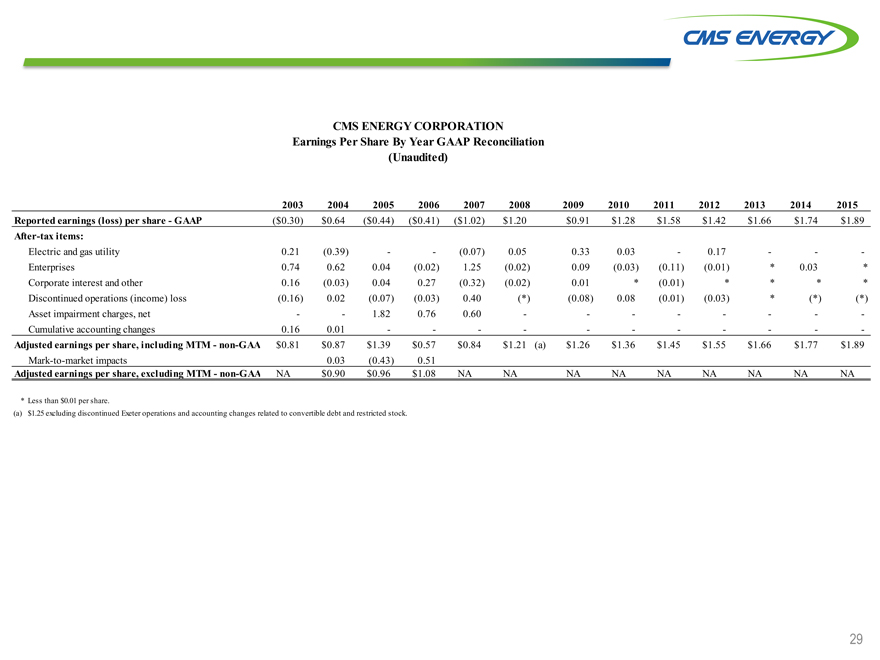
CMS ENERGY CORPORATION
Earnings Per Share By Year GAAP Reconciliation
(Unaudited)
2003 2004 2005 2006 2007 2008 2009 2010 2011 2012 2013 2014 2015
Reported earnings (loss) per share - GAAP ($0.30) $0.64 ($0.44) ($0.41) ($1.02) $1.20 $0.91 $1.28 $1.58 $1.42 $ 1.66 $ 1.74 $ 1.89
After-tax items:
Electric and gas utility 0.21 (0.39) - - (0.07) 0.05 0.33 0.03 - 0.17 - - -
Enterprises 0.74 0.62 0.04 (0.02) 1.25 (0.02) 0.09 (0.03) (0.11) (0.01) * 0.03 *
Corporate interest and other 0.16 (0.03) 0.04 0.27 (0.32) (0.02) 0.01 * (0.01) * * * *
Discontinued operations (income) loss (0.16) 0.02 (0.07) (0.03) 0.40 (*) (0.08) 0.08 (0.01) (0.03) * (*) (*)
Asset impairment charges, net - - 1.82 0.76 0.60 - - - - - - - -
Cumulative accounting changes 0.16 0.01 - - - - - - - - - - -
Adjusted earnings per share, including MTM - non-GAA $0.81 $0.87 $1.39 $0.57 $0.84 $1.21 (a) $1.26 $1.36 $1.45 $1.55 $ 1.66 $ 1.77 $ 1.89
Mark-to-market impacts 0.03 (0.43) 0.51
Adjusted earnings per share, excluding MTM - non-GAA NA $0.90 $0.96 $1.08 NA NA NA NA NA NA NA NA NA
* Less than $0.01 per share.
(a) $1.25 excluding discontinued Exeter operations and accounting changes related to convertible debt and restricted stock.
29
|
|
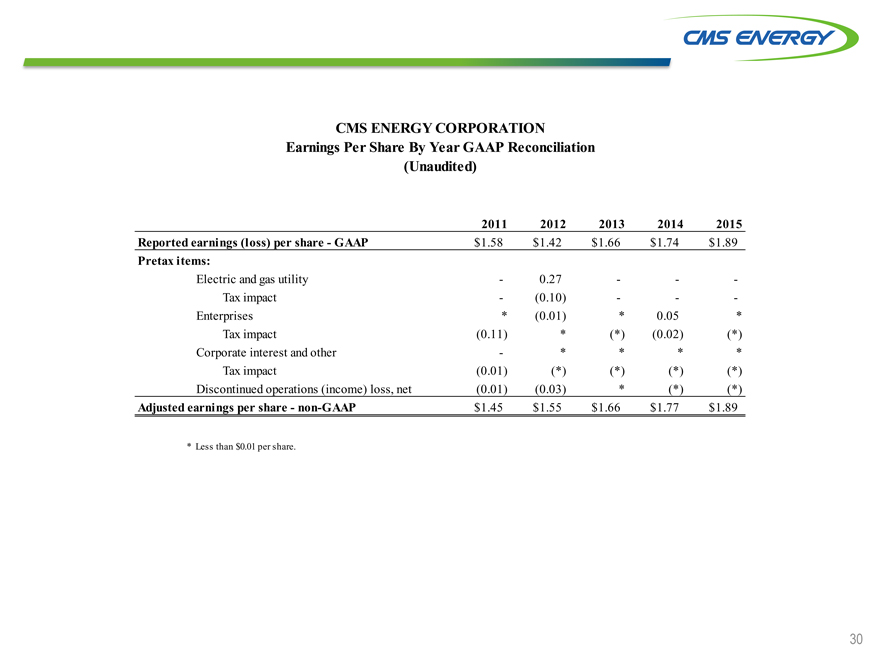
CMS ENERGY CORPORATION
Earnings Per Share By Year GAAP Reconciliation
(Unaudited)
2011 2012 2013 2014 2015
Reported earnings (loss) per share - GAAP $1.58 $1.42 $ 1.66 $1.74 $ 1.89
Pretax items:
Electric and gas utility - 0.27 - - -
Tax impact - (0.10) - - -
Enterprises * (0.01) * 0.05 *
Tax impact (0.11) * (*) (0.02) (*)
Corporate interest and other - * * * *
Tax impact (0.01) (*) (*) (*) (*)
Discontinued operations (income) loss, net (0.01) (0.03) * (*) (*)
Adjusted earnings per share - non-GAAP $1.45 $1.55 $ 1.66 $1.77 $ 1.89
* Less than $0.01 per share.
30
|
|
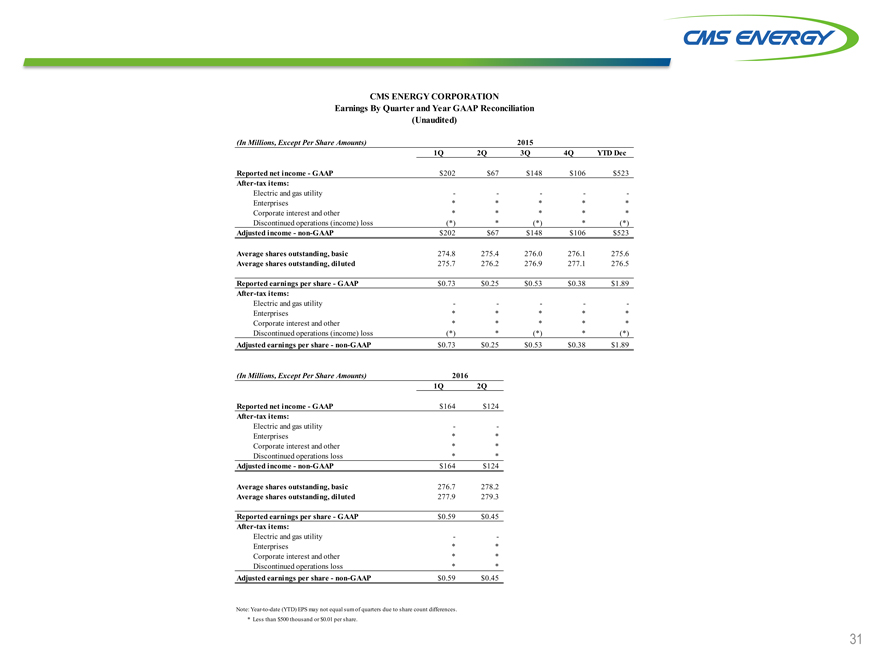
CMS ENERGY CORPORATION
Earnings By Quarter and Year GAAP Reconciliation
(Unaudited)
(In Millions, Except Per Share Amounts) 2015
1Q 2Q 3Q 4Q YTD Dec
Reported net income—GAAP $202 $67 $148 $106 $523
After-tax items:
Electric and gas utility — — -
Enterprises*****
Corporate interest and other*****
Discontinued operations (income) loss(*)*(*)*(*)
Adjusted income—non-GAAP $202 $67 $148 $106 $523
Average shares outstanding, basic 274.8 275.4 276.0 276.1 275.6
Average shares outstanding, diluted 275.7 276.2 276.9 277.1 276.5
Reported earnings per share—GAAP $0.73 $0.25 $0.53 $0.38 $1.89
After-tax items:
Electric and gas utility — — -
Enterprises*****
Corporate interest and other*****
Discontinued operations (income) loss(*)*(*)*(*)
Adjusted earnings per share—non-GAAP $0.73 $0.25 $0.53 $0.38 $1.89
(In Millions, Except Per Share Amounts) 2016
1Q 2Q
Reported net income—GAAP $164 $124
After-tax items:
Electric and gas utility —
Enterprises**
Corporate interest and other**
Discontinued operations loss**
Adjusted income—non-GAAP $164 $124
Average shares outstanding, basic 276.7 278.2
Average shares outstanding, diluted 277.9 279.3
Reported earnings per share—GAAP $0.59 $0.45
After-tax items:
Electric and gas utility —
Enterprises**
Corporate interest and other**
Discontinued operations loss**
Adjusted earnings per share—non-GAAP $0.59 $0.45
Note: Year-to-date (YTD) EPS may not equal sum of quarters due to share count differences.
| * |
|
Less than $500 thousand or $0.01 per share. |
31
|
|
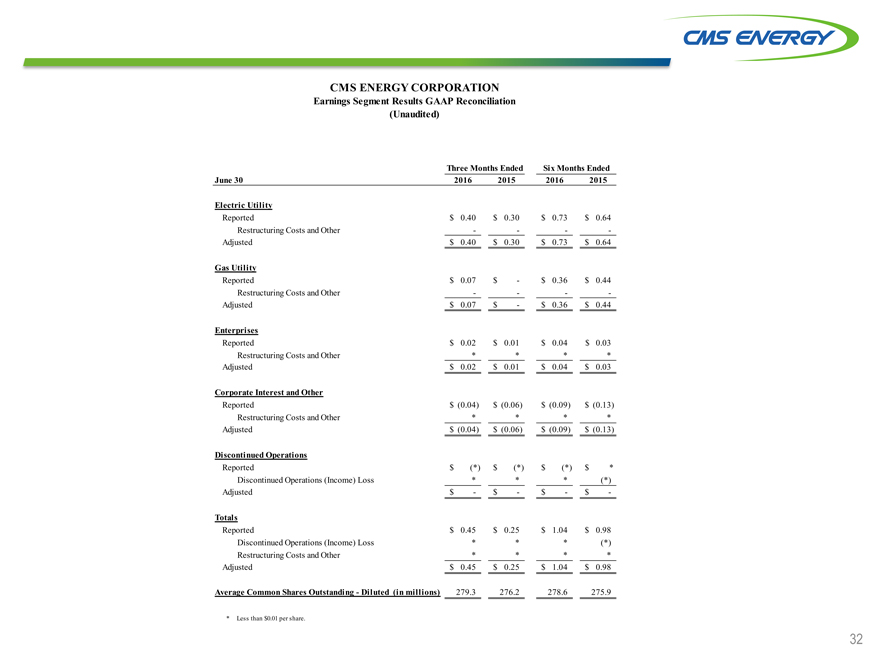
CMS ENERGY CORPORATION
Earnings Segment Results GAAP Reconciliation
(Unaudited)
Three Months Ended Six Months Ended
June 30 2016 2015 2016 2015
Electric Utility
Reported $ 0.40 $ 0.30 $ 0.73 $ 0.64
Restructuring Costs and Other — —
Adjusted $ 0.40 $ 0.30 $ 0.73 $ 0.64
Gas Utility
Reported $ 0.07 $—$ 0.36 $ 0.44
Restructuring Costs and Other — —
Adjusted $ 0.07 $—$ 0.36 $ 0.44
Enterprises
Reported $ 0.02 $ 0.01 $ 0.04 $ 0.03
Restructuring Costs and Other****
Adjusted $ 0.02 $ 0.01 $ 0.04 $ 0.03
Corporate Interest and Other
Reported $(0.04) $(0.06) $(0.09) $(0.13)
Restructuring Costs and Other****
Adjusted $(0.04) $(0.06) $(0.09) $(0.13)
Discontinued Operations
Reported $(*) $(*) $(*) $*
Discontinued Operations (Income) Loss***(*)
Adjusted $—$—$—$ -
Totals
Reported $ 0.45 $ 0.25 $ 1.04 $ 0.98
Discontinued Operations (Income) Loss***(*)
Restructuring Costs and Other****
Adjusted $ 0.45 $ 0.25 $ 1.04 $ 0.98
Average Common Shares Outstanding—Diluted (in millions) 279.3 276.2 278.6 275.9
| * |
|
Less than $0.01 per share. |
32
|
|
Consumers Energy
2016 Forecasted Cash Flow GAAP Reconciliation (in millions) (unaudited)
Reclassifications From Sources and Uses to Statement of Cash Flows
Interest/ Capital
Presentation Sources and Uses Tax Other Financing Lease Pymts Securitization Common Consolidated Statements of Cash Flows
non-GAAP Sharing Payments and Other Debt Pymts Dividends GAAP
Description Amount Operating as Operating as Financing as Financing as Financing Amount Description
Cash at year end 2015 $ 50 $—$—$—$—$—$ 50 Cash at year end 2015
Sources
Operating (dep & amort $798) $ 2,056
Other working capital(193) Net cash provided by
Sources $ 1,863 $—$(245) $ 25 $ 25 $—$ 1,668 operating activities
Uses
Interest and preferred dividends $(245)
Capital expenditures a(1,659)
Dividends/tax sharing to CMS(501)
Pension Contribution — Net cash used in
Uses $(2,405) $—$ 245 $—$—$ 501 $(1,659) investing activities
Cash flow from
Cash flow $(542) $—$—$ 25 $ 25 $ 501 $ 9 operating and
investing activities
Financing
Equity $ 275
New Issues 450
Retirements(161)
Net short-term financing & other(47) — Net cash used in
Financing $ 517 $—$—$(25) $(25) $(501) $(34) financing activities
Net change in cash $(25) $—$—$—$—$—$(25) Net change in cash
Cash at year end 2016 $ 25 $—$—$—$—$—$ 25 Cash at year end 2016
a Includes cost of removal and capital leases
33
|
|
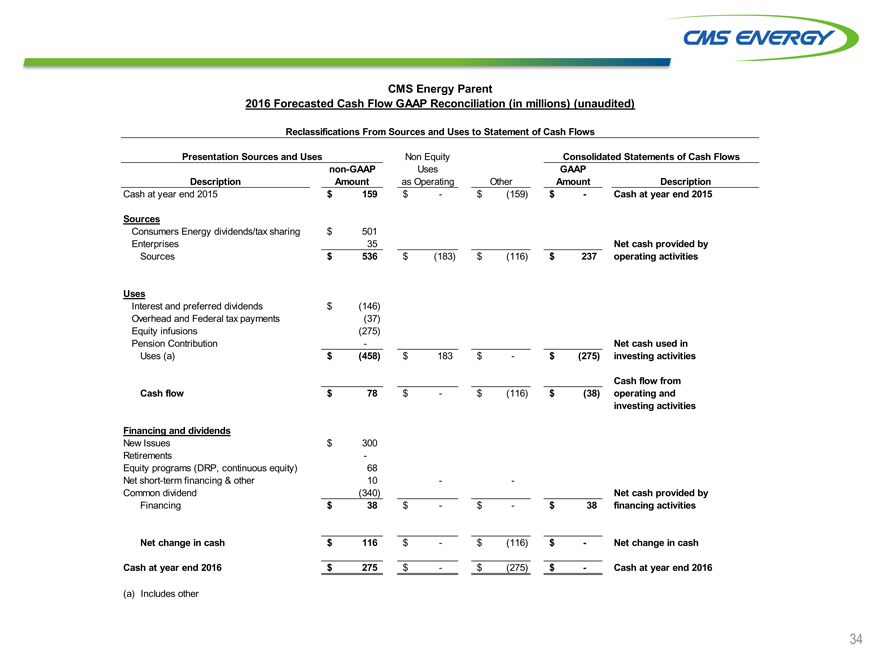
CMS Energy Parent
2016 Forecasted Cash Flow GAAP Reconciliation (in millions) (unaudited)
Reclassifications From Sources and Uses to Statement of Cash Flows
Presentation Sources and Uses Non Equity Consolidated Statements of Cash Flows
non-GAAP Uses GAAP
Description Amount as Operating Other Amount Description
Cash at year end 2015 $ 159 $—$(159) $—Cash at year end 2015
Sources
Consumers Energy dividends/tax sharing $ 501
Enterprises 35 Net cash provided by
Sources $ 536 $(183) $(116) $ 237 operating activities
Uses
Interest and preferred dividends $(146)
Overhead and Federal tax payments(37)
Equity infusions(275)
Pension Contribution—Net cash used in
Uses (a) $(458) $ 183 $—$(275) investing activities
Cash flow from
Cash flow $ 78 $—$(116) $(38) operating and
investing activities
Financing and dividends
New Issues $ 300
Retirements -
Equity programs (DRP, continuous equity) 68
Net short-term financing & other 10 —
Common dividend(340) Net cash provided by
Financing $ 38 $—$—$ 38 financing activities
Net change in cash $ 116 $—$(116) $—Net change in cash
Cash at year end 2016 $ 275 $—$(275) $—Cash at year end 2016
| (a) |
|
Includes other |
34
|
|
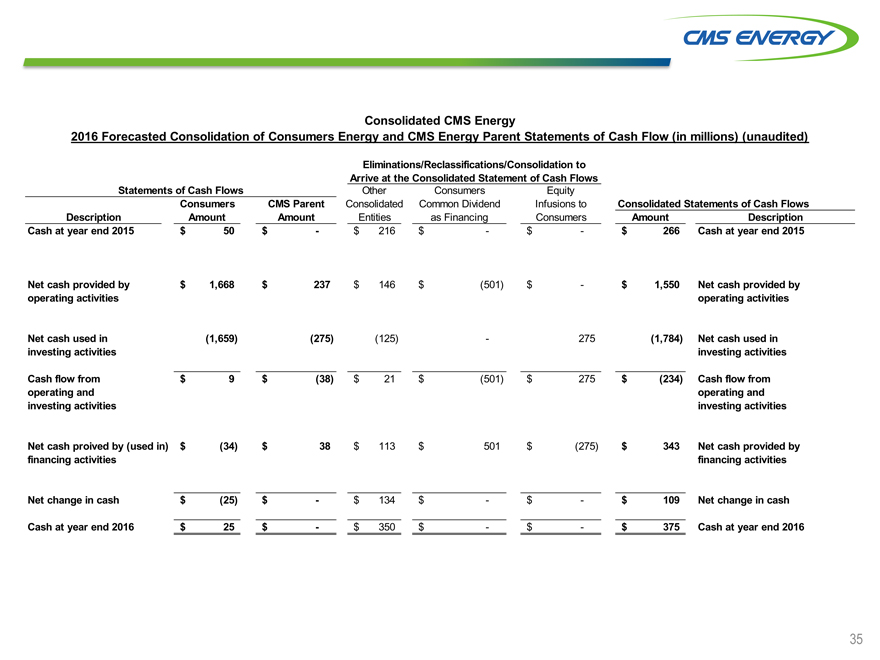
Consolidated CMS Energy
2016 Forecasted Consolidation of Consumers Energy and CMS Energy Parent Statements of Cash Flow (in millions) (unaudited)
Eliminations/Reclassifications/Consolidation to
Arrive at the Consolidated Statement of Cash Flows
Statements of Cash Flows Other Consumers Equity
Consumers CMS Parent Consolidated Common Dividend Infusions to Consolidated Statements of Cash Flows
Description Amount Amount Entities as Financing Consumers Amount Description
Cash at year end 2015 $ 50 $—$ 216 $—$—$ 266 Cash at year end 2015
Net cash provided by $ 1,668 $ 237 $ 146 $(501) $—$ 1,550 Net cash provided by
operating activities operating activities
Net cash used in(1,659)(275)(125)—275(1,784) Net cash used in
investing activities investing activities
Cash flow from $ 9 $(38) $ 21 $(501) $ 275 $(234) Cash flow from
operating and operating and
investing activities investing activities
Net cash proived by (used in) $(34) $ 38 $ 113 $ 501 $(275) $ 343 Net cash provided by
financing activities financing activities
Net change in cash $(25) $—$ 134 $—$—$ 109 Net change in cash
Cash at year end 2016 $ 25 $—$ 350 $—$—$ 375 Cash at year end 2016
35
|
|
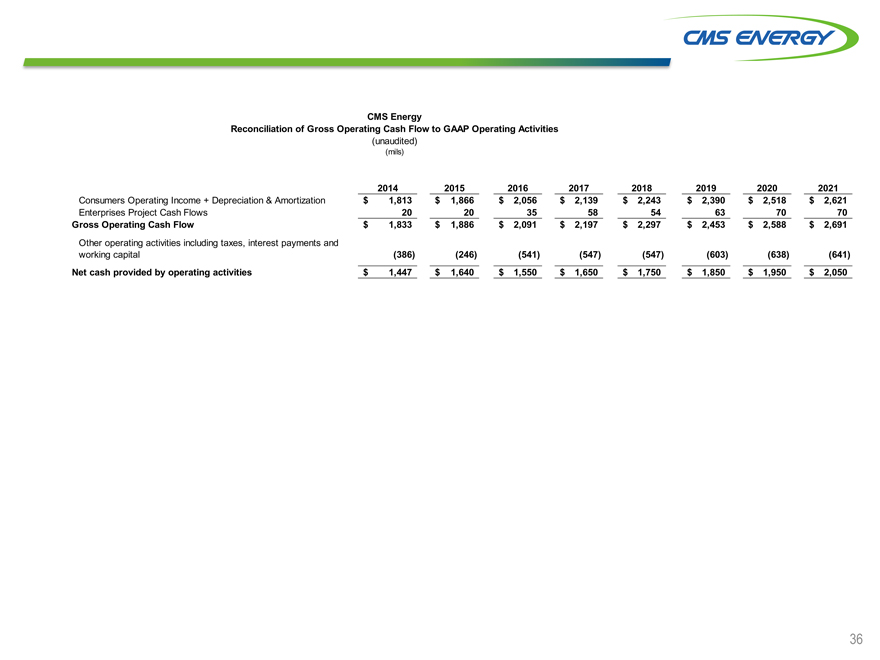
CMS Energy
Reconciliation of Gross Operating Cash Flow to GAAP Operating Activities
(unaudited)
(mils)
2014 2015 2016 2017 2018 2019 2020 2021
Consumers Operating Income + Depreciation & Amortization $ 1,813 $ 1,866 $ 2,056 $ 2,139 $ 2,243 $ 2,390 $ 2,518 $ 2,621
Enterprises Project Cash Flows 20 20 35 58 54 63 70 70
Gross Operating Cash Flow $ 1,833 $ 1,886 $ 2,091 $ 2,197 $ 2,297 $ 2,453 $ 2,588 $ 2,691
Other operating activities including taxes, interest payments and
working capital(386)(246)(541)(547)(547)(603)(638)(641)
Net cash provided by operating activities $ 1,447 $ 1,640 $ 1,550 $ 1,650 $ 1,750 $ 1,850 $ 1,950 $ 2,050
36
Serious News for Serious Traders! Try StreetInsider.com Premium Free!
You May Also Be Interested In
- CMS Energy (CMS) PT Raised to $66 at KeyBanc
- DMOS Revolutionizes Decentralized Computing Landscape with Groundbreaking Cloud Operating System
- Oak Valley Bancorp Reports 1st Quarter Results
Create E-mail Alert Related Categories
SEC FilingsSign up for StreetInsider Free!
Receive full access to all new and archived articles, unlimited portfolio tracking, e-mail alerts, custom newswires and RSS feeds - and more!
