

Form 8-K CMS ENERGY CORP For: Apr 28 Filed by: CONSUMERS ENERGY CO
 Tweet
Tweet Share
Share
UNITED STATES
SECURITIES AND EXCHANGE COMMISSION
Washington, D.C. 20549
FORM 8-K
CURRENT REPORT
PURSUANT TO SECTION 13 OR 15(d)
OF THE SECURITIES EXCHANGE ACT OF 1934
Date of Report (Date of earliest event reported) April 28, 2016
| Commission File Number |
Registrant; State of Incorporation; Address; and Telephone Number |
IRS Employer Identification No. | ||
| 1-9513 | CMS ENERGY CORPORATION (A Michigan Corporation) One Energy Plaza Jackson, Michigan 49201 (517) 788-0550 |
38-2726431 | ||
| 1-5611 | CONSUMERS ENERGY COMPANY (A Michigan Corporation) One Energy Plaza Jackson, Michigan 49201 (517) 788-0550 |
38-0442310 | ||
Check the appropriate box below if the Form 8-K filing is intended to simultaneously satisfy the filing obligation of the registrant under any of the following provisions:
| ¨ | Written communications pursuant to Rule 425 under the Securities Act (17 CFR 230.425) |
| ¨ | Soliciting material pursuant to Rule 14a-12 under the Exchange Act (17 CFR 240.14a-12) |
| ¨ | Pre-commencement communications pursuant to Rule 14d-2(b) under the Exchange Act (17 CFR 240.14d-2(b)) |
| ¨ | Pre-commencement communications pursuant to Rule 13e-4(c) under the Exchange Act (17 CFR 240.13e-4(c)) |
| Item 7.01. | Regulation FD Disclosure. |
CMS Energy Corporation (“CMS Energy”) will hold a webcast to discuss its 2016 first quarter results and provide a business and financial outlook on April 28 at 8:30 AM (EDT). A copy of the CMS Energy presentation is furnished as Exhibit 99.1 to this report. A webcast of the presentation will be available on the CMS Energy website, www.cmsenergy.com.
In accordance with General Instruction B.2 of Form 8-K, the information in this Current Report on Form 8-K, including Exhibit 99.1, shall not be deemed “filed” for the purposes of Section 18 of the Securities Exchange Act of 1934, or otherwise subject to the liabilities of that section, nor shall it be deemed incorporated by reference in any filing under the Securities Act of 1933.
Investors and others should note that CMS Energy routinely posts important information on its website and considers the Investor Relations section, www.cmsenergy.com/investor-relations, a channel of distribution.
| Item 9.01. | Financial Statements and Exhibits. |
(d) Exhibits.
| 99.1 | CMS Energy presentation dated April 28, 2016 |
SIGNATURES
Pursuant to the requirements of the Securities Exchange Act of 1934, the Registrants have duly caused this report to be signed on their behalf by the undersigned hereunto duly authorized.
| CMS ENERGY CORPORATION | ||||||
| Dated: April 28, 2016 | By: | /s/ Thomas J. Webb | ||||
| Thomas J. Webb | ||||||
| Executive Vice President and Chief Financial Officer | ||||||
| CONSUMERS ENERGY COMPANY | ||||||
| Dated: April 28, 2016 | By: | /s/ Thomas J. Webb | ||||
| Thomas J. Webb | ||||||
| Executive Vice President and Chief Financial Officer | ||||||
Exhibit Index
| 99.1 | CMS Energy presentation dated April 28, 2016 |
Exhibit 99.1

Exhibit 99.1
First Quarter 2016 Results & Outlook April 28, 2016
Jackson Generating Station Ludington Pumped Storage Cross Winds âEnergy Park
Among lowest acquisition cost ever Fourth largest in the world #2 in renewable sales in the Great Lakes area
This presentation is made as of the date hereof and contains “forward-looking statements” as defined in Rule 3b-6 of the
Securities Exchange Act of 1934, Rule 175 of the Securities Act of 1933, and relevant legal decisions. The forward-looking statements are subject to risks and uncertainties. All forward-looking statements should be considered in the context of the risk and other factors detailed from time to time in CMS Energy’s and Consumers Energy’s Securities and Exchange Commission filings. Forward-looking statements should be read in conjunction with “FORWARD-LOOKING STATEMENTS AND
INFORMATION” and “RISK FACTORS” sections of CMS Energy’s and Consumers Energy’s Form 10-K for the year ended
December 31, 2015 and as updated in subsequent 10-Qs. CMS Energy’s and Consumers Energy’s “FORWARD-LOOKING
STATEMENTS AND INFORMATION” and “RISK FACTORS” sections are incorporated herein by reference and discuss important factors that could cause CMS Energy’s and Consumers Energy’s results to differ materially from those anticipated in such statements. CMS Energy and Consumers Energy undertake no obligation to update any of the information presented herein to reflect facts, events or circumstances after the date hereof.
The presentation also includes non-GAAP measures when describing CMS Energy’s results of operations and financial performance. A reconciliation of each of these measures to the most directly comparable GAAP measure is included in the appendix and posted on our website at www.cmsenergy.com.
CMS Energy provides historical financial results on both a reported (GAAP) and adjusted (non-GAAP) basis and provides forward-looking guidance on an adjusted basis. Management views adjusted earnings as a key measure of the company’s present operating financial performance, unaffected by discontinued operations, asset sales, impairments, regulatory items from prior years, or other items. These items have the potential to impact, favorably or unfavorably, the company’s reported earnings in future periods.
Investors and others should note that CMS Energy routinely posts important information on its website and considers the Investor Relations section, www.cmsenergy.com/investor-relations, a channel of distribution.
| 1 |
|
Agenda
Overview
First Quarter Results Operational Performance
Our Model
Capital Investment Quality Improvements & Cost Reductions
Financial Results & Outlook
First Quarter; Full Year Weather Mitigation
John Russell President & CEO
Patti Poppe
Senior Vice President & Incoming CEO
Tom Webb
Executive VP & CFO
| 2 |
|
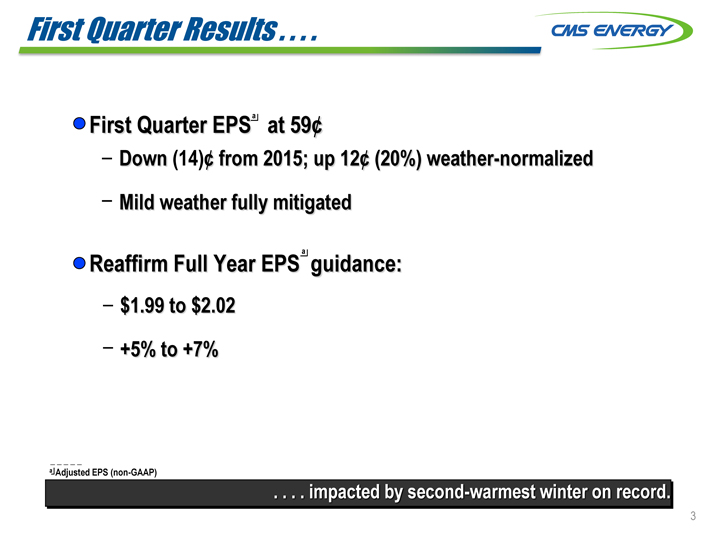
First Quarter Results . . . .
First Quarter EPSa at 59¢
Down (14)¢ from 2015; up 12¢ (20%) weather-normalized Mild weather fully mitigated
Reaffirm Full Year EPS a guidance:
$1.99 to $2.02 +5% to +7%
a Adjusted EPS (non-GAAP)
. . . . impacted by second-warmest winter on record.
3
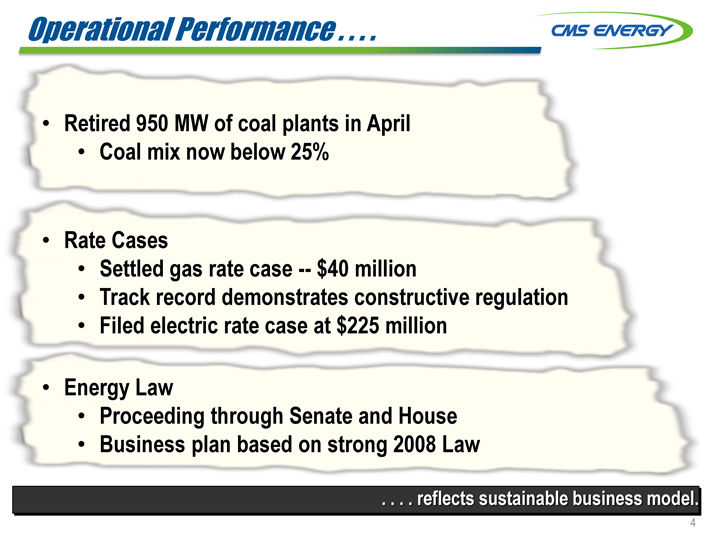
Operational Performance
Retired 950 MW of coal plants in April
Coal mix now below 25%
Rate Cases
Settled gas rate case — $40 million
Track record demonstrates constructive regulation
Filed electric rate case at $225 million
Energy Law
Proceeding through Senate and House
Business plan based on strong 2008 Law
reflects sustainable business model.
| 4 |
|
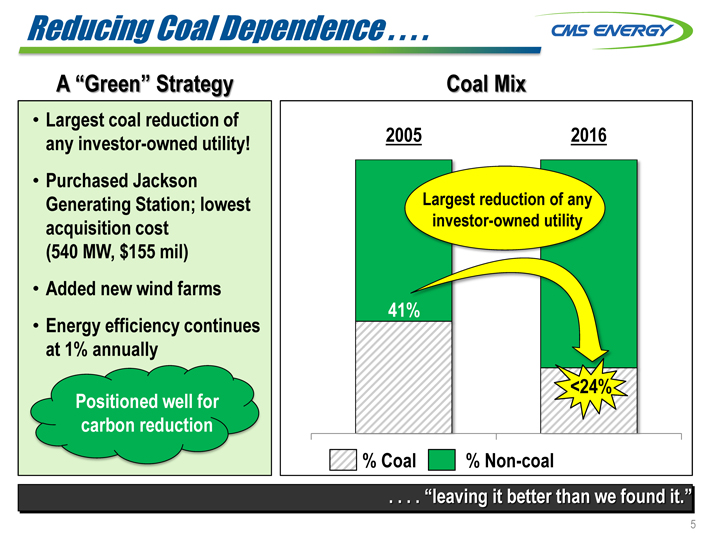
Reducing Coal Dependence . . . .
A “Green” Strategy
Largest coal reduction of any investor-owned utility! Purchased Jackson Generating Station; lowest acquisition cost (540 MW, $155 mil) Added new wind farms Energy efficiency continues at 1% annually
Positioned well for carbon reduction
Coal Mix
2005 2016
Largest reduction of any investor-owned utility
41%
<24%
% Coal % Non-coal
. . . . “leaving it better than we found it.”
| 5 |
|
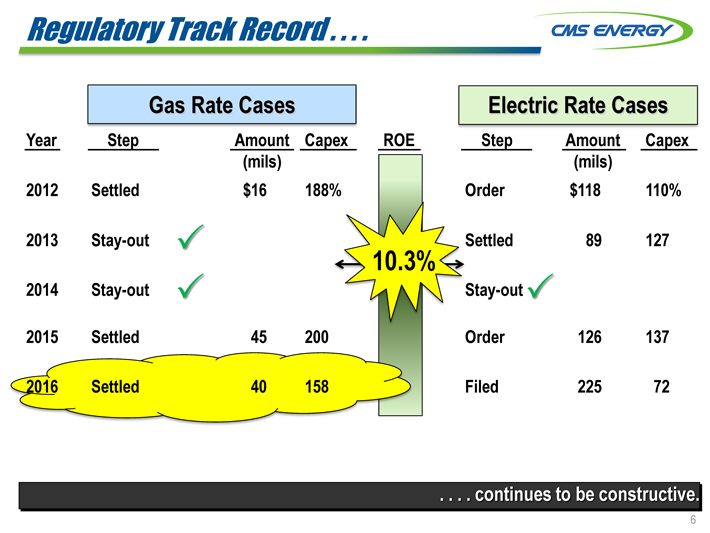
Regulatory Track Record
Gas Rate Cases Electric Rate Cases
Year Step Amount Capex ROE Step Amount Capex
(mils) (mils)
2012 Settled $16 188% Order $118 110%
2013 Stay-out Settled 89 127
10.3%
2014 Stay-out Stay-out
2015 Settled 45 200 Order 126 137
2016 Settled 40 158 Filed 225 72
continues to be constructive.
| 6 |
|
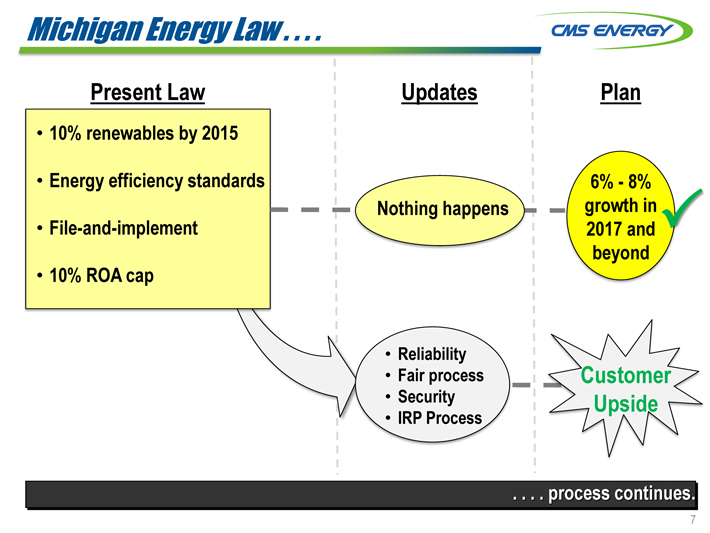
Michigan Energy Law . . . .
Present Law
10% renewables by 2015 Energy efficiency standards File-and-implement 10% ROA cap
Updates Plan
6%—8% Nothing happens growth in 2017 and beyond
Reliability
Fair process Customer
Security Upside
IRP Process
. . . . process continues.
| 7 |
|
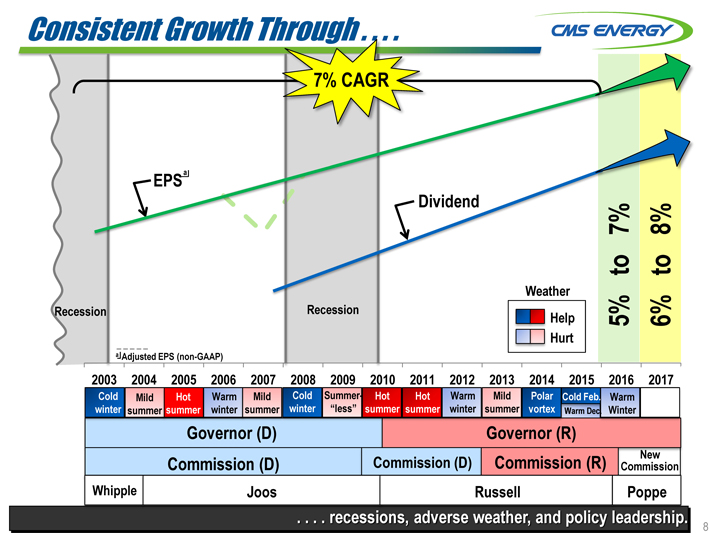
Consistent Growth Through . . . .
7% CAGR
EPSa DividendRecession Recession
a Adjusted EPS (non-GAAP)
Weather
Help
Hurt
5% to 7% 6% to 8%
2003 2004 2005 2006 2007 2008 2009 2010 2011 2012 2013 2014 2015 2016 2017 Cold Feb.
Cold Mild Hot Warm Mild Cold Summer- Hot Hot Warm Mild Polar Cold Feb. Warm
winter summer summer winter summer winter “less” summer summer winter summer vortex Warm Dec. Winter
Governor (D) Governor (R)
Commission (D) Commission (D) Commission (R) Commission
Whipple Joos Russell Poppe
recessions, adverse weather, and policy leadership.
New 8

Capex $17 Billion Over 10 Years . . . .
2016-2025 2016-2025
Investor AND Customer
How this adds value!
Cleaner Energy
Electric
Gas
Infrastructure & Enhancing
Infrastructure & Improving
Maintenance Productivity
Maintenance Service
Reducing
New
Electric Cost Generation Distribution & Reliability
Environmental
. . . . without raising base rates above inflation.
9
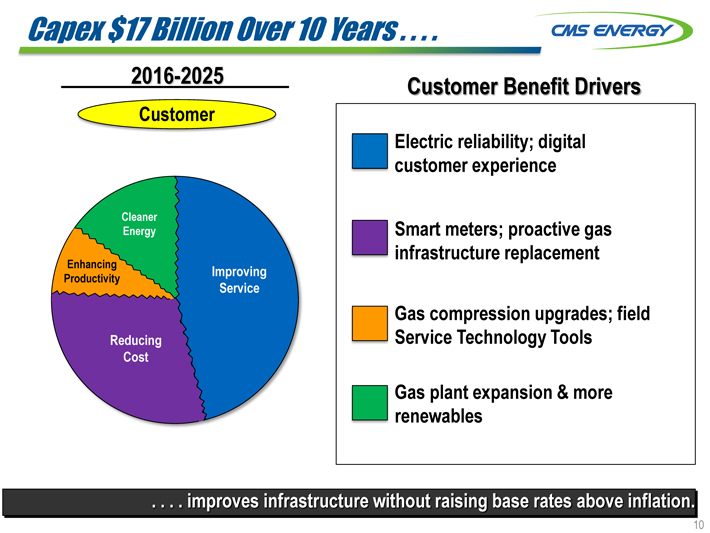
Capex $17 Billion Over 10 Years . . . .
2016-2025
Customer
Cleaner Energy
Enhancing
Improving
Productivity
Service
Reducing
Cost
Customer Benefit Drivers
Electric reliability; digital customer experience
Smart meters; proactive gas infrastructure replacement
Gas compression upgrades; field Service Technology Tools
Gas plant expansion & more renewables
. .. . . improves infrastructure without raising base rates above inflation.
10
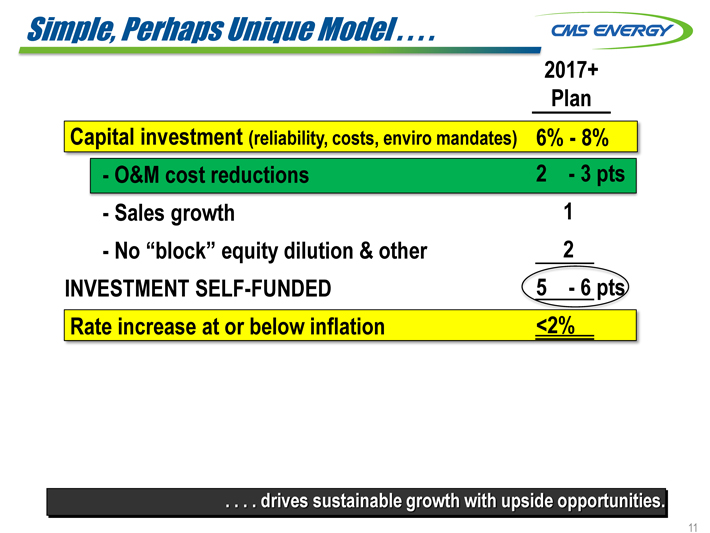
Simple, Perhaps Unique Model
2017+
Plan
Capital investment (reliability, costs, enviro mandates) 6%—8%
- O&M cost reductions 2—3 pts
- Sales growth 1
- No “block” equity dilution & other 2
INVESTMENT SELF-FUNDED 5—6 pts
Rate increase at or below inflation <2%
drives sustainable growth with upside opportunities.
11
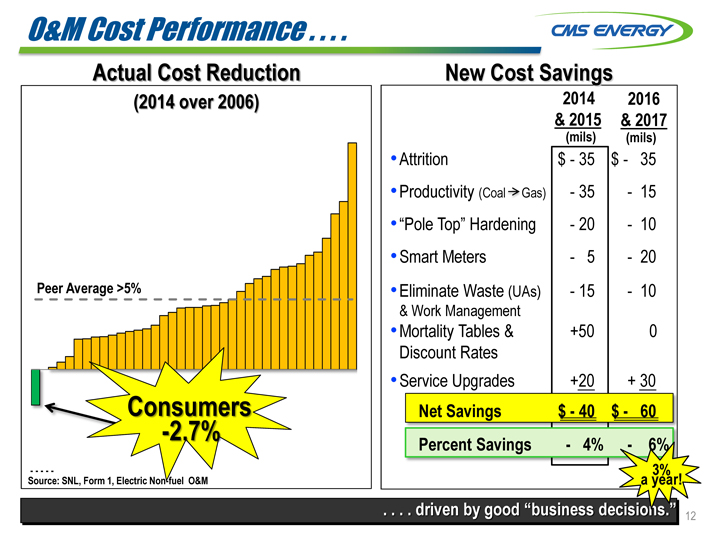
O&M Cost Performance . . . .
Actual Cost Reduction
(2014 over 2006)
Peer Average >5%
Consumers -2.7%
Source: — —— SNL, Form 1, Electric Non-fuel O&M
New Cost Savings
2014 2016
& 2015 & 2017
(mils) (mils)
Attrition $—35 $—35
Productivity (Coal Gas)—35 —15
“Pole Top” Hardening—20 —10
Smart Meters —5 —20
Eliminate Waste (UAs)—15 —10
& Work Management
Mortality Tables & +50 0
Discount Rates
Service Upgrades +20 + 30
Net Savings $—40 $—60
Percent Savings—4% —6%
3%
a year!
driven by good “business decisions.”
12
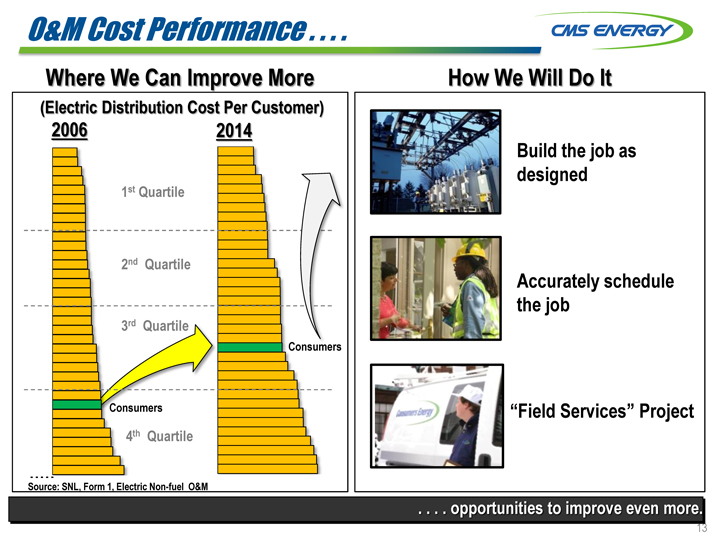
O&M Cost Performance . . . .
Where We Can Improve More
(Electric Distribution Cost Per Customer)
2006 2014
1st Quartile
2nd Quartile
3rd Quartile
4th Quartile
Consumers Consumers Source: — —— SNL, Form 1, Electric Non-fuel O&M
How We Will Do It
Build the job as designed
Accurately schedule the job
“Field Services” Project
. . . . opportunities to improve even more.
13
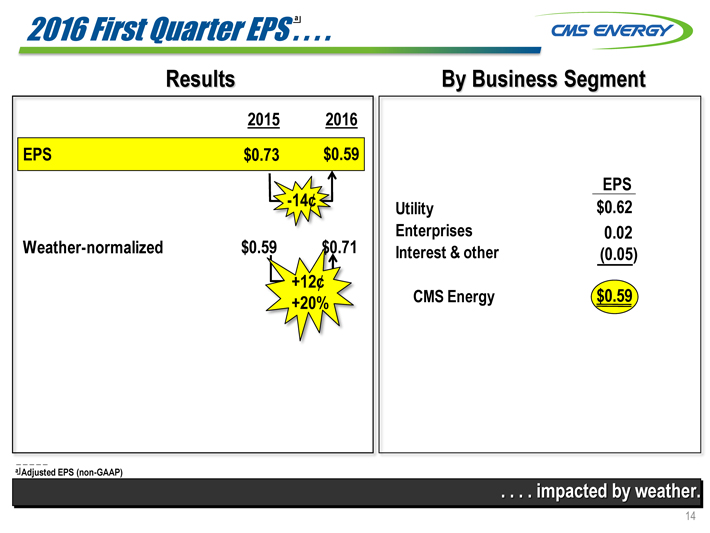
2016 First Quarter EPS . a . .
Results
2015 2016 EPS $0.73 $0.59
-14¢
Weather-normalized $0.59 $0.71
+12¢ +20%
a Adjusted EPS (non-GAAP)
By Business Segment
EPS
$0.62
0.02 (0.05)
$0.59
. . . . impacted by weather.
Utility Enterprises Interest & other
CMS Energy14
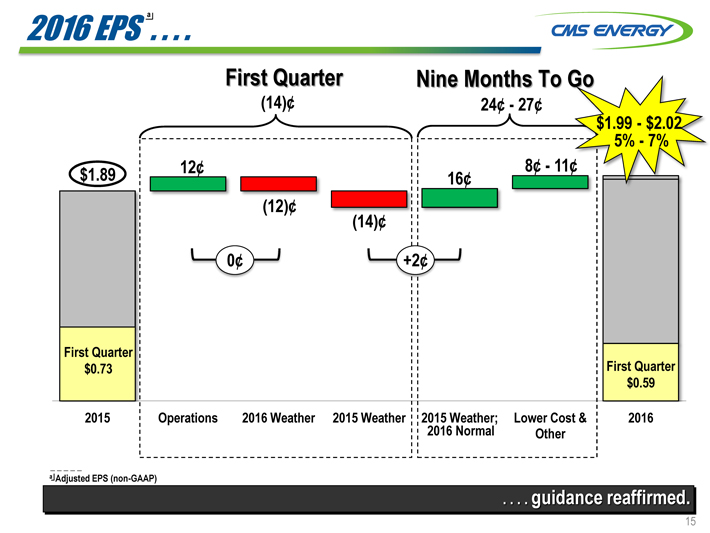
2016 EPS a .. . . .
First Quarter Nine Months To Go
| (14)¢ |
|
24¢—27¢ |
$1.99—$2.02
5%—7% 12¢ 8¢—11¢
$1.89 16¢ (12)¢ (14)¢
0¢ +2¢
First Quarter
$0.73 First Quarter
$0.59
2015 Operations 2016 Weather 2015 Weather 2015 2016 Weather; Normal Lower Cost & 2016 Other
a Adjusted EPS (non-GAAP)
. . . . guidance reaffirmed.
15
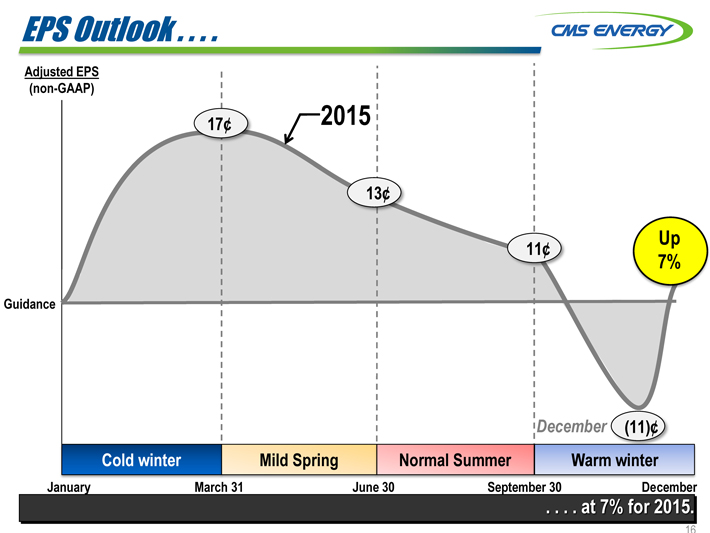
EPS Outlook . . . .
Adjusted EPS (non-GAAP)
17¢ 2015
13¢
Up
11¢
7%
Guidance
December (11)¢
Cold winter Mild Spring Normal Summer Warm winter
January March 31 June 30 September 30 December
. . . . at 7% for 2015.
16
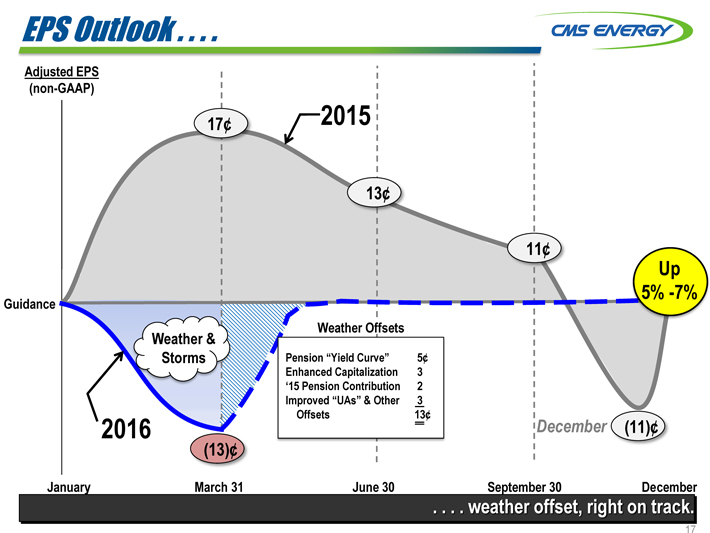
EPS Outlook . . . .
Adjusted EPS (non-GAAP)
17¢ 2015
13¢
11¢
Up
5% -7%
Guidance
Weather Offsets
Weather &
Storms Pension “Yield Curve” 5¢
Enhanced Capitalization 3
‘15 Pension Contribution 2 Improved “UAs” & Other 3 Offsets 13¢
2016 December (11)¢
| (13)¢ |
|
January March 31 June 30 September 30 December
. . . . weather offset, right on track.
17
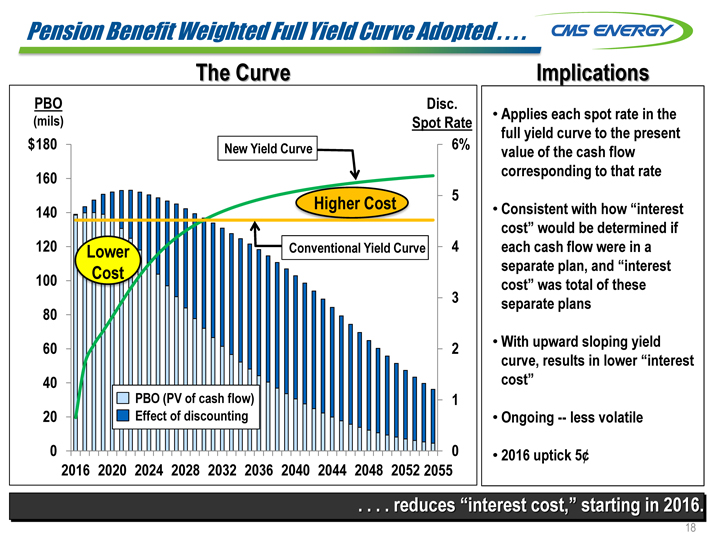
Pension Benefit Weighted Full Yield Curve Adopted . . . .
The Curve
PBO Disc. (mils) Spot Rate $ 180 6%
New Yield Curve
160
Higher Cost
140
120 Lower Conventional Yield Curve
100 Cost
80
60
40
PBO (PV of cash flow)
20 Effect of discounting
0
2016 2020 2024 2028 2032 2036 2040 2044 2048 2052 2055
5 4 3 2 1 0
Implications
Applies each spot rate in the full yield curve to the present value of the cash flow corresponding to that rate
Consistent with how “interest cost” would be determined if each cash flow were in a separate plan, and “interest cost” was total of these separate plans
With upward sloping yield curve, results in lower “interest cost”
Ongoing — less volatile
2016 uptick 5¢
. . . . reduces “interest cost,” starting in 2016.
18

Managing Work Every Year . . . .
Adjusted 2011 2012 2013 2014 2015
EPS $2.10
Mild 2.00 +17¢ Summer
+7%
1.90 +18¢
1.80 Offsets
Ice Storm -13¢
+7% Reinvestment
old RECORD
Cost WARM 1.70 Winter Savings +13¢ +7¢ +7% Reinvestment 1.60 Hot Mild Vortex Winter Summer +7% -9¢ 1.50 +1¢ old Reinvestment 2013 – 2015 Winter ICE
+7% Reinvestment Customer Reinvestment =
Hot STORM
1.40 Summer $238 million
Storms
-13¢
. . . . maximizes benefits for customers AND investors.
19
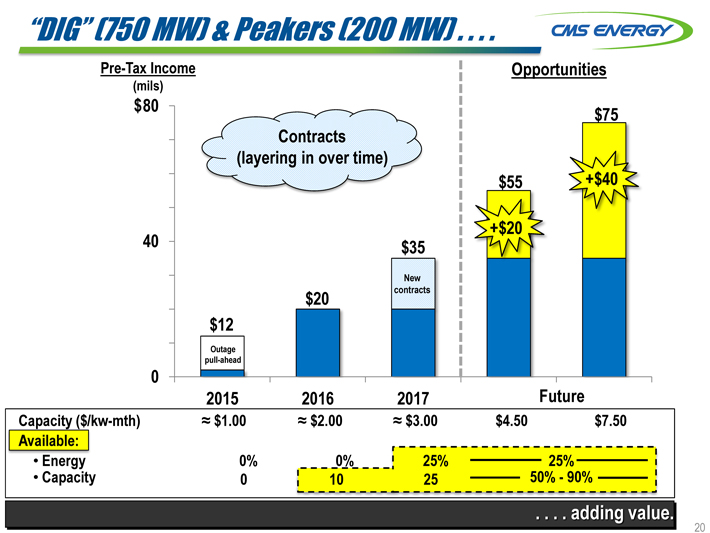
“DIG” (750 MW) & Peakers (200 MW)
Pre-Tax Income Opportunities
(mils)
$ 80 $75
Contracts
(layering in over time)
$55 +$40
+$20
40 $35
New
$20 contracts
$12
Outage
pull-ahead
0
2015 2016 2017 Future
Capacity ($/kw-mth) $1.00 $2.00 $3.00 $4.50 $ 7.50
Available:
Energy 0% 0% 25% 25%
Capacity 0 10 25 50%—90%
adding value.
20
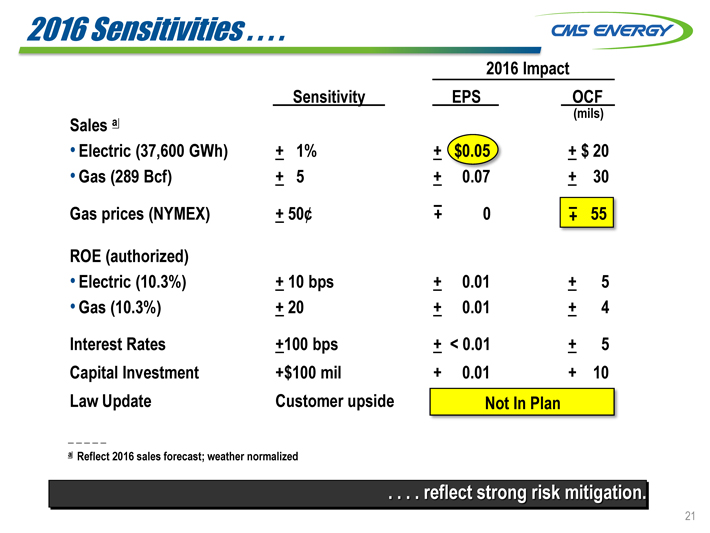
2016 Sensitivities
2016 Impact
Sensitivity EPS OCF
(mils)
Sales a
Electric (37,600 GWh) + 1% + $0.05 + $ 20
Gas (289 Bcf) + 5 + 0.07 + 30
Gas prices (NYMEX) + 50¢ + – 0 + – 55
ROE (authorized)
Electric (10.3%) + 10 bps + 0.01 + 5
Gas (10.3%) + 20 + 0.01 + 4
Interest Rates +100 bps + < 0.01 + 5
Capital Investment +$100 mil + 0.01 + 10
_ Law Update Customer upside Not In Plan
a Reflect 2016 sales forecast; weather normalized
reflect strong risk mitigation.
21
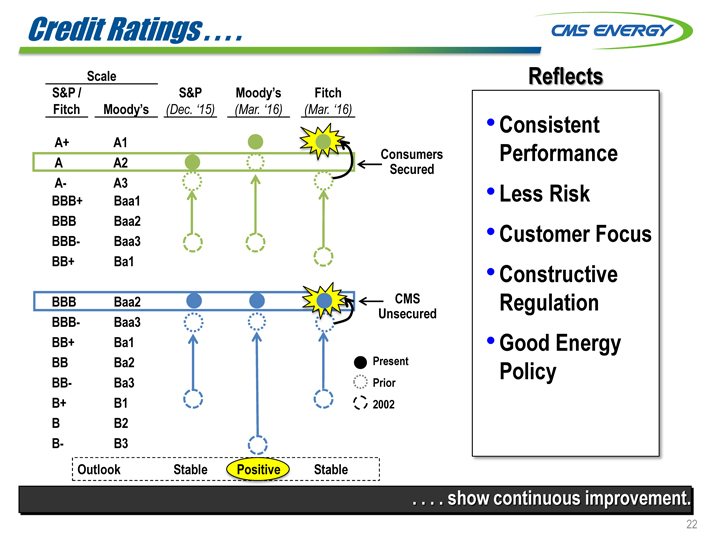
Credit Ratings . . . .
Scale Reflects
S&P / S&P Moody’s Fitch
Fitch Moody’s (Dec. ‘15) (Mar. ‘16) (Mar. ‘16)
Consistent
A+ A1
Consumers Performance
A A2 Secured
A- A3 • Less Risk BBB+ Baa1
BBB Baa2
BBB- Baa3 • Customer Focus
BB+ Ba1 •
Constructive
BBB Baa2 CMS Regulation
Unsecured BBB- Baa3
BB+ Ba1 Good Energy
BB Ba2 Present Policy BB- Ba3 Prior B+ B1 2002
B B2
B- B3
Outlook Stable Positive Stable
. . . . show continuous improvement.
22
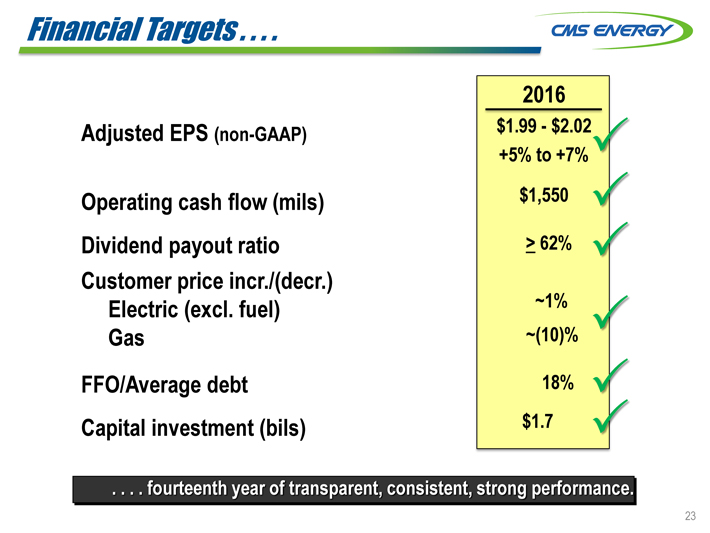
Financial Targets . . . .
Adjusted EPS (non-GAAP)
Operating cash flow (mils) Dividend payout ratio Customer price incr./(decr.) Electric (excl. fuel) Gas
FFO/Average debt Capital investment (bils)
2.02 +7% 62% 18% 2016
$1.99—$ +5% to $1,550
>
~1% ~(10)%
$1.7
. . . . fourteenth year of transparent, consistent, strong performance.
23
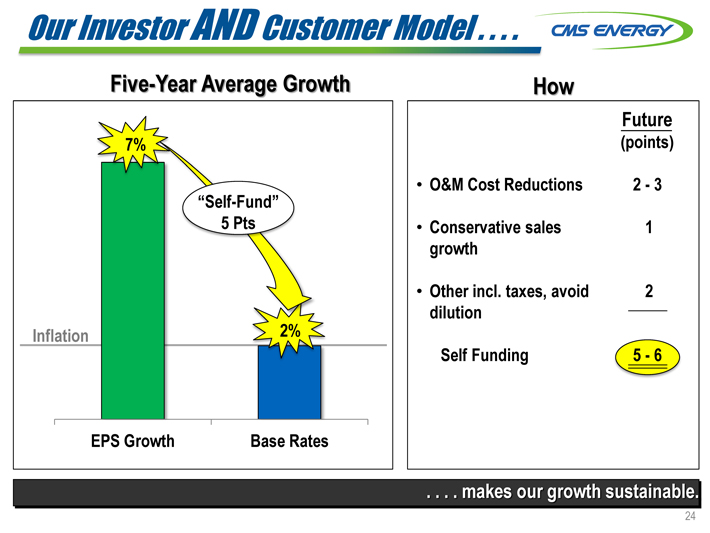
Our Investor AND Customer Model . . . .
Five-Year Average Growth
7%
“Self-Fund”
5 Pts Inflation 2% EPS Growth Base Rates
How
Future
(points)
O&M Cost Reductions 2—3
Conservative sales 1 growth
Other incl. taxes, avoid 2 dilution
Self Funding 5—6
. . . . makes our growth sustainable.
24

Q & A

Appendix
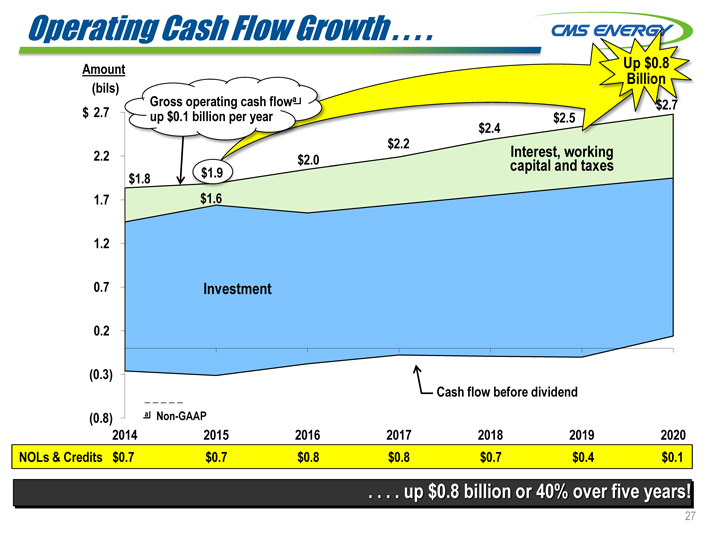
Operating Cash Flow Growth
Amount Up $0.8
(bils) Billion
Gross operating cash flowa
$ 2.7 up $0.1 billion per year $2.5
2.2
$1.8 $1.9
1.7 $1.6
1.2
0.7 Investment
0.2
(0.3)
Cash flow before dividend
(0.8) a Non-GAAP
2014 2015 2016 2017 2018 2019 2020
NOLs & Credits $0.7 $0.7 $0.8 $0.8 $0.7 $0.4 $0.1
up $0.8 billion or 40% over five years!
Interest, working capital and taxes
$2.0 $2.2 $2.4 $2.7 27
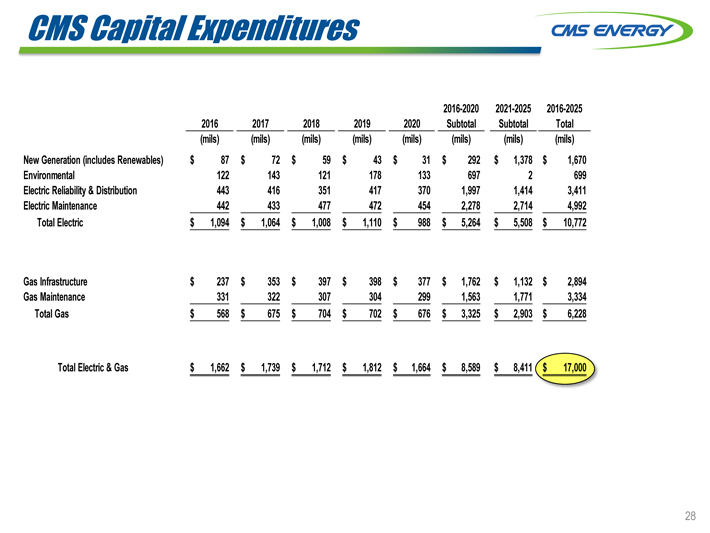
CMS Capital Expenditures
2016-2020 2021-2025 2016-2025
2016 2017 2018 2019 2020 Subtotal Subtotal Total
(mils) (mils) (mils) (mils) (mils) (mils) (mils) (mils)
New Generation (includes Renewables) $ 87 $ 72 $ 59 $ 43 $ 31 $ 292 $ 1,378 $ 1,670
Environmental 122 143 121 178 133 697 2 699
Electric Reliability & Distribution 443 416 351 417 370 1,997 1,414 3,411
Electric Maintenance 442 433 477 472 454 2,278 2,714 4,992
Total Electric $ 1,094 $ 1,064 $ 1,008 $ 1,110 $ 988 $ 5,264 $ 5,508 $ 10,772
Gas Infrastructure $ 237 $ 353 $ 397 $ 398 $ 377 $ 1,762 $ 1,132 $ 2,894
Gas Maintenance 331 322 307 304 299 1,563 1,771 3,334
Total Gas $ 568 $ 675 $ 704 $ 702 $ 676 $ 3,325 $ 2,903 $ 6,228
Total Electric & Gas $ 1,662 $ 1,739 $ 1,712 $ 1,812 $ 1,664 $ 8,589 $ 8,411 $ 17,000
28
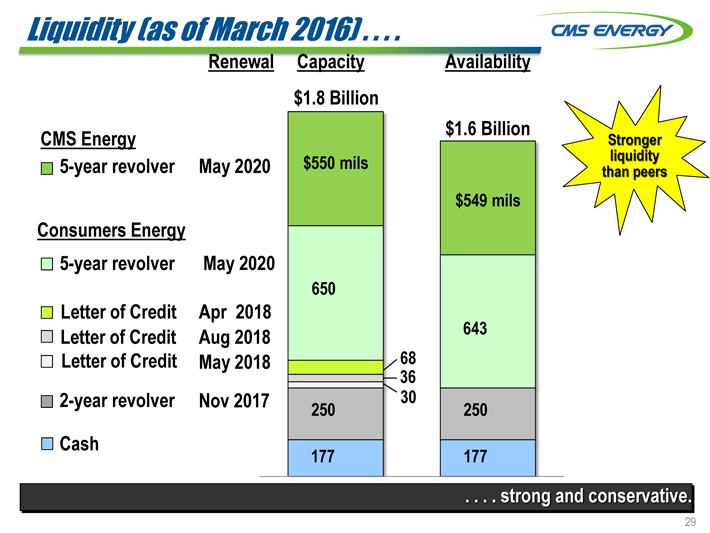
Liquidity (as of March 2016) . . . .
Renewal Capacity Availability
CMS Energy
5-year revolver May 2020
Consumers Energy
5-year revolver May 2020
Letter of Credit Apr 2018 Letter of Credit Aug 2018 Letter of Credit May 2018
2-year revolver Nov 2017 Cash
$1.8 Billion
$1.6 Billion
Stronger $550 mils liquidity than peers
$549 mils
650
643 68
36 30
250 250
177 177
. . . . strong and conservative.
29
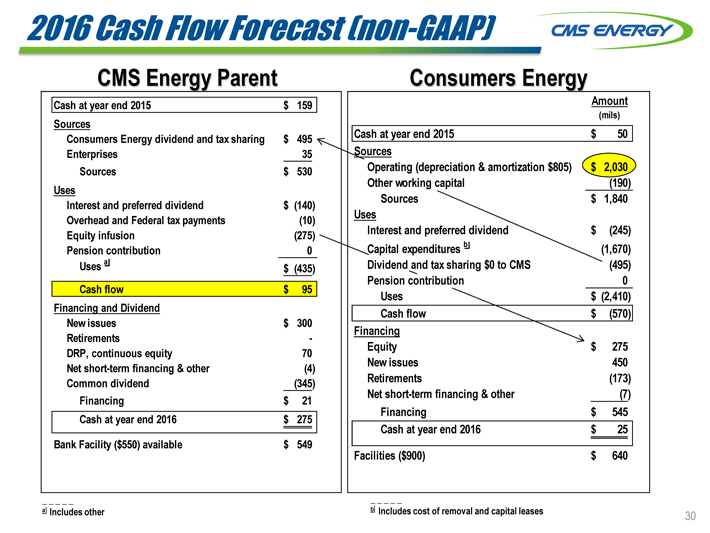
2016 Cash Flow Forecast (non-GAAP)
CMS Energy Parent
Cash at year end 2015 $ 159
Sources
Consumers Energy dividend and tax sharing $ 495
Enterprises 35
Sources $ 530
Uses
Interest and preferred dividend $ (140)
Overhead and Federal tax payments (10)
Equity infusion (275)
Pension contribution 0
Uses a $ (435)
Cash flow $ 95
Financing and Dividend
New issues $ 300
Retirements -
DRP, continuous equity 70
Net short-term financing & other (4)
Common dividend (345)
Financing $ 21
Cash at year end 2016 $ 275
Bank Facility ($550) available $ 549
a Includes other
Consumers Energy
Amount
(mils)
Cash at year end 2015 $ 50
Sources
Operating (depreciation & amortization $805) $ 2,030
Other working capital (190)
Sources $ 1,840
Uses
Interest and preferred dividend $ (245)
Capital expenditures b (1,670)
Dividend and tax sharing $0 to CMS (495)
Pension contribution 0
Uses $ (2,410)
Cash flow $ (570)
Financing
Equity $ 275
New issues 450
Retirements (173)
Net short-term financing & other (7)
Financing $ 545
Cash at year end 2016 $ 25
Facilities ($900) $ 640
b Includes cost of removal and capital leases 30

GAAP Reconciliation
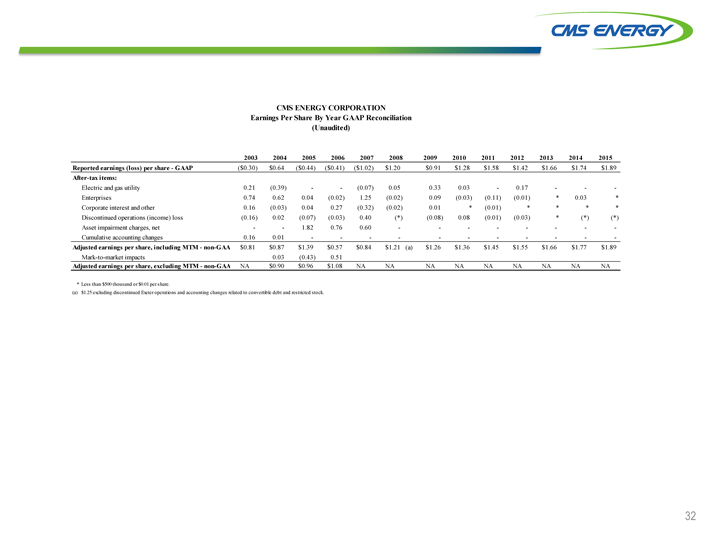
CMS ENERGY CORPORATION
Earnings Per Share By Year GAAP Reconciliation
(Unaudited)
2003 2004 2005 2006 2007 2008 2009 2010 2011 2012 2013 2014 2015
Reported earnings (loss) per share—GAAP ($0.30) $0.64 ($0.44) ($0.41) ($1.02) $1.20 $0.91 $1.28 $1.58 $1.42 $1.66 $1.74 $1.89
After-tax items:
Electric and gas utility 0.21 (0.39) — (0.07) 0.05 0.33 0.03—0.17 ——
Enterprises 0.74 0.62 0.04 (0.02) 1.25 (0.02) 0.09 (0.03) (0.11) (0.01) * 0.03 *
Corporate interest and other 0.16 (0.03) 0.04 0.27 (0.32) (0.02) 0.01 * (0.01) * * * *
Discontinued operations (income) loss (0.16) 0.02 (0.07) (0.03) 0.40 (*) (0.08) 0.08 (0.01) (0.03) * (*) (*)
Asset impairment charges, net — 1.82 0.76 0.60 — — — —
Cumulative accounting changes 0.16 0.01 — — — — ——
Adjusted earnings per share, including MTM—non-GAA $0.81 $0.87 $1.39 $0.57 $0.84 $1.21 (a) $1.26 $1.36 $1.45 $1.55 $1.66 $1.77 $1.89
Mark-to-market impacts 0.03 (0.43) 0.51
Adjusted earnings per share, excluding MTM—non-GAA NA $0.90 $0.96 $1.08 NA NA NA NA NA NA NA NA NA
* Less than $500 thousand or $0.01 per share.
(a) $1.25 excluding discontinued Exeter operations and accounting changes related to convertible debt and restricted stock.
32
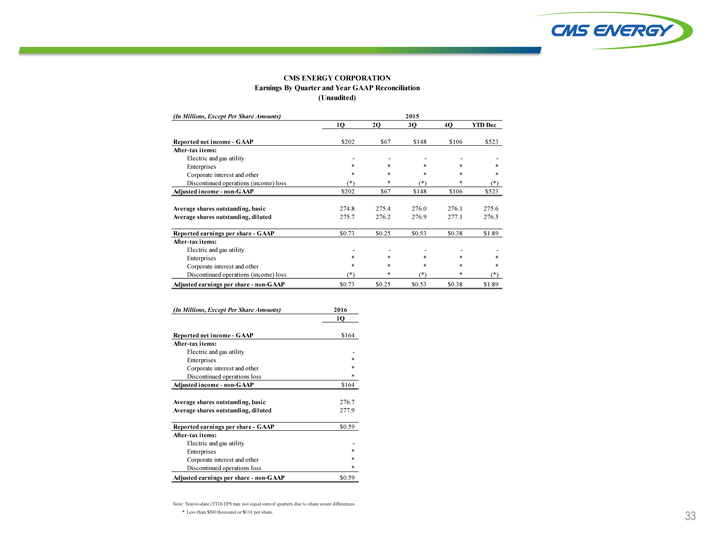
CMS ENERGY CORPORATION
Earnings By Quarter and Year GAAP Reconciliation
(Unaudited)
(In Millions, Except Per Share Amounts) 2015
1Q 2Q 3Q 4Q YTD Dec
Reported net income—GAAP $202 $67 $148 $106 $523
After-tax items:
Electric and gas utility — ——
Enterprises * * * * *
Corporate interest and other * * * * *
Discontinued operations (income) loss (*) * (*) * (*)
Adjusted income—non-GAAP $202 $67 $148 $106 $523
Average shares outstanding, basic 274.8 275.4 276.0 276.1 275.6
Average shares outstanding, diluted 275.7 276.2 276.9 277.1 276.5
Reported earnings per share—GAAP $0.73 $0.25 $0.53 $0.38 $1.89
After-tax items:
Electric and gas utility — ——
Enterprises * * * * *
Corporate interest and other * * * * *
Discontinued operations (income) loss (*) * (*) * (*)
Adjusted earnings per share—non-GAAP $0.73 $0.25 $0.53 $0.38 $1.89
(In Millions, Except Per Share Amounts) 2016
1Q
Reported net income—GAAP $164
After-tax items:
Electric and gas utility—
Enterprises *
Corporate interest and other *
Discontinued operations loss *
Adjusted income—non-GAAP $164
Average shares outstanding, basic 276.7
Average shares outstanding, diluted 277.9
Reported earnings per share—GAAP $0.59
After-tax items:
Electric and gas utility—
Enterprises *
Corporate interest and other *
Discontinued operations loss *
Adjusted earnings per share—non-GAAP $0.59
Note: Year-to-date (YTD) EPS may not equal sum of quarters due to share count differences.
* Less than $500 thousand or $0.01 per share. 33
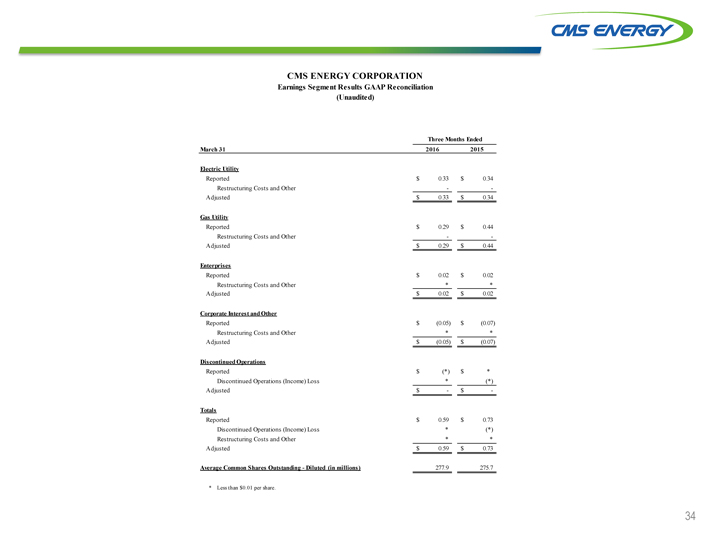
CMS ENERGY CORPORATION
Earnings Segment Results GAAP Reconciliation
(Unaudited)
Three Months Ended
March 31 2016 2015
Electric Utility
Reported $ 0.33 $ 0.34
Restructuring Costs and Other ——
Adjusted $ 0.33 $ 0.34
Gas Utility
Reported $ 0.29 $ 0.44
Restructuring Costs and Other ——
Adjusted $ 0.29 $ 0.44
Enterprises
Reported $ 0.02 $ 0.02
Restructuring Costs and Other * *
Adjusted $ 0.02 $ 0.02
Corporate Interest and Other
Reported $ (0.05) $ (0.07)
Restructuring Costs and Other * *
Adjusted $ (0.05) $ (0.07)
Discontinued Operations
Reported $ (*) $ *
Discontinued Operations (Income) Loss * (*)
Adjusted $—$—
Totals
Reported $ 0.59 $ 0.73
Discontinued Operations (Income) Loss * (*)
Restructuring Costs and Other * *
Adjusted $ 0.59 $ 0.73
Average Common Shares Outstanding—Diluted (in millions) 277.9 275.7
* Less than $0.01 per share.
34
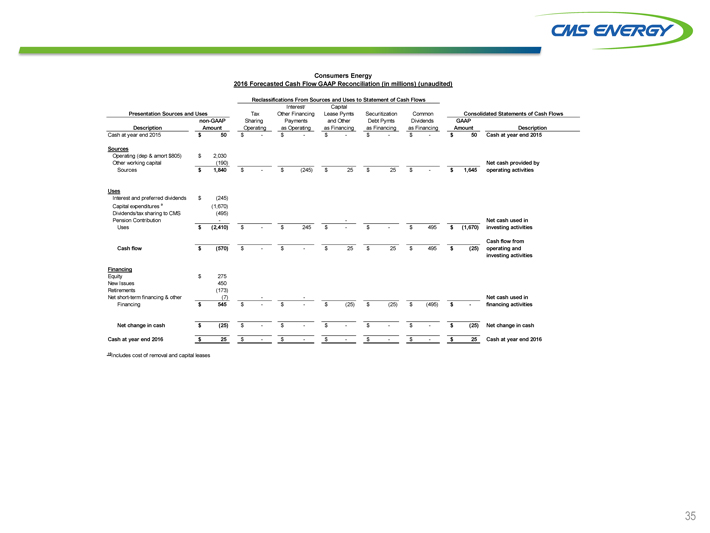
Consumers Energy
2016 Forecasted Cash Flow GAAP Reconciliation (in millions) (unaudited)
Reclassifications From Sources and Uses to Statement of Cash Flows
Interest/ Capital
Presentation Sources and Uses Tax Other Financing Lease Pymts Securitization Common Consolidated Statements of Cash Flows
non-GAAP Sharing Payments and Other Debt Pymts Dividends GAAP
Description Amount Operating as Operating as Financing as Financing as Financing Amount Description
Cash at year end 2015 $ 50 $—$—$—$—$—$ 50 Cash at year end 2015
Sources
Operating (dep & amort $805) $ 2,030
Other working capital (190) Net cash provided by
Sources $ 1,840 $—$ (245) $ 25 $ 25 $—$ 1,645 operating activities
Uses
Interest and preferred dividends $ (245)
Capital expenditures a (1,670)
Dividends/tax sharing to CMS (495)
Pension Contribution — — Net cash used in
Uses $ (2,410) $—$ 245 $—$—$ 495 $ (1,670) investing activities
Cash flow from
Cash flow $ (570) $—$—$ 25 $ 25 $ 495 $ (25) operating and
investing activities
Financing
Equity $ 275
New Issues 450
Retirements (173)
Net short-term financing & other (7) —— Net cash used in
Financing $ 545 $—$—$ (25) $ (25) $ (495) $—financing activities
Net change in cash $ (25) $—$—$—$—$—$ (25) Net change in cash
Cash at year end 2016 $ 25 $—$—$—$—$—$ 25 Cash at year end 2016
a Includes cost of removal and capital leases
35
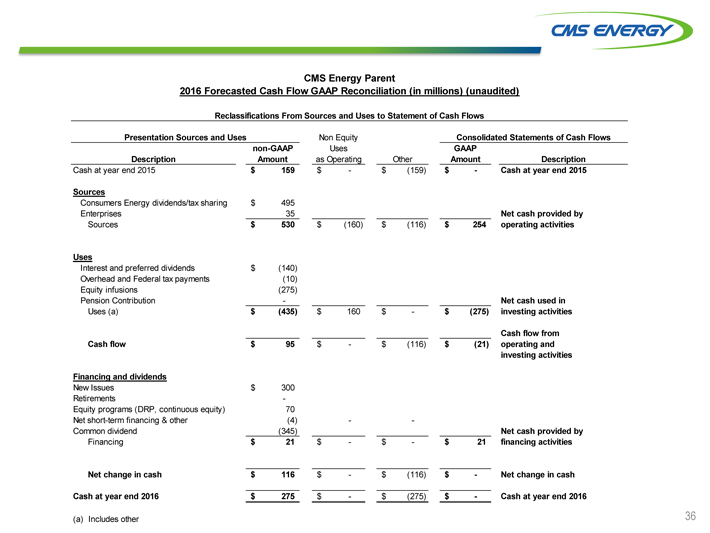
CMS Energy Parent
2016 Forecasted Cash Flow GAAP Reconciliation (in millions) (unaudited)
Reclassifications From Sources and Uses to Statement of Cash Flows
Presentation Sources and Uses Non Equity Consolidated Statements of Cash Flows
non-GAAP Uses GAAP
Description Amount as Operating Other Amount Description
Cash at year end 2015 $ 159 $—$ (159) $—Cash at year end 2015
Sources
Consumers Energy dividends/tax sharing $ 495
Enterprises 35 Net cash provided by
Sources $ 530 $ (160) $ (116) $ 254 operating activities
Uses
Interest and preferred dividends $ (140)
Overhead and Federal tax payments (10)
Equity infusions (275)
Pension Contribution — Net cash used in
Uses (a) $ (435) $ 160 $—$ (275) investing activities
Cash flow from
Cash flow $ 95 $—$ (116) $ (21) operating and
investing activities
Financing and dividends
New Issues $ 300
Retirements —
Equity programs (DRP, continuous equity) 70
Net short-term financing & other (4) ——
Common dividend (345) Net cash provided by
Financing $ 21 $—$—$ 21 financing activities
Net change in cash $ 116 $—$ (116) $—Net change in cash
Cash at year end 2016 $ 275 $—$ (275) $—Cash at year end 2016
(a) Includes other 36
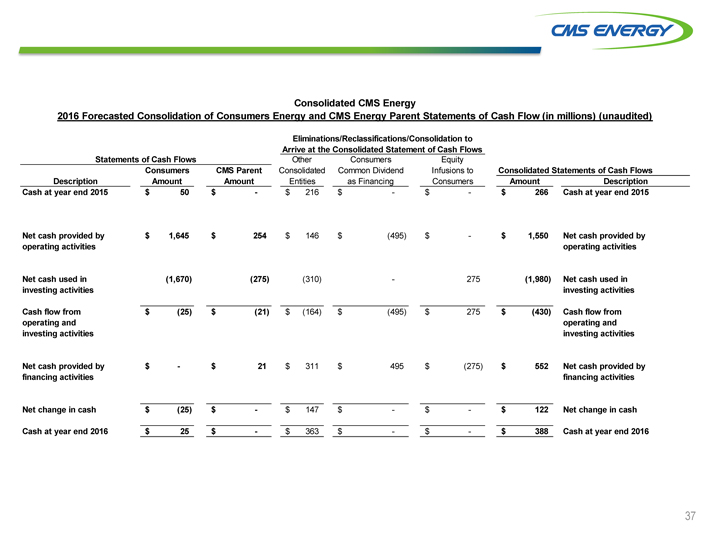
Consolidated CMS Energy
2016 Forecasted Consolidation of Consumers Energy and CMS Energy Parent Statements of Cash Flow (in millions) (unaudited)
Eliminations/Reclassifications/Consolidation to
Arrive at the Consolidated Statement of Cash Flows
Statements of Cash Flows Other Consumers Equity
Consumers CMS Parent Consolidated Common Dividend Infusions to Consolidated Statements of Cash Flows
Description Amount Amount Entities as Financing Consumers Amount Description
Cash at year end 2015 $ 50 $—$ 216 $—$—$ 266 Cash at year end 2015
Net cash provided by $ 1,645 $ 254 $ 146 $ (495) $—$ 1,550 Net cash provided by
operating activities operating activities
Net cash used in (1,670) (275) (310) — 275 (1,980) Net cash used in
investing activities investing activities
Cash flow from $ (25) $ (21) $ (164) $ (495) $ 275 $ (430) Cash flow from
operating and operating and
investing activities investing activities
Net cash provided by $—$ 21 $ 311 $ 495 $ (275) $ 552 Net cash provided by
financing activities financing activities
Net change in cash $ (25) $—$ 147 $—$—$ 122 Net change in cash
Cash at year end 2016 $ 25 $—$ 363 $—$—$ 388 Cash at year end 2016
37
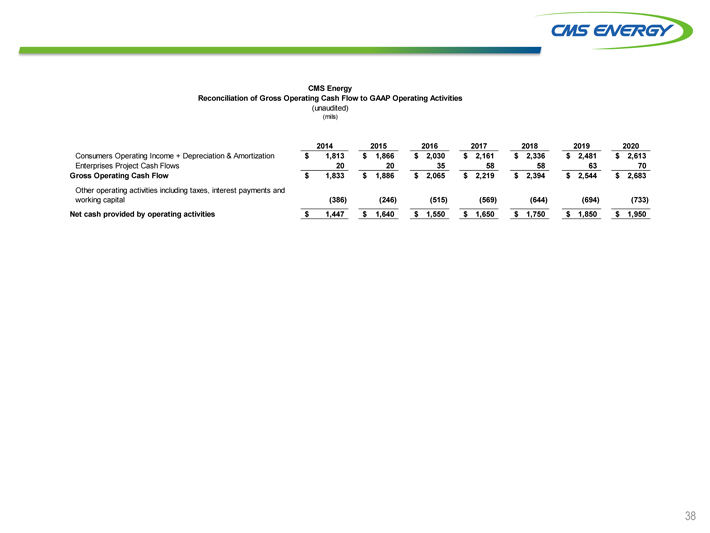
CMS Energy
Reconciliation of Gross Operating Cash Flow to GAAP Operating Activities
(unaudited)
(mils)
2014 2015 2016 2017 2018 2019 2020
Consumers Operating Income + Depreciation & Amortization $ 1,813 $ 1,866 $ 2,030 $ 2,161 $ 2,336 $ 2,481 $ 2,613
Enterprises Project Cash Flows 20 20 35 58 58 63 70
Gross Operating Cash Flow $ 1,833 $ 1,886 $ 2,065 $ 2,219 $ 2,394 $ 2,544 $ 2,683
Other operating activities including taxes, interest payments and
working capital (386) (246) (515) (569) (644) (694) (733)
Net cash provided by operating activities $ 1,447 $ 1,640 $ 1,550 $ 1,650 $ 1,750 $ 1,850 $ 1,950
38
Serious News for Serious Traders! Try StreetInsider.com Premium Free!
You May Also Be Interested In
- CMS Energy (CMS) PT Raised to $66 at KeyBanc
- CMS Energy (CMS) PT Raised to $57 at Morgan Stanley
- Crypto Hub Announces Partnership with Areon Network, Becoming the First Official Areon Launchpad
Create E-mail Alert Related Categories
SEC FilingsSign up for StreetInsider Free!
Receive full access to all new and archived articles, unlimited portfolio tracking, e-mail alerts, custom newswires and RSS feeds - and more!
