Form 8-K CLOUD PEAK ENERGY INC. For: Aug 01
UNITED STATES
SECURITIES AND EXCHANGE COMMISSION
Washington, D.C. 20549
FORM 8-K
CURRENT REPORT
Pursuant to Section 13 or 15(d) of the Securities Exchange Act of 1934
Date of Report (Date of earliest event reported): August 1, 2016
Cloud Peak Energy Inc.
(Exact name of registrant as specified in its charter)
|
Delaware |
|
001-34547 |
|
26-3088162 |
|
(State or other Jurisdiction of |
|
(Commission File Number) |
|
(IRS Employer Identification No.) |
|
505 S. Gillette Ave., Gillette, Wyoming |
|
82716 |
|
(Address of Principal Executive Offices) |
|
(Zip Code) |
Registrant’s telephone number, including area code: (307) 687-6000
Not Applicable
(Former name or former address if changed since last report.)
Check the appropriate box below if the Form 8-K filing is intended to simultaneously satisfy the filing obligation of the registrant under any of the following provisions:
o Written communications pursuant to Rule 425 under the Securities Act (17 CFR 230.425)
o Soliciting material pursuant to Rule 14a-12 under the Exchange Act (17 CFR 240.14a-12)
o Pre-commencement communications pursuant to Rule 14d-2(b) under the Exchange Act (17 CFR 240.14d-2(b))
o Pre-commencement communications pursuant to Rule 13e-4(c) under the Exchange Act (17 CFR 240.13e-4(c))
Item 7.01 Regulation FD Disclosure.
On August 1, 2016, Cloud Peak Energy Inc. posted investor slides dated August 2016 on the Investor Relations section of www.cloudpeakenergy.com. These slides are furnished as Exhibit 99.1 to this Form 8-K and incorporated herein by reference. The Cloud Peak Energy website is not intended to function as a hyperlink, and the information contained on such website is not a part of this Form 8-K.
Item 9.01 Financial Statements and Exhibits
(d) Exhibits. The following exhibit is being furnished herewith.
99.1 Furnished August 2016 Investor Slides
SIGNATURE
Pursuant to the requirements of the Securities Exchange Act of 1934, the registrant has duly caused this report to be signed on its behalf by the undersigned hereunto duly authorized.
|
|
CLOUD PEAK ENERGY INC. | |
|
|
| |
|
Date: August 1, 2016 |
By: |
/s/ Bryan J. Pechersky |
|
|
Name: |
Bryan J. Pechersky |
|
|
Title: |
Executive Vice President, General Counsel, |
|
|
|
and Corporate Secretary |
Exhibit 99.1
INVESTOR Presentation August 2016
Cautionary Note Regarding Forward-Looking Statements This presentation contains “forward-looking statements” within the meaning of the safe harbor provisions of Section 27A of the Securities Act of 1933 and Section 21E of the Securities Exchange Act of 1934. Forward-looking statements are not statements of historical facts, and often contain words such as “may,” “will,” “expect,” “believe,” “anticipate,” “plan,” “estimate,” “seek,” “could,” “should,” “intend,” “potential,” or words of similar meaning. Forward-looking statements are based on management’s current expectations, beliefs, assumptions and estimates regarding our company, industry, economic conditions, government regulations, energy policies and other factors. These statements are subject to significant risks, uncertainties and assumptions that are difficult to predict and could cause actual results to differ materially and adversely from those expressed or implied in the forward-looking statements. For a description of some of the risks and uncertainties that may adversely affect our future results, refer to the risk factors described from time to time in the reports and registration statements we file with the Securities and Exchange Commission, including those in Item 1A "Risk Factors" of our most recent Form 10-K and any updates thereto in our Forms 10-Q and Forms 8-K. There may be other risks and uncertainties that are not currently known to us or that we currently believe are not material. We make forward-looking statements based on currently available information, and we assume no obligation to, and expressly disclaim any obligation to, update or revise publicly any forward-looking statements made in our presentation, whether as a result of new information, future events or otherwise, except as required by law. Non-GAAP Financial Measures This presentation includes the non-GAAP financial measures of (1) Adjusted EBITDA (on a consolidated basis and for our reporting segments) and (2) Adjusted Earnings Per Share (“Adjusted EPS”). Adjusted EBITDA and Adjusted EPS are intended to provide additional information only and do not have any standard meaning prescribed by accounting principles generally accepted in the U.S. (“GAAP”). A quantitative reconciliation of historical net income (loss) to Adjusted EBITDA and EPS (as defined below) to Adjusted EPS is found in the tables accompanying this release. EBITDA represents net income (loss) before: (1) interest income (expense) net, (2) income tax provision, (3) depreciation and depletion, and (4) amortization. Adjusted EBITDA represents EBITDA as further adjusted for accretion, which represents non-cash increases in asset retirement obligation liabilities resulting from the passage of time, and specifically identified items that management believes do not directly reflect our core operations. For the periods presented herein, the specifically identified items are: (1) adjustments to exclude non-cash impairment charges and (2) adjustments for derivative financial instruments, excluding fair value mark-to-market gains or losses and including cash amounts received or paid. We enter into certain derivative financial instruments such as put options that require the payment of premiums at contract inception. The reduction in the premium value over time is reflected in the mark-to-market gains or losses. Our calculation of Adjusted EBITDA does not include premiums paid for derivative financial instruments; either at contract inception, as these payments pertain to future settlement periods, or in the period of contract settlement, as the payment occurred in a preceding period. Because of the inherent uncertainty related to the items identified above, management does not believe it is able to provide a meaningful forecast of the comparable GAAP measures or reconciliation to any forecasted GAAP measure without reasonable efforts. Adjusted EPS represents diluted earnings (loss) per common share (“EPS”) adjusted to exclude the estimated per share impact of the same specifically identified non-core items used to calculate Adjusted EBITDA as described above. All items are adjusted at the statutory tax rate of approximately 37 percent and exclude the impact of any valuation allowance. Adjusted EBITDA is an additional tool intended to assist our management in comparing our performance on a consistent basis for purposes of business decision making by removing the impact of certain items that management believes do not directly reflect our core operations. Adjusted EBITDA is a metric intended to assist management in evaluating operating performance, comparing performance across periods, planning and forecasting future business operations and helping determine levels of operating and capital investments. Period-to-period comparisons of Adjusted EBITDA are intended to help our management identify and assess additional trends potentially impacting our company that may not be shown solely by period-to-period comparisons of net income (loss). Consolidated Adjusted EBITDA is also used as part of our incentive compensation program for our executive officers and others. We believe Adjusted EBITDA and Adjusted EPS are also useful to investors, analysts and other external users of our consolidated financial statements in evaluating our operating performance from period to period and comparing our performance to similar operating results of other relevant companies. Adjusted EBITDA allows investors to measure a company’s operating performance without regard to items such as interest expense, taxes, depreciation and depletion, amortization and accretion and other specifically identified items that are not considered to directly reflect our core operations. Similarly, we believe our use of Adjusted EPS provides an appropriate measure to use in assessing our performance across periods given that this measure provides an adjustment for certain specifically identified significant items that are not considered to directly reflect our core operations, the magnitude of which may vary significantly from period to period and, thereby, have a disproportionate effect on the earnings per share reported for a given period. Our management recognizes that using Adjusted EBITDA and Adjusted EPS as performance measures has inherent limitations as compared to net income (loss), EPS, or other GAAP financial measures, as these non-GAAP measures exclude certain items, including items that are recurring in nature, which may be meaningful to investors. As a result of the exclusions, Adjusted EBITDA and Adjusted EPS should not be considered in isolation and do not purport to be alternatives to net income (loss), EPS or other GAAP financial measures as a measure of our operating performance. Because not all companies use identical calculations, our presentations of Adjusted EBITDA and Adjusted EPS may not be comparable to other similarly titled measures of other companies. Moreover, our presentation of Adjusted EBITDA is different than EBITDA as defined in our debt financing agreements. 2
Cloud Peak Energy Profile 3
One of the largest U.S. coal producers 2015 coal shipments from our three mines of 75.1 million tons 2015 proven & probable reserves of 1.1 billion tons Only pure-play PRB coal company Extensive NPRB projects and options for long-term growth opportunities Employs approximately 1,400 people Company and Financial Overview NYSE: CLD (7/25/16) $2.51 Market Capitalization (7/25/16) $153.9 million Total Available Liquidity (6/30/16) $523.0 million 2015 Revenue $1.1 billion Senior Debt (B+/Caa1) (6/30/16) $500 million 4

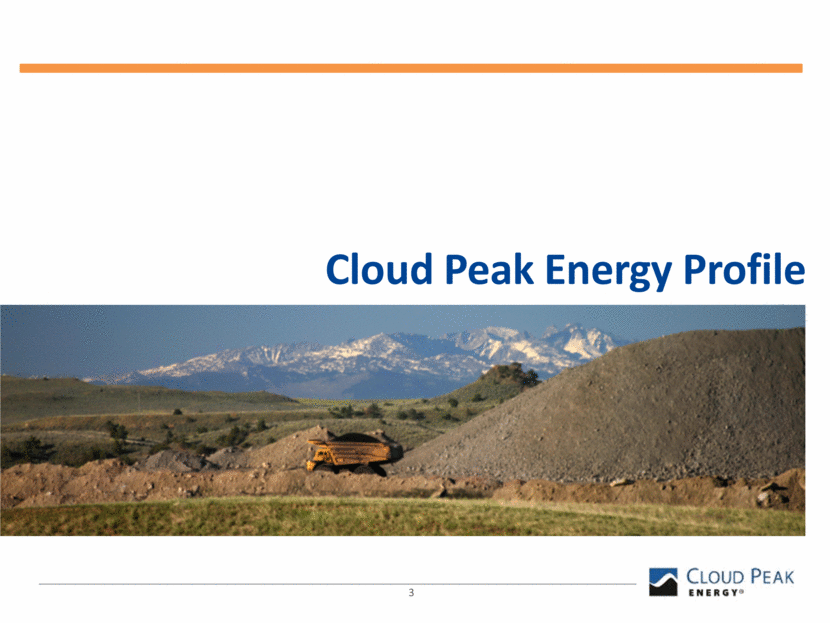
Low-Risk Surface Operations One of the best safety records in the industry Proportionately low, long-term operational liabilities Surface mining reduces liabilities and allows for high-quality reclamation Strong environmental compliance programs and ISO-14001 certified Highly productive, non-unionized workforce at all of our mines 5
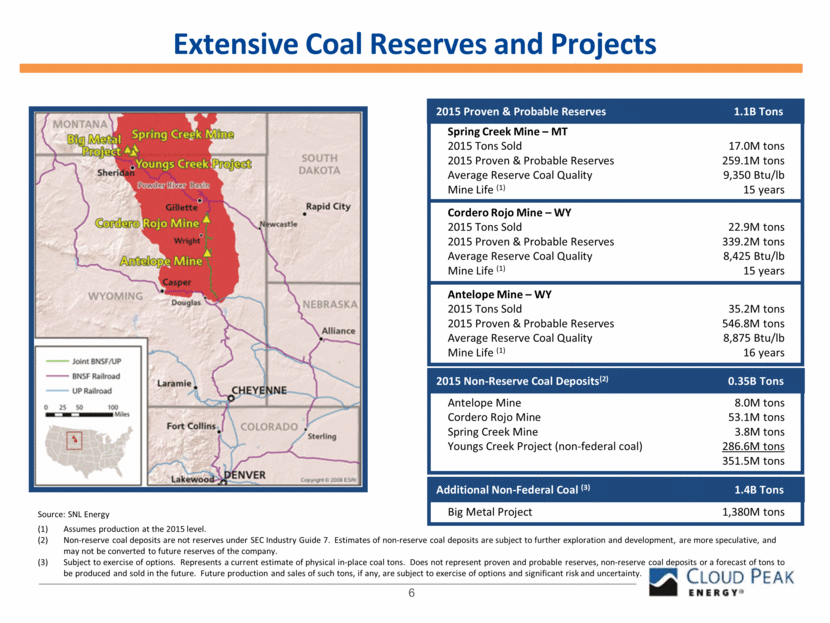
Extensive Coal Reserves and Projects Spring Creek Mine – MT 2015 Tons Sold 17.0M tons 2015 Proven & Probable Reserves 259.1M tons Average Reserve Coal Quality 9,350 Btu/lb Mine Life (1) 15 years Cordero Rojo Mine – WY 2015 Tons Sold 22.9M tons 2015 Proven & Probable Reserves 339.2M tons Average Reserve Coal Quality 8,425 Btu/lb Mine Life (1) 15 years Antelope Mine – WY 2015 Tons Sold 35.2M tons 2015 Proven & Probable Reserves 546.8M tons Average Reserve Coal Quality 8,875 Btu/lb Mine Life (1) 16 years Antelope Mine 8.0M tons Cordero Rojo Mine 53.1M tons Spring Creek Mine 3.8M tons Youngs Creek Project (non-federal coal) 286.6M tons 351.5M tons 2015 Non-Reserve Coal Deposits(2) 0.35B Tons Big Metal Project 1,380M tons Additional Non-Federal Coal (3) 1.4B Tons 2015 Proven & Probable Reserves 1.1B Tons Source: SNL Energy Assumes production at the 2015 level. Non-reserve coal deposits are not reserves under SEC Industry Guide 7. Estimates of non-reserve coal deposits are subject to further exploration and development, are more speculative, and may not be converted to future reserves of the company. (3) Subject to exercise of options. Represents a current estimate of physical in-place coal tons. Does not represent proven and probable reserves, non-reserve coal deposits or a forecast of tons to be produced and sold in the future. Future production and sales of such tons, if any, are subject to exercise of options and significant risk and uncertainty. 6
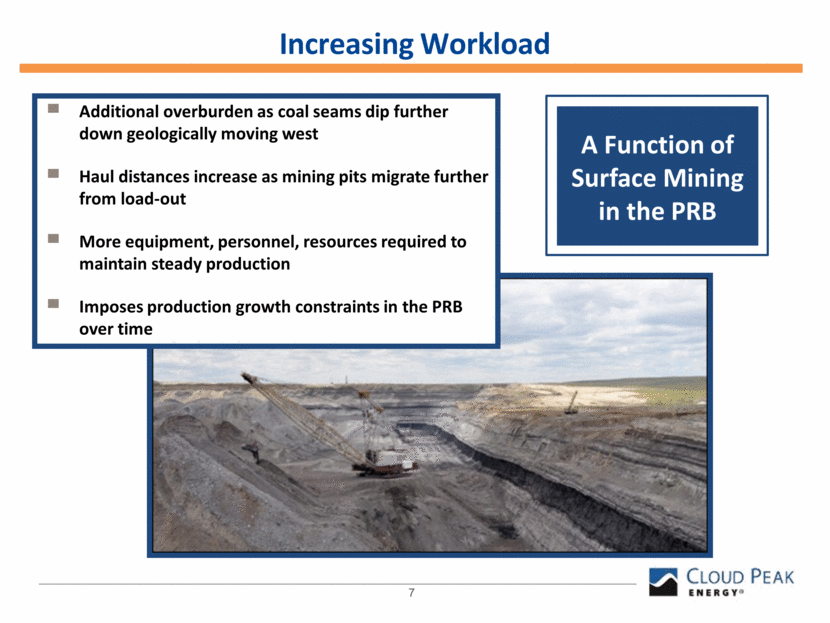
Increasing Workload A Function of Surface Mining in the PRB 7 Additional overburden as coal seams dip further down geologically moving west Haul distances increase as mining pits migrate further from load-out More equipment, personnel, resources required to maintain steady production Imposes production growth constraints in the PRB over time
Safety 8

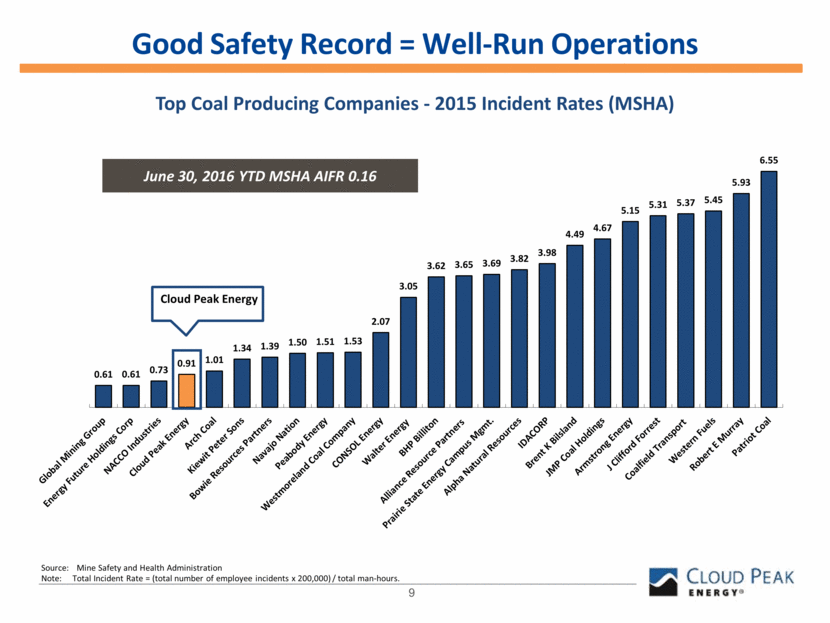
Good Safety Record = Well-Run Operations Source: Mine Safety and Health Administration Note: Total Incident Rate = (total number of employee incidents x 200,000) / total man-hours. 9 Top Coal Producing Companies - 2015 Incident Rates (MSHA) June 30, 2016 YTD MSHA AIFR 0.16 0.61 0.61 0.73 0.91 1.01 1.34 1.39 1.50 1.51 1.53 2.07 3.05 3.62 3.65 3.69 3.82 3.98 4.49 4.67 5.15 5.31 5.37 5.45 5.93 6.55 Cloud Peak Energy
Finance, Market Conditions, and Regulations 10
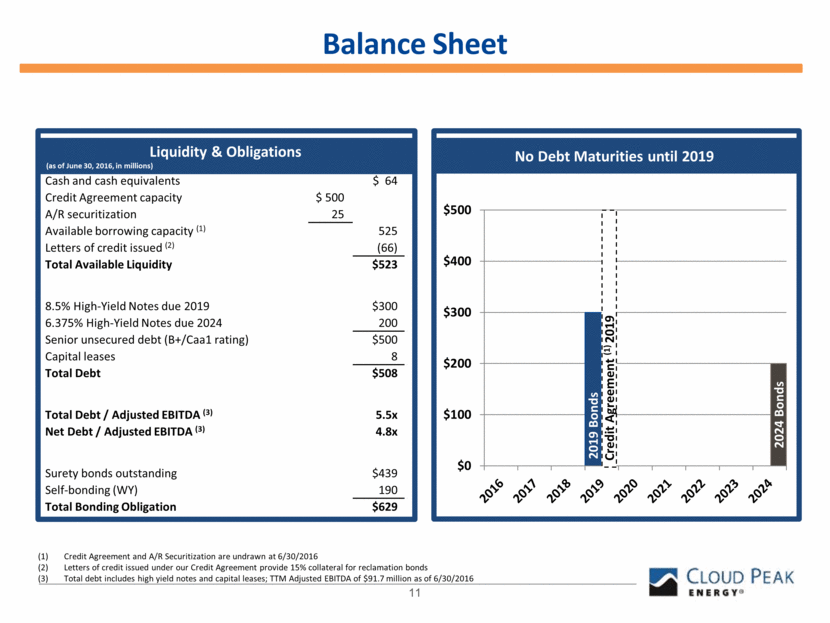
Balance Sheet Cash and cash equivalents $ 64 Credit Agreement capacity $ 500 A/R securitization 25 Available borrowing capacity (1) 525 Letters of credit issued (2) (66) Total Available Liquidity $523 8.5% High-Yield Notes due 2019 $300 6.375% High-Yield Notes due 2024 200 Senior unsecured debt (B+/Caa1 rating) $500 Capital leases 8 Total Debt $508 Total Debt / Adjusted EBITDA (3) 5.5x Net Debt / Adjusted EBITDA (3) 4.8x Surety bonds outstanding $439 Self-bonding (WY) 190 Total Bonding Obligation $629 Liquidity & Obligations (as of June 30, 2016, in millions) No Debt Maturities until 2019 11 Credit Agreement and A/R Securitization are undrawn at 6/30/2016 Letters of credit issued under our Credit Agreement provide 15% collateral for reclamation bonds Total debt includes high yield notes and capital leases; TTM Adjusted EBITDA of $91.7 million as of 6/30/2016 2019 Bonds 2024 Bonds $0 $100 $200 $300 $400 $500 Credit Agreement (1) 2019
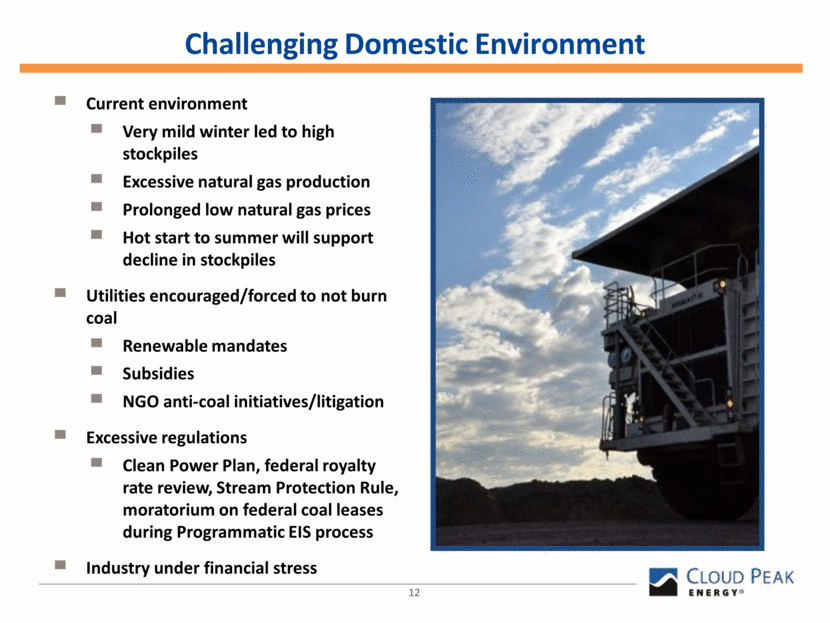
Challenging Domestic Environment Current environment Very mild winter led to high stockpiles Excessive natural gas production Prolonged low natural gas prices Hot start to summer will support decline in stockpiles Utilities encouraged/forced to not burn coal Renewable mandates Subsidies NGO anti-coal initiatives/litigation Excessive regulations Clean Power Plan, federal royalty rate review, Stream Protection Rule, moratorium on federal coal leases during Programmatic EIS process Industry under financial stress 12
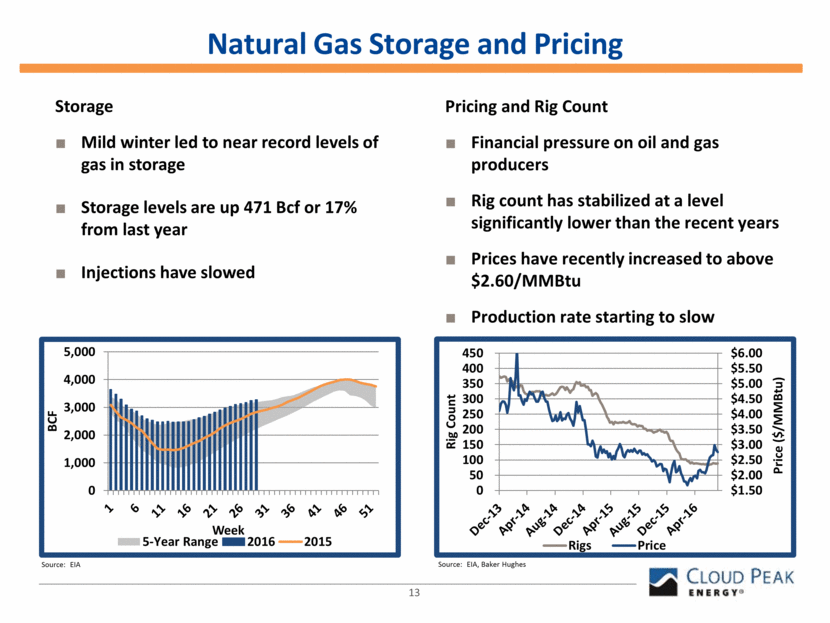
Natural Gas Storage and Pricing Storage Mild winter led to near record levels of gas in storage Storage levels are up 471 Bcf or 17% from last year Injections have slowed Pricing and Rig Count Financial pressure on oil and gas producers Rig count has stabilized at a level significantly lower than the recent years Prices have recently increased to above $2.60/MMBtu Production rate starting to slow 13 Source: EIA Source: EIA, Baker Hughes $1.50 $2.00 $2.50 $3.00 $3.50 $4.00 $4.50 $5.00 $5.50 $6.00 0 50 100 150 200 250 300 350 400 450 Price ($/MMBtu) Rig Count Rigs Price 0 1,000 2,000 3,000 4,000 5,000 BCF Week 5-Year Range 2016 2015
Federal Regulatory Pressures CPP – Clean Power Plan SCOTUS “stayed” CPP on February 9, 2016 pending resolution of legal challenges Final rule grants a two-year extension from proposed regulations but targets coal generation reduction Electric grid reliability remains a concern, although the EPA added a “reliability safety-valve” that eases compliance with the restrictions in the event they threaten utilities’ ability to maintain reliability MATS – Mercury and Air Toxics Commenced April 2015, remanded to lower court by the Supreme Court Many utilities are staying with original plans and are not adjusting to the Supreme Court decision EPA published its cost consideration finding in April 2016 Stream Protection Rule Proposed regulations would increase cost to mine coal for the PRB Could significantly curtail certain types of underground mining Public comment period closed – rule expected to be issued in third quarter of 2016 Waters of the United States Rule EPA/Corps Rule stayed by Sixth Circuit Court of Appeals in October 2015 pending merits review by court Rule would expand scope of activities that require Clean Water Act permits, including mine expansions DOI Moratorium of New Federal Coal Leases DOI will undertake Programmatic Environmental Impact Study to evaluate potential revisions DOI looks to review royalty rate, fair market value, leasing process Public comment period for scoping process concluded in third quarter of 2016. Self-Bonding Office of Surface Mining is considering NGO petition asking for revisions to state level programs Public comment period closed in late July 2016. Timing unknown for ruling. Federal and Indian Coal Valuation Reform Rule Final rule issued July 1, 2016 Significantly changes the manner in which non-arm’s length sales of federal coal are valued for royalty purposes Mandates a net-back calculation from the first third-party sale and introduces a default rule that will require substantial judgment 14

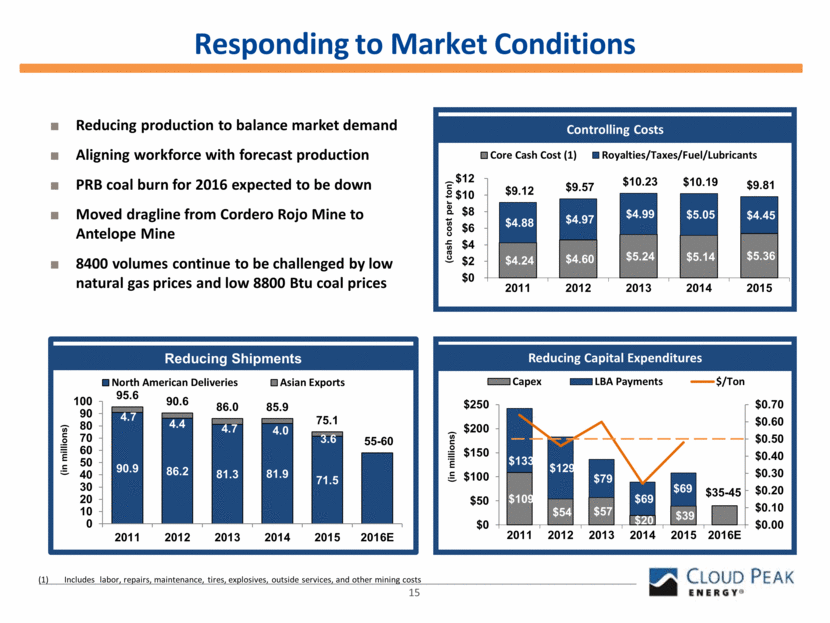
15 Responding to Market Conditions Reducing production to balance market demand Aligning workforce with forecast production PRB coal burn for 2016 expected to be down Moved dragline from Cordero Rojo Mine to Antelope Mine 8400 volumes continue to be challenged by low natural gas prices and low 8800 Btu coal prices Controlling Costs Reducing Capital Expenditures (1) Includes labor, repairs, maintenance, tires, explosives, outside services, and other mining costs $4.24 $4.60 $5.24 $5.14 $5.36 $4.88 $4.97 $4.99 $5.05 $4.45 $9.12 $9.57 $10.23 $10.19 $9.81 $0 $2 $4 $6 $8 $10 $12 2011 2012 2013 2014 2015 (cash cost per ton) Core Cash Cost (1) Royalties/Taxes/Fuel/Lubricants 90.9 86.2 81.3 81.9 71.5 4.7 4.4 4.7 4.0 3.6 95.6 90.6 86.0 85.9 75.1 55 - 60 0 10 20 30 40 50 60 70 80 90 100 2011 2012 2013 2014 2015 2016E (in millions) North American Deliveries Asian Exports Reducing Shipments $109 $54 $57 $20 $39 $35 - 45 $133 $129 $79 $69 $69 $0.00 $0.10 $0.20 $0.30 $0.40 $0.50 $0.60 $0.70 $0 $50 $100 $150 $200 $250 2011 2012 2013 2014 2015 2016E (in millions) Capex LBA Payments $/Ton
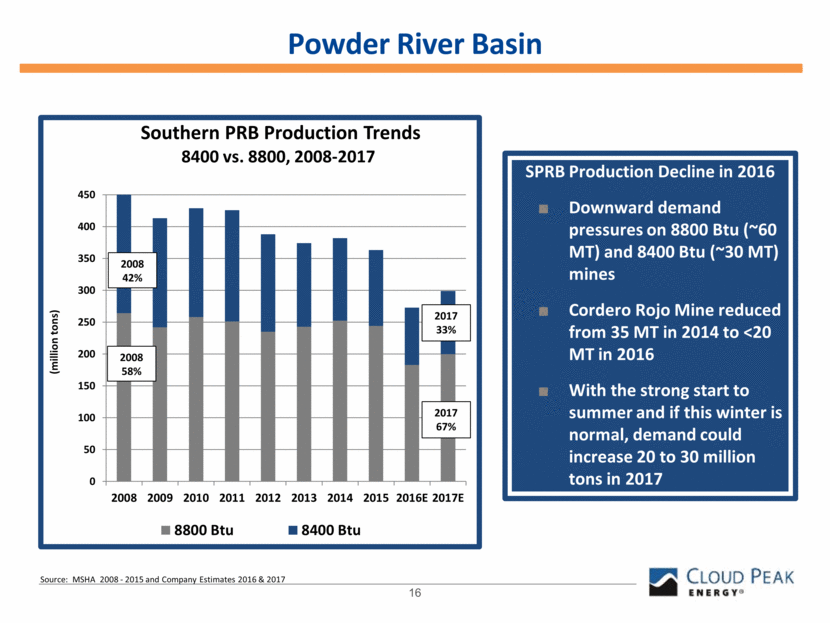
16 Powder River Basin SPRB Production Decline in 2016 Downward demand pressures on 8800 Btu (~60 MT) and 8400 Btu (~30 MT) mines Cordero Rojo Mine reduced from 35 MT in 2014 to <20 MT in 2016 With the strong start to summer and if this winter is normal, demand could increase 20 to 30 million tons in 2017 2008 42% 2008 58% 2017 33% 2017 67% Source: MSHA 2008 - 2015 and Company Estimates 2016 & 2017 0 50 100 150 200 250 300 350 400 450 2008 2009 2010 2011 2012 2013 2014 2015 2016E 2017E (million tons) Southern PRB Production Trends 8400 vs. 8800, 2008 - 2017 8800 Btu 8400 Btu
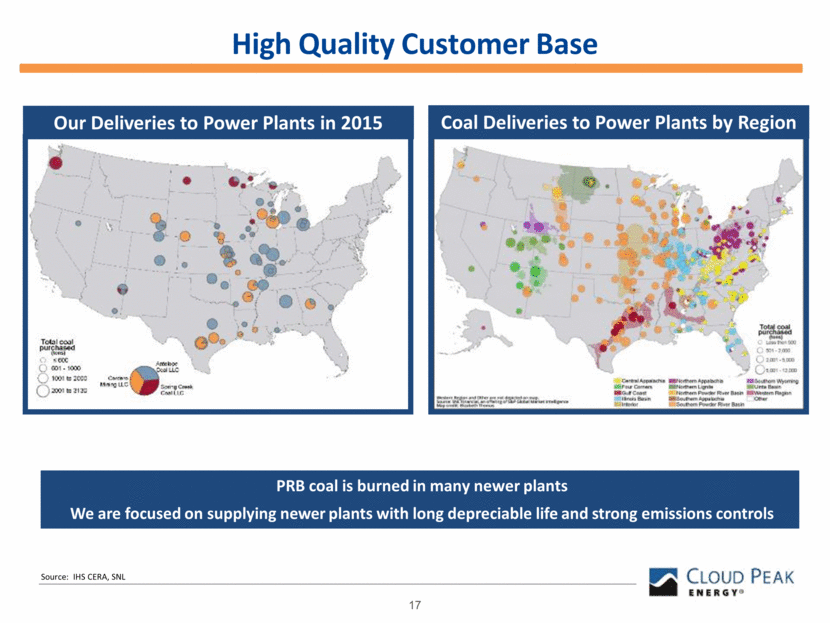
High Quality Customer Base Our Deliveries to Power Plants in 2015 Coal Deliveries to Power Plants by Region Source: IHS CERA, SNL 17 PRB coal is burned in many newer plants We are focused on supplying newer plants with long depreciable life and strong emissions controls
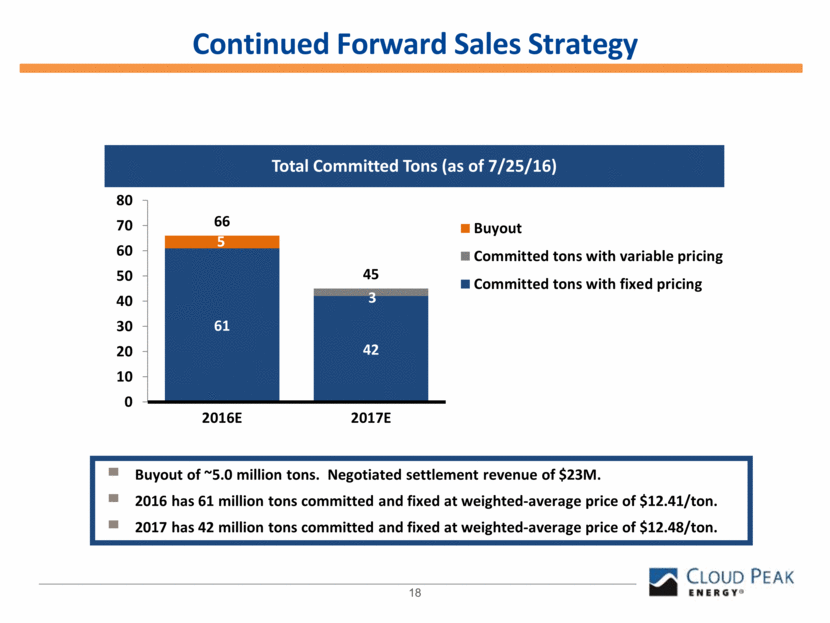
18 Continued Forward Sales Strategy Buyout of ~5.0 million tons. Negotiated settlement revenue of $23M. 2016 has 61 million tons committed and fixed at weighted-average price of $12.41/ton. 2017 has 42 million tons committed and fixed at weighted-average price of $12.48/ton. 61 42 3 5 66 45 0 10 20 30 40 50 60 70 80 2016E 2017E Buyout Committed tons with variable pricing Committed tons with fixed pricing Total Committed Tons (as of 7/25/16)
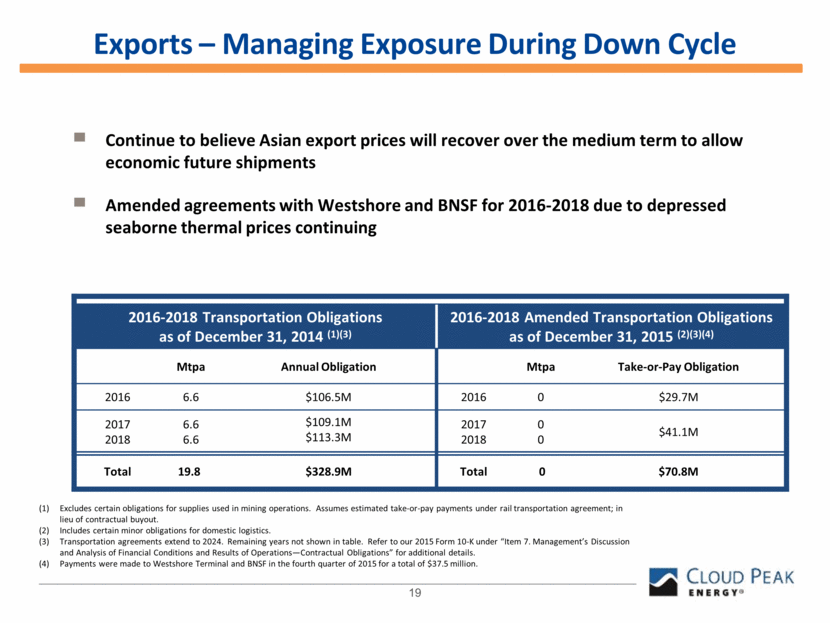
19 Exports – Managing Exposure During Down Cycle Continue to believe Asian export prices will recover over the medium term to allow economic future shipments Amended agreements with Westshore and BNSF for 2016-2018 due to depressed seaborne thermal prices continuing 2016-2018 Transportation Obligations as of December 31, 2014 (1)(3) 2016-2018 Amended Transportation Obligations as of December 31, 2015 (2)(3)(4) Mtpa Annual Obligation Mtpa Take-or-Pay Obligation 2016 6.6 $106.5M 2016 0 $29.7M 2017 2018 6.6 6.6 $109.1M $113.3M 2017 2018 0 0 $41.1M Total 19.8 $328.9M Total 0 $70.8M Excludes certain obligations for supplies used in mining operations. Assumes estimated take-or-pay payments under rail transportation agreement; in lieu of contractual buyout. Includes certain minor obligations for domestic logistics. Transportation agreements extend to 2024. Remaining years not shown in table. Refer to our 2015 Form 10-K under “Item 7. Management’s Discussion and Analysis of Financial Conditions and Results of Operations—Contractual Obligations” for additional details. Payments were made to Westshore Terminal and BNSF in the fourth quarter of 2015 for a total of $37.5 million.
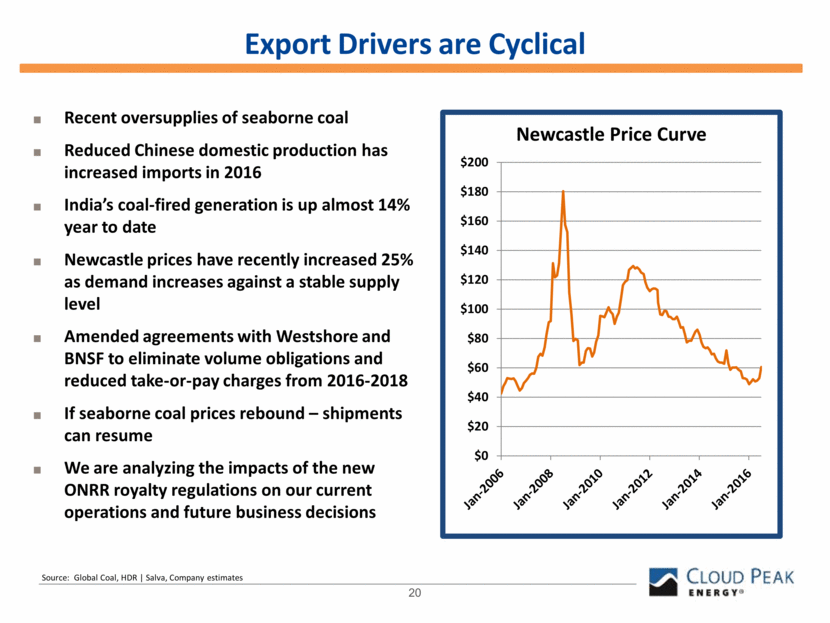
20 Recent oversupplies of seaborne coal Reduced Chinese domestic production has increased imports in 2016 India’s coal-fired generation is up almost 14% year to date Newcastle prices have recently increased 25% as demand increases against a stable supply level Amended agreements with Westshore and BNSF to eliminate volume obligations and reduced take-or-pay charges from 2016-2018 If seaborne coal prices rebound – shipments can resume We are analyzing the impacts of the new ONRR royalty regulations on our current operations and future business decisions Source: Global Coal, HDR Salva, Company estimates Export Drivers are Cyclical $0 $20 $40 $60 $80 $100 $120 $140 $160 $180 $200 Newcastle Price Curve
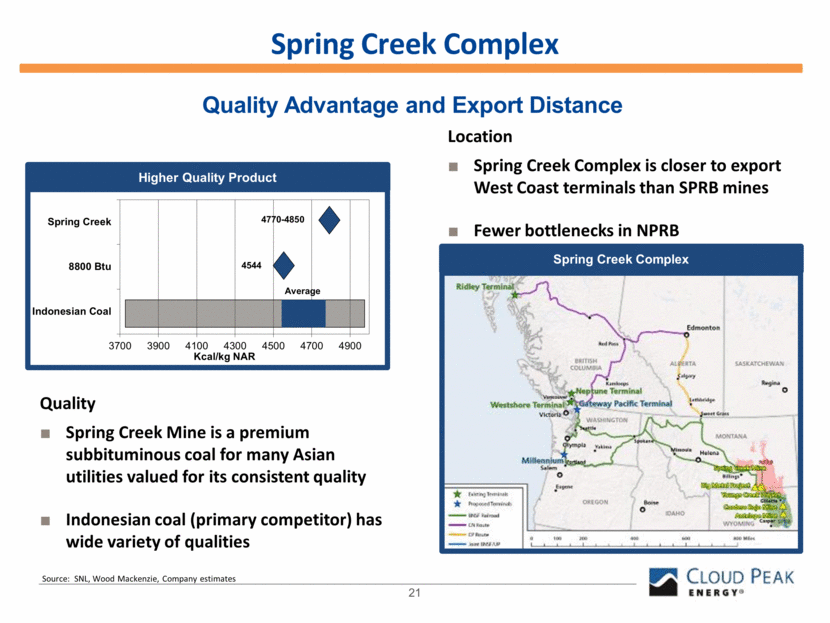
21 Spring Creek Complex Quality Advantage and Export Distance 4770-4850 4544 Average Source: SNL, Wood Mackenzie, Company estimates Higher Quality Product Location Spring Creek Complex is closer to export West Coast terminals than SPRB mines Fewer bottlenecks in NPRB Quality Spring Creek Mine is a premium subbituminous coal for many Asian utilities valued for its consistent quality Indonesian coal (primary competitor) has wide variety of qualities Spring Creek Complex 3700 3900 4100 4300 4500 4700 4900 Indonesian Coal 8800 Btu Spring Creek Kcal/kg NAR
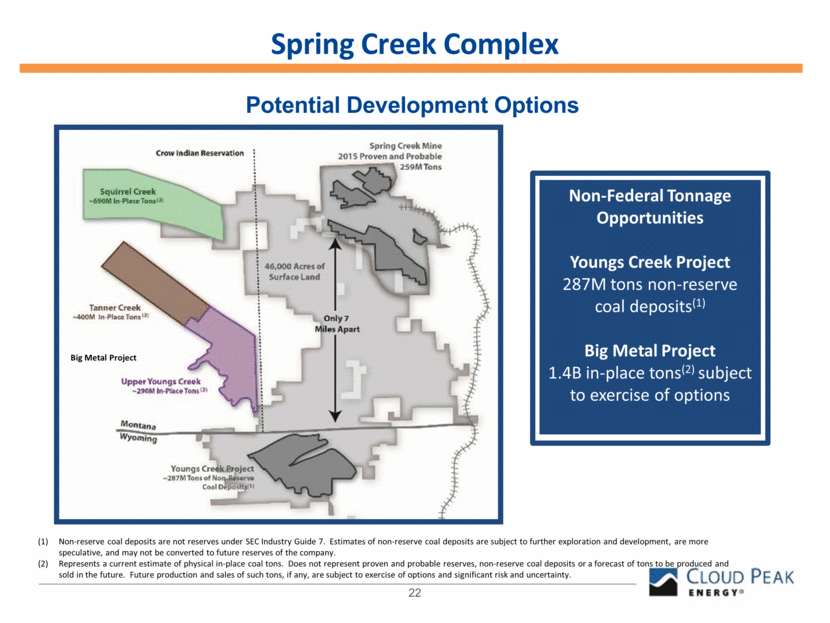
22 Spring Creek Complex Potential Development Options (1) Non-reserve coal deposits are not reserves under SEC Industry Guide 7. Estimates of non-reserve coal deposits are subject to further exploration and development, are more speculative, and may not be converted to future reserves of the company. (2) Represents a current estimate of physical in-place coal tons. Does not represent proven and probable reserves, non-reserve coal deposits or a forecast of tons to be produced and sold in the future. Future production and sales of such tons, if any, are subject to exercise of options and significant risk and uncertainty. Non-Federal Tonnage Opportunities Youngs Creek Project 287M tons non-reserve coal deposits(1) Big Metal Project 1.4B in-place tons(2) subject to exercise of options Big Metal Project
23 Key Projects – Non-Federal Coal Youngs Creek Project 287 million tons of non-reserve coal deposits at December 31, 2015(1) Contracted royalty payments of 8% vs. 12.5% federal rate 38,800 owned acres of surface land connecting Youngs Creek, Spring Creek, and Big Metal deposits Big Metal Project Exploration agreement and options to lease up to 1.4 billion tons(2) of in-place coal on the Crow Indian Reservation. BIA issued approval of agreements in June 2013 Option period payments up to $10M over initial 5 year period – $8.3M already paid Sliding scale royalty rate to the Crow of 7.5% - 15% vs. 12.5% federal rate (1) Non-reserve coal deposits are not reserves under SEC Industry Guide 7. Estimates of non-reserve coal deposits are subject to further exploration and development, are more speculative, and may not be converted to future reserves of the company. (2) Represents a current estimate of physical in-place coal tons. Does not represent proven and probable reserves, non-reserve coal deposits or a forecast of tons to be produced and sold in the future. Future production and sales of such tons, if any, are subject to exercise of options and significant risk and uncertainty.
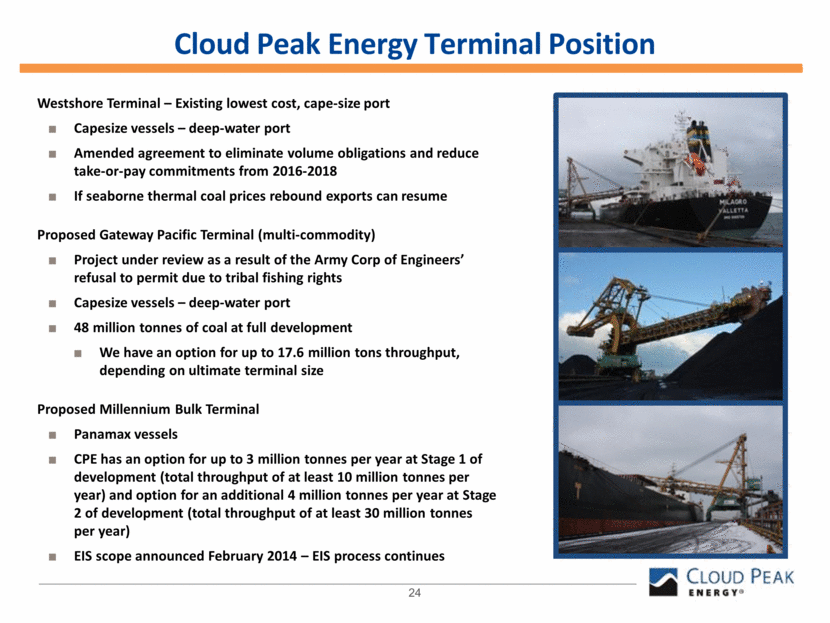
24 Cloud Peak Energy Terminal Position Westshore Terminal – Existing lowest cost, cape-size port Capesize vessels – deep-water port Amended agreement to eliminate volume obligations and reduce take-or-pay commitments from 2016-2018 If seaborne thermal coal prices rebound exports can resume Proposed Gateway Pacific Terminal (multi-commodity) Project under review as a result of the Army Corp of Engineers’ refusal to permit due to tribal fishing rights Capesize vessels – deep-water port 48 million tonnes of coal at full development We have an option for up to 17.6 million tons throughput, depending on ultimate terminal size Proposed Millennium Bulk Terminal Panamax vessels CPE has an option for up to 3 million tonnes per year at Stage 1 of development (total throughput of at least 10 million tonnes per year) and option for an additional 4 million tonnes per year at Stage 2 of development (total throughput of at least 30 million tonnes per year) EIS scope announced February 2014 – EIS process continues
Corporate Outlook 25
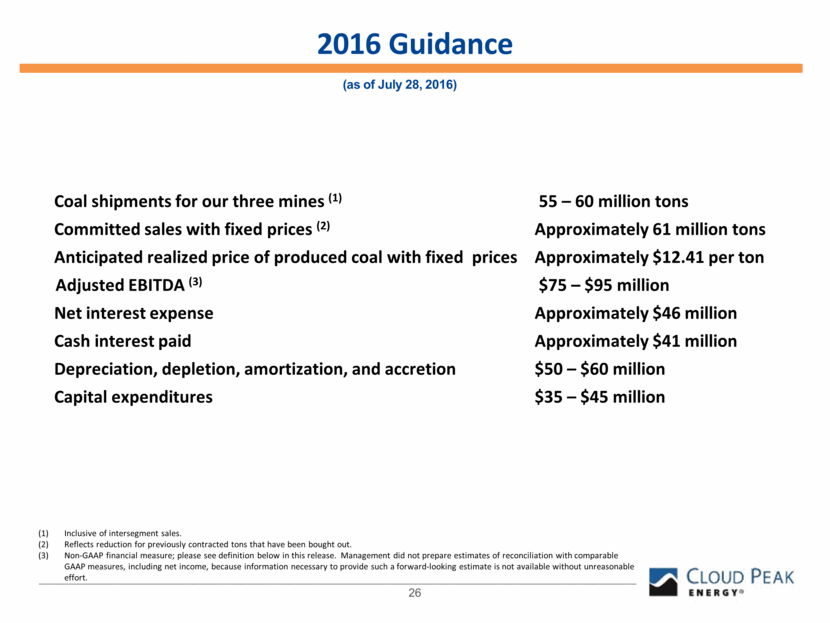
26 2016 Guidance (as of July 28, 2016) Coal shipments for our three mines (1) 55 – 60 million tons Committed sales with fixed prices (2) Approximately 61 million tons Anticipated realized price of produced coal with fixed prices Approximately $12.41 per ton Adjusted EBITDA (3) $75 – $95 million Net interest expense Approximately $46 million Cash interest paid Approximately $41 million Depreciation, depletion, amortization, and accretion $50 – $60 million Capital expenditures $35 – $45 million Inclusive of intersegment sales. Reflects reduction for previously contracted tons that have been bought out. Non-GAAP financial measure; please see definition below in this release. Management did not prepare estimates of reconciliation with comparable GAAP measures, including net income, because information necessary to provide such a forward-looking estimate is not available without unreasonable effort.
Appendix 27
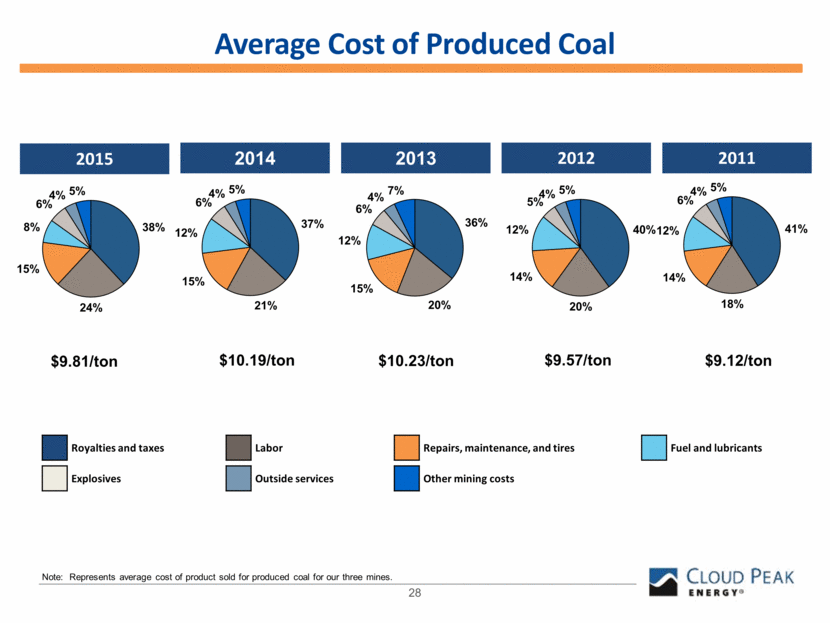
Note: Represents average cost of product sold for produced coal for our three mines. $10.23/ton $9.57/ton 2012 2013 2011 $9.12/ton 2014 $10.19/ton Royalties and taxes Labor Repairs, maintenance, and tires Fuel and lubricants Explosives Outside services Other mining costs 2015 $9.81/ton Average Cost of Produced Coal 28 36% 20% 15% 12% 6% 4% 7% 40% 20% 14% 12% 5% 4% 5% 41% 18% 14% 12% 6% 4% 5% 37% 21% 15% 12% 6% 4% 5% 38% 24% 15% 8% 6% 4% 5%
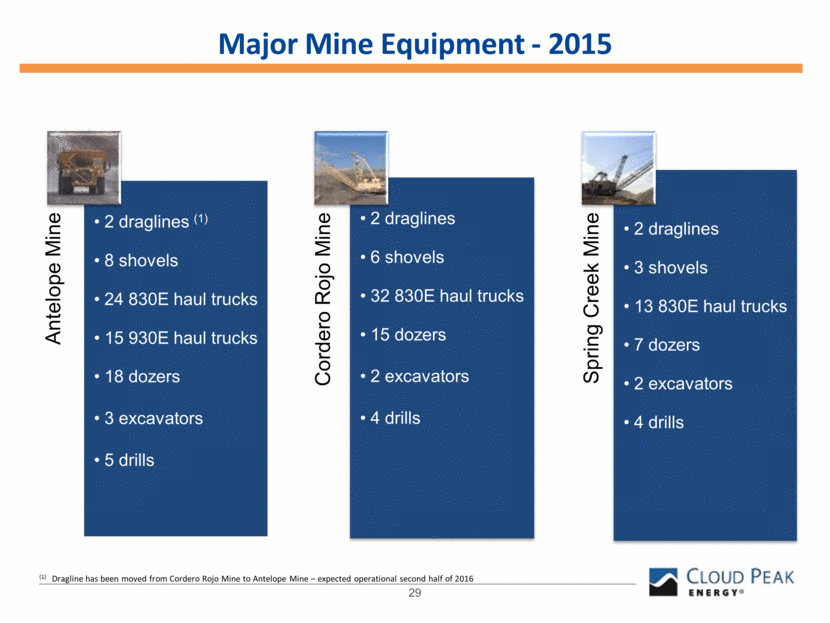
29 Major Mine Equipment - 2015 (1) Dragline has been moved from Cordero Rojo Mine to Antelope Mine – expected operational second half of 2016 Antelope Mine 2 draglines (1) 8 shovels 24 830E haul trucks 15 930E haul trucks 18 dozers 3 excavators 5 drills Cordero Rojo Mine 2 draglines 6 shovels 32 830E haul trucks 15 dozers 2 excavators 4 drills Spring Creek Mine 2 draglines 3 shovels 13 830E haul trucks 7 dozers 2 excavators 4 drills
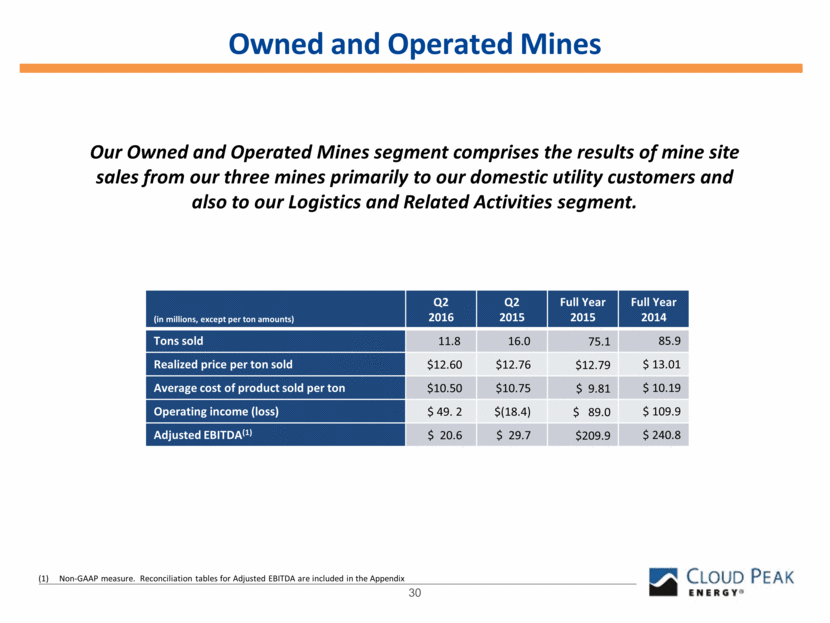
30 Owned and Operated Mines Our Owned and Operated Mines segment comprises the results of mine site sales from our three mines primarily to our domestic utility customers and also to our Logistics and Related Activities segment. (in millions, except per ton amounts) Q2 2016 Q2 2015 Full Year 2015 Full Year 2014 Tons sold 11.8 16.0 75.1 85.9 Realized price per ton sold $12.60 $12.76 $12.79 $ 13.01 Average cost of product sold per ton $10.50 $10.75 $ 9.81 $ 10.19 Operating income (loss) $ 49. 2 $(18.4) $ 89.0 $ 109.9 Adjusted EBITDA(1) $ 20.6 $ 29.7 $209.9 $ 240.8 (1) Non-GAAP measure. Reconciliation tables for Adjusted EBITDA are included in the Appendix
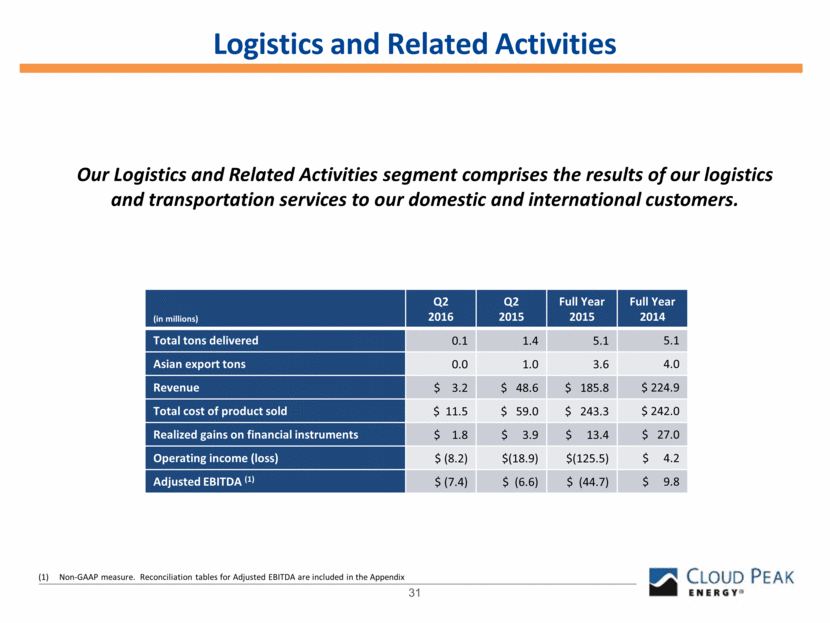
31 Logistics and Related Activities Our Logistics and Related Activities segment comprises the results of our logistics and transportation services to our domestic and international customers. (1) Non-GAAP measure. Reconciliation tables for Adjusted EBITDA are included in the Appendix (in millions) Q2 2016 Q2 2015 Full Year 2015 Full Year 2014 Total tons delivered 0.1 1.4 5.1 5.1 Asian export tons 0.0 1.0 3.6 4.0 Revenue $ 3.2 $ 48.6 $ 185.8 $ 224.9 Total cost of product sold $ 11.5 $ 59.0 $ 243.3 $ 242.0 Realized gains on financial instruments $ 1.8 $ 3.9 $ 13.4 $ 27.0 Operating income (loss) $ (8.2) $(18.9) $(125.5) $ 4.2 Adjusted EBITDA (1) $ (7.4) $ (6.6) $ (44.7) $ 9.8
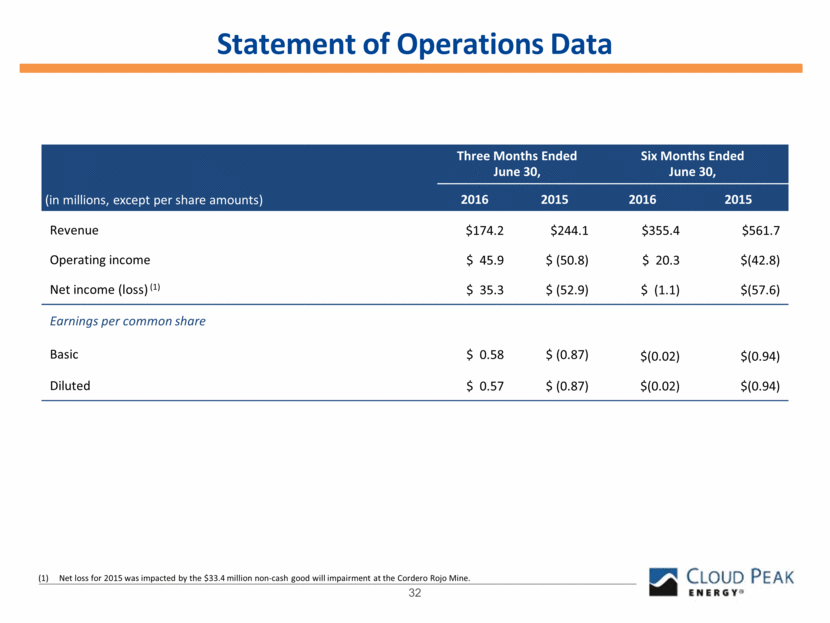
Three Months Ended June 30, Six Months Ended June 30, 2016 2015 2016 2015 Revenue $174.2 $244.1 $355.4 $561.7 Operating income $ 45.9 $ (50.8) $ 20.3 $(42.8) Net income (loss) (1) $ 35.3 $ (52.9) $ (1.1) $(57.6) Earnings per common share Basic $ 0.58 $ (0.87) $(0.02) $(0.94) Diluted $ 0.57 $ (0.87) $(0.02) $(0.94) Statement of Operations Data 32 (in millions, except per share amounts) (1) Net loss for 2015 was impacted by the $33.4 million non-cash good will impairment at the Cordero Rojo Mine.
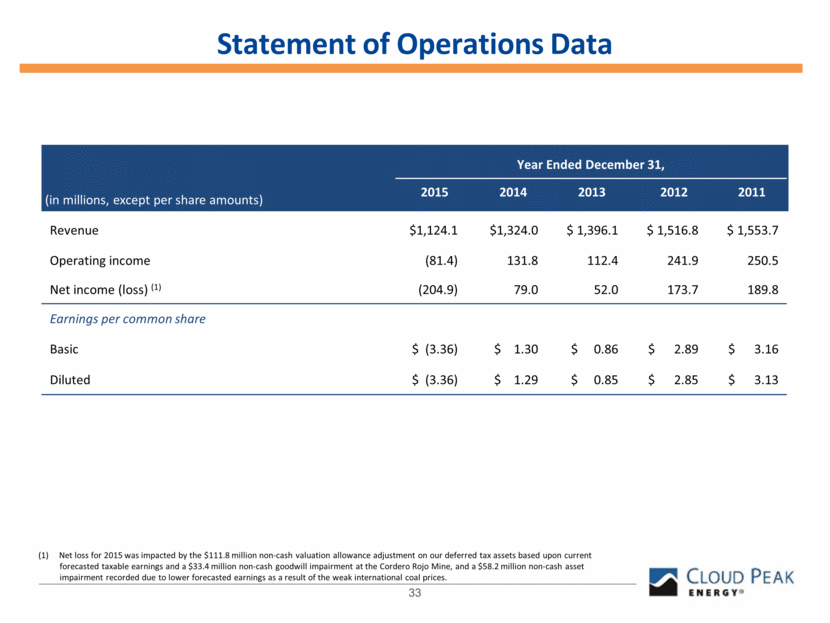
Revenue $1,124.1 $1,324.0 $ 1,396.1 $ 1,516.8 $ 1,553.7 Operating income (81.4) 131.8 112.4 241.9 250.5 Net income (loss) (1) (204.9) 79.0 52.0 173.7 189.8 Earnings per common share Basic $ (3.36) $ 1.30 $ 0.86 $ 2.89 $ 3.16 Diluted $ (3.36) $ 1.29 $ 0.85 $ 2.85 $ 3.13 Year Ended December 31, 2015 2014 2013 2012 2011 Statement of Operations Data 33 (in millions, except per share amounts) (1) Net loss for 2015 was impacted by the $111.8 million non-cash valuation allowance adjustment on our deferred tax assets based upon current forecasted taxable earnings and a $33.4 million non-cash goodwill impairment at the Cordero Rojo Mine, and a $58.2 million non-cash asset impairment recorded due to lower forecasted earnings as a result of the weak international coal prices.
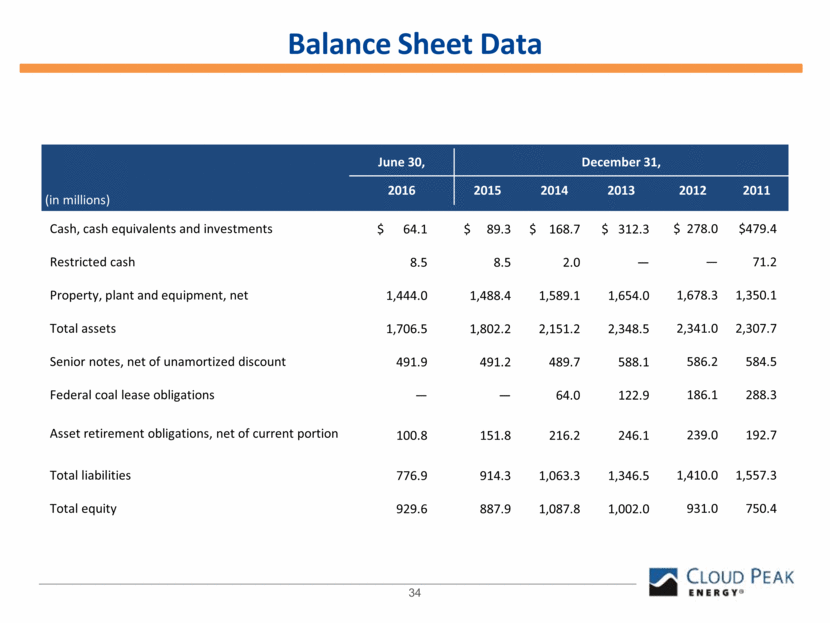
Cash, cash equivalents and investments $ 64.1 $ 89.3 $ 168.7 $ 312.3 $ 278.0 $479.4 Restricted cash 8.5 8.5 2.0 — — 71.2 Property, plant and equipment, net 1,444.0 1,488.4 1,589.1 1,654.0 1,678.3 1,350.1 Total assets 1,706.5 1,802.2 2,151.2 2,348.5 2,341.0 2,307.7 Senior notes, net of unamortized discount 491.9 491.2 489.7 588.1 586.2 584.5 Federal coal lease obligations — — 64.0 122.9 186.1 288.3 Asset retirement obligations, net of current portion 100.8 151.8 216.2 246.1 239.0 192.7 Total liabilities 776.9 914.3 1,063.3 1,346.5 1,410.0 1,557.3 Total equity 929.6 887.9 1,087.8 1,002.0 931.0 750.4 June 30, December 31, 2016 2015 2014 2013 2012 2011 Balance Sheet Data 34 (in millions)
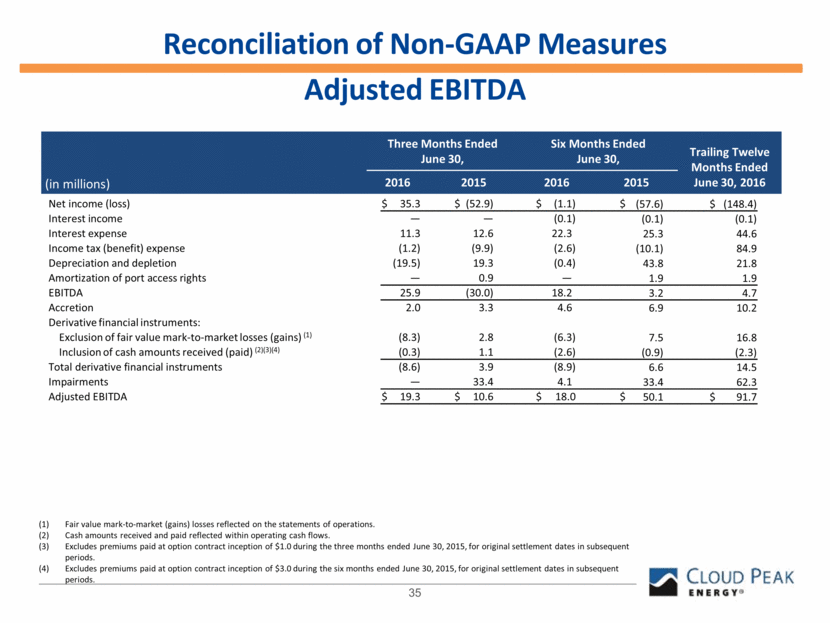
Three Months Ended June 30, Six Months Ended June 30, Trailing Twelve Months Ended June 30, 2016 2016 2015 2016 2015 Reconciliation of Non-GAAP Measures Adjusted EBITDA 35 Net income (loss) $ 35.3 $ (52.9) $ (1.1) $ (57.6) $ (148.4) Interest income — — (0.1) (0.1) (0.1) Interest expense 11.3 12.6 22.3 25.3 44.6 Income tax (benefit) expense (1.2) (9.9) (2.6) (10.1) 84.9 Depreciation and depletion (19.5) 19.3 (0.4) 43.8 21.8 Amortization of port access rights — 0.9 — 1.9 1.9 EBITDA 25.9 (30.0) 18.2 3.2 4.7 Accretion 2.0 3.3 4.6 6.9 10.2 Derivative financial instruments: Exclusion of fair value mark-to-market losses (gains) (1) (8.3) 2.8 (6.3) 7.5 16.8 Inclusion of cash amounts received (paid) (2)(3)(4) (0.3) 1.1 (2.6) (0.9) (2.3) Total derivative financial instruments (8.6) 3.9 (8.9) 6.6 14.5 Impairments — 33.4 4.1 33.4 62.3 Adjusted EBITDA $ 19.3 $ 10.6 $ 18.0 $ 50.1 $ 91.7 (1) Fair value mark-to-market (gains) losses reflected on the statements of operations. Cash amounts received and paid reflected within operating cash flows. Excludes premiums paid at option contract inception of $1.0 during the three months ended June 30, 2015, for original settlement dates in subsequent periods. Excludes premiums paid at option contract inception of $3.0 during the six months ended June 30, 2015, for original settlement dates in subsequent periods. (in millions)
Year Ended December 31, 2015 2014 2013 2012 2011 Net income $ (204.9) $ 79.0 $ 52.0 $ 173.7 $ 189.8 Interest income (0.2) (0.3) (0.4) (1.1) (0.6) Interest expense 47.6 77.2 41.7 36.3 33.9 Income tax (benefit) expense 77.4 34.9 11.6 62.6 11.4 Depreciation and depletion 66.1 112.0 100.5 94.6 87.1 Amortization 3.7 — — — — EBITDA $ (10.4) $ 302.8 $ 205.3 $ 366.1 $ 321.6 Accretion 12.6 15.1 15.3 13.2 12.5 Tax agreement (benefit) expense(1) — (58.6) 10.5 (29.0) 19.9 Derivative financial instruments: Exclusion of fair value mark-to-market (gains) losses(2) 30.6 (7.8) (25.6) (22.8) (2.3) Inclusion of cash amounts received(3)(4) (0.6) 24.7 13.0 11.2 — Total derivative financial instruments 30.0 16.9 (12.6) (11.5) (2.3) Impairments (5) 91.5 — — — — Gain on sale of Decker Mine interest — (74.3) — — — Adjusted EBITDA $ 123.8 $ 201.9 $ 218.6 $ 338.8 $ 351.7 (1) Changes to related deferred taxes are included in income tax expense. (2) Fair value mark-to-market (gains) losses reflected on the statement of operations. (3) Cash amounts received and paid reflected within operating cash flows. (4) Excludes premiums paid at option contract inception of $5.8 million and $4.0 million during the years ended December 31, in 2015 and 2014, respectively, for original settlement dates in subsequent years. (5) Non-cash impairments of $33.4 related to goodwill at the Cordero Rojo Mine, $52.2 million of port access rights, and $6.0 million related to our investment in GPT during the year ended December 31, 2015. Reconciliation of Non-GAAP Measures Adjusted EBITDA 36 (in millions)
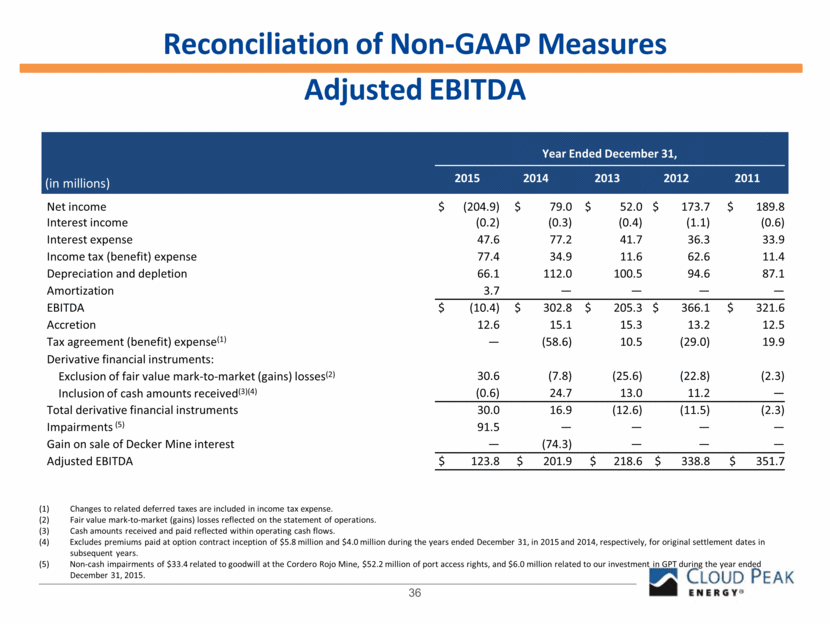
Excludes per share impact of premiums paid at option contract inception of $0.02 during the three months ended June 30, 2015, for original settlement dates in subsequent periods. Excludes per share impact of premiums paid at option contract inception of $0.05 during the six months ended June 30, 2015, for original settlement dates in subsequent periods. Three Months Ended Six Months Ended June 30, June 30, 2016 2015 2016 2015 Reconciliation of Non-GAAP Measures Adjusted EPS 37 Diluted earnings (loss) per common share $ 0.57 $ (0.87) $ (0.02) $ (0.94) Derivative financial instruments: Exclusion of fair value mark-to-market losses (gains) (0.13) 0.05 (0.10) 0.12 Inclusion of cash amounts received (paid) (1)(2) (0.01) 0.02 (0.04) (0.01) Total derivative financial instruments (0.14) 0.07 (0.14) 0.11 Impairments — 0.55 0.06 0.55 Tax impact of adjustments 0.05 (0.03) 0.06 (0.05) Adjusted EPS 0.48 (0.28) (0.04) (0.33) Weighted-average dilutive shares outstanding (in millions) 62.0 61.0 61.2 61.0
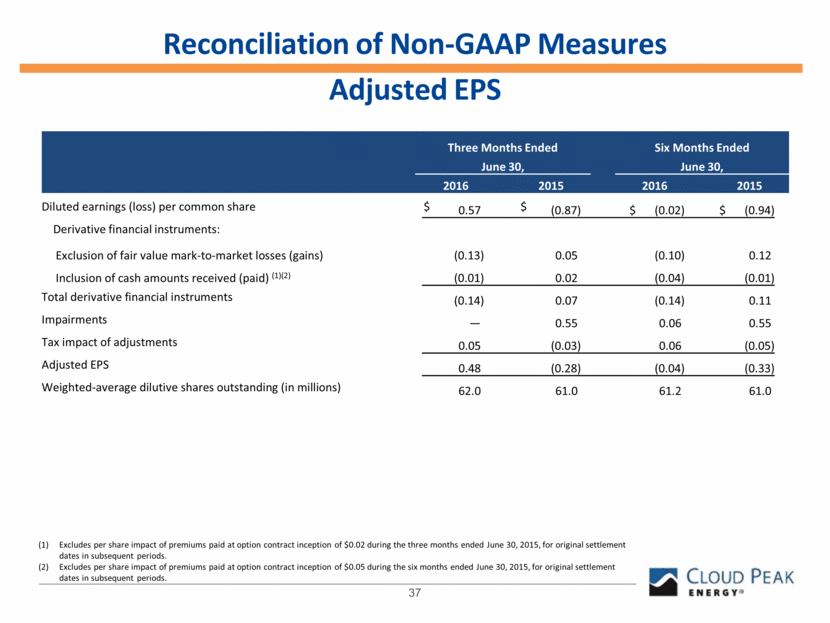
Diluted earnings per common share $ (3.36) $ 1.29 $ 0.85 $ 2.85 $ 3.13 Tax agreement (benefit) expense — (0.60) 0.11 (0.30) 0.21 Tax valuation allowance 1.83 (0.13) 0.10 (0.28) (0.84) Derivative financial instruments: Exclusion of fair value mark-to-market gains 0.33 (0.08) (0.27) (0.24) (0.02) Inclusion of cash amounts received (paid) (1) (0.01) 0.25 0.14 0.12 — Total derivative financial instruments 0.32 0.17 (0.13) (0.12) (0.02) Refinancing transaction — 0.22 — — — Impairments (2) 1.50 — — — — Gain on sale of Decker Mine interest — (0.76) — — — Adjusted EPS $ 0.28 $ 0.19 $ 0.73 $ 2.15 $ 2.47 Weighted-average dilutive shares outstanding (in millions) 61.1 61.3 61.2 60.9 60.6 Year Ended December 31, 2015 2014 2013 2012 2011 Reconciliation of Non-GAAP Measures Adjusted EPS 38 Excludes per share impact of premiums paid at option contract inception of $0.06 and $0.04 during the years ended December 31, 2015 and 2014, respectively, for original settlement dates in subsequent years. Non-cash impairments of goodwill, port access rights, and the Company’s investment in GPT during the year ended December 31, 2015.
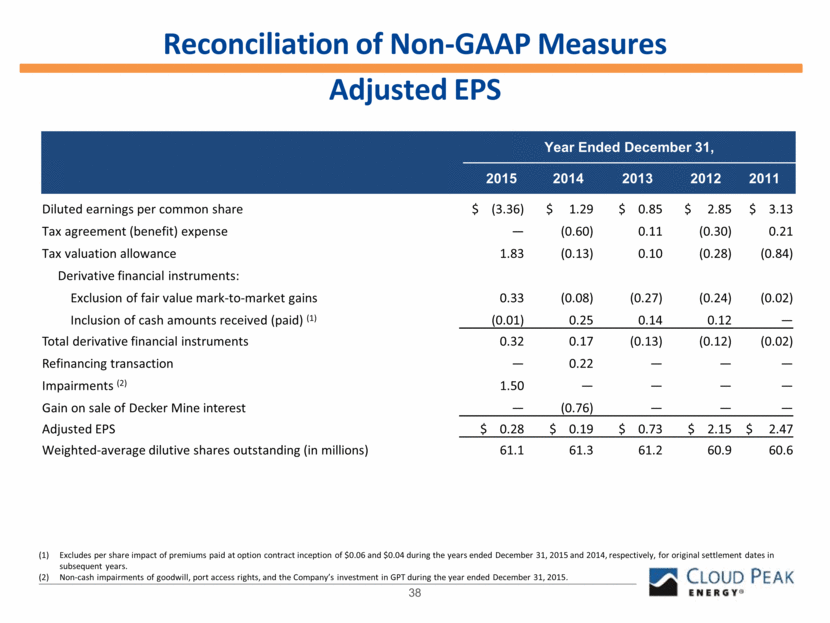
Three Months Ended Six Months Ended June 30, June 30, 2016 2015 2016 2015 Adjusted EBITDA by Segment 39 Excludes premiums paid at option contract inception of $1.0 during the three months ended June 30, 2015, for original settlement dates in subsequent periods. Excludes premiums at option contract inception of $3.0, related to our Logistics and Related Activities segment, during the six months ended June 30, 2015, for settlement dates in subsequent periods. Includes $18.8 of sales contract buyout revenue in the three months ended June 30, 2016. Includes $22.8 and $4.3 of sales contract buyouts for the six months ended June 30, 2016 and 2015, respectively. (in millions) Owned and Operated Mines Adjusted EBITDA $ 20.6 $ 29.7 Depreciation and depletion 19.9 (18.7) Accretion (1.9) (3.2) Derivative financial instruments: Exclusion of fair value mark-to-market gains (losses) $ 8.3 $ 4.7 Inclusion of cash amounts (received) paid (1)(2)) 2.1 2.7 Total derivative financial instruments 10.4 7.4 Impairments — (33.4) Other 0.2 (0.2) Operating income (loss) 49.2 (18.4) Logistics and Related Activities Adjusted EBITDA (7.4) (6.6) Amortization of port access rights — (0.9) Derivative financial instruments: Exclusion of fair value mark-to-market gains (losses) — (7.5) Inclusion of cash amounts (received) paid (1.8) (3.9) Total derivative financial instruments (1.8) (11.4) Other 1.0 — Operating income (loss) (8.2) (18.9) Other Adjusted EBITDA(3)(4) 6.1 (12.0) Depreciation and depletion (0.3) (0.6) Accretion (0.1) (0.1) Impairment (0.1) — Other (0.5) (0.4) Operating income (loss) 5.1 (13.1) Eliminations Adjusted EBITDA (0.1) (0.5) Operating loss (0.1) (0.5) Consolidated operating income (loss) 45.9 (50.8) Interest income — — Interest expense (11.3) (12.6) Other, net (0.2) 0.2 Income tax (expense) benefit 1.2 9.9 Income (loss) from unconsolidated affiliates, net of tax (0.3) 0.4 Net income (loss) $ 35.3 $ (52.9) $ 36.0 $ 84.4 1.1 (42.5) (4.3) (6.6) $ 6.3 $ (2.0) 6.2 8.3 12.5 6.3 (2.1) (33.4) 0.5 0.1 43.7 8.3 (14.3) (14.4) — (1.9) — (5.5) (3.6) (7.5) (3.6) (13.0) 1.8 0.1 (16.1) (29.2) (3.6) (18.8) (0.7) (1.3) (0.3) (0.3) (2.0) — (0.7) (0.4) (7.3) (20.8) (0.1) (1.1) (0.1) (1.1) 20.3 (42.8) 0.1 0.1 (22.3) (25.3) (0.6) (0.1) 2.6 10.1 (1.1) 0.4 $ (1.1) $ (57.6)
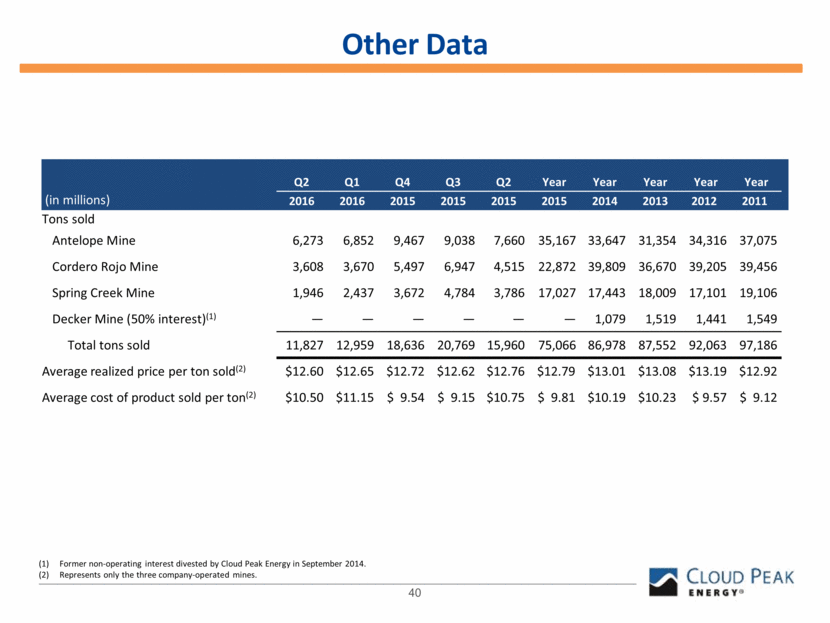
Former non-operating interest divested by Cloud Peak Energy in September 2014. Represents only the three company-operated mines. Q2 Q1 Q4 Q3 Q2 Year Year Year Year Year 2016 2016 2015 2015 2015 2015 2014 2013 2012 2011 Tons sold Antelope Mine 6,273 6,852 9,467 9,038 7,660 35,167 33,647 31,354 34,316 37,075 Cordero Rojo Mine 3,608 3,670 5,497 6,947 4,515 22,872 39,809 36,670 39,205 39,456 Spring Creek Mine 1,946 2,437 3,672 4,784 3,786 17,027 17,443 18,009 17,101 19,106 Decker Mine (50% interest)(1) — — — — — — 1,079 1,519 1,441 1,549 Total tons sold 11,827 12,959 18,636 20,769 15,960 75,066 86,978 87,552 92,063 97,186 Average realized price per ton sold(2) $12.60 $12.65 $12.72 $12.62 $12.76 $12.79 $13.01 $13.08 $13.19 $12.92 Average cost of product sold per ton(2) $10.50 $11.15 $ 9.54 $ 9.15 $10.75 $ 9.81 $10.19 $10.23 $ 9.57 $ 9.12 Other Data 40 (in millions)
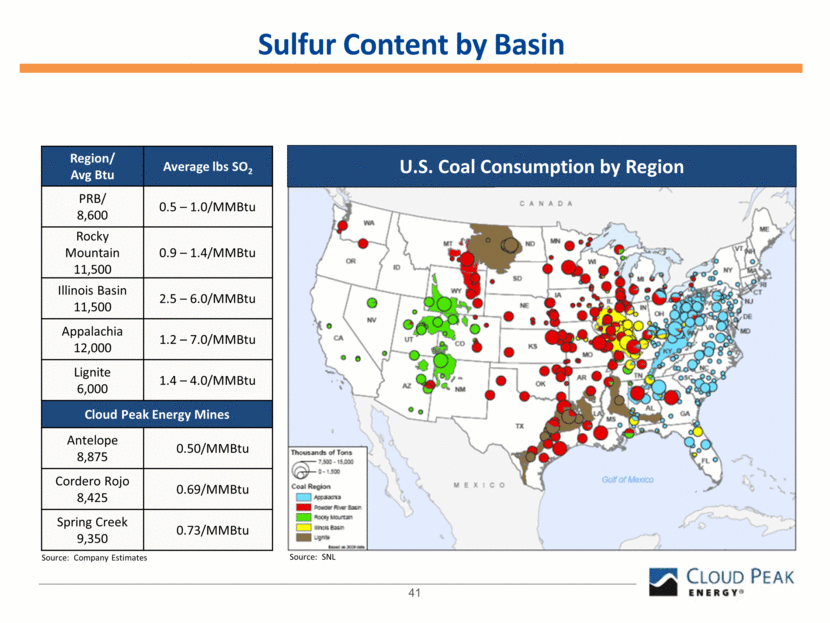
41 41 Sulfur Content by Basin Source: SNL U.S. Coal Consumption by Region Region/ Avg Btu Average lbs SO2 PRB/ 8,600 0.5 – 1.0/MMBtu Rocky Mountain 11,500 0.9 – 1.4/MMBtu Illinois Basin 11,500 2.5 – 6.0/MMBtu Appalachia 12,000 1.2 – 7.0/MMBtu Lignite 6,000 1.4 – 4.0/MMBtu Cloud Peak Energy Mines Antelope 8,875 0.50/MMBtu Cordero Rojo 8,425 0.69/MMBtu Spring Creek 9,350 0.73/MMBtu Source: Company Estimates 41
Serious News for Serious Traders! Try StreetInsider.com Premium Free!
You May Also Be Interested In
- Quinyx's 2024 State of the Frontline Workforce Report Finds Logistics Employees Feel Undervalued, Unclear on Career Path
- PrizePicks Announces New Chief People Officer and Key Responsible Gaming Hire
- Pipe17 Empowers Brands to Deliver on the Modern Brand Promise with Revolutionary Order Operations Platform
Create E-mail Alert Related Categories
SEC FilingsSign up for StreetInsider Free!
Receive full access to all new and archived articles, unlimited portfolio tracking, e-mail alerts, custom newswires and RSS feeds - and more!


 Tweet
Tweet Share
Share