

Form 8-K CIT GROUP INC For: Nov 03
 Tweet
Tweet Share
ShareUNITED STATES
SECURITIES AND EXCHANGE COMMISSION
Washington, D.C. 20549
FORM 8-K
CURRENT REPORT
Pursuant to Section 13 or 15(d) of the
Securities Exchange Act of 1934
Date of Report (Date of earliest event reported): November 3, 2015 (November 3, 2015)
CIT GROUP INC.
(Exact name of registrant as specified in its charter)
| Delaware | 001-31369 | 65-1051192 |
| (State or other | (Commission | (IRS Employer |
| jurisdiction of | File Number) | Identification No.) |
| incorporation) |
11 West 42nd Street
New York, New York 10036
(Address of registrant's principal executive office)
Registrant's telephone number, including area code: (212) 461-5200
(Former Name or Former Address, if Changed Since Last Report)
Check the appropriate box below if the Form 8-K filing is intended to simultaneously satisfy the filing obligation of the registrant under any of the following provisions (see General Instruction A.2. below):
[ ] Written communications pursuant to Rule 425 under the Securities Act (17 CFR 230.425)
[ ] Soliciting material pursuant to Rule 14a-12 under the Exchange Act (17 CFR 240.14a-12)
[ ] Pre-commencement communications pursuant to Rule 14d-2(b) under the Exchange Act (17 CFR 240.14d-2(b))
[ ] Pre-commencement communications pursuant to Rule 13e-4(c) under the Exchange Act (17 CFR 240.13e-4(c))
1
Section 2 – Financial Information
Item 2.02. Results of Operations and Financial Condition.
This Current Report on Form 8-K includes as an exhibit a press release, dated November 3, 2015, reporting the financial results of CIT Group Inc. (the “Company”) as of and for the quarter ended September 30, 2015. The press release is attached as Exhibit 99.1. This press release includes certain non-GAAP financial measures. A reconciliation of those measures to the most directly comparable GAAP measures is included as a table to the press release. The information furnished under this Item 2.02, including Exhibit 99.1, shall be considered filed for purposes of the Securities Exchange Act of 1934, as amended (the “Exchange Act”).
Section 7 – Regulation FD
Item 7.01. Regulation FD Disclosure.
In addition, this Form 8-K includes a copy of the Company’s presentation to analysts and investors of its Third Quarter 2015 Financial Results for the quarter ended September 30, 2015, which is attached as Exhibit 99.2. The information included in Exhibit 99.2 shall not be considered filed for purposes of the Exchange Act. The Company also provides supplementary financial information on its website, which is not incorporated by reference in this Form 8-K.
Section 9 – Financial Statements and Exhibits
Item 9.01. Financial Statements and Exhibits.
| (d) | Exhibits. |
| 99.1 | Press release issued by CIT Group Inc. on November 3, 2015 reporting its financial results as of and for the quarter ended September 30, 2015. |
|
99.2
|
Presentation by CIT Group Inc. on November 3, 2015 regarding its Third Quarter 2015 Financial Results.
|
Forward-Looking Statements
This Form 8-K contains forward-looking statements within the meaning of applicable federal securities laws that are based upon our current expectations and assumptions concerning future events, which are subject to a number of risks and uncertainties that could cause actual results to differ materially from those anticipated. The words “expect,” “anticipate,” “estimate,” “forecast,” “initiative,” “objective,” “plan,” “goal,” “project,” “outlook,” “priorities,” “target,” “intend,” “evaluate,” “pursue,” “commence,” “seek,” “may,” “would,” “could,” “should,” “believe,” “potential,” “continue,” or the negative of any of those words or similar expressions is intended to identify forward-looking statements. All statements contained in this Form 8-K, other than statements of historical fact, including without limitation, statements about our plans, strategies, prospects and expectations regarding future events and our financial performance, are forward-looking statements that involve certain risks and uncertainties. While these statements represent our current judgment on what the future may hold, and we believe these judgments are reasonable, these statements are not guarantees of any events or financial results, and our actual results may differ materially. Important factors that could cause our actual results to be materially different from our expectations include, among others, the risk that CIT is unsuccessful in implementing its strategy and business plan, the risk that CIT is unable to react to and address key business and regulatory issues, the risk that CIT is unable to achieve the projected revenue growth from its new business initiatives or the projected expense reductions from efficiency improvements, and the risk that CIT becomes subject to liquidity constraints and higher funding costs. We describe these and other risks that could affect our results in Item 1A, “Risk Factors,” of our latest Annual Report on Form 10-K for the year ended December 31, 2014, which was filed with the Securities and Exchange Commission. Accordingly, you should not place undue reliance on the forward-looking statements contained in this Form 8-K. These forward-looking statements speak only as of the date on which the statements were made. CIT undertakes no obligation to update publicly or otherwise revise any forward-looking statements, except where expressly required by law.
2
SIGNATURES
Pursuant to the requirements of the Securities Exchange Act of 1934, the Registrant has duly caused this report to be signed on its behalf by the undersigned hereunto duly authorized.
| CIT GROUP INC. | ||
| (Registrant) | ||
| | ||
| By: | /s/ Carol Hayles | |
| Carol Hayles | ||
| Executive Vice President & Chief Financial Officer | ||
Dated: November 3, 2015
3
Exhibit 99.1

FOR IMMEDIATE RELEASE
CIT REPORTS THIRD QUARTER 2015 NET INCOME OF $693 MILLION ($3.61 PER DILUTED SHARE)
INCOME FROM CONTINUING OPERATIONS OF $697 MILLION ($3.63 PER DILUTED SHARE)
- Results Impacted by Several Items Related to Strategic Initiatives and Exited Businesses – Includes net after-tax benefit of $544 million ($2.83) per diluted share from discrete items;
- Closed OneWest Bank Acquisition – Added over $20 billion of assets; $14 billion of deposits, reducing borrowing costs by approximately 70 basis points; CIT Bank now represents nearly 65% of total portfolio assets;
- Grew Lending and Leasing Assets – Financing and leasing assets in North America Banking and Transportation & International Finance grew over $1 billion or 3% from prior quarter, excluding assets acquired;
- Continued Capital Return – Returned nearly $170 million of capital to shareholders through dividends and the repurchase of approximately 3 million shares; Tier 1 Common Ratio of 12.4%.
NEW YORK, NY – November 3, 2015 – CIT Group Inc. (NYSE: CIT) cit.com, a leading provider of commercial lending and leasing services, today reported net income of $693 million, $3.61 per diluted share, for the quarter ended September 30, 2015, compared to net income of $515 million, $2.76 per diluted share, for the year-ago quarter. Income from continuing operations was $697 million, $3.63 per diluted share, compared to $515 million, $2.76 per diluted share, in the year-ago quarter. Net income for the current and year-ago quarters included $647 million, $3.37 per diluted share, and $375 million, $2.01 per diluted share, respectively, of income tax benefits associated with the reversals of the valuation allowance related to the U.S. federal deferred tax asset.
Net income for the nine month period ended September 30, 2015 was $912 million, $5.03 per diluted share, compared to $879 million, $4.59 per diluted share, for the period ended September 30, 2014. Income from continuing operations for the nine month period ended September 30, 2015 was $916 million, $5.05 per diluted share, compared to $825 million, $4.31 per diluted share, for the period ended September 30, 2014. Net income for the nine month periods ended September 30, 2015 and September 30, 2014 also included $647 million, $3.57 per diluted share, and $375 million, $1.96 per diluted share, respectively, of income tax benefits associated with the previously mentioned partial reversals of the tax related valuation allowance.
“We made significant progress in our transition to a U.S. commercial bank model in the third quarter,” said John Thain, Chairman and Chief Executive Officer. “We closed the acquisition of OneWest Bank and remain focused on integrating and leveraging its platform. We sold our business in Mexico, moved certain international businesses into held for sale and are exploring strategic alternatives for our Commercial Air business. I am confident our strategic initiatives will further position CIT for long-term success and increased shareholder value.”
2
Summary of Third Quarter Financial Results from Continuing Operations
All references in this section relate to continuing operations and therefore do not include any of the assets or results of operations of the discontinued operations.
On August 3, 2015, CIT acquired IMB HoldCo LLC, the parent company of OneWest Bank, which impacts the comparability of current results to prior periods. CIT paid approximately $3.4 billion as consideration, which was mostly comprised of approximately $1.9 billion in cash proceeds and 30.9 million shares of CIT Group Inc. common stock (valued at approximately $1.5 billion at the time of closing). The acquisition added over $20 billion of assets, including $0.6 billion of goodwill, and $18 billion of liabilities to CIT’s Consolidated Balance Sheet.
The third quarter 2015 includes two months of OneWest Bank results of operations, and the September 30, 2015 balance sheet includes the impact of the acquisition. Prior periods do not reflect any results from OneWest Bank.
Selected Financial Highlights (Continuing Operations)
| Change from: | ||||||||||||||||||||
| 3Q15 | 2Q15 | 3Q14 | Prior Quarter* | Prior Year* | ||||||||||||||||
| ($ in millions, except per share data) | ||||||||||||||||||||
| Pre-tax income | $ | 137 | $ | 153 | $ | 117 | $ | (16 | ) | $ | 20 | |||||||||
| Net income | $ | 697 | $ | 115 | $ | 515 | $ | 582 | $ | 181 | ||||||||||
| Diluted earnings per share (EPS) | $ | 3.63 | $ | 0.66 | $ | 2.76 | $ | 2.97 | $ | 0.87 | ||||||||||
| EPS impact from VA Reversal | $ | 3.37 | NA | $ | 2.01 | NA | $ | 1.36 | ||||||||||||
| Pre-tax return on average earning assets (ROAEA) | 1.04 | % | 1.49 | % | 1.14 | % | -0.45 | % | -0.10 | % | ||||||||||
| Net finance margin | 3.67 | % | 3.33 | % | 3.57 | % | 0.33 | % | 0.10 | % | ||||||||||
| Net efficiency ratio | 62.2 | % | 57.4 | % | 57.8 | % | 4.8 | % | 4.4 | % | ||||||||||
| Tangible book value per share (TBVPS) | $ | 47.09 | $ | 47.51 | $ | 45.87 | $ | (0.42 | ) | $ | 1.22 | |||||||||
| CET 1 Ratio | 12.4 | % | 14.4 | % | NA | -2.0 | % | NA | ||||||||||||
| Total Capital Ratio | 13.0 | % | 15.1 | % | 14.3 | % | -2.1 | % | -1.3 | % | ||||||||||
| Net charge-offs as % of AFR | 0.86 | % | 0.48 | % | 0.39 | % | 0.38 | % | 0.47 | % | ||||||||||
| Allowance for loan losses as % of finance receivables | 1.03 | % | 1.79 | % | 1.81 | % | -0.76 | % | -0.78 | % | ||||||||||
| Average earning assets | $ | 52,448 | $ | 41,159 | $ | 40,974 | $ | 11,289 | $ | 11,474 | ||||||||||
| Financing and leasing assets | $ | 50,099 | $ | 35,846 | $ | 36,072 | $ | 14,253 | $ | 14,026 | ||||||||||
| * Certain balances may not sum due to rounding. | ||||||||||||||||||||
Income from continuing operations of $697 million includes two months of results from OneWest Bank and also reflects discrete items that contributed $544 million to income relating to the acquisition, our strategic actions and portfolios we have exited. Discrete items associated with the acquisition include $647 million from the reversal of the valuation allowance on the U.S. federal deferred tax asset and after-tax transaction and restructuring costs of $18 million. In addition, we incurred charges on our strategic initiatives and exited portfolios, including a $14 million after-tax charge related to the sale of our Mexico business due to
3
the realization of the currency translation adjustment (“CTA”), $15 million in after-tax impairment on an international business moved to held for sale during the quarter, and discrete tax charges of $56 million. In addition to the discrete items noted above, income this quarter included a $17 million after-tax mark-to-market charge on the total return swap (“TRS”).
Tangible book value per share1 of $47.09 reflects the equity distributed for the OneWest Bank acquisition, the reversal of the valuation allowance on the deferred tax asset and the goodwill and intangibles associated with the acquisition. Estimated Common Equity Tier 1 and Total Capital ratios at September 30, 2015 declined to 12.4% and 13.0%, respectively, as calculated under the fully phased-in Regulatory Capital Rules. Average earning assets2 at September 30, 2015 increased to $52.4 billion.
Income Statement Highlights:
| Net Finance Revenue* | Change from: | |||||||||||||||||||
| ($ in millions) | 3Q15 | 2Q15 | 3Q14 | Prior Quarter | Prior Year | |||||||||||||||
| Interest income | $ | 438 | $ | 284 | $ | 308 | $ | 154 | $ | 129 | ||||||||||
| Rental income on operating leases | 539 | 532 | 535 | 8 | 4 | |||||||||||||||
| Finance revenue | 977 | 816 | 843 | 162 | 134 | |||||||||||||||
| Interest expense | (280 | ) | (265 | ) | (275 | ) | (15 | ) | (5 | ) | ||||||||||
| Depreciation on operating lease equipment | (159 | ) | (158 | ) | (156 | ) | (1 | ) | (3 | ) | ||||||||||
| Maintenance and other operating lease expenses | (56 | ) | (49 | ) | (47 | ) | (7 | ) | (9 | ) | ||||||||||
| Net finance revenue | $ | 482 | $ | 343 | $ | 365 | $ | 139 | $ | 117 | ||||||||||
| Average earning assets | $ | 52,448 | $ | 41,159 | $ | 40,974 | $ | 11,289 | $ | 11,474 | ||||||||||
| Net finance margin | 3.67 | % | 3.33 | % | 3.57 | % | 0.33 | % | 0.10 | % | ||||||||||
| * Certain balances may not sum due to rounding. | ||||||||||||||||||||
Net finance revenue3 was $482 million, compared to $343 million in the prior quarter and $365 million in the year-ago quarter. Average earning assets were $52 billion in the current quarter reflecting $20 billion of earnings assets acquired from OneWest Bank. Net finance revenue as a percentage of average earning assets (“net finance margin”) increased from both the prior and year-ago quarters. The increase from prior quarter primarily reflects the reduction in borrowing costs off-set by lower yielding assets acquired with the OneWest Bank acquisition, while the change from the year-ago quarter also reflects pressure on yields and the absence of interest recoveries.
1 Tangible book value and tangible book value per share are non-GAAP measures. See “Non-GAAP Measurements” at the end of this press release and page 23 for reconciliation of non-GAAP to GAAP financial information.
2 Average earning asset components have been changed to include interest earning cash, investments, securities and indemnification asset. See “Non-GAAP Measurements” at the end of this press release and page 23 for reconciliation of Earning Assets non-GAAP to GAAP financial information
3 Net finance revenue, net finance margin and net operating lease revenue are non-GAAP measures. See “Non-GAAP Measurements” at the end of this press release and page 23 for reconciliation of non-GAAP to GAAP financial information.
4
| Other Income* | Change from: | |||||||||||||||||||
| ($ in millions) | 3Q15 | 2Q15 | 3Q14 | Prior Quarter | Prior Year | |||||||||||||||
| Factoring commissions | $ | 31 | $ | 27 | $ | 31 | $ | 4 | $ | - | ||||||||||
| Fee revenues | 28 | 25 | 24 | 3 | 5 | |||||||||||||||
| Gains on sales of leasing equipment | 31 | 22 | 22 | 9 | 9 | |||||||||||||||
| Gains (losses) on loan and portfolio sales | (15 | ) | 2 | 10 | (17 | ) | (25 | ) | ||||||||||||
| Gains on investments | 2 | 4 | 5 | (2 | ) | (3 | ) | |||||||||||||
| Losses on OREO sales | (3 | ) | - | - | (3 | ) | (3 | ) | ||||||||||||
| Gains (losses) on derivatives and foreign currency exchange | (20 | ) | (5 | ) | (23 | ) | (15 | ) | 2 | |||||||||||
| Impairment on assets held for sale | (24 | ) | (11 | ) | (54 | ) | (13 | ) | 31 | |||||||||||
| Other revenues | 9 | - | 9 | 9 | - | |||||||||||||||
| Total other income | $ | 39 | $ | 64 | $ | 24 | $ | (25 | ) | $ | 15 | |||||||||
| * Certain balances may not sum due to rounding. | ||||||||||||||||||||
Other income of $39 million includes a $24 million mark-to-market charge on the TRS, a loss on the sale of the Mexico platform primarily related to the recognition of $19 million of CTA losses, and an impairment charge of $15 million on an international portfolio moved to held for sale, partially offset by an increase in gains on sale of rail cars. The prior quarter included a $9 million tax-related charge (that was fully offset with a benefit to the tax provision) and a $6 million negative mark-to-market on the TRS. The year-ago quarter was impacted by $46 million in impairment charges on the Non-Strategic Portfolios and a negative mark-to-market of $13 million on the TRS.
| Operating Expenses* | Change from: | |||||||||||||||||||
| ($ in millions) | 3Q15 | 2Q15 | 3Q14 | Prior Quarter | Prior Year | |||||||||||||||
| Compensation and benefits | $ | 160 | $ | 136 | $ | 130 | $ | 25 | $ | 30 | ||||||||||
| Technology | 30 | 25 | 21 | 5 | 9 | |||||||||||||||
| Professional fees | 57 | 21 | 22 | 37 | 35 | |||||||||||||||
| Net occupancy expense | 15 | 9 | 9 | 6 | 6 | |||||||||||||||
| Advertising and marketing | 7 | 7 | 8 | - | - | |||||||||||||||
| Other expenses | 54 | 37 | 35 | 17 | 19 | |||||||||||||||
| Operating expenses before provision for severance and facilities exiting and intangible asset amortization | 324 | 233 | 225 | 90 | 99 | |||||||||||||||
| Provision for severance and facilities exiting activities | 5 | 1 | 9 | 4 | (4 | ) | ||||||||||||||
| Intangible asset amortization | 5 | 1 | - | 5 | 5 | |||||||||||||||
| Total operating expenses | $ | 334 | $ | 235 | $ | 235 | $ | 99 | $ | 99 | ||||||||||
| Net efficiency ratio | 62.2 | % | 57.4 | % | 57.8 | % | 4.8 | % | 4.4 | % | ||||||||||
| * Certain balances may not sum due to rounding. | ||||||||||||||||||||
5
Operating expenses excluding restructuring fees and intangible asset amortization were $324 million, compared to $233 million in the prior quarter and $225 million in the year-ago quarter. The current quarter includes $24 million in transaction costs (included in professional fees) related to the OneWest Bank acquisition, which increased the net efficiency ratio4 by 460 basis points. Professional fees also reflect integration related costs, while other expenses include higher FDIC insurance costs resulting from the acquisition. The increase from the prior quarters also reflects higher compensation and occupancy costs primarily related to the addition of OneWest Bank. Headcount at September 30, 2015 was 4,960 up from 3,360 in the prior quarter and from 3,330 a year ago, driven by the OneWest acquisition. Restructuring costs and expenses associated with the amortization of intangibles are mainly the result of the OneWest Bank acquisition.
Income Taxes
The provision for income taxes was a benefit of $560 million, reflecting a $647 million reversal of the valuation allowance on the U.S. federal deferred tax asset partially offset by $56 million in discrete charges related to our international businesses. The effective tax rate excluding discrete items was 24%. The income tax benefit in the year-ago quarter was $401 million from a valuation allowance reversal and other discrete items, and a $38 million expense in the prior quarter. Cash taxes were $9 million compared to $4 million in the prior quarter and $3 million in the year-ago quarter.
Balance Sheet Highlights:
| Earning Assets* | Change from: | ||||||||
| ($ in millions) | 3Q15 | 2Q15 | 3Q14 | Prior Quarter |
Prior Year | ||||
| Loans (including assets held for sale) | $ 34,395 | $ 20,448 | $ 20,718 | $ 13,947 | $ 13,678 | ||||
| Operating lease equipment, net (including assets held for sale) | 15,704 | 15,398 | 15,354 | 306 | 350 | ||||
| Financing and Leasing Assets | 50,099 | 35,846 | 36,072 | 14,253 | 14,027 | ||||
| Interest bearing cash | 6,606 | 4,225 | 5,322 | 2,382 | 1,284 | ||||
| Investment securities | 3,619 | 1,693 | 792 | 1,926 | 2,826 | ||||
| Indemnification assets | 465 | - | - | 465 | 465 | ||||
| Securities purchased under agreements to resell | 100 | 750 | 650 | (650) | (550) | ||||
| Credit balances of factoring clients | (1,609) | (1,373) | (1,433) | (236) | (176) | ||||
| Total Earning Assets | $ 59,280 | $ 41,140 | $ 41,403 | $ 18,139 | $ 17,877 | ||||
| * Certain balances may not sum due to rounding. | |||||||||
4 Net efficiency ratio is a non-GAAP measure. See “Non-GAAP Measurements” at the end of this press release and page 23 for reconciliation of non-GAAP to GAAP financial information.
Earning Assets at September 30, 2015 were $59 billion, an increase of 44% from the prior quarter, reflecting approximately $6 billion in interest bearing deposits and investments, $14 billion in loans and $0.5 billion of indemnification assets, acquired in the OneWest Bank transaction. Excluding the loans purchased
6
in the acquisition, total financing and leasing assets increased 3% from the prior quarter, reflecting 3% growth in North America Banking (NAB) and Transportation & International Finance (TIF), which was slightly offset by a decrease in the Non-Strategic Portfolios resulting from the sale of the Mexican platform.
Total cash and investment securities, including non-earning cash, were $12.0 billion at September 30, 2015, and comprised of $8.3 billion of cash, $3.6 billion of debt and equity securities, of which $0.9 billion were short term, and $0.1 billion of reverse repurchase securities. Cash and investment securities at September 30, 2015 consisted of $2.1 billion related to the bank holding company and $8.4 billion at CIT Bank, N.A. (excluding $0.1 billion of restricted cash), with the remainder comprised of cash at operating subsidiaries and other restricted balances of approximately $1.5 billion.
| Deposits and Borrowings* | Change from: | |||||||||||||||||||
| ($ in millions) | 3Q15 | 2Q15 | 3Q14 | Prior Quarter | Prior Year | |||||||||||||||
| Total Deposits | $ | 32,329 | $ | 17,268 | $ | 14,483 | $ | 15,061 | $ | 17,846 | ||||||||||
| Unsecured notes | $ | 10,725 | $ | 10,733 | $ | 12,232 | $ | (8 | ) | $ | (1,507 | ) | ||||||||
| Secured borrowings | 8,596 | 5,709 | 6,691 | 2,887 | 1,904 | |||||||||||||||
| Total Borrowings | $ | 19,321 | $ | 16,442 | $ | 18,923 | $ | 2,879 | $ | 397 | ||||||||||
| * Certain balances may not sum due to rounding. | ||||||||||||||||||||
Deposits and secured borrowings increased from June 30, 2015, and September 30, 2014, reflecting $14 billion of deposits and $3 billion of FHLB borrowings acquired in the OneWest Bank transaction. At September 30, 2015, deposits represented approximately 63% of CIT’s funding, with unsecured and secured borrowings comprising 21% and 16% of the funding mix, respectively, reflecting the ongoing shift from unsecured borrowings to deposit funding. As a result, the weighted average coupon rate on outstanding deposits and borrowings in continuing operations was 2.21% at September 30, 2015, down from 3.04% at June 30, 2015 and from 3.16% at September 30, 2014.
| Capital* | Change from: | |||||||||||||||||||
| ($ in millions, except per share data) | 3Q15 | 2Q15 | 3Q14 | Prior Quarter | Prior Year | |||||||||||||||
| Common Stockholders' Equity | $ | 10,799 | $ | 8,807 | $ | 9,005 | $ | 1,992 | $ | 1,793 | ||||||||||
| Tangible Common Equity | $ | 9,462 | $ | 8,220 | $ | 8,414 | $ | 1,243 | $ | 1,048 | ||||||||||
| Total risk-based capital | $ | 9,156 | $ | 8,409 | $ | 8,422 | $ | 747 | $ | 734 | ||||||||||
| Risk-weighted assets | $ | 70,677 | $ | 55,665 | $ | 56,212 | $ | 15,012 | $ | 14,465 | ||||||||||
| Book value per share (BVPS) | $ | 53.74 | $ | 50.91 | $ | 49.10 | $ | 2.83 | $ | 4.64 | ||||||||||
| Tangible book value per share (TBVPS) | $ | 47.09 | $ | 47.51 | $ | 45.87 | $ | (0.42 | ) | $ | 1.22 | |||||||||
| CET 1 Ratio | 12.4 | % | 14.4 | % | NA | -2.0 | % | NA | ||||||||||||
| Total Capital Ratio | 13.0 | % | 15.1 | % | 14.3 | % | -2.1 | % | -1.3 | % | ||||||||||
| Tier 1 Leverage Ratio | 15.2 | % | 17.7 | % | 18.1 | % | -2.5 | % | -2.9 | % | ||||||||||
| * Certain balances may not sum due to rounding. | ||||||||||||||||||||
The acquisition of OneWest Bank increased equity, primarily due to the issuance of $1.5 billion in common shares, and resulted in the reversal of the valuation allowance on our Federal deferred tax asset. Tangible common equity reflects the increase in equity net of the increase in goodwill and intangibles resulting from the acquisition. Regulatory capital increased by approximately $800 million. While the reversal
7
of the deferred tax asset valuation allowance benefited stockholders’ equity, it had minimal impact on regulatory capital as the majority of the deferred tax asset balance was disallowed for regulatory capital purposes. As a result, capital ratios declined by approximately 200 basis points, as the benefit from the increase in regulatory capital was more than offset by the increase in the risk-weighted assets acquired.
The leverage ratio, which was also impacted by the acquisition, declined to 15.2%. The ratios presented reflect estimated Common Equity Tier 1 and Total Capital ratios at September 30 and June 30, 2015 under the fully phased-in Regulatory Capital Rules. The September 30, 2014 Tier 1 and Total Capital ratios are reported under the previously effective capital rules. The impact of the change in Regulatory Capital Rules at January 1, 2015 was minimal.
Book value per share grew during the quarter as the increase in equity outpaced the increase in shares outstanding. While tangible book value per share increased from a year ago, it decreased from June 30, 2015, as the higher share count offset the net increase in tangible equity.
During the quarter, we returned nearly $170 million in capital including $30 million in dividends and $140 million on repurchases of 3.0 million common shares at an average price of $46.28 per share.
In October 2015, the Board approved a $0.15 cash dividend payable on November 30, 2015 to common shareholders of record as of November 13, 2015.
Asset Quality
| Asset Quality* | Change from: | |||||||||||||||||||
| ($ in millions) | 3Q15 | 2Q15 | 3Q14 | Prior Quarter | Prior Year | |||||||||||||||
| Net charge-offs (NCO) | $ | 61 | $ | 24 | $ | 19 | $ | 38 | $ | 42 | ||||||||||
| NCO % of AFR | 0.86 | % | 0.48 | % | 0.39 | % | 0.38 | % | 0.47 | % | ||||||||||
| Non-accrual | $ | 215 | $ | 198 | $ | 201 | $ | 17 | $ | 14 | ||||||||||
| OREO | $ | 127 | $ | - | $ | - | $ | 127 | $ | 127 | ||||||||||
| Provision for credit losses | $ | 50 | $ | 19 | $ | 38 | $ | 31 | $ | 12 | ||||||||||
| Total Portfolio Allowance as a % of Finance Receivables (FR) | 1.03 | % | 1.79 | % | 1.81 | % | -0.76 | % | -0.78 | % | ||||||||||
| Allowance for loan losses plus non-accretable discount as % of FR (before non-accretable discount) / Commercial | 1.82 | % | 1.79 | % | 1.81 | % | 0.03 | % | 0.01 | % | ||||||||||
| * Certain balances may not sum due to rounding. | ||||||||||||||||||||
Net charge-offs of $61 million (0.86%) in the current quarter included $40 million related to receivables transferred to assets held for sale. Excluding assets moved to held for sale, net charge-offs were $21 million, relatively consistent with the prior quarter. Recoveries of $6 million were down from $11 million in the prior quarter and unchanged from the year-ago quarter.
Non-accrual loans rose modestly over the prior quarter due to the addition of a few discrete loans in North America Banking, including one loan in the energy portfolio, partially offset by a reduction from the sale of the Mexico business. The provision for credit losses was up from both the prior and year-ago quarters and reflects the reserve build on loan growth and a slight increase in the reserve resulting from the quarter’s purchase accounting accretion on loans. In addition, the provision was elevated in the current quarter from
8
the establishment of reserves on certain acquired non-credit impaired loans in the initial period post acquisition. Real estate owned as a result of foreclosures of secured mortgage loans was $127 million at September 30, 2015 and recorded in the Legacy Consumer Mortgage segment acquired with the OneWest Bank transaction.
The allowance for loan losses was $335 million (1.03% of finance receivables, 1.22% excluding loans subject to loss sharing agreements with the FDIC) at September 30, 2015, compared to $351 million (1.79%) at June 30, 2015 and $358 million (1.81%) at September 30, 2014. The decrease of $16 million in the allowance from the prior quarter is primarily due to the decline in non-specific reserves associated with assets transferred to held for sale, partially offset by reserve build on new loans and on certain acquired non-credit impaired loans. The decline in the percentage of allowance to finance receivables reflects the OneWest Bank acquisition, which added $14 billion of loans at fair value with no related allowance at the time of acquisition. Including the impact of the non-accretable discount on credit impaired loans, which absorbs credit losses on the discounted loans, the commercial loan allowance to finance receivables was 1.82%. The consumer loans ratio was 11% as most of the consumer loans purchased were credit impaired and are partially covered by loss share agreements with the FDIC.
As part of the OneWest Bank acquisition CIT’s direct lending to oil and gas extraction and services increased to approximately $1.0 billion and now comprise 3.1% of total loans. If oil prices remain at current levels, the portfolio could see additional downward credit migration.
Segment Highlights:
North America Banking (NAB)
| Earnings Summary* | Change from: | |||||||||||||||||||
| ($ in millions) | 3Q15 | 2Q15 | 3Q14 | Prior Quarter | Prior Year | |||||||||||||||
| Interest income | $ | 276 | $ | 199 | $ | 216 | $ | 77 | $ | 60 | ||||||||||
| Rental income on operating leases | 29 | 28 | 25 | 1 | 4 | |||||||||||||||
| Interest expense | (72 | ) | (73 | ) | (74 | ) | 1 | 2 | ||||||||||||
| Depreciation on operating lease equipment | (22 | ) | (21 | ) | (20 | ) | (0 | ) | (1 | ) | ||||||||||
| Net finance revenue | 210 | 133 | 146 | 78 | 64 | |||||||||||||||
| Other income | 58 | 69 | 71 | (11 | ) | (13 | ) | |||||||||||||
| Provision for credit losses | (47 | ) | (19 | ) | (30 | ) | (28 | ) | (17 | ) | ||||||||||
| Operating expenses | (186 | ) | (135 | ) | (126 | ) | (51 | ) | (60 | ) | ||||||||||
| Income before income taxes | $ | 36 | $ | 48 | $ | 62 | $ | (12 | ) | $ | (26 | ) | ||||||||
| Select Average Balances | ||||||||||||||||||||
| Average finance receivables | $ | 21,204 | $ | 15,854 | $ | 16,009 | $ | 5,350 | $ | 5,195 | ||||||||||
| Average earning assets | $ | 20,808 | $ | 15,397 | $ | 15,746 | $ | 5,411 | $ | 5,063 | ||||||||||
| Statistical Data | ||||||||||||||||||||
| Pre-tax ROAEA | 0.69 | % | 1.23 | % | 1.57 | % | -0.55 | % | -0.88 | % | ||||||||||
| Net finance margin | 4.04 | % | 3.44 | % | 3.71 | % | 0.60 | % | 0.33 | % | ||||||||||
| New business volume | $ | 2,067 | $ | 1,631 | $ | 1,608 | $ | 437 | $ | 459 | ||||||||||
| Efficiency ratio | 67.4 | % | 66.9 | % | 57.8 | % | 0.5 | % | 9.6 | % | ||||||||||
| * Certain balances may not sum due to rounding. | ||||||||||||||||||||
9
NAB pre-tax earnings of $36 million declined from both the prior and the year-ago quarters, primarily due to a $15 million goodwill impairment related to the transfer of the Canadian business to held for sale and elevated credit provision resulting from the establishment of reserves on certain acquired non-credit impaired loans. The current quarter includes two months of results of operations of OneWest Bank, which primarily impacted interest income, provision for credit losses and operating expenses.
The results continue to reflect a challenging lending environment and the impact of continued low interest rates. The current quarter’s results also reflect higher credit costs related to a few accounts, higher operating expenses, largely reflecting the acquisition of OneWest Bank, and a decline in other income which was negatively impacted by the impairment charge referenced above.
Financing and leasing assets, which comprise the majority of earning assets, were $24.7 billion, including $1.3 billion of consumer loans. These assets rose from $16.3 billion at June 30, 2015, and $16.4 billion at September 30, 2014, primarily due to approximately $8 billion of loans acquired. Assets also grew in Commercial Services reflecting seasonally-strong factored volume, Commercial Real Estate driven by strong new business originations, and Commercial Banking reflecting slower portfolio runoff. New lending and leasing volume was $2.1 billion, up from $1.6 billion in both the prior and year-ago quarters. Factored volume increased slightly from the year-ago quarter and rose nearly $1 billion (16%) from the prior quarter, in line with seasonal trends.
Net finance revenue (“NFR”) increased from the prior and year-ago quarters, reflecting higher earning assets and purchase accounting accretion on loans acquired. Net finance margin increased from the prior and year-ago quarters as the benefit of higher yields from purchase accounting accretion on acquired loans and lower funding costs due to the OneWest Bank acquisition more than offset lower pricing in certain new originations. The year ago quarter also benefited from interest recoveries.
The decline in other income from the prior and year-ago quarters was due primarily to the impairment charge noted above.
Operating expenses rose from both the prior and year-ago quarters reflecting an increase in employee and deposit-related costs that resulted from the acquisition of OneWest Bank.
Non-accrual loans were $156 million (0.67% of finance receivables), compared to $111 million (0.70%) at June 30, 2015, and $134 million (0.83%) a year ago. The increase in balance from the prior quarter related primarily to loans in the Commercial Banking division. The sequential quarter increase in the provision for credit losses reflects new volume, primarily in Commercial Banking and Commercial Real Estate, the establishment of reserves on acquired assets as well as an increase in specific reserves. Net charge-offs were $33 million (0.62% of average finance receivables), compared to $26 million (0.66%) in the prior quarter and $16 million (0.40%) in the year-ago quarter. Net charge-offs related to assets transferred to held for sale
10
were $14 million in the current quarter compared to $1 million in the prior quarter and $11 million in the year-ago quarter.
Transportation & International Finance (TIF)
| Earnings Summary* | Change from: | |||||||||||||||||||
| ($ in millions) | 3Q15 | 2Q15 | 3Q14 | Prior Quarter | Prior Year | |||||||||||||||
| Interest income | $ | 74 | $ | 70 | $ | 69 | $ | 4 | $ | 5 | ||||||||||
| Rental income on operating leases | 507 | 499 | 501 | 8 | 5 | |||||||||||||||
| Interest expense | (155 | ) | (165 | ) | (165 | ) | 10 | 10 | ||||||||||||
| Depreciation on operating lease equipment | (138 | ) | (137 | ) | (133 | ) | (1 | ) | (5 | ) | ||||||||||
| Maintenance and other operating lease expenses | (56 | ) | (49 | ) | (47 | ) | (7 | ) | (9 | ) | ||||||||||
| Net finance revenue | 232 | 218 | 226 | 14 | 6 | |||||||||||||||
| Other income | 23 | 17 | 19 | 6 | 4 | |||||||||||||||
| Provision for credit losses | (2 | ) | - | (9 | ) | (2 | ) | 8 | ||||||||||||
| Operating expenses | (68 | ) | (78 | ) | (74 | ) | 9 | 5 | ||||||||||||
| Income before income taxes | $ | 185 | $ | 157 | $ | 162 | $ | 28 | $ | 23 | ||||||||||
| Select Average Balances | ||||||||||||||||||||
| Average finance receivables | $ | 3,806 | $ | 3,657 | $ | 3,433 | $ | 149 | $ | 374 | ||||||||||
| Average operating leases | $ | 14,978 | $ | 14,720 | $ | 14,713 | $ | 258 | $ | 266 | ||||||||||
| Average earning assets | $ | 20,068 | $ | 20,156 | $ | 19,894 | $ | (87 | ) | $ | 175 | |||||||||
| Statistical Data | ||||||||||||||||||||
| Pre-tax ROAEA | 3.69 | % | 3.11 | % | 3.25 | % | 0.58 | % | 0.44 | % | ||||||||||
| Net finance margin | 4.62 | % | 4.32 | % | 4.54 | % | 0.31 | % | 0.09 | % | ||||||||||
| New business volume | $ | 1,237 | $ | 826 | $ | 1,327 | $ | 411 | $ | (90 | ) | |||||||||
| Efficiency ratio | 26.9 | % | 33.1 | % | 30.2 | % | -6.3 | % | -3.3 | % | ||||||||||
| * Certain balances may not sum due to rounding. | ||||||||||||||||||||
TIF pre-tax earnings were up from the prior and year-ago quarters, as finance revenue increased with financing and leasing asset growth, funding costs declined, other income rose from higher gains on asset sales and operating expenses declined from lower employee costs.
Financing and leasing assets at September 30, 2015 were $19.6 billion, up from $19.3 billion at June 30, 2015 and $19.1 billion at September 30, 2014. The increases primarily reflect growth in Rail and Maritime Finance, partially offset by a reduction in International Finance. The Aerospace portfolio, while up slightly from the prior quarter, was down from the year-ago quarter reflecting asset sales. Assets held for sale totaled $1.0 billion and largely consists of International Finance assets, including the U.K. equipment finance portfolio, for which the sale is expected to close in the fourth quarter, and the China portfolio, for which the intent to exit was recently announced. New business volume for the quarter consisted of $0.8 billion of operating lease equipment, including the delivery of 8 new aircraft, and approximately 2,200 new railcars, and the funding of $0.4 billion of finance receivables, the majority of which was in Maritime Finance.
Net finance revenue rose from the prior and year-ago quarters, reflecting asset growth and lower funding costs, partially offset by yield compression in Rail primarily due to increased maintenance and other operating lease expense. Net finance margin also increased from the prior and year-ago quarters reflecting lower funding costs as well as the aforementioned net finance revenue trends. Gross yields in Aerospace increased to 11.0% from 10.4% in the prior quarter due to increased collections, loan prepayment benefits and a decrease in the interest bearing cash balance (which is now included in Average Earning Assets), while gross yields in Rail of 14.5% were down sequentially from 14.7%, reflecting reduced utilization in energy-related railcars and portfolio growth.
Other income rose from the year-ago and prior quarters, driven by gains on railcar and commercial aircraft sales.
Non-accrual loans of $52 million (1.58% of finance receivables) improved from $58 million (1.55%) at June 30, 2015 and increased from $42 million (1.13%) a year ago and largely consist of international balances in each of the periods. There was a small provision for credit losses, compared to a slight benefit in the prior quarter and a $9 million provision in the year-ago quarter, primarily reflecting activity in China. Net charge-offs were $27 million this quarter (2.86% of average finance receivables) compared to net recoveries of $3 million in the prior quarter and net charge-offs of $4 million (0.44%) in the year-ago quarter. All but $0.1 million of the current quarter’s charge-offs were related to China and the majority related to the transfer of the China portfolio to held for sale.
Operating expenses were down from the prior and year-ago quarters reflecting lower employee costs, which improved efficiency.
Utilization trends were mixed compared to the prior quarter. Air utilization increased slightly to 98% of aircraft equipment leased or under a commitment at quarter-end. Rail utilization declined from 98% to 97% reflecting pressures mostly from energy related industries. All of our aircraft scheduled for delivery in the next 12 months and approximately 60% of the total railcar order-book have lease commitments.
11
Legacy Consumer Mortgages (LCM)
| Earnings Summary* | Change from: | |||||||||||||||||||
| ($ in millions) | 3Q15 | 2Q15 | 3Q14 | Prior Quarter | Prior Year | |||||||||||||||
| Interest income | $ | 63 | $ | - | $ | - | $ | 63 | $ | 63 | ||||||||||
| Interest expense | (14 | ) | - | - | (14 | ) | (14 | ) | ||||||||||||
| Net finance revenue | 49 | - | - | 49 | 49 | |||||||||||||||
| Other income | (1 | ) | - | - | (1 | ) | (1 | ) | ||||||||||||
| Provision for credit losses | (2 | ) | - | - | (2 | ) | (2 | ) | ||||||||||||
| Operating expenses | (17 | ) | - | - | (17 | ) | (17 | ) | ||||||||||||
| Income before income taxes | $ | 30 | $ | - | $ | - | $ | 30 | $ | 30 | ||||||||||
| Select Average Balances | ||||||||||||||||||||
| Average finance receivables | $ | 3,637 | $ | - | $ | - | $ | 3,637 | $ | 3,637 | ||||||||||
| Average earning assets | $ | 3,913 | $ | - | $ | - | $ | 3,913 | $ | 3,913 | ||||||||||
| Statistical Data | ||||||||||||||||||||
| Pre-tax ROAEA | 3.02 | % | - | - | 3.02 | % | 3.02 | % | ||||||||||||
| Net finance margin | 4.99 | % | - | - | 4.99 | % | 4.99 | % | ||||||||||||
| * Certain balances may not sum due to rounding. | ||||||||||||||||||||
LCM includes certain single family residential mortgage loans and reverse mortgage loans, mostly covered by loss share agreements acquired in the OneWest Bank acquisition, that will run-off over time.
Results reflect two months of activity. Revenue is primarily generated from interest on loans.
Financing and leasing assets totaled $5.7 billion at the acquisition date, and declined slightly to $5.6 billion at September 30, 2015. LCM includes single family residential mortgage loans, totaling $4.7 billion at September 30, 2015, and reverse mortgage loans totaling $0.9 billion. Approximately $5.0 billion of these loans are partially covered by loss sharing arrangements with the FDIC, which will continue to reimburse CIT Bank for certain realized losses. The indemnification asset, representing the expected cash flows from the loss share agreements was $397 million at September 30, 2015.
Non-accrual loans totaled $2 million and related to SFR loans and there were $1 million in net charge-offs. The loans were recorded at fair value upon acquisition, with no associated allowance for loan loss. The provision reflected changes in portfolio quality, along with draws on existing loans since the acquisition.
12
Non-Strategic Portfolios (NSP)
| Earnings Summary* | Change from: | |||||||||||||||||||
| ($ in millions) | 3Q15 | 2Q15 | 3Q14 | Prior Quarter | Prior Year | |||||||||||||||
| Interest income | $ | 7 | $ | 10 | $ | 20 | $ | (3 | ) | $ | (13 | ) | ||||||||
| Rental income on operating leases | 4 | 5 | 9 | (1 | ) | (5 | ) | |||||||||||||
| Interest expense | (6 | ) | (9 | ) | (19 | ) | 3 | 13 | ||||||||||||
| Depreciation on operating lease equipment | - | - | (4 | ) | - | 4 | ||||||||||||||
| Net finance revenue | 5 | 6 | 7 | (1 | ) | (2 | ) | |||||||||||||
| Other income | (22 | ) | (6 | ) | (47 | ) | (16 | ) | 25 | |||||||||||
| Provision for credit losses | - | - | 1 | - | (1 | ) | ||||||||||||||
| Operating expenses | (5 | ) | (11 | ) | (17 | ) | 6 | 12 | ||||||||||||
| Income before income taxes | $ | (21 | ) | $ | (10 | ) | $ | (56 | ) | $ | (11 | ) | $ | 35 | ||||||
| Select Average Balances | ||||||||||||||||||||
| Average earning assets | $ | 312 | $ | 465 | $ | 1,027 | $ | (152 | ) | $ | (715 | ) | ||||||||
| Statistical Data | ||||||||||||||||||||
| Pre-tax ROAEA | -26.90 | % | -8.95 | % | -21.84 | % | (0.2 | ) | (0.1 | ) | ||||||||||
| Net finance margin | 6.79 | % | 5.34 | % | 2.80 | % | 1.45 | % | 3.98 | % | ||||||||||
| New business volume | $ | 14 | $ | 26 | $ | 65 | $ | (12 | ) | $ | (51 | ) | ||||||||
| * Certain balances may not sum due to rounding. | ||||||||||||||||||||
NSP pre-tax losses were $21 million, up from the prior quarter and down from the year-ago quarter. The sequential trend reflects the completion of the sale of the Mexican platform during the quarter and a loss mainly due to the associated recognition of a $19 million currency translation adjustment loss, previously reflected in stockholder’s equity, and reduced operating expenses.
Financing and leasing assets declined to $0.1 billion at September 30, 2015, compared to $0.3 billion at June 30, 2015, and from $0.6 billion a year-ago, due to international portfolio sales and portfolio run-off.
The only remaining assets in the NSP segment relate to our Brazilian platform. We have a signed definitive agreement and received regulatory approval to sell the platform which is expected to close by the end of 2015.
13
Corporate and Other
| Earnings Summary* | Change from: | |||||||||||||||||||
| ($ in millions) | 3Q15 | 2Q15 | 3Q14 | Prior Quarter | Prior Year | |||||||||||||||
| Interest income | $ | 18 | $ | 5 | $ | 3 | $ | 14 | $ | 15 | ||||||||||
| Interest expense | (33 | ) | (18 | ) | (17 | ) | (15 | ) | (16 | ) | ||||||||||
| Net finance revenue | (15 | ) | (13 | ) | (14 | ) | (2 | ) | (1 | ) | ||||||||||
| Other income | (19 | ) | (17 | ) | (19 | ) | (3 | ) | (1 | ) | ||||||||||
| Operating expenses | (59 | ) | (11 | ) | (18 | ) | (47 | ) | (41 | ) | ||||||||||
| Income before income taxes | $ | (92 | ) | $ | (41 | ) | $ | (50 | ) | $ | (52 | ) | $ | (42 | ) | |||||
| Select Average Balances | ||||||||||||||||||||
| Average earning assets | $ | 7,347 | $ | 5,142 | $ | 4,307 | $ | 2,204 | $ | 3,040 | ||||||||||
| Statistical Data | ||||||||||||||||||||
| Pre-tax ROAEA | -5.03 | % | -3.18 | % | -4.67 | % | -1.85 | % | -0.36 | % | ||||||||||
| Net finance margin | -0.80 | % | -1.02 | % | -1.28 | % | 0.22 | % | 0.48 | % | ||||||||||
| Efficiency ratio | NM | -33.6 | % | -27.1 | % | NM | NM | |||||||||||||
| * Certain balances may not sum due to rounding. | ||||||||||||||||||||
Certain items are not allocated to operating segments and are included in Corporate and Other, including interest expense, primarily related to corporate liquidity costs, mark-to-market on certain derivatives, restructuring charges, certain legal costs and other operating expenses. Interest income increased from both prior and year-ago quarters primarily related to income generated from the investment portfolio, which now includes a Mortgage-Backed Security portfolio acquired in the OneWest Bank transaction. Other income included a $24 million negative mark-to-market on the TRS derivative. Operating expenses were elevated in the quarter reflecting closing costs and restructuring charges related to the OneWest Bank transaction.
Discontinued Operations
Income from discontinued
operations, net of taxes, was a loss of $4 million in the current quarter. Discontinued operations in the current quarter include
third-party reverse mortgage servicing right activities. The Company acquired servicing rights associated with Home Equity Conversion
Mortgages (HECM reverse mortgage loans or HECM loans) previously securitized in the form of GNMA Home Equity Conversion Mortgage-Backed
Securities (“HMBS”) in connection with the OneWest Bank transaction. Assets and liabilities of this business are included
in Assets of discontinued operations and Liabilities of discontinued operations. In the prior year, discontinued operations included
the activity related to our Student Loan portfolio that was sold in the second quarter of 2014.
14
Conference Call and Webcast
Chairman and Chief Executive Officer John A. Thain and Chief Financial Officer Carol Hayles will discuss these results on a conference call and audio webcast today, November 3, 2015, at 8:00 a.m. (EST). Interested parties may access the conference call live by dialing 888-317-6003 for U.S., 866-284-3684 for Canadian callers or 412-317-6061 for international callers and reference access code “7484525” or access the audio webcast at cit.com/investor. An audio replay of the call will be available until 11:59 p.m. (EST) on December 10, 2015, by dialing 877-344-7529 for U.S. callers, 855-669-9658 for Canadian callers or 412-317-0088 for international callers with the access code “10073687”, or at cit.com/investor.
About CIT
Founded in 1908, CIT (NYSE: CIT) is a financial holding company with more than $65 billion in assets. Its principal bank subsidiary, CIT Bank, N.A., (Member FDIC, Equal Housing Lender) has more than $30 billion of deposits and more than $40 billion of assets. It provides financing, leasing and advisory services principally to middle market companies across more than 30 industries primarily in North America, and equipment financing and leasing solutions to the transportation sector. It also offers products and services to consumers through its Internet bank franchise and a network of retail branches in Southern California, operating as OneWest Bank, a division of CIT Bank, N.A. cit.com
Forward-Looking Statements
This press release contains forward-looking statements within the meaning of applicable federal securities laws that are based upon our current expectations and assumptions concerning future events, which are subject to a number of risks and uncertainties that could cause actual results to differ materially from those anticipated. The words “expect,” “anticipate,” “estimate,” “forecast,” “initiative,” “objective,” “plan,” “goal,” “project,” “outlook,” “priorities,” “target,” “intend,” “evaluate,” “pursue,” “commence,” “seek,” “may,” “would,” “could,” “should,” “believe,” “potential,” “continue,” or the negative of any of those words or similar expressions is intended to identify forward-looking statements. All statements contained in this press release, other than statements of historical fact, including without limitation, statements about our plans, strategies, prospects and expectations regarding future events and our financial performance, are forward-looking statements that involve certain risks and uncertainties. While these statements represent our current judgment on what the future may hold, and we believe these judgments are reasonable, these statements are not guarantees of any events or financial results, and our actual results may differ materially. Important factors that could cause our actual results to be materially different from our expectations include, among others, the risk that CIT is unsuccessful in implementing its strategy and business plan, the risk that CIT is unable to react to and address key business and regulatory issues, the risk that CIT is unable to achieve the projected revenue growth from its new business initiatives or the projected expense reductions from efficiency improvements, and the risk that CIT becomes subject to liquidity constraints and higher funding costs. We describe these and other risks that could affect our results in Item 1A, “Risk Factors,” of our latest Annual Report on Form 10-K for the year ended December 31, 2014, which was filed with the Securities and Exchange Commission. Accordingly, you should not place undue reliance on the forward-looking statements contained in this press release. These forward-looking statements speak only as of the date on which the statements were made. CIT undertakes no obligation to update publicly or otherwise revise any forward-looking statements, except where expressly required by law.
Non-GAAP Measurements
Net finance revenue, net operating lease revenue, adjusted net finance revenue and average earning assets are non-GAAP measurements used by management to gauge portfolio performance. Operating expenses excluding restructuring costs and intangible amortization is a non-GAAP measurement used by management to compare period over period expenses. Net efficiency ratio measures operating expenses (net of restructuring costs and intangible amortization) to our level of total net revenues. Total assets from continuing operations is a non-GAAP measurement used by management to analyze the total asset change on a more consistent basis. Tangible book value and tangible book value per share are non-GAAP metrics used to analyze banks.
###
| CIT MEDIA RELATIONS: | CIT INVESTOR RELATIONS: |
| Matt Klein | Barbara Callahan |
| Vice President, Media Relations | Senior Vice President |
|
(973) 597-2020
|
(973) 740-5058 |
###
15
CIT GROUP INC. AND SUBSIDIARIES
Unaudited Consolidated Statements of Operations
(dollars in millions, except per share data)
| Quarters Ended | ||||||||||||||||||||
| September 30, | June 30, | September 30, | Nine Months Ended September 30, | |||||||||||||||||
| 2015 | 2015 | 2014 | 2015 | 2014 | ||||||||||||||||
| Interest income | ||||||||||||||||||||
| Interest and fees on loans | $ | 414.2 | $ | 274.8 | $ | 299.9 | $ | 961.4 | $ | 894.7 | ||||||||||
| Other Interest and dividends | 23.5 | 9.0 | 8.4 | 41.1 | 25.6 | |||||||||||||||
| Total interest income | 437.7 | 283.8 | 308.3 | 1,002.5 | 920.3 | |||||||||||||||
| Interest expense | ||||||||||||||||||||
| Interest on borrowings | (187.2 | ) | (193.0 | ) | (216.0 | ) | (582.5 | ) | (642.1 | ) | ||||||||||
| Interest on deposits | (93.1 | ) | (72.2 | ) | (59.2 | ) | (234.3 | ) | (167.2 | ) | ||||||||||
| Total interest expense | (280.3 | ) | (265.2 | ) | (275.2 | ) | (816.8 | ) | (809.3 | ) | ||||||||||
| Net interest revenue | 157.4 | 18.6 | 33.1 | 185.7 | 111.0 | |||||||||||||||
| Provision for credit losses | (49.9 | ) | (18.4 | ) | (38.2 | ) | (102.9 | ) | (85.1 | ) | ||||||||||
| Net interest revenue, after credit provision | 107.5 | 0.2 | (5.1 | ) | 82.8 | 25.9 | ||||||||||||||
| Non-interest income | ||||||||||||||||||||
| Rental income on operating leases | 539.3 | 531.7 | 535.0 | 1,601.6 | 1,546.5 | |||||||||||||||
| Other income | 39.2 | 63.5 | 24.2 | 189.1 | 189.0 | |||||||||||||||
| Total non-interest income | 578.5 | 595.2 | 559.2 | 1,790.7 | 1,735.5 | |||||||||||||||
| Non-interest expenses | ||||||||||||||||||||
| Depreciation on operating lease equipment | (159.1 | ) | (157.8 | ) | (156.4 | ) | (473.7 | ) | (462.5 | ) | ||||||||||
| Maintenance and other operating lease expenses | (55.9 | ) | (49.4 | ) | (46.5 | ) | (151.4 | ) | (147.1 | ) | ||||||||||
| Operating expenses | (333.9 | ) | (235.0 | ) | (234.5 | ) | (810.5 | ) | (693.0 | ) | ||||||||||
| Loss on debt extinguishment | (0.3 | ) | (0.1 | ) | - | (0.4 | ) | (0.4 | ) | |||||||||||
| Total other expenses | (549.2 | ) | (442.3 | ) | (437.4 | ) | (1,436.0 | ) | (1,303.0 | ) | ||||||||||
| Income from continuing operations before benefit (provision) for income taxes | 136.8 | 153.1 | 116.7 | 437.5 | 458.4 | |||||||||||||||
| Benefit (provision) for income taxes | 560.0 | (37.8 | ) | 401.2 | 478.2 | 369.6 | ||||||||||||||
| Income from continuing operations, before attribution of noncontrolling interests | 696.8 | 115.3 | 517.9 | 915.7 | 828.0 | |||||||||||||||
| Net (income) loss attributable to noncontrolling interests, after tax | - | - | (2.5 | ) | 0.1 | (2.5 | ) | |||||||||||||
| Income from continuing operations | 696.8 | 115.3 | 515.4 | 915.8 | 825.5 | |||||||||||||||
| Discontinued operation | ||||||||||||||||||||
| Loss from discontinued operation | (5.8 | ) | - | - | (5.8 | ) | (226.8 | ) | ||||||||||||
| Provision for Income Taxes | 2.1 | - | (0.5 | ) | 2.1 | (2.5 | ) | |||||||||||||
| Gain on sale of discontinued operation | - | - | - | - | 282.8 | |||||||||||||||
| (Loss) income from discontinued operation, net of taxes | (3.7 | ) | - | (0.5 | ) | (3.7 | ) | 53.5 | ||||||||||||
| Net income | $ | 693.1 | $ | 115.3 | $ | 514.9 | $ | 912.1 | $ | 879.0 | ||||||||||
| Basic income per common share | ||||||||||||||||||||
| Income from continuing operations | $ | 3.66 | $ | 0.66 | $ | 2.78 | $ | 5.08 | $ | 4.34 | ||||||||||
| (Loss) income from discontinued operation, net of taxes | (0.02 | ) | - | - | (0.02 | ) | 0.28 | |||||||||||||
| Basic income per common share | $ | 3.64 | $ | 0.66 | $ | 2.78 | $ | 5.06 | $ | 4.62 | ||||||||||
| Average number of common shares - basic (thousands) | 190,557 | 173,785 | 185,190 | 180,300 | 190,465 | |||||||||||||||
| Diluted income per common share | ||||||||||||||||||||
| Income from continuing operations | $ | 3.63 | $ | 0.66 | $ | 2.76 | $ | 5.05 | $ | 4.31 | ||||||||||
| (Loss) income from discontinued operation, net of taxes | (0.02 | ) | - | - | (0.02 | ) | 0.28 | |||||||||||||
| Diluted income per common share | $ | 3.61 | $ | 0.66 | $ | 2.76 | $ | 5.03 | $ | 4.59 | ||||||||||
| Average number of common shares - diluted (thousands) | 191,803 | 174,876 | 186,289 | 181,350 | 191,433 | |||||||||||||||
16
CIT GROUP INC. AND SUBSIDIARIES
Unaudited Consolidated Balance Sheets
(dollars in millions, except per share data)
| September 30, | June 30, | December 31, | September 30, | |||||||||||||
| 2015* | 2015 | 2014 | 2014 | |||||||||||||
| Assets | ||||||||||||||||
| Total cash and deposits | $ | 8,259.9 | $ | 5,465.3 | $ | 7,119.7 | $ | 6,214.2 | ||||||||
| Securities purchased under agreements to resell | 100.0 | 750.0 | 650.0 | 650.0 | ||||||||||||
| Investment securities | 3,618.8 | 1,692.9 | 1,550.3 | 792.4 | ||||||||||||
| Assets held for sale | 2,154.3 | 1,086.8 | 1,218.1 | 1,102.7 | ||||||||||||
| Loans | 32,406.2 | 19,649.3 | 19,495.0 | 19,785.8 | ||||||||||||
| Allowance for loan losses | (335.0 | ) | (350.9 | ) | (346.4 | ) | (357.7 | ) | ||||||||
| Loans, net of allowance for loan losses | 32,071.2 | 19,298.4 | 19,148.6 | 19,428.1 | ||||||||||||
| Operating lease equipment, net | 15,538.2 | 15,109.6 | 14,930.4 | 15,183.8 | ||||||||||||
| Indemnification assets | 465.0 | - | - | - | ||||||||||||
| Goodwill | 1,135.1 | 565.9 | 571.3 | 557.3 | ||||||||||||
| Intangible assets | 201.3 | 21.4 | 25.7 | 33.5 | ||||||||||||
| Unsecured counterparty receivable | 529.5 | 538.2 | 559.2 | 580.1 | ||||||||||||
| Other assets | 3,538.4 | 2,128.7 | 2,106.7 | 1,938.9 | ||||||||||||
| Assets of discontinued operation | 513.8 | - | - | - | ||||||||||||
| Total assets | $ | 68,125.5 | $ | 46,657.2 | $ | 47,880.0 | $ | 46,481.0 | ||||||||
| Liabilities | ||||||||||||||||
| Deposits | $ | 32,328.9 | $ | 17,267.8 | $ | 15,849.8 | $ | 14,483.2 | ||||||||
| Credit balances of factoring clients | 1,609.3 | 1,373.3 | 1,622.1 | 1,433.2 | ||||||||||||
| Other liabilities | 3,395.7 | 2,766.9 | 2,888.8 | 2,637.2 | ||||||||||||
| Borrowings | ||||||||||||||||
| Unsecured borrowings | 10,725.0 | 10,732.8 | 11,932.4 | 12,232.3 | ||||||||||||
| Structured financings | 5,376.5 | 5,561.4 | 6,268.7 | 6,401.4 | ||||||||||||
| FHLB advances | 3,219.0 | 147.4 | 254.7 | 289.7 | ||||||||||||
| Total long-term borrowings | 19,320.5 | 16,441.6 | 18,455.8 | 18,923.4 | ||||||||||||
| Liabilities of discontinued operation | 671.9 | - | - | - | ||||||||||||
| Total liabilities | 57,326.3 | 37,849.6 | 38,816.5 | 37,477.0 | ||||||||||||
| Equity | ||||||||||||||||
| Stockholders' equity | ||||||||||||||||
| Common stock | 2.0 | 2.0 | 2.0 | 2.0 | ||||||||||||
| Paid-in capital | 8,683.5 | 8,615.6 | 8,603.6 | 8,593.6 | ||||||||||||
| Retained earnings | 2,443.4 | 1,781.1 | 1,615.7 | 1,392.5 | ||||||||||||
| Accumulated other comprehensive loss | (174.3 | ) | (158.8 | ) | (133.9 | ) | (82.1 | ) | ||||||||
| Treasury stock, at cost | (155.9 | ) | (1,432.8 | ) | (1,018.5 | ) | (900.8 | ) | ||||||||
| Total common stockholders' equity | 10,798.7 | 8,807.1 | 9,068.9 | 9,005.2 | ||||||||||||
| Noncontrolling interests | 0.5 | 0.5 | (5.4 | ) | (1.2 | ) | ||||||||||
| Total equity | 10,799.2 | 8,807.6 | 9,063.5 | 9,004.0 | ||||||||||||
| Total liabilities and equity | $ | 68,125.5 | $ | 46,657.2 | $ | 47,880.0 | $ | 46,481.0 | ||||||||
| Book Value Per Common Share | ||||||||||||||||
| Book value per common share | $ | 53.74 | $ | 50.91 | $ | 50.13 | $ | 49.10 | ||||||||
| Tangible book value per common share | $ | 47.09 | $ | 47.51 | $ | 46.83 | $ | 45.87 | ||||||||
| Outstanding common shares (in thousands) | 200,952 | 172,998 | 180,921 | 183,423 | ||||||||||||
| * Preliminary | ||||||||||||||||
17
CIT GROUP INC. AND SUBSIDIARIES
Average Balances and Rates
(dollars in millions)
| Quarters Ended | ||||||||||||||||||||||||
| September 30, 2015 | June 30, 2015 | September 30, 2014 | ||||||||||||||||||||||
| Average Balance | Rate | Average Balance | Rate | Average Balance | Rate | |||||||||||||||||||
| Assets | ||||||||||||||||||||||||
| Interest bearing deposits | $ | 5,812.4 | 0.31% | $ | 4,829.4 | 0.28% | $ | 5,517.4 | 0.32% | |||||||||||||||
| Securities purchased under agreements to resell | 387.5 | 0.62% | 675.0 | 0.59% | 275.0 | 0.58% | ||||||||||||||||||
| Investments | 2,663.2 | 2.76% | 1,510.6 | 1.22% | 860.9 | 1.67% | ||||||||||||||||||
| Loans (including held for sale) | ||||||||||||||||||||||||
| U.S. | 27,320.5 | 5.72% | 18,130.4 | 5.41% | 17,002.0 | 5.85% | ||||||||||||||||||
| Non-U.S. | 1,971.6 | 8.91% | 2,161.3 | 9.01% | 3,186.7 | 8.87% | ||||||||||||||||||
| Total Loans | 29,292.1 | 5.95% | 20,291.7 | 5.83% | 20,188.7 | 6.36% | ||||||||||||||||||
| Total interest earning assets / interest income | 38,155.2 | 4.77% | 27,306.7 | 4.39% | 26,842.0 | 4.83% | ||||||||||||||||||
| Operating lease equipment, net (including held for sale) | ||||||||||||||||||||||||
| U.S. | 8,114.8 | 8.75% | 7,859.0 | 8.93% | 7,959.1 | 8.86% | ||||||||||||||||||
| Non-U.S. | 7,330.3 | 8.01% | 7,422.2 | 8.04% | 7,219.3 | 8.64% | ||||||||||||||||||
| Total operating lease equipment, net | 15,445.1 | 8.40% | 15,281.2 | 8.49% | 15,178.4 | 8.75% | ||||||||||||||||||
| Indemnification assets | 305.6 | 0.39% | - | - | - | - | ||||||||||||||||||
| Total earning assets | 53,905.9 | 5.81% | 42,587.9 | 5.91% | 42,020.4 | 6.29% | ||||||||||||||||||
| Non-interest earning assets | ||||||||||||||||||||||||
| Cash and due from banks | 1,902.6 | 952.7 | 968.1 | |||||||||||||||||||||
| Allowance for loan losses | (347.9 | ) | (358.0 | ) | (345.3 | ) | ||||||||||||||||||
| All other non-interest bearing assets | 4,433.4 | 3,285.5 | 2,768.3 | |||||||||||||||||||||
| Assets of discontinued operation | 333.8 | - | 0.2 | |||||||||||||||||||||
| Total Average Assets | $ | 60,227.8 | $ | 46,468.1 | $ | 45,411.7 | ||||||||||||||||||
| Liabilities | ||||||||||||||||||||||||
| Borrowings | ||||||||||||||||||||||||
| Deposits | $ | 26,356.2 | 1.41% | $ | 16,934.9 | 1.71% | $ | 14,223.6 | 1.66% | |||||||||||||||
| Borrowings | 18,258.3 | 4.10% | 16,540.3 | 4.67% | 18,430.3 | 4.69% | ||||||||||||||||||
| Total interest-bearing liabilities | 44,614.5 | 2.51% | 33,475.2 | 3.17% | 32,653.9 | 3.37% | ||||||||||||||||||
| Non-interest bearing deposits | 603.9 | |||||||||||||||||||||||
| Credit balances of factoring clients | 1,457.8 | 1,428.6 | 1,327.1 | |||||||||||||||||||||
| Other non-interest bearing liabilities | 3,054.0 | 2,776.7 | 2,674.4 | |||||||||||||||||||||
| Liabilities of discontinued operation | 432.0 | - | 0.2 | |||||||||||||||||||||
| Noncontrolling interests | 0.5 | 0.5 | 9.9 | |||||||||||||||||||||
| Stockholders' equity | 10,065.1 | 8,787.1 | 8,746.2 | |||||||||||||||||||||
| Total Average Liabilities and Stockholders' Equity | $ | 60,227.8 | $ | 46,468.1 | $ | 45,411.7 | ||||||||||||||||||
| Nine Months Ended | ||||||||||||||||||||||||
| September 30, 2015 | September 30, 2014 | |||||||||||||||||||||||
| Assets | ||||||||||||||||||||||||
| Interest bearing deposits | $ | 5,499.0 | 0.29% | $ | 5,138.7 | 0.35% | ||||||||||||||||||
| Securities purchased under agreements to resell | 535.0 | 0.57% | 110.0 | 0.48% | ||||||||||||||||||||
| Investments | 1,911.3 | 1.88% | 1,850.8 | 0.84% | ||||||||||||||||||||
| Loans (including held for sale) | ||||||||||||||||||||||||
| U.S. | 21,133.6 | 5.53% | 16,430.3 | 5.91% | ||||||||||||||||||||
| Non-U.S. | 2,118.3 | 9.13% | 3,471.3 | 8.61% | ||||||||||||||||||||
| Total Loans | 23,251.9 | 5.88% | 19,901.6 | 6.42% | ||||||||||||||||||||
| Total interest earning assets / interest income | 31,197.2 | 4.49% | 27,001.1 | 4.78% | ||||||||||||||||||||
| Operating lease equipment, net (including held for sale) | ||||||||||||||||||||||||
| U.S. | 7,923.0 | 8.93% | 7,678.0 | 8.77% | ||||||||||||||||||||
| Non-U.S. | 7,386.9 | 8.05% | 6,895.0 | 8.35% | ||||||||||||||||||||
| Total operating lease equipment, net | 15,309.9 | 8.50% | 14,573.0 | 8.57% | ||||||||||||||||||||
| Indemnification assets | 103.0 | 0.39% | - | - | ||||||||||||||||||||
| Total earning assets | 46,610.1 | 5.85% | 41,574.1 | 6.15% | ||||||||||||||||||||
| Non-interest earning assets | ||||||||||||||||||||||||
| Cash and due from banks | 1,282.5 | 974.5 | ||||||||||||||||||||||
| Allowance for loan losses | (350.4 | ) | (352.0 | ) | ||||||||||||||||||||
| All other non-interest bearing assets | 3,726.0 | 2,577.2 | ||||||||||||||||||||||
| Assets of discontinued operation | 112.5 | 1,517.3 | ||||||||||||||||||||||
| Total Average Assets | $ | 51,380.7 | $ | 46,291.1 | ||||||||||||||||||||
| Liabilities | ||||||||||||||||||||||||
| Borrowings | ||||||||||||||||||||||||
| Deposits | $ | 19,911.2 | 1.57% | $ | 13,544.9 | 1.65% | ||||||||||||||||||
| Borrowings | 17,527.6 | 4.43% | 18,566.0 | 4.61% | ||||||||||||||||||||
| Total interest-bearing liabilities | 37,438.8 | 2.91% | 32,110.9 | 3.36% | ||||||||||||||||||||
| Non-interest bearing deposits | 203.5 | |||||||||||||||||||||||
| Credit balances of factoring clients | 1,467.2 | 1,311.0 | ||||||||||||||||||||||
| Other non-interest bearing liabilities | 2,916.4 | 2,799.5 | ||||||||||||||||||||||
| Liabilities of discontinued operation | 145.6 | 1,296.4 | ||||||||||||||||||||||
| Noncontrolling interests | (1.3 | ) | 10.0 | |||||||||||||||||||||
| Stockholders' equity | 9,210.5 | 8,763.3 | ||||||||||||||||||||||
| Total Average Liabilities and Stockholders' Equity | $ | 51,380.7 | $ | 46,291.1 | ||||||||||||||||||||
18
CIT GROUP INC. AND SUBSIDIARIES
Select Accounts
(dollars in millions)
| Quarters Ended | ||||||||||||||||||||
| September 30, | June 30, | September 30, | Nine Months Ended September 30, | |||||||||||||||||
| 2015 | 2015 | 2014 | 2015 | 2014 | ||||||||||||||||
| OTHER INCOME | ||||||||||||||||||||
| Factoring commissions | $ | 30.9 | $ | 27.0 | $ | 31.1 | $ | 87.4 | $ | 88.0 | ||||||||||
| Gains on sales of leasing equipment | 30.7 | 21.5 | 22.0 | 84.2 | 46.4 | |||||||||||||||
| Fee revenues | 28.3 | 25.3 | 23.6 | 76.2 | 67.0 | |||||||||||||||
| Gains on investments | 2.0 | 3.8 | 5.3 | 6.5 | 14.4 | |||||||||||||||
| Loss on OREO sales | (3.2 | ) | - | - | (3.2 | ) | - | |||||||||||||
| (Loss) gains on loan and portfolio sales | (14.7 | ) | 2.1 | 9.8 | (6.0 | ) | 17.8 | |||||||||||||
| Net losses on derivatives and foreign currency exchange | (20.4 | ) | (5.0 | ) | (22.8 | ) | (35.1 | ) | (21.6 | ) | ||||||||||
| Impairment on assets held for sale | (23.6 | ) | (11.0 | ) | (54.1 | ) | (44.7 | ) | (69.5 | ) | ||||||||||
| Other revenues | 9.2 | (0.2 | ) | 9.3 | 23.8 | 46.5 | ||||||||||||||
| Total other income | $ | 39.2 | $ | 63.5 | $ | 24.2 | $ | 189.1 | $ | 189.0 | ||||||||||
| OPERATING EXPENSES | ||||||||||||||||||||
| Compensation and benefits | $ | (160.4 | ) | $ | (135.6 | ) | $ | (130.3 | ) | $ | (442.5 | ) | $ | (394.9 | ) | |||||
| Professional fees | (57.3 | ) | (20.8 | ) | (22.0 | ) | (97.6 | ) | (56.9 | ) | ||||||||||
| Technology | (29.9 | ) | (24.9 | ) | (21.2 | ) | (77.1 | ) | (63.1 | ) | ||||||||||
| Net occupancy expense | (14.8 | ) | (8.6 | ) | (9.1 | ) | (32.8 | ) | (26.5 | ) | ||||||||||
| Advertising and marketing | (7.4 | ) | (6.7 | ) | (7.5 | ) | (23.2 | ) | (23.7 | ) | ||||||||||
| Other expenses | (54.0 | ) | (36.8 | ) | (34.8 | ) | (126.0 | ) | (102.7 | ) | ||||||||||
| Operating expenses, before intangible assets amortization | (323.8 | ) | (233.4 | ) | (224.9 | ) | (799.2 | ) | (667.8 | ) | ||||||||||
| Provision for severance and facilities exiting activities | (5.1 | ) | (1.1 | ) | (9.2 | ) | (5.2 | ) | (24.7 | ) | ||||||||||
| Intangible assets amortization | (5.0 | ) | (0.5 | ) | (0.4 | ) | (6.1 | ) | (0.5 | ) | ||||||||||
| Total operating expenses | $ | (333.9 | ) | $ | (235.0 | ) | $ | (234.5 | ) | $ | (810.5 | ) | $ | (693.0 | ) | |||||
| September 30, | June 30, | December 31, | September 30, | |||||||||||||||||
| 2015* | 2015 | 2014 | 2014 | |||||||||||||||||
| TOTAL CASH AND INVESTMENT SECURITIES | ||||||||||||||||||||
| Total cash and deposits | $ | 8,259.9 | $ | 5,465.3 | $ | 7,119.7 | $ | 6,214.2 | ||||||||||||
| Securities purchased under agreements to resell | 100.0 | 750.0 | 650.0 | 650.0 | ||||||||||||||||
| Investment securities | 3,618.8 | 1,692.9 | 1,550.3 | 792.4 | ||||||||||||||||
| Total cash and investment securities | $ | 11,978.7 | $ | 7,908.2 | $ | 9,320.0 | $ | 7,656.6 | ||||||||||||
| OTHER ASSETS | ||||||||||||||||||||
| Current and deferred federal and state tax assets | $ | 1,216.7 | $ | 431.2 | $ | 483.5 | $ | 403.8 | ||||||||||||
| Deposits on commercial aerospace equipment | 810.7 | 816.9 | 736.3 | 693.0 | ||||||||||||||||
| Tax credit investments and investments in unconsolidated subsidiaries | 224.6 | 78.6 | 73.4 | 61.7 | ||||||||||||||||
| Property, furniture and fixtures | 200.2 | 144.4 | 126.4 | 127.8 | ||||||||||||||||
| Fair value of derivative financial instruments | 166.9 | 101.5 | 168.0 | 120.8 | ||||||||||||||||
| Deferred debt costs and other deferred charges | 131.7 | 126.8 | 148.1 | 153.4 | ||||||||||||||||
| Other real estate owned and repossessed assets | 127.9 | 2.6 | 0.8 | 0.7 | ||||||||||||||||
| Tax receivables, other than income taxes | 102.2 | 103.0 | 102.0 | 114.3 | ||||||||||||||||
| Other | 557.5 | 323.7 | 268.2 | 263.4 | ||||||||||||||||
| Total other assets | $ | 3,538.4 | $ | 2,128.7 | $ | 2,106.7 | $ | 1,938.9 | ||||||||||||
| OTHER LIABILITIES | ||||||||||||||||||||
| Equipment maintenance reserves | $ | 968.4 | $ | 982.5 | $ | 960.4 | $ | 941.2 | ||||||||||||
| Accrued expenses and accounts payable | 602.7 | 439.2 | 478.3 | 437.4 | ||||||||||||||||
| Current and deferred taxes payable | 384.9 | 345.6 | 319.1 | 264.4 | ||||||||||||||||
| Security and other deposits | 296.8 | 265.9 | 368.0 | 299.5 | ||||||||||||||||
| Accrued interest payable | 171.4 | 221.2 | 243.7 | 179.5 | ||||||||||||||||
| Valuation adjustment relating to aerospace commitments | 98.4 | 117.1 | 121.2 | 117.9 | ||||||||||||||||
| Other liabilities | 873.1 | 395.4 | 398.1 | 397.3 | ||||||||||||||||
| Total other liabilities | $ | 3,395.7 | $ | 2,766.9 | $ | 2,888.8 | $ | 2,637.2 | ||||||||||||
| * Preliminary | ||||||||||||||||||||
19
CIT GROUP INC. AND SUBSIDIARIES
Financing and Leasing Assets
(dollars in millions)
| September 30, | June 30, | December 31, | September 30, | |||||||||||||
| 2015 | 2015 | 2014 | 2014 | |||||||||||||
| North America Banking | ||||||||||||||||
| Commercial Banking | ||||||||||||||||
| Loans | $ | 10,235.0 | $ | 6,978.2 | $ | 6,889.9 | $ | 7,152.5 | ||||||||
| Operating lease equipment, net | - | - | - | 8.5 | ||||||||||||
| Assets held for sale | 413.0 | 88.3 | 22.8 | 85.3 | ||||||||||||
| Financing and leasing assets | 10,648.0 | 7,066.5 | 6,912.7 | 7,246.3 | ||||||||||||
| Commercial Real Estate | ||||||||||||||||
| Loans | 5,092.2 | 1,941.4 | 1,768.6 | 1,751.7 | ||||||||||||
| Equipment Finance | ||||||||||||||||
| Loans | 4,290.0 | 4,810.8 | 4,717.3 | 4,710.7 | ||||||||||||
| Operating lease equipment, net | 250.9 | 281.7 | 265.2 | 244.1 | ||||||||||||
| Assets held for sale | 569.5 | - | - | - | ||||||||||||
| Financing and leasing assets | 5,110.4 | 5,092.5 | 4,982.5 | 4,954.8 | ||||||||||||
| Commercial Services | ||||||||||||||||
| Loans - factoring receivables | 2,556.4 | 2,201.8 | 2,560.2 | 2,483.1 | ||||||||||||
| Consumer Banking | ||||||||||||||||
| Loans | 1,327.7 | - | - | - | ||||||||||||
| Assets held for sale | 8.1 | - | - | - | ||||||||||||
| Financing and leasing assets | 1,335.8 | - | - | - | ||||||||||||
| Total Segment | ||||||||||||||||
| Loans | 23,501.3 | 15,932.2 | 15,936.0 | 16,098.0 | ||||||||||||
| Operating lease equipment, net | 250.9 | 281.7 | 265.2 | 252.6 | ||||||||||||
| Assets held for sale | 990.6 | 88.3 | 22.8 | 85.3 | ||||||||||||
| Financing and leasing assets | 24,742.8 | 16,302.2 | 16,224.0 | 16,435.9 | ||||||||||||
| Transportation & International Finance | ||||||||||||||||
| Aerospace | ||||||||||||||||
| Loans | 1,705.6 | 1,739.6 | 1,796.5 | 1,664.4 | ||||||||||||
| Operating lease equipment, net | 9,045.2 | 8,816.7 | 8,949.5 | 9,216.6 | ||||||||||||
| Assets held for sale | 102.3 | 243.8 | 391.6 | 109.9 | ||||||||||||
| Financing and leasing assets | 10,853.1 | 10,800.1 | 11,137.6 | 10,990.9 | ||||||||||||
| Rail | ||||||||||||||||
| Loans | 129.0 | 124.7 | 130.0 | 120.1 | ||||||||||||
| Operating lease equipment, net | 6,242.1 | 6,010.8 | 5,715.2 | 5,708.7 | ||||||||||||
| Assets held for sale | 1.0 | 0.9 | 1.2 | 0.4 | ||||||||||||
| Financing and leasing assets | 6,372.1 | 6,136.4 | 5,846.4 | 5,829.2 | ||||||||||||
| Maritime Finance | ||||||||||||||||
| Loans | 1,470.9 | 1,274.4 | 1,006.7 | 839.5 | ||||||||||||
| Assets held for sale | 39.1 | 56.4 | 19.7 | - | ||||||||||||
| Financing and leasing assets | 1,510.0 | 1,330.8 | 1,026.4 | 839.5 | ||||||||||||
| International Finance | ||||||||||||||||
| Loans | - | 578.4 | 625.7 | 1,063.7 | ||||||||||||
| Operating lease equipment, net | - | 0.4 | 0.5 | 5.9 | ||||||||||||
| Assets held for sale | 905.5 | 404.4 | 402.7 | 354.4 | ||||||||||||
| Financing and leasing assets | 905.5 | 983.2 | 1,028.9 | 1,424.0 | ||||||||||||
| Total Segment | ||||||||||||||||
| Loans | 3,305.5 | 3,717.1 | 3,558.9 | 3,687.7 | ||||||||||||
| Operating lease equipment, net | 15,287.3 | 14,827.9 | 14,665.2 | 14,931.2 | ||||||||||||
| Assets held for sale | 1,047.9 | 705.5 | 815.2 | 464.7 | ||||||||||||
| Financing and leasing assets | 19,640.7 | 19,250.5 | 19,039.3 | 19,083.6 | ||||||||||||
| Legacy Consumer Mortgages | ||||||||||||||||
| Single Family Residential Mortgages | ||||||||||||||||
| Loans | 4,702.3 | - | - | - | ||||||||||||
| Assets held for sale | 21.2 | - | - | - | ||||||||||||
| Financing and leasing assets | 4,723.5 | - | - | - | ||||||||||||
| Reverse Mortgages | ||||||||||||||||
| Loans | 897.1 | - | - | - | ||||||||||||
| Assets held for sale | 15.7 | - | - | - | ||||||||||||
| Financing and leasing assets | 912.8 | - | - | - | ||||||||||||
| Total Segment | ||||||||||||||||
| Loans | 5,599.4 | - | - | - | ||||||||||||
| Assets held for sale | 36.9 | - | - | - | ||||||||||||
| Financing and leasing assets | 5,636.3 | - | - | - | ||||||||||||
| Non-Strategic Portfolios | ||||||||||||||||
| Loans | - | - | 0.1 | 0.1 | ||||||||||||
| Assets held for sale | 78.9 | 293.0 | 380.1 | 552.7 | ||||||||||||
| Financing and leasing assets | 78.9 | 293.0 | 380.2 | 552.8 | ||||||||||||
| Total financing and leasing assets | $ | 50,098.7 | $ | 35,845.7 | $ | 35,643.5 | $ | 36,072.3 | ||||||||
20
CIT GROUP INC. AND SUBSIDIARIES
Credit Metrics
(dollars in millions)
| Quarters Ended | ||||||||||||||||||||||||||||||||
| September 30, 2015 | June 30, 2015 | September 30, 2014 | ||||||||||||||||||||||||||||||
| Gross Charge-offs to Average Finance Receivables | ||||||||||||||||||||||||||||||||
| Transportation & International Finance(1) | $ | 28.3 | 2.97% | $ | 2.9 | 0.32% | $ | 4.5 | 0.52% | |||||||||||||||||||||||
| North America Banking(2) | 37.6 | 0.71% | 31.3 | 0.79% | 20.7 | 0.52% | ||||||||||||||||||||||||||
| Legacy Consumer Mortgages | 1.5 | 0.16% | - | - | - | - | ||||||||||||||||||||||||||
| Total CIT | $ | 67.4 | 0.94% | $ | 34.2 | 0.70% | $ | 25.2 | 0.52% | |||||||||||||||||||||||
| Nine Months Ended September 30, | ||||||||||||||||||||||||||||||||
| 2015 | 2014 | |||||||||||||||||||||||||||||||
| Transportation & International Finance(1) | $ | 34.4 | 1.27% | $ | 34.7 | 1.31% | ||||||||||||||||||||||||||
| North America Banking(2) | 92.3 | 0.70% | 56.5 | 0.50% | ||||||||||||||||||||||||||||
| Legacy Consumer Mortgages | 1.5 | 0.16% | - | - | ||||||||||||||||||||||||||||
| Non-Strategic Portfolios(3) | - | - | 7.5 | 5.04% | ||||||||||||||||||||||||||||
| Total CIT | $ | 128.2 | 0.76% | $ | 98.7 | 0.69% | ||||||||||||||||||||||||||
| Quarters Ended | ||||||||||||||||||||||||||||||||
| September 30, 2015 | June 30, 2015 | September 30, 2014 | ||||||||||||||||||||||||||||||
| Net Charge-offs to Average Finance Receivables | ||||||||||||||||||||||||||||||||
| Transportation & International Finance(1) | $ | 27.2 | 2.86% | $ | (2.7 | ) | (0.29% | ) | $ | 3.9 | 0.44% | |||||||||||||||||||||
| North America Banking(2) | 32.9 | 0.62% | 26.2 | 0.66% | 16.0 | 0.40% | ||||||||||||||||||||||||||
| Legacy Consumer Mortgages | 1.2 | 0.13% | - | - | - | - | ||||||||||||||||||||||||||
| Non-Strategic Portfolios(3) | - | - | - | - | (0.7 | ) | (4 | ) | ||||||||||||||||||||||||
| Total CIT | $ | 61.3 | 0.86% | $ | 23.5 | 0.48% | $ | 19.2 | 0.39% | |||||||||||||||||||||||
| Nine Months Ended September 30, | ||||||||||||||||||||||||||||||||
| 2015 | 2014 | |||||||||||||||||||||||||||||||
| Transportation & International Finance(1) | $ | 26.0 | 0.96% | $ | 30.0 | 1.13% | ||||||||||||||||||||||||||
| North America Banking(2) | 78.5 | 0.60% | 40.8 | 0.36% | ||||||||||||||||||||||||||||
| Legacy Consumer Mortgages | 1.2 | 0.13% | - | - | ||||||||||||||||||||||||||||
| Non-Strategic Portfolios(3) | - | - | 5.2 | 3.56% | ||||||||||||||||||||||||||||
| Total CIT | $ | 105.7 | 0.63% | $ | 76.0 | 0.53% | ||||||||||||||||||||||||||
| Non-accruing Loans to Finance Receivables(4) | September 30, 2015 | June 30, 2015 | December 31, 2014 | September 30, 2014 | ||||||||||||||||||||||||||||
| Transportation & International Finance | $ | 52.1 | 1.58% | $ | 57.8 | 1.55% | $ | 37.2 | 1.05% | $ | 41.8 | 1.13% | ||||||||||||||||||||
| North America Banking(2) | 156.3 | 0.67% | 111.0 | 0.70% | 100.9 | 0.63% | 134.1 | 0.83% | ||||||||||||||||||||||||
| Legacy Consumer Mortgages | 1.8 | 0.03% | - | - | - | - | - | - | ||||||||||||||||||||||||
| Non-Strategic Portfolios | 4.5 | (4 | ) | 29.2 | (4 | ) | 22.4 | (4 | ) | 25.2 | (4 | ) | ||||||||||||||||||||
| Total CIT | $ | 214.7 | 0.66% | $ | 198.0 | 1.01% | $ | 160.5 | 0.82% | $ | 201.1 | 1.02% | ||||||||||||||||||||
| PROVISION AND ALLOWANCE COMPONENTS | ||||||||||||||||||||||||||||||||
| Provision for Credit Losses | ||||||||||||||||||||||||||||||||
| Quarters Ended | ||||||||||||||||||||||||||||||||
| September 30, | June 30, | September 30, | Nine Months Ended September 30, | |||||||||||||||||||||||||||||
| 2015 | 2015 | 2014 | 2015 | 2014 | ||||||||||||||||||||||||||||
| Specific allowance - impaired loans | $ | 0.8 | $ | 2.7 | $ | 3.3 | $ | 5.9 | $ | (4.9 | ) | |||||||||||||||||||||
| Non-specific allowance | (12.2 | ) | (7.8 | ) | 15.7 | (8.7 | ) | 14.0 | ||||||||||||||||||||||||
| Net charge-offs | 61.3 | 23.5 | 19.2 | 105.7 | 76.0 | |||||||||||||||||||||||||||
| Totals | $ | 49.9 | $ | 18.4 | $ | 38.2 | $ | 102.9 | $ | 85.1 | ||||||||||||||||||||||
| Allowance for Loan Losses | ||||||||||||||||||||||||||||||||
| September 30, | June 30, | December 31, | September 30, | |||||||||||||||||||||||||||||
| 2015 | 2015 | 2014 | 2014 | |||||||||||||||||||||||||||||
| Specific allowance - impaired loans | $ | 18.3 | $ | 17.5 | $ | 12.4 | $ | 25.5 | ||||||||||||||||||||||||
| Non-specific allowance | 316.7 | 333.4 | 334.0 | 332.2 | ||||||||||||||||||||||||||||
| Totals | $ | 335.0 | $ | 350.9 | $ | 346.4 | $ | 357.7 | ||||||||||||||||||||||||
| Allowance for loan losses as a percentage of total finance receivables | 1.03% | 1.79% | 1.78% | 1.81% | ||||||||||||||||||||||||||||
| Allowance for loan losses as a percent of finance receivable/commercial | 1.31% | 1.79% | 1.78% | 1.81% | ||||||||||||||||||||||||||||
| Allowance for loan losses plus non-accretable discount as a percent of finance receivables (before the non-accretable discount)/commercial | 1.82% | 1.79% | 1.78% | 1.81% | ||||||||||||||||||||||||||||
| Allowance for loan losses as a percent of finance receivables/consumer | 11.27% | - | - | - | ||||||||||||||||||||||||||||
In certain instances, we use the term finance receivables synonymously with “Loans”, as presented on the balance sheet.
1) TIF charge-offs related to the transfer of receivables to assets held for sale for the quarter ended September 30, 2015 totaled $26 million, and was less than $1 million each of the first two quarters. TIF charge-offs for the nine months ended September 30, 2014 included $12 million, related to the transfer of receivables to assets held for sale.
2) NAB charge-offs for the quarters ended September 30, 2015 and June 30, 2015 included $14 million and $1 million, respectively, and $27 million year to date, related to the transfer of receivables to assets held for sale. For the quarter and nine months ended September 30, 2014, the respective amounts were $11 million and $17 million.
3) NSP charge-offs for the nine months ended September 30, 2015 included $7 million related to the transfer of receivables to assets held for sale.
4) Non-accrual loans include loans held for sale. NSP non-accrual loans reflected loans held for sale; since portfolio loans were insignificant, no % is displayed.
21
CIT GROUP INC. AND SUBSIDIARIES
Segment Results
(dollars in millions)
| Quarters Ended | ||||||||||||||||||||
| September 30, | June 30, | September 30, | Nine Months Ended September 30, | |||||||||||||||||
| 2015 | 2015 | 2014 | 2015 | 2014 | ||||||||||||||||
| North America Banking | ||||||||||||||||||||
| Total interest income | $ | 275.6 | $ | 199.0 | $ | 215.8 | $ | 670.7 | $ | 618.0 | ||||||||||
| Total interest expense | (72.2 | ) | (73.3 | ) | (74.2 | ) | (219.6 | ) | (211.2 | ) | ||||||||||
| Provision for credit losses | (46.9 | ) | (18.8 | ) | (29.7 | ) | (89.7 | ) | (55.5 | ) | ||||||||||
| Rental income on operating leases | 28.5 | 27.9 | 24.7 | 83.6 | 72.6 | |||||||||||||||
| Other income | 58.2 | 69.2 | 71.1 | 193.7 | 202.6 | |||||||||||||||
| Depreciation on operating lease equipment | (21.5 | ) | (21.1 | ) | (20.1 | ) | (63.3 | ) | (62.0 | ) | ||||||||||
| Operating expenses | (185.9 | ) | (135.4 | ) | (125.9 | ) | (456.0 | ) | (367.6 | ) | ||||||||||
| Income before provision for income taxes | $ | 35.8 | $ | 47.5 | $ | 61.7 | $ | 119.4 | $ | 196.9 | ||||||||||
| Funded new business volume | $ | 2,067.2 | $ | 1,630.5 | $ | 1,608.0 | $ | 5,051.8 | $ | 4,581.0 | ||||||||||
| Average Earning Assets | $ | 20,808.0 | $ | 15,396.7 | $ | 15,745.5 | $ | 17,154.5 | $ | 14,940.6 | ||||||||||
| Average Finance Receivables | $ | 21,204.1 | $ | 15,854.4 | $ | 16,009.3 | $ | 17,587.4 | $ | 15,221.6 | ||||||||||
| Transportation & International Finance | ||||||||||||||||||||
| Total interest income | $ | 73.8 | $ | 69.9 | $ | 68.8 | $ | 212.1 | $ | 217.7 | ||||||||||
| Total interest expense | (155.0 | ) | (164.9 | ) | (165.3 | ) | (488.5 | ) | (481.1 | ) | ||||||||||
| Provision for credit losses | (1.5 | ) | 0.4 | (9.1 | ) | (11.7 | ) | (29.8 | ) | |||||||||||
| Rental income on operating leases | 506.6 | 498.6 | 501.4 | 1,502.7 | 1,446.1 | |||||||||||||||
| Other income | 22.9 | 16.6 | 18.8 | 73.8 | 36.4 | |||||||||||||||
| Depreciation on operating lease equipment | (137.6 | ) | (136.7 | ) | (132.8 | ) | (410.4 | ) | (386.1 | ) | ||||||||||
| Maintenance and other operating lease expenses | (55.9 | ) | (49.4 | ) | (46.5 | ) | (151.4 | ) | (147.1 | ) | ||||||||||
| Operating expenses | (68.4 | ) | (77.6 | ) | (73.8 | ) | (227.8 | ) | (228.8 | ) | ||||||||||
| Income before provision for income taxes | $ | 184.9 | $ | 156.9 | $ | 161.5 | $ | 498.8 | $ | 427.3 | ||||||||||
| Funded new business volume | $ | 1,236.8 | $ | 825.8 | $ | 1,326.8 | $ | 2,587.8 | $ | 3,786.1 | ||||||||||
| Average Earning Assets | $ | 20,068.4 | $ | 20,155.6 | $ | 19,893.7 | $ | 20,143.9 | $ | 18,969.1 | ||||||||||
| Average Finance Receivables | $ | 3,806.2 | $ | 3,657.3 | $ | 3,432.7 | $ | 3,620.5 | $ | 3,535.8 | ||||||||||
| Legacy Consumer Mortgages | ||||||||||||||||||||
| Total interest income | $ | 62.8 | $ | - | $ | - | $ | 62.8 | $ | - | ||||||||||
| Total interest expense | (14.0 | ) | - | - | (14.0 | ) | - | |||||||||||||
| Provision for credit losses | (1.5 | ) | - | - | (1.5 | ) | - | |||||||||||||
| Other income | (0.9 | ) | - | - | (0.9 | ) | - | |||||||||||||
| Operating expenses | (16.9 | ) | - | - | (16.9 | ) | - | |||||||||||||
| Income before provision for income taxes | $ | 29.5 | $ | - | $ | - | $ | 29.5 | $ | - | ||||||||||
| Average Earning Assets | $ | 3,912.6 | $ | - | $ | - | $ | 1,318.5 | $ | - | ||||||||||
| Average Finance Receivables | $ | 3,637.0 | $ | - | $ | - | $ | 1,225.7 | $ | - | ||||||||||
| Non-Strategic Portfolios | ||||||||||||||||||||
| Total interest income | $ | 7.2 | $ | 10.2 | $ | 20.4 | $ | 29.7 | $ | 74.4 | ||||||||||
| Total interest expense | (6.1 | ) | (9.2 | ) | (18.6 | ) | (26.1 | ) | (66.5 | ) | ||||||||||
| Provision for credit losses | - | - | 0.7 | - | 0.4 | |||||||||||||||
| Rental income on operating leases | 4.2 | 5.2 | 8.9 | 15.3 | 27.8 | |||||||||||||||
| Other income | (21.8 | ) | (5.7 | ) | (47.1 | ) | (35.3 | ) | (38.8 | ) | ||||||||||
| Depreciation on operating lease equipment | - | - | (3.5 | ) | - | (14.4 | ) | |||||||||||||
| Operating expenses | (4.5 | ) | (10.9 | ) | (16.9 | ) | (27.8 | ) | (56.6 | ) | ||||||||||
| Loss before provision for income taxes | $ | (21.0 | ) | $ | (10.4 | ) | $ | (56.1 | ) | $ | (44.2 | ) | $ | (73.7 | ) | |||||
| Funded new business volume | $ | 14.2 | $ | 26.4 | $ | 64.7 | $ | 78.3 | $ | 180.6 | ||||||||||
| Average Earning Assets | $ | 312.3 | $ | 464.6 | $ | 1,027.4 | $ | 430.1 | $ | 1,324.3 | ||||||||||
| Average Finance Receivables | $ | - | $ | - | $ | 0.1 | $ | - | $ | 196.5 | ||||||||||
| Corporate and Other | ||||||||||||||||||||
| Total interest income | $ | 18.3 | $ | 4.7 | $ | 3.3 | $ | 27.2 | $ | 10.2 | ||||||||||
| Total interest expense | (33.0 | ) | (17.8 | ) | (17.1 | ) | (68.6 | ) | (50.5 | ) | ||||||||||
| Provision for credit losses | - | - | (0.1 | ) | - | (0.2 | ) | |||||||||||||
| Other income | (19.2 | ) | (16.6 | ) | (18.6 | ) | (42.2 | ) | (11.2 | ) | ||||||||||
| Operating expenses | (58.2 | ) | (11.1 | ) | (17.9 | ) | (82.0 | ) | (40.0 | ) | ||||||||||
| Loss on debt extinguishments | (0.3 | ) | (0.1 | ) | - | (0.4 | ) | (0.4 | ) | |||||||||||
| Loss before provision for income taxes | $ | (92.4 | ) | $ | (40.9 | ) | $ | (50.4 | ) | $ | (166.0 | ) | $ | (92.1 | ) | |||||
| Average Earning Assets | $ | 7,346.8 | $ | 5,142.4 | $ | 4,307.2 | $ | 6,095.9 | $ | 5,032.4 | ||||||||||
| Total CIT | ||||||||||||||||||||
| Total interest income | $ | 437.7 | $ | 283.8 | $ | 308.3 | $ | 1,002.5 | $ | 920.3 | ||||||||||
| Total interest expense | (280.3 | ) | (265.2 | ) | (275.2 | ) | (816.8 | ) | (809.3 | ) | ||||||||||
| Provision for credit losses | (49.9 | ) | (18.4 | ) | (38.2 | ) | (102.9 | ) | (85.1 | ) | ||||||||||
| Rental income on operating leases | 539.3 | 531.7 | 535.0 | 1,601.6 | 1,546.5 | |||||||||||||||
| Other income | 39.2 | 63.5 | 24.2 | 189.1 | 189.0 | |||||||||||||||
| Depreciation on operating lease equipment | (159.1 | ) | (157.8 | ) | (156.4 | ) | (473.7 | ) | (462.5 | ) | ||||||||||
| Maintenance and other operating lease expenses | (55.9 | ) | (49.4 | ) | (46.5 | ) | (151.4 | ) | (147.1 | ) | ||||||||||
| Operating expenses / loss on debt extinguishment | (334.2 | ) | (235.1 | ) | (234.5 | ) | (810.9 | ) | (693.4 | ) | ||||||||||
| Income from continuing operations before provision for income taxes | $ | 136.8 | $ | 153.1 | $ | 116.7 | $ | 437.5 | $ | 458.4 | ||||||||||
| Funded new business volume | $ | 3,318.2 | $ | 2,482.7 | $ | 2,999.5 | $ | 7,717.9 | $ | 8,547.7 | ||||||||||
| Average Earning Assets | $ | 52,448.1 | $ | 41,159.3 | $ | 40,973.8 | $ | 45,142.9 | $ | 40,266.4 | ||||||||||
| Average Finance Receivables | $ | 28,647.3 | $ | 19,511.7 | $ | 19,442.1 | $ | 22,433.6 | $ | 18,953.9 | ||||||||||
22
CIT GROUP INC. AND SUBSIDIARIES
Segment Margin
(dollars in millions)
| Quarters Ended | ||||||||||||||||||||
| September 30, | June 30, | September 30, | Nine Months Ended September 30, | |||||||||||||||||
| 2015 | 2015 | 2014 | 2015 | 2014 | ||||||||||||||||
| North America Banking | ||||||||||||||||||||
| Average Earning Assets (AEA) | ||||||||||||||||||||
| Commercial Banking | $ | 9,456.9 | $ | 7,031.7 | $ | 7,430.5 | $ | 7,835.4 | $ | 7,334.8 | ||||||||||
| Commercial Real Estate | 3,993.9 | 1,860.6 | 1,727.4 | 2,552.9 | 1,660.3 | |||||||||||||||
| Equipment Finance | 5,657.4 | 5,568.2 | 5,539.7 | 5,585.5 | 4,925.6 | |||||||||||||||
| Commercial Services | 833.0 | 936.2 | 1,047.9 | 888.6 | 1,019.9 | |||||||||||||||
| Consumer Banking | 866.8 | - | - | 292.1 | - | |||||||||||||||
| Gross yield | ||||||||||||||||||||
| Commercial Banking | 4.86% | 4.43% | 5.15% | 4.60% | 5.21% | |||||||||||||||
| Commercial Real Estate | 5.09% | 4.00% | 4.30% | 4.54% | 4.14% | |||||||||||||||
| Equipment Finance | 8.47% | 8.61% | 8.03% | 8.52% | 8.49% | |||||||||||||||
| Commercial Services | 5.22% | 4.53% | 5.76% | 4.83% | 5.06% | |||||||||||||||
| Consumer Banking | 3.58% | - | - | 3.55% | - | |||||||||||||||
| Total | ||||||||||||||||||||
| AEA | $ | 20,808.0 | $ | 15,396.7 | $ | 15,745.5 | $ | 17,154.5 | $ | 14,940.6 | ||||||||||
| Gross yield | 5.85% | 5.89% | 6.11% | 5.86% | 6.16% | |||||||||||||||
| Net Finance Margin | 4.04% | 3.44% | 3.71% | 3.66% | 3.72% | |||||||||||||||
| Transportation & International Finance | ||||||||||||||||||||
| Average Earning Assets (AEA) | ||||||||||||||||||||
| Aerospace | $ | 11,251.2 | $ | 11,643.3 | $ | 11,658.7 | $ | 11,614.1 | $ | 11,017.5 | ||||||||||
| Rail | 6,314.7 | 6,115.3 | 5,855.8 | 6,123.3 | 5,572.8 | |||||||||||||||
| Maritime Finance | 1,443.3 | 1,198.5 | 702.9 | 1,234.7 | 589.4 | |||||||||||||||
| International Finance | 1,059.2 | 1,198.5 | 1,676.3 | 1,171.8 | 1,789.4 | |||||||||||||||
| Gross yield | ||||||||||||||||||||
| Aerospace | 10.98% | 10.41% | 10.87% | 10.58% | 11.33% | |||||||||||||||
| Rail | 14.50% | 14.65% | 14.41% | 14.58% | 14.34% | |||||||||||||||
| Maritime Finance | 5.04% | 5.12% | 5.00% | 5.04% | 5.11% | |||||||||||||||
| International Finance | 9.25% | 8.77% | 8.08% | 8.77% | 7.91% | |||||||||||||||
| Total | ||||||||||||||||||||
| AEA | $ | 20,068.4 | $ | 20,155.6 | $ | 19,893.7 | $ | 20,143.9 | $ | 18,969.1 | ||||||||||
| Gross yield | 11.57% | 11.28% | 11.46% | 11.35% | 11.69% | |||||||||||||||
| Net Finance Margin | 4.62% | 4.32% | 4.54% | 4.40% | 4.57% | |||||||||||||||
| Legacy Consumer Mortgages | ||||||||||||||||||||
| Average Earning Assets (AEA) | ||||||||||||||||||||
| Single Family Residential Mortgages | $ | 3,321.9 | $ | - | $ | - | $ | 1,119.5 | $ | - | ||||||||||
| Reverse Mortgages | 590.7 | - | - | 199.0 | - | |||||||||||||||
| Gross yield | ||||||||||||||||||||
| Single Family Residential Mortgages | 5.68% | - | - | 5.61% | - | |||||||||||||||
| Reverse Mortgages | 10.59% | - | - | 10.47% | - | |||||||||||||||
| Total | ||||||||||||||||||||
| AEA | $ | 3,912.6 | $ | - | $ | - | $ | 1,318.5 | $ | - | ||||||||||
| Gross yield | 6.42% | - | - | 6.35% | - | |||||||||||||||
| Net Finance Margin | 4.99% | - | - | 4.94% | - | |||||||||||||||
Gross Yield includes interest income and rental income as a % of AEA.
Net Finance Margin (NFM) reflects Net Finance Revenue divided by AEA.
23
CIT GROUP INC. AND SUBSIDIARIES
Non-GAAP Disclosures
(dollars in millions)
Non-GAAP financial measures disclosed by management are meant to provide additional information and insight relative to business trends to investors and, in certain cases, to present financial information as measured by rating agencies and other users of financial information. These measures are not in accordance with, or a substitute for, GAAP and may be different from, or inconsistent with, non-GAAP financial measures used by other companies.
| Quarters Ended | ||||||||||||||||||||
| September 30, | June 30, | September 30, | Nine Months Ended September 30, | |||||||||||||||||
| Total Net Revenues(1) | 2015 | 2015 | 2014 | 2015 | 2014 | |||||||||||||||
| Interest income | $ | 437.7 | $ | 283.8 | $ | 308.3 | $ | 1,002.5 | $ | 920.3 | ||||||||||
| Rental income on operating leases | 539.3 | 531.7 | 535.0 | 1,601.6 | 1,546.5 | |||||||||||||||
| Finance revenue | 977.0 | 815.5 | 843.3 | 2,604.1 | 2,466.8 | |||||||||||||||
| Interest expense | (280.3 | ) | (265.2 | ) | (275.2 | ) | (816.8 | ) | (809.3 | ) | ||||||||||
| Depreciation on operating lease equipment | (159.1 | ) | (157.8 | ) | (156.4 | ) | (473.7 | ) | (462.5 | ) | ||||||||||
| Maintenance and other operating lease expenses | (55.9 | ) | (49.4 | ) | (46.5 | ) | (151.4 | ) | (147.1 | ) | ||||||||||
| Net finance revenue (NFR) | 481.7 | 343.1 | 365.2 | 1,162.2 | 1,047.9 | |||||||||||||||
| Other income | 39.2 | 63.5 | 24.2 | 189.1 | 189.0 | |||||||||||||||
| Total net revenues | $ | 520.9 | $ | 406.6 | $ | 389.4 | $ | 1,351.3 | $ | 1,236.9 | ||||||||||
| NFR as a % of AEA | 3.67% | 3.33% | 3.57% | 3.43% | 3.47% | |||||||||||||||
| Net Operating Lease Revenues(2) | ||||||||||||||||||||
| Rental income on operating leases | $ | 539.3 | $ | 531.7 | $ | 535.0 | $ | 1,601.6 | $ | 1,546.5 | ||||||||||
| Depreciation on operating lease equipment | (159.1 | ) | (157.8 | ) | (156.4 | ) | (473.7 | ) | (462.5 | ) | ||||||||||
| Maintenance and other operating lease expenses | (55.9 | ) | (49.4 | ) | (46.5 | ) | (151.4 | ) | (147.1 | ) | ||||||||||
| Net operating lease revenue | $ | 324.3 | $ | 324.5 | $ | 332.1 | $ | 976.5 | $ | 936.9 | ||||||||||
| September 30, | June 30, | December 31, | September 30, | |||||||||||||||||
| Earning Assets(3) | 2015 | 2015 | 2014 | 2014 | ||||||||||||||||
| Loans | $ | 32,406.2 | $ | 19,649.3 | $ | 19,495.0 | $ | 19,785.8 | ||||||||||||
| Operating lease equipment, net | 15,538.2 | 15,109.6 | 14,930.4 | 15,183.8 | ||||||||||||||||
| Assets held for sale | 2,154.3 | 1,086.8 | 1,218.1 | 1,102.7 | ||||||||||||||||
| Credit balances of factoring clients | (1,609.3 | ) | (1,373.3 | ) | (1,622.1 | ) | (1,433.2 | ) | ||||||||||||
| Interest bearing cash | 6,606.3 | 4,224.8 | 6,241.2 | 5,322.0 | ||||||||||||||||
| Investment securities | 3,618.8 | 1,692.9 | 1,550.3 | 792.4 | ||||||||||||||||
| Securities purchased under agreements to resell | 100.0 | 750.0 | 650.0 | 650.0 | ||||||||||||||||
| Indemnification assets | 465.0 | - | - | - | ||||||||||||||||
| Total earning assets | $ | 59,279.5 | $ | 41,140.1 | $ | 42,462.9 | $ | 41,403.5 | ||||||||||||
| Average Earning Assets (for the respective quarters) | $ | 52,448.1 | $ | 41,159.3 | $ | 41,935.7 | $ | 40,973.8 | ||||||||||||
| Quarters Ended | ||||||||||||||||||||
| September 30, | June 30, | September 30, | Nine Months Ended September 30, | |||||||||||||||||
| Adjusted Operating Expenses | 2015 | 2015 | 2014 | 2015 | 2014 | |||||||||||||||
| Operating expenses | $ | (333.9 | ) | $ | (235.0 | ) | $ | (234.5 | ) | $ | (810.5 | ) | $ | (693.0 | ) | |||||
| Provision for severance and facilities exiting activities | 5.1 | 1.1 | 9.2 | 5.2 | 24.7 | |||||||||||||||
| Intangible amortization | 5.0 | 0.5 | 0.4 | 6.1 | 0.5 | |||||||||||||||
| Operating expenses exclusive of restructuring costs and intangible amortization(4) | $ | (323.8 | ) | $ | (233.4 | ) | $ | (224.9 | ) | $ | (799.2 | ) | $ | (667.8 | ) | |||||
| Operating expenses (exclusive of restructuring costs and intangible amortization) as a % of AEA | (2.47% | ) | (2.27% | ) | (2.20% | ) | (2.36% | ) | (2.21% | ) | ||||||||||
| Total Net Revenue | $ | 520.9 | $ | 406.6 | $ | 389.4 | $ | 1,351.3 | $ | 1,236.9 | ||||||||||
| Operating expenses exclusive of restructuring costs and intangible amortization(4) | $ | (323.8 | ) | $ | (233.4 | ) | $ | (224.9 | ) | $ | (799.2 | ) | $ | (667.8 | ) | |||||
| Net Efficiency Ratio(5) | 62.2% | 57.4% | 57.8% | 59.1% | 54.0% | |||||||||||||||
| September 30, | June 30, | December 31, | September 30, | |||||||||||||||||
| 2015 | 2015 | 2014 | 2014 | |||||||||||||||||
| Continuing Operations Total Assets(6) | ||||||||||||||||||||
| Total Assets | $ | 68,125.5 | $ | 46,657.2 | $ | 47,880.0 | $ | 46,481.0 | ||||||||||||
| Assets of discontinued operation | 513.8 | - | - | - | ||||||||||||||||
| Continuing operations total assets | $ | 67,611.7 | $ | 46,657.2 | $ | 47,880.0 | $ | 46,481.0 | ||||||||||||
| September 30, | June 30, | December 31, | September 30, | |||||||||||||||||
| Tangible Book Value(7) | 2015 | 2015 | 2014 | 2014 | ||||||||||||||||
| Total common stockholders' equity | $ | 10,798.7 | $ | 8,807.1 | $ | 9,068.9 | $ | 9,005.2 | ||||||||||||
| Less: Goodwill | (1,135.1 | ) | (565.9 | ) | (571.3 | ) | (557.3 | ) | ||||||||||||
| Intangible assets | (201.3 | ) | (21.4 | ) | (25.7 | ) | (33.5 | ) | ||||||||||||
| Tangible book value | $ | 9,462.3 | $ | 8,219.8 | $ | 8,471.9 | $ | 8,414.4 | ||||||||||||
(1) Total net revenues are the combination of net finance revenue and other income and is an aggregation of all sources of revenue for the Company. Total net revenues are used by management to monitor business performance.
(2) Total net operating lease revenues are the combination of rental income on operating leases less depreciation on operating lease equipment and maintenance and other operating lease expenses. Total net operating lease revenues are used by management to monitor portfolio performance.
(3) Earning assets are utilized in certain revenue and earnings ratios. Earning assets are net of credit balances of factoring clients. This net amount represents the amounts we fund.
(4) Operating expenses exclusive of restructuring costs and intangible amortization is a non-GAAP measure used by management to compare period over period expenses.
(5) Net efficiency ratio is a non-GAAP measurement used by management to to measure operating expenses (before restructuring costs and intangible amortization) to the level of total net revenues.
(6) Total assets from continuing operations is a non-GAAP measurement used by management to analyze the total asset change on a more consistent basis.
(7) Tangible book value is a non-GAAP measure, which represents an adjusted common shareholders’ equity balance that has been reduced by goodwill and intangible assets. Tangible book value is used to compute a per common share amount, which is used to evaluate our use of equity.
Exhibit 99.2

Third Quarter 2015 Financial Results November 3, 2015
1 Important Notices This presentation contains forward - looking statements within the meaning of applicable federal securities laws that are based upon our current expectations and assumptions concerning future events, which are subject to a number of risks and uncertainties that could cause actual results to differ materially from those anticipated . The words “expect,” “anticipate,” “estimate,” “forecast,” “initiative,” “objective,” “plan,” “goal,” “project,” “outlook,” “priorities,” “target,” “intend,” “evaluate,” “pursue,” “commence,” “seek,” “may,” “would,” “could,” “should,” “believe,” “potential,” and “continue,” or the negative of any of those words or similar expressions are intended to identify forward - looking statements . All statements contained in this presentation, other than statements of historical fact, including without limitation, statements about our plans, strategies, prospects and expectations regarding future events and our financial performance, are forward - looking statements that involve certain risks and uncertainties . While these statements represent our current judgment on what the future may hold, and we believe these judgments are reasonable, these statements are not guarantees of any events or financial results, and our actual results may differ materially . Important factors that could cause our actual results to be materially different from our expectations include, among others, the risk that CIT is unsuccessful in implementing its strategy and business plan, the risk that CIT is unable to react to and address key business and regulatory issues, the risk that CIT is unable to achieve the projected revenue growth from its new business initiatives or the projected expense reductions from efficiency improvements, and the risk that CIT becomes subject to liquidity constraints and higher funding costs . We describe these and other risks that could affect our results in Item 1 A, “Risk Factors,” of our latest Annual Report on Form 10 - K for the year ended December 31 , 2014 , which was filed with the Securities and Exchange Commission . Accordingly, you should not place undue reliance on the forward - looking statements contained in this presentation . These forward - looking statements speak only as of the date on which the statements were made . CIT undertakes no obligation to update publicly or otherwise revise any forward - looking statements, except where expressly required by law . This presentation is to be used solely as part of CIT management’s continuing investor communications program . This presentation shall not constitute an offer or solicitation in connection with any securities . | 3Q15 Earnings

2 Continue Executing on Our Priorities ▪ OneWest acquisition closed on August 3, 2015 ▪ Commercial credit reserve (1) of 1.8% of finance receivables ▪ Portfolio assets grew 40% both from a year ago and prior quarter, reflecting $14 billion of acquired OneWest financing and leasing assets; Nearly 65% of financing and leasing assets are in the bank ▪ Deposits now exceed 60% of total funding; interest cost down 70 bps from prior quarter ▪ Cash and investment portfolio positioned to benefit from a rise in interest rates ▪ Returned nearly $170 million of capital to shareholders through dividends and the repurchase of 3.0 million shares in 3Q Expand Commercial Banking Franchise Maintain Strong Risk Management Practices Grow Business Franchises Realize Embedded Value Return Excess Capital | 3Q15 Earnings (1) Commercial allowance for loan losses plus non - accretable discount as % of commercial finance receivables (before the non - accretable discount).
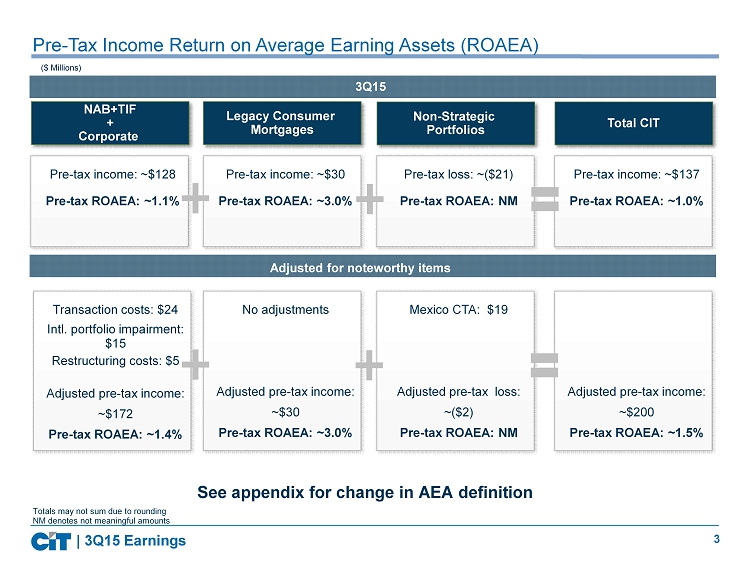
3 Pre - Tax Income Return on Average Earning Assets (ROAEA) Totals may not sum due to rounding NM denotes not meaningful amounts ($ Millions) NAB+TIF + Corporate Non - Strategic Portfolios Total CIT 3Q15 Pre - tax income: ~$128 Pre - tax ROAEA: ~1.1% Pre - tax loss: ~($21) Pre - tax ROAEA: NM Pre - tax income: ~$137 Pre - tax ROAEA: ~1.0% | 3Q15 Earnings Legacy Consumer Mortgages Pre - tax income: ~$30 Pre - tax ROAEA: ~3.0% Adjusted for noteworthy items Transaction costs: $24 Intl. portfolio impairment: $15 Restructuring costs: $5 Adjusted pre - tax income: ~$172 Pre - tax ROAEA: ~1.4% Mexico CTA: $ 1 9 Adjusted pre - tax loss: ~($2) Pre - tax ROAEA: NM No adjustments Adjusted pre - tax income: ~$30 Pre - tax ROAEA: ~3.0% Adjusted pre - tax income: ~$200 Pre - tax ROAEA: ~1.5% See appendix for change in AEA definition
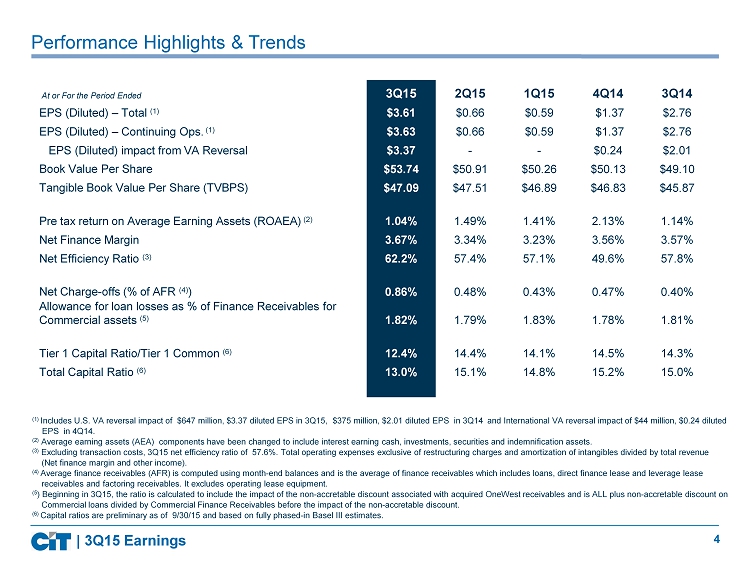
4 (1) Includes U.S . VA reversal impact of $647 million, $3.37 diluted EPS in 3Q15, $375 million, $2.01 diluted EPS in 3Q14 and International VA reversal impact of $4 4 million, $0.24 diluted EPS in 4Q14. (2) Average earning assets (AEA) components have been changed to include interest earning cash, investments, securities and indemnification assets. (3) Excluding transaction costs, 3Q15 net efficiency ratio of 57.6%. Total operating expenses exclusive of restructuring charges and amortization of intangibles divided by total revenue (Net finance margin and other income). (4) Average finance receivables (AFR) is computed using month - end balances and is the average of finance receivables which includes loans, direct finance lease and leverage lease receivables and factoring receivables. It excludes operating lease equipment. (5 ) Beginning in 3Q15 , the ratio is calculated to include the impact of the non - accretable discount associated with acquired OneWest receivables and is ALL plus non - accretable discount on Commercial loans divided by Commercial Finance Receivables before the impact of the non - accretable discount. (6) Capital ratios are preliminary as of 9/30/15 and based on fully phased - in Basel III estimates. At or For the Period Ended 3Q15 2Q15 1Q15 4Q14 3Q14 EPS (Diluted) – Total (1) $3.61 $0.66 $0.59 $1.37 $2.76 EPS (Diluted) – Continuing Ops. (1) $3.63 $0.66 $0.59 $1.37 $2.76 EPS (Diluted) impact from VA Reversal $3.37 - - $0.24 $2.01 Book Value Per Share $53.74 $50.91 $50.26 $50.13 $49.10 Tangible Book Value Per Share (TVBPS) $47.09 $47.51 $46.89 $46.83 $45.87 Pre tax return on Average Earning Assets (ROAEA) (2) 1.04% 1.49% 1.41% 2.13% 1.14% Net Finance Margin 3.67% 3.34% 3.23% 3.56% 3.57% Net Efficiency Ratio (3) 62.2% 57.4% 57.1% 49.6% 57.8% Net Charge - offs (% of AFR (4) ) 0.86% 0.48% 0.43% 0.47% 0.40% Allowance for loan losses as % of Finance Receivables for Commercial assets (5) 1.82% 1.79% 1.83% 1.78% 1.81% Tier 1 Capital Ratio/Tier 1 Common (6) 12.4% 14.4% 14.1% 14.5% 14.3% Total Capital Ratio (6) 13.0% 15.1% 14.8% 15.2% 15.0% Performance Highlights & Trends | 3Q15 Earnings

5 ($ Millions, except per share data) Results Reflect Several Items Items in 3Q15 Results Reported Diluted EPS (Continuing) $3.63 Impact Segment Item Line Item Total Pre - tax After tax Per share Corporate U.S. VA reversal Tax Provision - $647 $3.37 Corporate Discrete tax items Tax Provision - ($56) ($0.29) Corporate Transaction costs Operating Expenses ($24) ($15) ($0.08) NAB International portfolio impairment Other Income ($15) ($15) ($0.08) NSP CTA (1) on Mexico platform sale Other Income ($19) ($14) ($0.07) Corporate Restructuring Operating Expenses ($5) ($3) ($0.02) EPS based on 191.8 million average diluted shares outstanding, $ impacts are rounded | 3Q15 Earnings (1) Currency translation adjustment

6 3Q15 Earnings Reflect Impact of OneWest Acquisition | 3Q15 Earnings Actual 3Q15 Est. OW Impact 3Q15 CIT (Excl. OW Est. Impact 3Q15 Actual 2Q15 Interest Income 438 149 289 284 Rental Income on operating leases 539 - 539 532 Interest expense (280) (15) (266) (265) Depreciation on operating lease equipment (159) - (159) (158) Maintenance and other operating lease expenses (56) - (56) (49) Net finance revenue 482 134 347 343 Other income 39 3 36 64 Provision for credit losses (50) (21) (29) (18) Operating expenses including loss on extinguishment of debt (334) (67) (267) (235) Pre - tax income from continuing operations 137 49 88 153 Adjusted pre - tax income from continuing operations (1) 200 49 151 153 ($ Millions) (1) CIT 3Q15 adjustments include; transaction costs of $24 million, CTA on Mexico platform sale of $19 million, International portfolio impairment of $15 million and restructuring costs of $5 million. Results include two months of OneWest activity which reflected an elevated credit provision Totals may not sum due to rounding

7 ▪ Net Finance Revenue reflects increase in earning assets from OneWest acquisition ▪ Other items include purchase accounting accretion based on unpaid principal balance of the loans (vs. OneWest’s carrying value) ▪ Increase in Net Finance Margin from prior quarter reflects: + ~60bps benefit from lower funding costs primarily related to OneWest acquisition + ~ 15bps benefit from reduction in low yielding investments - ~35bps reduction from lower yielding OneWest portfolio Note: See appendix for change in definition of AEA which impacted the NFM ratio 343 347 329 335 421 3.57% 3.56% 3.23% 3.34% 3.67% 3Q14 4Q14 1Q15 2Q15 3Q15 Net Finance Revenue less other items Other Items NFM Net Finance Margin ($ Millions) Yield Analysis (2) 3Q15 2Q15 3Q14 bps 2Q15 bps 3Q14 Interest bearing deposits and investments 1.06% 0.51% 0.51% 55bps 55bps Loans 5.95 5.83 6.36 12 (42) Operating leases (net) 8.40 8.49 8.75 (9) (35) Indemnification asset 0.38 - - 38 38 Earning assets 5.81 5.91 6.29 (10) (48) Deposits 1.38 1.71 1.66 (33) (28) Borrowings 4.10 4.67 4.69 (57) (59) Interest - bearing liabilities 2.48 3.17 3.37 (69) (89) | 3Q15 Earnings Net Finance Revenue & Net Finance Margin 365 373 337 343 482 (1) Other items include suspended depreciation, interest recoveries/ prepayments and other loan and debt FSA. 3Q15 other items also includes purchase accounting accretion. (2) More detail is available in the average balance sheet within the third quarter 2015 press release. (1) Highlights
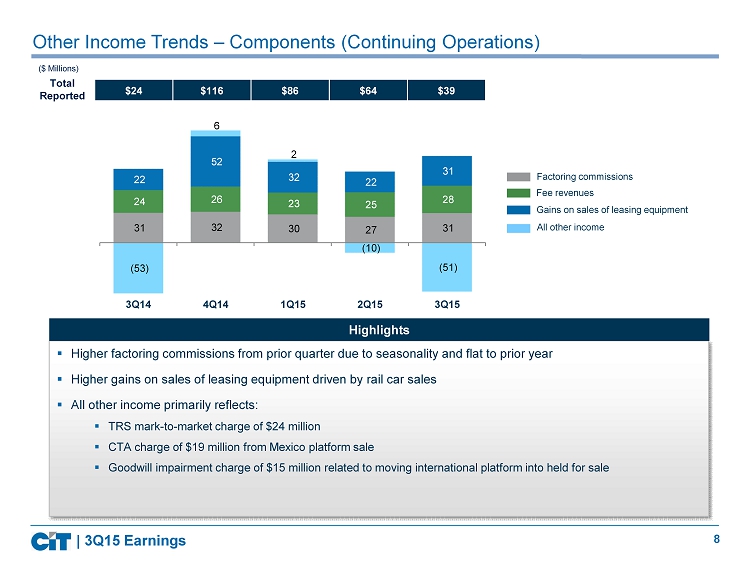
8 31 32 30 27 31 24 26 23 25 28 22 52 32 22 31 (53) 6 2 (10) (51) -55 -30 -5 20 45 70 95 120 145 Other Income Trends – Components (Continuing Operations) Factoring commissions Fee revenues Gains on sales of leasing equipment All other income ($ Millions) 3 Q14 1 Q15 2Q 15 3 Q15 4 Q14 Total Reported | 3Q15 Earnings ▪ Higher factoring commissions from prior quarter due to seasonality and flat to prior year ▪ Higher gains on sales of leasing equipment driven by rail car sales ▪ All other income primarily reflects: ▪ TRS mark - to - market charge of $24 million ▪ CTA charge of $19 million from Mexico platform sale ▪ Goodwill impairment charge of $15 million related to moving international platform into held for sale Highlights $24 $116 $86 $64 $39

9 Asset Quality Trends – ( Continuing Operations) ($ Millions) 201 161 184 198 215 0.4% 0.5% 0.4% 0.5% 0.9% 0.0% 0.3% 0.6% 0.9% 1.2% 1.5% 0 50 100 150 200 250 3Q14 4Q14 1Q15 2Q15 3Q15 Non-accrual Loans Net Charge-offs % to AFR 358 346 357 351 334 129 1.8% 1.8% 1.8% 1.8% 1.3% 1.8% 0.0% 0.5% 1.0% 1.5% 2.0% 0 100 200 300 400 500 3Q14 4Q14 1Q15 2Q15 3Q15 Non-accretable Allowance for Loan Losses (ALL) ALL % to FR ALL + non-accretable % to FR before non-accretable (1) (1) 3Q15, 2Q15, 1Q15, 4Q14 and 3Q14 include approximately$40 million, $ 2 million, $11 million, $7 million and $11 million respectively, of charge - offs related to the transfer of loans to held for sale; exclusive of these charge - offs, net charge - offs as a % to AFR would have been 17bps, 44 bps, 20 bps, 34 bps and 17 bps respectively. | 3Q15 Earnings Non - accrual Loans & Net Charge - offs Allowance for Loan Losses - Commercial ▪ Higher net charge - offs primarily due to receivables transferred to assets held for sale ▪ Non - accrual balances increased from a few loans in NAB ▪ Allowance for loan losses declined due to non - specific reserves related to assets transferred to held for sale. ▪ ALL as a % of finance receivables on commercial loans declined to 1.3% reflecting assets acquired from OneWest at fair value with no related allowance ▪ Including the non - accretable discount, ALL as a % of finance receivables is 1.8% Highlights

10 Restructuring Charges All Other Operating Expenses Costs Related to OneWest Acquisition Amortization of Intangibles 223 241 237 226 292 235 252 242 235 334 0 50 100 150 200 250 300 350 400 3Q14 4Q14 1Q15 2Q15 3Q15 Operating Expenses Trends – (Continuing Operations) ($ Millions) (1) 3Q15, 2Q15,1Q15,4Q14,and 3Q14 include approximately $32 million, $7 million, $ 5 million, $4 million, and $ 2 million, respectively, of costs related to OneWest acquisition. (2) Total operating expenses exclusive of restructuring charges and amortization of intangibles divided by total revenue (Net finance margin and other income). (1) | 3Q15 Earnings ▪ Higher operating expenses driven by: ▪ OneWest additional expenses of ~$67 million for two months ▪ Higher FDIC insurance costs resulting from the acquisition ▪ Costs associated with OneWest Bank acquisition include $24 million of transaction costs ▪ Excluding transaction costs, net efficiency ratio of 57.6% in 3Q15 Highlights 57.8% 49.6% 57.1% 57.4% 62.2% Net Efficiency Ratio (2)

11 226 233 215 218 232 4.5% 4.5% 4.3% 4.3% 4.6% 3Q14 4Q14 1Q15 2Q15 3Q15 Net Finance Revenue NFM 162 185 157 157 185 3.2% 3.6% 3.1% 3.1% 3.7% 3Q14 4Q14 1Q15 2Q15 3Q15 Pre-tax Income PTI- ROAEA Transportation & International Finance Trends 19.9 20.5 20.2 20.2 20.1 3Q14 4Q14 1Q15 2Q15 3Q15 ($ Millions) ($ Billions) | 3Q15 Earnings Pre - tax Income & ROAEA Average Earning Assets Net Finance Revenue & Net Finance Margin ($ Millions) ▪ Net Finance Margin benefited from lower funding costs ▪ Average Earning Assets flat driven by financing and leasing assets growth offset by decline in interest bearing cash ▪ Pre - tax income return on Average Earning Assets remains strong Highlights
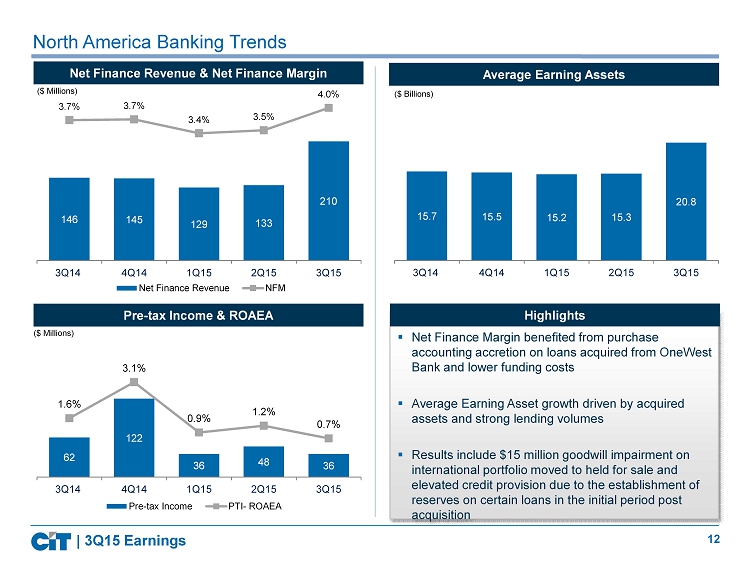
12 62 122 36 48 36 1.6% 3.1% 0.9% 1.2% 0.7% 3Q14 4Q14 1Q15 2Q15 3Q15 Pre-tax Income PTI- ROAEA 146 145 129 133 210 3.7% 3.7% 3.4% 3.5% 4.0% 3Q14 4Q14 1Q15 2Q15 3Q15 Net Finance Revenue NFM North America Banking Trends 15.7 15.5 15.2 15.3 20.8 3Q14 4Q14 1Q15 2Q15 3Q15 ($ Millions) ($ Billions) | 3Q15 Earnings Pre - tax Income & ROAEA Average Earning Assets Net Finance Revenue & Net Finance Margin ($ Millions) ▪ Net Finance Margin benefited from purchase accounting accretion on loans acquired from OneWest Bank and lower funding costs ▪ Average Earning Asset growth driven by acquired assets and strong lending volumes ▪ Results include $15 million goodwill impairment on international portfolio moved to held for sale and elevated credit provision due to the establishment of reserves on certain loans in the initial period post acquisition Highlights

13 APPENDIX | 3Q15 Earnings

14 Balance Sheet was Impacted by the OneWest Acquisition | 3Q15 Earnings Actual 3Q15 Actual 2Q15 OW Opening Balance Sheet Total cash and deposits 8,260 5,465 4,412 Securities purchased under agreements to resell 100 750 - Investment securities 3,619 1,693 1,297 Assets held for sale 2,154 1,087 20 Loans 32,406 19,649 13,598 Allowance for loan losses (335) (351) - Loans, net of allowance for loan losses 32,071 19,928 13,598 Operating lease equipment, net 15,538 15,110 - Indemnification assets 465 - 481 Goodwill and intangible assets 1,335 587 784 Unsecured counterparty receivable 530 538 - Other assets 3,538 2,150 677 Assets of discontinued operation 514 - 524 Total Assets 68,126 46,657 21,793 Deposits 32,329 17,268 14,533 Credit balances of factoring clients 1,609 1,373 - Other liabilities 3,396 2,767 221 Borrowings 19,321 16,442 2,970 Liabilities of discontinued operation 672 - 677 Total Liabilities 57,326 37,850 18,401 Total Equity 10,799 8,808 3,392 ($ Millions) Totals may not sum due to rounding

15 Select Purchase Accounting Items | 3Q15 Earnings ($ Millions) Expect net accretion to be slightly positive in the near - term Item CIT Fair Value as of 8/3/15 vs OWB Carrying Value Comments Notes Fair value mark on loans ( accretable /non accretable ) ~ (240) Mark against Unpaid Principal Balance: ~$1.2 billion accretable : accreted on an effective yield basis. ~$0.9 billion non - accretable : Credit mark on purchased credit impaired loans to cover future losses. Accretable : reflected in interest income. Non - accretable : Absorbs credit losses on applicable loans. Indemnification asset ~ (200) Interest income earned at ~105bps. Carrying value will change based on the cash flows of the underlying loans. Mark on deposits and borrowings ~ (36) Accreted over average remaining life of ~18 months. Reduces interest expense. Fair value intangibles ~ 180 Mostly amortized on a straight line basis over approximately 8 yrs . Increases operating expenses. Goodwill ~ 500 ~$ 260 million of goodwill is allocated to the LCM run - off portfolio. Including $100 million of goodwill already on OWB’s balance sheet, total goodwill added was $600 million.

16 Average Earning Assets (AEA) – Updated Definition | 3Q15 Earnings 3Q15 2Q15 1Q15 4Q14 3Q14 AEA - 34,098 33,772 34,346 34,295 NFM - 4.02% 4.00% 4.34% 4.26% Provision for Credit Losses - (0.22%) (0.41%) (0.17%) (0.45%) Other Income - 0.74% 1.02% 1.36% 0.28% Operating expenses - (2.76%) (2.86%) (2.93%) (2.74%) Pre - tax Income - 1.80% 1.75% 2.59% 1.36% AEA Components New Old Finance Receivables Operating Leases Assets Held For Sale Credit Balances of Factoring Clients Interest - bearing Cash Investment Securities Securities purchased under agreements to resell Indemnification Assets Metrics (Old AEA) 3Q15 2Q15 1Q15 4Q14 3Q14 AEA 52,448 41,113 41,796 41,861 40,949 NFM 3.67% 3.34% 3.23% 3.56% 3.57% Provision for Credit Losses (0.38%) (0.18%) (0.33%) (0.14%) (0.37%) Other Income 0.30% 0.62% 0.83% 1.08% 0.24% Operating expenses (2.55%) (2.29%) (2.31%) (2.38%) (2.29%) Pre - tax Income 1.04% 1.49% 1.41% 2.13% 1.14% Metrics (New AEA)

17 GAAP Tax vs. Economic Tax – (Continuing Operations ) 3Q15 2Q15 1Q15 FY14 Pre - tax Income $137 $153 $148 $681 (1) GAAP tax provision includes discrete tax items of $591 million, $7 million, $2 million and $445 million for 3Q15, 2Q15, 1Q15 and FY14 , respectively. (2) Net income includes $0 million, $0 million, $0 million and $1 million of losses attributable to non - controlling interests for 3 Q15, 2Q15, 1Q15 and FY14 , respectively. (3) EPS based on 191.8 million, 174.9 million, 177.1 million and 189.5 million average diluted shares outstanding for 3Q15, 2Q15, 1Q15 and FY14 , respectively. $ impacts are rounded ($ Millions, except per share data) GAAP Tax Benefit (Provision) (1) $560 ($38) ($44) $398 Net Income (2) $693 $115 $104 $1,078 Reported EPS (3) $3.61 $0.66 $0.59 $5.69 Effective Tax Rate NM 25% 30% (58%) Cash Taxes ($9) ($4) ($14) ($22) Pro Forma Net Income (2) $128 $149 $134 $658 Pro Forma EPS (3) $0.67 $0.85 $0.76 $3.47 Effective Tax Rate (Cash) 7% 2% 9% 3% ▪ Reset of GAAP effective tax rate in 2015 due to prior year partial valuation allowance reversal ▪ GAAP earnings reflect $ 647 million tax benefit due to VA reversal , partially offset by discrete items of $56 million ▪ Cash taxes were $ 9 million in 3Q15 | 3Q15 Earnings

18 Platform Exits In - Progress Estimated CTA (1) Expected Timing Transaction Size ($ Millions) Other international platforms; $350 million of UK CF and $180 million of NSP assets already sold but will have trailing CTA charges of ~$5 million. Brazil ~$80 ~$50 4Q15 U.K . Equipment Finance ~$385 ~$5 4Q15 | 3Q15 Earnings Canada ~$800 ~$0 - 5 2016 China ~$500 ~$0 - 5 2016 (1) Currency translation adjustment

19 Oil & Gas Extraction Svcs . ~$ 1.0 Exposure to Oil & Gas Extraction Services Loans ($ Billions) Total Loans: $32.4 Billion ▪ ~$1.0 billion of loans ▪ ~ 3% of total loans or ~4% of commercial loans ▪ ~50% Exploration & Production ( E&P), ~30% Energy Services and ~20% Midstream ▪ Less than 5 % are Leverage Loans ▪ Majority of portfolio is secured by traditional reserve based lending assets, working capital assets, long lived fixed assets Other ~91,000 In - service to Oil Sector ~23,000 North American Railcars Total Cars: ~114,000 ▪ Approximately 23,000 railcars that service the oil sector ▪ Leased to a mix of E&P, midstream, and refining customers as well as diversified shippers ▪ ~13,000 tank cars are leased directly to customers for the transportation of crude ▪ ~10,000 sand cars that support crude oil and natural gas drilling ▪ ~500 cars are up for renewal in 2015 and ~3,100 cars are up for renewal in 2016 ▪ Impact: Utilization and Net Finance Margin ▪ Impact: Credit Provision | 3Q15 Earnings Consumer Loans ~$6.9 Commercial Loans ~$24.5

20 North American Commercial Finance Business Segment Description SEGMENT DIVISIONS MARKETS AND SERVICES Transportation & International Finance • Aerospace Leasing and financing solutions for commercial airlines worldwide and business jet operators. • Rail Leasing and financing solutions to freight shippers and carriers. • Maritime Finance Financing solutions to owners and operators of oceangoing cargo vessels. • International Finance Lending and equipment leasing to small and middle market businesses in the UK and China. North America Banking • Commercial Banking New name, includes the former NACF Corporate Finance, and the new Commercial lending functions of NAB. The division also originates qualified Small Business Administration (“SBA”) loans. • Commercial Real Estate Former name – Real Estate Finance and includes assets from the acquisition. • Equipment Finance Provides lending, leasing and other financial and advisory services to small and middle - market companies across select industries. • Commercial Services Factoring, receivables management products and secured financing to retail supply chain companies . • Consumer Banking New division, includes retail banking, mortgage lending and private banking. Retail banking is the primary deposit gathering business and operates through two primary channels: retail branches and online direct channel. Mortgage lending offers jumbo residential mortgage loans and conforming residential mortgage loans. Private banking offers banking services to high net worth individuals. Legacy Consumer Mortgages • Single Family Residential Mortgages • Reverse Mortgages New segment, contains single - family residential (“SFR”) mortgages and reverse mortgages, which are covered by loss sharing agreements with the FDIC . Non - Strategic Portfolios Consists of portfolios that we do not consider strategic (Brazil portfolio). Corporate and Other Consists of certain items not allocated to operating segments. | 3Q15 Earnings

21 North American Commercial Finance | 3Q15 Earnings
Serious News for Serious Traders! Try StreetInsider.com Premium Free!
You May Also Be Interested In
- ROSEN, A TRUSTED AND LEADING LAW FIRM, Encourages JBS S.A. Investors to Inquire About Securities Class Action Investigation – JBSAY
- ROSEN, A LEADING LAW FIRM, Encourages Waldencast plc Investors to Inquire About Securities Class Action Investigation – WALD, WALDW
- Southwest Bancshares, Inc., Announces Texas Partners Bank as the Regional Bank Brand
Create E-mail Alert Related Categories
SEC FilingsSign up for StreetInsider Free!
Receive full access to all new and archived articles, unlimited portfolio tracking, e-mail alerts, custom newswires and RSS feeds - and more!
