

Form 8-K CIT GROUP INC For: Mar 23
 Tweet
Tweet Share
ShareUNITED STATES
SECURITIES AND EXCHANGE COMMISSION
Washington, D.C. 20549
FORM 8-K
CURRENT REPORT
Pursuant to Section 13 or 15(d) of the
Securities Exchange Act of 1934
Date of Report (Date of earliest event reported): March 23, 2016 (March 23, 2016)
CIT GROUP INC.
(Exact name of registrant as specified in its charter)
| Delaware | 001-31369 | 65-1051192 |
| (State or other | (Commission | (IRS Employer |
| jurisdiction of | File Number) | Identification No.) |
| incorporation) |
11 West 42nd Street
New York, New York 10036
(Address of registrant's principal executive office)
Registrant's telephone number, including area code: (212) 461-5200
(Former Name or Former Address, if Changed Since Last Report)
Check the appropriate box below if the Form 8-K filing is intended to simultaneously satisfy the filing obligation of the registrant under any of the following provisions (see General Instruction A.2. below):
[ ] Written communications pursuant to Rule 425 under the Securities Act (17 CFR 230.425)
[ ] Soliciting material pursuant to Rule 14a-12 under the Exchange Act (17 CFR 240.14a-12)
[ ] Pre-commencement communications pursuant to Rule 14d-2(b) under the Exchange Act (17 CFR 240.14d-2(b))
[ ] Pre-commencement communications pursuant to Rule 13e-4(c) under the Exchange Act (17 CFR 240.13e-4(c))
| 1 |
Section 7 – Regulation FD
Item 7.01. Regulation FD Disclosure.
On March 23, 2016, CIT Group Inc. (“CIT” or the “Company”) issued a press release announcing a conference call to discuss its strategic priorities, which is attached as Exhibit 99.1. In addition, the Company issued a presentation to analysts and investors providing additional details on its strategic priorities for 2016 through 2018, which is attached as Exhibit 99.2. The information included in Exhibits 99.1 and 99.2 shall not be considered filed for purposes of the Exchange Act.
Section 9 – Financial Statements and Exhibits
Item 9.01. Financial Statements and Exhibits.
| (d) | Exhibits. |
| 99.1 | Press release issued by CIT Group Inc. on March 23, 2016 announcing its strategic priorities. | |
|
99.2
|
Presentation by CIT Group Inc. on March 23, 2016 regarding its strategic priorities for 2016 to 2018.
|
Forward-Looking Statements
This Form 8-K contains forward-looking statements within the meaning of applicable federal securities laws that are based upon our current expectations and assumptions concerning future events, which are subject to a number of risks and uncertainties that could cause actual results to differ materially from those anticipated. The words “expect,” “anticipate,” “estimate,” “forecast,” “initiative,” “objective,” “plan,” “goal,” “project,” “outlook,” “priorities,” “target,” “intend,” “evaluate,” “pursue,” “commence,” “seek,” “may,” “would,” “could,” “should,” “believe,” “potential,” “continue,” or the negative of any of those words or similar expressions is intended to identify forward-looking statements. All statements contained in this Form 8-K, other than statements of historical fact, including without limitation, statements about our plans, strategies, prospects and expectations regarding future events and our financial performance, are forward-looking statements that involve certain risks and uncertainties. While these statements represent our current judgment on what the future may hold, and we believe these judgments are reasonable, these statements are not guarantees of any events or financial results, and our actual results may differ materially. Important factors that could cause our actual results to be materially different from our expectations include, among others, the risk that CIT is unsuccessful in implementing its strategy and business plan, the risk that CIT is unable to react to and address key business and regulatory issues, the risk that CIT is unable to achieve the projected revenue growth from its new business initiatives or the projected expense reductions from efficiency improvements, and the risk that CIT becomes subject to liquidity constraints and higher funding costs. We describe these and other risks that could affect our results in Item 1A, “Risk Factors,” of our latest Annual Report on Form 10-K for the year ended December 31, 2015, which was filed with the Securities and Exchange Commission. Accordingly, you should not place undue reliance on the forward-looking statements contained in this Form 8-K. These forward-looking statements speak only as of the date on which the statements were made. CIT undertakes no obligation to update publicly or otherwise revise any forward-looking statements, except where expressly required by law.
| 2 |
SIGNATURES
Pursuant to the requirements of the Securities Exchange Act of 1934, the Registrant has duly caused this report to be signed on its behalf by the undersigned hereunto duly authorized.
| CIT GROUP INC. | |||
| (Registrant) | |||
| By: | /s/ E. Carol Hayles | ||
| E. Carol Hayles | |||
| Executive Vice President & Chief Financial Officer | |||
Dated: March 23, 2016
| 3 |
Exhibit 99.1

FOR IMMEDIATE RELEASE
CIT PROVIDES UPDATE ON STRATEGIC PLAN –
CREATING A LEADING NATIONAL MIDDLE MARKET BANK
| · | Roadmap to Achieve 10 Percent Return on Tangible Common Equity (ROTCE) by 2018 |
| · | Focusing on Core Commercial Businesses |
| · | Reducing Operating Expenses by $125 Million |
| · | Expecting to Complete Commercial Air Separation by End of 2016 |
| · | Strategic Update Call Scheduled at 8:00 AM EDT |
NEW YORK – March 23, 2016 – CIT Group Inc. (NYSE: CIT), cit.com, a leading provider of commercial lending and leasing services, today announces its strategic plan designed to drive long-term shareholder value. In connection with today’s strategic update call, CIT is delivering a slide presentation which is available at cit.com/investor.
“Today, CIT announces steps to focus on our core businesses, improve our financial performance and transition our strategy to become a national middle market bank serving our customers with an integrated set of financing and deposit products,” said Ellen R. Alemany, incoming Chairwoman and CEO of CIT Group, and CEO and President of CIT Bank. “The CIT Board of Directors and management team have been conducting a strategic review of our businesses and are taking decisive actions to chart a clear path forward to drive value for shareholders and to demonstrate our commitment to our customers, communities and employees.”
CIT is committed to positioning the company to deliver long-term value for shareholders while maintaining a strong risk management culture. CIT’s strategic
| 2 |
priorities to advance its transition to a leading national middle market bank include:
| · | Focusing on Core Commercial Businesses: Invest in growth and strengthen its capabilities with respect to its core commercial lending, leasing (including rail), and depository solutions for middle market customers, as well as: |
o Complete the separation of the Commercial Air business by the end of 2016; and
o Complete the integration of OneWest Bank by year end.
| · | Improving Profitability and Returning Capital: Achieve a return on tangible common equity (ROTCE) of 10 percent by 2018 by executing on initiatives to: |
| o | Reduce operating expenses by $125 million by 2018; |
| o | Improve funding costs by growing its deposit base and transitioning the deposit mix to lower cost deposits; |
| o | Efficiently realize substantial cash flow and capital from deferred tax assets; and |
| o | Return excess capital to shareholders, subject to regulatory approvals. |
| · | Maintaining Strong Risk Management: The improvement in CIT’s credit ratings reflects the strength of its franchises, strong liquidity and capital positions, and the expansion and diversification of deposit funding. Additionally: |
| o | CIT has improved its risk profile and strengthened its underwriting standards to focus on appropriate risk adjusted returns throughout cycles and to leverage its expertise as an asset-backed lender; and |
| o | Going forward, the company will continue to ensure it maintains high risk management standards and evolves with industry requirements. |
Ms. Alemany concluded, “Our Board and management team are fully aligned with shareholders and are committed to thoughtfully considering their feedback into our ongoing decision-making. With our recent actions and the decisions we are announcing today, we are strengthening our culture of ownership, accountability and transparency at CIT. Our strategic plan of focusing on our core businesses and leveraging the strength of our franchises and risk
| 3 |
management practices will maximize value for shareholders and positon CIT as a leading national middle market bank.”
Conference Call and Webcast
Ms. Alemany and Carol Hayles, Chief Financial Officer, will host a strategic update call at 8:00 a.m. EDT on Wednesday, March 23, 2016, which will be broadcast live on the investor relations section of the company’s website at cit.com/investor or by dialing: 888-317-6003, elite entry code: 2160502. An archived version of the conference call and supporting materials will be available on the CIT website within the investor relations section after the live conference call.
About CIT
Founded in 1908, CIT (NYSE: CIT) is a financial holding company with more than $65 billion in assets. Its principal bank subsidiary, CIT Bank, N.A., (Member FDIC, Equal Housing Lender) has more than $30 billion of deposits and more than $40 billion of assets. It provides financing, leasing and advisory services principally to middle market companies across a wide variety of industries primarily in North America, and equipment financing and leasing solutions to the transportation sector. It also offers products and services to consumers through its Internet bank franchise and a network of retail branches in Southern California, operating as OneWest Bank, a division of CIT Bank, N.A. cit.com
Forward-Looking Statements
This press release contains forward-looking statements within the meaning of applicable federal securities laws that are based upon our current expectations and assumptions concerning future events, which are subject to a number of risks and uncertainties that could cause actual results to differ materially from those anticipated. The words “expect,” “anticipate,” “estimate,” “forecast,” “initiative,” “objective,” “plan,” “goal,” “project,” “outlook,” “priorities,” “target,” “intend,” “evaluate,” “pursue,” “commence,” “seek,” “may,” “would,” “could,” “should,” “believe,” “potential,” “continue” or the negative of any of those words or similar expressions is intended to identify forward-looking statements. All statements contained in this press release, other than statements of historical fact, including without limitation, statements about our plans, strategies, prospects and expectations regarding future events and our financial performance, are forward-looking statements that involve certain risks and uncertainties. While these statements represent our current judgment on what the future may hold, and we believe these judgments are reasonable, these statements are not guarantees of any events or financial results, and our actual results may differ materially. Important factors that could cause our actual results to be materially different from our expectations include, among others, the risk
| 4 |
that CIT is unsuccessful in implementing its strategy and business plan, the risk that CIT is unable to react to and address key business and regulatory issues, the risk that CIT is unable to achieve the projected revenue growth from its new business initiatives or the projected expense reductions from efficiency improvements, and the risk that CIT becomes subject to liquidity constraints and higher funding costs. We describe these and other risks that could affect our results in Item 1A, “Risk Factors,” of our latest Annual Report on Form 10-K for the year ended December 31, 2015, which was filed with the Securities and Exchange Commission. Accordingly, you should not place undue reliance on the forward-looking statements contained in this press release. These forward-looking statements speak only as of the date on which the statements were made. CIT undertakes no obligation to update publicly or otherwise revise any forward-looking statements, except where expressly required by law.
# # #
CIT MEDIA RELATIONS:
Matt Klein
Vice President, Media Relations
(973) 597-2020
CIT INVESTOR RELATIONS:
Barbara Callahan
Senior Vice President
(973) 740-5058
Exhibit 99.2
![]()
CIT Group Strategic Update Call Creating a Leading National Middle - Market Bank March 23, 2016
1 This presentation contains forward - looking statements within the meaning of applicable federal securities laws that are based upon our current expectations and assumptions concerning future events, which are subject to a number of risks and uncertainties that could cause actual results to differ materially from those anticipated . The words “expect,” “anticipate,” “estimate,” “forecast,” “initiative,” “objective,” “plan,” “goal,” “project,” “outlook,” “priorities,” “target,” “intend,” “evaluate,” “pursue,” “commence,” “seek,” “may,” “would,” “could,” “should,” “believe,” “potential,” and “continue,” or the negative of any of those words or similar expressions are intended to identify forward - looking statements . All statements contained in this presentation, other than statements of historical fact, including without limitation, statements about our plans, strategies, prospects and expectations regarding future events and our financial performance, are forward - looking statements that involve certain risks and uncertainties . While these statements represent our current judgment on what the future may hold, and we believe these judgments are reasonable, these statements are not guarantees of any events or financial results, and our actual results may differ materially . Important factors that could cause our actual results to be materially different from our expectations include, among others, the risk that CIT is unsuccessful in implementing its strategy and business plan, the risk that CIT is unable to react to and address key business and regulatory issues, the risk that CIT is unable to achieve the projected revenue growth from its new business initiatives or the projected expense reductions from efficiency improvements, and the risk that CIT becomes subject to liquidity constraints and higher funding costs . We describe these and other risks that could affect our results in Item 1 A, “Risk Factors,” of our latest Annual Report on Form 10 - K for the year ended December 31 , 2015 , which was filed with the Securities and Exchange Commission . Accordingly, you should not place undue reliance on the forward - looking statements contained in this presentation . These forward - looking statements speak only as of the date on which the statements were made . CIT undertakes no obligation to update publicly or otherwise revise any forward - looking statements, except where expressly required by law . This presentation is to be used solely as part of CIT management’s continuing investor communications program . This presentation shall not constitute an offer or solicitation in connection with any securities . Important Notices

2 Listening to Our Stakeholders 38 years of commercial banking experience including previous roles as Chief Executive Officer for Global Transaction Services , Commercial Banking and CitiCapital of Citigroup, and Chief Executive Officer of RBS Citizens Financial Group Joined CIT’s board of directors in January 2014 Will become CIT’s CEO in April and Chairwoman in May CIT’s board and management have been conducting a comprehensive strategic review, gathering input from customers, employees and shareholders To date, we have: – Simplified our organizational structure and streamlined our management team – Nominated Michael Carpenter and John Oros to our board of directors, providing additional banking , restructuring and regulatory expertise – Formed a working group of the board to oversee the separation of Commercial Air – Established a strategic plan to generate a 10% ROATCE by 2018 Ellen R. Alemany Strategic Review Process Current and nominated directors and their affiliates collectively own approximately 5% of CIT Executive compensation is aligned with achieving our ROATCE target We embrace and embody a culture of ownership, accountability and transparency, and we are committed to action Alignment With Shareholders

3 Our Vision: Create a Leading National Middle - Market Bank Focus on lending, leasing and depository solutions for middle - market commercial customers Complete the announced separations of non - core businesses, including Commercial Air Finish integrating OneWest Bank and continue to build out our deposit and commercial treasury services capabilities Reduce operating expense run rate by $125M or ~ 10% ( ¹ ) by 2018 Optimize the size of our holding company, replacing wholesale funding with core deposits Increase net revenue by building out the investment portfolio Return excess capital to shareholders ( ² ) , aligning our capital structure with commercial bank peers Credit discipline Culture of compliance and integrity Robust capital and liquidity Appropriate portfolio concentration Strong regulatory relationships Preparing to meet SIFI requirements We are targeting a 10% return on average tangible common equity by 2018 1 2 3 Focus on Our Core Businesses Improve Profitability and Return Capital Maintain Strong Risk Management (1) ~10% of 4Q 2015 normalized run rate of ~$1.3B, excluding reductions associated with announced business exits (2) Amount and timing subject to regulatory approval

4 CIT Bank 64% Holding Company 36% Commercial loans 53% Total: 1 Operating Leases 33% Deposits 12% Wholesale Debt 88% Deposits 64% Wholesale Debt 30% FHLB 6% Commercial loans 47% Consumer 22% Operating Leases 30% CIT Bank 14% Holding Company 86% Loan and Lease Composition Charting a Successful Path Forward From Who We Were . . . 2015 Transportation lessor and middle - market lender; primarily wholesale funded 2010 Identity Transportation lessor and middle - market lender with deposit funding % of Assets in CIT Bank Funding Composition Residential mortgages 11% Consumer 3%

5 CIT Bank 75% Holding Company 25% Commercial loans 66% Total: 1 Operating Leases 17% . . . To Who We Will Be Targeting ~85% of assets in CIT Bank Commercial loans and leases represent most of our earning assets Transition to lower - cost core deposits from retail, middle - market and commercial customers Targeting ~85% deposit funding Strategic vision Middle - market commercial bank funded with deposits 2015, illustrative for separation of Commercial Air Identity Leading national middle - market bank with a full suite of commercial lending, leasing and depository products Deposits ~75 % Wholesale Debt ~20 % FHLB ~5 % Loan and Lease Composition % of Assets in CIT Bank Funding Composition Residential mortgages 11% Consumer 3%

6 Our Strengths Will Make Us a Leading National Middle - Market Bank More than 100 years serving middle - market commercial customers Well - established lending, leasing and advisory franchises Growing retail branch, commercial and internet deposit franchises ~5,000 employees dedicated to serving customers and shareholders Capabilities and expertise in targeted industry verticals
1 Focus on Our Core Businesses
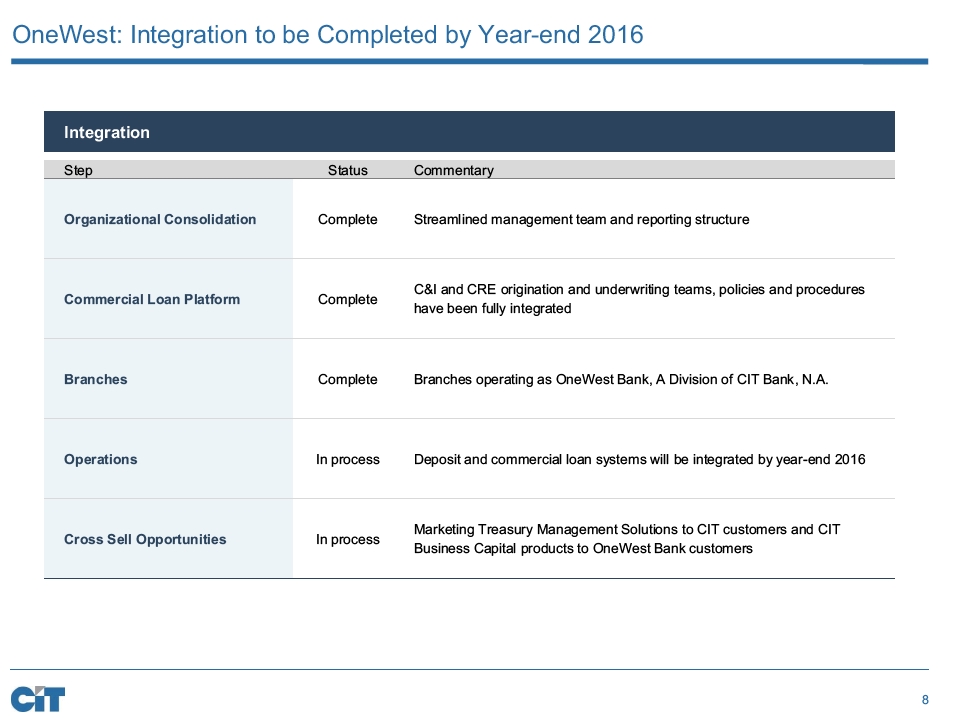
8 OneWest : Integration to be Completed by Year - end 2016 Integration Step Status Commentary Organizational Consolidation Complete Streamlined management team and reporting structure Commercial Loan Platform Complete C&I and CRE origination and underwriting teams, policies and procedures have been fully integrated Branches Complete Branches operating as OneWest Bank, A Division of CIT Bank, N.A. Operations In process Deposit and commercial loan systems will be integrated by year - end 2016 Cross Sell Opportunities In process Marketing Treasury Management Solutions to CIT customers and CIT Business Capital products to OneWest Bank customers

9 Formed new legal entity; advancing subsidiary realignment Completing carve out financial statements Engaged in systems and operational work necessary for both a sale or a spin Creating plan for liability management in the context of either a sale or a spin Commercial Air Separation: Process Update Engaged since Q4 2015 in preliminary discussions with a wide range of global partners Have begun executing nondisclosure agreements with selected counterparties Formal auction process to launch in Q2 2016 Preparing to file Form 10 registration statement by the end of Q2 2016 Able to execute spin - off by year - end 2016 We are committed to maximizing shareholder value regardless of disposition strategy Preparatory Steps Sale Process Underway Concurrently Preparing for Spin - off Dual track process, balancing many different considerations, including: valuation, timing, certainty of execution, funding and tax implications
![]()
10 Rail: An Important Franchise for CIT High - quality management team and customer base Above - hurdle return on equity One - third of our railcars are owned by CIT Bank Size and duration of order book does not attract significant additional regulatory capital In effect, Rail provides its own equity: Rail’s $1.2B of deferred tax liabilities offset an equal amount of deferred tax assets, generating regulatory capital Concentration: pro forma for separating Commercial Air, railcar leases will represent ~15% of total earning assets Business cycle: utilization and lease rates have trended downward, driven in particular by headwinds in the energy sector Bank funding limitations: we are unable to move all of our existing fleet into CIT Bank due to geographic (international) and other regulatory issues Tax: the accelerated depreciation of rail cars that creates valuable cash flow and a synergistic deferred tax liability also results in an extremely low tax basis in our railcar fleet High - quality management team and customer relationships drive strong returns through cycles Selling Rail today would not free up capital to return to shareholders, given regulatory capital impact While balancing efficient utilization of regulatory capital, we will focus on mitigating concentration risk Excellent Franchise Considerations Takeaways Findings From Our Strategic Review

11 Consumer Banking: Full suite of consumer deposit products and residential mortgage products offered through our OneWest retail branches and private bankers Small Business: Offering lending solutions and SBA loans to meet the needs of growing businesses Online Banking: BankOnCIT.com channel offers online savings & CDs nationally Consumer $ 1.4B Legacy Consumer Mortgage $ 5.5B Our Core Businesses (1) Commercial Banking Transportation ( ¹ ) Consumer & Community Banking Commercial Finance: Well - established middle - market bank with expertise in targeted industries and products Business Capital : Leading equipment lessor and lender; among the nation’s largest providers of factoring services Real Estate Finance: Deep industry relationships, underwriting experience and market expertise Rail: Provide financial solutions to customers in the U.S. and Europe Maritime : C ustomized offerings for all major segments of the maritime industry Business Air: Assist in the acquisition and financing of business aircraft Note: Data as of 12/31/15 (1) After separation of Commercial Air Commercial Finance $ 10.0B Business Capital $ 7.3B Real Estate Finance $ 5.4B Financing & Leasing Assets: $22.7B Rail $6.7B Maritime $ 1.7B Business Air $0.8B Financing & Leasing Assets: $9.2B (1) Financing & Leasing Assets: $6.9B

2 Improve Profitability and Return Capital

13 Key Performance Metrics Note: N/A denotes not applicable (1) Cost of funds defined as borrowing costs divided by total interest - bearing liabilities and non - interest bearing deposits (2) As % of average earnings assets. ( See appendix for non - GAAP items) (3) Peer average i ncludes other non - interest income (4) Total operating expenses exclusive of restructuring charges and amortization of intangibles divided by total revenue (ne t finance margin and other income) ( 5 ) S ee appendix for reconciliation of non - GAAP items (6) Peers include: BBT, CFG, CMA, FITB, HBAN, KEY, MTB, RF, STI, ZION (7) CIT 2015 metrics reflects five months of OneWest Bank results Peer average (6) CIT 2015 (7) 2018 Target Areas of focus Loan Yield 3.7% 5.9% N/A Deposit Costs 0.1% 1.3% N/A x Portfolio Yield 3.3% 6.5% N/A Cost of Funds (1) 0.3% 2.7% N/A x Net Finance Margin (2) 3.0% 3.5% 3.0 – 3.5% Credit provision (2) 0.2% 0.3% 0.25 – 0.50% Other income (2)(3) 1.8% 0.5% 0.6 – 0.75% Operating Expenses (2) 3.1% 2.4% 1.9 – 2.2% x Net Efficiency Ratio (4) 61.7% 57.4% Low 50s x Tax Rate 30% 23% <40% x CET1 Ratio 10.7% 12.7% 10 – 11% x ROATCE 10.6% 7.0% (5) 10% x

14 Average Adjusted TCE (1) $8.7B – $8.7B – $4.8B (2) – – $4.9B CET1 Ratio 12.7% – 12.7% – 10.5% – – 10.5% 7.0% 6.7% 7.3% 10% (0.3 % ) 0.6% 0.5% 2.2% Q4 2015 Reported ROATCE Q4 2015 Noteworthy Items Q4 2015 Run Rate Separation of Commercial Air Pro forma impact of separating Commercial Air Asset Growth Offset by Margin Compression Operating Efficiencies, Including International Exits 2018 Pathway to Delivering 10 % ROATCE by 2018 Return on Average Adjusted Tangible Common Equity (1) Note: For modeling purposes the ROATCE walk assumes a Commercial Air spin - off with 30% capital (1) See appendix for reconciliation of non - GAAP items (2) Capital reflects increase in disallowed DTA and the impact of transaction costs. Capital return and timing subject to regulat ory approval (1)

15 $1.3B $1.2B $1.1 – 1.0B 129 ($125)M ~10% CIT 4Q 2015 Run Rate Announced Exits CIT Illustrative Pro Forma Planned Cost Savings CIT 2018 We Will Reduce Operating Expenses by $125M or ~10% b y 2018 Operating Expense Roll - Forward Planned Cost Savings Absence of Integration Costs $125M Technology and Operations Consolidating operations, resources and systems, rationalizing hardware and software, further automating processes and optimizing real estate Organizational Realignment Streamlining management across all functions and centralizing resources Timing 2016: Operating expenses expected to be slightly elevated from one - time costs, including Commercial Air and international exits 2016 – 2017: Base expenses reflect ramp - up in cost savings over time 2018: Full - year benefit of cost savings ~$(50)M ~$(80)M Int’l Air

16 44% 43% 38% 18% 48% 49% 56% 35% 37% 7% 8% 7% 10% 31% 40% 46% 64% ~75 % ~85% 69% 59% 53% 30% ~20 % 1% 1% 6% ~5 % Funding Transition Underway 2012 2013 2014 2015 (1) 2015 After Air Future (1) Ratings as of most recent published report (2) Includes Online Savings and CDs (3) S&P/Moody’s/Fitch credit ratings Credit Ratings CIT Group We Are Transitioning To Lower Cost Core Deposits as Our Principal Source of Funding CIT Bank – / – / – – / – / – – / – / – BBB - / – / BB+ BB - /B1/ – BB - /Ba3/ – BB - /Ba3/BB+ BB +/B1/BB+ Deposit Composition and Cost Funding Composition n FHLB n Wholesale Debt n Deposits n Commercial / Other n Retail Branch n Online (2) n Brokered – Cost of deposits 1.67% 1.55% 1.63% 1.26% Committed to continued improvement in credit ratings Transition to lower - cost core deposits from retail, middle - market and commercial customers (3)
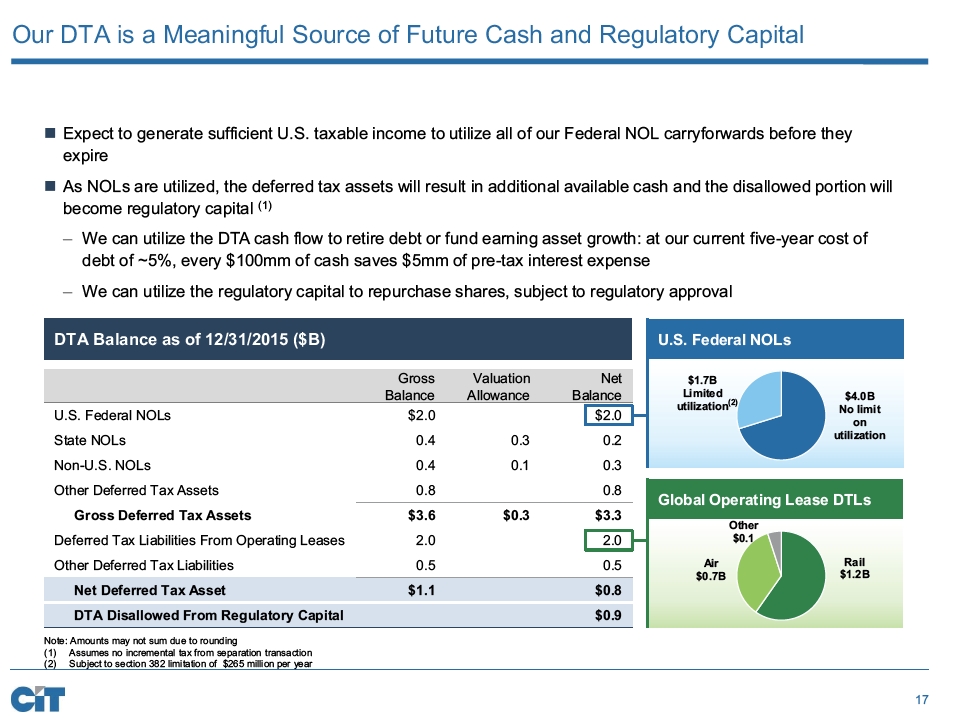
17 Rail $ 1.2B Air $ 0.7B Other $0.1 $4.0B No limit on utilization $1.7B Limited utilization Our DTA is a Meaningful Source of Future Cash and Regulatory Capital Expect to generate sufficient U.S. taxable income to utilize all of our Federal NOL carryforwards before they expire As NOLs are utilized, the deferred tax assets will result in additional available cash and the disallowed portion will become regulatory capital (1) – We can utilize the DTA cash flow to retire debt or fund earning asset growth: at our current five - year cost of debt of ~5 %, every $100mm of cash saves $5mm of pre - tax interest expense – We can utilize the regulatory capital to repurchase shares, subject to regulatory approval DTA Balance as of 12/31/2015 ($B) Gross Balance Valuation Allowance Net Balance U.S. Federal NOLs $2.0 $2.0 State NOLs 0.4 0.3 0.2 Non - U.S. NOLs 0.4 0.1 0.3 Other Deferred Tax Assets 0.8 0.8 Gross Deferred Tax Assets $3.6 $0.3 $3.3 Deferred Tax Liabilities From Operating Leases 2.0 2.0 Other Deferred Tax Liabilities 0.5 0.5 Net Deferred Tax Asset $1.1 $0.8 DTA Disallowed From Regulatory Capital $0.9 U.S. Federal NOLs Global Operating Lease DTLs Note: Amounts may not sum due to rounding (1) Assumes no incremental tax from separation transaction (2) Subject to section 382 limitation of $265 million per year (2)

18 Commercial Air Separation: Illustration of Key Value Considerations Commercial Air: Selected Financials (1) ($B) Assets $10.9 Allocated Capital Assuming 30% Equity/Assets 3.3 Goodwill and Intangibles 0.1 Net Deferred Tax Liability 0.3 Tax Basis (2) 0.0 CIT Group: Selected Tax Metrics (1) ($B) Net Operating Loss Carryforward $5.7 Unrestricted 4.0 Restricted by 382 Limitation 1.7 Net DTA Disallowed from Regulatory Capital $0.9 Illustrative Example (3): Sale vs. Spin - off ($B) Spin - off GAAP Taxes Expense (TBV Reduction) Cash Taxes Payable Remaining NOL C arryforwards Pro Forma Net DTA Sale (Before Premium) $1.3 0.2 2.0 0.0 (1) As of 12/31/2015 (2) Expected tax basis on legal entity (3) Illustrative example excludes transaction - related costs (4) Defined in spin - off case as allocated capital; defined in sale case as capital potentially available for distribution (allocate d capital, less GAAP taxes payable, plus disallowed DTA reduction) $0.0 0.0 5.3 1.1 Key Takeaways $3.0B Capital Released ( 4) $3.6B NOL Utilization $4.1B TBV Reduction $3.3B Capital Released ( 4) $0.3B NOL Utilization $3.1B TBV Reduction Sale price Timing and certainty of execution Size and means of capital distribution Trading price of SpinCo upon spin - off and over time Other Key Value Determinants We are committed to maximizing shareholder value regardless of disposition strategy

19 Capital Management Strategy and Priorities Share repurchases Special dividends Common dividends Investments in above - hurdle business initiatives Repurchasing high cost debt Capital Deployment Net income Deferred tax asset utilization ($ 0.9B disallowed as of 12/31/2015) Balance sheet management Business dispositions Capital Generation Disciplined capital deployment is a top priority Implied TBVPS Accretion / Dilution Current Share Price Sets a High Bar for Deployment: Illustrative Impact of Repurchasing 30M Shares Stock price P / TBV (2) $35.04 (1) $40.00 Premium (1) Note: Amount and timing of capital deployment subject to regulatory approval (1 ) Stock price as of 3/21/2016 (2) Tangible book value per share of $47.77 (as of 12/31/2015) (3) Assumes 30 million shares (15% of outstanding shares) repurchased 0% 14% 0.73x 0.84x 4.7% 2.9% (3)
![]()
3 Maintain Strong Risk Management

21 CIT’s Risk Management Practices Are Aligned With Commercial Banks In our underwriting, we focus on earning appropriate risk - adjusted returns through the cycle We focus on senior secured lending, drawing on our expertise as an asset - based lender We maintain strong liquidity at both the holding company and bank levels Our evolution toward deposit funding is positive for our liquidity position We balance internal economic views with regulatory expectations including the CCAR process to determine our target capital levels and mix Management determines and Board approves our risk appetite, defining the boundaries of our strategic plans Management sets policies and procedures to monitor and control risk Entire organization responsible for maintaining a strong risk culture Risk Management Components Credit Risk Liquidity Risk Capital Adequacy

22 Overall Credit Trends Are Stable With the Exception of Energy and Dry - Bulk In our commercial loan book, charge - offs remain at low levels and non - accruals are approximately 1% of finance receivables Expect near - term elevated charges related to certain energy and dry - bulk exposures We have strong credit management and industry teams which have experienced many cycles Non - accrual Loans / Total Loans Allowance for Loan Losses / Total Loans (1) Peers include: BBT, CFG, CMA, FITB, HBAN, KEY, MTB, RF, STI, ZION (2) Allowance for loan losses plus principal loss discount as a percent of total loans (before principal loss discount) 1.3% 0.8% 0.9% 1.0% 0.8% 0.7% 2013 2014 2015 CIT Peer Average 1.9% 1.8% 1.8% 1.6% 1.4% 1.3% 2013 2014 2015 CIT Peer Average (1) (1) (2)
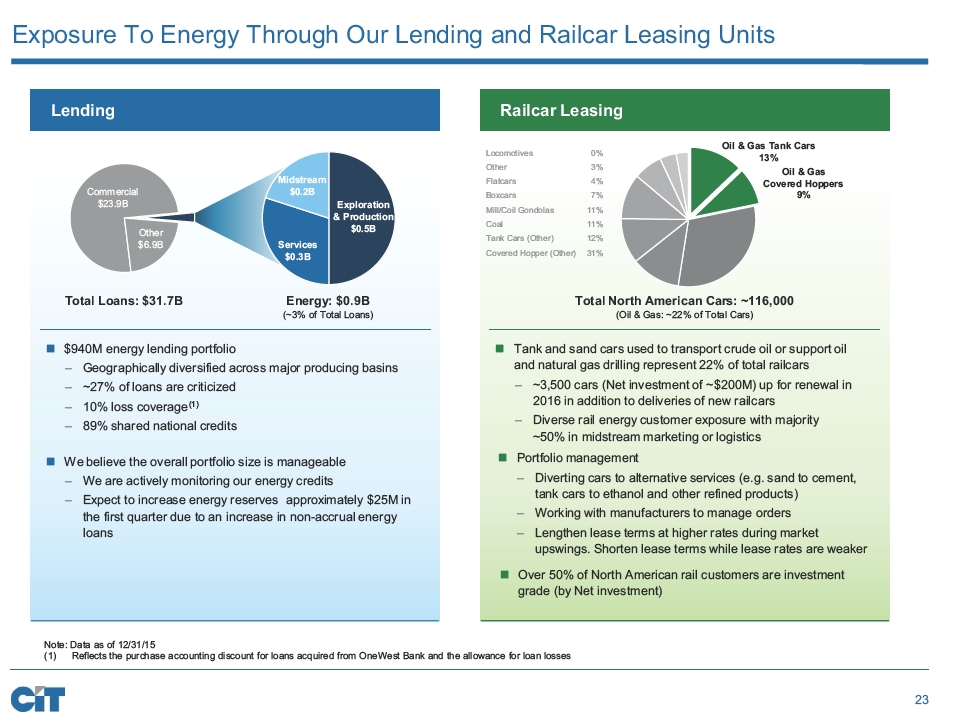
23 Exposure To Energy Through Our Lending and Railcar Leasing Units Note: Data as of 12/31/15 (1) Reflects the purchase accounting discount for loans acquired from OneWest Bank and the allowance for loan losses Railcar Leasing Tank and sand cars used to transport crude oil or support oil and natural gas drilling represent 22% of total railcars – ~3,500 cars (Net investment of ~$200M) up for renewal in 2016 in addition to deliveries of new railcars – Diverse rail energy customer exposure with majority ~50% in midstream marketing or logistics Total North American Cars: ~116,000 (Oil & Gas: ~22% of Total Cars) Oil & Gas Tank Cars 13% Oil & Gas Covered Hoppers 9% Portfolio management – Diverting cars to alternative services (e.g. sand to cement, tank cars to ethanol and other refined products) – Working with manufacturers to manage orders – Lengthen lease terms at higher rates during market upswings. Shorten lease terms while lease rates are weaker $940M energy lending portfolio – Geographically diversified across major producing basins – ~27% of loans are criticized – 10% loss coverage (1) – 89% shared national credits Lending Total Loans: $31.7B Energy: $0.9B (~3% of Total Loans) We believe the overall portfolio size is manageable – We are actively monitoring our energy credits – Expect to increase energy reserves approximately $25M in the first quarter due to an increase in non - accrual energy loans Commercial $23.9B Other $6.9B Midstream $0.2B Services $0.3B Exploration & Production $0.5B Locomotives 0% Other 3% Flatcars 4% Boxcars 7% Mill/Coil Gondolas 11% Coal 11% Tank Cars (Other) 12% Covered Hopper (Other) 31% Over 50% of North American rail customers are investment grade (by Net investment)

Conclusion

25 Creating a Leading National Middle - Market Bank Focusing on core businesses, which are well established and have significant franchise value D eliver 10% ROATCE by 2018 by improving profitability and returning capital (1) We are committed to action, and define success as maximizing value for our shareholders Committed to maximizing value of Commercial Air regardless of disposition strategy Maintaining strong risk management (1) Amount and timing subject to regulatory approval

Appendix
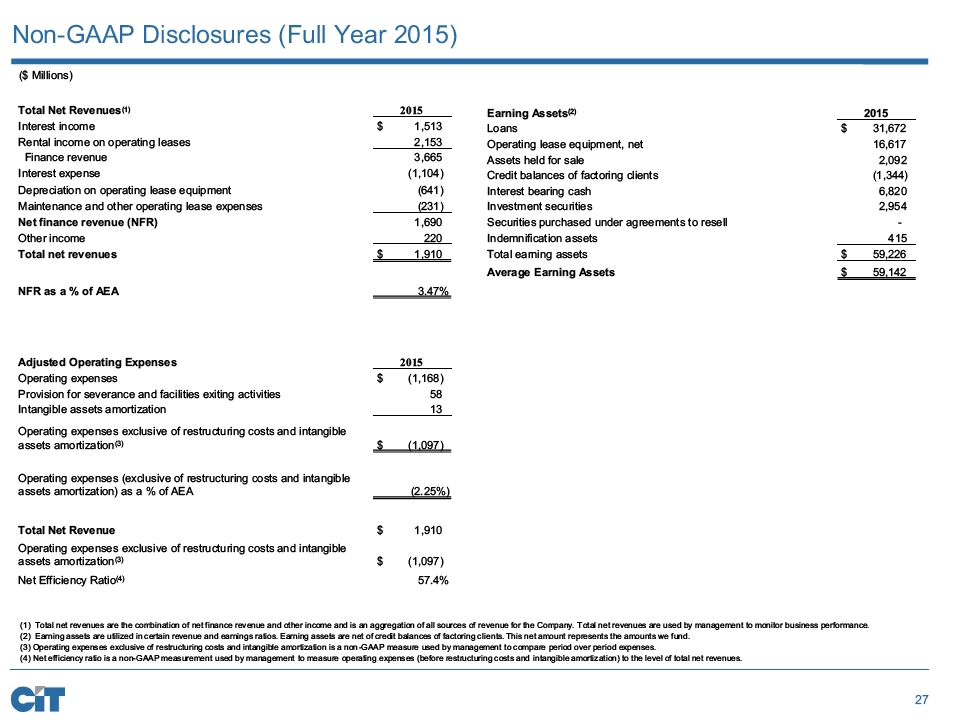
27 Non - GAAP Disclosures (Full Year 2015) (1) Total net revenues are the combination of net finance revenue and other income and is an aggregation of all sources of r eve nue for the Company. Total net revenues are used by management to monitor business performance. (2) Earning assets are utilized in certain revenue and earnings ratios. Earning assets are net of credit balances of factoring cl ien ts. This net amount represents the amounts we fund. (3) Operating expenses exclusive of restructuring costs and intangible amortization is a non - GAAP measure used by management to comp are period over period expenses. (4) Net efficiency ratio is a non - GAAP measurement used by management to measure operating expenses (before restructuring costs and intangible amortization) to the level of total net revenues. ($ Millions) Total Net Revenues (1) 2015 Interest income $ 1,513 Rental income on operating leases 2,153 Finance revenue 3,665 Interest expense (1,104) Depreciation on operating lease equipment (641) Maintenance and other operating lease expenses (231) Net finance revenue (NFR) 1,690 Other income 220 Total net revenues $ 1,910 NFR as a % of AEA 3.47% Earning Assets (2) 2015 Loans $ 31,672 Operating lease equipment, net 16,617 Assets held for sale 2,092 Credit balances of factoring clients (1,344) Interest bearing cash 6,820 Investment securities 2,954 Securities purchased under agreements to resell - Indemnification assets 415 Total earning assets $ 59,226 Average Earning Assets $ 59,142 Adjusted Operating Expenses 2015 Operating expenses $ (1,168) Provision for severance and facilities exiting activities 58 Intangible assets amortization 13 Operating expenses exclusive of restructuring costs and intangible assets amortization (3) $ (1,097) Operating expenses (exclusive of restructuring costs and intangible assets amortization) as a % of AEA (2.25%) Total Net Revenue $ 1,910 Operating expenses exclusive of restructuring costs and intangible assets amortization (3) $ (1,097) Net Efficiency Ratio (4) 57.4%

28 Non - GAAP Disclosures (Q4 2015) ($ Millions) Components of Tangible Common Equity Tangible Common Equity Total Common Stockholders' Equity 10,978$ LESS: Goodwill (1,198) LESS: Intangibles (176) Tangible Common Equity 9,604$ Adjusted ROATCE Net Income Average Tangible Common Equity ROATCE Net Income (Continuing); Average TCE 151$ 9,561$ ADD: Amortization of Intangibles 5 LESS: Reversal of Valuation Allowance; Disallowed DTA 4 (875) Adjusted Net Income; Adjusted TCE 152 8,686 7.0% ADD: Brazil exit CTA 58 ADD: Restructuring 33 ADD: Discrete Tax Item (15) ADD: Operating Expense Run-Rate Adjustment (18) ADD: Normalize Effective Tax Rate of 35% (65) Normalized Net Income; Adjusted TCE 146$ 8,686$ 6.7%
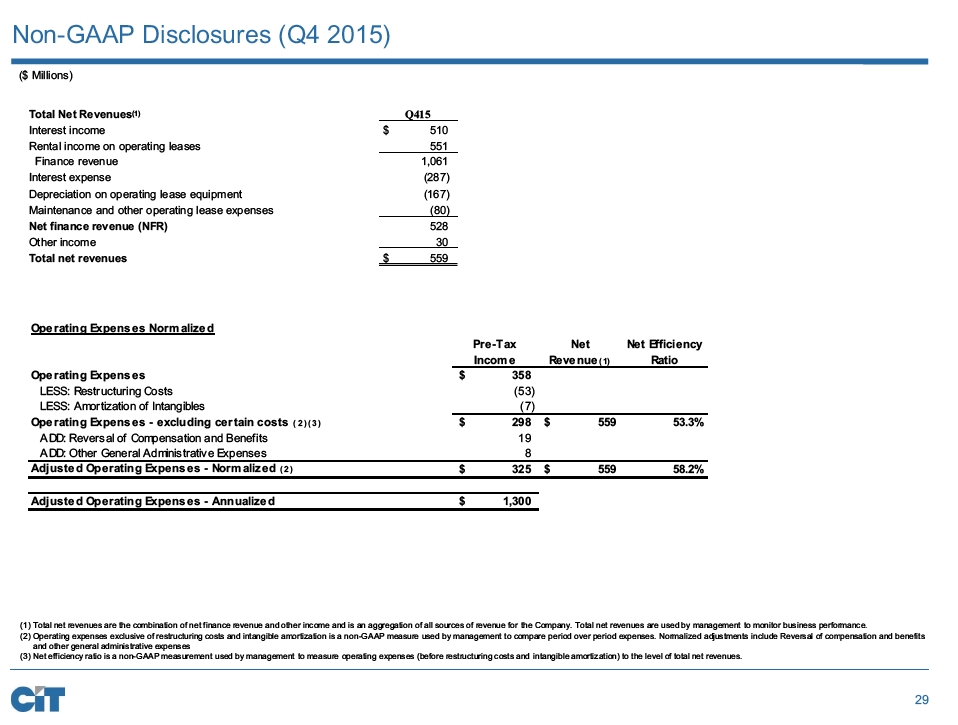
29 Non - GAAP Disclosures (Q4 2015) ($ Millions) Operating Expenses Normalized Operating Expenses 358$ LESS: Restructuring Costs (53) LESS: Amortization of Intangibles (7) Operating Expenses - excluding certain costs (2)(3) 298$ 559$ 53.3% ADD: Reversal of Compensation and Benefits 19 ADD: Other General Administrative Expenses 8 Adjusted Operating Expenses - Normalized (2) 325$ 559$ 58.2% Adjusted Operating Expenses - Annualized 1,300$ Pre-Tax Income Net Revenue (1) Net Efficiency Ratio (1) Total net revenues are the combination of net finance revenue and other income and is an aggregation of all sources of revenue for the Company. Total net revenues are used by management to monitor business performance. (2) Operating expenses exclusive of restructuring costs and intangible amortization is a non - GAAP measure used by management to compare period over period expenses . Normalized adjustments include Reversal of compensation and benefits and other general administrative expenses (3) Net efficiency ratio is a non - GAAP measurement used by management to measure operating expenses (before restructuring costs and intangible amortization) to the level of total net revenues. Total Net Revenues (1) Q415 Interest income $ 510 Rental income on operating leases 551 Finance revenue 1,061 Interest expense (287) Depreciation on operating lease equipment (167) Maintenance and other operating lease expenses (80) Net finance revenue (NFR) 528 Other income 30 Total net revenues $ 559
![]()
30 Simplified Organizational Structure with Customer Centric Focus ▪ Consumer Banking: Full - suite of consumer deposit products and residential mortgage products offered through our OneWest retail branches and private bankers - Online Banking : BankOnCIT.com channel offers online savings & CDs nationally ▪ Mortgage Lending: Includes run off legacy consumer mortgage portfolio ▪ Aerospace : L eading aircraft leasing organization providing financing solutions to commercial airlines worldwide ▪ Rail: Provides financial solutions to customers in the U.S. and Europe ▪ Maritime: C ustomized offerings for all major segments of the maritime industry ▪ Commercial Finance: Well established middle - market bank with expertise in targeted industries and products ▪ Business Capital: Leading equipment lessor and lender; among the nation’s largest providers of factoring services ▪ Real Estate Finance: Deep industry relationships, underwriting experience and market expertise ($ Billions) Note: Data a s of 12 /31/15 . Financing & Leasing Assets $20.0 Financing & Leasing Assets $6.9 Financing & Leasing Assets $22.7 Consumer & Community Banking Commercial Banking Transportation Real Estate Finance, 5.4 Business Capital, 7.3 Commercial Finance, 10.0 Mortgage, 5.5 Consumer, 1.4 Rail, 6.7 Maritime, 1 .7 Aerospace, 11.5

31 Commercial Finance: Funded Amount by Product Note: Data a s of 12 /31/15 Transaction Types Funded Amount by Vertical Portfolio Industry Diversification ▪ Customer revenues: $50M - $500M+ ▪ Middle market credits from B to BB ▪ Deal sizes: ~$10M - $50M+ ▪ Terms of 3 to 7 years ▪ Primarily floating rate ▪ Approximately 700 Customers 17% 17% 16% 7% 7% 4% 6% 6% 5% 14% Manufacturing Energy & Utilities Service Industries Healthcare Retail Communications Wholesaling Oil & Gas Extraction Finance and Insurance Other $10.0B 51% 25% 18% 5% 1% Cash Flow ABL Project Finance Equipment Other 34% 26% 20% 12% 6% 2% C&I + Sponsor Finance Energy Comm & Technology + Media & Entertainment Healthcare Corporate Banking Other National middle market bank with deep industry expertise and local commercial banking presence in California

32 Business Capital: Customized Financing Solutions Our Unique Value Proposition Our Competitive Differentiation ▪ Nationally, covering a wide array of industries, through speed and reliability of execution, we consistently deliver financing and banking solutions to help companies successfully compete in the markets they serve ▪ Full banking product suite offering ▪ Equipment & residual e xpertise ▪ Speed and predictability of execution ▪ Flow or structured Vendor programs ▪ Instantaneous credit decision making system ▪ Industry expertise – trusted advisor ▪ Client focused – long tenured client relationships ▪ Technology driven solutions ▪ Providing business loans and equipment leasing solutions from small to large businesses throughout the U.S. ▪ One of the nations leading providers of factoring and financing to the consumer products industry Substantial Cross Sell Opportunities Across CIT

33 Business Capital: Providing Solutions for Small and Middle Market Businesses Note: Data a s of 12/31/15 (1) Distribution based on equipment type as opposed to data in 10 - K which is provided by obligor/lessee industry 20% 18% 10% 10% 10% 8% 6% 6% 2% 10% Transportation Manufacturing Retail Construction Service Industries Oil & Gas Extraction Automotive Services Communications Energy & Utilities Other Direct coverage for large t icket equipment financing of assets that are critical to business operations Deal Size: ~$ 5M - $50M + 3 to 8 year t erms 42% 26% 13% 2% 17% Office Products Technology Communications Transportation Other Small and m id t icket manufacturer and dealer equipment leasing programs and Lender F inance leasing solutions to independents, captives and banks Deal Size : ~$5K - $ 2 0M+ 3 to 5 year t erms $ 3.2B $0.7B Direct and indirect (vendor) coverage for small ticket loans and equipment financing solutions to small and mid size businesses. Cost effective technology - driven processes Deal Size : ~$ 1 K - $500K+ 1 to 5 year t erms Leveraging Strong Brand in Direct & Indirect Market Segments for Continued Growth 37% 19% 14% 9% 8% 3% 3% 3% 5% Service Industries Food Industry Manufacturing Construction Transportation Agriculture Wholesale Trade Retail Trade Other $0.8B Direct Capital Equipment Finance (1) Capital Equipment Finance

34 (1) Includes luggage , toys, sporting goods and general products Full Year 2015: $26B in Factored Volume Client Profile Business Capital: Commercial Services: Market Leader for Factoring Services ▪ Over 700 c lients • Most are privately held • Manufacturers , wholesalers, importers and exporters • Client revenues: $ 5M - $500M+ ▪ ~35% also borrow ▪ Contracts range from 60 days to multi - year ▪ Primarily discretionary lending ▪ Typical client tenure 10+ years Apparel 56% Textiles 9 % Furniture, Home Furnishings 11% Footwear 9 % General Products (1) 9% Provides Credit Protection, Receivables Management and Working Capital Electronics 7% Note: Data as of 12/31/15
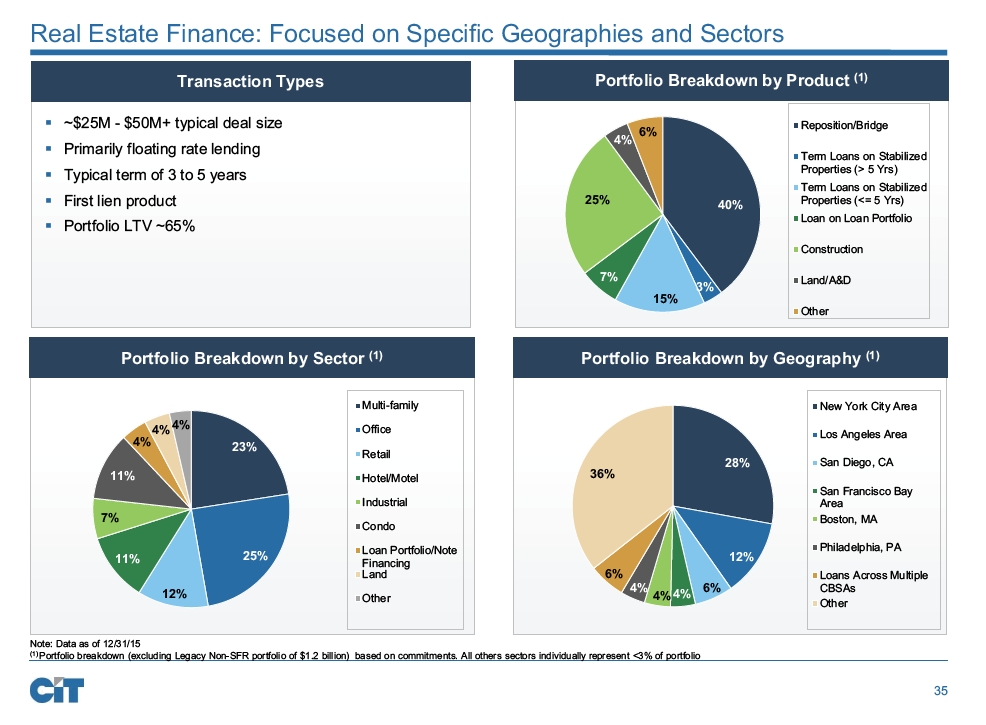
35 Real Estate Finance: Focused on Specific Geographies and Sectors Portfolio Breakdown by Sector (1) Note: Data a s of 12 /31/15 (1) Portfolio breakdown (excluding Legacy Non - SFR portfolio of $1.2 billion) based on commitments. All others sectors individually represent <3% of portfolio ▪ ~$25M - $ 50M+ typical deal size ▪ Primarily floating rate lending ▪ Typical term of 3 to 5 years ▪ First lien p roduct ▪ Portfolio LTV ~65% Transaction Types Portfolio Breakdown by Geography (1) 23% 25% 12% 11% 7% 11% 4% 4% 4% Multi - family Office Retail Hotel/Motel Industrial Condo Loan Portfolio/Note Financing Land Other 28% 12% 6% 4% 4% 4% 6% 36% New York City Area Los Angeles Area San Diego, CA San Francisco Bay Area Boston, MA Philadelphia, PA Loans Across Multiple CBSAs Other Portfolio Breakdown by Product (1) 40% 3% 15% 7% 25% 4% 6% Reposition/Bridge Term Loans on Stabilized Properties (> 5 Yrs) Term Loans on Stabilized Properties (<= 5 Yrs) Loan on Loan Portfolio Construction Land/A&D Other

36 ▪ ~$25 billion of consumer deposits ▪ $5.5 billion of Legacy Consumer Mortgages (forward and reverse) ▪ O ffer a full suite of consumer deposit products and residential mortgage loans through our retail branches and private bankers ▪ The BankOnCIT.com direct channel offers online savings & CDs nationally ▪ Small Business Administration Lending specializes in SBA and Owner - Occupied Commercial Real Estate loans to meet the needs of California’s growing small businesses ▪ We are committed to the Southern California community with our CRA volunteering and lending Consumer & Community Banking: One Person at a Time ® Overview Portfolio Breakdown Ventura Oxnard Los Angeles Pasadena Palm Desert Rancho Santa Fe La Jolla Cities OneWest Branches California 70 Branches in Southern California Los Angeles, an Attractive Market (1) $737 $167 $145 $140 $70 NYC LA Chicago Miami Dallas 2 nd most populous market in the country Home to 7% of U.S. businesses with $40K in sales per household Median HHI income 13% > than national average (1) Bars ($bn) show MSA deposit growth from 2005 - 2015

37 Transportation: At a Glance Note: Data as of 12 /31/15 (1) Financing and leasing assets Transportation $20.0B Assets (1) ($16.4B Operating Leases, $3.5B Loans ex. HFS) Commercial Rail Business Maritime Finance Aerospace ▪ $10.8B of a ssets ▪ Lease, finance or manage 350+ aircraft ▪ 139 ($11.3B) new aircraft on order with manufacturers ▪ ~100 customers ▪ ~50 countries ▪ Provide leasing, lending, asset management, aircraft valuation and advisory services ▪ $0.8B of assets ▪ Provide financing and leasing programs for corporate and private owners of business jets ▪ Service clients in the US and abroad ▪ $6.7B of assets ▪ Lease ~129,000 railcars including ~400 locomotives ▪ ~7K new railcars on order ▪ ~650 customers ▪ Headquarters in Chicago and Paris ▪ Clients in US, Canada, Mexico and throughout Europe ▪ $1.7B of assets ▪ Public launch November 2012 ▪ Offer loans and leases to vessel owners and operators ▪ Assets financed include ocean going and inland cargo vessels, offshore service vessels and drilling rigs

38 Transportation: High Quality Fleets ▪ Operating lease fleet of 284 aircraft ▪ Young, fuel - efficient and technologically advanced aircraft • Weighted average age is ~5 years • 97% of fleet is in - production ▪ In - demand aircraft with broad operator appeal • Primarily narrow body (A320s & 737s) • Select intermediate body (A330s) ▪ Continue to add latest technology aircraft • NEO, MAX, A350, 787 Commercial Air ▪ Total leased f leet of ~129,000 railcars • North America ~116,000 railcars including ~ 400 locomotives • Europe ~ 13,0 00 railcars ▪ Balanced distribution of car types • ~75% freight cars • ~25% tank cars ▪ Largely high - capacity, efficient cars ▪ Young, well - maintained equipment • Average age North American fleet ~12 years • Lower operating/maintenance costs Rail Note: Data as of 12 / 31/15; Commercial Air data based on operating lease fleet and net investment. Rail data based on total leased and unit count.

39 E175 4 B767 5 Other 4 B757 8 E190/E195 16 A330 40 B737 84 A310/A319/A 320/ A321 119 B787 4 C ommercial Air: High Quality Portfolio Operating Lease Aircraft Portfolio (by type) Note: Data as of 12/31/15; d ata based on operating lease fleet and net investment. $9.8 Billion 284 Aircraft 99% 98% 95% 94% 98% 99% 100% Utilization Trends Balanced Expiration Schedule 29 29 30 29 41 2016 2017 2018 2019 2020 # of Aircraft
![]()
40 Commercial Air: Strong Order Book ▪ Ensures access to current and in - demand equipment/technologies ▪ Provides predictable growth ▪ Strengthens relationship with manufacturers and clients ▪ Supply chain is a valuable information source in risk management Note: Data as of 12/31/15, order amounts ex clude deposits and sale - leasebacks Commercial Air (139 Aircraft) $11 Billion of Aircraft on Order Order Book Is a Key Value Driver 0.8 0.9 2.4 3.9 3.2 2016 2017 2018 2019 2020 Strategically Positioned Aircraft Orders by Year ($B) Predominantly New Technology Aircraft Orders by Model 737 (NG) 3 A321 6 737 (MAX) 37 A350 12 A330 (NEO) 15 787 16 A320/A321 (NEO) 50

41 Covered Hopper - Other, 31% Covered Hopper - O&G Related, 9% Tank Cars - Other, 12% Tank Cars - O&G Related, 13% Mill/Coil Gondolas, 11% Coal, 11% Boxcars, 7% Flatcars, 4% Other, 3% Total Cars: ~116,000 Rail: Diversified Fleet Fleet by Type – North American Fleet 99% 98% 95% 94% 98% 99% 96% Utilization Trends Balanced Expiration Schedule Fleet by Type – Europe Fleet 21 24 20 18 23 2016 2017 2018 2019 2020+ # of Rail Cars (in '000) Covered Hoppers, 13% Flat Wagons, 5% Gondola, 17% Other, 19% Tank Cars, 46% Total Cars: ~13,000 O&G = Oil and Gas

42 Maritime: Portfolio Highlights ▪ Gross Yield (2015): 5.1% ▪ $ Committed: $1.7B ▪ $ Outstanding: $1.7B ▪ # Vessels: 199 ▪ # Clients: 39 ▪ Average Term: 4 Yrs . ▪ Average LTV: 75% ▪ Average Vessel Age: 8 Yrs. Portfolio Overview as of December 31, 2015 (1) Broker CDs 91% Transaction Types Containership 4% Dry Bulk 29% Gas 17% Offshore 9% Crude 11% Tankers Product 28% Chemical Tanker 2% ▪ Offer senior loans, bareboat charters, financing and advisory services to owners and operators of ocean going cargo vessels ▪ Assets financed include ocean going and inland cargo vessels, offshore service vessels and drilling rigs ▪ Obligors consist of traditional ship owners and joint ventures, typically featuring an equity sponsor and ship owner/operator ▪ Generally floating rate loans with average term of 4 - 5 years and LTV of 75% (1) Portfolio overview based on the shipping collateral of the debt outstanding

43
Serious News for Serious Traders! Try StreetInsider.com Premium Free!
You May Also Be Interested In
- Eaton to announce first quarter 2024 earnings on April 30, 2024
- Gold Terra Announces Closing of $2.5 Million Private Placement, With Eric Sprott as a Lead Investor
- First Trust Energy Infrastructure Fund Declares its Final Common Share Distribution Dates
Create E-mail Alert Related Categories
SEC FilingsSign up for StreetInsider Free!
Receive full access to all new and archived articles, unlimited portfolio tracking, e-mail alerts, custom newswires and RSS feeds - and more!
