

Form 8-K CIT GROUP INC For: Jul 28
 Tweet
Tweet Share
ShareUNITED STATES
SECURITIES AND EXCHANGE COMMISSION
Washington, D.C. 20549
FORM 8-K
CURRENT REPORT
Pursuant to Section 13 or 15(d) of the
Securities Exchange Act of 1934
Date of Report (Date of earliest event reported): July 28, 2016 (July 28, 2016)
CIT GROUP INC.
(Exact name of registrant as specified in its charter)
| Delaware | 001-31369 | 65-1051192 |
| (State or other | (Commission | (IRS Employer |
| jurisdiction of | File Number) | Identification No.) |
| incorporation) |
11 West 42nd Street
New York, New York 10036
(Address of registrant's principal executive office)
Registrant's telephone number, including area code: (212) 461-5200
(Former Name or Former Address, if Changed Since Last Report)
Check the appropriate box below if the Form 8-K filing is intended to simultaneously satisfy the filing obligation of the registrant under any of the following provisions (see General Instruction A.2. below):
[ ] Written communications pursuant to Rule 425 under the Securities Act (17 CFR 230.425)
[ ] Soliciting material pursuant to Rule 14a-12 under the Exchange Act (17 CFR 240.14a-12)
[ ] Pre-commencement communications pursuant to Rule 14d-2(b) under the Exchange Act (17 CFR 240.14d-2(b))
[ ] Pre-commencement communications pursuant to Rule 13e-4(c) under the Exchange Act (17 CFR 240.13e-4(c))
Section 2 – Financial Information
Item 2.02. Results of Operations and Financial Condition.
This Current Report on Form 8-K includes as an exhibit a press release, dated July 28, 2016, reporting the financial results of CIT Group Inc. (the “Company”) as of and for the quarter ended June 30, 2016. The press release is attached as Exhibit 99.1. This press release includes certain non-GAAP financial measures. A reconciliation of those measures to the most directly comparable GAAP measures is included as a table to the press release. The information furnished under this Item 2.02, including Exhibit 99.1, shall be considered filed for purposes of the Securities Exchange Act of 1934, as amended (the “Exchange Act”).
Section 7 – Regulation FD
Item 7.01. Regulation FD Disclosure.
In addition, this Form 8-K includes a copy of the Company’s presentation to analysts and investors of its Second Quarter 2016 Financial Results for the quarter ended June 30, 2016, which is attached as Exhibit 99.2. The information included in Exhibit 99.2 shall not be considered filed for purposes of the Exchange Act. The Company also provides supplementary financial information on its website, which is not incorporated by reference in this Form 8-K.
Section 9 – Financial Statements and Exhibits
Item 9.01. Financial Statements and Exhibits.
| (d) | Exhibits. |
| 99.1 | Press release issued by CIT Group Inc. on July 28, 2016 reporting its financial results as of and for the quarter ended June 30, 2016. | |
|
99.2
|
Presentation by CIT Group Inc. on July 28, 2016 regarding its Second Quarter 2016 Financial Results.
|
Forward-Looking Statements
This Form 8-K contains forward-looking statements within the meaning of applicable federal securities laws that are based upon our current expectations and assumptions concerning future events, which are subject to a number of risks and uncertainties that could cause actual results to differ materially from those anticipated. The words “expect,” “anticipate,” “estimate,” “forecast,” “initiative,” “objective,” “plan,” “goal,” “project,” “outlook,” “priorities,” “target,” “intend,” “evaluate,” “pursue,” “commence,” “seek,” “may,” “would,” “could,” “should,” “believe,” “potential,” “continue,” or the negative of any of those words or similar expressions is intended to identify forward-looking statements. All statements contained in this Form 8-K, other than statements of historical fact, including without limitation, statements about our plans, strategies, prospects and expectations regarding future events and our financial performance, are forward-looking statements that involve certain risks and uncertainties. While these statements represent our current judgment on what the future may hold, and we believe these judgments are reasonable, these statements are not guarantees of any events or financial results, and our actual results may differ materially. Important factors that could cause our actual results to be materially different from our expectations include, among others, the risk that CIT is unsuccessful in implementing its strategy and business plan, the risk that CIT is unable to react to and address key business and regulatory issues, the risk that CIT is unable to achieve the projected revenue growth from its new business initiatives or the projected expense reductions from efficiency improvements, and the risk that CIT becomes subject to liquidity constraints and higher funding costs. We describe these and other risks that could affect our results in Item 1A, “Risk Factors,” of our latest Annual Report on Form 10-K for the year ended December 31, 2015, which was filed with the Securities and Exchange Commission. Accordingly, you should not place undue reliance on the forward-looking statements contained in this Form 8-K. These forward-looking statements speak only as of the date on which the statements were made. CIT undertakes no obligation to update publicly or otherwise revise any forward-looking statements, except where expressly required by law.
2
SIGNATURES
Pursuant to the requirements of the Securities Exchange Act of 1934, the Registrant has duly caused this report to be signed on its behalf by the undersigned hereunto duly authorized.
| CIT GROUP INC. | ||
| (Registrant) | ||
| | ||
| By: | /s/ E. Carol Hayles | |
| E. Carol Hayles | ||
| Executive Vice President & | ||
| Chief Financial Officer | ||
Dated: July 28, 2016
3
Exhibit 99.1
1

FOR IMMEDIATE RELEASE
CIT REPORTS SECOND QUARTER 2016 NET INCOME OF $14 MILLION ($0.07 PER DILUTED SHARE);
INCOME FROM CONTINUING OPERATIONS OF $181 MILLION ($0.90 PER DILUTED SHARE)
- Net Income includes After-Tax Charges of ($163) million ($0.80) Per Diluted Share Related to Discontinued Operations – Increased Interest Curtailment Reserve and related contingent liabilities in Financial Freedom, the reverse mortgage servicing business that was part of the OneWest Bank acquisition in 2015;
- Stable Core Operating Trends – Pre-tax income from continuing operations improved over $70 million from the prior quarter resulting from a lower credit provision; Non-accrual loans fell by 4%;
- Advanced Commercial Air Separation – Filed Initial Form 10 Registration Statement for C2 Aviation Capital and progressed to second round of bidding in conjunction with our dual track process;
- Continued Portfolio Optimization – Executed a definitive agreement to sell our Canadian Equipment and Corporate Finance Business; Transferred remaining Business Air assets to held for sale;
- Maintained Strong Capital Ratios – Common Equity Tier 1 of 13.4% and Total Capital Ratio of 14.1%.
NEW YORK, NY – July 28, 2016 – CIT Group Inc. (NYSE: CIT), today reported net income of $14 million, $0.07 per diluted share, for the quarter ended June 30, 2016, compared to net income of $115 million, $0.66 per diluted share for the year-ago quarter. Income from continuing operations for the second quarter was $181 million, $0.90 per diluted share compared to $115 million, $0.66 per diluted share in the year-ago quarter.
Net income for the six month period ended June 30, 2016 was $161 million, $0.80 per diluted share, compared to $219 million, $1.24 per diluted share, for the period ended June 30, 2015. Income from continuing operations for the six month period ended June 30, 2016 was $333 million, $1.65 per diluted share, compared to $219 million, $1.24 per diluted share for the six month period ended June 30, 2015.
The loss of $167 million in discontinued operations relates to Financial Freedom, a reverse mortgage servicing business that was part of the OneWest Bank acquisition in August 2015. As disclosed in CIT’s Form 10-K for fiscal year 2015, CIT determined that there was a material weakness related to the Home Equity Conversion Mortgage (“HECM”) interest curtailment reserve associated with this business. During the current quarter, as a result of the ongoing process to remediate the material weakness and taking into consideration the investigation being conducted by the Office of Inspector General (“OIG”) for the Department of Housing and Urban Development, the Company recorded additional reserves, due to a change in estimate, of $230 million. This review and the related investigation are ongoing and, as a result, the amount of this reserve could change prior to the filing of the current quarter Form 10-Q.
2
“We are disappointed that the additional charges arising from the legacy Financial Freedom business, which was part of the OneWest Bank acquisition, offset the improved earnings from continuing operations. Despite the impact it had on our financial results, we made good progress this quarter advancing our strategic goals,” said Ellen Alemany, Chief Executive Officer. “We filed the initial Form 10 Registration Statement for C2 Aviation Capital as part of our Commercial Air separation and have advanced to the second round of the bidding process. We entered into a definitive agreement to sell our Canadian Equipment and Corporate Finance Business and we transferred our remaining Business Air assets to held for sale. We remain committed to executing on our strategy to grow our core businesses, reduce operating expenses and improve returns.”
3
Summary of Second Quarter Financial Results from Continuing Operations
All references in this section relate to continuing operations and therefore do not include any of the assets or results of operations of the discontinued operations.
On August 3, 2015, CIT acquired IMB HoldCo LLC, the parent company of OneWest Bank, which impacts the comparability of current results to prior periods. The current and prior quarters reflect a full quarter of OneWest Bank’s results of operations while the prior-year period does not include any results from OneWest Bank.
Selected Financial Highlights (Continuing Operations)
| Change from: | ||||||||||||||||||||
| 2Q16 | 1Q16 | 2Q15 | Prior Quarter* | Prior Year* | ||||||||||||||||
| ($ in millions, except per share data) | ||||||||||||||||||||
| Pre-tax income | $ | 275 | $ | 204 | $ | 153 | $ | 71 | $ | 122 | ||||||||||
| Net income | $ | 181 | $ | 152 | $ | 115 | $ | 29 | $ | 66 | ||||||||||
| Diluted earnings per share (EPS) | $ | 0.90 | $ | 0.75 | $ | 0.66 | $ | 0.14 | $ | 0.24 | ||||||||||
| Pre-tax return on average earning assets (ROAEA) | 1.86 | % | 1.38 | % | 1.49 | % | 0.48 | % | 0.37 | % | ||||||||||
| Return on average earning assets (ROAEA) | 1.22 | % | 1.02 | % | 1.12 | % | 0.20 | % | 0.10 | % | ||||||||||
| Adjusted return on tangible common equity (ROTCE)(1) | 8.26 | % | 7.08 | % | 5.89 | % | 1.18 | % | 2.37 | % | ||||||||||
| Net finance margin(1) | 3.65 | % | 3.74 | % | 3.33 | % | -0.08 | % | 0.32 | % | ||||||||||
| Net efficiency ratio(1) | 49.8 | % | 49.2 | % | 57.4 | % | 0.60 | % | -7.58 | % | ||||||||||
| Tangible book value per share (TBVPS)(1) | $ | 48.45 | $ | 48.39 | $ | 47.51 | $ | 0.06 | $ | 0.93 | ||||||||||
| CET 1 Ratio(2) | 13.4 | % | 13.1 | % | 14.4 | % | 0.3 | % | -1.0 | % | ||||||||||
| Total Capital Ratio(2) | 14.1 | % | 13.8 | % | 15.1 | % | 0.3 | % | -1.0 | % | ||||||||||
| Net charge-offs as % of AFR | 0.53 | % | 0.65 | % | 0.48 | % | -0.12 | % | 0.05 | % | ||||||||||
| Allowance for loan losses as % of finance receivables | 1.31 | % | 1.29 | % | 1.14 | % | 0.02 | % | 0.17 | % | ||||||||||
| Average earning assets | $ | 59,229 | $ | 59,206 | $ | 41,159 | $ | 23 | $ | 18,070 | ||||||||||
| Financing and leasing assets | $ | 49,725 | $ | 50,286 | $ | 35,846 | $ | (561 | ) | $ | 13,879 | |||||||||
| * Certain balances may not sum due to rounding. | ||||||||||||||||||||
| (1) See "Non-GAAP Measurements" at the end of this press release and page 23 for reconciliation of non-GAAP to GAAP financial information. | ||||||||||||||||||||
| (2) Ratios based on the fully phased-in basis. | ||||||||||||||||||||
Income from continuing operations of $181 million included net after-tax charges of $9 million from discrete items related to our strategic initiatives. Discrete items included charges related to a goodwill impairment on the business aircraft assets transferred to held for sale and a restructuring charge resulting from operating expense reduction initiatives. In addition to these items, income this quarter included a lower credit provision primarily in the oil and gas portfolio and a mark-to-market benefit on the total return swap (“TRS”).
Tangible book value per share1 increased slightly to $48.45. Estimated Common Equity Tier 1 and Total Capital ratios at June 30, 2016 increased to 13.4% and 14.1%, respectively, as calculated under the fully phased-in Regulatory Capital Rules. Average earning assets2 for the June 30, 2016 quarter were relatively flat at $59.2 billion reflecting growth in Transportation Finance offset by a reduction in Commercial Banking and run-off in the
1 Adjusted ROATCE, Tangible book value and tangible book value per share are non-GAAP measures. See “Non-GAAP Measurements” at the end of this press release and page 25 for reconciliation of non-GAAP to GAAP financial information.
2 Average earning asset components include interest earning cash, investments, securities and indemnification assets. See “Non-GAAP Measurements” at the end of this press release and page 25 for reconciliation of Earning Assets non-GAAP to GAAP financial information.
4
liquidating portfolios. The ROTCE3 of 8.26% increased from the prior quarter reflecting earnings from continuing operations while the increase from the year-ago quarter reflects the lower capital levels primarily due to the acquisition of OneWest Bank.
Income Statement Highlights:
| Net Finance Revenue* | Change from: | |||||||||||||||||||
| ($ in millions) | 2Q16 | 1Q16 | 2Q15 | Prior Quarter | Prior Year | |||||||||||||||
| Interest income | $ | 495 | $ | 495 | $ | 284 | $ | (0 | ) | $ | 212 | |||||||||
| Rental income on operating leases | 569 | 575 | 532 | (6 | ) | 38 | ||||||||||||||
| Finance revenue | 1,065 | 1,071 | 816 | (6 | ) | 249 | ||||||||||||||
| Interest expense | (283 | ) | (286 | ) | (265 | ) | 4 | (17 | ) | |||||||||||
| Depreciation on operating lease equipment | (176 | ) | (175 | ) | (158 | ) | (1 | ) | (19 | ) | ||||||||||
| Maintenance and other operating lease expenses | (65 | ) | (56 | ) | (49 | ) | (9 | ) | (16 | ) | ||||||||||
| Net finance revenue | $ | 541 | $ | 553 | $ | 343 | $ | (12 | ) | $ | 198 | |||||||||
| Average earning assets | $ | 59,229 | $ | 59,206 | $ | 41,159 | $ | 23 | $ | 18,070 | ||||||||||
| Net finance margin | 3.65 | % | 3.74 | % | 3.33 | % | -0.08 | % | 0.32 | % | ||||||||||
| * Certain balances may not sum due to rounding. | ||||||||||||||||||||
Net finance revenue4 was $541 million in the current quarter, compared to $553 million in the prior quarter and $343 million in the year-ago quarter. Net finance revenue as a percentage of average earning assets (“net finance margin”) decreased from the prior quarter and increased from the year-ago quarter. The decreases in net finance revenue and net finance margin from the prior quarter were driven primarily by higher maintenance and other operating lease costs and lower rental revenue as the prior quarter reflected elevated collections on remarketed aircraft.
Average earning assets were essentially flat compared to the prior quarter reflecting growth in Aerospace, Rail, Real Estate Finance, and Other Consumer Banking, driven by new business volume, offset by assets sales and higher prepayments in Commercial Finance and run-off in the liquidating portfolios.
The increases in net finance revenue, net finance margin and average earning assets from the year-ago quarter reflected the benefits from the OneWest Bank acquisition.
3 Adjusted Return on Tangible Common Equity, which adjusts tangible common equity for the reversal of the valuation allowance and the amortization of intangibles in the numerator and the disallowed deferred tax asset related to regulatory capital in the denominator, is a non-GAAP measure. See “Non-GAAP Measurements” at the end of this press release and page 25 for reconciliation of non-GAAP to GAAP financial information.
4 Net finance revenue, net finance margin and net operating lease revenue are non-GAAP measures. See “Non-GAAP Measurements” at the end of this press release and page 25 for reconciliation of non-GAAP to GAAP financial information.
5
| Other Income* | Change from: | |||||||||||||||||||
| ($ in millions) | 2Q16 | 1Q16 | 2Q15 | Prior Quarter | Prior Year | |||||||||||||||
| Fee revenues | $ | 28 | $ | 33 | $ | 25 | $ | (5 | ) | $ | 3 | |||||||||
| Gains on sales of leasing equipment | 28 | 11 | 22 | 17 | 7 | |||||||||||||||
| Factoring commissions | 24 | 26 | 27 | (2 | ) | (3 | ) | |||||||||||||
| Net gain (losses) on derivatives and foreign currency exchange | 10 | 9 | (5 | ) | 1 | 15 | ||||||||||||||
| Gains on loan and portfolio sales | 8 | 0 | 2 | 7 | 6 | |||||||||||||||
| Gains (losses) on investments | 6 | (4 | ) | 4 | 10 | 3 | ||||||||||||||
| Gain on OREO sales | 4 | 2 | - | 2 | 4 | |||||||||||||||
| Impairment on assets held for sale | (17 | ) | (22 | ) | (11 | ) | 5 | (6 | ) | |||||||||||
| Other revenues | 13 | 46 | (0 | ) | (32 | ) | 14 | |||||||||||||
| Total other income | $ | 104 | $ | 101 | $ | 64 | $ | 3 | $ | 41 | ||||||||||
| * Certain balances may not sum due to rounding. | ||||||||||||||||||||
Other income of $104 million included gains on assets sales, primarily in Rail, mostly offset by impairment charges on certain rail assets when transferred to held for sale, and a $4 million goodwill impairment charge on the remaining business aircraft assets, also transferred to assets held for sale. The current quarter also included a $9 million mark-to-market benefit on the TRS and a $5 million mark-to-market benefit on the mortgage backed securities. The prior quarter included $10 million of net benefits from international business exits,$18 million benefit from the mark-to-market on the TRS partially offset by a $4 million mark-to-market charge on the mortgage backed securities. The year-ago quarter included a $9 million tax-related charge (that was fully offset with a benefit to the tax provision) and a $6 million negative mark-to-market on the TRS.
| Operating Expenses* | Change from: | |||||||||||||||||||
| ($ in millions) | 2Q16 | 1Q16 | 2Q15 | Prior Quarter | Prior Year | |||||||||||||||
| Compensation and benefits | $ | (156 | ) | $ | (172 | ) | $ | (136 | ) | $ | 16 | $ | (20 | ) | ||||||
| Technology | (31 | ) | (30 | ) | (25 | ) | (1 | ) | (6 | ) | ||||||||||
| Professional fees | (40 | ) | (39 | ) | (21 | ) | (1 | ) | (19 | ) | ||||||||||
| Net occupancy expense | (17 | ) | (18 | ) | (9 | ) | 1 | (9 | ) | |||||||||||
| Advertising and marketing | (4 | ) | (5 | ) | (7 | ) | 1 | 2 | ||||||||||||
| Other expenses | (73 | ) | (57 | ) | (37 | ) | (16 | ) | (36 | ) | ||||||||||
| Operating expenses before provision for severance and facilities exiting and intangible asset amortization | (321 | ) | (322 | ) | (233 | ) | - | (88 | ) | |||||||||||
| Provision for severance and facilities exiting activities | (10 | ) | (20 | ) | (1 | ) | 11 | (9 | ) | |||||||||||
| Intangible asset amortization | (6 | ) | (6 | ) | (1 | ) | - | (6 | ) | |||||||||||
| Total operating expenses | $ | (338 | ) | $ | (349 | ) | $ | (235 | ) | $ | 11 | $ | (103 | ) | ||||||
| Net efficiency ratio | 49.8 | % | 49.2 | % | 57.4 | % | -0.6 | % | 7.6 | % | ||||||||||
| * Certain balances may not sum due to rounding. | ||||||||||||||||||||
Operating expenses excluding restructuring costs and intangible asset amortization5 were relatively flat to the prior quarter at $321 million. The current quarter reflected elevated costs primarily associated with the Commercial Air separation and higher FDIC insurance, offset by lower employee cost as the prior quarter included the annual benefit restarts. The current quarter also included $8 million of other expenses related to real estate owned (“REO”) that occurred in prior periods. The increase from the prior year reflected the addition of OneWest Bank. The net efficiency ratio5 of 50% reflected lower net finance revenue partially offset by lower operating
5 Operating expenses excluding restructuring costs and intangible asset amortization and Net efficiency ratio is a non-GAAP measure. See “Non-GAAP Measurements” at the end of this press release and page 25 for reconciliation of non-GAAP to GAAP financial information.
6
expenses as compared to the prior quarter and improvement from the prior year reflects the addition of OneWest Bank. Headcount at June 30, 2016 was 4,650, down from 4,740 in the prior quarter, due to strategic initiatives, and up from 3,360 a year-ago, due to the OneWest Bank acquisition. Restructuring costs in this quarter and the prior quarter related to our strategic initiatives to reduce operating expenses, while the amortization of intangibles was primarily due to the OneWest Bank acquisition.
Income Taxes
The provision for income taxes of $94 million for the quarter included $4 million of net discrete tax expense. The prior quarter had an income tax expense of $53 million for the quarter, including $14 million of discrete tax benefits from the resolution of a tax position on an international portfolio that had been previously sold. The current effective tax rate was 34% for the quarter, up from 26% in the prior quarter and 25% in the year-ago quarter. The increase in the effective tax rate is mainly attributable to the impact of discrete items compared to the prior quarter and increased domestic earnings, which shifted the geographic mix of earnings compared to the year-ago quarter. Cash taxes were a net payment of $6 million compared to less than $1 million in the prior quarter and $4 million in the year-ago quarter.
7
Balance Sheet Highlights:
| Earning Assets* | Change from: | |||||||||||||||||||
| ($ in millions) | 2Q16 | 1Q16 | 2Q15 | Prior Quarter | Prior Year | |||||||||||||||
| Loans (including assets held for sale) | $ | 32,700 | $ | 33,475 | $ | 20,448 | $ | (775 | ) | $ | 12,252 | |||||||||
| Operating lease equipment, net (including assets held for sale) | 17,025 | 16,811 | 15,398 | 214 | 1,627 | |||||||||||||||
| Financing and Leasing Assets | 49,725 | 50,286 | 35,846 | (561 | ) | 13,879 | ||||||||||||||
| Interest bearing cash | 7,083 | 7,135 | 4,225 | (52 | ) | 2,858 | ||||||||||||||
| Investment securities | 3,229 | 2,897 | 1,693 | 332 | 1,536 | |||||||||||||||
| Indemnification asset | 376 | 389 | - | (14 | ) | 376 | ||||||||||||||
| Securities purchased under agreements to resell | - | - | 750 | - | (750 | ) | ||||||||||||||
| Credit balances of factoring clients | (1,215 | ) | (1,361 | ) | (1,373 | ) | 146 | 158 | ||||||||||||
| Total Earning Assets | $ | 59,197 | $ | 59,346 | $ | 41,140 | $ | (149 | ) | $ | 18,057 | |||||||||
| * Certain balances may not sum due to rounding. | ||||||||||||||||||||
Earning assets at June 30, 2016 declined slightly from the prior quarter, as collections and sales of loans offset $2.8 billion in new originations. The increase from the year-ago quarter principally reflects the assets acquired from OneWest Bank.
Interest bearing cash and investment securities were $10.3 billion at June 30, 2016, and consisted of $7.1 billion of cash ($0.6 billion of which was restricted cash), and $3.2 billion of investment securities, primarily debt securities, Federal Home Loan Bank (“FHLB”) stock and equities. The increase in investment securities from the prior quarter reflects the initiative to deploy cash into liquid investments. In addition, there was $1.0 billion of non-interest bearing cash and other restricted balances.
Of the total cash and investment securities $1.7 billion of the interest bearing cash and investment securities was at the financial holding company, $8.2 billion was at CIT Bank and the remaining $1.4 billion includes amounts at the operating subsidiaries and restricted balances. In addition, there was $1.0 billion of non-interest bearing cash primarily at the operating subsidiaries and other restricted balances.
| Deposits and Borrowings* | Change from: | |||||||||||||||||||
| ($ in millions) | 2Q16 | 1Q16 | 2Q15 | Prior Quarter | Prior Year | |||||||||||||||
| Total Deposits | $ | 32,879 | $ | 32,893 | $ | 17,268 | $ | (14 | ) | $ | 15,611 | |||||||||
| Unsecured borrowings | $ | 10,591 | $ | 10,587 | $ | 10,684 | $ | 4 | $ | (93 | ) | |||||||||
| Secured borrowings | 6,919 | 7,425 | 5,645 | (506 | ) | 1,274 | ||||||||||||||
| Total Borrowings | $ | 17,510 | $ | 18,013 | $ | 16,330 | $ | (502 | ) | $ | 1,181 | |||||||||
| * Certain balances may not sum due to rounding. | ||||||||||||||||||||
Deposits were essentially flat from the prior quarter. The decline in secured borrowings related to the amortization, redemption and maturities of structured financings. The increase in secured borrowings from June 30, 2015 primarily reflected FHLB borrowings related to the acquisition of OneWest Bank in the third quarter of 2015, offset by a reduction in other secured borrowings. At June 30, 2016, deposits represented approximately 65% of CIT’s funding, with unsecured and secured borrowings comprising 21% and 14% of the funding mix, respectively. The weighted average coupon rate on outstanding deposits and borrowings was 2.20% at June 30, 2016, down from 2.22% at March 31, 2016 and 3.04% at June 30, 2015.
8
| Capital* | Change from: | |||||||||||||||||||
| ($ in millions, except per share data) | 2Q16 | 1Q16 | 2Q15 | Prior Quarter | Prior Year | |||||||||||||||
| Common Stockholders' Equity | $ | 11,124 | $ | 11,126 | $ | 8,807 | $ | (2 | ) | $ | 2,317 | |||||||||
| Tangible Common Equity | $ | 9,786 | $ | 9,760 | $ | 8,220 | $ | 25 | $ | 1,566 | ||||||||||
| Total risk-based capital(1) | $ | 9,539 | $ | 9,524 | $ | 8,409 | $ | 15 | $ | 1,130 | ||||||||||
| Risk-weighted assets(1) | $ | 67,733 | $ | 69,192 | $ | 55,665 | $ | (1,459 | ) | $ | 12,068 | |||||||||
| Book value per share (BVPS) | $ | 55.07 | $ | 55.16 | $ | 50.91 | $ | (0.09 | ) | $ | 4.16 | |||||||||
| Tangible book value per share (TBVPS) | $ | 48.45 | $ | 48.39 | $ | 47.51 | $ | 0.06 | $ | 0.93 | ||||||||||
| CET 1 Ratio(1) | 13.4 | % | 13.1 | % | 14.4 | % | 0.3 | % | -1.0 | % | ||||||||||
| Total Capital Ratio(1) | 14.1 | % | 13.8 | % | 15.1 | % | 0.3 | % | -1.0 | % | ||||||||||
| Tier 1 Leverage Ratio(1) | 13.9 | % | 13.8 | % | 17.7 | % | 0.1 | % | -3.8 | % | ||||||||||
| * Certain balances may not sum due to rounding. | ||||||||||||||||||||
| (1) Balances and ratios based on the fully phased-in basis. | ||||||||||||||||||||
Common stockholders’ equity and tangible common equity were essentially unchanged from the prior quarter. The acquisition of OneWest Bank was the main contributor to the increase from June 30, 2015, primarily due to the issuance of common shares and the reversal of the valuation allowance on our Federal deferred tax asset in the third quarter of 2015. Tangible common equity also increased from June 30, 2015, but by a lower amount due to the increase in goodwill and intangibles resulting from the acquisition of OneWest Bank. While regulatory capital also reflected the trends noted above, the increase was less than the common equity increase since the majority of the deferred tax asset balance is disallowed for regulatory capital purposes. All regulatory capital ratios increased from the prior quarter reflecting a reduction in risk weighted assets. The decline in capital ratios from the prior year reflected the acquisition of OneWest Bank as growth in regulatory capital was more than offset by the increase in the risk-weighted assets. The ratios presented are estimated Common Equity Tier 1 and Total Capital ratios under the fully phased-in Regulatory Capital Rules.
Book value per share and tangible book value per share were relatively flat. Both amounts also increased from June 30, 2015, as the increase in equity outpaced the increase in shares outstanding.
In July 2016, the Board approved a $0.15 cash dividend payable on August 26, 2016 to common shareholders of record as of August 12, 2016.
9
Asset Quality
| Asset Quality* | Change from: | |||||||||||||||||||
| ($ in millions) | 2Q16 | 1Q16 | 2Q15 | Prior Quarter | Prior Year | |||||||||||||||
| Net charge-offs (NCO) | $ | 41 | $ | 51 | $ | 24 | $ | (10 | ) | $ | 18 | |||||||||
| NCO % of AFR | 0.53 | % | 0.65 | % | 0.48 | % | -0.12 | % | 0.05 | % | ||||||||||
| Non-accrual | $ | 283 | $ | 295 | $ | 198 | $ | (12 | ) | $ | 85 | |||||||||
| OREO | $ | 90 | $ | 100 | $ | - | $ | (10 | ) | $ | 90 | |||||||||
| Provision for credit losses | $ | 28 | $ | 99 | $ | 18 | $ | (71 | ) | $ | 10 | |||||||||
| Total Portfolio Allowance as a % of Finance Receivables (FR) | 1.31 | % | 1.29 | % | 1.14 | % | 0.02 | % | 0.17 | % | ||||||||||
| Allowance for loan losses plus principal loss discount as % of FR (before principal loss discount) / Commercial | 1.83 | % | 1.87 | % | 1.79 | % | -0.04 | % | 0.04 | % | ||||||||||
| * Certain balances may not sum due to rounding. | ||||||||||||||||||||
Excluding the impact relating to assets transferred to held for sale in all periods, net charge-offs were $16 million (0.21% of average finance receivables), compared to $42 million (0.53%) in the prior quarter and $22 million (0.45%) in the year-ago quarter. The current quarter net charge-offs includes $17 million in the energy (oil and gas) portfolio, of which $10 million related to loans which were sold or transferred to assets held for sale. Prior quarter net charge-offs included $15 million in the energy (oil and gas) portfolio .
Non-accrual loans of $283 million (0.93% of finance receivables) decreased from the prior quarter as charge-offs and asset sales generally offset a modest level of new non-accruals. The increase compared to the year-ago quarter is primarily due to increases in the energy portfolio. The provision for credit losses decreased from the prior quarter elevated levels, as portfolio quality was relatively unchanged and charge-offs, excluding the impact relating to assets transferred to held for sale, were lower.
The allowance for loan losses was $399 million (1.31% of finance receivables, 1.55% excluding loans subject to loss sharing agreements with the FDIC) at June 30, 2016, compared to $405 million (1.29% of finance receivables, 1.52% excluding loans subject to loss sharing agreements with the FDIC) at March 31, 2016 and $351 million (1.79% of finance receivables) at June 30, 2015. The slight decrease in allowance for loan losses from the prior quarter primarily reflected a reduction due to energy related charge-offs and lower loan balances, partially offset by approximately $10 million increase in the reserve for maritime finance loans, while the increase from the year-ago quarter was concentrated in the energy and maritime portfolios. Including the impact of the principal loss discount on credit impaired loans, which is essentially a reserve for credit losses on the discounted loans, the commercial loan allowance to finance receivables was 1.83% compared to 1.87% at March 31, 2016. The consumer loans ratio was 7.20% at June 30, 2016 and 7.86% at March 31, 2016, respectively, as most of the consumer loans purchased were credit impaired and are partially covered by loss sharing agreements with the FDIC. The decrease from the prior quarter was driven by the shift in asset mix as new originations offset the run-off of the purchased credit impaired portfolio.
CIT’s loans to the oil and gas industry totaled $0.8 billion or 2.7% of total loans at June 30, 2016, of which 47% were criticized. The decline of $0.1 billion in oil and gas loans was driven by loan sales and pay downs. The portfolio has loss coverage of about 10.5% of the principal balance, reflecting the purchase accounting discount for loans acquired from OneWest Bank and the allowance for loan losses. If market conditions remain the same, the portfolio will likely experience additional downward credit migration.
10
Commercial Banking
| Earnings Summary* | Change from: | |||||||||||||||||||
| ($ in millions) | 2Q16 | 1Q16 | 2Q15 | Prior Quarter | Prior Year | |||||||||||||||
| Interest income | $ | 289 | $ | 287 | $ | 186 | $ | 2 | $ | 103 | ||||||||||
| Rental income on operating leases | 29 | 27 | 24 | 2 | 5 | |||||||||||||||
| Interest expense | (75 | ) | (74 | ) | (65 | ) | (1 | ) | (10 | ) | ||||||||||
| Depreciation on operating lease equipment | (22 | ) | (20 | ) | (18 | ) | (2 | ) | (4 | ) | ||||||||||
| Net finance revenue | 222 | 221 | 128 | 1 | 94 | |||||||||||||||
| Other income | 61 | 56 | 67 | 5 | (6 | ) | ||||||||||||||
| Provision for credit losses | (11 | ) | (74 | ) | (18 | ) | 62 | 7 | ||||||||||||
| Operating expenses | (149 | ) | (158 | ) | (133 | ) | 10 | (16 | ) | |||||||||||
| Income before income taxes | $ | 122 | $ | 44 | $ | 44 | $ | 78 | $ | 78 | ||||||||||
| Select Average Balances | ||||||||||||||||||||
| Average finance receivables | $ | 21,041 | $ | 21,131 | $ | 15,041 | $ | (90 | ) | $ | 6,000 | |||||||||
| Average earning assets | $ | 20,575 | $ | 20,727 | $ | 14,502 | $ | (152 | ) | $ | 6,073 | |||||||||
| Statistical Data | ||||||||||||||||||||
| Pre-tax ROAEA | 2.38 | % | 0.85 | % | 1.22 | % | 1.53 | % | 1.16 | % | ||||||||||
| Net finance margin | 4.31 | % | 4.26 | % | 3.52 | % | 0.05 | % | 0.79 | % | ||||||||||
| New business volume | $ | 2,048 | $ | 1,581 | $ | 1,523 | $ | 467 | $ | 525 | ||||||||||
| Net efficiency ratio | 52.1 | % | 56.8 | % | 67.9 | % | 4.7 | % | 15.8 | % | ||||||||||
| * Certain balances may not sum due to rounding. | ||||||||||||||||||||
Commercial Banking pre-tax earnings increased from the prior quarter due to lower credit costs and operating expenses, while the increase from the year-ago quarter also reflects the addition from OneWest Bank.
Financing and leasing assets, which comprise the majority of earning assets, were $21.5 billion at June 30, 2016, down slightly from $22.0 billion at March 31, 2016, mostly driven by the decrease in financing and leasing assets in Commercial Finance, and up from $15.4 billion a year-ago, reflecting the acquisition of OneWest Bank. New lending and leasing volume exceeded $2 billion and was up from the prior and year-ago quarters, driven by strong origination activity in Real Estate Finance, while factored volume was down from both the prior and year-ago quarters.
Net finance revenue was essentially flat to the prior quarter, and included interest recoveries of $6 million on a loan previously charged off. The increase from the year-ago quarter reflected higher earning assets and purchase accounting accretion on loans acquired from OneWest Bank. Net finance margin of 4.31% was up slightly from the prior and year-ago quarters from interest recoveries on loans previously charged off. In addition, the increase from the prior year was also due to purchase accounting accretion on acquired loans.
Other income increased from the prior quarter primarily due to gains on asset sales and recoveries of previous impairments on assets held for sale, partially offset by lower capital market fees and factoring commissions. The decline from the year-ago quarter reflected lower gains on asset sales and lower factoring commissions.
Operating expenses decreased from the prior quarter, as the prior quarter included higher legal expenses in Commercial Finance and higher sales and local taxes in Business Capital. The increase from the year-ago quarter reflected the acquisition of OneWest Bank.
11
Net charge-offs were $35 million (0.66% of average finance receivables), compared to $32 million (0.60%) in the prior quarter and $25 million (0.67%) in the year-ago quarter. Excluding assets transferred to held for sale in all periods, net charge-offs were $16 million in the current quarter, compared to $30 million in the prior quarter and $24 million in the year-ago quarter. The decrease in the current quarter compared to the prior quarter primarily related to energy loans. Non-accrual loans were $208 million (1.00% of finance receivables), compared to $215 million (1.00%) at March 31, 2016, and $98 million (0.65%) a year-ago. The increase in balances from the year-ago quarter was primarily related to loans in the energy sector. The provision for credit losses decreased from the prior quarter, which included higher reserves and charge-offs related to the energy portfolio.
Transportation Finance
| Earnings Summary* | Change from: | |||||||||||||||||||
| ($ in millions) | 2Q16 | 1Q16 | 2Q15 | Prior Quarter | Prior Year | |||||||||||||||
| Interest income | $ | 50 | $ | 53 | $ | 44 | $ | (3 | ) | $ | 6 | |||||||||
| Rental income on operating leases | 537 | 545 | 498 | (8 | ) | 39 | ||||||||||||||
| Interest expense | (147 | ) | (148 | ) | (149 | ) | 2 | 2 | ||||||||||||
| Depreciation on operating lease equipment | (155 | ) | (155 | ) | (137 | ) | 0 | (18 | ) | |||||||||||
| Maintenance and other operating lease expenses | (65 | ) | (56 | ) | (49 | ) | (9 | ) | (16 | ) | ||||||||||
| Net finance revenue | 220 | 238 | 208 | (17 | ) | 13 | ||||||||||||||
| Other income | 12 | 19 | 14 | (7 | ) | (2 | ) | |||||||||||||
| Provision for credit losses | (16 | ) | (23 | ) | (1 | ) | 7 | (15 | ) | |||||||||||
| Operating expenses | (62 | ) | (61 | ) | (64 | ) | (2 | ) | 2 | |||||||||||
| Income before income taxes | $ | 154 | $ | 173 | $ | 157 | $ | (19 | ) | $ | (2 | ) | ||||||||
| Select Average Balances | ||||||||||||||||||||
| Average finance receivables | $ | 2,726 | $ | 3,333 | $ | 3,048 | $ | (607 | ) | $ | (322 | ) | ||||||||
| Average operating leases | $ | 16,477 | $ | 16,364 | $ | 14,720 | $ | 113 | $ | 1,757 | ||||||||||
| Average earning assets | $ | 20,946 | $ | 20,620 | $ | 18,957 | $ | 326 | $ | 1,989 | ||||||||||
| Statistical Data | ||||||||||||||||||||
| Pre-tax ROAEA | 2.94 | % | 3.36 | % | 3.30 | % | -0.41 | % | -0.36 | % | ||||||||||
| Net finance margin | 4.21 | % | 4.61 | % | 4.38 | % | -0.40 | % | -0.18 | % | ||||||||||
| New business volume | $ | 461 | $ | 246 | $ | 744 | $ | 215 | $ | (283 | ) | |||||||||
| Net efficiency ratio | 26.1 | % | 23.7 | % | 28.8 | % | -2.4 | % | 2.7 | % | ||||||||||
| * Certain balances may not sum due to rounding. | ||||||||||||||||||||
Transportation Finance pre-tax earnings decreased from the prior quarter, as lower net finance revenue and other income offset lower credit costs, and were essentially flat with the year-ago quarter, as higher net finance revenue on increased average earning assets was offset by higher credit costs, largely in Maritime. The current quarter results also reflected charges related to the transfer of the remaining Business Air portfolio to held for sale and increased operating expenses related to the planned Commercial Air separation.
Financing and leasing assets totaled $20.0 billion at June 30, 2016, compared to $19.9 billion at March 31, 2016 and $18.3 billion at June 30, 2015. Assets grew sequentially in Aerospace and Rail and grew in all three divisions (Aerospace, Rail and Maritime) from a year ago. Assets held for sale of $0.8 billion principally included the Business Air portfolio, as the remaining Business Air assets were transferred to held for sale during the quarter. New business volume for the quarter totaled $0.5 billion, up from the prior quarter reflecting additional aircraft and railcar deliveries.
12
Net finance revenue was down from the prior quarter, as the impact of higher maintenance and other operating lease expenses and lower rentals offset lower funding costs. Net finance revenue increased from the year-ago quarter primarily reflecting higher average operating lease assets partially offset by higher maintenance and other operating lease expenses. Net finance margin was down from the prior and year-ago quarters reflecting the net finance revenue trends described above. Gross yields in Aerospace and Rail decreased from the prior quarter to 10.9% and 13.2%, respectively, reflecting lower rental rates and higher cash balances in Aerospace.
Other income declined from the prior and year-ago quarters largely reflecting higher gains on asset sales in rail, which were offset by impairments, including a $4 million goodwill impairment charge related to the business aircraft assets transferred to held for sale.
Operating expenses were relatively flat with the prior quarter, as higher costs related to the Commercial Air separation offset lower employee costs. The current and prior quarter included $9 million and $4 million of costs related to the Commercial Air separation initiative, respectively.
Net charge-offs, excluding assets transferred to held for sale, were negligible for the current and year-ago quarters, compared to net charge-offs of $12 million (1.49% of average finance receivables) related to the Aerospace loan portfolio in the prior quarter. Non-accrual loans of $18 million (0.70% of finance receivables) decreased from $22 million (0.78%) at March 31, 2016 and increased from $5 million (0.15%) a year-ago, and principally consisted of business aircraft loans in each of the periods. The provision for credit losses decreased from the prior quarter, but continues to reflect reserve increases in Maritime and elevated charges in the Business Air portfolio related to the assets transferred to held for sale.
Utilization trends were relatively unchanged compared to the prior quarter. All aircraft were on lease or under a commitment at quarter-end resulting in 100% utilization, while Rail utilization remained at approximately 94%. All of our aircraft scheduled for delivery in the next 12 months and approximately 41% of the total railcar order-book have lease commitments.
13
Consumer and Community Banking
| Earnings Summary* | Change from: | |||||||||||||||||||
| ($ in millions) | 2Q16 | 1Q16 | 2Q15 | Prior Quarter | Prior Year | |||||||||||||||
| Interest income | $ | 105 | $ | 103 | $ | - | $ | 2 | $ | 105 | ||||||||||
| Interest expense | (6 | ) | (9 | ) | - | 3 | (6 | ) | ||||||||||||
| Net finance revenue | 100 | 94 | - | 5 | 100 | |||||||||||||||
| Other income | 12 | 8 | - | 4 | 12 | |||||||||||||||
| Provision for credit losses | (1 | ) | (3 | ) | - | 2 | (1 | ) | ||||||||||||
| Operating expenses | (93 | ) | (82 | ) | - | (11 | ) | (93 | ) | |||||||||||
| Income before income taxes | $ | 17 | $ | 17 | $ | - | $ | (0 | ) | $ | 17 | |||||||||
| Select Average Balances | ||||||||||||||||||||
| Average finance receivables | $ | 7,156 | $ | 7,160 | $ | - | $ | (5 | ) | $ | 7,156 | |||||||||
| Average earning assets | $ | 7,729 | $ | 7,758 | $ | - | $ | (29 | ) | $ | 7,729 | |||||||||
| Statistical Data | ||||||||||||||||||||
| Pre-tax ROAEA | 0.87 | % | 0.88 | % | - | -0.01 | % | 0.87 | % | |||||||||||
| Net finance margin | 5.15 | % | 4.86 | % | - | 0.29 | % | 5.15 | % | |||||||||||
| New business volume | $ | 261 | $ | 215 | $ | - | $ | 47 | $ | 261 | ||||||||||
| Net efficiency ratio | 79.6 | % | 75.8 | % | - | 3.8 | % | 79.6 | % | |||||||||||
| * Certain balances may not sum due to rounding. | ||||||||||||||||||||
Consumer and Community Banking pre-tax earnings remained consistent with the prior quarter. The quarter benefited from higher net finance revenue, higher other income due to gains on REO, and lower credit provision, which were offset by higher operating expenses, primarily from REO expenses ($8 million of which related to prior periods).
Financing and leasing assets totaled $7.2 billion at June 30, 2016, down slightly from March 31, 2016, as the run-off of the Legacy Consumer Mortgage (“LCM”) portfolios offset new volume. The LCM portfolios make up $5.2 billion of the current quarter balance with a significant portion covered by loss sharing agreements with the FDIC. The benefit of these agreements is recorded within the indemnification asset.
Non-accrual loans were $12 million (0.16% of finance receivables) at June 30, 2016, up from $7 million (0.10% of finance receivables) at March 31, 2016. The provision for credit losses decreased slightly from the prior quarter.
14
Non-Strategic Portfolios (NSP)
| Earnings Summary* | Change from: | |||||||||||||||||||
| ($ in millions) | 2Q16 | 1Q16 | 2Q15 | Prior Quarter | Prior Year | |||||||||||||||
| Interest income | $ | 23 | $ | 25 | $ | 49 | $ | (2 | ) | $ | (26 | ) | ||||||||
| Rental income on operating leases | 4 | 4 | 10 | 0 | (6 | ) | ||||||||||||||
| Interest expense | (14 | ) | (15 | ) | (34 | ) | 1 | 20 | ||||||||||||
| Depreciation on operating lease equipment | - | - | (4 | ) | - | 4 | ||||||||||||||
| Net finance revenue | 14 | 14 | 21 | (1 | ) | (8 | ) | |||||||||||||
| Other income | 7 | 15 | (1 | ) | (8 | ) | 8 | |||||||||||||
| Provision for credit losses | - | - | 1 | - | (1 | ) | ||||||||||||||
| Operating expenses | (12 | ) | (12 | ) | (35 | ) | 0 | 23 | ||||||||||||
| Income (loss) before income taxes | $ | 8 | $ | 17 | $ | (14 | ) | $ | (9 | ) | $ | 22 | ||||||||
| Select Average Balances | ||||||||||||||||||||
| Average earning assets | $ | 1,385 | $ | 1,517 | $ | 2,558 | $ | (132 | ) | $ | (1,174 | ) | ||||||||
| Statistical Data | ||||||||||||||||||||
| Pre-tax ROAEA | 2.34 | % | 4.38 | % | -2.16 | % | -2.04 | % | 4.50 | % | ||||||||||
| Net finance margin | 3.90 | % | 3.77 | % | 3.30 | % | 0.13 | % | 0.60 | % | ||||||||||
| New business volume | $ | 61 | $ | 44 | $ | 216 | $ | 17 | $ | (154 | ) | |||||||||
| * Certain balances may not sum due to rounding. | ||||||||||||||||||||
NSP pre-tax earnings for the quarter reflected operations for the remaining businesses in Canada and China. The prior quarter reflected a gain of $24 million from the sale of the U.K. business, partially offset by an $11 million impairment charge on assets held for sale. The year-ago pre-tax loss was driven by the higher level of operating expenses, reflective of the remaining businesses at that time. Financing and leasing assets at June 30, 2016 totaled $1.1 billion, down slightly from $1.2 billion at March 31, 2016 and from $2.1 billion at June 30, 2015. Our remaining NSP businesses are classified as held for sale. During this quarter we reached a definitive agreement to sell the Canadian Equipment and Corporate Finance business (approximately $750 million in financing and leasing assets), subject to regulatory approvals, and expect the transaction to close in the fourth quarter of this year.
15
Corporate & Other
| Earnings Summary* | Change from: | |||||||||||||||||||
| ($ in millions) | 2Q16 | 1Q16 | 2Q15 | Prior Quarter | Prior Year | |||||||||||||||
| Interest income | $ | 28 | $ | 27 | $ | 5 | $ | 0 | $ | 23 | ||||||||||
| Interest expense | (42 | ) | (41 | ) | (18 | ) | (0 | ) | (24 | ) | ||||||||||
| Net finance revenue | (14 | ) | (14 | ) | (13 | ) | (0 | ) | (1 | ) | ||||||||||
| Other income | 13 | 4 | (17 | ) | 9 | 30 | ||||||||||||||
| Operating expenses | (25 | ) | (37 | ) | (4 | ) | 11 | (21 | ) | |||||||||||
| Loss before income taxes | $ | (26 | ) | $ | (47 | ) | $ | (34 | ) | $ | 20 | $ | 8 | |||||||
| Select Average Balances | ||||||||||||||||||||
| Average earning assets | $ | 8,595 | $ | 8,585 | $ | 5,142 | $ | 10 | $ | 3,453 | ||||||||||
| Statistical Data | ||||||||||||||||||||
| Pre-tax ROAEA | -1.21 | % | -2.17 | % | -2.62 | % | 0.95 | % | 1.41 | % | ||||||||||
| Net finance margin | -0.66 | % | -0.65 | % | -1.02 | % | -0.01 | % | 0.36 | % | ||||||||||
| * Certain balances may not sum due to rounding. | ||||||||||||||||||||
Certain items are not allocated to operating segments and are included in Corporate and Other, including interest expense, primarily related to corporate liquidity costs, mark-to-market on certain derivatives, restructuring charges, certain legal costs and other operating expenses. Interest income increased slightly from the prior quarter and is up from a year-ago quarter primarily related to income generated from the investment portfolio. Other income included a $9 million mark-to-market benefit on the TRS and a $5 million mark-to-market benefit on mortgage backed securities in the current quarter, compared to an $18 million benefit on the TRS offset by a $4 million mark-to-market charge on mortgage backed securities in the prior quarter. The prior year quarter included a $9 million tax-related charge, (that was fully offset with a benefit to the tax provision) and a negative mark-to-market adjustment on the TRS of $6 million. Operating expenses for the quarter reflected restructuring charges of $10 million, compared to $20 million in the prior quarter, reflecting our previously announced organizational changes, and $1 million in the year-ago quarter.
Discontinued Operations
Income from discontinued operations, net of taxes, was a loss of $167 million in the current quarter compared to a loss of $5 million in the prior quarter. In the current period, discontinued operations predominantly relates to third-party reverse mortgage servicing activity, known as Financial Freedom, which the Company acquired in the OneWest Bank acquisition.
As a result of the ongoing review to remediate the material weakness, and taking into consideration the investigation being conducted by the OIG, the Company recorded additional reserves, due to a change in estimate, of $230 million during the current quarter.
16
Conference Call and Webcast
Chairwoman and Chief Executive Officer Ellen Alemany and Chief Financial Officer Carol Hayles will discuss these results on a conference call and audio webcast today, July 28, at 8:00 a.m. (EDT). Interested parties may access the conference call live by dialing 888-317-6003 for U.S., 866-284-3684 for Canadian callers or 412-317-6061 for international callers and reference access code “0603321” or access the audio webcast at cit.com/investor. An audio replay of the call will be available until 11:59 p.m. (EDT) on August 28, 2016, by dialing 877-344-7529 for U.S. callers, 855-669-9658 for Canadian callers or 412-317-0088 for international callers with the access code “10089399”, or at cit.com/investor.
About CIT
Founded in 1908, CIT (NYSE: CIT) is a financial holding company with more than $65 billion in assets. Its principal bank subsidiary, CIT Bank, N.A., (Member FDIC, Equal Housing Lender) has more than $30 billion of deposits and more than $40 billion of assets. It provides financing, leasing and advisory services principally to middle market companies across a wide variety of industries primarily in North America, and equipment financing and leasing solutions to the transportation sector. It also offers products and services to consumers through its Internet bank franchise and a network of retail branches in Southern California, operating as OneWest Bank, a division of CIT Bank, N.A. cit.com
Forward-Looking Statements
This press release contains forward-looking statements within the meaning of applicable federal securities laws that are based upon our current expectations and assumptions concerning future events, which are subject to a number of risks and uncertainties that could cause actual results to differ materially from those anticipated. The words “expect,” “anticipate,” “estimate,” “forecast,” “initiative,” “objective,” “plan,” “goal,” “project,” “outlook,” “priorities,” “target,” “intend,” “evaluate,” “pursue,” “commence,” “seek,” “may,” “would,” “could,” “should,” “believe,” “potential,” “continue,” or the negative of any of those words or similar expressions is intended to identify forward-looking statements. All statements contained in this press release, other than statements of historical fact, including without limitation, statements about our plans, strategies, prospects and expectations regarding future events and our financial performance, are forward-looking statements that involve certain risks and uncertainties. While these statements represent our current judgment on what the future may hold, and we believe these judgments are reasonable, these statements are not guarantees of any events or financial results, and our actual results may differ materially. Important factors that could cause our actual results to be materially different from our expectations include, among others, the risk that CIT is unsuccessful in implementing its strategy and business plan, the risk that CIT is unable to react to and address key business and regulatory issues, the risk that CIT is unable to achieve the projected revenue growth from its new business initiatives or the projected expense reductions from efficiency improvements, and the risk that CIT becomes subject to liquidity constraints and higher funding costs. We describe these and other risks that could affect our results in Item 1A, “Risk Factors,” of our latest Annual Report on Form 10-K for the year ended December 31, 2015, which was filed with the Securities and Exchange Commission. Accordingly, you should not place undue reliance on the forward-looking statements contained in this press release. These forward-looking statements speak only as of the date on which the statements were made. CIT undertakes no obligation to update publicly or otherwise revise any forward-looking statements, except where expressly required by law.
Non-GAAP Measurements
Net finance revenue, net operating lease revenue and average earning assets are non-GAAP measurements used by management to gauge portfolio performance. Operating expenses excluding restructuring costs and intangible amortization is a non-GAAP measurement used by management to compare period over period expenses. Net efficiency ratio measures operating expenses (net of restructuring costs and intangible amortization) to our level of total net revenues. Total assets from continuing operations is a non-GAAP measurement used by management to analyze the total asset change on a more consistent basis. Tangible book value and tangible book value per share are non-GAAP metrics used to analyze banks.
###
| CIT MEDIA RELATIONS: | CIT INVESTOR RELATIONS: |
| Matt Klein | Barbara Callahan |
| Director | Senior Vice President |
|
(973) 597-2020
|
(973) 740-5058 |
###
17
CIT GROUP INC. AND SUBSIDIARIES
Unaudited Consolidated Statements of Income
(dollars in millions, except per share data)
| Quarters Ended | Six Months Ended | |||||||||||||||||||
| June 30, | March 31, | June 30, | June 30, | |||||||||||||||||
| 2016* | 2016 | 2015 | 2016* | 2015 | ||||||||||||||||
| Interest income | ||||||||||||||||||||
| Interest and fees on loans | $ | 463.6 | $ | 464.5 | $ | 274.8 | $ | 928.1 | $ | 547.2 | ||||||||||
| Other Interest and dividends | 31.7 | 30.9 | 9.0 | 62.6 | 17.6 | |||||||||||||||
| Total interest income | 495.3 | 495.4 | 283.8 | 990.7 | 564.8 | |||||||||||||||
| Interest expense | ||||||||||||||||||||
| Interest on borrowings | (183.1 | ) | (186.9 | ) | (193.0 | ) | (370.0 | ) | (395.3 | ) | ||||||||||
| Interest on deposits | (99.4 | ) | (99.5 | ) | (72.2 | ) | (198.9 | ) | (141.2 | ) | ||||||||||
| Total interest expense | (282.5 | ) | (286.4 | ) | (265.2 | ) | (568.9 | ) | (536.5 | ) | ||||||||||
| Net interest revenue | 212.8 | 209.0 | 18.6 | 421.8 | 28.3 | |||||||||||||||
| Provision for credit losses | (28.1 | ) | (99.3 | ) | (18.4 | ) | (127.4 | ) | (53.0 | ) | ||||||||||
| Net interest revenue, after credit provision | 184.7 | 109.7 | 0.2 | 294.4 | (24.7 | ) | ||||||||||||||
| Non-interest income | ||||||||||||||||||||
| Rental income on operating leases | 569.3 | 575.4 | 531.7 | 1,144.7 | 1,062.3 | |||||||||||||||
| Other income | 104.3 | 100.9 | 63.5 | 205.2 | 149.9 | |||||||||||||||
| Total non-interest income | 673.6 | 676.3 | 595.2 | 1,349.9 | 1,212.2 | |||||||||||||||
| Non-interest expenses | ||||||||||||||||||||
| Depreciation on operating lease equipment | (176.4 | ) | (175.3 | ) | (157.8 | ) | (351.7 | ) | (314.6 | ) | ||||||||||
| Maintenance and other operating lease expenses | (64.9 | ) | (56.2 | ) | (49.4 | ) | (121.1 | ) | (95.5 | ) | ||||||||||
| Operating expenses | (337.5 | ) | (348.5 | ) | (235.0 | ) | (686.0 | ) | (476.6 | ) | ||||||||||
| Loss on debt extinguishment and deposit redemption | (4.1 | ) | (1.6 | ) | (0.1 | ) | (5.7 | ) | (0.1 | ) | ||||||||||
| Total other expenses | (582.9 | ) | (581.6 | ) | (442.3 | ) | (1,164.5 | ) | (886.8 | ) | ||||||||||
| Income from continuing operations before provision for income taxes | 275.4 | 204.4 | 153.1 | 479.8 | 300.7 | |||||||||||||||
| Provision for income taxes | (94.3 | ) | (52.7 | ) | (37.8 | ) | (147.0 | ) | (81.8 | ) | ||||||||||
| Income from continuing operations, before attribution of noncontrolling interests | 181.1 | 151.7 | 115.3 | 332.8 | 218.9 | |||||||||||||||
| Net loss attributable to noncontrolling interests, after tax | - | - | - | - | 0.1 | |||||||||||||||
| Income from continuing operations | 181.1 | 151.7 | 115.3 | 332.8 | 219.0 | |||||||||||||||
| Discontinued operation | ||||||||||||||||||||
| Loss from discontinued operation | (236.3 | ) | (7.4 | ) | - | (243.7 | ) | - | ||||||||||||
| Benefit for income taxes | 69.3 | 2.6 | - | 71.9 | - | |||||||||||||||
| Loss from discontinued operation, net of taxes | (167.0 | ) | (4.8 | ) | - | (171.8 | ) | - | ||||||||||||
| Net income | $ | 14.1 | $ | 146.9 | $ | 115.3 | $ | 161.0 | $ | 219.0 | ||||||||||
| Basic income per common share | ||||||||||||||||||||
| Income from continuing operations | $ | 0.90 | $ | 0.75 | $ | 0.66 | $ | 1.65 | $ | 1.25 | ||||||||||
| Loss from discontinued operation, net of taxes | (0.83 | ) | (0.02 | ) | - | (0.85 | ) | - | ||||||||||||
| Basic income per common share | $ | 0.07 | $ | 0.73 | $ | 0.66 | $ | 0.80 | $ | 1.25 | ||||||||||
| Average number of common shares - basic (thousands) | 201,893 | 201,394 | 173,785 | 201,647 | 175,019 | |||||||||||||||
| Diluted income per common share | ||||||||||||||||||||
| Income from continuing operations | $ | 0.90 | $ | 0.75 | $ | 0.66 | $ | 1.65 | $ | 1.24 | ||||||||||
| Loss from discontinued operation, net of taxes | (0.83 | ) | (0.02 | ) | - | (0.85 | ) | - | ||||||||||||
| Diluted income per common share | $ | 0.07 | $ | 0.73 | $ | 0.66 | $ | 0.80 | $ | 1.24 | ||||||||||
| Average number of common shares - diluted (thousands) | 202,275 | 202,136 | 174,876 | 202,208 | 175,971 | |||||||||||||||
| * Preliminary | ||||||||||||||||||||
18
CIT GROUP INC. AND SUBSIDIARIES
Unaudited Consolidated Balance Sheets
(dollars in millions, except per share data)
| June 30, | March 31, | December 31, | June 30, | |||||||||||||
| 2016* | 2016 | 2015 | 2015 | |||||||||||||
| Assets | ||||||||||||||||
| Total cash and deposits | $ | 8,103.9 | $ | 8,141.8 | $ | 8,301.5 | $ | 5,465.3 | ||||||||
| Securities purchased under agreements to resell | - | - | - | 750.0 | ||||||||||||
| Investment securities | 3,229.1 | 2,896.8 | 2,953.8 | 1,692.9 | ||||||||||||
| Assets held for sale | 2,403.3 | 2,211.2 | 2,092.4 | 1,086.8 | ||||||||||||
| Loans | 30,456.8 | 31,408.6 | 31,671.7 | 19,649.3 | ||||||||||||
| Allowance for loan losses | (399.4 | ) | (404.6 | ) | (360.2 | ) | (350.9 | ) | ||||||||
| Loans, net of allowance for loan losses | 30,057.4 | 31,004.0 | 31,311.5 | 19,298.4 | ||||||||||||
| Operating lease equipment, net | 16,864.6 | 16,665.7 | 16,617.0 | 15,109.6 | ||||||||||||
| Indemnification assets | 375.5 | 389.4 | 414.8 | - | ||||||||||||
| Goodwill | 1,169.7 | 1,195.1 | 1,198.3 | 565.9 | ||||||||||||
| Intangible assets | 168.9 | 170.3 | 176.3 | 21.4 | ||||||||||||
| Unsecured counterparty receivable | 570.2 | 556.3 | 537.8 | 538.2 | ||||||||||||
| Other assets | 3,288.6 | 3,377.5 | 3,297.6 | 2,016.6 | ||||||||||||
| Assets of discontinued operation | 469.1 | 489.5 | 500.5 | - | ||||||||||||
| Total assets | $ | 66,700.3 | $ | 67,097.6 | $ | 67,401.5 | $ | 46,545.1 | ||||||||
| Liabilities | ||||||||||||||||
| Deposits | $ | 32,879.1 | $ | 32,892.7 | $ | 32,782.2 | $ | 17,267.8 | ||||||||
| Credit balances of factoring clients | 1,215.2 | 1,361.0 | 1,344.0 | 1,373.3 | ||||||||||||
| Other liabilities | 3,054.2 | 3,020.2 | 3,158.7 | 2,766.9 | ||||||||||||
| Borrowings | ||||||||||||||||
| Unsecured borrowings | 10,591.2 | 10,587.3 | 10,636.3 | 10,684.2 | ||||||||||||
| Structured financings | 3,923.8 | 4,309.0 | 4,687.9 | 5,497.9 | ||||||||||||
| FHLB advances | 2,995.1 | 3,116.3 | 3,117.6 | 147.4 | ||||||||||||
| Total borrowings | 17,510.1 | 18,012.6 | 18,441.8 | 16,329.5 | ||||||||||||
| Liabilities of discontinued operation | 917.1 | 684.8 | 696.2 | - | ||||||||||||
| Total liabilities | 55,575.7 | 55,971.3 | 56,422.9 | 37,737.5 | ||||||||||||
| Equity | ||||||||||||||||
| Stockholders' equity | ||||||||||||||||
| Common stock | 2.1 | 2.1 | 2.0 | 2.0 | ||||||||||||
| Paid-in capital | 8,749.8 | 8,739.4 | 8,718.1 | 8,615.6 | ||||||||||||
| Retained earnings | 2,656.9 | 2,673.7 | 2,557.4 | 1,781.1 | ||||||||||||
| Accumulated other comprehensive loss | (107.7 | ) | (117.4 | ) | (142.1 | ) | (158.8 | ) | ||||||||
| Treasury stock, at cost | (177.0 | ) | (172.0 | ) | (157.3 | ) | (1,432.8 | ) | ||||||||
| Total common stockholders' equity | 11,124.1 | 11,125.8 | 10,978.1 | 8,807.1 | ||||||||||||
| Noncontrolling interests | 0.5 | 0.5 | 0.5 | 0.5 | ||||||||||||
| Total equity | 11,124.6 | 11,126.3 | 10,978.6 | 8,807.6 | ||||||||||||
| Total liabilities and equity | $ | 66,700.3 | $ | 67,097.6 | $ | 67,401.5 | $ | 46,545.1 | ||||||||
| Book Value Per Common Share | ||||||||||||||||
| Book value per common share | $ | 55.07 | $ | 55.16 | $ | 54.61 | $ | 50.91 | ||||||||
| Tangible book value per common share | $ | 48.45 | $ | 48.39 | $ | 47.77 | $ | 47.51 | ||||||||
| Outstanding common shares (in thousands) | 201,990 | 201,702 | 201,022 | 172,998 | ||||||||||||
| * Preliminary | ||||||||||||||||
19
CIT GROUP INC. AND SUBSIDIARIES
Average Balances and Rates
(dollars in millions)
| Quarters Ended | ||||||||||||||||||||||||
| June 30, 2016 | March 31, 2016 | June 30, 2015 | ||||||||||||||||||||||
| Average Balance | Rate | Average Balance | Rate | Average Balance | Rate | |||||||||||||||||||
| Assets | ||||||||||||||||||||||||
| Interest bearing deposits | $ | 7,113.5 | 0.50 | % | $ | 7,114.0 | 0.47 | % | $ | 4,829.4 | 0.28 | % | ||||||||||||
| Securities purchased under agreements to resell | - | - | - | - | 675.0 | 0.59 | % | |||||||||||||||||
| Investments | 3,130.6 | 2.91 | % | 2,923.5 | 3.08 | % | 1,510.6 | 1.22 | % | |||||||||||||||
| Loans (including held for sale) | ||||||||||||||||||||||||
| U.S. | 31,784.4 | 5.87 | % | 32,091.5 | 5.74 | % | 18,130.4 | 5.41 | % | |||||||||||||||
| Non-U.S. | 1,160.2 | 8.41 | % | 1,291.0 | 8.18 | % | 2,161.3 | 9.01 | % | |||||||||||||||
| Total Loans | 32,944.6 | 5.96 | % | 33,382.5 | 5.84 | % | 20,291.7 | 5.83 | % | |||||||||||||||
| Total interest earning assets / interest income | 43,188.7 | 4.81 | % | 43,420.0 | 4.74 | % | 27,306.7 | 4.39 | % | |||||||||||||||
| Operating lease equipment, net (including held for sale) | ||||||||||||||||||||||||
| U.S. | 8,922.0 | 7.57 | % | 8,831.3 | 8.41 | % | 7,859.0 | 8.93 | % | |||||||||||||||
| Non-U.S. | 8,003.5 | 7.95 | % | 7,890.0 | 8.02 | % | 7,422.2 | 8.04 | % | |||||||||||||||
| Total operating lease equipment, net | 16,925.5 | 7.75 | % | 16,721.3 | 8.23 | % | 15,281.2 | 8.49 | % | |||||||||||||||
| Indemnification assets | 379.8 | -9.06 | % | 401.7 | -3.09 | % | - | - | ||||||||||||||||
| Total earning assets | 60,494.0 | 5.56 | % | 60,543.0 | 5.67 | % | 42,587.9 | 5.91 | % | |||||||||||||||
| Non-interest earning assets | ||||||||||||||||||||||||
| Cash and due from banks | 1,051.4 | 1,331.4 | 952.7 | |||||||||||||||||||||
| Non-interest bearing deposits | ||||||||||||||||||||||||
| Allowance for loan losses | (398.9 | ) | (371.5 | ) | (358.0 | ) | ||||||||||||||||||
| All other non-interest bearing assets | 5,278.8 | 5,298.4 | 3,169.0 | |||||||||||||||||||||
| Assets of discontinued operation | 479.9 | 495.1 | - | |||||||||||||||||||||
| Total Average Assets | $ | 66,905.2 | $ | 67,296.4 | $ | 46,351.6 | ||||||||||||||||||
| Liabilities | ||||||||||||||||||||||||
| Borrowings | ||||||||||||||||||||||||
| Deposits | $ | 31,643.5 | 1.26 | % | $ | 31,829.1 | 1.25 | % | $ | 16,844.6 | 1.71 | % | ||||||||||||
| Borrowings | 17,853.7 | 4.10 | % | 18,210.4 | 4.11 | % | 16,423.8 | 4.70 | % | |||||||||||||||
| Total interest-bearing liabilities | 49,497.2 | 2.28 | % | 50,039.5 | 2.29 | % | 33,268.4 | 3.19 | % | |||||||||||||||
| Non-interest bearing deposits | 1,124.9 | 1,080.2 | 90.3 | |||||||||||||||||||||
| Credit balances of factoring clients | 1,264.9 | 1,337.5 | 1,428.6 | |||||||||||||||||||||
| Other non-interest bearing liabilities | 3,093.3 | 3,063.7 | 2,776.7 | |||||||||||||||||||||
| Liabilities of discontinued operation | 738.1 | 690.2 | - | |||||||||||||||||||||
| Noncontrolling interests | 0.5 | 0.5 | 0.5 | |||||||||||||||||||||
| Stockholders' equity | 11,186.3 | 11,084.8 | 8,787.1 | |||||||||||||||||||||
| Total Average Liabilities and Stockholders' Equity | $ | 66,905.2 | $ | 67,296.4 | $ | 46,351.6 | ||||||||||||||||||
| Six Months Ended | ||||||||||||||||||||||||
| June 30, 2016 | June 30, 2015 | |||||||||||||||||||||||
| Assets | ||||||||||||||||||||||||
| Interest bearing deposits | $ | 7,110.7 | 0.49 | % | $ | 5,390.1 | 0.27 | % | ||||||||||||||||
| Securities purchased under agreements to resell | - | - | 650.0 | 0.52 | % | |||||||||||||||||||
| Investments | 3,045.7 | 2.98 | % | 1,526.2 | 1.11 | % | ||||||||||||||||||
| Loans (including held for sale) | ||||||||||||||||||||||||
| U.S. | 31,904.4 | 5.81 | % | 18,012.5 | 5.39 | % | ||||||||||||||||||
| Non-U.S. | 1,230.6 | 8.26 | % | 2,203.2 | 9.18 | % | ||||||||||||||||||
| Total Loans | 33,135.0 | 5.90 | % | 20,215.7 | 5.83 | % | ||||||||||||||||||
| Total interest earning assets / interest income | 43,291.4 | 4.77 | % | 27,782.0 | 4.29 | % | ||||||||||||||||||
| Operating lease equipment, net (including held for sale) | ||||||||||||||||||||||||
| U.S. | 8,873.5 | 7.99 | % | 7,821.1 | 9.03 | % | ||||||||||||||||||
| Non-U.S. | 7,951.6 | 7.98 | % | 7,424.1 | 8.05 | % | ||||||||||||||||||
| Total operating lease equipment, net | 16,825.1 | 7.99 | % | 15,245.2 | 8.56 | % | ||||||||||||||||||
| Indemnification assets | 390.9 | -5.99 | % | - | - | |||||||||||||||||||
| Total earning assets | 60,507.4 | 5.62 | % | 43,027.2 | 5.85 | % | ||||||||||||||||||
| Non-interest earning assets | ||||||||||||||||||||||||
| Cash and due from banks | 1,217.8 | 930.3 | ||||||||||||||||||||||
| Allowance for loan losses | (382.4 | ) | (352.3 | ) | ||||||||||||||||||||
| All other non-interest bearing assets | 5,271.3 | 3,184.2 | ||||||||||||||||||||||
| Assets of discontinued operation | 487.2 | - | ||||||||||||||||||||||
| Total Average Assets | $ | 67,101.3 | $ | 46,789.4 | ||||||||||||||||||||
| Liabilities | ||||||||||||||||||||||||
| Borrowings | ||||||||||||||||||||||||
| Deposits | $ | 31,727.6 | 1.25 | % | $ | 16,546.2 | 1.71 | % | ||||||||||||||||
| Borrowings | 18,034.8 | 4.10 | % | 17,009.7 | 4.65 | % | ||||||||||||||||||
| Total interest-bearing liabilities | 49,762.4 | 2.29 | % | 33,555.9 | 3.20 | % | ||||||||||||||||||
| Non-interest bearing deposits | 1,103.6 | 98.2 | ||||||||||||||||||||||
| Credit balances of factoring clients | 1,292.6 | 1,459.2 | ||||||||||||||||||||||
| Other non-interest bearing liabilities | 3,087.0 | 2,836.4 | ||||||||||||||||||||||
| Liabilities of discontinued operation | 718.3 | - | ||||||||||||||||||||||
| Noncontrolling interests | 0.5 | (2.0 | ) | |||||||||||||||||||||
| Stockholders' equity | 11,136.9 | 8,841.7 | ||||||||||||||||||||||
| Total Average Liabilities and Stockholders' Equity | $ | 67,101.3 | $ | 46,789.4 | ||||||||||||||||||||
20
CIT GROUP INC. AND SUBSIDIARIES
Select Accounts
(dollars in millions)
| Quarters Ended | Six Months Ended | |||||||||||||||||||
| June 30, | March 31, | June 30, | June 30, | |||||||||||||||||
| 2016 | 2016 | 2015 | 2016 | 2015 | ||||||||||||||||
| OTHER INCOME | ||||||||||||||||||||
| Fee revenues | $ | 28.0 | $ | 32.7 | $ | 25.3 | $ | 60.7 | $ | 47.9 | ||||||||||
| Gains on sales of leasing equipment | 28.0 | 11.2 | 21.5 | 39.2 | 53.5 | |||||||||||||||
| Factoring commissions | 24.1 | 26.4 | 27.0 | 50.5 | 56.5 | |||||||||||||||
| Net gain (losses) on derivatives and foreign currency exchange | 10.4 | 9.3 | (5.0 | ) | 19.7 | (14.7 | ) | |||||||||||||
| Gains on loan and portfolio sales | 7.7 | 0.3 | 2.1 | 8.0 | 8.7 | |||||||||||||||
| Gains (losses) on investments | 6.3 | (4.1 | ) | 3.8 | 2.2 | 4.5 | ||||||||||||||
| Gain on OREO sales | 3.5 | 1.7 | - | 5.2 | - | |||||||||||||||
| Impairment on assets held for sale | (17.0 | ) | (22.1 | ) | (11.0 | ) | (39.1 | ) | (21.1 | ) | ||||||||||
| Other revenues | 13.3 | 45.5 | (0.2 | ) | 58.8 | 14.6 | ||||||||||||||
| Total other income | $ | 104.3 | $ | 100.9 | $ | 63.5 | $ | 205.2 | $ | 149.9 | ||||||||||
| OPERATING EXPENSES | ||||||||||||||||||||
| Compensation and benefits | $ | (155.9 | ) | $ | (172.2 | ) | $ | (135.6 | ) | $ | (328.1 | ) | $ | (282.1 | ) | |||||
| Professional fees | (39.5 | ) | (38.8 | ) | (20.8 | ) | (78.3 | ) | (40.3 | ) | ||||||||||
| Technology | (31.3 | ) | (30.4 | ) | (24.9 | ) | (61.7 | ) | (47.2 | ) | ||||||||||
| Net occupancy expense | (17.4 | ) | (18.4 | ) | (8.6 | ) | (35.8 | ) | (18.0 | ) | ||||||||||
| Advertising and marketing | (4.4 | ) | (5.4 | ) | (6.7 | ) | (9.8 | ) | (15.8 | ) | ||||||||||
| Other expenses | (72.9 | ) | (56.6 | ) | (36.8 | ) | (129.5 | ) | (72.0 | ) | ||||||||||
| Operating expenses, before provision for severance and facilities exiting and intangible asset amortization | (321.4 | ) | (321.8 | ) | (233.4 | ) | (643.2 | ) | (475.4 | ) | ||||||||||
| Provision for severance and facilities exiting activities | (9.7 | ) | (20.3 | ) | (1.1 | ) | (30.0 | ) | (0.1 | ) | ||||||||||
| Intangible asset amortization | (6.4 | ) | (6.4 | ) | (0.5 | ) | (12.8 | ) | (1.1 | ) | ||||||||||
| Total operating expenses | $ | (337.5 | ) | $ | (348.5 | ) | $ | (235.0 | ) | $ | (686.0 | ) | $ | (476.6 | ) | |||||
| June 30, | March 31, | December 31, | June 30, | |||||||||||||||||
| 2016* | 2016 | 2015 | 2015 | |||||||||||||||||
| TOTAL CASH AND INVESTMENT SECURITIES | ||||||||||||||||||||
| Total cash and deposits | $ | 8,103.9 | $ | 8,141.8 | $ | 8,301.5 | $ | 5,465.3 | ||||||||||||
| Securities purchased under agreements to resell | - | - | - | 750.0 | ||||||||||||||||
| Investment securities | 3,229.1 | 2,896.8 | 2,953.8 | 1,692.9 | ||||||||||||||||
| Total cash and investment securities | $ | 11,333.0 | $ | 11,038.6 | $ | 11,255.3 | $ | 7,908.2 | ||||||||||||
| OTHER ASSETS | ||||||||||||||||||||
| Current and deferred federal and state tax assets | $ | 1,180.9 | $ | 1,197.4 | $ | 1,252.5 | $ | 431.2 | ||||||||||||
| Deposits on commercial aerospace equipment | 764.6 | 774.3 | 696.0 | 816.9 | ||||||||||||||||
| Tax credit investments and investments in unconsolidated subsidiaries | 238.1 | 237.9 | 223.9 | 78.6 | ||||||||||||||||
| Property, furniture and fixtures | 191.6 | 192.1 | 197.2 | 144.4 | ||||||||||||||||
| Other counterparty receivables | 146.7 | 179.6 | 59.0 | 28.8 | ||||||||||||||||
| Fair value of derivative financial instruments | 134.0 | 97.4 | 140.7 | 101.5 | ||||||||||||||||
| Other real estate owned and repossessed assets | 91.6 | 105.4 | 127.3 | 2.6 | ||||||||||||||||
| Tax receivables, other than income taxes | 82.1 | 105.7 | 98.2 | 103.0 | ||||||||||||||||
| Other | 459.0 | 487.7 | 502.8 | 309.6 | ||||||||||||||||
| Total other assets | $ | 3,288.6 | $ | 3,377.5 | $ | 3,297.6 | $ | 2,016.6 | ||||||||||||
| OTHER LIABILITIES | ||||||||||||||||||||
| Equipment maintenance reserves | $ | 1,067.2 | $ | 1,042.2 | $ | 1,012.4 | $ | 982.5 | ||||||||||||
| Accrued expenses and accounts payable | 542.8 | 563.6 | 628.1 | 439.2 | ||||||||||||||||
| Current and deferred taxes payable | 364.1 | 354.5 | 363.1 | 345.6 | ||||||||||||||||
| Accrued interest payable | 200.4 | 161.0 | 209.6 | 221.2 | ||||||||||||||||
| Security and other deposits | 197.6 | 179.9 | 263.0 | 265.9 | ||||||||||||||||
| Fair value of derivative financial instruments | 154.6 | 196.5 | 103.0 | 88.1 | ||||||||||||||||
| Valuation adjustment relating to aerospace commitments | 73.1 | 73.1 | 73.1 | 117.1 | ||||||||||||||||
| Other liabilities | 454.4 | 449.4 | 506.4 | 307.3 | ||||||||||||||||
| Total other liabilities | $ | 3,054.2 | $ | 3,020.2 | $ | 3,158.7 | $ | 2,766.9 | ||||||||||||
| * Preliminary | ||||||||||||||||||||
21
CIT GROUP INC. AND SUBSIDIARIES
Financing and Leasing Assets
(dollars in millions)
| June 30, | March 31, | December 31, | June 30, | |||||||||||||
| 2016 | 2016 | 2015 | 2015 | |||||||||||||
| Commercial Banking | ||||||||||||||||
| Commercial Finance | ||||||||||||||||
| Loans | $ | 8,512.9 | $ | 9,329.4 | $ | 9,118.6 | $ | 6,734.8 | ||||||||
| Assets held for sale | 461.3 | 203.4 | 313.6 | 88.2 | ||||||||||||
| Financing and leasing assets | 8,974.2 | 9,532.8 | 9,432.2 | 6,823.0 | ||||||||||||
| Real Estate Finance | ||||||||||||||||
| Loans | 5,566.1 | 5,348.5 | 5,300.6 | 1,941.4 | ||||||||||||
| Assets held for sale | - | 14.4 | 57.0 | - | ||||||||||||
| Financing and leasing assets | 5,566.1 | 5,362.9 | 5,357.6 | 1,941.4 | ||||||||||||
| Business Capital | ||||||||||||||||
| Loans | 6,630.8 | 6,759.3 | 6,510.0 | 6,436.1 | ||||||||||||
| Operating lease equipment, net | 314.8 | 292.6 | 259.0 | 241.9 | ||||||||||||
| Assets held for sale | 10.4 | 11.9 | 44.3 | - | ||||||||||||
| Financing and leasing assets | 6,956.0 | 7,063.8 | 6,813.3 | 6,678.0 | ||||||||||||
| Total Segment | ||||||||||||||||
| Loans | 20,709.8 | 21,437.2 | 20,929.2 | 15,112.3 | ||||||||||||
| Operating lease equipment, net | 314.8 | 292.6 | 259.0 | 241.9 | ||||||||||||
| Assets held for sale | 471.7 | 229.7 | 414.9 | 88.2 | ||||||||||||
| Financing and leasing assets | 21,496.3 | 21,959.5 | 21,603.1 | 15,442.4 | ||||||||||||
| Transportation Finance | ||||||||||||||||
| Aerospace | ||||||||||||||||
| Loans | 904.4 | 1,031.9 | 1,762.3 | 1,739.6 | ||||||||||||
| Operating lease equipment, net | 9,685.6 | 9,594.3 | 9,765.2 | 8,816.7 | ||||||||||||
| Assets held for sale | 764.1 | 723.8 | 34.7 | 243.9 | ||||||||||||
| Financing and leasing assets | 11,354.1 | 11,350.0 | 11,562.2 | 10,800.2 | ||||||||||||
| Rail | ||||||||||||||||
| Loans | 106.9 | 118.1 | 120.9 | 124.7 | ||||||||||||
| Operating lease equipment, net | 6,864.2 | 6,778.8 | 6,592.8 | 6,010.8 | ||||||||||||
| Assets held for sale | 6.9 | 0.4 | 0.7 | 0.9 | ||||||||||||
| Financing and leasing assets | 6,978.0 | 6,897.3 | 6,714.4 | 6,136.4 | ||||||||||||
| Maritime Finance | ||||||||||||||||
| Loans | 1,601.8 | 1,636.7 | 1,658.9 | 1,274.4 | ||||||||||||
| Assets held for sale | 29.6 | 30.5 | 19.5 | 56.4 | ||||||||||||
| Financing and leasing assets | 1,631.4 | 1,667.2 | 1,678.4 | 1,330.8 | ||||||||||||
| Total Segment | ||||||||||||||||
| Loans | 2,613.1 | 2,786.7 | 3,542.1 | 3,138.7 | ||||||||||||
| Operating lease equipment, net | 16,549.8 | 16,373.1 | 16,358.0 | 14,827.5 | ||||||||||||
| Assets held for sale | 800.6 | 754.7 | 54.9 | 301.2 | ||||||||||||
| Financing and leasing assets | 19,963.5 | 19,914.5 | 19,955.0 | 18,267.4 | ||||||||||||
| Consumer and Community Banking | ||||||||||||||||
| Other Consumer Banking | ||||||||||||||||
| Loans | 1,977.1 | 1,879.5 | 1,770.0 | - | ||||||||||||
| Assets held for sale | 3.3 | 2.6 | 3.9 | - | ||||||||||||
| Financing and leasing assets | 1,980.4 | 1,882.1 | 1,773.9 | - | ||||||||||||
| Legacy Consumer Mortgages | ||||||||||||||||
| Loans | 5,156.8 | 5,305.2 | 5,430.4 | - | ||||||||||||
| Assets held for sale | 34.6 | 48.0 | 41.2 | - | ||||||||||||
| Financing and leasing assets | 5,191.4 | 5,353.2 | 5,471.6 | - | ||||||||||||
| Total Segment | ||||||||||||||||
| Loans | 7,133.9 | 7,184.7 | 7,200.4 | - | ||||||||||||
| Assets held for sale | 37.9 | 50.6 | 45.1 | - | ||||||||||||
| Financing and leasing assets | 7,171.8 | 7,235.3 | 7,245.5 | - | ||||||||||||
| Non-Strategic Portfolios | ||||||||||||||||
| Loans | - | - | - | 1,398.3 | ||||||||||||
| Operating lease equipment, net | - | - | - | 40.2 | ||||||||||||
| Assets held for sale | 1,093.1 | 1,176.2 | 1,577.5 | 697.4 | ||||||||||||
| Financing and leasing assets | 1,093.1 | 1,176.2 | 1,577.5 | 2,135.9 | ||||||||||||
| Total financing and leasing assets | $ | 49,724.7 | $ | 50,285.5 | $ | 50,381.1 | $ | 35,845.7 | ||||||||
22
CIT GROUP INC. AND SUBSIDIARIES
Credit Metrics
(dollars in millions)
| Quarters Ended | ||||||||||||||||||||||||||||||||
| June 30, 2016 | March 31, 2016 | June 30, 2015 | ||||||||||||||||||||||||||||||
| Gross Charge-offs to Average Finance Receivables | ||||||||||||||||||||||||||||||||
| Commercial Banking(2) | $ | 38.0 | 0.72 | % | $ | 35.8 | 0.68 | % | $ | 29.8 | 0.79 | % | ||||||||||||||||||||
| Transportation Finance(1) | 6.6 | 0.97 | % | 19.6 | 2.35 | % | 0.7 | 0.09 | % | |||||||||||||||||||||||
| Consumer and Community Banking | 0.5 | 0.03 | % | 0.7 | 0.04 | % | - | - | ||||||||||||||||||||||||
| Non-Strategic Portfolios | - | - | - | - | 3.7 | 1.04 | % | |||||||||||||||||||||||||
| Total CIT | $ | 45.1 | 0.58 | % | $ | 56.1 | 0.71 | % | $ | 34.2 | 0.70 | % | ||||||||||||||||||||
| Six Months Ended June 30 | ||||||||||||||||||||||||||||||||
| 2016 | 2015 | |||||||||||||||||||||||||||||||
| Commercial Banking(2) | $ | 73.8 | 0.70 | % | $ | 52.4 | 0.70 | % | ||||||||||||||||||||||||
| Transportation Finance(1) | 26.2 | 1.71 | % | 0.7 | 0.05 | % | ||||||||||||||||||||||||||
| Consumer and Community Banking | 1.2 | 0.03 | % | - | - | |||||||||||||||||||||||||||
| Non-Strategic Portfolios | - | - | 7.7 | 1.07 | % | |||||||||||||||||||||||||||
| Total CIT | $ | 101.2 | 0.65 | % | $ | 60.8 | 0.63 | % | ||||||||||||||||||||||||
| Quarters Ended | ||||||||||||||||||||||||||||||||
| June 30, 2016 | March 31, 2016 | June 30, 2015 | ||||||||||||||||||||||||||||||
| Net Charge-offs to Average Finance Receivables | ||||||||||||||||||||||||||||||||
| Commercial Banking(2) | $ | 34.7 | 0.66 | % | $ | 31.8 | 0.60 | % | $ | 25.2 | 0.67 | % | ||||||||||||||||||||
| Transportation Finance(1) | 6.6 | 0.97 | % | 19.6 | 2.35 | % | 0.6 | 0.08 | % | |||||||||||||||||||||||
| Consumer and Community Banking | (0.3 | ) | -0.02 | % | (0.1 | ) | -0.01 | % | - | - | ||||||||||||||||||||||
| Non-Strategic Portfolios | - | - | - | - | (2.3 | ) | (0.65 | %) | ||||||||||||||||||||||||
| Total CIT | $ | 41.0 | 0.53 | % | $ | 51.3 | 0.65 | % | $ | 23.5 | 0.48 | % | ||||||||||||||||||||
| Six Months Ended June 30 | ||||||||||||||||||||||||||||||||
| 2016 | 2015 | |||||||||||||||||||||||||||||||
| Commercial Banking(2) | $ | 66.5 | 0.63 | % | $ | 44.5 | 0.59 | % | ||||||||||||||||||||||||
| Transportation Finance(1) | 26.2 | 1.71 | % | 0.6 | 0.04 | % | ||||||||||||||||||||||||||
| Consumer and Community Banking | (0.4 | ) | -0.01 | % | - | - | ||||||||||||||||||||||||||
| Non-Strategic Portfolios | - | - | (0.7 | ) | -0.10 | % | ||||||||||||||||||||||||||
| Total CIT | $ | 92.3 | 0.59 | % | $ | 44.4 | 0.46 | % | ||||||||||||||||||||||||
| Non-accruing Loans to Finance Receivables(3) | June 30, 2016 | March 31, 2016 | December 31, 2015 | June 30, 2015 | ||||||||||||||||||||||||||||
| Commercial Banking | $ | 207.8 | 1.00 | % | $ | 215.2 | 1.00 | % | $ | 191.1 | 0.91 | % | $ | 98.1 | 0.65 | % | ||||||||||||||||
| Transportation Finance | 18.2 | 0.70 | % | 21.7 | 0.78 | % | 15.4 | 0.43 | % | 4.7 | 0.15 | % | ||||||||||||||||||||
| Consumer and Community Banking | 11.7 | 0.16 | % | 7.1 | 0.10 | % | 5.2 | 0.07 | % | - | - | |||||||||||||||||||||
| Non-Strategic Portfolios(3) | 45.1 | (3 | ) | 51.1 | (3 | ) | 56.0 | (3 | ) | 95.2 | 6.81 | % | ||||||||||||||||||||
| Total CIT | $ | 282.8 | 0.93 | % | $ | 295.1 | 0.94 | % | $ | 267.7 | 0.85 | % | $ | 198.0 | 1.01 | % | ||||||||||||||||
| PROVISION AND ALLOWANCE COMPONENTS | |||||||||||||||||||
| Provision for Credit Losses | |||||||||||||||||||
| Quarters Ended | Six Months Ended | ||||||||||||||||||
| June 30, | March 31, | June 30, | June 30, | June 30, | |||||||||||||||
| 2016 | 2016 | 2015 | 2016 | 2015 | |||||||||||||||
| Specific allowance - impaired loans | $ | 14.5 | $ | 21.8 | $ | 2.7 | $ | 36.3 | $ | 5.1 | |||||||||
| Non-specific allowance | (27.4 | ) | 26.2 | (7.8 | ) | (1.2 | ) | 3.5 | |||||||||||
| Net charge-offs | 41.0 | 51.3 | 23.5 | 92.3 | 44.4 | ||||||||||||||
| Totals | $ | 28.1 | $ | 99.3 | $ | 18.4 | $ | 127.4 | $ | 53.0 | |||||||||
| Allowance for Loan Losses | |||||||||||||||||||
| June 30, | March 31, | December 31, | June 30, | ||||||||||||||||
| 2016 | 2016 | 2015 | 2015 | ||||||||||||||||
| Specific allowance - impaired loans | $ | 29.4 | $ | 40.2 | $ | 27.8 | $ | 17.5 | |||||||||||
| Non-specific allowance | 370.0 | 364.4 | 332.4 | 333.4 | |||||||||||||||
| Totals | $ | 399.4 | $ | 404.6 | $ | 360.2 | $ | 350.9 | |||||||||||
| Allowance for loan losses as a percentage of total finance receivables | 1.31% | 1.29% | 1.14% | 1.79% | |||||||||||||||
| Allowance for loan losses as a percent of finance receivables/Commercial | 1.62% | 1.61% | 1.43% | 1.79% | |||||||||||||||
| Allowance for loan losses plus principal loss discount as a percent of finance receivables (before the principal loss discount)/Commercial | 1.83% | 1.87% | 1.79% | 1.79% | |||||||||||||||
| Allowance for loan losses plus principal loss discount as a percent of finance receivables (before the principal loss discount)/Consumer | 7.20% | 7.86% | 8.62% | - | |||||||||||||||
In certain instances, we use the term finance receivables synonymously with “Loans”, as presented on the balance sheet.
1) Transportation Finance charge-offs related to the transfer of receivables to assets held for sale for the quarters ended June 30, 2016, March 31, 2016, and June 30, 2015 totaled $7 million, $7 million, and $1 million, respectively.
2) Commercial Banking charge-offs related to the transfer of receivables to assets held for sale for the quarters ended June 30, 2016, March 31, 2016, and June 30, 2015 totaled $19 million, $2 million, and $1 million, respectively.
3) Non-accrual loans include loans held for sale. NSP non-accrual loans reflected loans held for sale; since portfolio loans were insignificant, no % is displayed.
23
CIT GROUP INC. AND SUBSIDIARIES
Segment Results
(dollars in millions)
| Quarters Ended | Six Months Ended | |||||||||||||||||||
| June 30, | March 31, | June 30, | June 30, 2016 | |||||||||||||||||
| 2016 | 2016 | 2015 | 2016 | 2015 | ||||||||||||||||
| Commercial Banking | ||||||||||||||||||||
| Total interest income | $ | 289.2 | $ | 287.1 | $ | 185.9 | $ | 576.3 | $ | 367.2 | ||||||||||
| Total interest expense | (74.7 | ) | (73.6 | ) | (64.7 | ) | (148.3 | ) | (129.5 | ) | ||||||||||
| Provision for credit losses | (11.4 | ) | (73.5 | ) | (18.0 | ) | (84.9 | ) | (42.4 | ) | ||||||||||
| Rental income on operating leases | 28.7 | 27.1 | 23.8 | 55.8 | 46.9 | |||||||||||||||
| Other income | 60.9 | 55.5 | 67.3 | 116.4 | 130.9 | |||||||||||||||
| Depreciation on operating lease equipment | (21.5 | ) | (20.0 | ) | (17.5 | ) | (41.5 | ) | (34.7 | ) | ||||||||||
| Operating expenses | (148.8 | ) | (158.4 | ) | (132.7 | ) | (307.2 | ) | (264.0 | ) | ||||||||||
| Income before provision for income taxes | $ | 122.4 | $ | 44.2 | $ | 44.1 | $ | 166.6 | $ | 74.4 | ||||||||||
| Funded new business volume | $ | 2,048.4 | $ | 1,581.4 | $ | 1,523.4 | $ | 3,629.8 | $ | 2,819.6 | ||||||||||
| Average Earning Assets | $ | 20,575.1 | $ | 20,727.0 | $ | 14,501.8 | $ | 20,627.9 | $ | 14,428.4 | ||||||||||
| Average Finance Receivables | $ | 21,040.7 | $ | 21,130.8 | $ | 15,040.7 | $ | 21,035.6 | $ | 15,006.6 | ||||||||||
| Transportation Finance | ||||||||||||||||||||
| Total interest income | $ | 49.9 | $ | 52.7 | $ | 44.4 | $ | 102.6 | $ | 87.1 | ||||||||||
| Total interest expense | (146.5 | ) | (148.1 | ) | (148.7 | ) | (294.6 | ) | (299.3 | ) | ||||||||||
| Provision for credit losses | (15.6 | ) | (22.7 | ) | (1.1 | ) | (38.3 | ) | (7.5 | ) | ||||||||||
| Rental income on operating leases | 536.6 | 544.5 | 497.9 | 1,081.1 | 994.6 | |||||||||||||||
| Other income | 11.7 | 18.8 | 13.8 | 30.5 | 49.2 | |||||||||||||||
| Depreciation on operating lease equipment | (154.9 | ) | (155.3 | ) | (136.6 | ) | (310.2 | ) | (272.6 | ) | ||||||||||
| Maintenance and other operating lease expenses | (64.9 | ) | (56.2 | ) | (49.4 | ) | (121.1 | ) | (95.5 | ) | ||||||||||
| Operating expenses / loss on debt extinguishment | (62.2 | ) | (60.7 | ) | (63.8 | ) | (122.9 | ) | (131.0 | ) | ||||||||||
| Income before provision for income taxes | $ | 154.1 | $ | 173.0 | $ | 156.5 | $ | 327.1 | $ | 325.0 | ||||||||||
| Funded new business volume | $ | 461.0 | $ | 245.9 | $ | 743.8 | $ | 706.9 | $ | 1,163.3 | ||||||||||
| Average Earning Assets | $ | 20,945.7 | $ | 20,619.5 | $ | 18,957.2 | $ | 20,761.9 | $ | 18,933.6 | ||||||||||
| Average Finance Receivables | $ | 2,726.0 | $ | 3,333.4 | $ | 3,047.5 | $ | 3,064.4 | $ | 2,994.4 | ||||||||||
| Consumer and Community Banking | ||||||||||||||||||||
| Total interest income | $ | 105.4 | $ | 103.2 | $ | - | $ | 208.6 | $ | - | ||||||||||
| Total interest expense | (5.9 | ) | (8.9 | ) | - | (14.8 | ) | - | ||||||||||||
| Provision for credit losses | (1.1 | ) | (3.1 | ) | - | (4.2 | ) | - | ||||||||||||
| Other income | 11.7 | 8.1 | - | 19.8 | - | |||||||||||||||
| Operating expenses | (93.2 | ) | (82.2 | ) | - | (175.4 | ) | - | ||||||||||||
| Income before provision for income taxes | $ | 16.9 | $ | 17.1 | $ | - | $ | 34.0 | $ | - | ||||||||||
| Funded new business volume | $ | 261.3 | $ | 214.5 | $ | - | $ | 475.8 | $ | - | ||||||||||
| Average Earning Assets | $ | 7,728.6 | $ | 7,757.8 | $ | - | $ | 7,739.2 | $ | - | ||||||||||
| Average Finance Receivables | $ | 7,155.6 | $ | 7,160.4 | $ | - | $ | 7,154.2 | $ | - | ||||||||||
| Non-Strategic Portfolios | ||||||||||||||||||||
| Total interest income | $ | 23.2 | $ | 25.0 | $ | 48.8 | $ | 48.2 | $ | 101.6 | ||||||||||
| Total interest expense | (13.7 | ) | (14.5 | ) | (34.0 | ) | (28.2 | ) | (72.0 | ) | ||||||||||
| Provision for credit losses | - | - | 0.7 | - | (3.1 | ) | ||||||||||||||
| Rental income on operating leases | 4.0 | 3.8 | 10.0 | 7.8 | 20.8 | |||||||||||||||
| Other income | 6.7 | 14.5 | (1.0 | ) | 21.2 | (7.2 | ) | |||||||||||||
| Depreciation on operating lease equipment | - | - | (3.7 | ) | - | (7.3 | ) | |||||||||||||
| Operating expenses | (12.1 | ) | (12.2 | ) | (34.6 | ) | (24.3 | ) | (71.6 | ) | ||||||||||
| Income (loss) before provision for income taxes | $ | 8.1 | $ | 16.6 | $ | (13.8 | ) | $ | 24.7 | $ | (38.8 | ) | ||||||||
| Funded new business volume | $ | 61.1 | $ | 44.3 | $ | 215.5 | $ | 105.4 | $ | 416.9 | ||||||||||
| Average Earning Assets | $ | 1,384.5 | $ | 1,516.8 | $ | 2,558.0 | $ | 1,456.2 | $ | 2,648.8 | ||||||||||
| Average Finance Receivables | $ | - | $ | - | $ | 1,423.5 | $ | - | $ | 1,442.6 | ||||||||||
| Corporate and Other | ||||||||||||||||||||
| Total interest income | $ | 27.6 | $ | 27.4 | $ | 4.7 | $ | 55.0 | $ | 8.9 | ||||||||||
| Total interest expense | (41.7 | ) | (41.3 | ) | (17.8 | ) | (83.0 | ) | (35.7 | ) | ||||||||||
| Other income | 13.3 | 4.0 | (16.6 | ) | 17.3 | (23.0 | ) | |||||||||||||
| Operating expenses / loss on debt extinguishment and deposit redemption | (25.3 | ) | (36.6 | ) | (4.0 | ) | (61.9 | ) | (10.1 | ) | ||||||||||
| Loss before provision for income taxes | $ | (26.1 | ) | $ | (46.5 | ) | $ | (33.7 | ) | $ | (72.6 | ) | $ | (59.9 | ) | |||||
| Average Earning Assets | $ | 8,595.3 | $ | 8,585.3 | $ | 5,142.4 | $ | 8,629.6 | $ | 5,557.1 | ||||||||||
| Total CIT | ||||||||||||||||||||
| Total interest income | $ | 495.3 | $ | 495.4 | $ | 283.8 | $ | 990.7 | $ | 564.8 | ||||||||||
| Total interest expense | (282.5 | ) | (286.4 | ) | (265.2 | ) | (568.9 | ) | (536.5 | ) | ||||||||||
| Provision for credit losses | (28.1 | ) | (99.3 | ) | (18.4 | ) | (127.4 | ) | (53.0 | ) | ||||||||||
| Rental income on operating leases | 569.3 | 575.4 | 531.7 | 1,144.7 | 1,062.3 | |||||||||||||||
| Other income | 104.3 | 100.9 | 63.5 | 205.2 | 149.9 | |||||||||||||||
| Depreciation on operating lease equipment | (176.4 | ) | (175.3 | ) | (157.8 | ) | (351.7 | ) | (314.6 | ) | ||||||||||
| Maintenance and other operating lease expenses | (64.9 | ) | (56.2 | ) | (49.4 | ) | (121.1 | ) | (95.5 | ) | ||||||||||
| Operating expenses / loss on debt extinguishment | (341.6 | ) | (350.1 | ) | (235.1 | ) | (691.7 | ) | (476.7 | ) | ||||||||||
| Income from continuing operations before provision for income taxes | $ | 275.4 | $ | 204.4 | $ | 153.1 | $ | 479.8 | $ | 300.7 | ||||||||||
| Funded new business volume | $ | 2,831.8 | $ | 2,086.1 | $ | 2,482.7 | $ | 4,917.9 | $ | 4,399.8 | ||||||||||
| Average Earning Assets | $ | 59,229.2 | $ | 59,206.4 | $ | 41,159.4 | $ | 59,214.8 | $ | 41,567.9 | ||||||||||
| Average Finance Receivables | $ | 30,922.3 | $ | 31,624.6 | $ | 19,511.7 | $ | 31,254.2 | $ | 19,443.6 | ||||||||||
24
CIT GROUP INC. AND SUBSIDIARIES
Segment Margin
(dollars in millions)
| Quarters Ended | Six Months Ended | |||||||||||||||||||
| June 30, | March 31, | June 30, | June 30, | |||||||||||||||||
| 2016 | 2016 | 2015 | 2016 | 2015 | ||||||||||||||||
| Commercial Banking | ||||||||||||||||||||
| Total Segment | ||||||||||||||||||||
| AEA | $ | 20,575.1 | $ | 20,727.0 | $ | 14,501.8 | $ | 20,627.9 | $ | 14,428.4 | ||||||||||
| Net Finance Revenue | 221.7 | 220.6 | 127.5 | 442.3 | 249.9 | |||||||||||||||
| Gross yield | 6.18% | 6.06% | 5.78% | 6.13% | 5.74% | |||||||||||||||
| Net Finance Margin | 4.31% | 4.26% | 3.52% | 4.29% | 3.46% | |||||||||||||||
| Average Earning Assets (AEA) | ||||||||||||||||||||
| Commercial Finance | $ | 9,260.5 | $ | 9,545.4 | $ | 6,784.3 | $ | 9,381.4 | $ | 6,753.1 | ||||||||||
| Real Estate Finance | 5,453.8 | 5,334.6 | 1,860.6 | 5,398.6 | 1,819.9 | |||||||||||||||
| Business Capital | 5,860.8 | 5,847.0 | 5,856.9 | 5,847.9 | 5,855.4 | |||||||||||||||
| Net Finance Revenue | ||||||||||||||||||||
| Commercial Finance | $ | 94.5 | $ | 90.6 | $ | 45.1 | $ | 185.1 | $ | 89.2 | ||||||||||
| Real Estate Finance | 51.6 | 54.4 | 11.1 | 106.0 | 21.1 | |||||||||||||||
| Business Capital | 75.6 | 75.6 | 71.3 | 151.2 | 139.6 | |||||||||||||||
| Gross yield | ||||||||||||||||||||
| Commercial Finance | 5.38% | 5.03% | 4.40% | 5.22% | 4.40% | |||||||||||||||
| Real Estate Finance | 5.18% | 5.44% | 4.00% | 5.31% | 3.97% | |||||||||||||||
| Business Capital | 8.38% | 8.32% | 7.95% | 8.36% | 7.83% | |||||||||||||||
| Net Finance Margin | ||||||||||||||||||||
| Commercial Finance | 4.08% | 3.80% | 2.66% | 3.95% | 2.64% | |||||||||||||||
| Real Estate Finance | 3.78% | 4.08% | 2.39% | 3.93% | 2.32% | |||||||||||||||
| Business Capital | 5.16% | 5.17% | 4.87% | 5.17% | 4.77% | |||||||||||||||
| Transportation Finance | ||||||||||||||||||||
| AEA | $ | 20,945.7 | $ | 20,619.5 | $ | 18,957.2 | $ | 20,761.9 | $ | 18,933.6 | ||||||||||
| Net Finance Revenue | 220.2 | 237.6 | 207.6 | 457.8 | 414.3 | |||||||||||||||
| Gross yield | 11.20% | 11.59% | 11.44% | 11.40% | 11.43% | |||||||||||||||
| Net Finance Margin | 4.21% | 4.61% | 4.38% | 4.41% | 4.38% | |||||||||||||||
| Average Earning Assets (AEA) | ||||||||||||||||||||
| Aerospace | $ | 12,255.8 | $ | 12,050.9 | $ | 11,643.6 | $ | 12,137.1 | $ | 11,778.1 | ||||||||||
| Rail | 7,036.7 | 6,882.4 | 6,115.2 | 6,954.7 | 6,026.2 | |||||||||||||||
| Maritime Finance | 1,653.2 | 1,686.2 | 1,198.4 | 1,670.1 | 1,129.3 | |||||||||||||||
| Net Finance Revenue | ||||||||||||||||||||
| Aerospace | $ | 110.6 | $ | 119.6 | $ | 99.1 | $ | 230.2 | $ | 200.7 | ||||||||||
| Rail | 94.0 | 100.2 | 98.0 | 194.2 | 194.3 | |||||||||||||||
| Maritime Finance | 15.6 | 17.8 | 10.5 | 33.4 | 19.3 | |||||||||||||||
| Gross yield | ||||||||||||||||||||
| Aerospace | 10.87% | 11.18% | 10.41% | 11.04% | 10.41% | |||||||||||||||
| Rail | 13.16% | 13.73% | 14.65% | 13.45% | 14.63% | |||||||||||||||
| Maritime Finance | 5.30% | 5.75% | 5.12% | 5.53% | 5.04% | |||||||||||||||
| Net Finance Margin | ||||||||||||||||||||
| Aerospace | 3.61% | 3.97% | 3.40% | 3.79% | 3.41% | |||||||||||||||
| Rail | 5.34% | 5.82% | 6.41% | 5.58% | 6.45% | |||||||||||||||
| Maritime Finance | 3.77% | 4.22% | 3.50% | 4.00% | 3.42% | |||||||||||||||
| Consumer and Community Banking | ||||||||||||||||||||
| Total Segment | ||||||||||||||||||||
| AEA | $ | 7,728.6 | $ | 7,757.8 | $ | - | $ | 7,739.2 | $ | - | ||||||||||
| Net Finance Revenue | 99.5 | 94.3 | - | 193.8 | - | |||||||||||||||
| Gross yield | 5.46% | 5.32% | - | 5.39% | - | |||||||||||||||
| Net Finance Margin | 5.15% | 4.86% | - | 5.01% | - | |||||||||||||||
| Average Earning Assets (AEA) | ||||||||||||||||||||
| Other Consumer Banking | $ | 2,071.7 | $ | 1,941.8 | $ | - | $ | 2,003.5 | $ | - | ||||||||||
| Legacy Consumer Mortgages | 5,656.9 | 5,816.0 | - | 5,735.7 | - | |||||||||||||||
| Net Finance Revenue | ||||||||||||||||||||
| Other Consumer Banking | $ | 37.1 | $ | 34.0 | $ | - | $ | 71.1 | $ | - | ||||||||||
| Legacy Consumer Mortgages | 62.4 | 60.3 | - | 122.7 | - | |||||||||||||||
| Gross yield | ||||||||||||||||||||
| Other Consumer Banking | 3.58% | 3.65% | - | 3.62% | - | |||||||||||||||
| Legacy Consumer Mortgages | 6.15% | 5.87% | - | 6.01% | - | |||||||||||||||
| Net Finance Margin | ||||||||||||||||||||
| Other Consumer Banking | 7.16% | 7.00% | - | 7.10% | - | |||||||||||||||
| Legacy Consumer Mortgages | 4.41% | 4.15% | - | 4.28% | - | |||||||||||||||
| Non-Strategic Portfolios | ||||||||||||||||||||
| AEA | $ | 1,384.5 | $ | 1,516.8 | $ | 2,558.0 | $ | 1,456.2 | $ | 2,648.8 | ||||||||||
| Net Finance Revenue | 13.5 | 14.3 | 21.1 | 27.8 | 43.1 | |||||||||||||||
| Gross yield | 7.86% | 7.59% | 9.19% | 7.69% | 9.24% | |||||||||||||||
| Net Finance Margin | 3.90% | 3.77% | 3.30% | 3.82% | 3.25% | |||||||||||||||
Gross Yield includes interest income and rental income as a % of AEA.
Net Finance Margin (NFM) reflects Net Finance Revenue divided by AEA.
25
CIT GROUP INC. AND SUBSIDIARIES
Non-GAAP Disclosures
(dollars in millions)
Non-GAAP financial measures disclosed by management are meant to provide additional information and insight relative to business trends to investors and, in certain cases, to present financial information as measured by rating agencies and other users of financial information. These measures are not in accordance with, or a substitute for, GAAP and may be different from, or inconsistent with, non-GAAP financial measures used by other companies.
| Quarters Ended | Six Months Ended | |||||||||||||||||||
| June 30, | March 31, | June 30, | June 30, | |||||||||||||||||
| Total Net Revenues(1) | 2016 | 2016 | 2015 | 2016 | 2015 | |||||||||||||||
| Interest income | $ | 495.3 | $ | 495.4 | $ | 283.8 | $ | 990.7 | $ | 564.8 | ||||||||||
| Rental income on operating leases | 569.3 | 575.4 | 531.7 | 1,144.7 | 1,062.3 | |||||||||||||||
| Finance revenue | 1,064.6 | 1,070.8 | 815.5 | 2,135.4 | 1,627.1 | |||||||||||||||
| Interest expense | (282.5 | ) | (286.4 | ) | (265.2 | ) | (568.9 | ) | (536.5 | ) | ||||||||||
| Depreciation on operating lease equipment | (176.4 | ) | (175.3 | ) | (157.8 | ) | (351.7 | ) | (314.6 | ) | ||||||||||
| Maintenance and other operating lease expenses | (64.9 | ) | (56.2 | ) | (49.4 | ) | (121.1 | ) | (95.5 | ) | ||||||||||
| Net finance revenue (NFR) | 540.8 | 552.9 | 343.1 | 1,093.7 | 680.5 | |||||||||||||||
| Other income | 104.3 | 100.9 | 63.5 | 205.2 | 149.9 | |||||||||||||||
| Total net revenues | $ | 645.1 | $ | 653.8 | $ | 406.6 | $ | 1,298.9 | $ | 830.4 | ||||||||||
| NFR as a % of AEA | 3.65% | 3.74% | 3.33% | 3.69% | 3.27% | |||||||||||||||
| Net Operating Lease Revenues(2) | ||||||||||||||||||||
| Rental income on operating leases | $ | 569.3 | $ | 575.4 | $ | 531.7 | $ | 1,144.7 | $ | 1,062.3 | ||||||||||
| Depreciation on operating lease equipment | (176.4 | ) | (175.3 | ) | (157.8 | ) | $ | (351.7 | ) | $ | (314.6 | ) | ||||||||
| Maintenance and other operating lease expenses | (64.9 | ) | (56.2 | ) | (49.4 | ) | $ | (121.1 | ) | $ | (95.5 | ) | ||||||||
| Net operating lease revenue | $ | 328.0 | $ | 343.9 | $ | 324.5 | $ | 671.9 | $ | 652.2 | ||||||||||
| June 30, | March 31, | December 31, | June 30, | |||||||||||||||||
| Earning Assets(3) | 2016 | 2016 | 2015 | 2015 | ||||||||||||||||
| Loans | $ | 30,456.8 | $ | 31,408.6 | $ | 31,671.7 | $ | 19,649.3 | ||||||||||||
| Operating lease equipment, net | 16,864.6 | 16,665.7 | 16,617.0 | 15,109.6 | ||||||||||||||||
| Assets held for sale | 2,403.3 | 2,211.2 | 2,092.4 | 1,086.8 | ||||||||||||||||
| Credit balances of factoring clients | (1,215.2 | ) | (1,361.0 | ) | (1,344.0 | ) | (1,373.3 | ) | ||||||||||||
| Interest bearing cash | 7,082.8 | 7,135.0 | 6,820.3 | 4,224.8 | ||||||||||||||||
| Investment securities | 3,229.1 | 2,896.8 | 2,953.8 | 1,692.9 | ||||||||||||||||
| Securities purchased under agreements to resell | - | - | - | 750.0 | ||||||||||||||||
| Indemnification assets | 375.5 | 389.4 | 414.8 | - | ||||||||||||||||
| Total earning assets | $ | 59,196.9 | $ | 59,345.7 | $ | 59,226.0 | $ | 41,140.1 | ||||||||||||
| Average Earning Assets (for the respective quarters) | $ | 59,229.2 | $ | 59,206.4 | $ | 59,141.5 | $ | 41,159.4 | ||||||||||||
| Quarters Ended | Six Months Ended | |||||||||||||||||||
| June 30, | March 31, | June 30, | June 30, | |||||||||||||||||
| Adjusted Operating Expenses | 2016 | 2016 | 2015 | 2016 | 2015 | |||||||||||||||
| Operating expenses | $ | (337.5 | ) | $ | (348.5 | ) | $ | (235.0 | ) | $ | (686.0 | ) | $ | (476.6 | ) | |||||
| Provision for severance and facilities exiting activities | 9.7 | 20.3 | 1.1 | 30.0 | 0.1 | |||||||||||||||
| Intangible assets amortization | 6.4 | 6.4 | 0.5 | 12.8 | 1.1 | |||||||||||||||
| Operating expenses exclusive of restructuring costs and intangible assets amortization(4) | $ | (321.4 | ) | $ | (321.8 | ) | $ | (233.4 | ) | $ | (643.2 | ) | $ | (475.4 | ) | |||||
| Operating expenses (exclusive of restructuring costs and intangible assets amortization) as a % of AEA | (2.17% | ) | (2.17% | ) | (2.27% | ) | (2.17% | ) | (2.29% | ) | ||||||||||
| Total Net Revenue | $ | 645.1 | $ | 653.8 | $ | 406.6 | $ | 1,298.9 | $ | 830.4 | ||||||||||
| Operating expenses exclusive of restructuring costs and intangible assets amortization(4) | $ | (321.4 | ) | $ | (321.8 | ) | $ | (233.4 | ) | $ | (643.2 | ) | $ | (475.4 | ) | |||||
| Net Efficiency Ratio(5) | 49.8% | 49.2% | 57.4% | 49.5% | 57.2% | |||||||||||||||
| June 30, | March 31, | December 31, | June 30, | |||||||||||||||||
| 2016 | 2016 | 2015 | 2015 | |||||||||||||||||
| Continuing Operations Total Assets(6) | ||||||||||||||||||||
| Total Assets | $ | 66,700.3 | $ | 67,097.6 | $ | 67,401.5 | $ | 46,545.1 | ||||||||||||
| Assets of discontinued operation | (469.1 | ) | (489.5 | ) | (500.5 | ) | - | |||||||||||||
| Continuing operations total assets | $ | 66,231.2 | $ | 66,608.1 | $ | 66,901.0 | $ | 46,545.1 | ||||||||||||
| June 30, | March 31, | December 31, | June 30, | |||||||||||||||||
| Tangible Book Value(7) | 2016 | 2016 | 2015 | 2015 | ||||||||||||||||
| Total common stockholders' equity | $ | 11,124.1 | $ | 11,125.8 | $ | 10,978.1 | $ | 8,807.1 | ||||||||||||
| Less: Goodwill | (1,169.7 | ) | (1,195.1 | ) | (1,198.3 | ) | (565.9 | ) | ||||||||||||
| Intangible assets | (168.9 | ) | (170.3 | ) | (176.3 | ) | (21.4 | ) | ||||||||||||
| Tangible book value | 9,785.5 | 9,760.4 | 9,603.5 | 8,219.8 | ||||||||||||||||
| Less: Disallowed deferred tax asset | (842.4 | ) | (873.9 | ) | (904.5 | ) | (339.7 | ) | ||||||||||||
| Adjusted tangible common equity(8) | $ | 8,943.1 | $ | 8,886.5 | $ | 8,699.0 | $ | 7,880.1 | ||||||||||||
| Average adjusted tangible common equity | $ | 8,971.6 | $ | 8,825.1 | $ | 8,675.5 | $ | 7,917.7 | ||||||||||||
(1) Total net revenues are the combination of net finance revenue and other income and is an aggregation of all sources of revenue for the Company. Total net revenues are used by management to monitor business performance.
(2) Total net operating lease revenues are the combination of rental income on operating leases less depreciation on operating lease equipment and maintenance and other operating lease expenses. Total net operating lease revenues are used by management to monitor portfolio performance.
(3) Earning assets are utilized in certain revenue and earnings ratios. Earning assets are net of credit balances of factoring clients. This net amount represents the amounts we fund.
(4) Operating expenses exclusive of restructuring costs and intangible amortization is a non-GAAP measure used by management to compare period over period expenses.
(5) Net efficiency ratio is a non-GAAP measurement used by management to measure operating expenses (before restructuring costs and intangible amortization) to the level of total net revenues.
(6) Total assets from continuing operations is a non-GAAP measurement used by management to analyze the total asset change on a more consistent basis.
(7) Tangible book value is a non-GAAP measure, which represents an adjusted common shareholders’ equity balance that has been reduced by goodwill and intangible assets. Tangible book value is used to compute a per common share amount, which is used to evaluate our use of equity.
(8) Return on average tangible common equity is adjusted to remove the impact of intangible amortization, goodwill impairment and the impact from valuation allowance reversals from income from continuing operations, while the average tangible common equity is reduced for disallowed deferred tax assets. Return on average tangible common equity is another metric used to evaluate our use of equity.
Exhibit 99.2

Second Quarter 2016 Financial Results July 28, 2016

1 Important Notices This presentation contains forward - looking statements within the meaning of applicable federal securities laws that are based upon our current expectations and assumptions concerning future events, which are subject to a number of risks and uncertainties that could cause actual results to differ materially from those anticipated . The words “expect,” “anticipate,” “estimate,” “forecast,” “initiative,” “objective,” “plan,” “goal,” “project,” “outlook,” “priorities,” “target,” “intend,” “evaluate,” “pursue,” “commence,” “seek,” “may,” “would,” “could,” “should,” “believe,” “potential,” and “continue,” or the negative of any of those words or similar expressions are intended to identify forward - looking statements . All statements contained in this presentation, other than statements of historical fact, including without limitation, statements about our plans, strategies, prospects and expectations regarding future events and our financial performance, are forward - looking statements that involve certain risks and uncertainties . While these statements represent our current judgment on what the future may hold, and we believe these judgments are reasonable, these statements are not guarantees of any events or financial results, and our actual results may differ materially . Important factors that could cause our actual results to be materially different from our expectations include, among others, the risk that CIT is unsuccessful in implementing its strategy and business plan, the risk that CIT is unable to react to and address key business and regulatory issues, the risk that CIT is unable to achieve the projected revenue growth from its new business initiatives or the projected expense reductions from efficiency improvements, and the risk that CIT becomes subject to liquidity constraints and higher funding costs . We describe these and other risks that could affect our results in Item 1 A, “Risk Factors,” of our latest Annual Report on Form 10 - K for the year ended December 31 , 2015 , which was filed with the Securities and Exchange Commission . Accordingly, you should not place undue reliance on the forward - looking statements contained in this presentation . These forward - looking statements speak only as of the date on which the statements were made . CIT undertakes no obligation to update publicly or otherwise revise any forward - looking statements, except where expressly required by law . This presentation is to be used solely as part of CIT management’s continuing investor communications program . This presentation shall not constitute an offer or solicitation in connection with any securities . | 2Q16 Earnings

2 Executing on Our 2016 Priorities 1 Focus on Our Core Businesses 3 Maintain Strong Risk Management | 2Q16 Earnings 2 Improve Profitability and Return Capital (1) Commercial allowance for loan losses plus principal loss discount as % of commercial finance receivables (before the prin cip al loss discount). (2) Reflects the purchase accounting discount for loans acquired from OneWest Bank and the allowance for loan losses. ▪ Announced sale of Canada Equipment and Corporate Finance business ▪ China business exit progressing ▪ Filed initial Form 10 Registration Statement for C2 Aviation Capital and progressed to second round of bidding in conjunction with dual track process for separation of Commercial A ir ▪ Transferred remaining ~$100 million of Business Air portfolio into assets held for sale (AHFS) ▪ Expect to complete 30% of $125 million annual expense save target by year - end ▪ Deposits represent approximately 65% of total funding; deposit costs remained stable ▪ Grew Commercial Banking deposits by 12% from first quarter ▪ Commercial credit reserve (1) 1.8% of finance receivables ▪ Non - accruals 0.9% of finance receivables ▪ 10.5% coverage (2) on energy loans ▪ Common Equity Tier 1 ratio 13.4% up ~ 3 0 bps
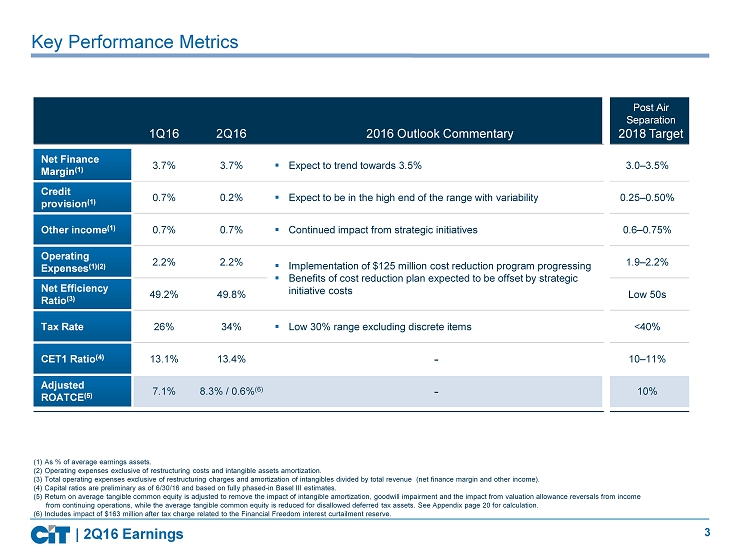
3 Key Performance Metrics (1) As % of average earnings assets . (2) Operating expenses exclusive of restructuring costs and intangible assets amortization. (3) Total operating expenses exclusive of restructuring charges and amortization of intangibles divided by total revenue (net finance margin and other income). (4) Capital ratios are preliminary as of 6/30/16 and based on fully phased - in Basel III estimates. (5) Return on average tangible common equity is adjusted to remove the impact of intangible amortization, goodwill impairment and th e impact from valuation allowance reversals from income from continuing operations, while the average tangible common equity is reduced for disallowed deferred tax assets. See Appendix page 20 for calculation . (6) Includes impact of $163 million after tax charge related to the Financial Freedom interest curtailment reserve. 1Q16 2Q16 2016 Outlook Commentary Post Air Separation 2018 Target Net Finance Margin (1) 3.7% 3.7% ▪ Expect to trend towards 3.5% 3.0 – 3.5% Credit provision (1) 0.7% 0.2% ▪ Expect to be in the high end of the range with variability 0.25 – 0.50% Other income (1) 0.7% 0.7% ▪ Continued impact from strategic initiatives 0.6 – 0.75% Operating Expenses (1)(2) 2.2% 2.2% ▪ Implementation of $125 million cost reduction program progressing ▪ Benefits of cost reduction plan expected to be offset by strategic initiative costs 1.9 – 2.2% Net Efficiency Ratio (3) 49.2% 49.8% Low 50s Tax Rate 26% 34% ▪ Low 30% range excluding discrete items <40% CET1 Ratio (4) 13.1% 13.4% - 10 – 11% Adjusted ROATCE (5) 7.1% 8.3% / 0.6% (6) - 10% | 2Q16 Earnings

4 (1) Includes U.S . VA reversal impact of $647 million, $3.37 diluted EPS in 3Q15. (2) Average earning assets (AEA) components include interest earning cash, investments, securities and indemnification assets, loans and operating lease equip men t. (3) Excluding transaction costs, 3Q15 net efficiency ratio of 57.6%. Total o perating e xpenses exclusive of r estructuring charges and amortization of intangibles divided by total revenue (Net finance margin and other income). (4) Average finance receivables (AFR) is computed using month - end balances and is the average of finance receivables which inclu des loans, direct finance lease and leverage lease receivables and factoring receivables. It excludes operating lease equipment. (5 ) Beginning in 3Q15 , the ratio is calculated to include the impact of the principal loss discount associated with acquired OneWest receivables and is ALL plus principal loss discount on Commercial loans divided by Commercial Finance Receivables before the impact of the principal loss discount. (6) Capital ratios are preliminary as of 6/30/16 and based on fully phased - in Basel III estimates. At or For the Period Ended 2Q16 1Q16 4Q15 3Q15 2Q15 EPS (Diluted) – Total (1) $0.07 $0.73 $0.72 $3.61 $0.66 EPS (Diluted) – Continuing Ops. (1) $0.90 $0.75 $0.75 $3.63 $0.66 EPS (Diluted) impact from VA Reversal - - - $3.37 - Book Value Per Share $55.07 $55.16 $54.61 $53.74 $50.91 Tangible Book Value Per Share (TBVPS) $48.45 $48.39 $47.77 $47.09 $47.51 Pre - tax r eturn on Average Earning Assets (ROAEA) – Continuing Ops. (2) 1.86% 1.38% 0.95% 1.04% 1.49% After - tax r eturn on Average Earning Assets (ROAEA) – Continuing Ops. (2) 1.22% 1.02% 0.98% 5.29% 1.12% Net Finance Margin – Continuing Ops. 3.65% 3.74% 3.57% 3.67% 3.33% Net Efficiency Ratio – Continuing Ops. (3) 49.8% 49.2% 53.3% 62.2% 57.4% Adjusted ROATCE – Continuing Ops. 8.3% 7.1% 7.1% 2.6% 5.9% Net Charge - offs (% of AFR (4) ) 0.53% 0.65% 0.40% 0.86% 0.48% A llowance for loan losses as % of Finance Receivables for Commercial assets (5) 1.83% 1.87% 1.79% 1.82% 1.79% CET1 Ratio/Tier 1 Capital Ratio (6) 13.4% 13.1% 12.7% 12.5% 14.4% Total Capital Ratio (6) 14.1% 13.8% 13.2% 13.0% 15.1% Performance Highlights & Trends | 2Q16 Earnings

5 ($ Millions, except per share data) Noteworthy Items in 2Q16 Items in 2Q16 Results Continuing Operations Reported Diluted EPS (Continuing) $0.90 Impact Segment Item Line Item Total Pre - tax After tax Per share Corporate Restructuring Operating Expenses ($10) ($6) ($0.03) Transportation Finance Business Air Goodwill Impairment Other Income ($4) ($3) ($0.01) EPS based on 202.3 million average diluted shares outstanding, $ impacts are rounded. | 2Q16 Earnings (1) Currency translation adjustment. Discontinued Operations Reported Diluted EPS (Total) $0.07 Impact Item Total Pre - tax After tax Per share Financial Freedom Interest Curtailment Reserve ($230) ($163) ($0.80)

6 Financing & Leasing Assets (FLA) Highlights 15.4 22.3 21.6 22.0 21.5 18.3 18.7 20.0 19.9 20.0 7.3 7.2 7.2 7.2 2.1 1.8 1.6 1.2 1.1 0 20 40 60 2Q15 3Q15 4Q15 1Q16 2Q16 ($ Billions) | 2Q16 Earnings ▪ Total FLA decreased as asset sales and run - off were partially offset by new originations ▪ Commercial Banking: Decreased 2%, primarily driven by Commercial Finance prepayments and asset sales ▪ Transportation Finance: Transferred remaining Business A ir portfolio of ~$100 million into AHFS ▪ Consumer and Community Banking: Legacy Consumer Mortgages annualized run - off of 12% in the quarter was partially offset by growth in other consumer banking originations Consumer and Community Banking Transportation Finance Commercial Banking Non - Strategic Portfolios $35.8 $50.1 $50.4 $50.3 $49.7 Total Reported

7 ▪ Net Finance Revenue reflects increase in earning assets from OneWest acquisition in 3Q 2015 ▪ Other items primarily include purchase accounting accretion based on unpaid principal balance of the loans (vs. OneWest’s carrying value) ▪ Decrease in Net Finance Margin from prior quarter primarily reflects: - ~10 bps reduction from higher operating lease maintenance/expense in both Air & Rail and lower Rail rents - ~10 bps reduction from loan mix primarily due to run - off in NSP and Consumer and Community Banking segments + ~5 bps benefit from interest recoveries & prepayments in Commercial Banking + ~5 bps benefit from other items 335 421 447 482 458 3.33% 3.67% 3.57% 3.74% 3.65% 2Q15 3Q15 4Q15 1Q16 2Q16 Net Finance Revenue less other items Other Items NFM Net Finance Margin Trends – (Continuing Operations) ($ Millions) Yield Analysis (2) 2Q16 1Q16 2Q15 bps 1Q16 bps 2Q15 Interest bearing deposits and investments 1.24% 1.23% 0.51% 0.01 0.73 Loans 5.96 5.84 5.83 0.12 0.13 Operating leases (net) 7.75 8.23 8.49 (0.48) (0.74) Indemnification assets (9.06) (3.09) - (6.13) (9.22) Earning assets 5.56 5.67 5.91 (0.11) (0.35) Deposits 1.26 1.25 1.71 0.01 (0.45) Borrowings 4.10 4.11 4.70 (0.01) (0.60) Interest - bearing liabilities 2.28 2.29 3.19 (0.01) (0.91) Net Finance Revenue & Net Finance Margin 343 482 528 553 (1) Other items include suspended depreciation, interest recoveries/prepayments and other loan and debt FSA. 2Q16, 1Q16, 4Q15 , 3 Q15 and 2Q15 other items also includes purchase accounting accretion. (2) More detail is available in the average balance sheet within the second quarter 2016 press release. (1) Highlights | 2Q16 Earnings 541

8 27 31 29 26 24 25 30 35 33 28 22 31 17 11 28 (10) (52) (50) 31 24 -55 -30 -5 20 45 70 95 120 145 Other Income Trends – Components (Continuing Operations) Factoring commissions Fee revenues Gains on sales of leasing equipment All other income ($ Millions) 2 Q15 4 Q15 1Q 16 2Q16 3 Q15 Total Reported ▪ Lower factoring commissions primarily driven by lower volume ▪ Higher gains on sales of leasing equipment primarily driven by railcar sales mostly offset by impairments in all other income ▪ All other income primarily reflects: ▪ TRS mark - to - market benefit of $9 million ▪ Mortgage Backed Securities mark - to - market benefit of $5 million ▪ Business Air goodwill impairment charge of $4 million Highlights $64 $39 $30 $101 $104 | 2Q16 Earnings
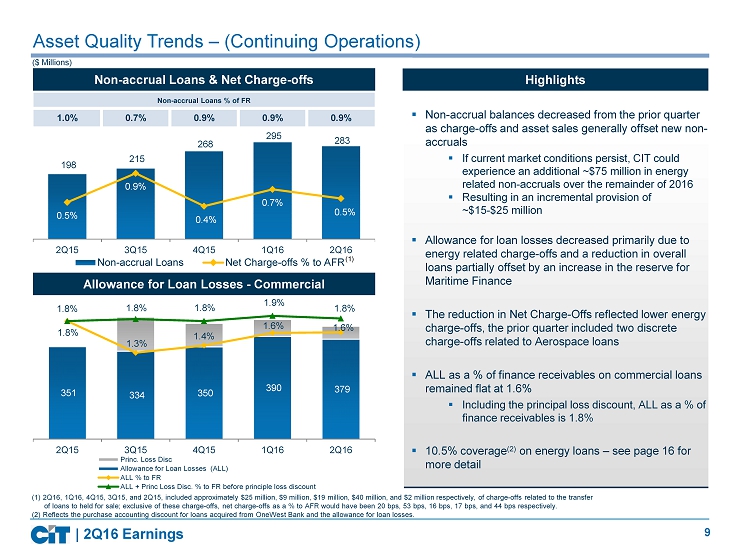
9 Asset Quality Trends – (Continuing Operations) ($ Millions) 198 215 268 295 283 0.5% 0.9% 0.4% 0.7% 0.5% 2Q15 3Q15 4Q15 1Q16 2Q16 Non-accrual Loans Net Charge-offs % to AFR 351 334 350 390 379 1.8% 1.3% 1.4% 1.6% 1.6% 1.8% 1.8% 1.8% 1.9% 1.8% 2Q15 3Q15 4Q15 1Q16 2Q16 Princ. Loss Disc Allowance for Loan Losses (ALL) ALL % to FR ALL + Princ Loss Disc. % to FR before principle loss discount (1) (1) 2Q16, 1Q16, 4Q15, 3Q15, and 2Q15, included approximately $25 million, $9 million, $19 million, $40 million, and $2 million respectively, of charge - offs related to the transfer of loans to held for sale; exclusive of these charge - offs, net charge - offs as a % to AFR would have been 20 bps, 53 bps, 16 bps, 17 bps, and 44 bps respectively. (2) Reflects the purchase accounting discount for loans acquired from OneWest Bank and the allowance for loan losses. Non - accrual Loans & Net Charge - offs Allowance for Loan Losses - Commercial ▪ N on - accrual balances decreased from the prior quarter as charge - offs and asset sales generally offset new non - accruals ▪ If current market conditions persist, CIT could experience an additional ~$75 million in energy related non - accruals over the remainder of 2016 ▪ Resulting in an incremental provision of ~$15 - $25 million ▪ Allowance for loan losses decreased primarily due to energy related charge - offs and a reduction in overall loans partially offset by an increase in the reserve for Maritime Finance ▪ The reduction in Net Charge - Offs reflected lower energy charge - offs, the prior quarter included two discrete charge - offs related to Aerospace loans ▪ ALL as a % of finance receivables on commercial loans remained flat at 1.6% ▪ Including the principal loss discount, ALL as a % of finance receivables is 1.8% ▪ 10.5% coverage (2) on energy loans – see page 16 for more detail Highlights | 2Q16 Earnings Non - accrual Loans % of FR 1.0% 0.7% 0.9% 0.9% 0.9%

10 310 312 305 15 10 17 4Q15 Normalized 1Q16 Comp & Benefits Elevated REO expenses OWB & Other Strategic Initiatives 2Q16 ▪ Expect to complete 30% of $125 million annual expense save target by year - end ▪ Progress on cost reduction initiatives in 2016 will be offset by higher costs related to strategic initiatives (e.g. OneWest Ban k Integration & Commercial Air Separation) ▪ 3Q15 included two months of OneWest Bank operating expenses; all periods thereafter reflect full impact All Other Operating Expenses Costs Related to OneWest Acquisition & Other Strategic Initiatives Amortization of Intangibles Restructuring Charges Operating Expenses Trends – (Continuing Operations) ($ Millions) (1) Total operating e xpenses exclusive of restructuring charges and amortization of intangibles divided by t otal r evenue (Net finance margin and other i ncome). Excluding transaction costs, net efficiency ratio of 57.6% in 3Q15. (2) Exclusive of amortization of intangibles and restructuring charges. (3) Includes reversal of accrued compensation and benefits of $19 million and other general administrative expenses of $8 mil lio n. Highlights 57.4% 62.2% 53.3% 49.2% 49.8% Net Efficiency Ratio (1) | 2Q16 Earnings 226 292 283 312 305 7 32 15 10 17 235 334 358 349 338 2Q15 3Q15 4Q15 1Q16 2Q16 2Q16 Walk (2) 322 321 (16) 8 7 325 (3)
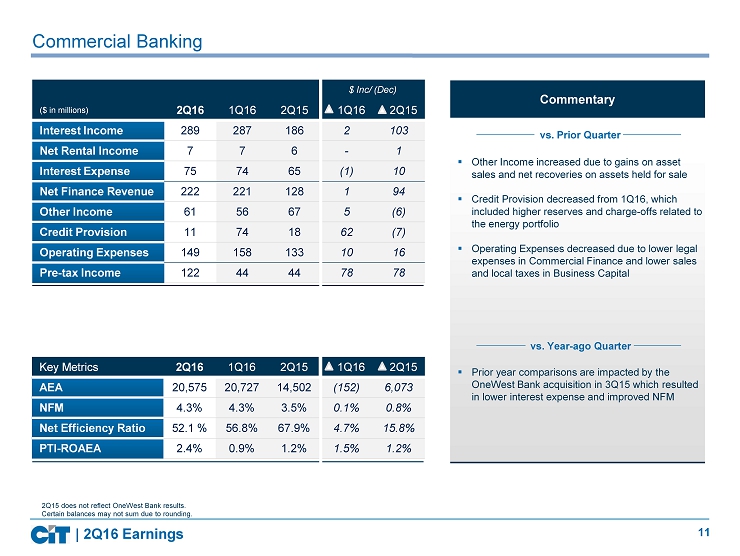
11 Commercial Banking $ Inc/ (Dec) ($ in millions) 2Q16 1Q16 2Q15 1Q16 2Q15 Interest Income 289 287 186 2 103 Net Rental Income 7 7 6 - 1 Interest Expense 75 74 65 (1) 10 Net Finance Revenue 222 221 128 1 94 Other Income 61 56 67 5 (6) Credit Provision 11 74 18 62 (7) Operating Expenses 149 158 133 10 16 Pre - tax Income 122 44 44 78 78 ▪ Other Income increased due to gains on asset sales and net recoveries on assets held for sale ▪ Credit Provision decreased from 1Q16, which included higher reserves and charge - offs related to the energy portfolio ▪ Operating Expenses decreased due to lower legal expenses in Commercial Finance and lower sales and local taxes in Business Capital ▪ Prior year comparisons are impacted by the OneWest Bank acquisition in 3Q15 which resulted in lower interest expense and improved NFM Key Metrics 2Q16 1Q16 2Q15 1Q16 2Q15 AEA 20,575 20,727 14,502 (152) 6,073 NFM 4.3% 4.3% 3.5% 0.1% 0.8% Net Efficiency Ratio 52.1 % 56.8% 67.9% 4.7% 15.8% PTI - ROAEA 2.4% 0.9% 1.2% 1.5% 1.2% | 2Q16 Earnings 2Q15 does not reflect OneWest Bank results. Certain balances may not sum due to rounding. vs. Prior Quarter vs. Year - ago Quarter Commentary

12 Commentary $ Inc/ (Dec) ($ in millions) 2Q16 1Q16 2Q15 1Q16 2Q15 Interest Income 50 53 44 (3) 6 Net Rental Income 382 390 361 (7) 20 Interest Expense 147 148 149 (2) (2) Maintenance & Other 65 56 49 9 16 Net Finance Revenue 220 238 208 (17) 13 Other Income 12 19 14 (7) (2) Credit Provision 16 23 1 (7) 15 Operating Expenses 62 61 64 2 (2) Pre - tax Income 154 173 157 (19) (2) ▪ Net Finance Revenue decreased due to higher maintenance and other operating lease expenses and lower rentals offset by lower funding costs ▪ Credit Provision decreased and continue to reflect reserve increases in Maritime and elevated charges in the Business Air portfolio related to the assets transferred to held for sale ▪ Operating Expenses were relatively flat as higher costs related to the Commercial A ir separation offset lower employee costs ▪ Net Finance Revenue increased due to higher average operating lease assets partially offset by higher maintenance and other operating lease expenses ▪ Other Income decreased largely reflecting higher gains on asset sales in rail, which were offset by impairments, including a $4 million goodwill impairment charge related to the business aircraft assets transferred to held - for - sale ▪ Credit Provision increased primarily due to the Maritime reserve Key Metrics 2Q16 1Q16 2Q15 1Q16 2Q15 AEA 20,946 20,620 18,957 326 1,989 NFM 4.2% 4.6% 4.4% (0.4%) (0.2%) Net Efficiency Ratio 26.1% 23.7% 28.8% (2.4%) 2.7% PTI - ROAEA 2.9% 3.4% 3.3% (0.4%) (0.4%) | 2Q16 Earnings Transportation Finance Certain balances may not sum due to rounding. vs. Prior Quarter vs. Year - ago Quarter

13 Commentary $ Inc/ (Dec) ($ in millions) 2Q16 1Q16 2Q15 1Q16 2Q15 Interest Income 105 103 - 2 105 Interest Expense 6 9 - 3 6 Net Finance Revenue 100 94 - 5 100 Other Income 12 8 - 4 12 Credit Provision 1 3 - (2) 1 Operating Expenses 93 82 - 11 93 Pre - tax Income 17 17 - - 17 ▪ Pre - Tax Income remained flat, reflecting higher other income from gains on REO, higher net finance revenue, and lower credit provision, were offset by higher operating expenses primarily from REO expenses ▪ Prior year comparisons are impacted by the OneWest Bank acquisition in 3Q15 Key Metrics 2Q16 1Q16 2Q15 1Q16 2Q15 AEA 7,729 7,758 - (29) 7,729 NFM 5.2% 4.9% - 0.3% 5.2% Net Efficiency Ratio 79.6% 75.8% - (3.8%) 79.6% PTI - ROAEA 0.9% 0.9% - - 0.9% | 2Q16 Earnings Consumer and Community Banking 2Q15 does not reflect OneWest Bank results. Certain balances may not sum due to rounding. vs. Prior Quarter vs. Year - ago Quarter
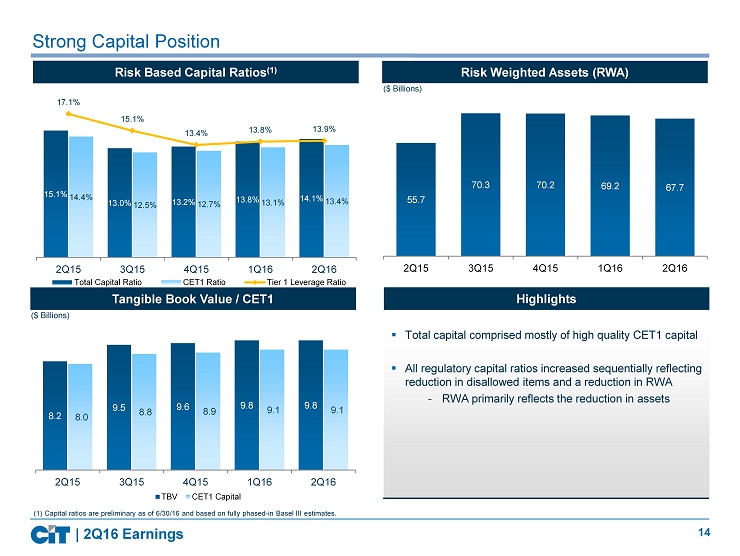
14 15.1% 13.0% 13.2% 13.8% 14.1% 14.4% 12.5% 12.7% 13.1% 13.4% 17.1% 15.1% 13.4% 13.8% 13.9% 2Q15 3Q15 4Q15 1Q16 2Q16 Total Capital Ratio CET1 Ratio Tier 1 Leverage Ratio Strong Capital Position 8.2 9.5 9.6 9.8 9.8 8.0 8.8 8.9 9.1 9.1 2Q15 3Q15 4Q15 1Q16 2Q16 TBV CET1 Capital Tangible Book Value / CET1 Risk Based Capital Ratios (1) ▪ Total capital comprised mostly of high quality CET1 capital ▪ All regulatory capital ratios increased sequentially reflecting reduction in disallowed items and a reduction in RWA - RWA primarily reflects the reduction in assets Highlights | 2Q16 Earnings (1) Capital ratios are preliminary as of 6/30/16 and based on fully phased - in Basel III estimates. ($ Billions) 55.7 70.3 70.2 69.2 67.7 2Q15 3Q15 4Q15 1Q16 2Q16 Risk Weighted Assets (RWA) ($ Billions)
15 APPENDIX | 2Q16 Earnings

16 Exposure to Energy – Oil & Gas Loans ($ Billions) (1) Reflects the purchase accounting discount for loans acquired from OneWest Bank and the allowance for loan losses. (2) 65% line utilization in 1Q16 (3) Line Utilization % at 1Q16: E&P 68%, Midstream 62%, Energy Services 65% (4) Criticized % at 1Q16: E&P 66%, Midstream 2 %, Energy Services 45%. | 2Q16 Earnings Outstanding Line Utilization (3) Criticized (4) Commentary E & P $408 72% 62% ▪ Geographically diversified across the major producing basins ▪ Oil 43%/Gas 57% Midstream $224 71% 10% ▪ Long - lived infrastructure that store and transport essential commodity products Energy Services $200 66% 61% ▪ Geographically diversified across the major producing basins ▪ Almost all loans are secured Total Loans: $30.5 Energy: ~$0.8 (2.7% of Total Loans) Commercial $22.5 Consumer $7.1 Midstream $0.2 Energy Services $0.2 Exploration & Production $0.4 ▪ $832 million or 2.7% of total loans ▪ Loss coverage of 10.5% ( 1) ▪ ~47% of loans are Criticized ▪ 70% Line Utilization (2) ▪ Non - accruals of ~$140 million – ~70% current ▪ ~90% are Shared National Credits ▪ Less than 5% are Leveraged Loans ▪ Majority of portfolio is secured by: ▪ Traditional reserve - based lending assets ▪ Working capital assets ▪ Long - lived fixed assets ($ Millions)
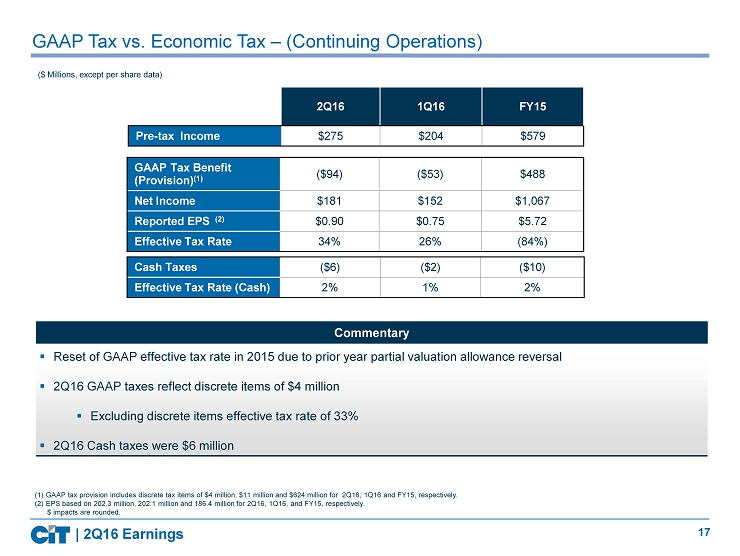
17 GAAP Tax vs. Economic Tax – (Continuing Operations ) 2Q16 1Q16 FY15 Pre - tax Income $275 $204 $579 (1) GAAP tax provision includes discrete tax items of $4 million, $11 million and $624 million for 2Q16, 1Q16 and FY15, respectively. (2) EPS based on 202.3 million, 202.1 million and 186.4 million for 2Q16, 1Q16, and FY15, respectively. $ impacts are rounded. ($ Millions, except per share data) GAAP Tax Benefit (Provision) (1) ($94) ($53) $488 Net Income $181 $152 $1,067 Reported EPS (2) $0.90 $0.75 $5.72 Effective Tax Rate 34% 26% (84%) Cash Taxes ($6) ($2) ($10) Effective Tax Rate (Cash) 2% 1% 2% ▪ Reset of GAAP effective tax rate in 2015 due to prior year partial valuation allowance reversal ▪ 2 Q16 GAAP taxes reflect discrete items of $4 million ▪ Excluding discrete items effective tax rate of 33% ▪ 2 Q16 C ash taxes were $6 million Commentary | 2Q16 Earnings
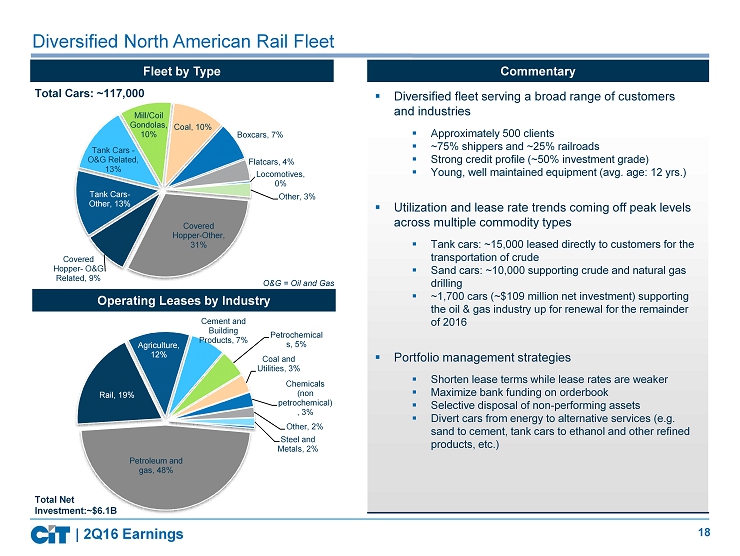
18 Petroleum and gas, 48% Rail, 19% Agriculture, 12% Cement and Building Products, 7% Petrochemical s, 5% Coal and Utilities, 3% Chemicals (non petrochemical) , 3% Other, 2% Steel and Metals, 2% Covered Hopper - Other, 31% Covered Hopper - O&G Related, 9% Tank Cars - Other, 13% Tank Cars - O&G Related, 13% Mill/Coil Gondolas, 10% Coal, 10% Boxcars, 7% Flatcars, 4% Locomotives, 0% Other, 3% Total Cars: ~117,000 Diversified North American Rail Fleet Operating Leases by Industry | 2Q16 Earnings Fleet by Type ▪ Diversified fleet serving a broad range of customers and industries ▪ Approximately 500 clients ▪ ~75% shippers and ~25% railroads ▪ Strong credit profile (~50% investment grade) ▪ Young, well maintained equipment ( avg. age: 12 yrs.) ▪ Utilization and lease rate trends coming off peak levels across multiple commodity types ▪ Tank cars: ~15,000 leased directly to customers for the transportation of crude ▪ Sand c ars: ~10,000 supporting crude and natural gas drilling ▪ ~1,700 cars (~$109 million net investment) supporting the oil & gas industry up for renewal for the remainder of 2016 ▪ Portfolio management strategies ▪ Shorten lease terms while lease rates are weaker ▪ Maximize bank funding on orderbook ▪ Selective disposal of non - performing assets ▪ Divert cars from energy to alternative services (e.g. sand to cement, tank cars to ethanol and other refined products, etc.) Total Net Investment:~$6.1B Commentary O&G = Oil and Gas

19 Financial Freedom | 2Q16 Earnings Financial Freedom is a reverse mortgage servicing operation that was part of the OneWest Bank acquisition in 2015. Financial Freedom services Federal Housing Administration (FHA) insured Home Equity Conversion Mortgages (HECM) on behalf of third party investors for which it receives a servicing fee. When a loan has a maturity event 1 , the steps required to be taken in the foreclosure process and the timelines within which they must be completed, are mandated by the Department of Housing and Urban Development (HUD). As long as the servicer satisfies the requirements in the mandated timeframes, HUD will reimburse the investor for debenture interest 2 from the onset of a maturity event through the date on which the claim is paid. – If however, the servicer fails to complete a required step on time, the interest will be curtailed, and Financial Freedom will be required to reimburse the investor for the unpaid debenture interest. What is Financial Freedom? (1) Maturity events include, but are not limited to; the borrower passing away, vacating the home, failing to make property t ax or insurance payments, etc. (2) Debenture interest is the interest rate paid on debentures issued with respect to a loan insured by the FHA. F ailure to satisfy the requirements of the HUD guidelines constitutes servicer error. Servicers are responsible for making payment to the investors for any debenture interest that is not payable by HUD as a result of servicer error. Each quarter CIT evaluates the level of servicing errors and records a liability for the amount of debenture interest that it expects to be required to pay the third parties. What is an Interest Curtailment Reserve?

20 Adjusted ROTCE Calculation | 2Q16 Earnings Current quarter capital amounts are preliminary. (1) Before discrete items. Adjusted ROTCE Calculation 2Q16 1Q16 4Q15 3Q15 2Q15 ($ in millions) A Net Income (Continuing Ops) $181 $152 $151 $697 $115 Goodwill Impairment $0 $0 $0 $0 $0 Amortization of Intangibles $6 $6 $7 $5 $1 B Tax Effected Goodwill Impairment and Amortization of Intangibles $4 $4 $6 $4 $1 Effective Tax Rate (for respective quarter) 33% 31% 9% 24% 29% C Valuation Allowance Reversal $0 $0 $4 $647 $0 A + B - CNet Income After Adjustments $185 $156 $153 $54 $116 D Annualized Net Income After Adjustments $741 $625 $613 $215 $463 Average Tangible Common Equity $9,830 $9,714 $9,561 $8,991 $8,200 Less: Average Disallowed DTA $858 $889 $886 $604 $349 E Adjusted Average TCE $8,972 $8,825 $8,675 $8,387 $7,851 D / E Adjusted ROTCE 8.26% 7.08% 7.08% 2.56% 5.89% (1)

21
Serious News for Serious Traders! Try StreetInsider.com Premium Free!
You May Also Be Interested In
- Anzu Partners Promotes Three Business Services Team Members to Principal
- PowerSchool Holdings, Inc. (PWSC) Stockholder Alert: Robbins LLP is Investigating the Officers and Directors of PowerSchool Holdings, Inc. for Investors
- GOODRX HOLDINGS, INC. (NASDAQ: GDRX) INVESTOR ALERT: Bernstein Liebhard LLP Announces that a Securities Class Action Lawsuit Has Been Filed Against GoodRx Holdings, Inc.
Create E-mail Alert Related Categories
SEC FilingsSign up for StreetInsider Free!
Receive full access to all new and archived articles, unlimited portfolio tracking, e-mail alerts, custom newswires and RSS feeds - and more!
