

Form 8-K CHIMERA INVESTMENT CORP For: May 02
 Tweet
Tweet Share
Share
UNITED STATES
SECURITIES
AND EXCHANGE COMMISSION
Washington,
DC 20549
______________
FORM
8-K
CURRENT
REPORT
PURSUANT
TO SECTION 13 OR 15(d) OF THE
SECURITIES
EXCHANGE ACT OF 1934
Date
of Report (Date of earliest event reported):
May
2, 2016
CHIMERA
INVESTMENT CORPORATION
(Exact
name of registrant as specified in its charter)
|
Maryland |
1-33796 |
26-0630461 |
|
(State or Other Jurisdiction of Incorporation) |
(Commission File Number) |
(IRS Employer Identification No.) |
|
520 Madison Avenue, 32nd Fl |
10022 |
|
(Address of principal executive offices) |
(Zip Code) |
Registrant’s telephone number, including area code: (212) 626-2300
No Change
(Former Name or Former Address, if Changed Since
Last Report)
Check the
appropriate box below if the Form 8-K filing is intended to
simultaneously satisfy the filing obligation of the registrant under any
of the following provisions:
⃞ Written communications pursuant to Rule 425 under the Securities Act (17 CFR 230.425)
⃞ Soliciting material pursuant to Rule 14a-12 under the Exchange Act (17 CFR 240.14a-12)
⃞ Pre-commencement communications pursuant to Rule 14d-2(b) under the Exchange Act (17 CFR 240.14d-2(b))
⃞ Pre-commencement communications pursuant to Rule 13e-4(c) under the Exchange Act (17 CFR 240.13e-4(c))
| Item 2.02. | Results of Operations and Financial Condition |
On May 2, 2016, the registrant issued a press release announcing its financial results for the quarter ended March 31, 2016 and declaring second quarter dividend of $0.48 per share. A copy of the press release is furnished as Exhibit 99.1 to this report.
On May 2, 2016, the registrant posted supplemental financial information on the Investor Relations section of its website (www.chimerareit.com). A copy of the supplemental financial information is furnished as Exhibit 99.2 to this report and incorporated herein by reference.
|
Item 9.01 |
Financial Statements and Exhibits |
|
(d) |
Exhibits |
|
99.1 |
Press Release, dated May 2, 2016, issued by Chimera Investment Corporation |
|
99.2 |
Supplemental Financial Information for the quarter ended March 31, 2016. |
SIGNATURES
Pursuant to the requirements of the Securities Exchange Act of 1934, the registrant has duly caused this report to be signed on its behalf by the undersigned hereunto duly authorized.
|
Chimera Investment Corporation |
|||||
|
|
|
By: |
/s/ Rob Colligan |
||
| Name: |
Rob Colligan |
||||
| Title: |
Chief Financial Officer |
||||
|
Date: |
May 2, 2016 |
||||
Exhibit 99.1
CHIMERA INVESTMENT CORPORATION RELEASES 1st QUARTER 2016 EARNINGS
- 1st QUARTER 2016 CORE EARNINGS(1) OF $0.58 PER SHARE AND GAAP EARNINGS OF $0.44 PER SHARE
- ECONOMIC BOOK VALUE(1) OF $14.46 PER SHARE AND GAAP BOOK VALUE OF $15.52 PER SHARE
- BOARD DECLARES SECOND QUARTER 2016 DIVIDEND OF $0.48 PER SHARE; EXPECTS TO MAINTAIN A $0.48 DIVIDEND FOR THE REMAINING TWO QUARTERS OF 2016
NEW YORK--(BUSINESS WIRE)--May 2, 2016--The Board of Directors of Chimera announced the declaration of its second quarter cash dividend of $0.48 per common share. The dividend is payable July 29, 2016, to common stockholders of record on June 30, 2016. The ex-dividend date is June 28, 2016. The Board of Directors also announced that it expects to maintain a quarterly cash dividend of $0.48 per common share for the third and fourth quarters of 2016.
The Company distributes dividends based on its current estimate of taxable earnings per common share, not GAAP earnings. Taxable and GAAP earnings will typically differ due to items such as differences in premium amortization, accretion of discounts, unrealized and realized gains and losses, and credit loss recognition. Portions of the dividend may be ordinary income, capital gains or a return of capital.
(1) Core earnings and economic book value are non-GAAP measures. See additional discussion on page 4.
Other Information
Chimera Investment Corporation is a publicly traded real estate investment trust, or REIT, that is primarily engaged in real estate finance. We were incorporated in Maryland on June 01, 2007 and commenced operations on November 21, 2007. We invest, either directly or indirectly through our subsidiaries, in RMBS, residential mortgage loans, Agency CMBS, commercial mortgage loans, real estate-related securities and various other asset classes. We have elected and believe that we are organized and have operated in a manner that enables us to be taxed as a REIT under the Internal Revenue Code of 1986, as amended, or the Code.
Please visit www.chimerareit.com and click on Investor Relations for additional information about the Company.
| CHIMERA INVESTMENT CORPORATION | |||||||||||
| CONSOLIDATED STATEMENTS OF FINANCIAL CONDITION | |||||||||||
| (dollars in thousands, except share and per share data) | |||||||||||
| (Unaudited) | |||||||||||
| March 31, 2016 | December 31, 2015 | ||||||||||
| Assets: | |||||||||||
| Cash and cash equivalents | $ | 190,453 | $ | 114,062 | |||||||
| Non-Agency RMBS, at fair value | 3,580,250 | 3,675,841 | |||||||||
| Agency MBS, at fair value | 6,661,289 | 6,514,824 | |||||||||
| Securitized loans held for investment, at fair value | 4,613,492 | 4,768,416 | |||||||||
| Accrued interest receivable | 65,053 | 66,247 | |||||||||
| Other assets | 190,855 | 189,796 | |||||||||
| Derivatives, at fair value, net | 5,565 | 15,460 | |||||||||
| Total assets (1) | $ | 15,306,957 | $ | 15,344,646 | |||||||
| Liabilities: | |||||||||||
| Repurchase agreements, MBS ($8.9 billion and $8.8 billion pledged as collateral, respectively) | $ | 7,545,631 | $ | 7,439,339 | |||||||
| Securitized debt, collateralized by Non-Agency RMBS ($2.0 billion and $2.1 billion pledged as collateral, respectively) | 492,107 | 529,415 | |||||||||
| Securitized debt at fair value, collateralized by loans held for investment ($4.6 billion and $4.8 billion pledged as collateral, respectively) | 3,617,294 | 3,720,496 | |||||||||
| Payable for investments purchased | 582,875 | 560,641 | |||||||||
| Accrued interest payable | 45,873 | 37,432 | |||||||||
| Dividends payable | 90,367 | 90,097 | |||||||||
| Accounts payable and other liabilities | 5,594 | 11,404 | |||||||||
| Derivatives, at fair value | 13,581 | 9,634 | |||||||||
| Total liabilities (1) | 12,393,322 | 12,398,458 | |||||||||
|
Commitments and Contingencies |
|||||||||||
| Stockholders' Equity: | |||||||||||
| Preferred Stock: par value $0.01 per share; 100,000,000 shares authorized, 0 shares issued and outstanding, respectively | $ | - | $ | - | |||||||
| Common stock: par value $0.01 per share; 300,000,000 shares authorized, 187,729,765 and 187,711,868 shares issued and outstanding, respectively | 1,877 | 1,877 | |||||||||
| Additional paid-in-capital | 3,366,670 | 3,366,568 | |||||||||
| Accumulated other comprehensive income | 842,265 | 773,791 | |||||||||
| Accumulated deficit | (1,297,177 | ) | (1,196,048 | ) | |||||||
| Total stockholders' equity | $ | 2,913,635 | $ | 2,946,188 | |||||||
| Total liabilities and stockholders' equity | $ | 15,306,957 | $ | 15,344,646 | |||||||
|
(1) The Company's consolidated statements of financial condition include assets of consolidated variable interest entities ("VIEs") that can only be used to settle obligations and liabilities of the VIE for which creditors do not have recourse to the primary beneficiary (Chimera Investment Corp.). As of March 31, 2016 and December 31, 2015, total assets of consolidated VIEs were $6,795,923 and $7,031,278, respectively, and total liabilities of consolidated VIEs were $4,121,346 and $4,262,017, respectively. |
| CHIMERA INVESTMENT CORPORATION | |||||||||||
| CONSOLIDATED STATEMENTS OF OPERATIONS AND COMPREHENSIVE INCOME | |||||||||||
| (dollars in thousands, except share and per share data) | |||||||||||
| (Unaudited) | |||||||||||
| For the Quarter Ended | |||||||||||
| Net Interest Income: | March 31, 2016 | March 31, 2015 | |||||||||
| Interest income (1) | $ | 201,194 | $ | 243,145 | |||||||
| Interest expense (2) | 62,981 | 60,456 | |||||||||
| Net interest income | 138,213 | 182,689 | |||||||||
| Other-than-temporary impairments: | |||||||||||
| Total other-than-temporary impairment losses | (4,423 | ) | (1,052 | ) | |||||||
| Portion of loss recognized in other comprehensive income | (6,255 | ) | (6,763 | ) | |||||||
| Net other-than-temporary credit impairment losses | (10,678 | ) | (7,815 | ) | |||||||
| Other investment gains (losses): | |||||||||||
| Net unrealized gains (losses) on derivatives | (101,110 | ) | 4,055 | ||||||||
| Realized gains (losses) on terminations of interest rate swaps | (458 | ) | (68,579 | ) | |||||||
| Net realized gains (losses) on derivatives | (34,969 | ) | (42,086 | ) | |||||||
| Net gains (losses) on derivatives | (136,537 | ) | (106,610 | ) | |||||||
| Net unrealized gains (losses) on financial instruments at fair value | 16,871 | (10,425 | ) | ||||||||
| Net realized gains (losses) on sales of investments | (2,674 | ) | 29,565 | ||||||||
| Gains (losses) on Extinguishment of Debt | (1,766 | ) | - | ||||||||
| Total other gains (losses) | (124,106 | ) | (87,470 | ) | |||||||
| Other income: | |||||||||||
| Other income | 95,000 | - | |||||||||
| Total other income | 95,000 | - | |||||||||
| Other expenses: | |||||||||||
| Management fees | - | 10,326 | |||||||||
| Expense recoveries from Manager | - | (1,113 | ) | ||||||||
| Net management fees | - | 9,213 | |||||||||
| Compensation and benefits | 5,222 | 471 | |||||||||
| General and administrative expenses | 4,503 | 4,290 | |||||||||
| Servicing Fees of consolidated VIEs | 5,577 | 6,388 | |||||||||
| Total other expenses | 15,302 | 20,362 | |||||||||
| Income (loss) before income taxes | 83,127 | 67,042 | |||||||||
| Income taxes | 29 | 1 | |||||||||
| Net income (loss) | $ | 83,098 | $ | 67,041 | |||||||
| Net income (loss) per share available to common shareholders: | |||||||||||
| Basic | 0.44 | $ | 0.33 | ||||||||
| Diluted | $ | 0.44 | $ | 0.33 | |||||||
| Weighted average number of common shares outstanding: | |||||||||||
| Basic | 187,723,472 | 205,527,476 | |||||||||
| Diluted | 187,840,182 | 205,566,956 | |||||||||
| Comprehensive income (loss): | |||||||||||
| Net income (loss) | $ | 83,098 | $ | 67,041 | |||||||
| Other comprehensive income: | |||||||||||
| Unrealized gains (losses) on available-for-sale securities, net | 59,408 | (19,912 | ) | ||||||||
|
Reclassification adjustment for net losses included in net |
10,678 | 7,815 | |||||||||
|
Reclassification adjustment for net realized losses (gains)
included |
(1,612 | ) | (29,076 | ) | |||||||
| Other comprehensive income (loss) | 68,474 | (41,173 | ) | ||||||||
| Comprehensive income (loss) | $ | 151,572 | $ | 25,868 | |||||||
|
(1) Includes interest income of consolidated VIEs of $131,980 and $150,618 for the quarters ended March 31, 2016 and 2015 respectively. |
|
(2) Includes interest expense of consolidated VIEs of $39,250 and $46,753 for the quarters ended March 31, 2016 and 2015 respectively. |
Core earnings
Core earnings is a non-GAAP measure and is defined as GAAP net income excluding unrealized gains on the aggregate portfolio, impairment losses, realized gains on sales of investments, realized gains or losses on futures, realized gains or losses on swap terminations, gain on deconsolidation, extinguishment of debt and certain other non-recurring gains or losses. As defined, core earnings include interest income and expense as well as realized losses on interest rate swaps used to hedge interest rate risk. Core earnings are provided for the purpose of comparability to other peer issuers, but have important limitations. Core earnings as described above helps evaluate our financial performance without the impact of certain transactions and is of limited usefulness as an analytical tool. Therefore, core earnings should not be viewed in isolation and is not a substitute for net income or net income per basic share computed in accordance with GAAP.
The following table provides GAAP measures of net income and net income per basic share available to common stockholders for the periods presented and details with respect to reconciling the line items to core earnings and related per average basic common share amounts:
| For the Quarters Ended | ||||||||||||||||||||||||||
| March 31, 2016 | December 31, 2015 | September 30, 2015 | June 30, 2015 | March 31, 2015 | ||||||||||||||||||||||
| (dollars in thousands, except per share data) | ||||||||||||||||||||||||||
| GAAP Net income | $ | 83,098 | $ | 115,380 | $ | (48,259 | ) | $ | 116,187 | $ | 67,041 | |||||||||||||||
| Adjustments: | ||||||||||||||||||||||||||
| Net other-than-temporary credit impairment losses | 10,678 | 14,696 | 17,832 | 27,101 | 7,815 | |||||||||||||||||||||
| Net unrealized (gains) losses on derivatives | 101,110 | (46,842 | ) | 71,540 | (88,028 | ) | (4,055 | ) | ||||||||||||||||||
| Net unrealized (gains) losses on financial instruments at fair value | (16,871 | ) | 69,793 | 40,955 | 37,260 | 10,425 | ||||||||||||||||||||
| Net realized (gains) losses on sales of investments | 2,674 | (34,285 | ) | (3,539 | ) | (9,685 | ) | (29,565 | ) | |||||||||||||||||
| (Gains) losses on extinguishment of debt | 1,766 | (8,906 | ) | 19,915 | (5,079 | ) | - | |||||||||||||||||||
| Realized (gains) losses on terminations of interest rate swaps | 458 | (754 | ) | - | 31,124 | 68,579 | ||||||||||||||||||||
| Net realized (gains) losses on derivatives | 21,609 | (9,018 | ) | 9,309 | 7,778 | 27,454 | ||||||||||||||||||||
| Total other (gains) losses | - | 256 | - | - | - | |||||||||||||||||||||
| Other income | (95,000 | ) | - | - | - | - | ||||||||||||||||||||
| Core Earnings | $ | 109,522 | $ | 100,320 | $ | 107,753 | $ | 116,658 | $ | 147,694 | ||||||||||||||||
| GAAP net income per basic common share | $ | 0.44 | $ | 0.61 | $ | (0.24 | ) | $ | 0.57 | $ | 0.33 | |||||||||||||||
| Core earnings per basic common share | $ | 0.58 | $ | 0.53 | $ | 0.54 | $ | 0.57 | $ | 0.72 | ||||||||||||||||
The following tables provide a summary of the Company’s RMBS portfolio at March 31, 2016 and December 31, 2015.
|
|
March 31, 2016 |
|||||||||||||||
|
Principal or |
Weighted |
Weighted |
Weighted |
Weighted |
||||||||||||
| Non-Agency RMBS | ||||||||||||||||
| Senior | $ 3,572,750 | $ 57.57 | $ 76.87 | 3.9% | 14.3% | |||||||||||
| Senior, interest-only | 5,343,042 | 5.04 | 4.51 | 1.7% | 12.5% | |||||||||||
| Subordinated | 735,699 | 69.18 | 79.24 | 3.2% | 10.1% | |||||||||||
| Subordinated, interest-only | 279,620 | 5.34 | 3.52 | 1.2% | 12.5% | |||||||||||
| Agency MBS | ||||||||||||||||
| Residential pass-through | 5,063,355 | 104.91 | 105.79 | 3.7% | 2.7% | |||||||||||
| Commercial pass-through | 1,072,937 | 102.31 | 104.90 | 3.5% | 2.9% | |||||||||||
| Interest-only | 4,011,154 | 4.63 | 4.46 | 0.9% | 3.7% | |||||||||||
| (1) Bond Equivalent Yield at period end. | ||||||||||||||||
| December 31, 2015 | ||||||||||||||||
|
Principal or |
Weighted |
Weighted |
Weighted |
Weighted |
||||||||||||
| Non-Agency RMBS | ||||||||||||||||
| Senior | $ 3,651,869 | $ 57.47 | $ 77.39 | 3.8% | 13.7% | |||||||||||
| Senior, interest-only | 5,426,029 | 4.95 | 4.32 | 1.7% | 12.9% | |||||||||||
| Subordinated | 762,466 | 69.25 | 79.26 | 3.2% | 8.8% | |||||||||||
| Subordinated, interest-only | 284,931 | 5.34 | 3.95 | 1.2% | 10.9% | |||||||||||
| Agency MBS | ||||||||||||||||
| Residential pass-through | 5,045,418 | 105.07 | 104.41 | 3.7% | 2.8% | |||||||||||
| Commercial pass-through | 952,091 | 102.27 | 102.28 | 3.4% | 2.9% | |||||||||||
| Interest-only | 6,722,472 | 4.17 | 4.06 | 0.8% | 3.4% | |||||||||||
| (1) Bond Equivalent Yield at period end. | ||||||||||||||||
At March 31, 2016 and December 31, 2015, the repurchase agreements collateralized by RMBS had the following remaining maturities.
| March 31, 2016 | December 31, 2015 | |||||||||
| (dollars in thousands) | ||||||||||
| Overnight | $ | - | $ | - | ||||||
| 1 to 29 days | 2,984,870 | 3,312,902 | ||||||||
| 30 to 59 days | 2,411,954 | 2,501,513 | ||||||||
| 60 to 89 days | 277,324 | 246,970 | ||||||||
| 90 to 119 days | 777,051 | 430,026 | ||||||||
| Greater than or equal to 120 days | 1,094,432 | 947,928 | ||||||||
| Total | $ | 7,545,631 | $ | 7,439,339 | ||||||
The following table summarizes certain characteristics of our portfolio at March 31, 2016 and December 31, 2015.
| For the quarter ended, | For the year ended, | |||||||||||||
| March 31, 2016 | December 31, 2015 | |||||||||||||
| Interest earning assets at period-end (1) | $ | 14,855,031 | $ | 14,959,081 | ||||||||||
| Interest bearing liabilities at period-end | $ | 11,655,032 | $ | 11,689,250 | ||||||||||
| GAAP Leverage at period-end | 4.0:1 | 4.0:1 | ||||||||||||
| GAAP Leverage at period-end (recourse) | 2.6:1 | 2.5:1 | ||||||||||||
| Economic Leverage at period-end (recourse) | 2.8:1 | 2.7:1 | ||||||||||||
| Portfolio Composition, at amortized cost | ||||||||||||||
| Non-Agency RMBS | 10.3 | % | 10.4 | % | ||||||||||
| Senior | 4.7 | % | 4.7 | % | ||||||||||
| Senior, interest only | 1.9 | % | 1.9 | % | ||||||||||
| Subordinated | 3.6 | % | 3.7 | % | ||||||||||
| Subordinated, interest only | 0.1 | % | 0.1 | % | ||||||||||
| RMBS transferred to consolidated VIEs | 9.9 | % | 10.1 | % | ||||||||||
| Agency MBS | 46.9 | % | 46.0 | % | ||||||||||
| Residential | 37.8 | % | 37.2 | % | ||||||||||
| Commercial | 7.8 | % | 6.8 | % | ||||||||||
| Interest-only | 1.3 | % | 2.0 | % | ||||||||||
| Securitized loans held for investment | 32.8 | % | 33.5 | % | ||||||||||
| Fixed-rate percentage of portfolio | 84.9 | % | 84.7 | % | ||||||||||
| Adjustable-rate percentage of portfolio | 15.1 | % | 15.3 | % | ||||||||||
| Annualized yield on average interest earning assets for the periods ended | 5.9 | % | 6.0 | % | ||||||||||
| Annualized cost of funds on average borrowed funds for the periods ended (2) | 2.5 | % | 2.5 | % | ||||||||||
| (1) Excludes cash and cash equivalents. | ||||||||||||||
| (2) Includes the effect of realized losses on interest rate swaps. | ||||||||||||||
Economic Book Value
The table below presents our estimated economic book value. We calculate and disclose this non-GAAP measurement because we believe it represents an estimate of the fair value of the assets we own or are able to dispose of, pledge, or otherwise monetize. The estimated economic book value should not be viewed in isolation and is not a substitute for book value computed in accordance with GAAP.
| March 31, 2016 | ||||||||
| (dollars in thousands, except per share data) | ||||||||
| GAAP Book Value | $ | 2,913,635 | ||||||
| GAAP Book Value per Share | $ | 15.52 | ||||||
|
Economic Adjustments: |
||||||||
| Assets of Consolidated VIEs | (6,670,061 | ) | ||||||
| Non-Recourse Liabilities of Consolidated VIEs | 4,109,401 | |||||||
| Interests in VIEs eliminated in consolidation | 2,361,817 | |||||||
| Total Adjustments - Net | (198,843 | ) | ||||||
| Total Adjustments - Net (per share) | (1.06 | ) | ||||||
| Economic Book Value | $ | 2,714,792 | ||||||
| Economic Book Value per Share | $ | 14.46 | ||||||
| December 31, 2015 | ||||||||
| (dollars in thousands, except per share data) | ||||||||
| GAAP Book Value | $ | 2,946,188 | ||||||
| GAAP Book Value per Share | $ | 15.70 | ||||||
|
Economic Adjustments: |
||||||||
| Assets of Consolidated VIEs | (6,908,910 | ) | ||||||
| Non-Recourse Liabilities of Consolidated VIEs | 4,249,911 | |||||||
| Interests in VIEs eliminated in consolidation | 2,462,713 | |||||||
| Total Adjustments - Net | (196,286 | ) | ||||||
| Total Adjustments - Net (per share) | (1.05 | ) | ||||||
| Economic Book Value | $ | 2,749,902 | ||||||
| Economic Book Value per Share | $ | 14.65 | ||||||
The table below shows our average earning assets held, interest earned on assets, yield on average interest earning assets, average debt balance, economic interest expense, economic average cost of funds, economic net interest income, and net interest rate spread for the periods presented.
| For the Quarter Ended | ||||||||||||||||||||||||||
| March 31, 2016 | March 31, 2015 | |||||||||||||||||||||||||
| (dollars in thousands) | (dollars in thousands) | |||||||||||||||||||||||||
|
Average |
Interest |
Average |
Average |
Interest |
Average |
|||||||||||||||||||||
| Assets: | ||||||||||||||||||||||||||
| Interest-earning assets (1): | ||||||||||||||||||||||||||
| Agency MBS | $ | 6,003,520 | $ | 37,659 | 2.5 | % | $ | 7,491,398 | $ | 67,786 | 3.6 | % | ||||||||||||||
| Non-Agency RMBS | 1,461,811 | 31,106 | 8.5 | % | 999,067 | 24,424 | 9.8 | % | ||||||||||||||||||
|
Non-Agency RMBS transferred to consolidated VIEs |
1,418,442 | 64,232 | 18.1 | % | 1,639,964 | 68,183 | 16.6 | % | ||||||||||||||||||
|
Jumbo Prime securitized residential mortgage loans held for investment |
442,629 | 3,833 | 3.5 | % | 610,836 | 8,003 | 5.2 | % | ||||||||||||||||||
| Seasoned sub-prime securitized residential mortgage loans held for investment | 4,244,226 | 63,916 | 6.0 | % | 4,499,936 | 74,431 | 6.6 | % | ||||||||||||||||||
| Total | $ | 13,570,628 | $ | 200,746 | 5.9 | % | $ | 15,241,201 | $ | 242,827 | 6.4 | % | ||||||||||||||
| Liabilities and stockholders' equity: | ||||||||||||||||||||||||||
| Interest-bearing liabilities: | ||||||||||||||||||||||||||
| Agency repurchase agreements (2) | $ | 5,419,402 | $ | 21,279 | 1.6 | % | $ | 7,198,680 | $ | 22,662 | 1.3 | % | ||||||||||||||
| Non-Agency repurchase agreements | 2,077,523 | 13,671 | 2.6 | % | 1,116,675 | 6,209 | 2.2 | % | ||||||||||||||||||
|
Securitized debt, collateralized by Non-Agency RMBS |
510,761 | 3,996 | 3.1 | % | 688,260 | 7,947 | 4.6 | % | ||||||||||||||||||
|
Securitized debt, collateralized by jumbo prime residential mortgage loans |
341,776 | 2,561 | 3.0 | % | 499,075 | 5,341 | 4.3 | % | ||||||||||||||||||
| Securitized debt, collateralized by seasoned sub-prime residential mortgage loans | 3,329,390 | 32,694 | 3.9 | % | 3,808,607 | 33,466 | 3.5 | % | ||||||||||||||||||
| Total | $ | 11,678,852 | $ | 74,201 | 2.5 | % | $ | 13,311,297 | $ | 75,625 | 2.3 | % | ||||||||||||||
| Economic net interest income/net interest rate spread | $ | 126,545 | 3.4 | % | $ | 167,202 | 4.0 | % | ||||||||||||||||||
| Net interest-earning assets/net interest margin | $ | 1,891,776 | 3.6 | % | $ | 1,929,904 | 4.4 | % | ||||||||||||||||||
| Ratio of interest-earning assets to interest bearing liabilities | 1.16 | 1.14 | ||||||||||||||||||||||||
| (1) Interest-earning assets at amortized cost | ||||||||||||||||||||||||||
| (2) Interest includes periodic cash settlements on swaps | ||||||||||||||||||||||||||
The table below shows our Net Income, Economic Net Interest Income and Core Earnings, each as a percentage of average equity. Return on average equity is defined as our GAAP net income (loss) as a percentage of average equity. Average equity is defined as the average of Company’s beginning and ending equity balance for the period reported. Economic Net Interest Income and Core Earnings are non-GAAP measures as defined in previous sections.
|
Return on Average Equity |
Economic Net Interest |
Core Earnings/Average |
||||||||
| (Ratios have been annualized) | ||||||||||
| For The Quarter Ended March 31, 2016 | 11.34% | 17.28% | 14.95% | |||||||
| For The Quarter Ended December 31, 2015 | 15.22% | 16.52% | 13.23% | |||||||
| For The Quarter Ended September 30, 2015 | (5.89%) | 16.43% | 13.14% | |||||||
| For The Quarter Ended June 30, 2015 | 13.35% | 16.10% | 13.40% | |||||||
| For The Quarter Ended March 31, 2015 | 7.52% | 18.76% | 16.57% | |||||||
| For The Year Ended December 31, 2015 | 7.52% | 17.12% | 14.20% | |||||||
| For The Year Ended December 31, 2014 | 16.99% | 14.06% | 12.70% | |||||||
| * Includes effect of realized losses on interest rate swaps. | ||||||||||
The table below presents changes in Accretable Yield, or the excess of the security’s cash flows expected to be collected over the Company’s investment, solely as it pertains to the Company’s Non-Agency RMBS portfolio accounted for according to the provisions of ASC 310-30.
| For the Quarter Ended | |||||||||||
| March 31, 2016 | March 31, 2015 | ||||||||||
| (dollars in thousands) | |||||||||||
| Balance at beginning of period | $ | 1,742,744 | $ | 1,534,497 | |||||||
| Purchases | 20,183 | 84,753 | |||||||||
| Accretion | (36,353 | ) | (69,705 | ) | |||||||
| Reclassification (to) from non-accretable difference | (33 | ) | 7,182 | ||||||||
| Sales and deconsolidation | - | (19,865 | ) | ||||||||
| Balance at end of period | $ | 1,726,541 | $ | 1,536,862 | |||||||
Disclaimer
This presentation includes “forward-looking statements” within the meaning of the safe harbor provisions of the United States Private Securities Litigation Reform Act of 1995. Actual results may differ from expectations, estimates and projections and, consequently, readers should not rely on these forward-looking statements as predictions of future events. Words such as “expect,” “target,” “assume,” “estimate,” “project,” “budget,” “forecast,” “anticipate,” “intend,” “plan,” “may,” “will,” “could,” “should,” “believe,” “predicts,” “potential,” “continue,” and similar expressions are intended to identify such forward-looking statements. These forward-looking statements involve significant risks and uncertainties that could cause actual results to differ materially from expected results, including, among other things, those described in our Annual Report on Form 10-K for the year ended December 31, 2015, and any subsequent Quarterly Reports on Form 10-Q, under the caption “Risk Factors.” Factors that could cause actual results to differ include, but are not limited to: the state of credit markets and general economic conditions; changes in interest rates and the market value of our assets; the rates of default or decreased recovery on the mortgages underlying our target assets; the occurrence, extent and timing of credit losses within our portfolio; the credit risk in our underlying assets; declines in home prices; our ability to establish, adjust and maintain appropriate hedges for the risks in our portfolio; the availability and cost of our target assets; our ability to borrow to finance our assets and the associated costs; changes in the competitive landscape within our industry; our ability to manage various operational risks and costs associated with our business; interruptions in or impairments to our communications and information technology systems; our ability to acquire residential mortgage loans and successfully securitize the residential mortgage loans we acquire; our ability to oversee our third party sub-servicers; the impact of any deficiencies in the servicing or foreclosure practices of third parties and related delays in the foreclosure process; our exposure to legal and regulatory claims; legislative and regulatory actions affecting our business; the impact of new or modified government mortgage refinance or principal reduction programs; our ability to maintain our REIT qualification; and limitations imposed on our business due to our REIT status and our exempt status under the Investment Company Act of 1940.
Readers are cautioned not to place undue reliance upon any forward-looking statements, which speak only as of the date made. Chimera does not undertake or accept any obligation to release publicly any updates or revisions to any forward-looking statement to reflect any change in its expectations or any change in events, conditions or circumstances on which any such statement is based. Additional information concerning these and other risk factors is contained in Chimera’s most recent filings with the Securities and Exchange Commission (SEC). All subsequent written and oral forward-looking statements concerning Chimera or matters attributable to Chimera or any person acting on its behalf are expressly qualified in their entirety by the cautionary statements above.
Readers are advised that the financial information in this presentation is based on company data available at the time of this presentation and, in certain circumstances, may not have been audited by the company’s independent auditors.
CONTACT:
Investor Relations
866-315-9930
www.chimerareit.com
Exhibit 99.2

Q1 2016 Supplemental Financial Information May 3, 2016
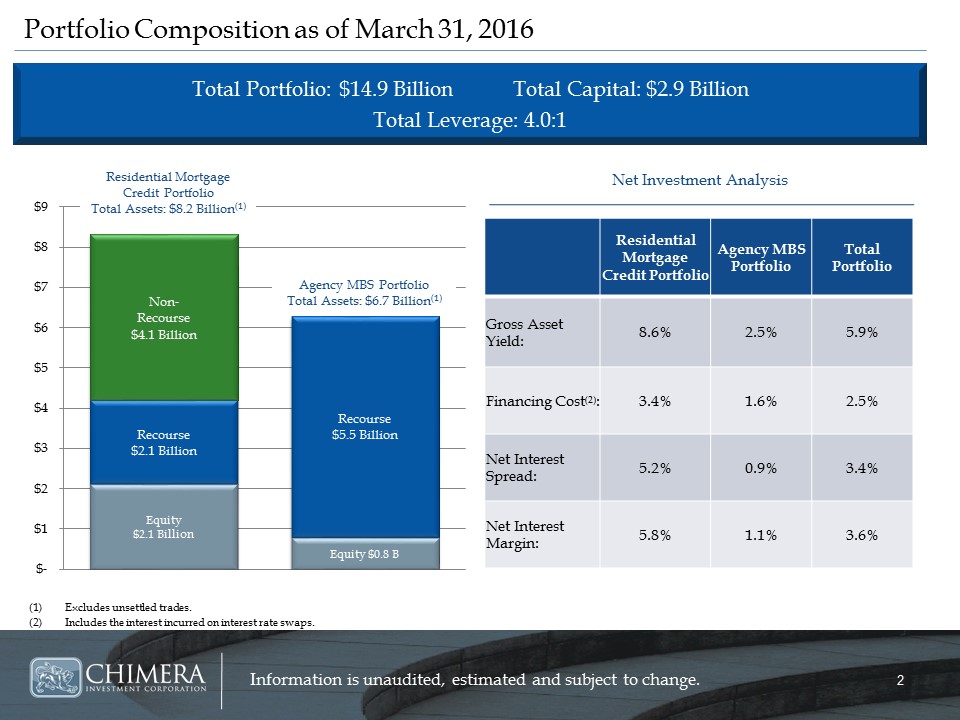
Portfolio Composition as of March 31, 2016 Residential Mortgage Credit Portfolio Agency MBS Portfolio Total Portfolio Gross Asset Yield: 8.6% 2.5% 5.9% Financing Cost(2): 3.4% 1.6% 2.5% Net Interest Spread: 5.2% 0.9% 3.4% Net Interest Margin: 5.8% 1.1% 3.6% Excludes unsettled trades.Includes the interest incurred on interest rate swaps. Total Portfolio: $14.9 Billion Total Capital: $2.9 BillionTotal Leverage: 4.0:1 Net Investment Analysis Residential Mortgage Credit PortfolioTotal Assets: $8.2 Billion(1) Agency MBS PortfolioTotal Assets: $6.7 Billion(1)
Portfolio Composition as of March 31, 2016 Residential Mortgage Credit Portfolio Agency MBS Portfolio Total Portfolio Gross Asset Yield: 8.6% 2.5% 5.9% Financing Cost(2): 3.4% 1.6% 2.5% Net Interest Spread: 5.2% 0.9% 3.4% Net Interest Margin: 5.8% 1.1% 3.6% Excludes unsettled trades.Includes the interest incurred on interest rate swaps. Total Portfolio: $14.9 Billion Total Capital: $2.9 BillionTotal Leverage: 4.0:1 Net Investment Analysis Residential Mortgage Credit PortfolioTotal Assets: $8.2 Billion(1) Agency MBS PortfolioTotal Assets: $6.7 Billion(1)
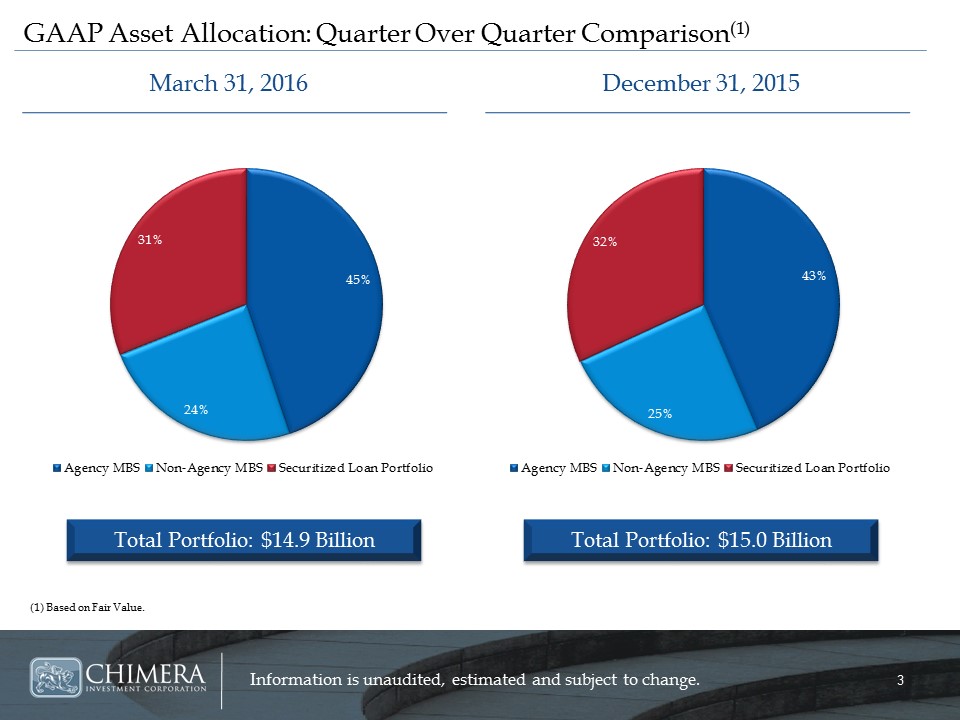
March 31, 2016 December 31, 2015 GAAP Asset Allocation: Quarter Over Quarter Comparison(1) (1) Based on Fair Value.
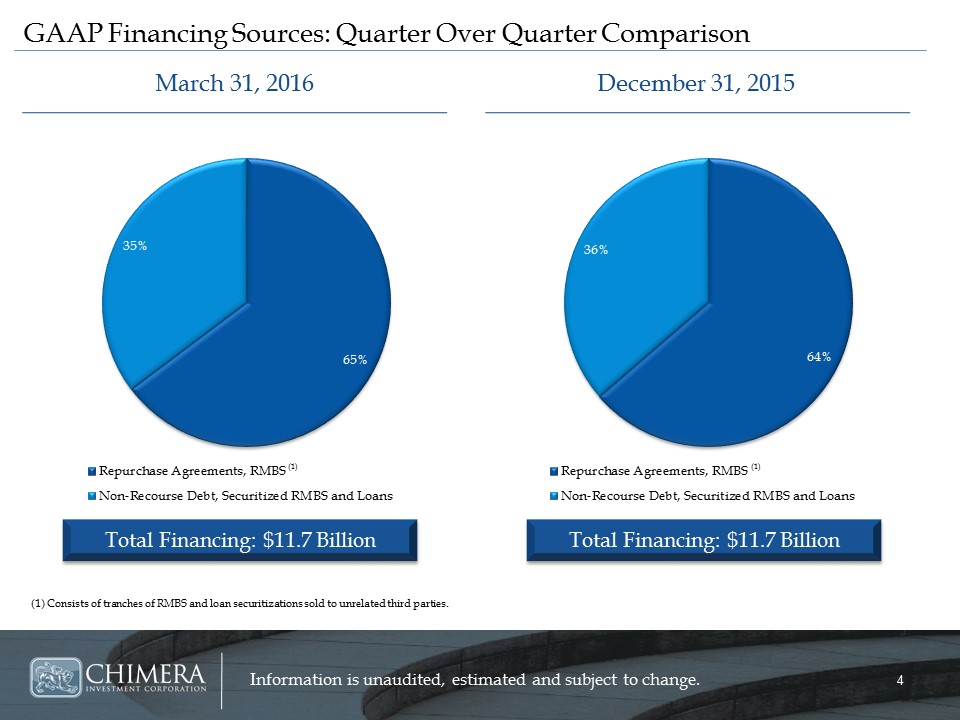
(1) Consists of tranches of RMBS and loan securitizations sold to unrelated third parties. March 31, 2016 December 31, 2015 GAAP Financing Sources: Quarter Over Quarter Comparison Total Financing: $11.7 Billion Total Financing: $11.7 Billion (1) (1) 3.5% 0.9%
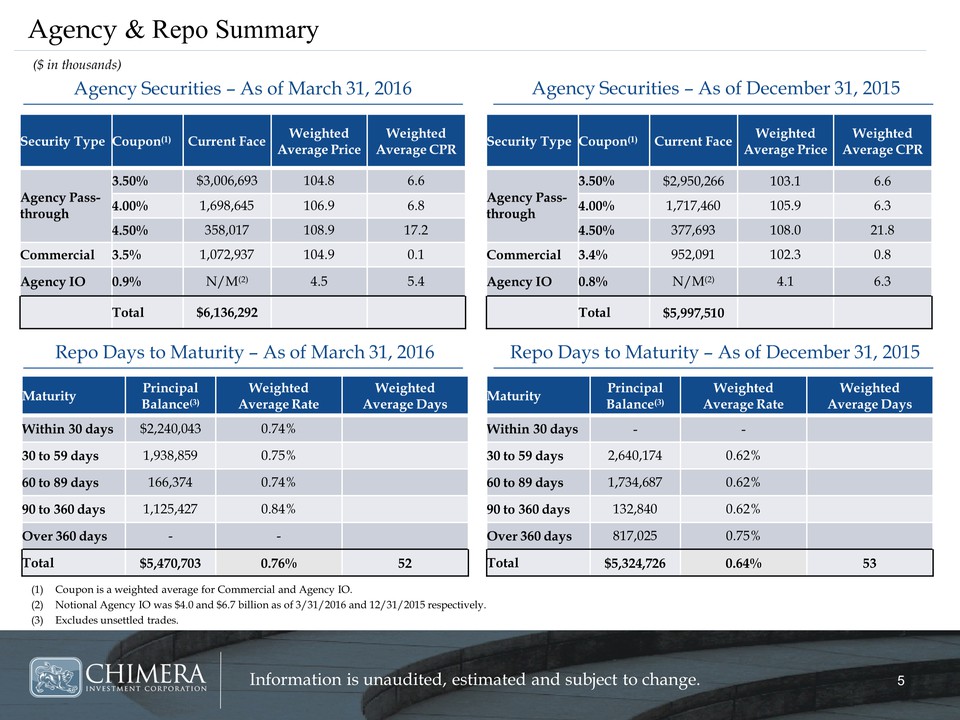
Agency & Repo Summary Agency Securities – As of March 31, 2016 Repo Days to Maturity – As of March 31, 2016 Agency Securities – As of December 31, 2015 Repo Days to Maturity – As of December 31, 2015 ($ in thousands) Maturity Principal Balance(3) Weighted Average Rate Weighted Average Days Within 30 days - - 30 to 59 days 2,640,174 0.62% 60 to 89 days 1,734,687 0.62% 90 to 360 days 132,840 0.62% Over 360 days 817,025 0.75% Total $5,324,726 0.64% 53 Coupon is a weighted average for Commercial and Agency IO.Notional Agency IO was $4.0 and $6.7 billion as of 3/31/2016 and 12/31/2015 respectively. Excludes unsettled trades. Security Type Coupon(1) Current Face Weighted Average Price Weighted Average CPR Agency Pass-through 3.50% $3,006,693 104.8 6.6 4.00% 1,698,645 106.9 6.8 4.50% 358,017 108.9 17.2 Commercial 3.4% 1,072,937 104.9 0.1 Agency IO 0.8% N/M(2) 4.5 5.4 Total $6,136,292 Maturity Principal Balance(3) Weighted Average Rate Weighted Average Days Within 30 days $2,240,043 0.74% 30 to 59 days 1,938,859 0.75% 60 to 89 days 166,374 0.74% 90 to 360 days 1,125,427 0.84% Over 360 days - - Total $5,470,703 0.76% 52 Security Type Coupon(1) Current Face Weighted Average Price Weighted Average CPR Agency Pass-through 3.50% $2,950,266 103.1 6.6 4.00% 1,717,460 105.9 6.3 4.50% 377,693 108.0 21.8 Commercial 3.4% 952,091 102.3 0.8 Agency IO 0.8% N/M(2) 4.1 6.3 Total $5,997,510
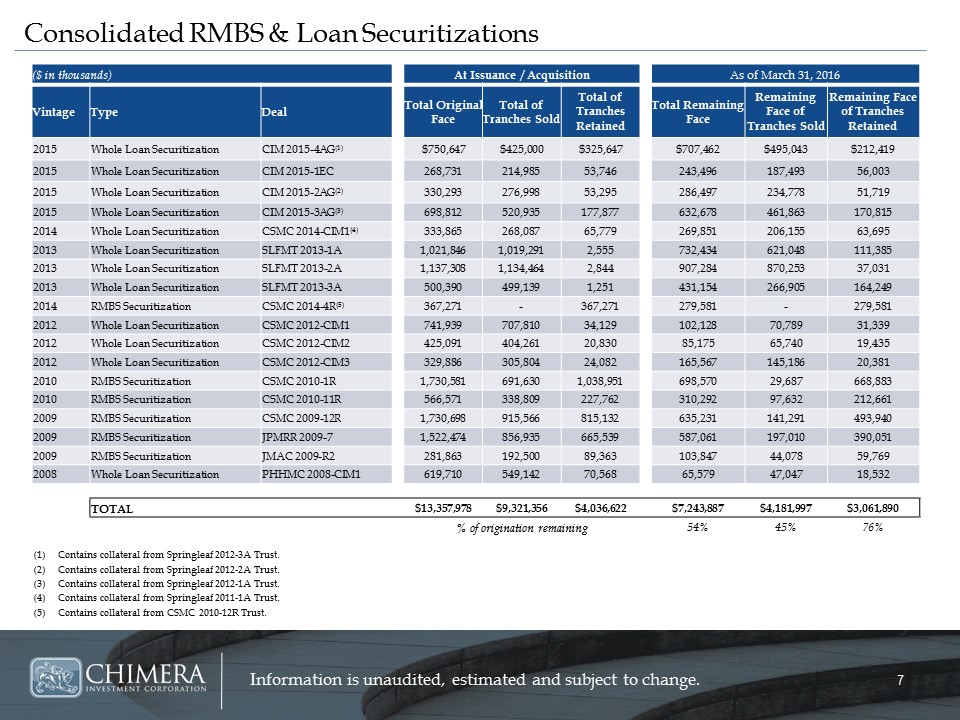
Consolidated RMBS & Loan Securitizations ($ in thousands) At Issuance / Acquisition As of March 31, 2016 Vintage Type Deal Total Original Face Total of Tranches Sold Total of Tranches Retained Total Remaining Face Remaining Face of Tranches Sold Remaining Face of Tranches Retained 2015 Whole Loan Securitization CIM 2015-4AG(1) $750,647 $425,000 $325,647 $707,462 $495,043 $212,419 2015 Whole Loan Securitization CIM 2015-1EC 268,731 214,985 53,746 243,496 187,493 56,003 2015 Whole Loan Securitization CIM 2015-2AG(2) 330,293 276,998 53,295 286,497 234,778 51,719 2015 Whole Loan Securitization CIM 2015-3AG(3) 698,812 520,935 177,877 632,678 461,863 170,815 2014 Whole Loan Securitization CSMC 2014-CIM1(4) 333,865 268,087 65,779 269,851 206,155 63,695 2013 Whole Loan Securitization SLFMT 2013-1A 1,021,846 1,019,291 2,555 732,434 621,048 111,385 2013 Whole Loan Securitization SLFMT 2013-2A 1,137,308 1,134,464 2,844 907,284 870,253 37,031 2013 Whole Loan Securitization SLFMT 2013-3A 500,390 499,139 1,251 431,154 266,905 164,249 2014 RMBS Securitization CSMC 2014-4R(5) 367,271 - 367,271 279,581 - 279,581 2012 Whole Loan Securitization CSMC 2012-CIM1 741,939 707,810 34,129 102,128 70,789 31,339 2012 Whole Loan Securitization CSMC 2012-CIM2 425,091 404,261 20,830 85,175 65,740 19,435 2012 Whole Loan Securitization CSMC 2012-CIM3 329,886 305,804 24,082 165,567 145,186 20,381 2010 RMBS Securitization CSMC 2010-1R 1,730,581 691,630 1,038,951 698,570 29,687 668,883 2010 RMBS Securitization CSMC 2010-11R 566,571 338,809 227,762 310,292 97,632 212,661 2009 RMBS Securitization CSMC 2009-12R 1,730,698 915,566 815,132 635,231 141,291 493,940 2009 RMBS Securitization JPMRR 2009-7 1,522,474 856,935 665,539 587,061 197,010 390,051 2009 RMBS Securitization JMAC 2009-R2 281,863 192,500 89,363 103,847 44,078 59,769 2008 Whole Loan Securitization PHHMC 2008-CIM1 619,710 549,142 70,568 65,579 47,047 18,532 TOTAL $13,357,978 $9,321,356 $4,036,622 $7,243,887 $4,181,997 $3,061,890 % of origination remaining 54% 45% 76% Contains collateral from Springleaf 2012-3A Trust.Contains collateral from Springleaf 2012-2A Trust.Contains collateral from Springleaf 2012-1A Trust. Contains collateral from Springleaf 2011-1A Trust.Contains collateral from CSMC 2010-12R Trust.

Serious News for Serious Traders! Try StreetInsider.com Premium Free!
You May Also Be Interested In
- Chesapeake Financial Shares Reports First Quarter Earnings and Declares Dividend
- NowVertical Group Announces Amendment to Acrotrend Obligations
- Albertsons Companies' Vons Store Partners With Local Southern California Artist for Earth Month Mural
Create E-mail Alert Related Categories
SEC FilingsSign up for StreetInsider Free!
Receive full access to all new and archived articles, unlimited portfolio tracking, e-mail alerts, custom newswires and RSS feeds - and more!
