Form 8-K CBRE GROUP, INC. For: May 18
UNITED STATES
SECURITIES AND EXCHANGE COMMISSION
Washington, D.C. 20549
FORM 8-K
CURRENT REPORT
Pursuant to Section 13 OR 15(d) of the
Securities Exchange Act of 1934
Date of Report (Date of earliest event reported): May 18, 2016
CBRE GROUP, INC.
|
|
|
|
|
|
|
|
(Exact name of registrant as specified in its charter)
|
Delaware |
|
001-32205 |
|
94-3391143 |
| |
|
|
|
|
|
|
| |
|
|
|
|
|
|
| |
|
(State or other |
|
(Commission File Number) |
|
(IRS Employer | ||
|
jurisdiction of |
|
|
|
Identification No.) | ||
|
incorporation) |
|
|
|
| ||
|
400 South Hope Street, 25th Floor, Los Angeles, California |
|
90071 | ||
|
|
|
| ||
|
|
|
| ||
|
(Address of Principal Executive Offices) |
|
(Zip Code) | ||
(213) 613-3333
|
|
|
|
|
|
|
|
Registrant’s Telephone Number, Including Area Code
Not Applicable
|
|
|
|
|
|
|
|
(Former Name or Former Address, if Changed Since Last Report)
Check the appropriate box below if the Form 8-K filing is intended to simultaneously satisfy the filing obligation of the registrant under any of the following provisions:
[_] Written communications pursuant to Rule 425 under the Securities Act (17 CFR 230.425)
[_] Soliciting material pursuant to Rule 14a-12 under the Exchange Act (17 CFR 240.14a-12(b))
[_] Pre-commencement communications pursuant to Rule 14d-2(b) under the Exchange Act (17 CFR 240.14d-2(b))
[_] Pre-commencement communications pursuant to Rule 13e-4(c) under the Exchange Act (17 CFR 240.13e-4(c))
This Current Report on Form 8-K is filed by CBRE Group, Inc., a Delaware corporation (the “Company”), in connection with the matters described herein.
Item 7.01 Regulation FD Disclosure.
The Company is scheduled to meet with investors during the month of May 2016. A copy of the presentation to be used at these meetings is furnished as Exhibit 99.1 to this Current Report on Form 8-K. The information contained in this Exhibit shall not be deemed “filed” for purposes of Section 18 of the Securities Exchange Act of 1934, nor shall it be deemed incorporated by reference in any filing under the Securities Act of 1933, except as expressly set forth by specific reference in such filing.
Item 9.01 Financial Statements and Exhibits.
(d) Exhibits
|
Exhibit |
|
Description |
|
99.1 |
|
CBRE Investor Presentation |
Signature
Pursuant to the requirements of the Securities Exchange Act of 1934, the registrant has duly caused this report to be signed on its behalf by the undersigned hereunto duly authorized.
|
Date: May 18, 2016 |
CBRE GROUP, INC. | ||
|
|
|
| |
|
|
|
| |
|
|
By: |
/s/ GIL BOROK |
|
|
|
|
|
|
|
|
|
Gil Borok | |
|
|
|
Deputy Chief Financial Officer and Chief Accounting Officer | |
Exhibit 99.1
Cbre group, inc. Global Market Leader in Integrated Commercial Real Estate Services May 2016

Forward-Looking Statements This presentation contains statements that are forward looking within the meaning of the Private Securities Litigation Reform Act of 1995. These include statements regarding CBRE’s future growth momentum, operations, market share, business outlook, and financial expectations. These statements are estimates only and actual results may ultimately differ from them. Except to the extent required by applicable securities laws, we undertake no obligation to update or publicly revise any of the forward-looking statements that you may hear today. Please refer to our first quarter earnings report, on Form 8-K, our most recent quarterly report filed on Form 10-Q and our most recent annual report filed on Form 10-K, in particular any discussion of risk factors or forward-looking statements, which are filed with the SEC and available at the SEC’s website (www.sec.gov), for a full discussion of the risks and other factors that may impact any forward-looking statements that you may hear today. We may make certain statements during the course of this presentation, which include references to “non-GAAP financial measures,” as defined by SEC regulations. Where required by these regulations, we have provided reconciliations of these measures to what we believe are the most directly comparable GAAP measures, which are attached hereto within the appendix.
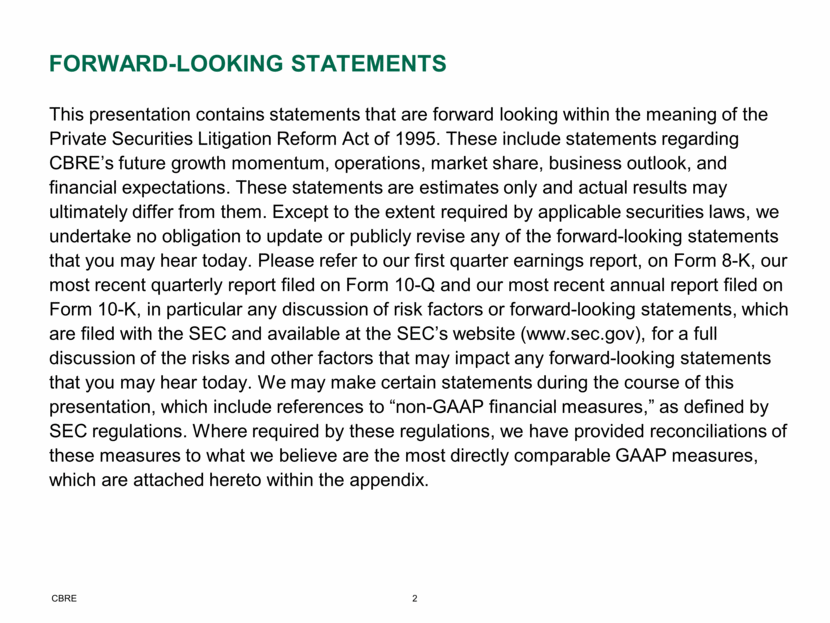
the global market leader CBRE is the premier global provider of integrated services to commercial real estate investors and occupiers GLOBAL LEADERSHIP WITH BROAD CAPABILITIES #1 Leasing #1 Property Sales #1 Outsourcing #1 Appraisal & Valuation $89.7 billion AUM Investment Management1 SCALE AND DIVERSITY 460+ offices in over 60 countries2 Serves over 90% of the Fortune 100 $311 billion of sales and lease activity and 87,000+ transactions in 2015 5.2 billion square feet under management3 See slide 27 for footnotes
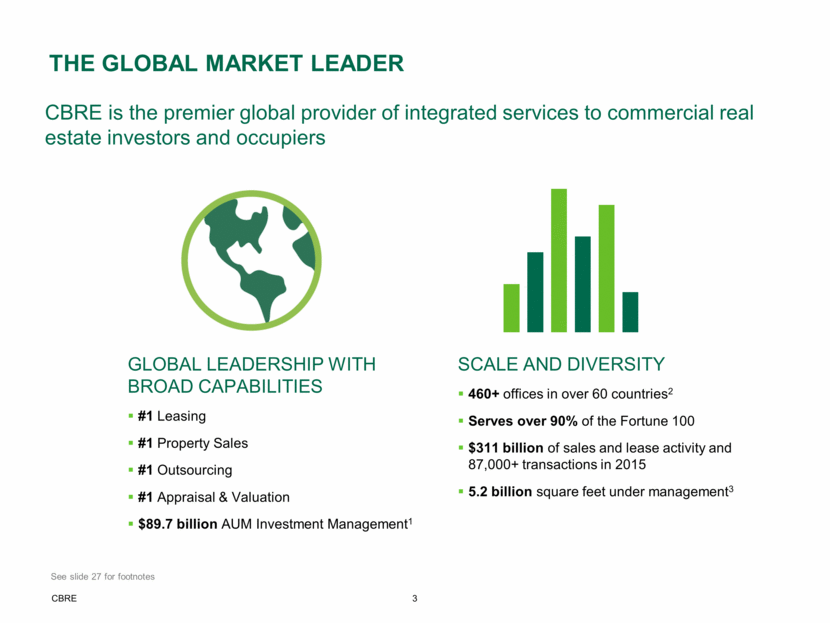
The Leading global brand CBRE is recognized as the foremost commercial real estate authority Fortune 500 company since 2008; ranked #321 in 2015 Ranked #1 brand for 15 consecutive years Global Real Estate Advisor of the Year four years in a row Ranked among the Most Admired Companies for four consecutive years Ranked among the top few outsourcing service providers across all industries for five consecutive years Named a World’s Most Ethical Company three years in a row S&P 500 company since 2006 S&P 500 Fortune 500 Fortune The Lipsey Company International Association of Outsourcing Professionals Euromoney Ethisphere One of only two companies to be ranked in the top 12 of the Barron’s 500 in each of the past three years (2014-2016). Barron’s 500 Forbes Named America’s 15th Best Employer (out of 500 companies) Top 10% of all S&P 500 companies CDP’s Climate Disclosure Leadership Index
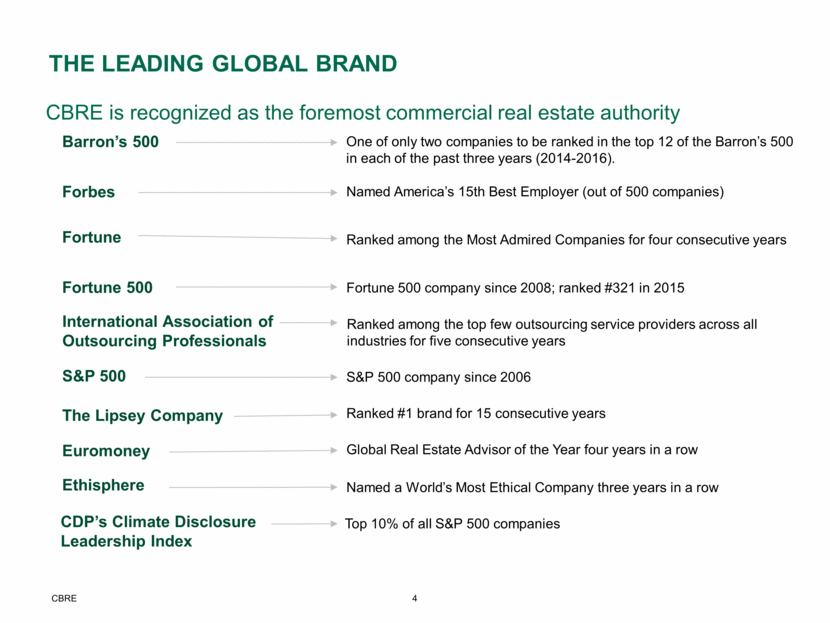
CBRE Serves investors and occupiers CBRE’s integrated, best-in-class offering creates value for clients at every stage of the life cycle
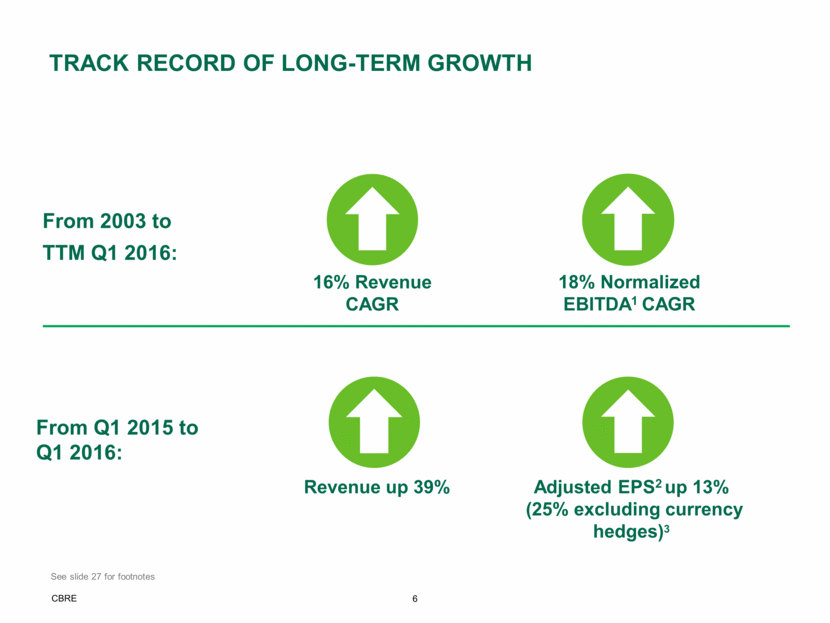
Revenue up 39% Adjusted EPS2 up 13% (25% excluding currency hedges)3 From Q1 2015 to Q1 2016: Track record of long-term growth From 2003 to TTM Q1 2016: 16% Revenue CAGR 18% Normalized EBITDA1 CAGR See slide 27 for footnotes
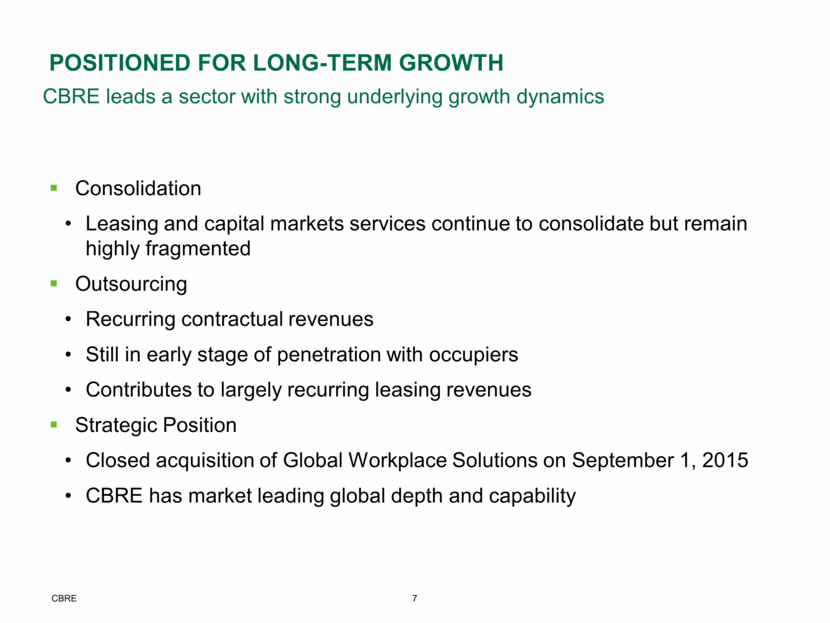
Positioned for long-term growth Consolidation Leasing and capital markets services continue to consolidate but remain highly fragmented Outsourcing Recurring contractual revenues Still in early stage of penetration with occupiers Contributes to largely recurring leasing revenues Strategic Position Closed acquisition of Global Workplace Solutions on September 1, 2015 CBRE has market leading global depth and capability CBRE leads a sector with strong underlying growth dynamics
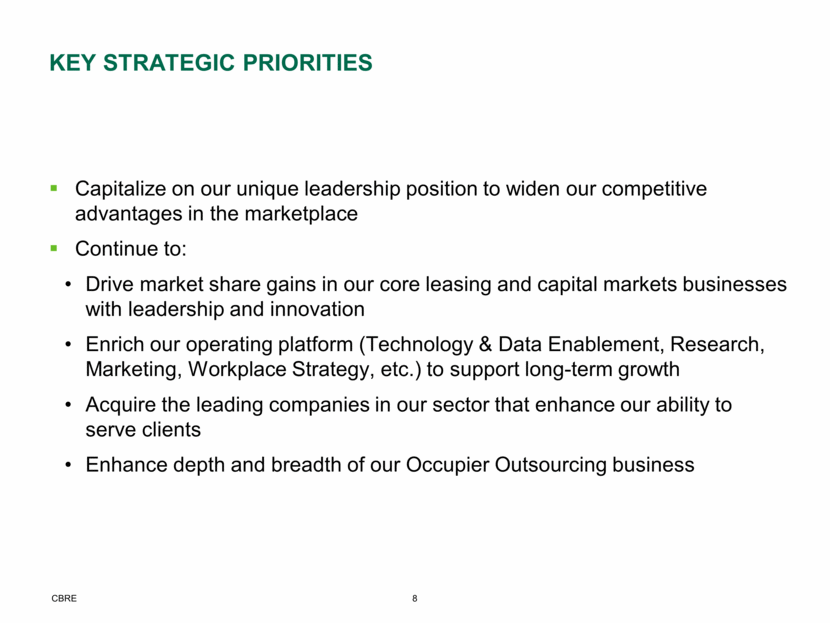
Key strategic priorities Capitalize on our unique leadership position to widen our competitive advantages in the marketplace Continue to: Drive market share gains in our core leasing and capital markets businesses with leadership and innovation Enrich our operating platform (Technology & Data Enablement, Research, Marketing, Workplace Strategy, etc.) to support long-term growth Acquire the leading companies in our sector that enhance our ability to serve clients Enhance depth and breadth of our Occupier Outsourcing business
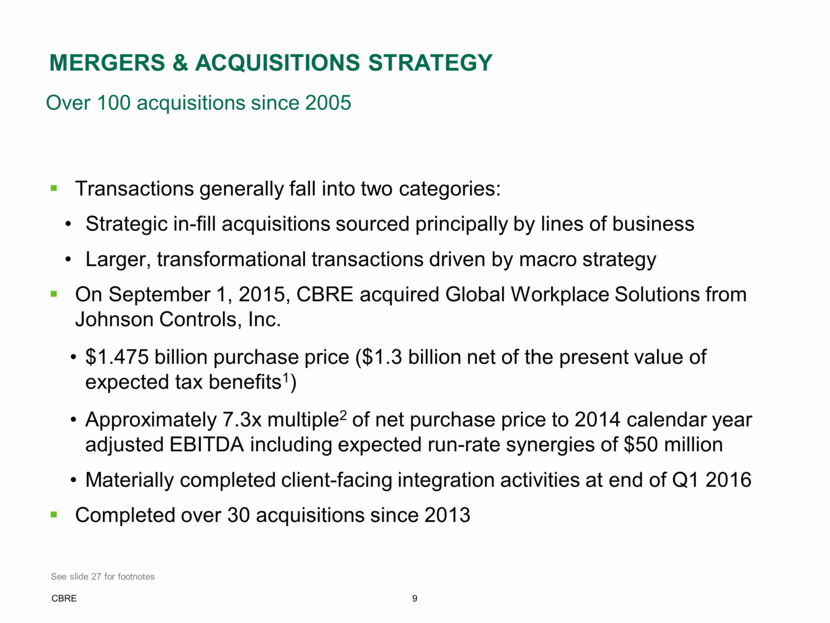
Mergers & acquisitions strategy Transactions generally fall into two categories: Strategic in-fill acquisitions sourced principally by lines of business Larger, transformational transactions driven by macro strategy On September 1, 2015, CBRE acquired Global Workplace Solutions from Johnson Controls, Inc. $1.475 billion purchase price ($1.3 billion net of the present value of expected tax benefits1) Approximately 7.3x multiple2 of net purchase price to 2014 calendar year adjusted EBITDA including expected run-rate synergies of $50 million Materially completed client-facing integration activities at end of Q1 2016 Completed over 30 acquisitions since 2013 Over 100 acquisitions since 2005 See slide 27 for footnotes
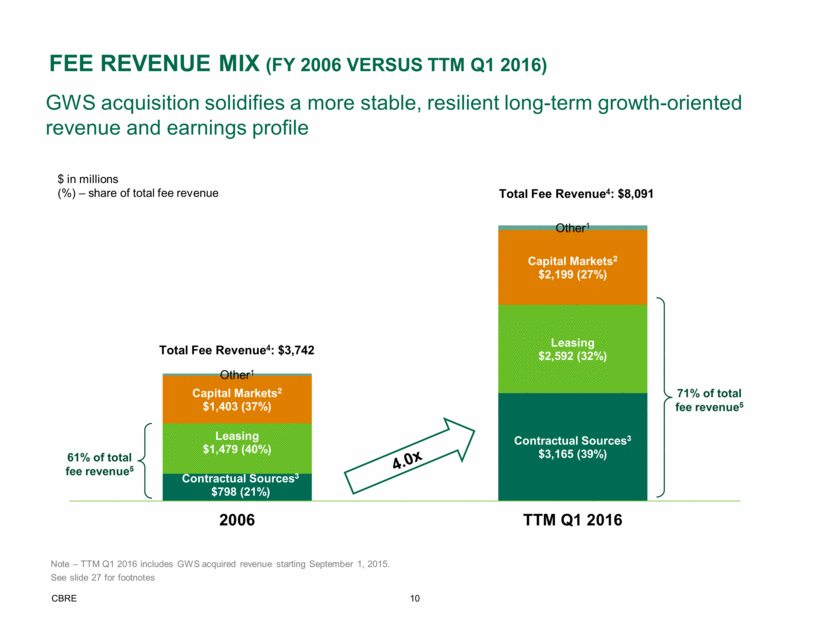
fee revenue Mix (FY 2006 versus TTM Q1 2016) Total Fee Revenue4: $3,742 Total Fee Revenue4: $8,091 4.0x Note – TTM Q1 2016 includes GWS acquired revenue starting September 1, 2015. See slide 27 for footnotes GWS acquisition solidifies a more stable, resilient long-term growth-oriented revenue and earnings profile Contractual Sources 3 $798 (21%) Contractual Sources 3 $3,165 (39%) Leasing $1,479 (40%) Leasing $2,592 (32%) Capital Markets 2 $1,403 (37%) Capital Markets 2 $2,199 (27%) Other 1 Other 1 2006 TTM Q1 2016 $ in millions (%) – share of total fee revenue 71% of total fee revenue 5 61% of total fee revenue 5
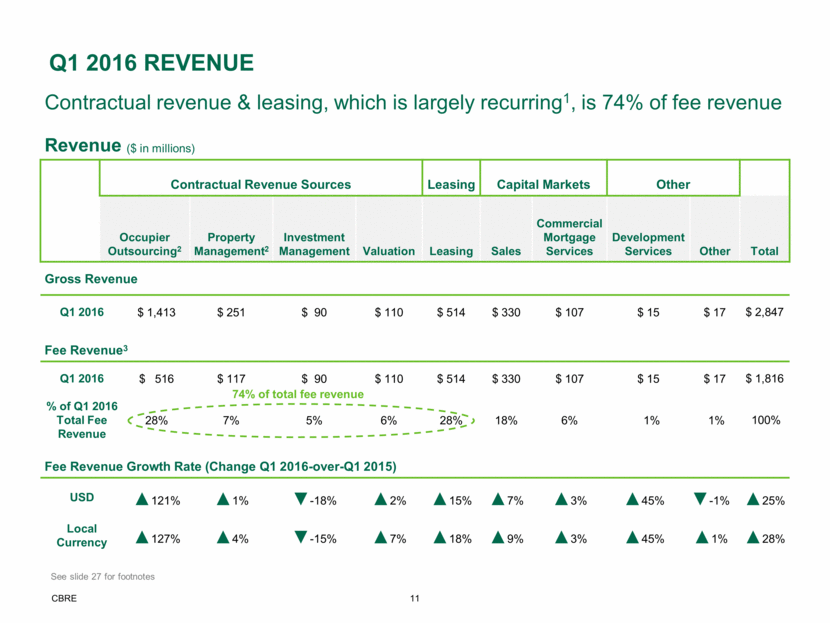
Q1 2016 REVENUE Contractual revenue & leasing, which is largely recurring1, is 74% of fee revenue Revenue ($ in millions) Contractual Revenue Sources Leasing Capital Markets Other Occupier Outsourcing2 Property Management2 Investment Management Valuation Leasing Sales Commercial Mortgage Services Development Services Other Total Gross Revenue Q1 2016 $ 1,413 $ 251 $ 90 $ 110 $ 514 $ 330 $ 107 $ 15 $ 17 $ 2,847 Fee Revenue3 Q1 2016 $ 516 $ 117 $ 90 $ 110 $ 514 $ 330 $ 107 $ 15 $ 17 $ 1,816 % of Q1 2016 Total Fee Revenue 28% 7% 5% 6% 28% 18% 6% 1% 1% 100% Fee Revenue Growth Rate (Change Q1 2016-over-Q1 2015) USD 121% 1% -18% 2% 15% 7% 3% 45% -1% 25% Local Currency 127% 4% -15% 7% 18% 9% 3% 45% 1% 28% 74% of total fee revenue See slide 27 for footnotes
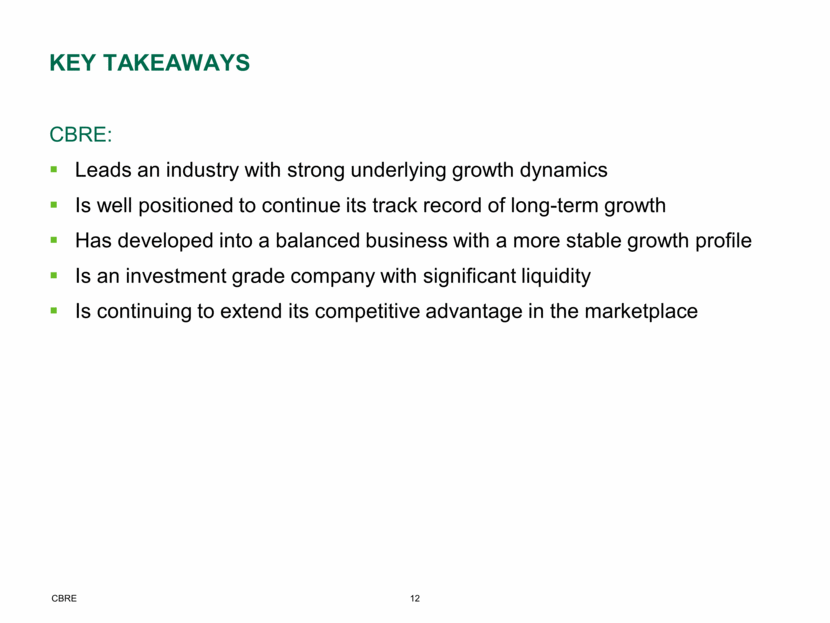
Key takeaways CBRE: Leads an industry with strong underlying growth dynamics Is well positioned to continue its track record of long-term growth Has developed into a balanced business with a more stable growth profile Is an investment grade company with significant liquidity Is continuing to extend its competitive advantage in the marketplace
appendix

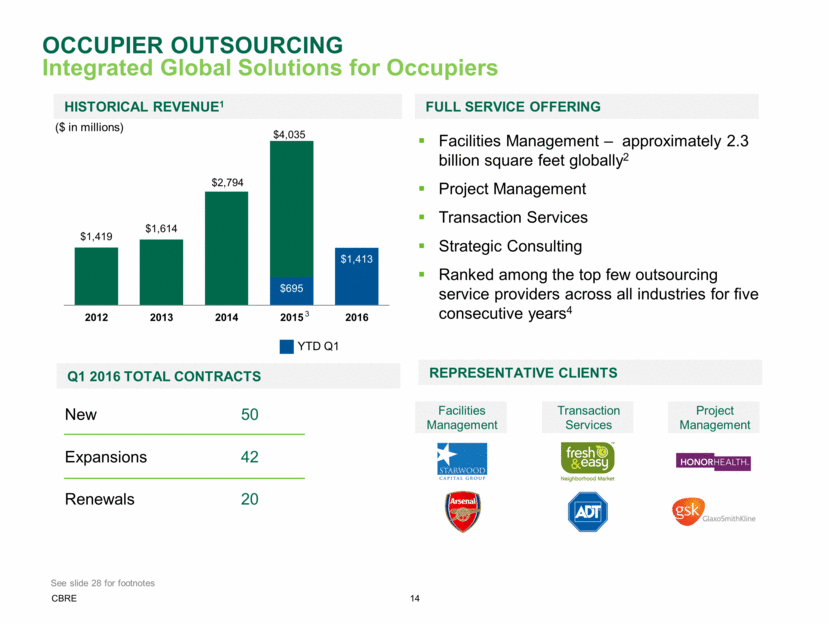
New 50 Expansions 42 Renewals 20 Historical revenue1 Full service offering Q1 2016 Total Contracts Facilities Management – approximately 2.3 billion square feet globally2 Project Management Transaction Services Strategic Consulting Ranked among the top few outsourcing service providers across all industries for five consecutive years4 Occupier Outsourcing Integrated Global Solutions for Occupiers Facilities Management Transaction Services Project Management Representative clients 3 YTD Q1 ($ in millions) See slide 28 for footnotes $1,419 $1,614 $2,794 $4,035 $695 $1,413 2012 2013 2014 2015 2016
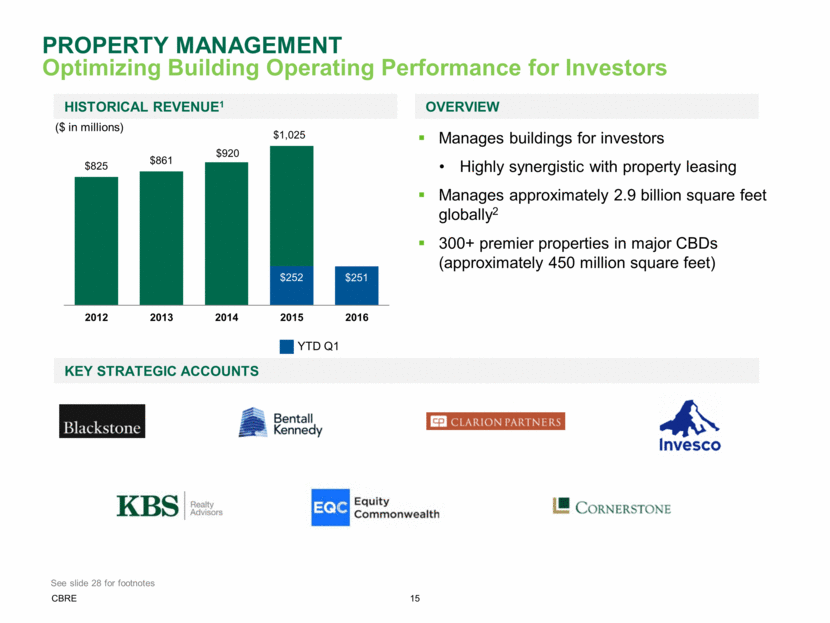
Historical revenue1 overview Key strategic accounts ($ in millions) Manages buildings for investors Highly synergistic with property leasing Manages approximately 2.9 billion square feet globally2 300+ premier properties in major CBDs (approximately 450 million square feet) Property management Optimizing Building Operating Performance for Investors YTD Q1 See slide 28 for footnotes $825 $861 $920 $1,025 $252 $251 2012 2013 2014 2015 2016
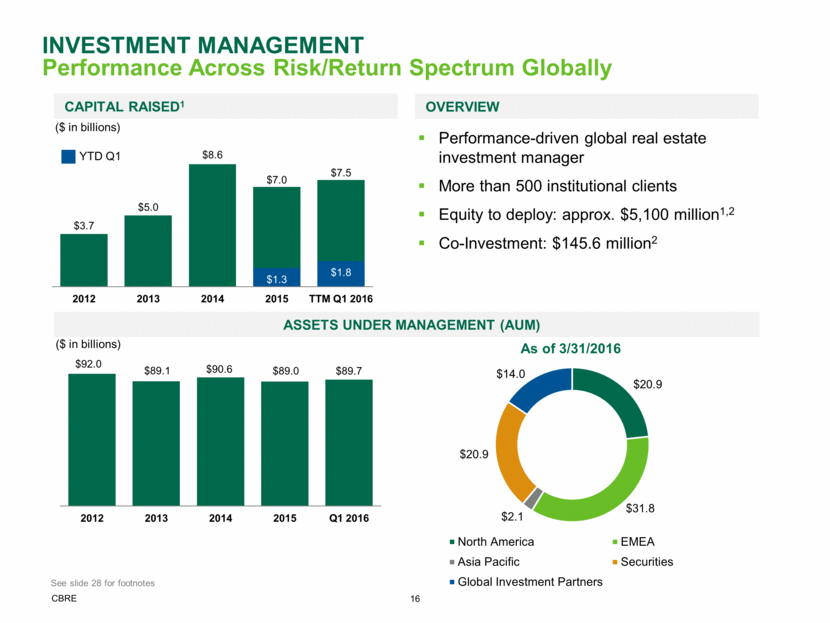
CAPITAL RAISED1 Performance-driven global real estate investment manager More than 500 institutional clients Equity to deploy: approx. $5,100 million1,2 Co-Investment: $145.6 million2 Assets under Management (AUM) overview ($ in billions) As of 3/31/2016 ($ in billions) INVESTMENT MANAGEMENT Performance Across Risk/Return Spectrum Globally YTD Q1 See slide 28 for footnotes $20.9 $31.8 $2.1 $20.9 $14.0 North America EMEA Asia Pacific Securities Global Investment Partners $92.0 $89.1 $90.6 $89.0 $89.7 2012 2013 2014 2015 Q1 2016 $3.7 $5.0 $8.6 $7.0 $7.5 $1.3 $1.8 2012 2013 2014 2015 TTM Q1 2016
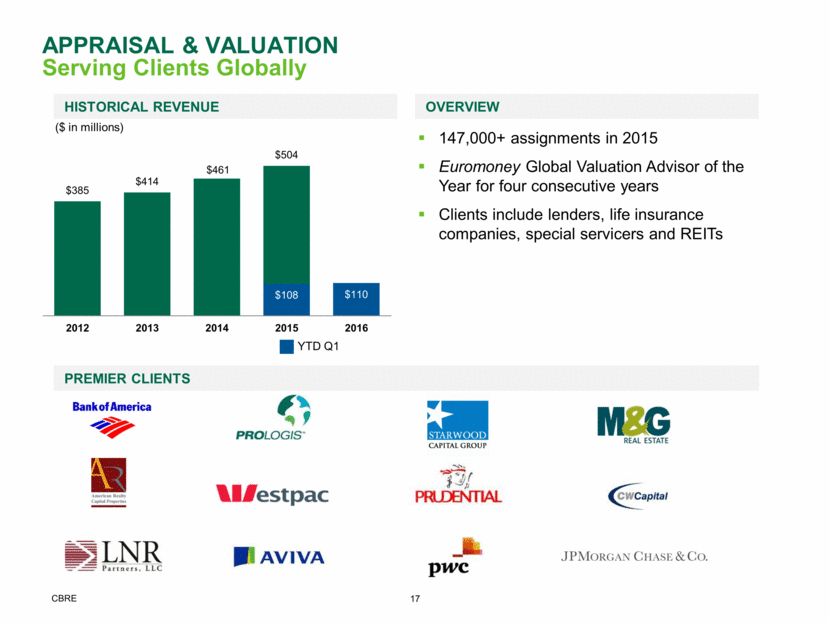
Premier clients ($ in millions) 147,000+ assignments in 2015 Euromoney Global Valuation Advisor of the Year for four consecutive years Clients include lenders, life insurance companies, special servicers and REITs overview Appraisal & Valuation Serving Clients Globally Historical revenue YTD Q1 $385 $414 $461 $504 $108 $110 2012 2013 2014 2015 2016
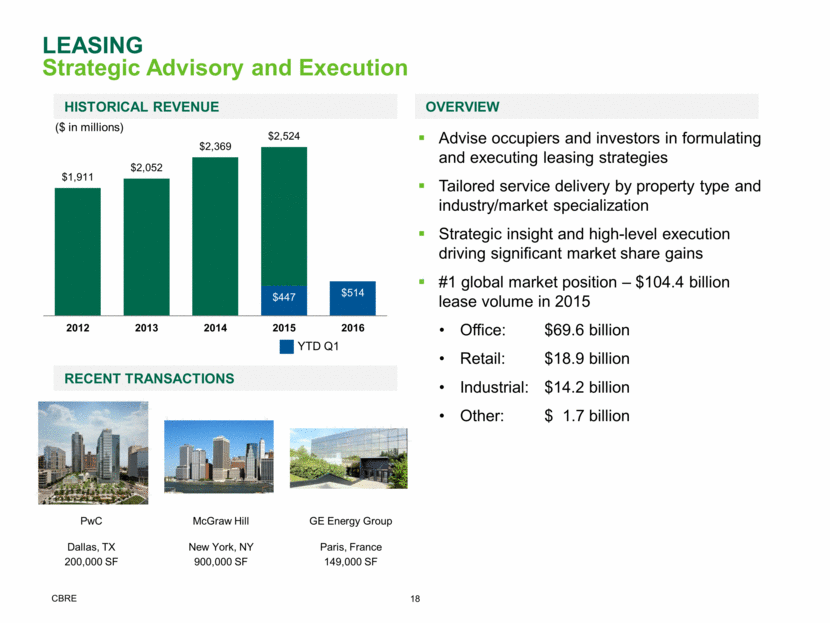
overview Recent transactions PwC McGraw Hill GE Energy Group Dallas, TX New York, NY Paris, France 200,000 SF 900,000 SF 149,000 SF Advise occupiers and investors in formulating and executing leasing strategies Tailored service delivery by property type and industry/market specialization Strategic insight and high-level execution driving significant market share gains #1 global market position – $104.4 billion lease volume in 2015 Office: $69.6 billion Retail: $18.9 billion Industrial: $14.2 billion Other: $ 1.7 billion LEASING Strategic Advisory and Execution ($ in millions) Historical revenue YTD Q1 $1,911 $2,052 $2,369 $2,524 $447 $514 2012 2013 2014 2015 2016
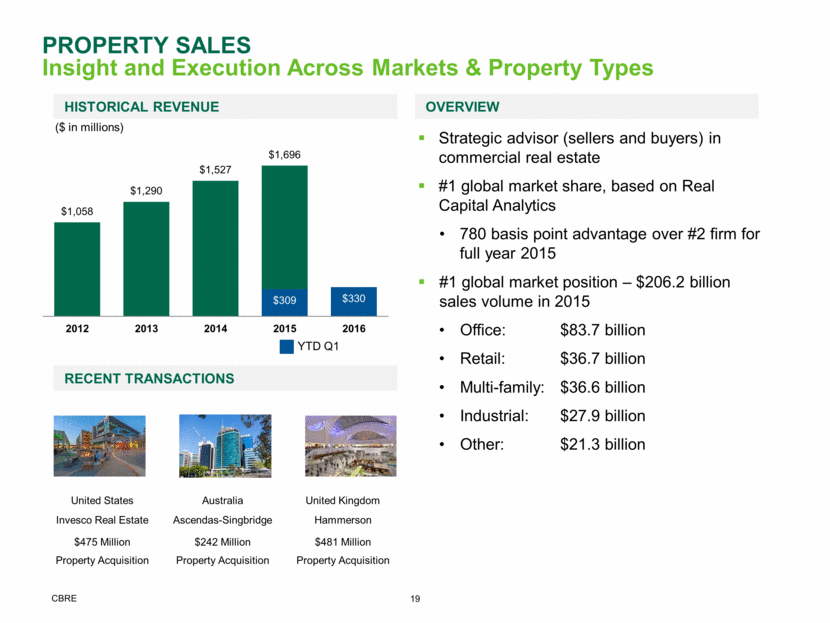
United States Australia United Kingdom Invesco Real Estate Ascendas-Singbridge Hammerson $475 Million $242 Million $481 Million Property Acquisition Property Acquisition Property Acquisition Recent transactions Strategic advisor (sellers and buyers) in commercial real estate #1 global market share, based on Real Capital Analytics 780 basis point advantage over #2 firm for full year 2015 #1 global market position – $206.2 billion sales volume in 2015 Office: $83.7 billion Retail: $36.7 billion Multi-family: $36.6 billion Industrial: $27.9 billion Other: $21.3 billion overview Historical revenue Property Sales Insight and Execution Across Markets & Property Types ($ in millions) YTD Q1 $1,058 $1,290 $1,527 $1,696 $309 $330 2012 2013 2014 2015 2016
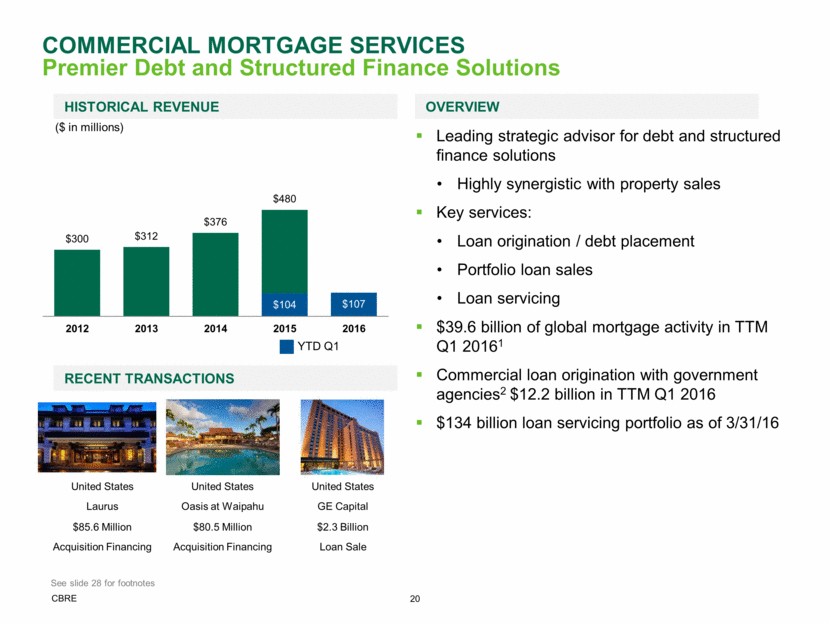
United States United States United States Laurus Oasis at Waipahu GE Capital $85.6 Million $80.5 Million $2.3 Billion Acquisition Financing Acquisition Financing Loan Sale Recent transactions Leading strategic advisor for debt and structured finance solutions Highly synergistic with property sales Key services: Loan origination / debt placement Portfolio loan sales Loan servicing $39.6 billion of global mortgage activity in TTM Q1 20161 Commercial loan origination with government agencies2 $12.2 billion in TTM Q1 2016 $134 billion loan servicing portfolio as of 3/31/16 overview Historical revenue Commercial mortgage services Premier Debt and Structured Finance Solutions ($ in millions) YTD Q1 See slide 28 for footnotes $300 $312 $376 $480 $104 $107 2012 2013 2014 2015 2016
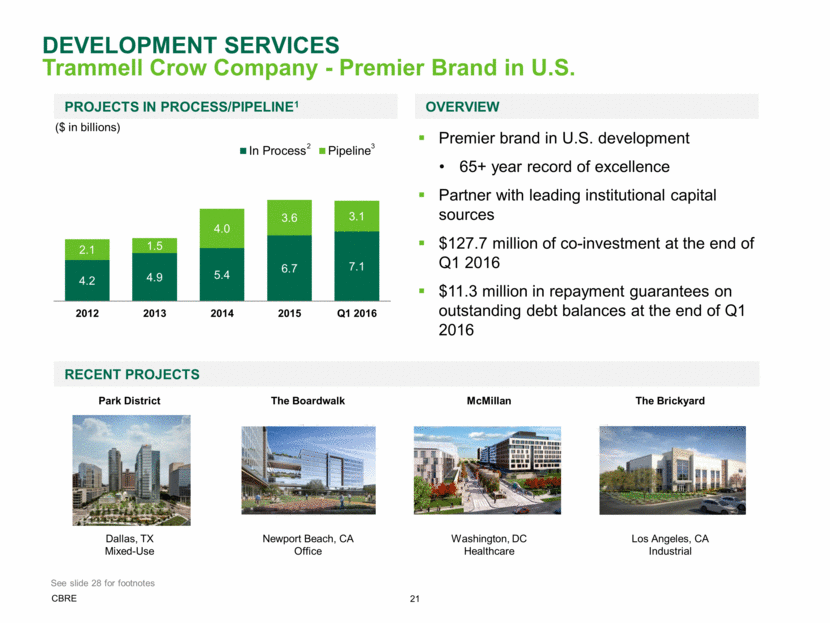
Park District The Boardwalk McMillan The Brickyard Dallas, TX Mixed-Use Newport Beach, CA Office Washington, DC Healthcare Los Angeles, CA Industrial 2 Projects in process/pipeline1 overview Recent projects Premier brand in U.S. development 65+ year record of excellence Partner with leading institutional capital sources $127.7 million of co-investment at the end of Q1 2016 $11.3 million in repayment guarantees on outstanding debt balances at the end of Q1 2016 Development Services Trammell Crow Company - Premier Brand in U.S. ($ in billions) 3 See slide 28 for footnotes 4.2 4.9 5.4 6.7 7.1 2.1 1.5 4.0 3.6 3.1 2012 2013 2014 2015 Q1 2016 In Process Pipeline
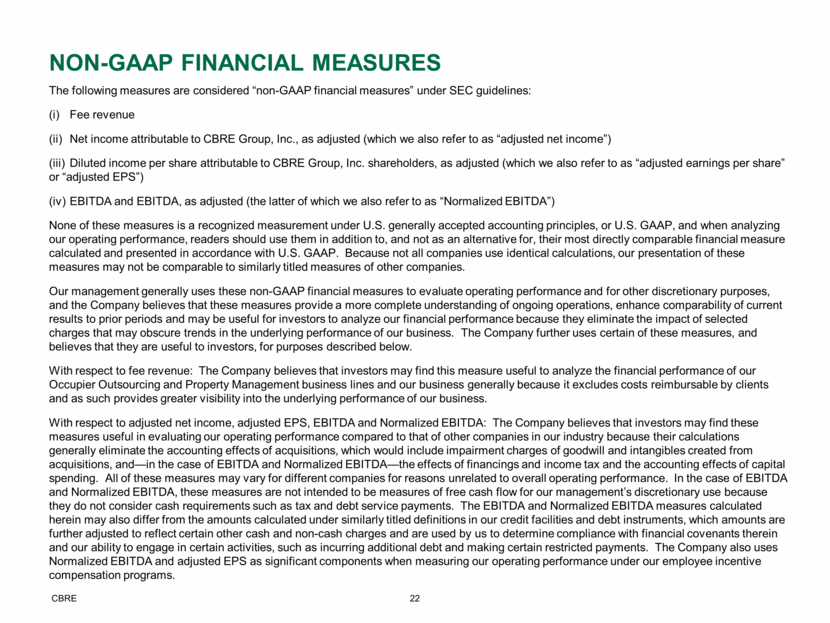
Non-Gaap financial measures The following measures are considered “non-GAAP financial measures” under SEC guidelines: (i) Fee revenue (ii) Net income attributable to CBRE Group, Inc., as adjusted (which we also refer to as “adjusted net income”) (iii) Diluted income per share attributable to CBRE Group, Inc. shareholders, as adjusted (which we also refer to as “adjusted earnings per share” or “adjusted EPS”) (iv) EBITDA and EBITDA, as adjusted (the latter of which we also refer to as “Normalized EBITDA”) None of these measures is a recognized measurement under U.S. generally accepted accounting principles, or U.S. GAAP, and when analyzing our operating performance, readers should use them in addition to, and not as an alternative for, their most directly comparable financial measure calculated and presented in accordance with U.S. GAAP. Because not all companies use identical calculations, our presentation of these measures may not be comparable to similarly titled measures of other companies. Our management generally uses these non-GAAP financial measures to evaluate operating performance and for other discretionary purposes, and the Company believes that these measures provide a more complete understanding of ongoing operations, enhance comparability of current results to prior periods and may be useful for investors to analyze our financial performance because they eliminate the impact of selected charges that may obscure trends in the underlying performance of our business. The Company further uses certain of these measures, and believes that they are useful to investors, for purposes described below. With respect to fee revenue: The Company believes that investors may find this measure useful to analyze the financial performance of our Occupier Outsourcing and Property Management business lines and our business generally because it excludes costs reimbursable by clients and as such provides greater visibility into the underlying performance of our business. With respect to adjusted net income, adjusted EPS, EBITDA and Normalized EBITDA: The Company believes that investors may find these measures useful in evaluating our operating performance compared to that of other companies in our industry because their calculations generally eliminate the accounting effects of acquisitions, which would include impairment charges of goodwill and intangibles created from acquisitions, and—in the case of EBITDA and Normalized EBITDA—the effects of financings and income tax and the accounting effects of capital spending. All of these measures may vary for different companies for reasons unrelated to overall operating performance. In the case of EBITDA and Normalized EBITDA, these measures are not intended to be measures of free cash flow for our management’s discretionary use because they do not consider cash requirements such as tax and debt service payments. The EBITDA and Normalized EBITDA measures calculated herein may also differ from the amounts calculated under similarly titled definitions in our credit facilities and debt instruments, which amounts are further adjusted to reflect certain other cash and non-cash charges and are used by us to determine compliance with financial covenants therein and our ability to engage in certain activities, such as incurring additional debt and making certain restricted payments. The Company also uses Normalized EBITDA and adjusted EPS as significant components when measuring our operating performance under our employee incentive compensation programs.
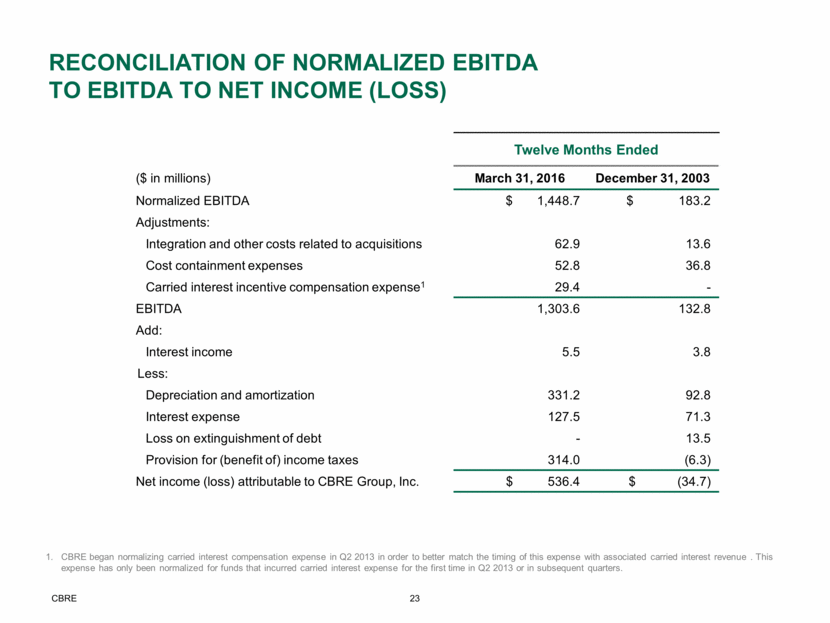
Twelve Months Ended ($ in millions) March 31, 2016 December 31, 2003 Normalized EBITDA $ 1,448.7 $ 183.2 Adjustments: Integration and other costs related to acquisitions 62.9 13.6 Cost containment expenses 52.8 36.8 Carried interest incentive compensation expense1 29.4 - EBITDA 1,303.6 132.8 Add: Interest income 5.5 3.8 Less: Depreciation and amortization 331.2 92.8 Interest expense 127.5 71.3 Loss on extinguishment of debt - 13.5 Provision for (benefit of) income taxes 314.0 (6.3) Net income (loss) attributable to CBRE Group, Inc. $ 536.4 $ (34.7) Reconciliation of Normalized EBITDA to EBITDA to Net Income (Loss) CBRE began normalizing carried interest compensation expense in Q2 2013 in order to better match the timing of this expense with associated carried interest revenue . This expense has only been normalized for funds that incurred carried interest expense for the first time in Q2 2013 or in subsequent quarters.
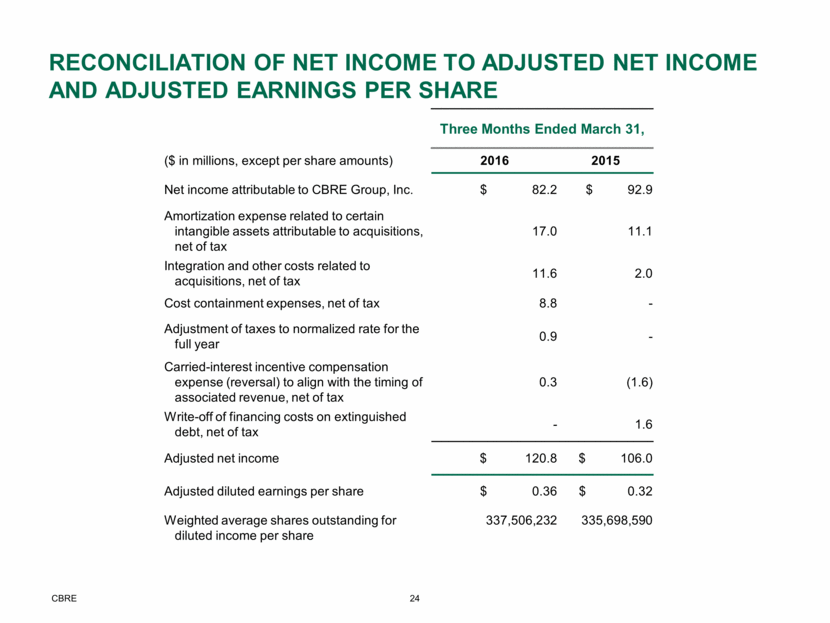
Reconciliation of Net Income to adjusted Net Income and adjusted earnings per share Three Months Ended March 31, ($ in millions, except per share amounts) 2016 2015 Net income attributable to CBRE Group, Inc. $ 82.2 $ 92.9 Amortization expense related to certain intangible assets attributable to acquisitions, net of tax 17.0 11.1 Integration and other costs related to acquisitions, net of tax 11.6 2.0 Cost containment expenses, net of tax 8.8 - Adjustment of taxes to normalized rate for the full year 0.9 - Carried-interest incentive compensation expense (reversal) to align with the timing of associated revenue, net of tax 0.3 (1.6) Write-off of financing costs on extinguished debt, net of tax - 1.6 Adjusted net income $ 120.8 $ 106.0 Adjusted diluted earnings per share $ 0.36 $ 0.32 Weighted average shares outstanding for diluted income per share 337,506,232 335,698,590
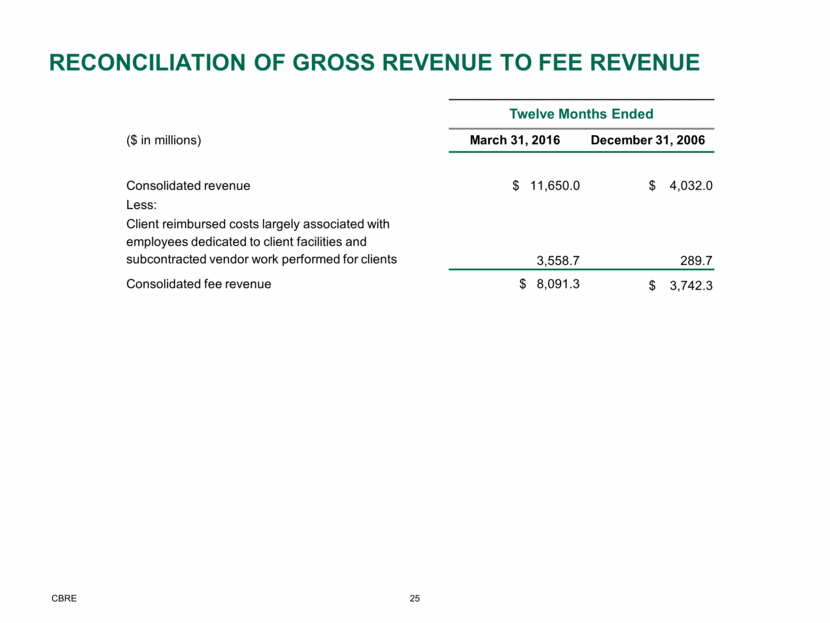
Reconciliation of gross revenue to fee revenue Twelve Months Ended ($ in millions) March 31, 2016 December 31, 2006 Consolidated revenue $ 11,650.0 $ 4,032.0 Less: Client reimbursed costs largely associated with employees dedicated to client facilities and subcontracted vendor work performed for clients 3,558.7 289.7 Consolidated fee revenue $ 8,091.3 $ 3,742.3
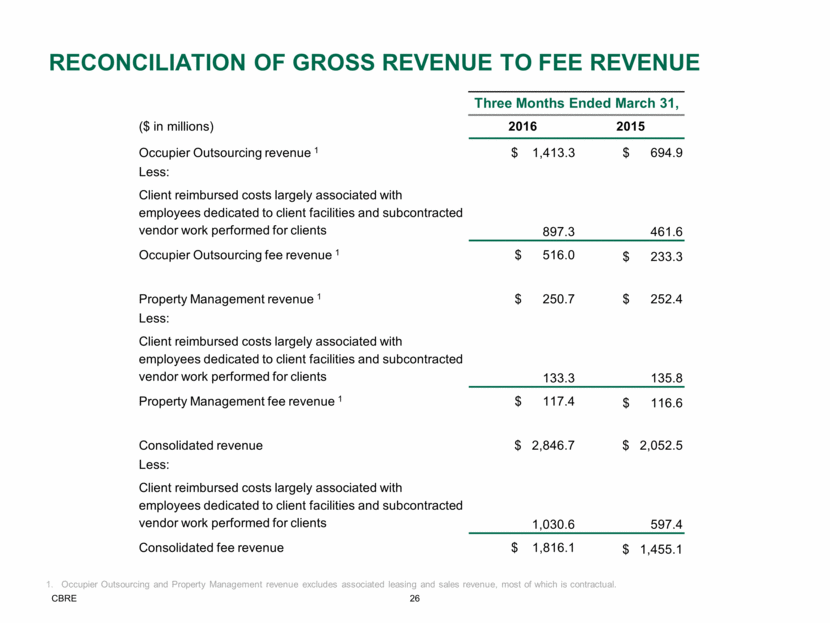
Reconciliation of gross revenue to fee revenue Occupier Outsourcing and Property Management revenue excludes associated leasing and sales revenue, most of which is contractual. Three Months Ended March 31, ($ in millions) 2016 2015 Occupier Outsourcing revenue 1 $ 1,413.3 $ 694.9 Less: Client reimbursed costs largely associated with employees dedicated to client facilities and subcontracted vendor work performed for clients 897.3 461.6 Occupier Outsourcing fee revenue 1 $ 516.0 $ 233.3 Property Management revenue 1 $ 250.7 $ 252.4 Less: Client reimbursed costs largely associated with employees dedicated to client facilities and subcontracted vendor work performed for clients 133.3 135.8 Property Management fee revenue 1 $ 117.4 $ 116.6 Consolidated revenue $ 2,846.7 $ 2,052.5 Less: Client reimbursed costs largely associated with employees dedicated to client facilities and subcontracted vendor work performed for clients 1,030.6 597.4 Consolidated fee revenue $ 1,816.1 $ 1,455.1
Footnotes Slide 9 The base purchase price was $1.475 billion in cash plus net adjustments for working capital and other items. Such net adjustments took into account approximately $45 million in cash acquired by CBRE in the acquisition. The purchase price has been subject to post-closing adjustments as outlined in the purchase agreement for the transaction. Deal costs are excluded from the purchase price. Multiple based on GWS adjusted EBITDA as calculated by GWS (when owned by Johnson Controls) and using GWS’s methodologies (when owned by Johnson Controls) as well as previously announced run-rate cost synergies of approximately $50 million, which are expected to be fully realized in 2017. Slide 10 Other includes Development Services (1% in both 2006 and TTM Q1 2016) and Other (1% in both 2006 and TTM Q1 2016). Capital Markets includes Sales (33% in 2006 and 21% in TTM Q1 2016) and Commercial Mortgage Services (4% in 2006 and 6% in TTM Q1 2016). Contractual Revenues include Occupier Outsourcing and Property Management (7% in 2006 and 27% in TTM Q1 2016; excludes associated sales and lease revenues, most of which are contractual), Global Investment Management (6% in both 2006 and TTM Q1 2016), and Valuation (8% in 2006 and 6% in TTM Q1 2016). Fee Revenue is gross revenue less client reimbursed costs largely associated with our employees that are dedicated to client facilities and subcontracted vendor work performed for clients. Contractual plus leasing revenues are 64% of 2006 GAAP revenue and 79% of TTM Q1 2016 GAAP revenue. Slide 6 Normalized EBITDA excludes (from EBITDA) certain carried interest incentive compensation expense (reversal) to align with the timing of associated revenue, cost containment expenses and integration and other costs related to acquisitions. Adjusted EPS includes the impact of an adjusting provision for income taxes to a normalized rate and excludes amortization expense related to certain intangible assets attributable to acquisitions, the write-off of financing costs on extinguished debt, cost containment expenses, integration and other costs related to acquisitions, and adjusts certain carried interest incentive compensation expense (reversal) to align with the timing of associated revenue. The 25% increase reflects the negative impact of marking currency hedges to market ($0.05) partially offset by $0.01 gain from other currency movement. NOTE: Local currency percent changes versus prior year are non-GAAP financial measures noted on slides 6 and 11. These percent changes are calculated by comparing current year results versus prior year results, in each case at prior year exchange rates. Slide 11 We regard leasing revenue as largely recurring because unlike most other transaction businesses, leasing activity normally takes place when leases expire. The average lease expires in five to six years. This means that, on average, in a typical year approximately 17% to 20% of leases roll over and a new leasing decision must be made. When a lease expires in the ordinary course, we expect it to be renewed, extended or the tenant to vacate the space to lease another space in the market. In each instance, a transaction is completed. If there is a downturn in economic activity, some tenants may seek a short term lease extension, often a year, before making a longer term commitment. In this scenario, that delayed leasing activity tends to be stacked on top of the normal activity in the following year. Thus, we characterize leasing as largely recurring because we expect an expiration of a lease, in the ordinary course, to lead to an opportunity for a leasing commission from such completed transaction. Occupier Outsourcing and Property Management revenue excludes associated leasing and sales revenue, most of which is contractual. Fee revenue is gross revenue less both client reimbursed costs largely associated with employees that are dedicated to client facilities and subcontracted vendor work performed for clients. Slide 3 Assets Under Management (AUM) as of March 31, 2016. As of December 31, 2015, includes affiliates. Property and Corporate Facilities under Management as of December 31, 2015; 7% of this square footage is managed by affiliates.
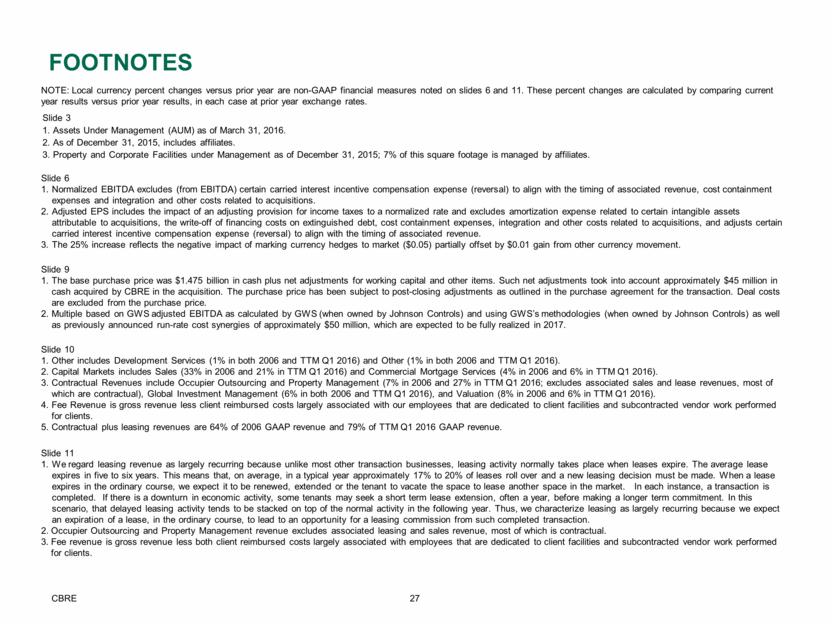
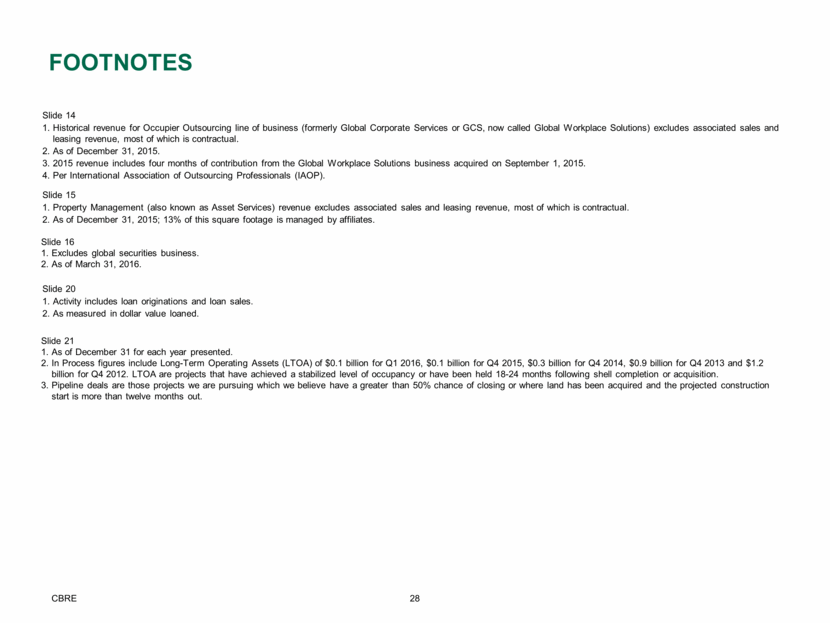
Footnotes Slide 16 Excludes global securities business. As of March 31, 2016. Slide 21 As of December 31 for each year presented. In Process figures include Long-Term Operating Assets (LTOA) of $0.1 billion for Q1 2016, $0.1 billion for Q4 2015, $0.3 billion for Q4 2014, $0.9 billion for Q4 2013 and $1.2 billion for Q4 2012. LTOA are projects that have achieved a stabilized level of occupancy or have been held 18-24 months following shell completion or acquisition. Pipeline deals are those projects we are pursuing which we believe have a greater than 50% chance of closing or where land has been acquired and the projected construction start is more than twelve months out. Slide 14 Historical revenue for Occupier Outsourcing line of business (formerly Global Corporate Services or GCS, now called Global Workplace Solutions) excludes associated sales and leasing revenue, most of which is contractual. As of December 31, 2015. 2015 revenue includes four months of contribution from the Global Workplace Solutions business acquired on September 1, 2015. Per International Association of Outsourcing Professionals (IAOP). Slide 15 Property Management (also known as Asset Services) revenue excludes associated sales and leasing revenue, most of which is contractual. As of December 31, 2015; 13% of this square footage is managed by affiliates. Slide 20 Activity includes loan originations and loan sales. As measured in dollar value loaned.
Serious News for Serious Traders! Try StreetInsider.com Premium Free!
You May Also Be Interested In
- Kopin Exhibiting at SPIE Defense & Commercial Sensing Conference at the National Harbor, MD April 23 through April 25, 2024
- Anzu Partners Promotes Three Business Services Team Members to Principal
- Hop-on Re-Schedules Annual Shareholders Meeting Using Our Own Proprietary Digitalage Streams(TM) Worldwide Broadcasting Technology
Create E-mail Alert Related Categories
SEC FilingsSign up for StreetInsider Free!
Receive full access to all new and archived articles, unlimited portfolio tracking, e-mail alerts, custom newswires and RSS feeds - and more!


 Tweet
Tweet Share
Share