

Form 8-K CATERPILLAR INC For: Oct 25
 Tweet
Tweet Share
ShareUNITED STATES SECURITIES AND EXCHANGE COMMISSION Washington, D.C. 20549 | ||||
 | ||||
FORM 8-K | ||||
Current Report | ||||
Pursuant to Section 13 or 15(d) of the Securities Exchange Act of 1934 | ||||
Date of Report (Date of earliest event reported): October 25, 2016 | ||||
CATERPILLAR INC. (Exact name of registrant as specified in its charter) | ||||
Delaware (State or other jurisdiction of incorporation) | ||||
1-768 (Commission File Number) | 37-0602744 (IRS Employer Identification No.) | |||
100 NE Adams Street, Peoria, Illinois (Address of principal executive offices) | 61629 (Zip Code) | |||
Registrant’s telephone number, including area code: (309) 675-1000 | ||||
Former name or former address, if changed since last report: N/A | ||||
Check the appropriate box below if the Form 8-K filing is intended to simultaneously satisfy the filing obligation of the registrant under any of the following provisions: | ||||
o | Written communications pursuant to Rule 425 under the Securities Act (17 CFR 230.425) | |||
o | Soliciting material pursuant to Rule 14a-12 under the Exchange Act (17 CFR 240.14a-12) | |||
o | Pre-commencement communications pursuant to Rule 14d-2(b) under the Exchange Act (17 CFR 240.14d-2(b)) | |||
o | Pre-commencement communications pursuant to Rule 13e-4(c) under the Exchange Act (17 CFR 240.13e-4(c)) | |||
Item 2.02. Results of Operations and Financial Condition.
On October 25, 2016, Caterpillar Inc. (“Caterpillar”) issued a press release reporting its financial results for the third quarter ended September 30, 2016. A copy of the press release is attached hereto as Exhibit 99.1 and incorporated into this Item 2.02 by reference.
The information in this Current Report on Form 8-K, including Exhibit 99.1, is being furnished in accordance with the provisions of General Instruction B.2 of Form 8-K.
Item 9.01. Financial Statements and Exhibits.
(d) | Exhibits: | ||
The following is furnished as an exhibit to this report: | |||
99.1 | Caterpillar Inc. press release dated October 25, 2016. | ||
SIGNATURES | ||
Pursuant to the requirements of the Securities Exchange Act of 1934, the registrant has duly caused this report to be signed on its behalf by the undersigned hereunto duly authorized. | ||
CATERPILLAR INC. | ||
October 25, 2016 | By: | /s/James B. Buda |
James B. Buda | ||
Executive Vice President, Law and Public Policy | ||
EXHIBIT INDEX | |
Exhibit No. | Description |
99.1 | Caterpillar Inc. press release dated October 25, 2016. |
Exhibit 99.1
Caterpillar Inc.
3Q 2016 Earnings Release
October 25, 2016
FOR IMMEDIATE RELEASE
Caterpillar Reports Third-Quarter 2016 Results
Third Quarter | ||||
($ in billions except profit per share) | 2016 | 2015 | ||
Sales and Revenues | $9.160 | $10.962 | ||
Profit Per Share | $0.48 | $0.94 | ||
Profit Per Share (Excluding Restructuring Costs) | $0.85 | $1.05 | ||
PEORIA, Ill. - Caterpillar Inc. (NYSE: CAT) today announced profit per share of $0.48 for the third quarter of 2016, a decrease from $0.94 per share in the third quarter of 2015. Excluding restructuring costs, profit per share was $0.85, down from $1.05 per share in the third quarter of 2015. Third-quarter 2016 sales and revenues of $9.2 billion were down 16 percent from $11.0 billion in the third quarter of 2015.
“Economic weakness throughout much of the world persists and, as a result, most of our end markets remain challenged. In North America, the market has an abundance of used construction equipment, rail customers have a substantial number of idle locomotives, and around the world there are a significant number of idle mining trucks,” said Caterpillar Chairman and Chief Executive Officer Doug Oberhelman. “However, there were a few bright spots this quarter. Both the construction industry and our machine market position improved in China. Most commodity prices, while low, seem to have stabilized. Parts sales have increased sequentially in each of the last two quarters. Our machine market position and quality remain at high levels and our work on Lean and restructuring are continuing to help us lower costs.
“I’m pleased with how Caterpillar has responded and our team’s incredible focus on reducing costs and pulling through profit despite sluggish end markets. In the third quarter, despite a $1.8 billion decline in sales and revenues, our operating profit pull through was significantly better than our target range. Lower variable manufacturing costs of $234 million and lower period costs of $420 million enabled us to offset much of the negative impact from a weak sales environment and continue investment in products and digital capabilities,” said Oberhelman.
2016 Outlook
The full-year outlook for 2016 sales and revenues is about $39 billion, and profit is $2.35 per share, or $3.25 per share excluding restructuring costs. The outlook does not include potential mark-to-market gains or losses related to pension and OPEB plans, which, as discussed in Q&A #10, are likely to significantly impact full-year 2016 results. The previous outlook for 2016 expected sales and revenues to be in a range of $40.0 to $40.5 billion, with profit at the midpoint of the
(more)
2
sales and revenues range of about $2.75 per share, or about $3.55 per share excluding restructuring costs. Restructuring costs in 2016, which were expected to be about $700 million, are now forecast to be about $800 million, primarily due to asset write downs recognized in the third quarter.
Preliminary Outlook for 2017 Sales and Revenues
Our preliminary outlook for 2017 is that sales and revenues will not be significantly different than 2016. The balance of risk, particularly during the first half of the year, is likely on the negative side. We are, however, encouraged that most commodity prices important to our business have improved from the lows earlier in 2016. Should commodity prices show relative stability and move higher in 2017, it is reasonable to expect that our business would respond, and we could see a more positive second half. Our preliminary outlook for 2017 is based on our expectation that world economic growth will remain subdued at close to 2.5 percent - similar to the past few years.
“While we are seeing early signals of improvement in some areas, we continue to face a number of challenges. We remain cautious as we look ahead to 2017, but are hopeful as the year unfolds we will begin to see more positive momentum. Whether or not that happens, we are continuing to prepare for a better future. In addition to substantial restructuring and significant cost reduction actions, we've kept our focus on customers and on the future by continuing to invest in our digital capabilities, connecting assets and jobsites and developing the next generation of more productive and efficient products,” said Oberhelman.
Following is a summary of positive and negative factors that could influence 2017 sales and revenues:
Positive factors
• | Prices for some commodities important to our business have improved from earlier lows. Oil prices are currently near $50 per barrel, but are still volatile. While about 70 percent below the prior peak in 2014, the U.S. active rig count is up 37 percent since May of 2016. |
• | Most prices for mined commodities have risen from lows earlier this year, and we are expecting average prices in 2017 to be flat to up modestly from 2016. We are seeing recent improvement in dealer rebuild activity and some firming of aftermarket parts sales in mining. |
• | The construction industry and our market position have continued to improve in China, and we are expecting a continued small improvement in 2017. |
• | Construction sales in Brazil and Russia have likely bottomed at very low levels in 2016. |
• | After several years of decline, surveys of capital expenditures in the mining sector indicate spending should level off in 2017. |
Negative factors
• | While sentiment around mining has definitely improved, there are still many idle trucks on customer sites, and we have not seen an increase in orders for new equipment. |
• | While mining-related commodity prices have improved, some remain at levels that we believe are too low to drive additional investment. |
• | Construction activity and construction equipment sales in North America during the second half of 2016 are now anticipated to be lower than we expected in our previous 2016 outlook. We are concerned that could continue into 2017. |
• | There is continuing uncertainty in Europe, particularly around the impact of Brexit on European economic growth, business confidence and investment. |
• | While sales in China have improved, there is risk of slowing if Chinese government monetary and fiscal policy become less supportive. |
(more)
3
• | Power generation sales are expected to be down, particularly in the oil-producing regions of Africa/Middle East where the pace of investment has slowed. |
• | Marine engines for boats that service offshore oil and gas are not expected to improve as oil prices, while better, are not expected to be sufficient to improve offshore rig economics in 2017. Tug markets also are expected to be weak with weak freight movement. |
• | We expect continued weakness in industrial engine sales to agricultural customers and small generator set packagers. |
• | North American rail is again expected to be a challenged industry with many idle locomotives. |
“As you know, I’ve decided to retire after 41 years at Caterpillar, and Jim Umpleby will succeed me as CEO. He’s been a key part of the leadership team for several years and is absolutely ready to lead Caterpillar. I’m confident I’m turning over a company that’s ready for a better future. We have a great team, our product portfolio is the best ever, our machine market position and quality remain at high levels and we’ve significantly improved our cost structure. At some point, and I think we’re getting closer to that point, our businesses will turn up. Many of our businesses, including mining, oil and gas, rail and construction, are currently operating well below historical replacement demand levels in many parts of the world. It’s a good time for Jim to take over, as I know Caterpillar will deliver even better financial results when key industries begin to improve and get back to mid-cycle replacement demand levels," said Oberhelman.
Highlights
• | Substantially lower costs in the third quarter helped mitigate the impact of lower sales - restructuring and cost reduction actions are paying off |
• | Market position for machines continuing to improve - including China |
• | Strong balance sheet and continued commitment to stockholders - maintained $0.77 per share dividend (announced October 12, 2016) |
• | Full-year 2016 outlook lowered in challenged environment |
• | 2017 sales and revenues are not expected to be significantly different than 2016 |
(more)
4
Notes:
• | Glossary of terms is included on pages 17-18; first occurrence of terms shown in bold italics. |
• | Information on non-GAAP financial measures is included on page 19. |
• | Caterpillar will conduct a teleconference and live webcast, with a slide presentation, beginning at 10 a.m. Central Time on Tuesday, October 25, 2016, to discuss its 2016 third-quarter results. The accompanying slides will be available before the webcast on the Caterpillar website at http://www.caterpillar.com/investors/events-and-presentations. |
About Caterpillar:
For 91 years, Caterpillar Inc. has been making sustainable progress possible and driving positive change on every continent. Customers turn to Caterpillar to help them develop infrastructure, energy and natural resource assets. With 2015 sales and revenues of $47.011 billion, Caterpillar is the world’s leading manufacturer of construction and mining equipment, diesel and natural gas engines, industrial gas turbines and diesel-electric locomotives. The company principally operates through its three product segments - Construction Industries, Resource Industries and Energy & Transportation - and also provides financing and related services through its Financial Products segment. For more information, visit caterpillar.com. To connect with us on social media, visit caterpillar.com/social-media.
Caterpillar contact: Rachel Potts, 309-675-6892 (Office), 309-573-3444 (Mobile) or [email protected]
Forward-Looking Statements
Certain statements in this press release relate to future events and expectations and are forward-looking statements within the meaning of the Private Securities Litigation Reform Act of 1995. Words such as “believe,” “estimate,” “will be,” “will,” “would,” “expect,” “anticipate,” “plan,” “project,” “intend,” “could,” “should” or other similar words or expressions often identify forward-looking statements. All statements other than statements of historical fact are forward-looking statements, including, without limitation, statements regarding our outlook, projections, forecasts or trend descriptions. These statements do not guarantee future performance, and we do not undertake to update our forward-looking statements.
Caterpillar’s actual results may differ materially from those described or implied in our forward-looking statements based on a number of factors, including, but not limited to: (i) global and regional economic conditions and economic conditions in the industries we serve; (ii) government monetary or fiscal policies and infrastructure spending; (iii) commodity price changes, component price increases, fluctuations in demand for our products or significant shortages of component products; (iv) disruptions or volatility in global financial markets limiting our sources of liquidity or the liquidity of our customers, dealers and suppliers; (v) political and economic risks, commercial instability and events beyond our control in the countries in which we operate; (vi) failure to maintain our credit ratings and potential resulting increases to our cost of borrowing and adverse effects on our cost of funds, liquidity, competitive position and access to capital markets; (vii) our Financial Products segment’s risks associated with the financial services industry; (viii) changes in interest rates or market liquidity conditions; (ix) an increase in delinquencies, repossessions or net losses of Cat Financial’s customers; (x) new regulations or changes in financial services regulations; (xi) a failure to realize, or a delay in realizing, all of the anticipated benefits of our acquisitions, joint ventures or divestitures; (xii) international trade policies and their impact on demand for our products and our competitive position; (xiii) our ability to develop, produce and market quality products that meet our customers’ needs; (xiv) the impact of the highly competitive environment in which we operate on our sales and pricing; (xv) failure to realize all of the anticipated benefits from initiatives to increase our productivity, efficiency and cash flow and to reduce costs; (xvi) additional restructuring costs or a failure to realize anticipated savings or benefits from past or future cost reduction actions; (xvii) inventory management decisions and sourcing practices of our dealers and our OEM customers; (xviii) compliance with environmental laws and regulations; (xix) alleged or actual violations of trade or anti-corruption laws and regulations; (xx) additional tax expense or exposure; (xxi) currency fluctuations; (xxii) our or Cat Financial’s compliance with financial covenants; (xxiii) increased pension plan funding obligations; (xxiv) union disputes or other employee relations issues; (xxv) significant legal proceedings, claims, lawsuits or government investigations; (xxvi) changes in accounting standards; (xxvii) failure or breach of IT security; (xxviii) adverse effects of unexpected events including natural disasters; and (xxix) other factors described in more detail under “Item 1A. Risk Factors” in our Form 10-K filed with the SEC on February 16, 2016 for the year ended December 31, 2015.
(more)
5
CONSOLIDATED RESULTS
Consolidated Sales and Revenues
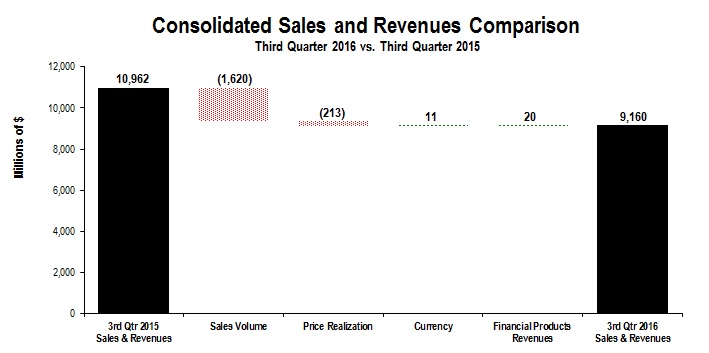
The chart above graphically illustrates reasons for the change in Consolidated Sales and Revenues between the third quarter of 2015 (at left) and the third quarter of 2016 (at right). Items favorably impacting sales and revenues appear as upward stair steps with the corresponding dollar amounts above each bar, while items negatively impacting sales and revenues appear as downward stair steps with dollar amounts reflected in parentheses above each bar. Caterpillar management utilizes these charts internally to visually communicate with the company’s Board of Directors and employees.
Sales and Revenues
Total sales and revenues were $9.160 billion in the third quarter of 2016, a decline of $1.802 billion, or 16 percent, compared with $10.962 billion in the third quarter of 2015. The decrease was primarily due to lower sales volume, resulting from lower end-user demand attributable to continued weak commodity prices globally and economic weakness in many developing countries. While sales for both new equipment and aftermarket parts declined in all segments, most of the decrease was for new equipment. The unfavorable impact of price realization also contributed to the decline.
Sales declined in all regions. In North America, sales decreased 20 percent primarily due to lower end-user demand for infrastructure, continuing declines in mining and the impact of low oil prices. In EAME, sales declined 20 percent primarily in Africa/Middle East due to weak economic conditions, resulting from continued low oil and other commodity prices and an uncertain investment environment. Sales decreased 22 percent in Latin America primarily due to continued widespread economic weakness across the region. Weak commodity prices and inflation have also contributed to the decline. Asia/Pacific sales declined 8 percent primarily due to lower end-user demand for most Energy & Transportation applications.
Energy & Transportation’s sales declined 19 percent largely due to lower end-user demand for all applications. Construction Industries’ sales decreased 13 percent primarily due to lower demand from end users and unfavorable price realization. Resource Industries’ sales declined 25 percent mostly due to continued low end-user demand. Financial Products’ segment revenues were about flat with the third quarter of 2015.
(more)
6
Consolidated Operating Profit
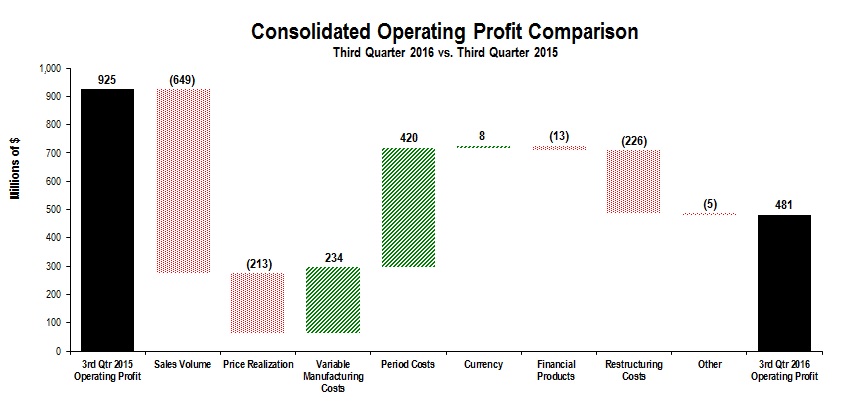
The chart above graphically illustrates reasons for the change in Consolidated Operating Profit (Loss) between the third quarter of 2015 (at left) and the third quarter of 2016 (at right). Items favorably impacting operating profit appear as upward stair steps with the corresponding dollar amounts above each bar, while items negatively impacting operating profit appear as downward stair steps with dollar amounts reflected in parentheses above each bar. Caterpillar management utilizes these charts internally to visually communicate with the company’s Board of Directors and employees. The bar entitled Other includes consolidating adjustments and Machinery, Energy & Transportation other operating (income) expenses.
Operating profit for the third quarter of 2016 was $481 million, compared with $925 million in the third quarter of 2015. The decrease of $444 million was primarily due to lower sales volume, resulting from lower end-user demand attributable to continued weak commodity prices globally and economic weakness in many developing countries. In addition, restructuring costs and price realization were unfavorable. These items were partially offset by favorable period costs and variable manufacturing costs. The unfavorable price realization resulted from competitive market conditions, primarily in Construction Industries.
Period costs were lower primarily due to substantial restructuring and cost reduction actions over the past year and lower short-term incentive compensation expense. The reductions primarily impacted period manufacturing costs and selling, general and administrative expenses (SG&A). About half of the improvement in variable manufacturing costs was due to lower material costs. In addition, the impact of cost absorption was favorable as inventory decreased in the third quarter of 2015 and was about flat in the third quarter of 2016.
Restructuring costs of $324 million in the third quarter of 2016 were related to restructuring programs across the company, primarily in Resource Industries. In the third quarter of 2015, restructuring costs were $98 million.
Other Profit/Loss Items
▪ | Other income/expense in the third quarter of 2016 was income of $28 million, compared with expense of $15 million in the third quarter of 2015. The favorable change was primarily due to the net impact from currency translation and hedging gains and losses, partially offset by lower gains from the sales of securities in the third quarter of 2016 compared to the third quarter of 2015. The favorable change in net currency translation and hedging gains and losses was primarily a result of the absence of net losses in the third quarter of 2015, mostly due to the Brazilian real. |
(more)
7
▪ | The provision for income taxes in the third quarter reflects an estimated annual tax rate of 25 percent, compared to 28 percent for the third quarter of 2015, and 25.5 percent for the full-year 2015 excluding discrete items. The full-year rate for 2015 of 25.5 percent was lower than the third-quarter 2015 rate of 28 percent, primarily due to the permanent renewal of the U.S. research and development tax credit along with changes in the geographic mix of profits from a tax perspective in the fourth quarter of 2015. |
Global Workforce
Caterpillar worldwide, full-time employment was about 97,100 at the end of the third quarter of 2016, compared with about 108,900 at the end of the third quarter of 2015, a decrease of about 11,800 full-time employees. The flexible workforce decreased by about 2,300 for a total decrease in the global workforce of about 14,100. The decrease was primarily the result of restructuring programs and lower production volumes.
September 30 | ||||||||
2016 | 2015 | Increase / (Decrease) | ||||||
Full-time employment | 97,100 | 108,900 | (11,800 | ) | ||||
Flexible workforce | 11,700 | 14,000 | (2,300 | ) | ||||
Total | 108,800 | 122,900 | (14,100 | ) | ||||
Geographic summary of change | ||||||||
U.S. workforce | (8,600 | ) | ||||||
Non-U.S. workforce | (5,500 | ) | ||||||
Total | (14,100 | ) | ||||||
(more)
8
SEGMENT RESULTS
Sales and Revenues by Geographic Region
(Millions of dollars) | Total | % Change | North America | % Change | Latin America | % Change | EAME | % Change | Asia/ Pacific | % Change | |||||||||||||||||||
Third Quarter 2016 | |||||||||||||||||||||||||||||
Construction Industries 1 | $ | 3,554 | (13)% | $ | 1,655 | (19)% | $ | 287 | (20)% | $ | 789 | (18)% | $ | 823 | 14% | ||||||||||||||
Resource Industries 2 | 1,377 | (25)% | 454 | (35)% | 254 | (19)% | 303 | (29)% | 366 | (8)% | |||||||||||||||||||
Energy & Transportation 3 | 3,534 | (19)% | 1,583 | (15)% | 280 | (25)% | 1,094 | (17)% | 577 | (28)% | |||||||||||||||||||
All Other Segments 4 | 28 | (28)% | 6 | (63)% | — | (100)% | 5 | (50)% | 17 | 70% | |||||||||||||||||||
Corporate Items and Eliminations | (30 | ) | — | (26 | ) | — | (3 | ) | (1 | ) | |||||||||||||||||||
Machinery, Energy & Transportation | $ | 8,463 | (18)% | $ | 3,672 | (20)% | $ | 821 | (22)% | $ | 2,188 | (20)% | $ | 1,782 | (8)% | ||||||||||||||
Financial Products Segment | $ | 749 | —% | $ | 466 | 3% | $ | 84 | (8)% | $ | 101 | —% | $ | 98 | (8)% | ||||||||||||||
Corporate Items and Eliminations | (52 | ) | (28 | ) | (10 | ) | (4 | ) | (10 | ) | |||||||||||||||||||
Financial Products Revenues | $ | 697 | 3% | $ | 438 | 9% | $ | 74 | (10)% | $ | 97 | 2% | $ | 88 | (11)% | ||||||||||||||
Consolidated Sales and Revenues | $ | 9,160 | (16)% | $ | 4,110 | (18)% | $ | 895 | (21)% | $ | 2,285 | (19)% | $ | 1,870 | (8)% | ||||||||||||||
Third Quarter 2015 | |||||||||||||||||||||||||||||
Construction Industries 1 | $ | 4,075 | $ | 2,037 | $ | 360 | $ | 958 | $ | 720 | |||||||||||||||||||
Resource Industries 2 | 1,842 | 702 | 312 | 429 | 399 | ||||||||||||||||||||||||
Energy & Transportation 3 | 4,352 | 1,858 | 371 | 1,326 | 797 | ||||||||||||||||||||||||
All Other Segments 4 | 39 | 16 | 3 | 10 | 10 | ||||||||||||||||||||||||
Corporate Items and Eliminations | (23 | ) | (25 | ) | — | 1 | 1 | ||||||||||||||||||||||
Machinery, Energy & Transportation | $ | 10,285 | $ | 4,588 | $ | 1,046 | $ | 2,724 | $ | 1,927 | |||||||||||||||||||
Financial Products Segment | $ | 752 | $ | 453 | $ | 91 | $ | 101 | $ | 107 | |||||||||||||||||||
Corporate Items and Eliminations | (75 | ) | (52 | ) | (9 | ) | (6 | ) | (8 | ) | |||||||||||||||||||
Financial Products Revenues | $ | 677 | $ | 401 | $ | 82 | $ | 95 | $ | 99 | |||||||||||||||||||
Consolidated Sales and Revenues | $ | 10,962 | $ | 4,989 | $ | 1,128 | $ | 2,819 | $ | 2,026 | |||||||||||||||||||
1 Does not include inter-segment sales of $27 million and $17 million in third quarter 2016 and 2015, respectively.
2 Does not include inter-segment sales of $69 million and $88 million in third quarter 2016 and 2015, respectively.
3 Does not include inter-segment sales of $629 million and $702 million in third quarter 2016 and 2015, respectively.
4 Does not include inter-segment sales of $95 million and $88 million in third quarter 2016 and 2015, respectively.
Sales and Revenues by Segment
(Millions of dollars) | Third Quarter 2015 | Sales Volume | Price Realization | Currency | Other | Third Quarter 2016 | $ Change | % Change | |||||||||||||||||||||
Construction Industries | $ | 4,075 | $ | (384 | ) | $ | (165 | ) | $ | 28 | $ | — | $ | 3,554 | $ | (521 | ) | (13)% | |||||||||||
Resource Industries | 1,842 | (439 | ) | (29 | ) | 3 | — | 1,377 | (465 | ) | (25)% | ||||||||||||||||||
Energy & Transportation | 4,352 | (777 | ) | (19 | ) | (22 | ) | — | 3,534 | (818 | ) | (19)% | |||||||||||||||||
All Other Segments | 39 | (11 | ) | — | — | — | 28 | (11 | ) | (28)% | |||||||||||||||||||
Corporate Items and Eliminations | (23 | ) | (9 | ) | — | 2 | — | (30 | ) | (7 | ) | ||||||||||||||||||
Machinery, Energy & Transportation | $ | 10,285 | $ | (1,620 | ) | $ | (213 | ) | $ | 11 | $ | — | $ | 8,463 | $ | (1,822 | ) | (18)% | |||||||||||
Financial Products Segment | 752 | — | — | — | (3 | ) | 749 | (3 | ) | —% | |||||||||||||||||||
Corporate Items and Eliminations | (75 | ) | — | — | — | 23 | (52 | ) | 23 | ||||||||||||||||||||
Financial Products Revenues | $ | 677 | $ | — | $ | — | $ | — | $ | 20 | $ | 697 | $ | 20 | 3% | ||||||||||||||
Consolidated Sales and Revenues | $ | 10,962 | $ | (1,620 | ) | $ | (213 | ) | $ | 11 | $ | 20 | $ | 9,160 | $ | (1,802 | ) | (16)% | |||||||||||
(more)
9
Operating Profit (Loss) by Segment
(Millions of dollars) | Third Quarter 2016 | Third Quarter 2015 | $ Change | % Change | |||||||||
Construction Industries | $ | 326 | $ | 354 | $ | (28 | ) | (8)% | |||||
Resource Industries | (77 | ) | (42 | ) | (35 | ) | (83)% | ||||||
Energy & Transportation | 572 | 683 | (111 | ) | (16)% | ||||||||
All Other Segments | (22 | ) | (11 | ) | (11 | ) | (100)% | ||||||
Corporate Items and Eliminations | (433 | ) | (182 | ) | (251 | ) | |||||||
Machinery, Energy & Transportation | $ | 366 | $ | 802 | $ | (436 | ) | (54)% | |||||
Financial Products Segment | 183 | 207 | (24 | ) | (12)% | ||||||||
Corporate Items and Eliminations | (12 | ) | (22 | ) | 10 | ||||||||
Financial Products | $ | 171 | $ | 185 | $ | (14 | ) | (8)% | |||||
Consolidating Adjustments | (56 | ) | (62 | ) | 6 | ||||||||
Consolidated Operating Profit (Loss) | $ | 481 | $ | 925 | $ | (444 | ) | (48)% | |||||
(more)
10
CONSTRUCTION INDUSTRIES
(Millions of dollars) | ||||||||||||||||||
Sales Comparison | ||||||||||||||||||
Third Quarter 2015 | Sales Volume | Price Realization | Currency | Third Quarter 2016 | $ Change | % Change | ||||||||||||
Sales Comparison 1 | $4,075 | ($384) | ($165) | $28 | $3,554 | ($521) | (13 | )% | ||||||||||
Sales by Geographic Region | ||||||||||||||||||
Third Quarter 2016 | Third Quarter 2015 | $ Change | % Change | |||||||||||||||
North America | $1,655 | $2,037 | ($382) | (19 | )% | |||||||||||||
Latin America | 287 | 360 | (73 | ) | (20 | )% | ||||||||||||
EAME | 789 | 958 | (169 | ) | (18 | )% | ||||||||||||
Asia/Pacific | 823 | 720 | 103 | 14 | % | |||||||||||||
Total 1 | $3,554 | $4,075 | ($521) | (13 | )% | |||||||||||||
Operating Profit | ||||||||||||||||||
Third Quarter 2016 | Third Quarter 2015 | $ Change | % Change | |||||||||||||||
Operating Profit | $326 | $354 | ($28) | (8 | )% | |||||||||||||
1 Does not include inter-segment sales of $27 million and $17 million in third quarter 2016 and 2015, respectively.
Construction Industries’ sales were $3.554 billion in the third quarter of 2016, a decrease of $521 million, or 13 percent, from the third quarter of 2015. The decrease in sales was due to lower volume and unfavorable price realization. While sales declined for both new equipment and aftermarket parts, most of the decrease was for new equipment.
▪ | Sales volume declined primarily due to lower end-user demand. |
▪ | Unfavorable price realization resulted from competitive market conditions. |
Sales decreased in North America, EAME and Latin America and increased in Asia/Pacific.
▪ | In North America, the sales decline was primarily due to lower end-user demand. Although residential and non-residential construction activity improved, we believe declines in other sectors, such as oil and gas, have resulted in the availability of used equipment to support the increased activity. The decline was also due to unfavorable price realization, resulting from competitive market conditions. |
▪ | Sales in EAME decreased primarily due to the unfavorable impact of changes in dealer inventories and unfavorable price realization due to competitive market conditions. Dealers decreased inventories in the third quarter of 2016, compared to a slight increase in the third quarter of 2015. The sales decline was primarily in oil-producing economies in Africa/Middle East due to continued low oil prices and an uncertain investment environment. |
▪ | In Latin America, end-user demand was down across the region, with the most significant decline in Brazil due to weak economic conditions. |
▪ | Sales in Asia/Pacific were slightly higher as a result of an increase in end-user demand primarily in China stemming from increased government support in infrastructure and residential investment. In addition, changes in Asia/Pacific dealer inventories were favorable as dealers increased inventories in the third quarter of 2016, compared to a decrease in the third quarter of 2015. |
(more)
11
Construction Industries’ profit was $326 million in the third quarter of 2016, compared with $354 million in the third quarter of 2015. The decrease in profit was primarily due to unfavorable price realization resulting from competitive market conditions and lower sales volume. The decline was mostly offset by the favorable impact of restructuring and cost reduction actions, lower short-term incentive compensation expense and improved material costs.
RESOURCE INDUSTRIES
(Millions of dollars) | ||||||||||||||||||
Sales Comparison | ||||||||||||||||||
Third Quarter 2015 | Sales Volume | Price Realization | Currency | Third Quarter 2016 | $ Change | % Change | ||||||||||||
Sales Comparison 1 | $1,842 | ($439) | ($29) | $3 | $1,377 | ($465) | (25 | )% | ||||||||||
Sales by Geographic Region | ||||||||||||||||||
Third Quarter 2016 | Third Quarter 2015 | $ Change | % Change | |||||||||||||||
North America | $454 | $702 | ($248) | (35 | )% | |||||||||||||
Latin America | 254 | 312 | (58 | ) | (19 | )% | ||||||||||||
EAME | 303 | 429 | (126 | ) | (29 | )% | ||||||||||||
Asia/Pacific | 366 | 399 | (33 | ) | (8 | )% | ||||||||||||
Total 1 | $1,377 | $1,842 | ($465) | (25 | )% | |||||||||||||
Operating Profit (Loss) | ||||||||||||||||||
Third Quarter 2016 | Third Quarter 2015 | $ Change | % Change | |||||||||||||||
Operating Profit (Loss) | ($77) | ($42) | ($35) | (83 | )% | |||||||||||||
1 Does not include inter-segment sales of $69 million and $88 million in third quarter 2016 and 2015, respectively.
Resource Industries’ sales were $1.377 billion in the third quarter of 2016, a decrease of $465 million, or 25 percent, from the third quarter of 2015. The decline was primarily due to lower sales volume. While sales for both new equipment and aftermarket parts declined, nearly all of the decrease was for new equipment. Part sales have increased sequentially in each of the last two quarters.
The sales decrease was primarily due to lower end-user demand across all regions. While commodity prices have improved from their recent lows, it is not clear at this time if the current prices are sufficient to drive increased demand for new equipment. Mining customers continued to focus on improving productivity in existing mines and reducing their total capital expenditures, as they have for several years. In addition, sales of large construction equipment, including articulated trucks, are lower primarily in North America. As a result, sales and new orders in Resource Industries continue to be weak.
Resource Industries incurred a loss of $77 million in the third quarter of 2016, compared with a loss of $42 million in the third quarter of 2015. The unfavorable change was due to lower sales volume and unfavorable price realization, partially offset by the impact of restructuring and cost reduction actions, lower short-term incentive compensation expense and improved material costs.
(more)
12
ENERGY & TRANSPORTATION
(Millions of dollars) | ||||||||||||||||||
Sales Comparison | ||||||||||||||||||
Third Quarter 2015 | Sales Volume | Price Realization | Currency | Third Quarter 2016 | $ Change | % Change | ||||||||||||
Sales Comparison 1 | $4,352 | ($777) | ($19) | ($22) | $3,534 | ($818) | (19 | )% | ||||||||||
Sales by Geographic Region | ||||||||||||||||||
Third Quarter 2016 | Third Quarter 2015 | $ Change | % Change | |||||||||||||||
North America | $1,583 | $1,858 | ($275) | (15 | )% | |||||||||||||
Latin America | 280 | 371 | (91 | ) | (25 | )% | ||||||||||||
EAME | 1,094 | 1,326 | (232 | ) | (17 | )% | ||||||||||||
Asia/Pacific | 577 | 797 | (220 | ) | (28 | )% | ||||||||||||
Total 1 | $3,534 | $4,352 | ($818) | (19 | )% | |||||||||||||
Operating Profit | ||||||||||||||||||
Third Quarter 2016 | Third Quarter 2015 | $ Change | % Change | |||||||||||||||
Operating Profit | $572 | $683 | ($111) | (16 | )% | |||||||||||||
1 Does not include inter-segment sales of $629 million and $702 million in third quarter 2016 and 2015, respectively.
Energy & Transportation’s sales were $3.534 billion in the third quarter of 2016, a decrease of $818 million, or 19 percent, from the third quarter of 2015. The decrease was primarily the result of lower sales volume across all applications.
▪ | Transportation - Sales decreased in all geographic regions primarily due to continued weakness in the rail industry, with the most significant declines in North America and Asia/Pacific. The North American rail industry continues to be depressed with a significant number of idle locomotives that impacted demand for rail services and aftermarket. In Asia/Pacific, the decrease was primarily due to the absence of a large sale of locomotives that occurred in the third quarter of 2015. |
▪ | Power Generation - Sales decreased in all regions with the largest declines in EAME and Asia/Pacific. The decline in EAME was primarily a result of continued weakness in the Middle East with continued low oil prices limiting investments. The decline in Asia/Pacific was due to the absence of several large projects that occurred in third quarter of 2015. |
▪ | Oil and Gas - Sales continued to decrease in much of the world due to low oil prices. The sales decline was most significant in Asia/Pacific and North America. In Asia/Pacific, the decrease was primarily due to lower demand for equipment used for production, drilling and gas compression. The decline in sales in North America was mostly due to lower demand for turbines used for production. |
▪ | Industrial - Sales were lower primarily in EAME and North America. The decline in sales was primarily due to lower end-user demand for most industrial applications. |
Energy & Transportation’s profit was $572 million in the third quarter of 2016, compared with $683 million in the third quarter of 2015. The decline was primarily due to a decrease in sales volume, partially offset by the impact of restructuring and cost reduction actions, improved material costs and a favorable impact of cost absorption as inventory decreased in the third quarter of 2015 and was about flat in the third quarter of 2016.
(more)
13
FINANCIAL PRODUCTS SEGMENT
(Millions of dollars) | |||||||||||||||||
Revenues by Geographic Region | |||||||||||||||||
Third Quarter 2016 | Third Quarter 2015 | $ Change | % Change | ||||||||||||||
North America | $466 | $453 | $13 | 3 | % | ||||||||||||
Latin America | 84 | 91 | (7 | ) | (8 | )% | |||||||||||
EAME | 101 | 101 | — | — | % | ||||||||||||
Asia/Pacific | 98 | 107 | (9 | ) | (8 | )% | |||||||||||
Total | $749 | $752 | ($3) | — | % | ||||||||||||
Operating Profit | |||||||||||||||||
Third Quarter 2016 | Third Quarter 2015 | $ Change | % Change | ||||||||||||||
Operating Profit | $183 | $207 | ($24) | (12 | )% | ||||||||||||
Financial Products’ revenues were $749 million in the third quarter of 2016, a decrease of $3 million, from the third quarter of 2015. Unfavorable impacts from returned or repossessed equipment, primarily in North America, and lower average earning assets in Latin America and Asia/Pacific were about offset by higher average financing rates, primarily in North America.
Financial Products’ profit was $183 million in the third quarter of 2016, compared with $207 million in the third quarter of 2015. The decrease was primarily due to lower gains on sales of securities at Insurance Services in the third quarter of 2016, compared to the third quarter of 2015.
At the end of the third quarter of 2016, past dues at Cat Financial were 2.77 percent, compared with 2.68 percent at the end of the third quarter of 2015. Write-offs, net of recoveries, were $29 million for the third quarter of 2016, compared with $69 million for the third quarter of 2015.
As of September 30, 2016, Cat Financial's allowance for credit losses totaled $346 million, or 1.28 percent of net finance receivables, compared with $348 million, or 1.26 percent of net finance receivables at September 30, 2015. The allowance for credit losses at year-end 2015 was $338 million, or 1.22 percent of net finance receivables.
Corporate Items and Eliminations
Expense for corporate items and eliminations was $445 million in the third quarter of 2016, an increase of $241 million from the third quarter of 2015. Corporate items and eliminations include: corporate-level expenses; restructuring costs; timing differences, as some expenses are reported in segment profit on a cash basis; retirement benefit costs other than service cost; currency differences for ME&T, as segment profit is reported using annual fixed exchange rates; cost of sales methodology differences as segments use a current cost methodology; and inter-segment eliminations.
The increase in expense from the third quarter of 2015 was primarily due to a $226 million increase in restructuring costs.
(more)
14
QUESTIONS AND ANSWERS
Q1: | Price realization was lower in the third quarter of 2016, compared with the third quarter of 2015, especially in Construction Industries. What do you expect for the remainder of the year? |
A: | While we expect to see a competitive pricing environment in the fourth quarter, driven by excess industry capacity and an overall weak economic environment, we are not expecting further deterioration from third-quarter levels in the fourth quarter. |
Q2: | Could you summarize the status of the restructuring actions announced on September 24, 2015? |
A: | On September 24, 2015, Caterpillar announced a significant restructuring and cost reduction initiative, with actions expected through 2018. It included plans to lower operating costs by about $1.5 billion annually once fully implemented, reduce the workforce by more than 10,000 people, consolidate or close more than 20 facilities and decrease manufacturing square footage by more than 10 percent. |
With our most recent restructuring and consolidation announcements, all significant actions included in the September 2015 announcement have been made public. Since September 2015, the company has announced the closure, consolidation or contemplated closure of nearly 30 facilities around the world, which would eliminate more than 11 percent of manufacturing square footage. Additionally, the company has reduced the global workforce by about 14,000, which resulted from a combination of restructuring actions and lower volume.
Through the first nine months of 2016, we reduced period costs, primarily period cost of sales and SG&A expense, by approximately $1.2 billion, compared with the first nine months of 2015. About $330 million of the decrease was a result of lower short-term incentive compensation expense. The remaining decrease of about $880 million was a result of ongoing restructuring and cost reduction actions, including those announced on September 24, 2015.
Q3: | Have you announced restructuring actions this year that were not related to your September 2015 announcement? |
A: | Yes. The ongoing weakness in many key end markets Caterpillar serves has resulted in more aggressive cost reduction and restructuring actions than we anticipated in our announcement last September. Over the past year, the company has taken additional restructuring actions, including ending production of on-highway vocational trucks and track drills; pursuing strategic alternatives, including a possible divestiture of room and pillar products; and consolidating two product development divisions within Resource Industries. Additional actions could still be taken as Caterpillar continues to align its cost structure with the economic conditions in its industries. |
Restructuring costs for 2016 are expected to be about $800 million, an increase from our expectation of $700 million during the second quarter of 2016. The increase is primarily due to asset write downs recognized in the third quarter resulting from additional restructuring actions in Resource Industries.
Q4: | Can you discuss changes in dealer inventories during 2016? |
A: | Changes in dealer inventories had a negative impact on sales in both the third quarter of 2016 and the third quarter of 2015. Dealer machine and engine inventories decreased about $700 million in the third quarter of 2016 and about $600 million in the third quarter of 2015. |
During the first nine months of 2016, dealer machine and engine inventories decreased about $800 million. We expect dealers will make substantial inventory reductions during the fourth quarter, resulting in lower year-end inventories in 2016, compared to 2015.
(more)
15
Q5: | Can you discuss changes to your order backlog? |
A: | At the end of the third quarter of 2016, the order backlog was $11.6 billion, a reduction of about $150 million from the end of the second quarter of 2016, with no significant changes in any segment. Compared to the third quarter of 2015, the order backlog has declined about $2.1 billion with decreases in all segments. |
Q6: | Can you comment on expense related to your 2016 short-term incentive compensation plans? |
A: | Short-term incentive compensation expense is directly related to financial and operational performance, measured against targets set annually. As a result of lowering the 2016 profit outlook, we expect full-year incentive compensation expense to be lower than our second-quarter estimate. As a result, no short-term incentive compensation expense was recognized in the third quarter of 2016. Third-quarter 2015 expense was about $120 million. Through the first nine months, 2016 short-term incentive compensation expense was about $200 million. |
For 2016, our outlook includes short-term incentive compensation expense of about $265 million. Full-year 2015 short-term incentive compensation expense was about $585 million.
Q7: | Can you give us an update on how Cat Financial is performing? |
A: | Cat Financial's portfolio continues to perform well overall despite ongoing weakness in many key end markets. Third-quarter 2016 past dues were 2.77 percent, compared with 2.68 percent in the third quarter of 2015, with current past dues remaining lower than historical averages. Write-offs in the third quarter of 2016 were $29 million, or 0.44 percent of the average retail portfolio, compared with $69 million, or 1.04 percent of the average retail portfolio in third quarter of 2015, and slightly below historical averages for the third quarter. We believe customer risk exposure is well managed, with a broad distribution of portfolio exposure across a global customer base. Cat Financial continues to work closely with its customers to provide financing support for new Caterpillar product purchases and to actively monitor global portfolio health. |
Q8: | Can you comment on your balance sheet and cash priorities? |
A: | The ME&T debt-to-capital ratio was 37.1 percent at the end of the third quarter of 2016, compared with 39.0 percent at the end of the second quarter. Our cash and liquidity positions remain strong with an enterprise cash balance of $6.1 billion as of September 30, 2016. ME&T operating cash flow for the third quarter of 2016 was $400 million, compared with $766 million in the third quarter of 2015. For 2016, we expect ME&T operating cash flow to exceed dividends and capital expenditures. Our cash deployment priorities are unchanged, and we remain focused on the continued strength of our balance sheet. |
Q9: | Do you expect 2017 funding for your pension and OPEB plans to increase substantially from 2016? |
A: | Through September 2016, we have contributed about $270 million to our pension and OPEB plans and we expect full-year contributions of about $350 million. We expect full-year contributions in 2017 to be about $550 million. |
Q10: Can you provide more information on the accounting change you made for pension and OPEB plans and the potential impact on 2016?
A: | Effective January 1, 2016, we made a change in accounting principle related to pension and OPEB plans. The expense recognized is essentially split into two components. The first component, annual benefits earned by employees along with interest cost on the liability and an expected return on plan assets, is recognized throughout the year. We consider this “ongoing” pension and OPEB expense. In the fourth quarter, we will recognize the second component, a mark-to-market adjustment, to reflect changes occurring during the year. Generally, changes in interest rates have the most significant impact on the mark-to-market adjustment. In years when interest rates drop, the present value of future benefit payments is higher and we incur a loss. In years when interest rates increase, the present value decreases and we incur a gain. The impact of changing interest rates can be volatile to earnings; however our pension and OPEB obligations will be paid through many years in the future and actual cash payments are expected to be relatively stable. Differences in actual versus expected |
(more)
16
investment performance of plan assets and changes in other economic and demographic factors also impact the adjustment.
While this year’s impact could change significantly over the next quarter, based on interest rates (which are lower than year-end 2015) and investment returns as of the end of the third quarter, the year-end impact would be negative to profit after tax by approximately $2 billion or $3.50 per share. This adjustment will have no impact on 2016 cash flow, our pension funding obligations or benefits paid to plan participants.
(more)
17
GLOSSARY OF TERMS
1. | All Other Segments - Primarily includes activities such as: the business strategy, product management, development, and manufacturing of filters and fluids, undercarriage, tires and rims, ground engaging tools, fluid transfer products, precision seals and rubber, and sealing and connecting components primarily for Cat® products; parts distribution; distribution services responsible for dealer development and administration including a wholly owned dealer in Japan, dealer portfolio management and ensuring the most efficient and effective distribution of machines, engines and parts; digital investments for new customer and dealer solutions that integrate data analytics with state-of-the art digital technologies while transforming the buying experience. |
2. | Consolidating Adjustments - Elimination of transactions between Machinery, Energy & Transportation and Financial Products. |
3. | Construction Industries - A segment primarily responsible for supporting customers using machinery in infrastructure, forestry and building construction applications. Responsibilities include business strategy, product design, product management and development, manufacturing, marketing and sales and product support. The product portfolio includes backhoe loaders, small wheel loaders, small track-type tractors, skid steer loaders, multi-terrain loaders, mini excavators, compact wheel loaders, telehandlers, select work tools, small, medium and large track excavators, wheel excavators, medium wheel loaders, compact track loaders, medium track-type tractors, track-type loaders, motor graders, pipelayers, forestry and paving products. |
4. | Currency - With respect to sales and revenues, currency represents the translation impact on sales resulting from changes in foreign currency exchange rates versus the U.S. dollar. With respect to operating profit, currency represents the net translation impact on sales and operating costs resulting from changes in foreign currency exchange rates versus the U.S. dollar. Currency includes the impact on sales and operating profit for the Machinery, Energy & Transportation lines of business only; currency impacts on Financial Products’ revenues and operating profit are included in the Financial Products’ portions of the respective analyses. With respect to other income/expense, currency represents the effects of forward and option contracts entered into by the company to reduce the risk of fluctuations in exchange rates (hedging) and the net effect of changes in foreign currency exchange rates on our foreign currency assets and liabilities for consolidated results (translation). |
5. | Debt-to-Capital Ratio - A key measure of Machinery, Energy & Transportation’s financial strength used by management. The metric is defined as Machinery, Energy & Transportation’s short-term borrowings, long-term debt due within one year and long-term debt due after one year (debt) divided by the sum of Machinery, Energy & Transportation’s debt and stockholders’ equity. Debt also includes Machinery, Energy & Transportation’s long-term borrowings from Financial Products. |
6. | EAME - A geographic region including Europe, Africa, the Middle East and the Commonwealth of Independent States (CIS). |
7. | Earning Assets - Assets consisting primarily of total finance receivables net of unearned income, plus equipment on operating leases, less accumulated depreciation at Cat Financial. |
8. | Energy & Transportation - A segment primarily responsible for supporting customers using reciprocating engines, turbines, diesel-electric locomotives and related parts across industries serving power generation, industrial, oil and gas and transportation applications, including marine and rail-related businesses. Responsibilities include business strategy, product design, product management and development, manufacturing, marketing and sales and product support of turbines and turbine-related services, reciprocating engine powered generator sets, integrated systems used in the electric power generation industry, reciprocating engines and integrated systems and solutions for the marine and oil and gas industries; reciprocating engines supplied to the industrial industry as well as Cat machinery; the remanufacturing of Cat engines and components and remanufacturing services for other companies; the business strategy, product design, product management and development, manufacturing, remanufacturing, leasing and service of diesel-electric locomotives and components and other rail-related products and services and product support of on-highway vocational trucks for North America. |
9. | Financial Products Segment - Provides financing to customers and dealers for the purchase and lease of Cat and other equipment, as well as some financing for Caterpillar sales to dealers. Financing plans include operating and finance leases, installment sale contracts, working capital loans and wholesale financing plans. The segment also provides various forms of insurance to customers and dealers to help support the purchase and lease of our equipment. Financial Products segment profit is determined on a pretax basis and includes other income/expense items. |
(more)
18
10. | Latin America - A geographic region including Central and South American countries and Mexico. |
11. | Lean Management - A holistic management system that uses a sequential cadence of principles to drive the highest quality and lowest total cost to achieve customer requirements. |
12. | Machinery, Energy & Transportation (ME&T) - Represents the aggregate total of Construction Industries, Resource Industries, Energy & Transportation and All Other Segments and related corporate items and eliminations. |
13. | Machinery, Energy & Transportation Other Operating (Income) Expenses - Comprised primarily of gains/losses on disposal of long-lived assets, gains/losses on divestitures and legal settlements and accruals. Restructuring costs classified as other operating expenses on the Results of Operations are presented separately on the Operating Profit Comparison. |
14. | Operating Profit Pull Through - A key metric used by management to measure the rate of operating profit change relative to the change in sales and revenues. The metric is defined as the change in operating profit divided by the change in sales and revenues. Excludes restructuring costs and mark-to-market gains or losses resulting from pension and OPEB plan remeasurements. |
15. | Pension and other postemployment benefit (OPEB) costs - The company’s defined benefit pension and postretirement benefit plans. |
16. | Period Costs - Includes period manufacturing costs, ME&T selling, general and administrative (SG&A) and research and development (R&D) expenses excluding the impact of currency and exit-related costs that are included in restructuring costs (see definition below). Period manufacturing costs support production but are defined as generally not having a direct relationship to short-term changes in volume. Examples include machinery and equipment repair, depreciation on manufacturing assets, facility support, procurement, factory scheduling, manufacturing planning and operations management. SG&A and R&D costs are not linked to the production of goods or services and include marketing, legal and financial services and the development of new and significant improvements in products or processes. |
17. | Price Realization - The impact of net price changes excluding currency and new product introductions. Price realization includes geographic mix of sales, which is the impact of changes in the relative weighting of sales prices between geographic regions. |
18. | Resource Industries - A segment primarily responsible for supporting customers using machinery in mining, quarry, waste, and material handling applications. Responsibilities include business strategy, product design, product management and development, manufacturing, marketing and sales and product support. The product portfolio includes large track-type tractors, large mining trucks, hard rock vehicles, longwall miners, electric rope shovels, draglines, hydraulic shovels, track and rotary drills, highwall miners, large wheel loaders, off-highway trucks, articulated trucks, wheel tractor scrapers, wheel dozers, landfill compactors, soil compactors, material handlers, continuous miners, scoops and haulers, hardrock continuous mining systems, select work tools, machinery components and electronics and control systems. In addition to equipment, Resource Industries also develops and sells technology to provide customers fleet management systems, equipment management analytics and autonomous machine capabilities. Resource Industries also manages areas that provide services to other parts of the company, including integrated manufacturing and research and development. |
19. | Restructuring Costs - Primarily costs for employee separation costs, long-lived asset impairments and contract terminations. These costs are included in Other Operating (Income) Expenses. Restructuring costs also include other exit-related costs primarily for accelerated depreciation and equipment relocation (primarily included in Cost of goods sold) and sales discounts and payments to dealers and customers related to discontinued products (included in Sales of ME&T). |
20. | Sales Volume - With respect to sales and revenues, sales volume represents the impact of changes in the quantities sold for Machinery, Energy & Transportation as well as the incremental revenue impact of new product introductions, including emissions-related product updates. With respect to operating profit, sales volume represents the impact of changes in the quantities sold for Machinery, Energy & Transportation combined with product mix as well as the net operating profit impact of new product introductions, including emissions-related product updates. Product mix represents the net operating profit impact of changes in the relative weighting of Machinery, Energy & Transportation sales with respect to total sales. |
21. | Variable Manufacturing Costs - Represents volume-adjusted costs excluding the impact of currency. Variable manufacturing costs are defined as having a direct relationship with the volume of production. This includes material costs, direct labor and other costs that vary directly with production volume such as freight, power to operate machines and supplies that are consumed in the manufacturing process. |
(more)
19
NON-GAAP FINANCIAL MEASURES
The following definition is provided for “non-GAAP financial measures” in connection with Regulation G issued by the Securities and Exchange Commission. The non-GAAP financial measures we use have no standardized meaning prescribed by U.S. GAAP and therefore are unlikely to be comparable to the calculation of similar measures for other companies. Management does not intend these items to be considered in isolation or substituted for the related GAAP measure.
Profit Per Share Excluding Restructuring Costs
We incurred restructuring costs in 2015 and in the first three quarters of 2016 and expect to incur additional restructuring costs in the fourth quarter of 2016. We believe it is important to separately quantify the profit per share impact of restructuring costs in order for our results and outlook to be meaningful to our readers as these costs are incurred in the current year to generate longer-term benefits. We have also provided 2015 profit per share excluding restructuring costs comparable to the 2016 presentation. Reconciliation of profit per share excluding restructuring costs to the most directly comparable GAAP measure, diluted profit per share, are as follows:
Third Quarter | 2016 Outlook | |||||||
2015 | 2016 | Previous 1 | Current 2 | |||||
Profit per share | $0.94 | $0.48 | $2.75 | $2.35 | ||||
Per share restructuring costs3 | $0.11 | $0.37 | $0.80 | $0.90 | ||||
Profit per share excluding restructuring costs | $1.05 | $0.85 | $3.55 | $3.25 | ||||
1 2016 Sales and Revenues Outlook in a range of $40.0-40.5 billion (as of July 26, 2016). Profit per share at midpoint. | ||||||||
2 2016 current outlook as of October 25, 2016. Sales and Revenues Outlook of about $39 billion. | ||||||||
1-2 2016 Outlook does not include any impact from mark-to-market gains or losses resulting from pension and OPEB plan remeasurements. See Q&A #10 on page 15 for further discussion. | ||||||||
3 At statutory tax rates. | ||||||||
Machinery, Energy & Transportation
Caterpillar defines Machinery, Energy & Transportation as it is presented in the supplemental data as Caterpillar Inc. and its subsidiaries with Financial Products accounted for on the equity basis. Machinery, Energy & Transportation information relates to the design, manufacture and marketing of our products. Financial Products’ information relates to the financing to customers and dealers for the purchase and lease of Caterpillar and other equipment. The nature of these businesses is different, especially with regard to the financial position and cash flow items. Caterpillar management utilizes this presentation internally to highlight these differences. We also believe this presentation will assist readers in understanding our business. Pages 20-28 reconcile Machinery, Energy & Transportation with Financial Products on the equity basis to Caterpillar Inc. consolidated financial information.
Caterpillar's latest financial results and outlook are also available via:
Telephone:
800-228-7717 (Inside the United States and Canada)
858-764-9492 (Outside the United States and Canada)
Internet:
http://www.caterpillar.com/en/investors.html
http://www.caterpillar.com/en/investors/quarterly-results.html (live broadcast/replays of quarterly conference call)
Caterpillar contact: Rachel Potts, 309-675-6892 (Office), 309-573-3444 (Mobile) or [email protected]
(more)
20
Caterpillar Inc.
Condensed Consolidated Statement of Results of Operations
(Unaudited)
(Dollars in millions except per share data)
Three Months Ended September 30, | Nine Months Ended September 30, | ||||||||||||||
2016 | 2015 | 2016 | 2015 | ||||||||||||
Sales and revenues: | |||||||||||||||
Sales of Machinery, Energy & Transportation | $ | 8,463 | $ | 10,285 | $ | 26,888 | $ | 33,829 | |||||||
Revenues of Financial Products | 697 | 677 | 2,075 | 2,152 | |||||||||||
Total sales and revenues | 9,160 | 10,962 | 28,963 | 35,981 | |||||||||||
Operating costs: | |||||||||||||||
Cost of goods sold | 6,527 | 7,872 | 20,768 | 25,306 | |||||||||||
Selling, general and administrative expenses | 992 | 1,129 | 3,203 | 3,696 | |||||||||||
Research and development expenses | 453 | 513 | 1,429 | 1,547 | |||||||||||
Interest expense of Financial Products | 147 | 142 | 447 | 440 | |||||||||||
Other operating (income) expenses | 560 | 381 | 1,356 | 1,032 | |||||||||||
Total operating costs | 8,679 | 10,037 | 27,203 | 32,021 | |||||||||||
Operating profit | 481 | 925 | 1,760 | 3,960 | |||||||||||
Interest expense excluding Financial Products | 126 | 127 | 385 | 381 | |||||||||||
Other income (expense) | 28 | (15 | ) | 112 | 107 | ||||||||||
Consolidated profit before taxes | 383 | 783 | 1,487 | 3,686 | |||||||||||
Provision (benefit) for income taxes | 96 | 218 | 372 | 1,074 | |||||||||||
Profit of consolidated companies | 287 | 565 | 1,115 | 2,612 | |||||||||||
Equity in profit (loss) of unconsolidated affiliated companies | (4 | ) | (3 | ) | (7 | ) | 1 | ||||||||
Profit of consolidated and affiliated companies | 283 | 562 | 1,108 | 2,613 | |||||||||||
Less: Profit (loss) attributable to noncontrolling interests | — | 3 | 4 | 7 | |||||||||||
Profit 1 | $ | 283 | $ | 559 | $ | 1,104 | $ | 2,606 | |||||||
Profit per common share | $ | 0.48 | $ | 0.95 | $ | 1.89 | $ | 4.36 | |||||||
Profit per common share — diluted 2 | $ | 0.48 | $ | 0.94 | $ | 1.88 | $ | 4.30 | |||||||
Weighted-average common shares outstanding (millions) | |||||||||||||||
– Basic | 584.7 | 588.4 | 583.8 | 597.9 | |||||||||||
– Diluted 2 | 589.6 | 594.8 | 588.7 | 605.3 | |||||||||||
Cash dividends declared per common share | $ | — | $ | — | $ | 1.54 | $ | 1.47 | |||||||
1 | Profit attributable to common stockholders. |
2 | Diluted by assumed exercise of stock-based compensation awards using the treasury stock method. |
(more)
21
Caterpillar Inc.
Condensed Consolidated Statement of Financial Position
(Unaudited)
(Millions of dollars)
September 30, 2016 | December 31, 2015 | ||||||
Assets | |||||||
Current assets: | |||||||
Cash and short-term investments | $ | 6,113 | $ | 6,460 | |||
Receivables – trade and other | 5,797 | 6,695 | |||||
Receivables – finance | 8,719 | 8,991 | |||||
Prepaid expenses and other current assets | 1,892 | 1,662 | |||||
Inventories | 9,478 | 9,700 | |||||
Total current assets | 31,999 | 33,508 | |||||
Property, plant and equipment – net | 15,680 | 16,090 | |||||
Long-term receivables – trade and other | 1,102 | 1,170 | |||||
Long-term receivables – finance | 13,835 | 13,651 | |||||
Noncurrent deferred and refundable income taxes | 2,579 | 2,489 | |||||
Intangible assets | 2,453 | 2,821 | |||||
Goodwill | 6,725 | 6,615 | |||||
Other assets | 2,029 | 1,998 | |||||
Total assets | $ | 76,402 | $ | 78,342 | |||
Liabilities | |||||||
Current liabilities: | |||||||
Short-term borrowings: | |||||||
Machinery, Energy & Transportation | $ | 263 | $ | 9 | |||
Financial Products | 6,702 | 6,958 | |||||
Accounts payable | 4,713 | 5,023 | |||||
Accrued expenses | 3,022 | 3,116 | |||||
Accrued wages, salaries and employee benefits | 1,286 | 1,994 | |||||
Customer advances | 1,161 | 1,146 | |||||
Dividends payable | — | 448 | |||||
Other current liabilities | 1,620 | 1,671 | |||||
Long-term debt due within one year: | |||||||
Machinery, Energy & Transportation | 553 | 517 | |||||
Financial Products | 5,970 | 5,360 | |||||
Total current liabilities | 25,290 | 26,242 | |||||
Long-term debt due after one year: | |||||||
Machinery, Energy & Transportation | 8,432 | 8,960 | |||||
Financial Products | 15,190 | 16,209 | |||||
Liability for postemployment benefits | 8,499 | 8,843 | |||||
Other liabilities | 3,276 | 3,203 | |||||
Total liabilities | 60,687 | 63,457 | |||||
Stockholders’ equity | |||||||
Common stock | 5,266 | 5,238 | |||||
Treasury stock | (17,544 | ) | (17,640 | ) | |||
Profit employed in the business | 29,450 | 29,246 | |||||
Accumulated other comprehensive income (loss) | (1,527 | ) | (2,035 | ) | |||
Noncontrolling interests | 70 | 76 | |||||
Total stockholders’ equity | 15,715 | 14,885 | |||||
Total liabilities and stockholders’ equity | $ | 76,402 | $ | 78,342 | |||
(more)
22
Caterpillar Inc.
Condensed Consolidated Statement of Cash Flow
(Unaudited)
(Millions of dollars)
Nine Months Ended September 30, | |||||||
2016 | 2015 | ||||||
Cash flow from operating activities: | |||||||
Profit of consolidated and affiliated companies | $ | 1,108 | $ | 2,613 | |||
Adjustments for non-cash items: | |||||||
Depreciation and amortization | 2,255 | 2,272 | |||||
Other | 640 | 323 | |||||
Changes in assets and liabilities, net of acquisitions and divestitures: | |||||||
Receivables – trade and other | 1,128 | 614 | |||||
Inventories | 331 | 840 | |||||
Accounts payable | (163 | ) | (893 | ) | |||
Accrued expenses | (153 | ) | (25 | ) | |||
Accrued wages, salaries and employee benefits | (727 | ) | (704 | ) | |||
Customer advances | (24 | ) | (36 | ) | |||
Other assets – net | (141 | ) | 96 | ||||
Other liabilities – net | (291 | ) | (236 | ) | |||
Net cash provided by (used for) operating activities | 3,963 | 4,864 | |||||
Cash flow from investing activities: | |||||||
Capital expenditures – excluding equipment leased to others | (807 | ) | (946 | ) | |||
Expenditures for equipment leased to others | (1,393 | ) | (1,251 | ) | |||
Proceeds from disposals of leased assets and property, plant and equipment | 572 | 473 | |||||
Additions to finance receivables | (6,911 | ) | (7,099 | ) | |||
Collections of finance receivables | 6,968 | 6,849 | |||||
Proceeds from sale of finance receivables | 55 | 101 | |||||
Investments and acquisitions (net of cash acquired) | (72 | ) | (140 | ) | |||
Proceeds from sale of businesses and investments (net of cash sold) | — | 174 | |||||
Proceeds from sale of securities | 304 | 238 | |||||
Investments in securities | (339 | ) | (296 | ) | |||
Other – net | 5 | (76 | ) | ||||
Net cash provided by (used for) investing activities | (1,618 | ) | (1,973 | ) | |||
Cash flow from financing activities: | |||||||
Dividends paid | (1,348 | ) | (1,309 | ) | |||
Distribution to noncontrolling interests | (8 | ) | (7 | ) | |||
Common stock issued, including treasury shares reissued | (54 | ) | 34 | ||||
Treasury shares purchased | — | (2,025 | ) | ||||
Excess tax benefit from stock-based compensation | 12 | 20 | |||||
Proceeds from debt issued (original maturities greater than three months) | 4,430 | 4,082 | |||||
Payments on debt (original maturities greater than three months) | (5,602 | ) | (6,772 | ) | |||
Short-term borrowings – net (original maturities three months or less) | (111 | ) | 1,922 | ||||
Net cash provided by (used for) financing activities | (2,681 | ) | (4,055 | ) | |||
Effect of exchange rate changes on cash | (11 | ) | (131 | ) | |||
Increase (decrease) in cash and short-term investments | (347 | ) | (1,295 | ) | |||
Cash and short-term investments at beginning of period | 6,460 | 7,341 | |||||
Cash and short-term investments at end of period | $ | 6,113 | $ | 6,046 | |||
All short-term investments, which consist primarily of highly liquid investments with original maturities of three months or less, are considered to be cash equivalents. |
(more)
23
Caterpillar Inc.
Supplemental Data for Results of Operations
For the Three Months Ended September 30, 2016
(Unaudited)
(Millions of dollars)
Supplemental Consolidating Data | |||||||||||||||||
Consolidated | Machinery, Energy & Transportation 1 | Financial Products | Consolidating Adjustments | ||||||||||||||
Sales and revenues: | |||||||||||||||||
Sales of Machinery, Energy & Transportation | $ | 8,463 | $ | 8,463 | $ | — | $ | — | |||||||||
Revenues of Financial Products | 697 | — | 768 | (71 | ) | 2 | |||||||||||
Total sales and revenues | 9,160 | 8,463 | 768 | (71 | ) | ||||||||||||
Operating costs: | |||||||||||||||||
Cost of goods sold | 6,527 | 6,528 | — | (1 | ) | 3 | |||||||||||
Selling, general and administrative expenses | 992 | 858 | 138 | (4 | ) | 3 | |||||||||||
Research and development expenses | 453 | 453 | — | — | |||||||||||||
Interest expense of Financial Products | 147 | — | 151 | (4 | ) | 4 | |||||||||||
Other operating (income) expenses | 560 | 258 | 308 | (6 | ) | 3 | |||||||||||
Total operating costs | 8,679 | 8,097 | 597 | (15 | ) | ||||||||||||
Operating profit | 481 | 366 | 171 | (56 | ) | ||||||||||||
Interest expense excluding Financial Products | 126 | 139 | — | (13 | ) | 4 | |||||||||||
Other income (expense) | 28 | (25 | ) | 10 | 43 | 5 | |||||||||||
Consolidated profit before taxes | 383 | 202 | 181 | — | |||||||||||||
Provision (benefit) for income taxes | 96 | 36 | 60 | — | |||||||||||||
Profit of consolidated companies | 287 | 166 | 121 | — | |||||||||||||
Equity in profit (loss) of unconsolidated affiliated companies | (4 | ) | (4 | ) | — | — | |||||||||||
Equity in profit of Financial Products’ subsidiaries | — | 120 | — | (120 | ) | 6 | |||||||||||
Profit of consolidated and affiliated companies | 283 | 282 | 121 | (120 | ) | ||||||||||||
Less: Profit (loss) attributable to noncontrolling interests | — | (1 | ) | 1 | — | ||||||||||||
Profit 7 | $ | 283 | $ | 283 | $ | 120 | $ | (120 | ) | ||||||||
1 | Represents Caterpillar Inc. and its subsidiaries with Financial Products accounted for on the equity basis. |
2 | Elimination of Financial Products’ revenues earned from Machinery, Energy & Transportation. |
3 | Elimination of net expenses recorded by Machinery, Energy & Transportation paid to Financial Products. |
4 | Elimination of interest expense recorded between Financial Products and Machinery, Energy & Transportation. |
5 | Elimination of discount recorded by Machinery, Energy & Transportation on receivables sold to Financial Products and of interest earned between Machinery, Energy & Transportation and Financial Products. |
6 | Elimination of Financial Products’ profit due to equity method of accounting. |
7 | Profit attributable to common stockholders. |
(more)
24
Caterpillar Inc.
Supplemental Data for Results of Operations
For the Three Months Ended September 30, 2015
(Unaudited)
(Millions of dollars)
Supplemental Consolidating Data | |||||||||||||||||
Consolidated | Machinery, Energy & Transportation 1 | Financial Products | Consolidating Adjustments | ||||||||||||||
Sales and revenues: | |||||||||||||||||
Sales of Machinery, Energy & Transportation | $ | 10,285 | $ | 10,285 | $ | — | $ | — | |||||||||
Revenues of Financial Products | 677 | — | 772 | (95 | ) | 2 | |||||||||||
Total sales and revenues | 10,962 | 10,285 | 772 | (95 | ) | ||||||||||||
Operating costs: | |||||||||||||||||
Cost of goods sold | 7,872 | 7,871 | — | 1 | 3 | ||||||||||||
Selling, general and administrative expenses | 1,129 | 1,015 | 139 | (25 | ) | 3 | |||||||||||
Research and development expenses | 513 | 513 | — | — | |||||||||||||
Interest expense of Financial Products | 142 | — | 144 | (2 | ) | 4 | |||||||||||
Other operating (income) expenses | 381 | 84 | 304 | (7 | ) | 3 | |||||||||||
Total operating costs | 10,037 | 9,483 | 587 | (33 | ) | ||||||||||||
Operating profit | 925 | 802 | 185 | (62 | ) | ||||||||||||
Interest expense excluding Financial Products | 127 | 138 | — | (11 | ) | 4 | |||||||||||
Other income (expense) | (15 | ) | (87 | ) | 21 | 51 | 5 | ||||||||||
Consolidated profit before taxes | 783 | 577 | 206 | — | |||||||||||||
Provision (benefit) for income taxes | 218 | 156 | 62 | — | |||||||||||||
Profit of consolidated companies | 565 | 421 | 144 | — | |||||||||||||
Equity in profit (loss) of unconsolidated affiliated companies | (3 | ) | (3 | ) | — | — | |||||||||||
Equity in profit of Financial Products’ subsidiaries | — | 144 | — | (144 | ) | 6 | |||||||||||
Profit of consolidated and affiliated companies | 562 | 562 | 144 | (144 | ) | ||||||||||||
Less: Profit (loss) attributable to noncontrolling interests | 3 | 3 | — | — | |||||||||||||
Profit 7 | $ | 559 | $ | 559 | $ | 144 | $ | (144 | ) | ||||||||
1 | Represents Caterpillar Inc. and its subsidiaries with Financial Products accounted for on the equity basis. |
2 | Elimination of Financial Products’ revenues earned from Machinery, Energy & Transportation. |
3 | Elimination of net expenses recorded by Machinery, Energy & Transportation paid to Financial Products. |
4 | Elimination of interest expense recorded between Financial Products and Machinery, Energy & Transportation. |
5 | Elimination of discount recorded by Machinery, Energy & Transportation on receivables sold to Financial Products and of interest earned between Machinery, Energy & Transportation and Financial Products. |
6 | Elimination of Financial Products’ profit due to equity method of accounting. |
7 | Profit attributable to common stockholders. |
(more)
25
Caterpillar Inc.
Supplemental Data for Results of Operations
For the Nine Months Ended September 30, 2016
(Unaudited)
(Millions of dollars)
Supplemental Consolidating Data | |||||||||||||||||
Consolidated | Machinery, Energy & Transportation 1 | Financial Products | Consolidating Adjustments | ||||||||||||||
Sales and revenues: | |||||||||||||||||
Sales of Machinery, Energy & Transportation | $ | 26,888 | $ | 26,888 | $ | — | $ | — | |||||||||
Revenues of Financial Products | 2,075 | — | 2,305 | (230 | ) | 2 | |||||||||||
Total sales and revenues | 28,963 | 26,888 | 2,305 | (230 | ) | ||||||||||||
Operating costs: | |||||||||||||||||
Cost of goods sold | 20,768 | 20,769 | — | (1 | ) | 3 | |||||||||||
Selling, general and administrative expenses | 3,203 | 2,794 | 424 | (15 | ) | 3 | |||||||||||
Research and development expenses | 1,429 | 1,429 | — | — | |||||||||||||
Interest expense of Financial Products | 447 | — | 458 | (11 | ) | 4 | |||||||||||
Other operating (income) expenses | 1,356 | 462 | 914 | (20 | ) | 3 | |||||||||||
Total operating costs | 27,203 | 25,454 | 1,796 | (47 | ) | ||||||||||||
Operating profit | 1,760 | 1,434 | 509 | (183 | ) | ||||||||||||
Interest expense excluding Financial Products | 385 | 422 | — | (37 | ) | 4 | |||||||||||
Other income (expense) | 112 | (72 | ) | 38 | 146 | 5 | |||||||||||
Consolidated profit before taxes | 1,487 | 940 | 547 | — | |||||||||||||
Provision (benefit) for income taxes | 372 | 198 | 174 | — | |||||||||||||
Profit of consolidated companies | 1,115 | 742 | 373 | — | |||||||||||||
Equity in profit (loss) of unconsolidated affiliated companies | (7 | ) | (7 | ) | — | — | |||||||||||
Equity in profit of Financial Products’ subsidiaries | — | 369 | — | (369 | ) | 6 | |||||||||||
Profit of consolidated and affiliated companies | 1,108 | 1,104 | 373 | (369 | ) | ||||||||||||
Less: Profit (loss) attributable to noncontrolling interests | 4 | — | 4 | — | |||||||||||||
Profit 7 | $ | 1,104 | $ | 1,104 | $ | 369 | $ | (369 | ) | ||||||||
1 | Represents Caterpillar Inc. and its subsidiaries with Financial Products accounted for on the equity basis. |
2 | Elimination of Financial Products’ revenues earned from Machinery, Energy & Transportation. |
3 | Elimination of net expenses recorded by Machinery, Energy & Transportation paid to Financial Products. |
4 | Elimination of interest expense recorded between Financial Products and Machinery, Energy & Transportation. |
5 | Elimination of discount recorded by Machinery, Energy & Transportation on receivables sold to Financial Products and of interest earned between Machinery, Energy & Transportation and Financial Products. |
6 | Elimination of Financial Products’ profit due to equity method of accounting. |
7 | Profit attributable to common stockholders. |
(more)
26
Caterpillar Inc.
Supplemental Data for Results of Operations
For the Nine Months Ended September 30, 2015
(Unaudited)
(Millions of dollars)
Supplemental Consolidating Data | |||||||||||||||||
Consolidated | Machinery, Energy & Transportation 1 | Financial Products | Consolidating Adjustments | ||||||||||||||
Sales and revenues: | |||||||||||||||||
Sales of Machinery, Energy & Transportation | $ | 33,829 | $ | 33,829 | $ | — | $ | — | |||||||||
Revenues of Financial Products | 2,152 | — | 2,390 | (238 | ) | 2 | |||||||||||
Total sales and revenues | 35,981 | 33,829 | 2,390 | (238 | ) | ||||||||||||
Operating costs: | |||||||||||||||||
Cost of goods sold | 25,306 | 25,306 | — | — | |||||||||||||
Selling, general and administrative expenses | 3,696 | 3,269 | 444 | (17 | ) | 3 | |||||||||||
Research and development expenses | 1,547 | 1,547 | — | — | |||||||||||||
Interest expense of Financial Products | 440 | — | 445 | (5 | ) | 4 | |||||||||||
Other operating (income) expenses | 1,032 | 149 | 903 | (20 | ) | 3 | |||||||||||
Total operating costs | 32,021 | 30,271 | 1,792 | (42 | ) | ||||||||||||
Operating profit | 3,960 | 3,558 | 598 | (196 | ) | ||||||||||||
Interest expense excluding Financial Products | 381 | 413 | — | (32 | ) | 4 | |||||||||||
Other income (expense) | 107 | (79 | ) | 22 | 164 | 5 | |||||||||||
Consolidated profit before taxes | 3,686 | 3,066 | 620 | — | |||||||||||||
Provision (benefit) for income taxes | 1,074 | 885 | 189 | — | |||||||||||||
Profit of consolidated companies | 2,612 | 2,181 | 431 | — | |||||||||||||
Equity in profit (loss) of unconsolidated affiliated companies | 1 | 1 | — | — | |||||||||||||
Equity in profit of Financial Products’ subsidiaries | — | 429 | — | (429 | ) | 6 | |||||||||||
Profit of consolidated and affiliated companies | 2,613 | 2,611 | 431 | (429 | ) | ||||||||||||
Less: Profit (loss) attributable to noncontrolling interests | 7 | 5 | 2 | — | |||||||||||||
Profit 7 | $ | 2,606 | $ | 2,606 | $ | 429 | $ | (429 | ) | ||||||||
1 | Represents Caterpillar Inc. and its subsidiaries with Financial Products accounted for on the equity basis. |
2 | Elimination of Financial Products’ revenues earned from Machinery, Energy & Transportation. |
3 | Elimination of net expenses recorded by Machinery, Energy & Transportation paid to Financial Products. |
4 | Elimination of interest expense recorded between Financial Products and Machinery, Energy & Transportation. |
5 | Elimination of discount recorded by Machinery, Energy & Transportation on receivables sold to Financial Products and of interest earned between Machinery, Energy & Transportation and Financial Products. |
6 | Elimination of Financial Products’ profit due to equity method of accounting. |
7 | Profit attributable to common stockholders. |
(more)
27
Caterpillar Inc.
Supplemental Data for Cash Flow
For the Nine Months Ended September 30, 2016
(Unaudited)
(Millions of dollars)
Supplemental Consolidating Data | ||||||||||||||||
Consolidated | Machinery, Energy & Transportation 1 | Financial Products | Consolidating Adjustments | |||||||||||||
Cash flow from operating activities: | ||||||||||||||||
Profit of consolidated and affiliated companies | $ | 1,108 | $ | 1,104 | $ | 373 | $ | (369 | ) | 2 | ||||||
Adjustments for non-cash items: | ||||||||||||||||
Depreciation and amortization | 2,255 | 1,591 | 664 | — | ||||||||||||
Undistributed profit of Financial Products | — | (362 | ) | — | 362 | 3 | ||||||||||
Other | 640 | 503 | (11 | ) | 148 | 4 | ||||||||||
Changes in assets and liabilities, net of acquisitions and divestitures: | ||||||||||||||||
Receivables - trade and other | 1,128 | 252 | 42 | 834 | 4, 5 | |||||||||||
Inventories | 331 | 335 | — | (4 | ) | 4 | ||||||||||
Accounts payable | (163 | ) | (130 | ) | 16 | (49 | ) | 4 | ||||||||
Accrued expenses | (153 | ) | (93 | ) | (60 | ) | — | |||||||||
Accrued wages, salaries and employee benefits | (727 | ) | (713 | ) | (14 | ) | — | |||||||||
Customer advances | (24 | ) | (24 | ) | — | — | ||||||||||
Other assets – net | (141 | ) | (278 | ) | 102 | 35 | 4 | |||||||||
Other liabilities – net | (291 | ) | (402 | ) | 146 | (35 | ) | 4 | ||||||||
Net cash provided by (used for) operating activities | 3,963 | 1,783 | 1,258 | 922 | ||||||||||||
Cash flow from investing activities: | ||||||||||||||||
Capital expenditures - excluding equipment leased to others | (807 | ) | (802 | ) | (6 | ) | 1 | 4 | ||||||||
Expenditures for equipment leased to others | (1,393 | ) | (56 | ) | (1,377 | ) | 40 | 4 | ||||||||
Proceeds from disposals of leased assets and property, plant and equipment | 572 | 89 | 510 | (27 | ) | 4 | ||||||||||
Additions to finance receivables | (6,911 | ) | — | (8,888 | ) | 1,977 | 5 | |||||||||
Collections of finance receivables | 6,968 | — | 9,308 | (2,340 | ) | 5 | ||||||||||
Net intercompany purchased receivables | — | — | 580 | (580 | ) | 5 | ||||||||||
Proceeds from sale of finance receivables | 55 | — | 55 | — | ||||||||||||
Net intercompany borrowings | — | (716 | ) | (999 | ) | 1,715 | 6 | |||||||||
Investments and acquisitions (net of cash acquired) | (72 | ) | (72 | ) | — | — | ||||||||||
Proceeds from sale of securities | 304 | 25 | 279 | — | ||||||||||||
Investments in securities | (339 | ) | (22 | ) | (317 | ) | — | |||||||||
Other – net | 5 | 15 | (17 | ) | 7 | 8 | ||||||||||
Net cash provided by (used for) investing activities | (1,618 | ) | (1,539 | ) | (872 | ) | 793 | |||||||||
Cash flow from financing activities: | ||||||||||||||||
Dividends paid | (1,348 | ) | (1,348 | ) | (7 | ) | 7 | 7 | ||||||||
Distribution to noncontrolling interests | (8 | ) | (8 | ) | — | — | ||||||||||
Common stock issued, including treasury shares reissued | (54 | ) | (54 | ) | 7 | (7 | ) | 8 | ||||||||
Excess tax benefit from stock-based compensation | 12 | 12 | — | — | ||||||||||||
Net intercompany borrowings | — | 999 | 716 | (1,715 | ) | 6 | ||||||||||
Proceeds from debt issued (original maturities greater than three months) | 4,430 | 6 | 4,424 | — | ||||||||||||
Payments on debt (original maturities greater than three months) | (5,602 | ) | (525 | ) | (5,077 | ) | — | |||||||||
Short-term borrowings – net (original maturities three months or less) | (111 | ) | 254 | (365 | ) | — | ||||||||||
Net cash provided by (used for) financing activities | (2,681 | ) | (664 | ) | (302 | ) | (1,715 | ) | ||||||||
Effect of exchange rate changes on cash | (11 | ) | (26 | ) | 15 | — | ||||||||||
Increase (decrease) in cash and short-term investments | (347 | ) | (446 | ) | 99 | — | ||||||||||
Cash and short-term investments at beginning of period | 6,460 | 5,340 | 1,120 | — | ||||||||||||
Cash and short-term investments at end of period | $ | 6,113 | $ | 4,894 | $ | 1,219 | $ | — | ||||||||
1 | Represents Caterpillar Inc. and its subsidiaries with Financial Products accounted for on the equity basis. |
2 | Elimination of Financial Products’ profit after tax due to equity method of accounting. |
3 | Elimination of non-cash adjustment for the undistributed earnings from Financial Products. |
4 | Elimination of non-cash adjustments and changes in assets and liabilities related to consolidated reporting. |
5 | Reclassification of Financial Products’ cash flow activity from investing to operating for receivables that arose from the sale of inventory. |
6 | Elimination of net proceeds and payments to/from Machinery, Energy & Transportation and Financial Products. |
7 | Elimination of dividend from Financial Products to Machinery, Energy & Transportation. |
8 | Elimination of change in investment and common stock related to Financial Products. |
(more)
28
Caterpillar Inc.
Supplemental Data for Cash Flow
For the Nine Months Ended September 30, 2015
(Unaudited)
(Millions of dollars)
Supplemental Consolidating Data | ||||||||||||||||
Consolidated | Machinery, Energy & Transportation 1 | Financial Products | Consolidating Adjustments | |||||||||||||
Cash flow from operating activities: | ||||||||||||||||
Profit of consolidated and affiliated companies | $ | 2,613 | $ | 2,611 | $ | 431 | $ | (429 | ) | 2 | ||||||
Adjustments for non-cash items: | ||||||||||||||||
Depreciation and amortization | 2,272 | 1,608 | 664 | — | ||||||||||||
Undistributed profit of Financial Products | — | (179 | ) | — | 179 | 3 | ||||||||||
Other | 323 | 221 | (92 | ) | 194 | 4 | ||||||||||
Changes in assets and liabilities, net of acquisitions and divestitures: | ||||||||||||||||
Receivables - trade and other | 614 | 342 | (65 | ) | 337 | 4, 5 | ||||||||||
Inventories | 840 | 845 | — | (5 | ) | 4 | ||||||||||
Accounts payable | (893 | ) | (988 | ) | 56 | 39 | 4 | |||||||||
Accrued expenses | (25 | ) | (41 | ) | 3 | 13 | 4 | |||||||||
Accrued wages, salaries and employee benefits | (704 | ) | (695 | ) | (9 | ) | — | |||||||||
Customer advances | (36 | ) | (36 | ) | — | — | ||||||||||
Other assets – net | 96 | 1 | 58 | 37 | 4 | |||||||||||
Other liabilities – net | (236 | ) | (243 | ) | 57 | (50 | ) | 4 | ||||||||
Net cash provided by (used for) operating activities | 4,864 | 3,446 | 1,103 | 315 | ||||||||||||
Cash flow from investing activities: | ||||||||||||||||
Capital expenditures - excluding equipment leased to others | (946 | ) | (938 | ) | (9 | ) | 1 | 4 | ||||||||
Expenditures for equipment leased to others | (1,251 | ) | (157 | ) | (1,116 | ) | 22 | 4 | ||||||||
Proceeds from disposals of leased assets and property, plant and equipment | 473 | 51 | 429 | (7 | ) | 4 | ||||||||||
Additions to finance receivables | (7,099 | ) | — | (9,434 | ) | 2,335 | 5, 8 | |||||||||
Collections of finance receivables | 6,849 | — | 9,001 | (2,152 | ) | 5 | ||||||||||
Net intercompany purchased receivables | — | — | 758 | (758 | ) | 5 | ||||||||||
Proceeds from sale of finance receivables | 101 | — | 101 | — | ||||||||||||
Net intercompany borrowings | — | (21 | ) | 1 | 20 | 6 | ||||||||||
Investments and acquisitions (net of cash acquired) | (140 | ) | (140 | ) | — | — | ||||||||||
Proceeds from sale of businesses and investments (net of cash sold) | 174 | 180 | — | (6 | ) | 8 | ||||||||||
Proceeds from sale of securities | 238 | 16 | 222 | — | ||||||||||||
Investments in securities | (296 | ) | (20 | ) | (276 | ) | — | |||||||||
Other – net | (76 | ) | (34 | ) | (42 | ) | — | |||||||||
Net cash provided by (used for) investing activities | (1,973 | ) | (1,063 | ) | (365 | ) | (545 | ) | ||||||||
Cash flow from financing activities: | ||||||||||||||||
Dividends paid | (1,309 | ) | (1,309 | ) | (250 | ) | 250 | 7 | ||||||||
Distribution to noncontrolling interests | (7 | ) | (7 | ) | — | — | ||||||||||
Common stock issued, including treasury shares reissued | 34 | 34 | — | — | ||||||||||||
Treasury shares purchased | (2,025 | ) | (2,025 | ) | — | — | ||||||||||
Excess tax benefit from stock-based compensation | 20 | 20 | — | — | ||||||||||||
Net intercompany borrowings | — | (1 | ) | 21 | (20 | ) | 6 | |||||||||
Proceeds from debt issued (original maturities greater than three months) | 4,082 | 3 | 4,079 | — | ||||||||||||
Payments on debt (original maturities greater than three months) | (6,772 | ) | (513 | ) | (6,259 | ) | — | |||||||||
Short-term borrowings – net (original maturities three months or less) | 1,922 | 5 | 1,917 | — | ||||||||||||
Net cash provided by (used for) financing activities | (4,055 | ) | (3,793 | ) | (492 | ) | 230 | |||||||||
Effect of exchange rate changes on cash | (131 | ) | (99 | ) | (32 | ) | — | |||||||||
Increase (decrease) in cash and short-term investments | (1,295 | ) | (1,509 | ) | 214 | — | ||||||||||
Cash and short-term investments at beginning of period | 7,341 | 6,317 | 1,024 | — | ||||||||||||
Cash and short-term investments at end of period | $ | 6,046 | $ | 4,808 | $ | 1,238 | $ | — | ||||||||
1 | Represents Caterpillar Inc. and its subsidiaries with Financial Products accounted for on the equity basis. |
2 | Elimination of Financial Products’ profit after tax due to equity method of accounting. |
3 | Elimination of non-cash adjustment for the undistributed earnings from Financial Products. |
4 | Elimination of non-cash adjustments and changes in assets and liabilities related to consolidated reporting. |
5 | Reclassification of Financial Products’ cash flow activity from investing to operating for receivables that arose from the sale of inventory. |
6 | Elimination of net proceeds and payments to/from Machinery, Energy & Transportation and Financial Products. |
7 | Elimination of dividend from Financial Products to Machinery, Energy & Transportation. |
8 | Elimination of proceeds received from Financial Products related to Machinery, Energy & Transportation’s sale of businesses and investments. |
Serious News for Serious Traders! Try StreetInsider.com Premium Free!
You May Also Be Interested In
- Caterpillar (CAT) April weekly option implied volatility into quarter results
- Marex Group plc Announces Pricing of Initial Public Offering
- Rubrik Announces Pricing of Upsized Initial Public Offering
Create E-mail Alert Related Categories
SEC FilingsSign up for StreetInsider Free!
Receive full access to all new and archived articles, unlimited portfolio tracking, e-mail alerts, custom newswires and RSS feeds - and more!
