Form 8-K C H ROBINSON WORLDWIDE For: Apr 26
UNITED STATES
SECURITIES AND EXCHANGE COMMISSION
WASHINGTON, D.C. 20549
FORM 8-K
CURRENT REPORT
PURSUANT TO SECTION 13 OR 15(d)
OF THE SECURITIES EXCHANGE ACT OF 1934
Date of Report: April 26, 2016
(Date of earliest event reported)
C.H. ROBINSON WORLDWIDE, INC.
(Exact name of registrant as specified in its charter)
Commission File Number: 000-23189
| Delaware | 41-1883630 | |
| (State or other jurisdiction of incorporation) |
(IRS Employer Identification No.) |
14701 Charlson Road, Eden Prairie, MN 55347
(Address of principal executive offices, including zip code)
(952) 937-8500
(Registrant’s telephone number, including area code)
Not Applicable
(Former name or former address, if changed since last report)
Check the appropriate box below if the Form 8-K filing is intended to simultaneously satisfy the filing obligation of the registrant under any of the following provisions:
| ¨ | Written communications pursuant to Rule 425 under the Securities Act (17 CFR 230.425) |
| ¨ | Soliciting material pursuant to Rule 14a-12 under the Exchange Act (17 CFR 240.14a-12) |
| ¨ | Pre-commencement communications pursuant to Rule 14d-2(b) under the Exchange Act (17 CFR 240.14d-2(b)) |
| ¨ | Pre-commencement communications pursuant to Rule 13e-4(c) under the Exchange Act (17 CFR 240.13e-4(c)) |
| Item 2.02. | Results of Operations and Financial Condition. |
The following information is being “furnished” in accordance with General Instruction B.2 of Form 8-K and shall not be deemed “filed” for purposes of Section 18 of the Securities Exchange Act of 1934, as amended (the “Exchange Act”), or otherwise subject to the liabilities of that section, nor shall it be deemed to be incorporated by reference in any filing under the Securities Act of 1933, as amended, or the Exchange Act, except as expressly set forth by specific reference in such filing.
Furnished herewith as Exhibits 99.1 and 99.2, respectively, and incorporated by reference herein are the text of C.H. Robinson Worldwide, Inc.’s announcement regarding its financial results for the quarter ended March 31, 2016 and its earnings conference call slides.
| Item 9.01 | Financial Statements and Exhibits. |
| (d) | Exhibits. |
| 99.1 | Press Release dated April 26, 2016 of C.H. Robinson Worldwide, Inc. | |
| 99.2 | Earnings conference call slides dated April 27, 2016. | |
SIGNATURE
Pursuant to the requirements of the Securities Exchange Act of 1934, the registrant has duly caused this report to be signed on its behalf by the undersigned hereunto duly authorized.
| C.H. ROBINSON WORLDWIDE, INC. | ||
| By: | /s/ Ben G. Campbell | |
| Ben G. Campbell Chief Legal Officer and Secretary | ||
Date: April 26, 2016
EXHIBIT INDEX
| 99.1 | Press Release dated April 26, 2016 of C.H. Robinson Worldwide, Inc. | |
| 99.2 | Earnings conference call slides dated April 27, 2016. | |
Exhibit 99.1
C.H. Robinson Worldwide, Inc.
14701 Charlson Road
Eden Prairie, Minnesota 55347
Andrew Clarke, Chief Financial Officer, (952) 683-3474
Tim Gagnon, Director, Investor Relations (952) 683-5007
FOR IMMEDIATE RELEASE
C.H. ROBINSON REPORTS FIRST QUARTER RESULTS
MINNEAPOLIS, April 26, 2016 – C.H. Robinson Worldwide, Inc. (“C.H. Robinson”) (NASDAQ: CHRW), today reported financial results for the quarter ended March 31, 2016. Summarized financial results are as follows (dollars in thousands, except per share data):
| Three months ended March 31, | ||||||||||||
| 2016 | 2015 | % change |
||||||||||
| Total revenues |
$ | 3,073,943 | $ | 3,300,890 | -6.9 | % | ||||||
| Net revenues: |
||||||||||||
| Transportation |
||||||||||||
| Truckload |
321,684 | 298,380 | 7.8 | % | ||||||||
| LTL |
91,293 | 85,370 | 6.9 | % | ||||||||
| Intermodal |
9,264 | 10,512 | -11.9 | % | ||||||||
| Ocean |
58,669 | 50,190 | 16.9 | % | ||||||||
| Air |
18,409 | 20,639 | -10.8 | % | ||||||||
| Customs |
10,724 | 10,263 | 4.5 | % | ||||||||
| Other logistics services |
24,023 | 19,791 | 21.4 | % | ||||||||
|
|
|
|
|
|||||||||
| Total transportation |
534,066 | 495,145 | 7.9 | % | ||||||||
| Sourcing |
29,269 | 29,965 | -2.3 | % | ||||||||
|
|
|
|
|
|||||||||
| Total net revenues |
563,335 | 525,110 | 7.3 | % | ||||||||
| Operating expenses |
364,383 | 343,185 | 6.2 | % | ||||||||
|
|
|
|
|
|||||||||
| Operating income |
198,952 | 181,925 | 9.4 | % | ||||||||
| Net income |
$ | 118,963 | $ | 106,476 | 11.7 | % | ||||||
|
|
|
|
|
|||||||||
| Diluted EPS |
$ | 0.83 | $ | 0.73 | 13.7 | % | ||||||
Our truckload net revenues increased 7.8 percent in the first quarter of 2016 compared to the first quarter of 2015. Our total truckload volumes increased approximately three percent in the first quarter of 2016. North American truckload volumes increased approximately four percent in the first quarter of 2016. Our truckload net revenue margin increased in the first quarter of 2016 compared to the first quarter of 2015, due primarily to lower transportation costs, excluding fuel. Additionally, the lower cost of fuel contributed to an increase in truckload net revenue margin. In North America, excluding the estimated impacts of the change in fuel, our average truckload rate per mile charged to our customers decreased approximately five percent in the first quarter of 2016 compared to the first quarter of 2015. In North America, our truckload transportation costs decreased approximately seven percent, excluding the estimated impacts of the change in fuel. These decreases were largely the result of available capacity in the market and a change in the mix of our business.
Our less-than-truckload (“LTL”) net revenues increased 6.9 percent in the first quarter of 2016 compared to the first quarter of 2015. LTL volumes increased approximately 10 percent in the first quarter of 2016 compared to the first quarter of 2015. Net revenue margin increased in the first quarter of 2016 compared to the first quarter of 2015.
(more)
C.H. Robinson Worldwide, Inc.
April 26, 2016
Page 2
Our intermodal net revenues decreased 11.9 percent in the first quarter of 2016 compared to the first quarter of 2015. During the first quarter of 2016, intermodal opportunities were negatively impacted by the lower cost truck market.
Our ocean transportation net revenues increased 16.9 percent in the first quarter of 2016 compared to the first quarter of 2015. The increase in net revenues was primarily due to increased net revenue margin and higher volumes.
Our air transportation net revenues decreased 10.8 percent in the first quarter of 2016 compared to the first quarter of 2015. The decrease was primarily due to lower prices, partially offset by margin expansion and volume increases.
Our customs net revenues increased 4.5 percent in the first quarter of 2016 compared to the first quarter of 2015. The increase was due to an increase in transaction volumes.
Our other logistics services revenues, which includes managed services, warehousing, and small parcel, increased 21.4 percent in the first quarter of 2016 compared to the first quarter of 2015 primarily from volume growth in managed services.
Sourcing net revenues decreased 2.3 percent in the first quarter of 2016 compared to the first quarter of 2015. This decrease was primarily due to an increase in product costs caused by adverse weather effects, partially offset by an increase in case volumes.
For the first quarter, operating expenses increased 6.2 percent to $364.4 million in 2016 from $343.2 million in 2015. Operating expenses as a percentage of net revenues decreased to 64.7 percent in the first quarter of 2016 from 65.4 percent in the first quarter of 2015.
For the first quarter, personnel expenses increased 8.8 percent to $277.5 million in 2016 from $255.1 million in 2015. For the first quarter, our average headcount grew 5.5 percent compared to the first quarter of 2015. Additionally, we recognized additional payroll tax expense in the first quarter of 2016 related to the delivery of previously vested restricted equity awards.
For the first quarter, other selling, general, and administrative expenses decreased 1.3 percent to $86.9 million in 2016 from $88.0 million in 2015. This decrease was primarily due to a decrease in the provision for doubtful accounts, partially offset by an increase in travel expenses.
Founded in 1905, C.H. Robinson Worldwide, Inc., is one of the largest non-asset based third party logistics companies in the world. C.H. Robinson is a global provider of multimodal transportation services and logistics solutions, currently serving over 110,000 active customers through a network of offices in North America, South America, Europe, and Asia. C.H. Robinson maintains one of the largest networks of motor carrier capacity in North America and works with approximately 68,000 transportation providers worldwide.
Except for the historical information contained herein, the matters set forth in this release are forward-looking statements that represent our expectations, beliefs, intentions or strategies concerning future events. These forward-looking statements are subject to certain risks and uncertainties that could cause actual results to differ materially from our historical experience or our present expectations, including, but not limited to such factors as changes in economic conditions, including uncertain consumer demand; changes in market demand and
(more)
C.H. Robinson Worldwide, Inc.
April 26, 2016
Page 3
pressures on the pricing for our services; competition and growth rates within the third party logistics industry; freight levels and increasing costs and availability of truck capacity or alternative means of transporting freight, and changes in relationships with existing truck, rail, ocean and air carriers; changes in our customer base due to possible consolidation among our customers; our ability to integrate the operations of acquired companies with our historic operations successfully; risks associated with litigation and insurance coverage; risks associated with operations outside of the U.S.; risks associated with the potential impacts of changes in government regulations; risks associated with the produce industry, including food safety and contamination issues; fuel prices and availability; the impact of war on the economy; and other risks and uncertainties detailed in our Annual and Quarterly Reports.
Any forward-looking statement speaks only as of the date on which such statement is made, and we undertake no obligation to update such statement to reflect events or circumstances arising after such date. All remarks made during our financial results conference call will be current at the time of the call and we undertake no obligation to update the replay.
Conference Call Information:
C.H. Robinson Worldwide First Quarter 2016 Earnings Conference Call
Wednesday, April 27, 2016 8:30 a.m. Eastern Time
The call will be limited to 60 minutes, including questions and answers. We invite call participants to submit questions in advance of the conference call and we will respond to as many of the questions as we can in the time allowed. To submit your question(s) in advance of the call, please email [email protected].
Presentation slides and a simultaneous live audio webcast of the conference call may be accessed through the Investor Relations link on C.H. Robinson’s website at www.chrobinson.com.
To participate in the conference call by telephone, please call ten minutes early by dialing: 800-946-0716
International callers dial +1-719-325-2312
Callers should reference the conference ID, which is 4928630
Webcast replay available through Investor Relations link at www.chrobinson.com
Telephone audio replay available until 11:30 a.m. Eastern Time on May 4, 2016: 888-203-1112;
passcode: 4928630#
International callers dial +1-719-457-0820
(more)
C.H. Robinson Worldwide, Inc.
April 26, 2016
Page 4
CONDENSED CONSOLIDATED STATEMENTS OF INCOME
(unaudited, in thousands, except per share data)
| Three months ended March 31, |
||||||||
| 2016 | 2015 | |||||||
| Revenues: |
||||||||
| Transportation |
$ | 2,713,688 | $ | 2,947,257 | ||||
| Sourcing |
360,255 | 353,633 | ||||||
|
|
|
|
|
|||||
| Total revenues |
3,073,943 | 3,300,890 | ||||||
|
|
|
|
|
|||||
| Costs and expenses: |
||||||||
| Purchased transportation and related services |
2,179,622 | 2,452,112 | ||||||
| Purchased products sourced for resale |
330,986 | 323,668 | ||||||
| Personnel expenses |
277,497 | 255,144 | ||||||
| Other selling, general, and administrative expenses |
86,886 | 88,041 | ||||||
|
|
|
|
|
|||||
| Total costs and expenses |
2,874,991 | 3,118,965 | ||||||
|
|
|
|
|
|||||
| Income from operations |
198,952 | 181,925 | ||||||
|
|
|
|
|
|||||
| Interest and other expense |
(8,772 | ) | (9,605 | ) | ||||
|
|
|
|
|
|||||
| Income before provision for income taxes |
190,180 | 172,320 | ||||||
| Provision for income taxes |
71,217 | 65,844 | ||||||
|
|
|
|
|
|||||
| Net income |
$ | 118,963 | $ | 106,476 | ||||
|
|
|
|
|
|||||
| Net income per share (basic) |
$ | 0.83 | $ | 0.73 | ||||
| Net income per share (diluted) |
$ | 0.83 | $ | 0.73 | ||||
| Weighted average shares outstanding (basic) |
143,525 | 146,204 | ||||||
| Weighted average shares outstanding (diluted) |
143,658 | 146,383 | ||||||
(more)
C.H. Robinson Worldwide, Inc.
April 26, 2016
Page 5
CONDENSED CONSOLIDATED BALANCE SHEETS
(unaudited, in thousands)
| March 31, 2016 |
December 31, 2015 |
|||||||
| Assets |
||||||||
| Current assets: |
||||||||
| Cash and cash equivalents |
$ | 179,406 | $ | 168,229 | ||||
| Receivables, net |
1,463,240 | 1,505,620 | ||||||
| Other current assets |
63,070 | 56,849 | ||||||
|
|
|
|
|
|||||
| Total current assets |
1,705,716 | 1,730,698 | ||||||
| Property and equipment, net |
195,920 | 190,874 | ||||||
| Intangible and other assets |
1,260,609 | 1,262,786 | ||||||
|
|
|
|
|
|||||
| Total assets |
$ | 3,162,245 | $ | 3,184,358 | ||||
|
|
|
|
|
|||||
| Liabilities and stockholders’ investment |
||||||||
| Current liabilities: |
||||||||
| Accounts payable and outstanding checks |
$ | 761,085 | $ | 783,883 | ||||
| Accrued compensation |
61,246 | 146,666 | ||||||
| Accrued income taxes |
32,589 | 12,573 | ||||||
| Other accrued expenses |
47,135 | 55,475 | ||||||
| Current portion of debt |
470,000 | 450,000 | ||||||
|
|
|
|
|
|||||
| Total current liabilities |
1,372,055 | 1,448,597 | ||||||
| Noncurrent income taxes payable |
18,523 | 19,634 | ||||||
| Deferred tax liabilities |
79,653 | 65,460 | ||||||
| Long-term debt |
500,000 | 500,000 | ||||||
| Other long term liabilities |
208 | 217 | ||||||
|
|
|
|
|
|||||
| Total liabilities |
1,970,439 | 2,033,908 | ||||||
| Total stockholders’ investment |
1,191,806 | 1,150,450 | ||||||
|
|
|
|
|
|||||
| Total liabilities and stockholders’ investment |
$ | 3,162,245 | $ | 3,184,358 | ||||
|
|
|
|
|
|||||
(more)
C.H. Robinson Worldwide, Inc.
April 26, 2016
Page 6
CONDENSED CONSOLIDATED STATEMENT OF CASH FLOWS
(unaudited, in thousands, except operational data)
| Three months ended March 31, |
||||||||
| 2016 | 2015 | |||||||
| Operating activities: |
||||||||
| Net income |
$ | 118,963 | $ | 106,476 | ||||
| Stock-based compensation |
15,179 | 15,336 | ||||||
| Depreciation and amortization |
16,875 | 16,243 | ||||||
| Provision for doubtful accounts |
85 | 3,991 | ||||||
| Deferred income taxes |
15,350 | 426 | ||||||
| Other |
180 | 429 | ||||||
| Changes in operating elements, net of acquisitions: |
||||||||
| Receivables |
42,295 | (27,599 | ) | |||||
| Prepaid expenses and other |
(7,378 | ) | (12,639 | ) | ||||
| Other non-current assets |
— | 1,435 | ||||||
| Accounts payable and outstanding checks |
(22,783 | ) | 21,105 | |||||
| Accrued compensation and profit-sharing contribution |
(84,431 | ) | (64,709 | ) | ||||
| Accrued income taxes |
18,905 | 48,390 | ||||||
| Other accrued liabilities |
(9,090 | ) | (8,489 | ) | ||||
|
|
|
|
|
|||||
| Net cash provided by operating activities |
104,150 | 100,395 | ||||||
| Investing activities: |
||||||||
| Purchases of property and equipment |
(13,121 | ) | (3,895 | ) | ||||
| Purchases and development of software |
(4,704 | ) | (2,771 | ) | ||||
| Restricted cash |
— | 359,388 | ||||||
| Acquisitions, net of cash |
— | (369,143 | ) | |||||
| Other |
(770 | ) | 462 | |||||
|
|
|
|
|
|||||
| Net cash used for investing activities |
(18,595 | ) | (15,959 | ) | ||||
| Financing activities: |
||||||||
| Borrowings on line of credit |
1,480,000 | 2,025,000 | ||||||
| Repayments on line of credit |
(1,460,000 | ) | (2,000,000 | ) | ||||
| Net repurchases of common stock |
(46,529 | ) | (40,340 | ) | ||||
| Excess tax benefit on stock-based compensation |
13,827 | 4,842 | ||||||
| Cash dividends |
(63,888 | ) | (57,335 | ) | ||||
|
|
|
|
|
|||||
| Net cash used for financing activities |
(76,590 | ) | (67,833 | ) | ||||
| Effect of exchange rates on cash |
2,212 | (9,760 | ) | |||||
|
|
|
|
|
|||||
| Net change in cash and cash equivalents |
11,177 | 6,843 | ||||||
| Cash and cash equivalents, beginning of period |
168,229 | 128,940 | ||||||
|
|
|
|
|
|||||
| Cash and cash equivalents, end of period |
$ | 179,406 | $ | 135,783 | ||||
|
|
|
|
|
|||||
| As of March 31, | ||||||||
| 2016 | 2015 | |||||||
| Operational Data: |
||||||||
| Employees |
13,343 | 12,632 | ||||||
###

Earnings Conference Call – First Quarter 2016 April 27, 2016 John Wiehoff, Chairman & CEO Andrew Clarke, CFO Tim Gagnon, Director, Investor Relations Exhibit 99.2
Safe Harbor Statement Except for the historical information contained herein, the matters set forth in this presentation and the accompanying earnings release are forward-looking statements that represent our expectations, beliefs, intentions or strategies concerning future events. These forward-looking statements are subject to certain risks and uncertainties that could cause actual results to differ materially from our historical experience or our present expectations, including, but not limited to such factors as changes in economic conditions, including uncertain consumer demand; changes in market demand and pressures on the pricing for our services; competition and growth rates within the fourth party logistics industry; freight levels and increasing costs and availability of truck capacity or alternative means of transporting freight, and changes in relationships with existing truck, rail, ocean and air carriers; changes in our customer base due to possible consolidation among our customers; our ability to integrate the operations of acquired companies with our historic operations successfully; risks associated with litigation and insurance coverage; risks associated with operations outside of the U.S.; risks associated with the potential impacts of changes in government regulations; risks associated with the produce industry, including food safety and contamination issues; fuel prices and availability; changes to our share repurchase activity; the impact of war on the economy; and other risks and uncertainties detailed in our Annual and Quarterly Reports.
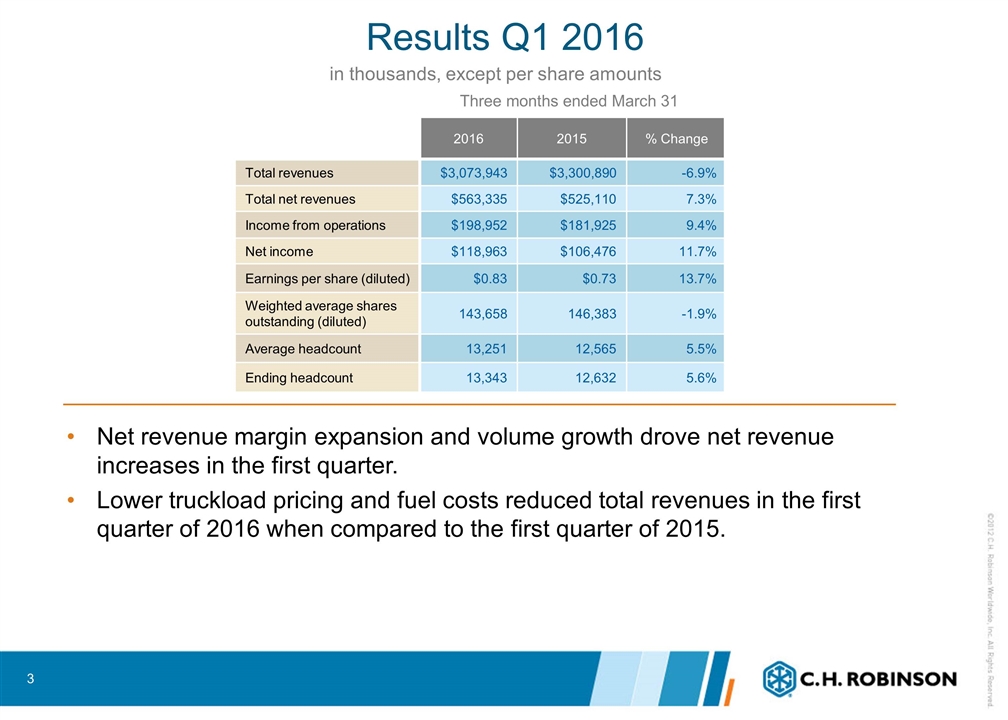
Results Q1 2016 in thousands, except per share amounts Net revenue margin expansion and volume growth drove net revenue increases in the first quarter. Lower truckload pricing and fuel costs reduced total revenues in the first quarter of 2016 when compared to the first quarter of 2015. Three months ended March 31 2016 2015 % Change Total revenues $3,073,943 $3,300,890 -6.9% Total net revenues $563,335 $525,110 7.3% Income from operations $198,952 $181,925 9.4% Net income $118,963 $106,476 11.7% Earnings per share (diluted) $0.83 $0.73 13.7% Weighted average shares outstanding (diluted) 143,658 146,383 -1.9% Average headcount 13,251 12,565 5.5% Ending headcount 13,343 12,632 5.6%
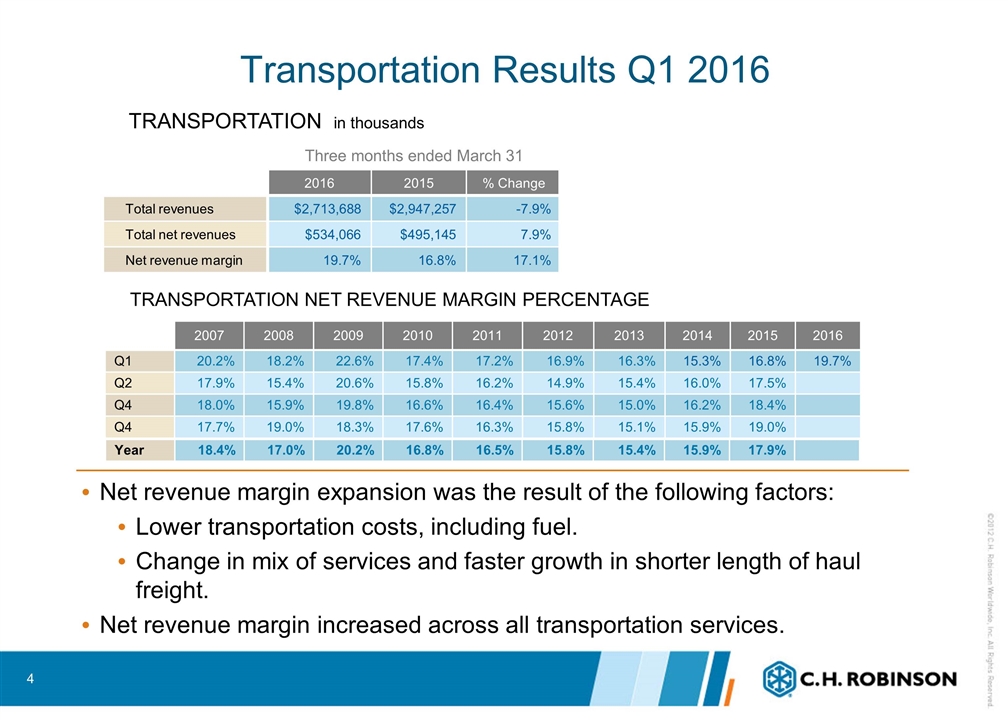
Transportation Results Q1 2016 Net revenue margin expansion was the result of the following factors: Lower transportation costs, including fuel. Change in mix of services and faster growth in shorter length of haul freight. Net revenue margin increased across all transportation services. TRANSPORTATION in thousands TRANSPORTATION NET REVENUE MARGIN PERCENTAGE 2007 2008 2009 2010 2011 2012 2013 2014 2015 2016 Q1 20.2% 18.2% 22.6% 17.4% 17.2% 16.9% 16.3% 15.3% 16.8% 19.7% Q2 17.9% 15.4% 20.6% 15.8% 16.2% 14.9% 15.4% 16.0% 17.5% Q4 18.0% 15.9% 19.8% 16.6% 16.4% 15.6% 15.0% 16.2% 18.4% Q4 17.7% 19.0% 18.3% 17.6% 16.3% 15.8% 15.1% 15.9% 19.0% Year 18.4% 17.0% 20.2% 16.8% 16.5% 15.8% 15.4% 15.9% 17.9% 2016 2015 % Change Total revenues $2,713,688 $2,947,257 -7.9% Total net revenues $534,066 $495,145 7.9% Net revenue margin 19.7% 16.8% 17.1% Three months ended March 31
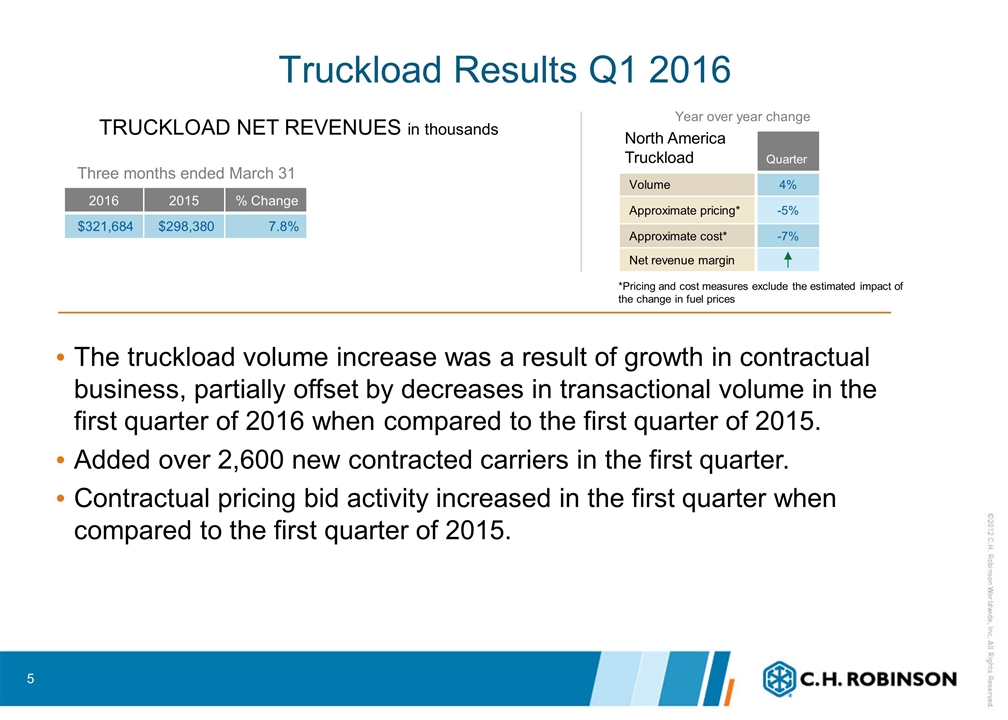
Truckload Results Q1 2016 TRUCKLOAD NET REVENUES in thousands North America Truckload The truckload volume increase was a result of growth in contractual business, partially offset by decreases in transactional volume in the first quarter of 2016 when compared to the first quarter of 2015. Added over 2,600 new contracted carriers in the first quarter. Contractual pricing bid activity increased in the first quarter when compared to the first quarter of 2015. 2016 2015 % Change $321,684 $298,380 7.8% Three months ended March 31 Year over year change *Pricing and cost measures exclude the estimated impact of the change in fuel prices Quarter Volume 4% Approximate pricing* -5% Approximate cost* -7% Net revenue margin
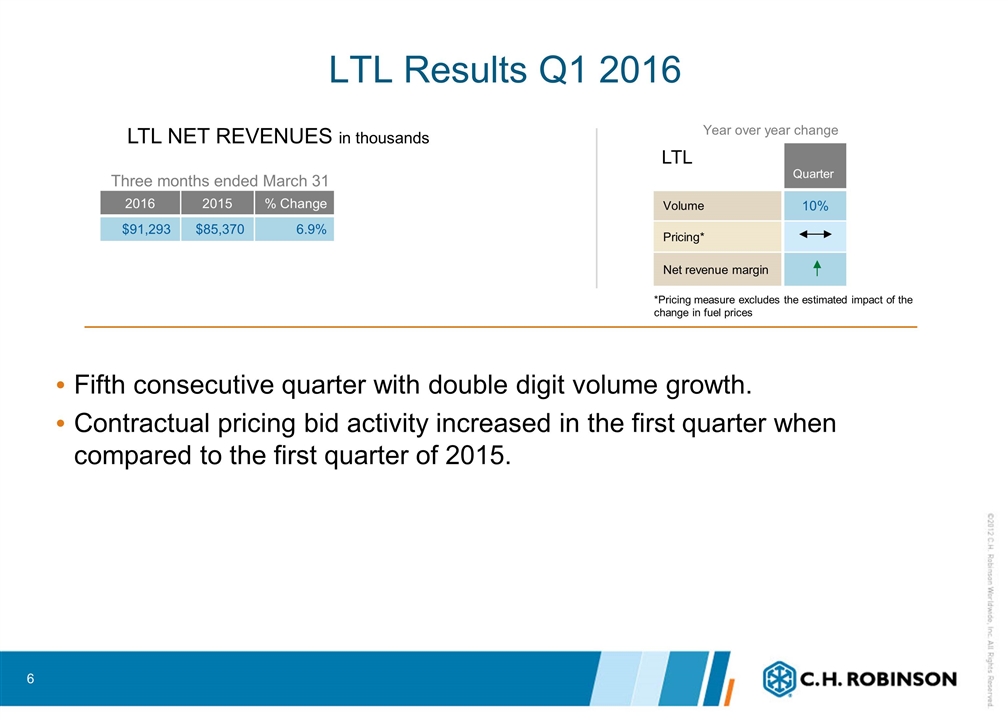
LTL Results Q1 2016 LTL NET REVENUES in thousands LTL Fifth consecutive quarter with double digit volume growth. Contractual pricing bid activity increased in the first quarter when compared to the first quarter of 2015. 2016 2015 % Change $91,293 $85,370 6.9% Three months ended March 31 Year over year change Quarter Volume 10% Pricing* Net revenue margin *Pricing measure excludes the estimated impact of the change in fuel prices
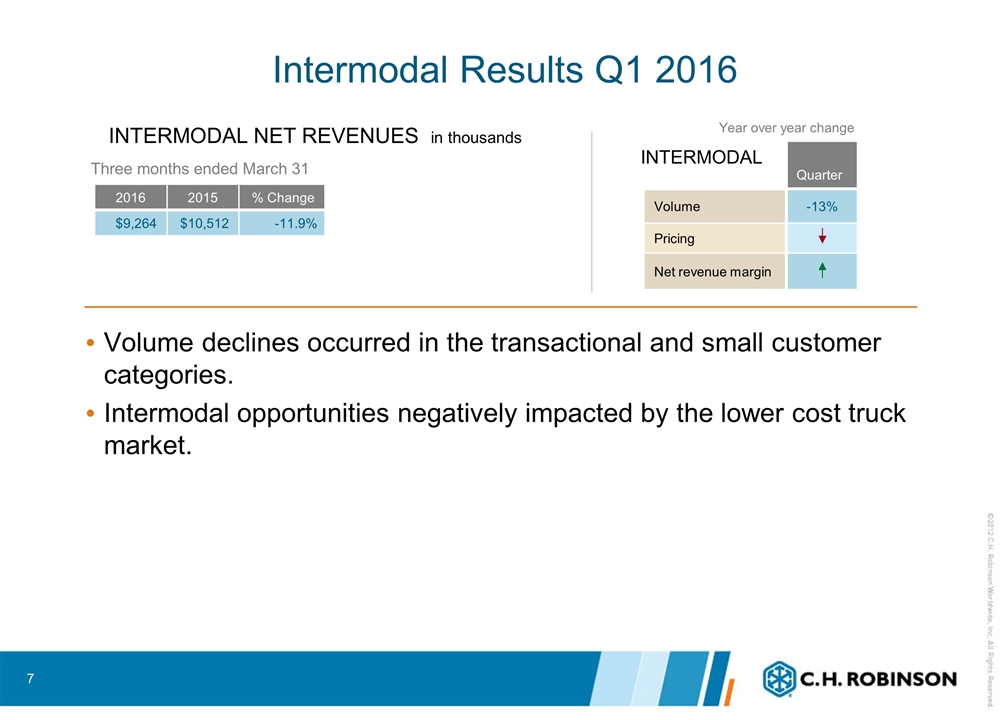
Intermodal Results Q1 2016 Volume declines occurred in the transactional and small customer categories. Intermodal opportunities negatively impacted by the lower cost truck market. INTERMODAL NET REVENUES in thousands INTERMODAL 2016 2015 % Change $9,264 $10,512 -11.9% Three months ended March 31 Year over year change Quarter Volume -13% Pricing Net revenue margin
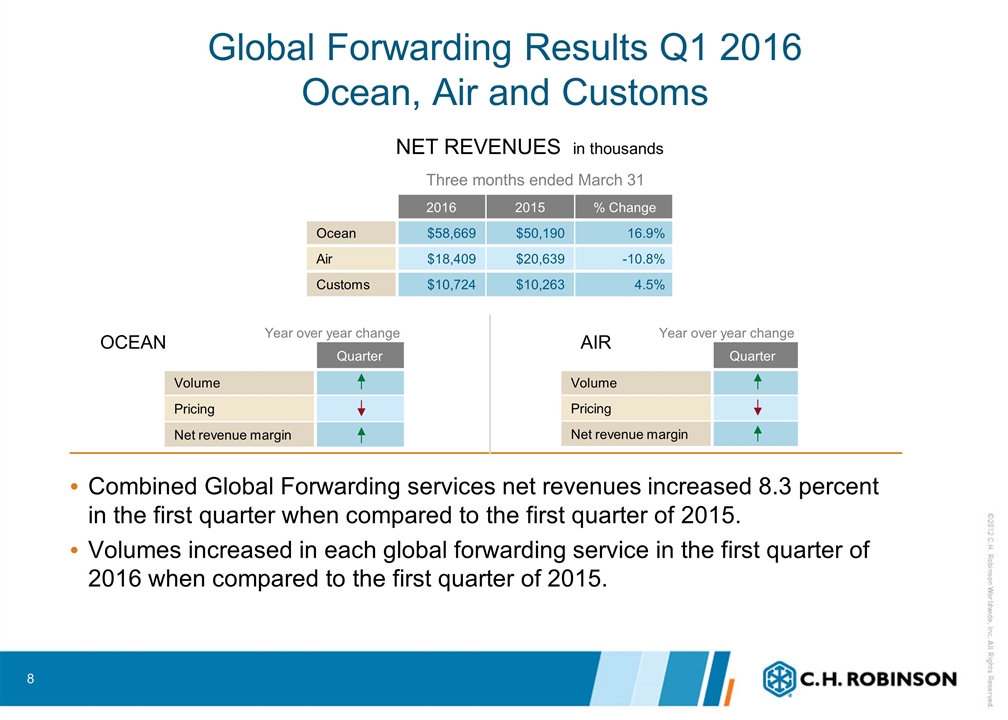
Global Forwarding Results Q1 2016 Ocean, Air and Customs NET REVENUES in thousands OCEAN AIR Combined Global Forwarding services net revenues increased 8.3 percent in the first quarter when compared to the first quarter of 2015. Volumes increased in each global forwarding service in the first quarter of 2016 when compared to the first quarter of 2015. 2016 2015 % Change Ocean $58,669 $50,190 16.9% Air $18,409 $20,639 -10.8% Customs $10,724 $10,263 4.5% Three months ended March 31 Quarter Volume Pricing Net revenue margin Quarter Volume Pricing Net revenue margin Year over year change Year over year change
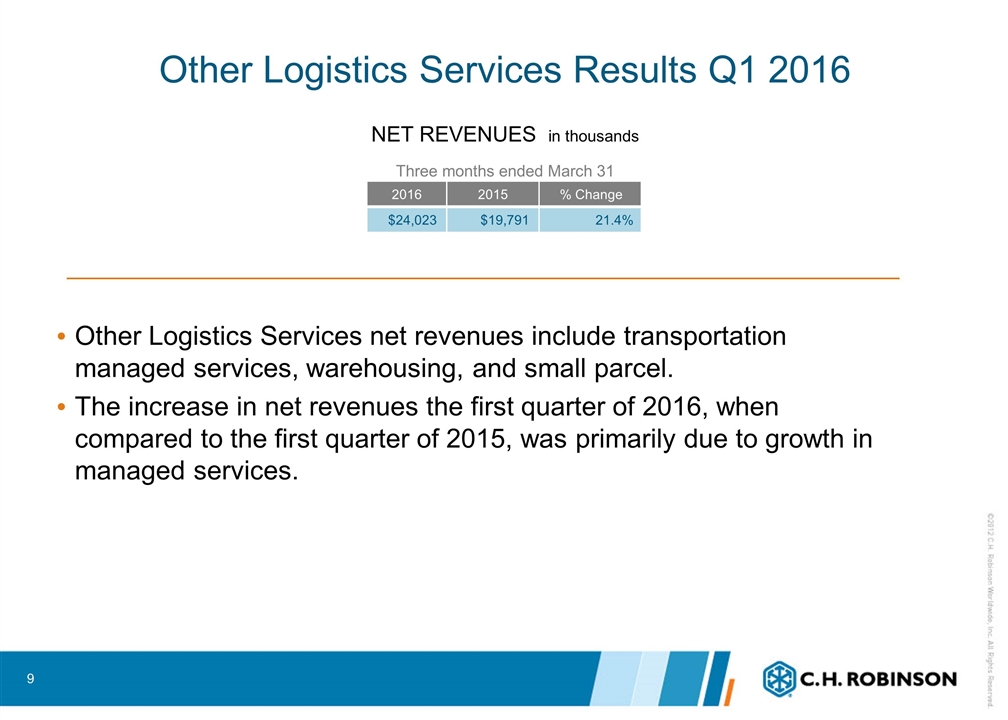
Other Logistics Services Results Q1 2016 Other Logistics Services net revenues include transportation managed services, warehousing, and small parcel. The increase in net revenues the first quarter of 2016, when compared to the first quarter of 2015, was primarily due to growth in managed services. NET REVENUES in thousands 2016 2015 % Change $24,023 $19,791 21.4% Three months ended March 31
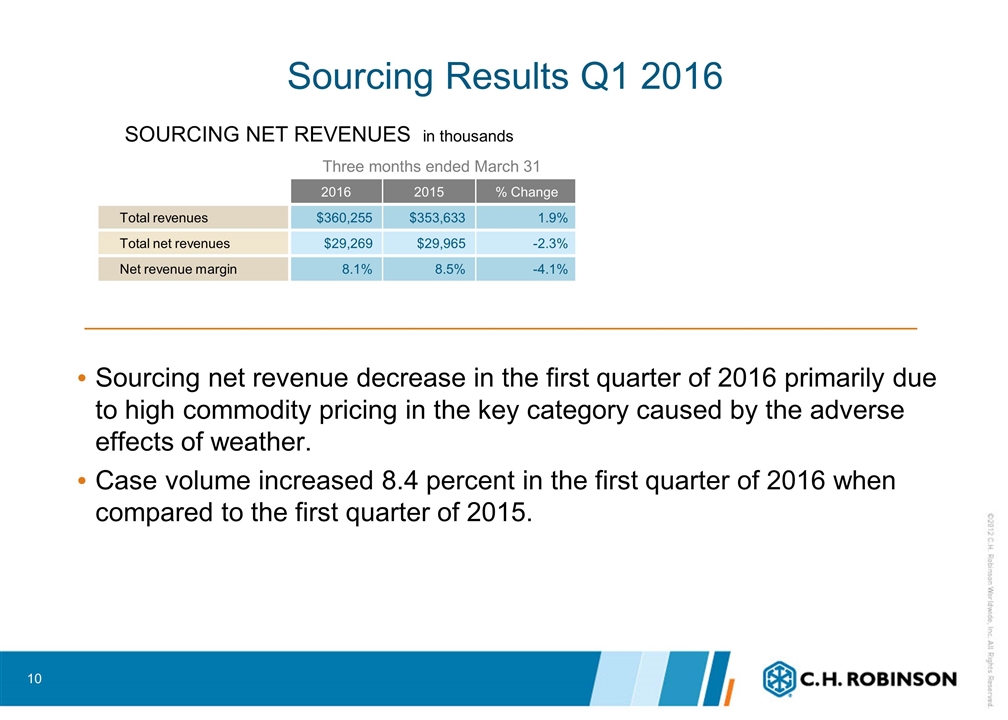
Sourcing Results Q1 2016 Sourcing net revenue decrease in the first quarter of 2016 primarily due to high commodity pricing in the key category caused by the adverse effects of weather. Case volume increased 8.4 percent in the first quarter of 2016 when compared to the first quarter of 2015. SOURCING NET REVENUES in thousands 2016 2015 % Change Total revenues $360,255 $353,633 1.9% Total net revenues $29,269 $29,965 -2.3% Net revenue margin 8.1% 8.5% -4.1% Three months ended March 31
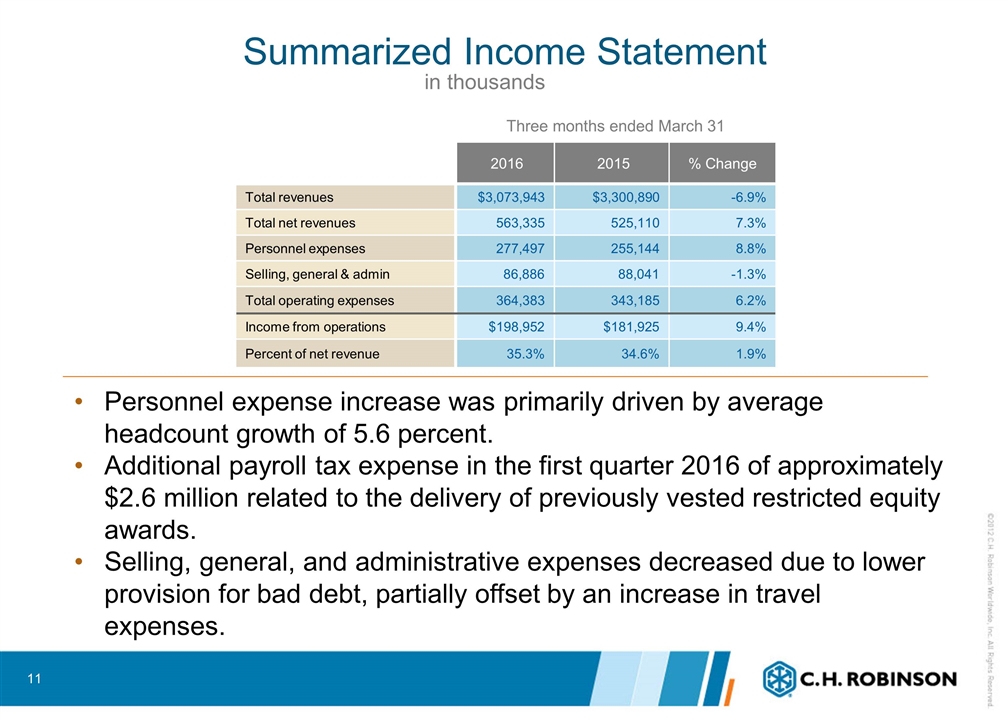
in thousands Summarized Income Statement Personnel expense increase was primarily driven by average headcount growth of 5.6 percent. Additional payroll tax expense in the first quarter 2016 of approximately $2.6 million related to the delivery of previously vested restricted equity awards. Selling, general, and administrative expenses decreased due to lower provision for bad debt, partially offset by an increase in travel expenses. Three months ended March 31 2016 2015 % Change Total revenues $3,073,943 $3,300,890 -6.9% Total net revenues 563,335 525,110 7.3% Personnel expenses 277,497 255,144 8.8% Selling, general & admin 86,886 88,041 -1.3% Total operating expenses 364,383 343,185 6.2% Income from operations $198,952 $181,925 9.4% Percent of net revenue 35.3% 34.6% 1.9%
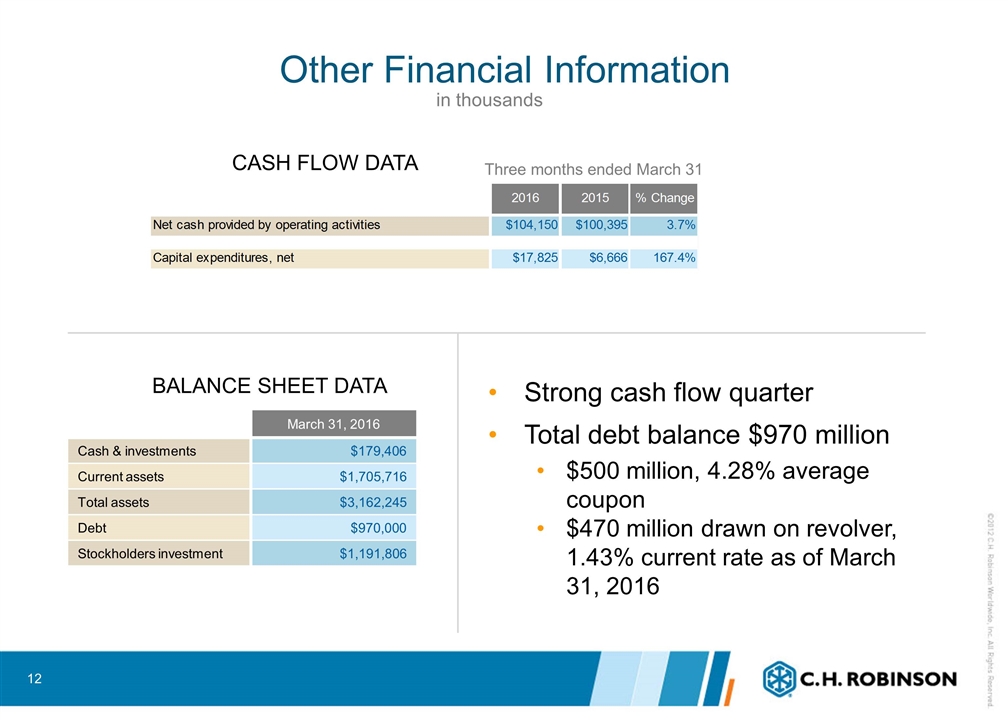
CASH FLOW DATA BALANCE SHEET DATA Other Financial Information in thousands Strong cash flow quarter Total debt balance $970 million $500 million, 4.28% average coupon $470 million drawn on revolver, 1.43% current rate as of March 31, 2016 Three months ended March 31 March 31, 2016 Cash & investments $179,406 Current assets $1,705,716 Total assets $3,162,245 Debt $970,000 Stockholders investment $1,191,806 2016 2015 % Change Net cash provided by operating activities $,104,150 $,100,395 3.7% Capital expenditures, net $17,825 $6,666 1.6740174017401741 Three months ended December 31, Year ended December 31, 2013 2012 2013 2012 %chg Net cash provided by operating activities (excluding the impact of accured income taxes) $,176,678 $89,333 $,453,634 $,355,800 0.27496908375491858 Impact of accrued income taxes ,-11,830 ,103,853 -,105,857 ,104,542 Net cash provided by operating activities $,164,848 $,193,186 $,347,777 $,460,342 Net cash provided by operating activities - actual/reported $,164,848 $,193,186 $,347,777 $,460,342 -0.24452472292339178 Adjust: Impact of accrued income taxes ,-11,830 ,103,853 -,105,857 ,104,542 Net cash provided by operating activities - adjusted $,176,678 $89,333 $,453,634 $,355,800 0.27496908375491858 2013 2012 % Change Capital expenditures, net $13,970 $11,765 0.187 Net cash provided by operating activities $,164,848 $,193,186 -0.14699999999999999 Capital expenditures, net $13,970 $11,765 0.187
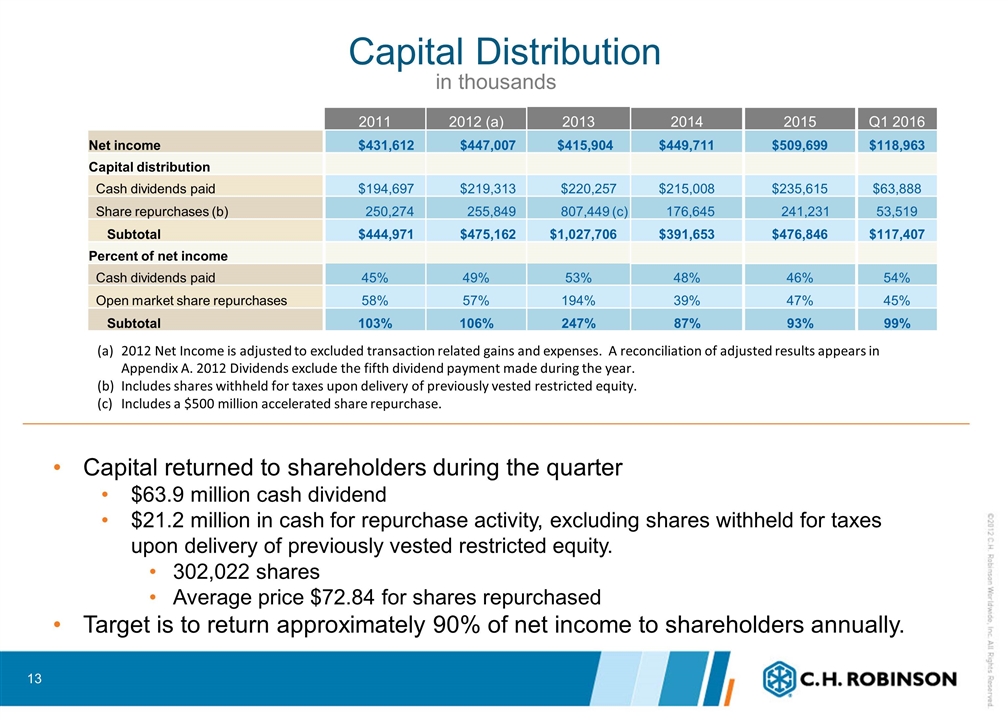
in thousands Capital Distribution Capital returned to shareholders during the quarter $63.9 million cash dividend $21.2 million in cash for repurchase activity, excluding shares withheld for taxes upon delivery of previously vested restricted equity. 302,022 shares Average price $72.84 for shares repurchased Target is to return approximately 90% of net income to shareholders annually. 2011 2012 (a) 2013 2014 2015 Q1 2016 Net income $431,612 $447,007 $415,904 $449,711 $509,699 $118,963 Capital distribution Cash dividends paid $194,697 $219,313 $220,257 $215,008 $235,615 $63,888 Share repurchases (b) 250,274 255,849 807,449 (c) 176,645 241,231 53,519 Subtotal $444,971 $475,162 $1,027,706 $391,653 $476,846 $117,407 Percent of net income Cash dividends paid 45% 49% 53% 48% 46% 54% Open market share repurchases 58% 57% 194% 39% 47% 45% Subtotal 103% 106% 247% 87% 93% 99% 2012 Net Income is adjusted to excluded transaction related gains and expenses. A reconciliation of adjusted results appears in Appendix A. 2012 Dividends exclude the fifth dividend payment made during the year. Includes shares withheld for taxes upon delivery of previously vested restricted equity. Includes a $500 million accelerated share repurchase.
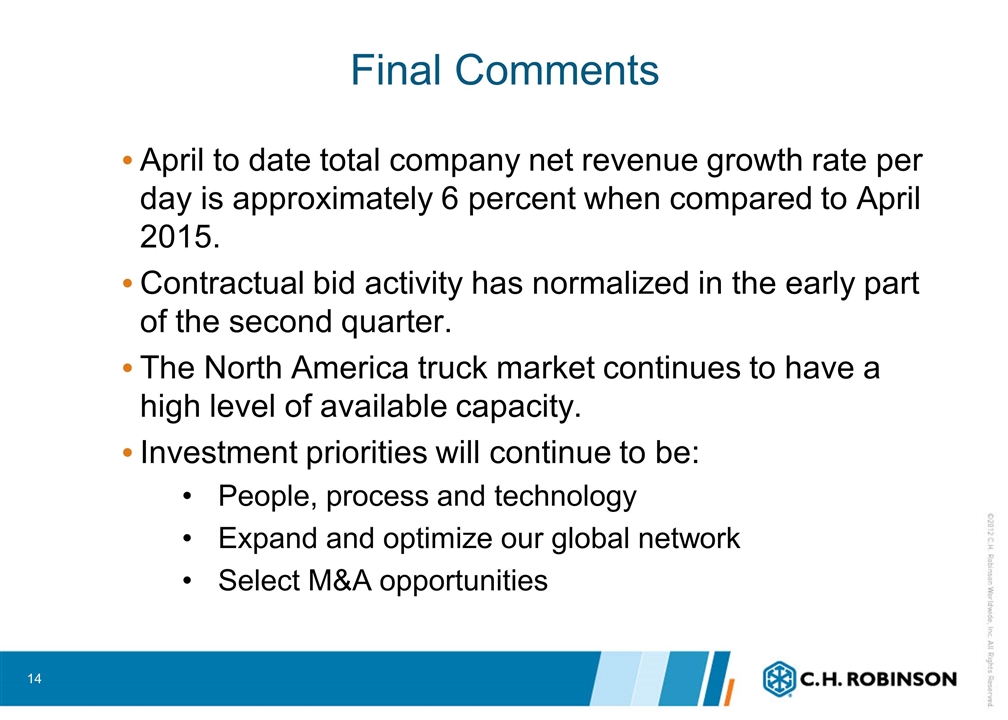
Final Comments April to date total company net revenue growth rate per day is approximately 6 percent when compared to April 2015. Contractual bid activity has normalized in the early part of the second quarter. The North America truck market continues to have a high level of available capacity. Investment priorities will continue to be: People, process and technology Expand and optimize our global network Select M&A opportunities
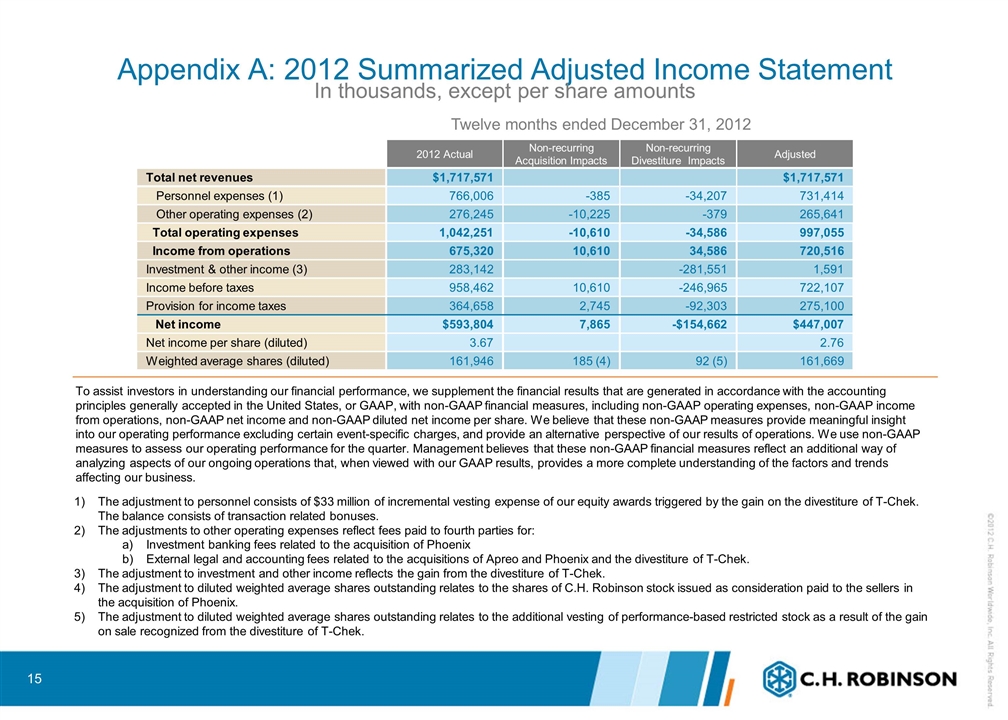
Appendix A: 2012 Summarized Adjusted Income Statement In thousands, except per share amounts Twelve months ended December 31, 2012 The adjustment to personnel consists of $33 million of incremental vesting expense of our equity awards triggered by the gain on the divestiture of T-Chek. The balance consists of transaction related bonuses. The adjustments to other operating expenses reflect fees paid to fourth parties for: Investment banking fees related to the acquisition of Phoenix External legal and accounting fees related to the acquisitions of Apreo and Phoenix and the divestiture of T-Chek. The adjustment to investment and other income reflects the gain from the divestiture of T-Chek. The adjustment to diluted weighted average shares outstanding relates to the shares of C.H. Robinson stock issued as consideration paid to the sellers in the acquisition of Phoenix. The adjustment to diluted weighted average shares outstanding relates to the additional vesting of performance-based restricted stock as a result of the gain on sale recognized from the divestiture of T-Chek. 2012 Actual Non-recurring Acquisition Impacts Non-recurring Divestiture Impacts Adjusted Total net revenues $1,717,571 $1,717,571 Personnel expenses (1) 766,006 -385 -34,207 731,414 Other operating expenses (2) 276,245 -10,225 -379 265,641 Total operating expenses 1,042,251 -10,610 -34,586 997,055 Income from operations 675,320 10,610 34,586 720,516 Investment & other income (3) 283,142 -281,551 1,591 Income before taxes 958,462 10,610 -246,965 722,107 Provision for income taxes 364,658 2,745 -92,303 275,100 Net income $593,804 7,865 -$154,662 $447,007 Net income per share (diluted) 3.67 2.76 Weighted average shares (diluted) 161,946 185 (4) 92 (5) 161,669 To assist investors in understanding our financial performance, we supplement the financial results that are generated in accordance with the accounting principles generally accepted in the United States, or GAAP, with non-GAAP financial measures, including non-GAAP operating expenses, non-GAAP income from operations, non-GAAP net income and non-GAAP diluted net income per share. We believe that these non-GAAP measures provide meaningful insight into our operating performance excluding certain event-specific charges, and provide an alternative perspective of our results of operations. We use non-GAAP measures to assess our operating performance for the quarter. Management believes that these non-GAAP financial measures reflect an additional way of analyzing aspects of our ongoing operations that, when viewed with our GAAP results, provides a more complete understanding of the factors and trends affecting our business.

Serious News for Serious Traders! Try StreetInsider.com Premium Free!
You May Also Be Interested In
- ATV industry players unite on safer riding for youth; Ontario Quad Safety Council launches new online training program
- PowerSchool Holdings, Inc. (PWSC) Stockholder Alert: Robbins LLP is Investigating the Officers and Directors of PowerSchool Holdings, Inc. for Investors
- WellSpan Health Breaks Ground on New Shrewsbury Hospital That Will Improve Access to Care Close to Home
Create E-mail Alert Related Categories
SEC FilingsSign up for StreetInsider Free!
Receive full access to all new and archived articles, unlimited portfolio tracking, e-mail alerts, custom newswires and RSS feeds - and more!


 Tweet
Tweet Share
Share