

Form 8-K BlackRock Inc. For: Oct 18
 Tweet
Tweet Share
Share
UNITED STATES
SECURITIES AND EXCHANGE COMMISSION
Washington, D.C. 20549
FORM 8-K
CURRENT REPORT
Pursuant to Section 13 OR 15(d) of
The Securities Exchange Act of 1934
Date of Report (Date of earliest event reported): October 18, 2016
BLACKROCK, INC.
(Exact name of registrant as specified in its charter)
| DELAWARE | 001-33099 | 32-0174431 | ||
| (State or other jurisdiction of incorporation) |
(Commission File Number) |
(IRS Employer Identification No.) |
| 55 East 52nd Street, New York, New York | 10055 | |
| (Address of principal executive offices) | (Zip Code) |
Registrant’s telephone number, including area code: (212) 810-5300
(Former name or former address, if changed since last report.)
Check the appropriate box below if the Form 8-K filing is intended to simultaneously satisfy the filing obligation of the registrant under any of the following provisions (see General Instruction A.2. below):
| ☐ | Written communications pursuant to Rule 425 under the Securities Act (17 CFR 230.425) |
| ☐ | Soliciting material pursuant to Rule 14a-12 under the Exchange Act (17 CFR 240.14a-12) |
| ☐ | Pre-commencement communications pursuant to Rule 14d-2(b) under the Exchange Act (17 CFR 240.14d-2(b)) |
| ☐ | Pre-commencement communications pursuant to Rule 13e-4(c) under the Exchange Act (17 CFR 240.13e-4(c)) |
| Item 2.02. | Results of Operations and Financial Condition |
On October 18, 2016, BlackRock, Inc. (the “Company”) reported results of operations for the three and nine months ended September 30, 2016. A copy of the earnings release issued by the Company is attached as Exhibit 99.1. In addition, a copy of the Company’s Earnings Release Supplement for the quarter ended September 30, 2016 is being furnished as Exhibit 99.2 to this Form 8-K.
| Item 9.01. | Financial Statements and Exhibits |
(d) Exhibits
| 99.1 | Earnings release dated October 18, 2016 issued by the Company | |
| 99.2 | Third Quarter 2016 Earnings – Earnings Release Supplement | |
SIGNATURES
Pursuant to the requirements of the Securities Exchange Act of 1934, the registrant has duly caused this report to be signed on its behalf by the undersigned hereunto duly authorized.
| BlackRock, Inc. | ||||||
| (Registrant) | ||||||
| By: | /s/ Gary Shedlin | |||||
|
| ||||||
| Date: October 18, 2016 |
Gary S. Shedlin | |||||
| Senior Managing Director and | ||||||
| Chief Financial Officer | ||||||
EXHIBIT INDEX
| 99.1 | Earnings release dated October 18, 2016 issued by the Company | |
| 99.2 | Third Quarter 2016 Earnings – Earnings Release Supplement | |
Exhibit 99.1

| Tom Wojcik, Investor Relations | Brian Beades, Media Relations | |||
| 212.810.8127 | 212.810.5596
|
BlackRock Reports Third Quarter 2016 Diluted EPS of $5.26, or $5.14 as adjusted
| • | $70 billion of total net inflows, including $55 billion in long-term net inflows, reflects positive flows across all product types, investment styles and regions |
| • | 4% increase in base fees year-over-year driven by organic growth and market performance, offset by mix change favoring fixed income and cash |
| • | 13% growth in Aladdin® revenue year-over-year reflects ongoing demand for risk management technology |
| • | Expansion in operating margin from prior year driven by continued expense discipline in the current quarter |
| • | 5% increase in diluted EPS (3% as adjusted) year-over-year |
| • | Consistent capital management with $275 million of quarterly share repurchases |
FINANCIAL RESULTS
| (in millions, except per share data) |
Q3 2016 |
Q3 2015 |
Change | Q2 2016 |
Change | Nine Months Ended September 30, | ||||||||||||||||||||||||||
| 2016 | 2015 | Change | ||||||||||||||||||||||||||||||
| AUM |
$ | 5,117,421 | $ | 4,505,721 | 14 | % | $ | 4,890,121 | 5 | % | $ | 5,117,421 | $ | 4,505,721 | 14 | % | ||||||||||||||||
| GAAP basis: |
||||||||||||||||||||||||||||||||
| Revenue |
$ | 2,837 | $ | 2,910 | (3 | )% | $ | 2,804 | 1 | % | $ | 8,265 | $ | 8,538 | (3 | )% | ||||||||||||||||
| Operating income |
$ | 1,209 | $ | 1,222 | (1 | )% | $ | 1,173 | 3 | % | $ | 3,345 | $ | 3,527 | (5 | )% | ||||||||||||||||
| Operating margin |
42.6 | % | 42.0 | % | 60 | bps | 41.8 | % | 80 | bps | 40.5 | % | 41.3 | % | (80 | ) bps | ||||||||||||||||
| Net income(1) |
$ | 875 | $ | 843 | 4 | % | $ | 789 | 11 | % | $ | 2,321 | $ | 2,484 | (7 | )% | ||||||||||||||||
| Diluted EPS |
$ | 5.26 | $ | 5.00 | 5 | % | $ | 4.73 | 11 | % | $ | 13.92 | $ | 14.68 | (5 | )% | ||||||||||||||||
| Weighted average |
166.3 | 168.7 | (1 | )% | 166.6 | — | % | 166.8 | 169.2 | (1 | )% | |||||||||||||||||||||
| As Adjusted: |
||||||||||||||||||||||||||||||||
| Operating income(2) |
$ | 1,216 | $ | 1,227 | (1 | )% | $ | 1,179 | 3 | % | $ | 3,442 | $ | 3,552 | (3 | )% | ||||||||||||||||
| Operating margin(2) |
44.8 | % | 43.9 | % | 90 | bps | 43.9 | % | 90 | bps | 43.5 | % | 43.4 | % | 10 | bps | ||||||||||||||||
| Net income(1) (2) |
$ | 854 | $ | 844 | 1 | % | $ | 797 | 7 | % | $ | 2,362 | $ | 2,512 | (6 | )% | ||||||||||||||||
| Diluted EPS(2) |
$ | 5.14 | $ | 5.00 | 3 | % | $ | 4.78 | 8 | % | $ | 14.16 | $ | 14.85 | (5 | )% | ||||||||||||||||
| (1) | Net income represents net income attributable to BlackRock, Inc. |
| (2) | See notes (1) through (4) to the Condensed Consolidated Statements of Income and Supplemental Information on pages 13 through 15 for more information on as adjusted items and the reconciliation to GAAP. |
New York, October 18, 2016 — BlackRock, Inc. (NYSE: BLK) today reported financial results for the three and nine months ended September 30, 2016.
“BlackRock’s business model was built to thrive in all market environments,” commented Laurence D. Fink, Chairman and CEO of BlackRock. “In the third quarter, even as investor preferences continued to migrate from equity to fixed income and cash, and away from active strategies, the diversity of our platform drove nearly $70 billion of total net inflows. Our $55 billion of long-term net inflows were positive across both active and index strategies, and positive across every asset class and region.
“Retail and institutional investors continued turning to iShares as an effective way to express market views and generate alpha. iShares once again captured the #1 market share of net new business in the United States, in Europe and globally, across both equity and fixed income. Our European fixed income ETFs reached $100 billion of AUM and fixed income remains an important growth area for iShares.
“With pensions and insurers facing continued challenges to fund future liabilities in a ‘lower-for-longer’ environment, we saw $8 billion of long-term active net inflows from institutional clients in the quarter, reflecting demand for BlackRock’s customized fixed income solutions and multi-asset strategies. Institutional demand for investment and risk management technology remains strong and drove 13% growth in our Aladdin revenue year-over-year.
“Regulatory change continues to have a material impact on our industry. In retail, the DoL fiduciary rule will increasingly influence the choices that financial intermediaries make for their clients. Anticipating that change, BlackRock is using our scale to provide distribution partners with the highest quality investment strategies at the best value, as well as portfolio construction and risk tools, to help them build better portfolios. In cash management, where more than $1 trillion dollars has shifted from prime to government funds as a result of money market reform, the breadth of our platform and our
-1-
ability to both embrace and adapt ahead of change have enabled us to meet our clients’ evolving needs and increase market share, and we saw $15 billion of net inflows into cash management in the third quarter.
“I want to thank our employees for their ongoing commitment to improving our clients’ financial futures. We continue to evolve our business model and invest in our future to help clients achieve their investment goals and deliver long-term value for shareholders.”
LONG-TERM RESULTS BY CLIENT TYPE
| (in millions), (unaudited) |
Q3 2016 Net flows |
September 30, 2016 AUM |
Q3 2016 Base Fees(1) |
September 30, 2016 AUM % of Total |
Q3 2016 Base Fees(1) % of Total |
|||||||||||||||
| Retail |
$ | (2,228 | ) | $ | 554,778 | $ | 821 | 12 | % | 34 | % | |||||||||
| iShares |
51,257 | 1,246,166 | 901 | 26 | % | 37 | % | |||||||||||||
| Institutional: |
||||||||||||||||||||
| Active |
7,531 | 1,039,653 | 465 | 22 | % | 19 | % | |||||||||||||
| Index |
(1,376 | ) | 1,877,501 | 241 | 40 | % | 10 | % | ||||||||||||
|
|
|
|
|
|
|
|
|
|
|
|||||||||||
| Total institutional |
6,155 | 2,917,154 | 706 | 62 | % | 29 | % | |||||||||||||
|
|
|
|
|
|
|
|
|
|
|
|||||||||||
| Total long-term |
$ | 55,184 | $ | 4,718,098 | $ | 2,428 | 100 | % | 100 | % | ||||||||||
|
|
|
|
|
|
|
|
|
|
|
|||||||||||
LONG-TERM RESULTS BY PRODUCT TYPE
| (in millions), (unaudited) |
Q3 2016 Net flows |
September 30, 2016 AUM |
Q3 2016 Base Fees(1) |
September 30, 2016 AUM % of Total |
Q3 2016 Base Fees(1) % of Total |
|||||||||||||||
| Equity |
$ | 13,350 | $ | 2,566,039 | $ | 1,270 | 54 | % | 52 | % | ||||||||||
| Fixed income |
36,981 | 1,628,268 | 693 | 34 | % | 29 | % | |||||||||||||
| Multi-asset |
3,038 | 402,261 | 285 | 9 | % | 12 | % | |||||||||||||
| Alternatives |
1,815 | 121,530 | 180 | 3 | % | 7 | % | |||||||||||||
|
|
|
|
|
|
|
|
|
|
|
|||||||||||
| Total long-term |
$ | 55,184 | $ | 4,718,098 | $ | 2,428 | 100 | % | 100 | % | ||||||||||
|
|
|
|
|
|
|
|
|
|
|
|||||||||||
LONG-TERM RESULTS BY INVESTMENT STYLE
| (in millions), (unaudited) |
Q3 2016 Net flows |
September 30, 2016 AUM |
Q3 2016 Base Fees(1) |
September 30, 2016 AUM % of Total |
Q3 2016 Base Fees(1) % of Total |
|||||||||||||||
| Active |
$ | 4,039 | $ | 1,547,473 | $ | 1,274 | 33 | % | 52 | % | ||||||||||
| Index and iShares |
51,145 | 3,170,625 | 1,154 | 67 | % | 48 | % | |||||||||||||
|
|
|
|
|
|
|
|
|
|
|
|||||||||||
| Total long-term |
$ | 55,184 | $ | 4,718,098 | $ | 2,428 | 100 | % | 100 | % | ||||||||||
|
|
|
|
|
|
|
|
|
|
|
|||||||||||
| (1) | Base fees include investment advisory, administration fees and securities lending revenue. |
Long-Term Business Highlights
Long-term net inflows were positive across all major regions, with net inflows of $38.7 billion, $13.4 billion and $3.1 billion from clients in the Americas, EMEA and Asia-Pacific, respectively. At September 30, 2016, BlackRock managed 63% of its long-term AUM for investors in the Americas and 37% for clients in EMEA and Asia-Pacific.
A discussion of the Company’s net flows by client type for the third quarter of 2016 is presented below.
| • | Retail long-term net outflows of $2.2 billion reflected net outflows of $1.9 billion and $0.3 billion from the United States and internationally, respectively. Fixed income saw net inflows of $5.8 billion, paced by flows into emerging market debt and high yield bond funds. Equity net outflows of $3.9 billion were primarily related to outflows from European and U.S. equities. Multi-asset net outflows of $3.5 billion were largely due to outflows from world allocation strategies. |
| • | iShares® long-term net inflows of $51.3 billion were led by equity net inflows of $25.5 billion, with strength in emerging market precision exposures and iShares Core ETFs. Fixed income net inflows of $22.7 billion were diversified across corporate, emerging markets and core bond funds. Commodities iShares generated $2.9 billion of net inflows. |
-2-
| • | Institutional active long-term net inflows of $7.5 billion were led by multi-asset net inflows of $6.5 billion, driven by ongoing demand for solutions offerings and the LifePath® target-date series. Fixed income net inflows of $5.1 billion reflected strong flows from insurance clients in the quarter. Equity net outflows of $3.4 billion were primarily due to outflows from Scientific Active equities and European equities. |
| • | Institutional index long-term net outflows of $1.4 billion reflected equity net outflows of $4.9 billion, partially offset by fixed income inflows of $3.4 billion, driven by inflows into liability-driven investment solutions. |
Cash management AUM increased 4% to $389.0 billion, driven by $14.7 billion of net inflows, primarily into government funds ahead of money market reform.
Advisory AUM ended the third quarter at $10.3 billion.
INVESTMENT PERFORMANCE AT SEPTEMBER 30, 2016 (1)
| One-year period | Three-year period | Five-year period | ||||||||||
| Fixed Income: |
||||||||||||
| Actively managed AUM above benchmark or peer median |
||||||||||||
| Taxable |
59 | % | 79 | % | 88 | % | ||||||
| Tax-exempt |
60 | % | 60 | % | 65 | % | ||||||
| Index AUM within or above applicable tolerance |
89 | % | 98 | % | 98 | % | ||||||
|
|
|
|
|
|
|
|||||||
| Equity: |
||||||||||||
| Actively managed AUM above benchmark or peer median |
||||||||||||
| Fundamental |
50 | % | 66 | % | 53 | % | ||||||
| Scientific |
31 | % | 83 | % | 93 | % | ||||||
| Index AUM within or above applicable tolerance |
96 | % | 99 | % | 97 | % | ||||||
|
|
|
|
|
|
|
|||||||
| (1) | Past performance is not indicative of future results. The performance information shown is based on preliminary available data. Please refer to page 16 for performance disclosure detail. |
Teleconference, Webcast and Presentation Information
Chairman and Chief Executive Officer, Laurence D. Fink, and Chief Financial Officer, Gary S. Shedlin, will host a teleconference call for investors and analysts on Tuesday, October 18, 2016 at 8:30 a.m. (Eastern Time). Members of the public who are interested in participating in the teleconference should dial, from the United States, (800) 374-0176, or from outside the United States, (706) 679-8281, shortly before 8:30 a.m. and reference the BlackRock Conference Call (ID Number 92557521). A live, listen-only webcast will also be available via the investor relations section of www.blackrock.com.
Both the teleconference and webcast will be available for replay by 12:30 p.m. (Eastern Time) on Tuesday, October 18, 2016 and ending at midnight on Tuesday, November 1, 2016. To access the replay of the teleconference, callers from the United States should dial (855) 859-2056 and callers from outside the United States should dial (404) 537-3406 and enter the Conference ID Number 92557521. To access the webcast, please visit the investor relations section of www.blackrock.com.
About BlackRock
BlackRock is a global leader in investment management, risk management and advisory services for institutional and retail clients. At September 30, 2016, BlackRock’s AUM was $5.1 trillion. BlackRock helps clients around the world meet their goals and overcome challenges with a range of products that include separate accounts, mutual funds, iShares® (exchange-traded funds), and other pooled investment vehicles. BlackRock also offers risk management, advisory and enterprise investment system services to a broad base of institutional investors through BlackRock Solutions®. As of September 30, 2016, the firm had approximately 13,000 employees in 30 countries and a major presence in global markets, including North and South America, Europe, Asia, Australia and the Middle East and Africa. For additional information, please visit the Company’s website at www.blackrock.com | Twitter: @blackrock_news | Blog: www.blackrockblog.com | LinkedIn: www.linkedin.com/company/blackrock
-3-
CONDENSED CONSOLIDATED STATEMENTS OF INCOME AND SUPPLEMENTAL INFORMATION
(in millions, except shares and per share data), (unaudited)
| Three Months Ended September 30, |
Change | Three Months Ended June 30, 2016 |
Change | |||||||||||||||||
| 2016 | 2015 | |||||||||||||||||||
| Revenue |
||||||||||||||||||||
| Investment advisory, administration fees and securities lending revenue |
$ | 2,546 | $ | 2,456 | $ | 90 | $ | 2,489 | $ | 57 | ||||||||||
| Investment advisory performance fees |
58 | 208 | (150 | ) | 74 | (16 | ) | |||||||||||||
| BlackRock Solutions and advisory |
174 | 167 | 7 | 172 | 2 | |||||||||||||||
| Distribution fees |
10 | 14 | (4 | ) | 11 | (1 | ) | |||||||||||||
| Other revenue |
49 | 65 | (16 | ) | 58 | (9 | ) | |||||||||||||
|
|
|
|
|
|
|
|
|
|
|
|||||||||||
| Total revenue |
2,837 | 2,910 | (73 | ) | 2,804 | 33 | ||||||||||||||
|
|
|
|
|
|
|
|
|
|
|
|||||||||||
| Expense |
||||||||||||||||||||
| Employee compensation and benefits |
969 | 1,023 | (54 | ) | 977 | (8 | ) | |||||||||||||
| Distribution and servicing costs |
114 | 102 | 12 | 109 | 5 | |||||||||||||||
| Amortization of deferred sales commissions |
8 | 12 | (4 | ) | 9 | (1 | ) | |||||||||||||
| Direct fund expense |
200 | 198 | 2 | 195 | 5 | |||||||||||||||
| General and administration |
312 | 319 | (7 | ) | 316 | (4 | ) | |||||||||||||
| Amortization of intangible assets |
25 | 34 | (9 | ) | 25 | — | ||||||||||||||
|
|
|
|
|
|
|
|
|
|
|
|||||||||||
| Total expense |
1,628 | 1,688 | (60 | ) | 1,631 | (3 | ) | |||||||||||||
|
|
|
|
|
|
|
|
|
|
|
|||||||||||
| Operating income |
1,209 | 1,222 | (13 | ) | 1,173 | 36 | ||||||||||||||
| Nonoperating income (expense) |
||||||||||||||||||||
| Net gain (loss) on investments |
31 | (10 | ) | 41 | 20 | 11 | ||||||||||||||
| Interest and dividend income |
22 | 12 | 10 | 6 | 16 | |||||||||||||||
| Interest expense |
(52 | ) | (50 | ) | (2 | ) | (51 | ) | (1 | ) | ||||||||||
|
|
|
|
|
|
|
|
|
|
|
|||||||||||
| Total nonoperating income (expense) |
1 | (48 | ) | 49 | (25 | ) | 26 | |||||||||||||
|
|
|
|
|
|
|
|
|
|
|
|||||||||||
| Income before income taxes |
1,210 | 1,174 | 36 | 1,148 | 62 | |||||||||||||||
| Income tax expense |
333 | 342 | (9 | ) | 353 | (20 | ) | |||||||||||||
|
|
|
|
|
|
|
|
|
|
|
|||||||||||
| Net income |
877 | 832 | 45 | 795 | 82 | |||||||||||||||
| Less: |
||||||||||||||||||||
| Net income (loss) attributable to noncontrolling interests |
2 | (11 | ) | 13 | 6 | (4 | ) | |||||||||||||
|
|
|
|
|
|
|
|
|
|
|
|||||||||||
| Net income attributable to BlackRock, Inc. |
$ | 875 | $ | 843 | $ | 32 | $ | 789 | $ | 86 | ||||||||||
|
|
|
|
|
|
|
|
|
|
|
|||||||||||
| Weighted-average common shares outstanding |
||||||||||||||||||||
| Basic |
164,129,214 | 166,045,291 | (1,916,077 | ) | 164,758,612 | (629,398 | ) | |||||||||||||
| Diluted |
166,256,598 | 168,665,303 | (2,408,705 | ) | 166,639,290 | (382,692 | ) | |||||||||||||
| Earnings per share attributable to BlackRock, Inc. common stockholders (4) |
||||||||||||||||||||
| Basic |
$ | 5.33 | $ | 5.08 | $ | 0.25 | $ | 4.79 | $ | 0.54 | ||||||||||
| Diluted |
$ | 5.26 | $ | 5.00 | $ | 0.26 | $ | 4.73 | $ | 0.53 | ||||||||||
| Cash dividends declared and paid per share |
$ | 2.29 | $ | 2.18 | $ | 0.11 | $ | 2.29 | $ | — | ||||||||||
| Supplemental information: |
||||||||||||||||||||
| AUM (end of period) |
$ | 5,117,421 | $ | 4,505,721 | $ | 611,700 | $ | 4,890,121 | $ | 227,300 | ||||||||||
| Shares outstanding (end of period) |
163,858,070 | 166,057,085 | (2,199,015 | ) | 164,463,297 | (605,227 | ) | |||||||||||||
| GAAP: |
||||||||||||||||||||
| Operating margin |
42.6 | % | 42.0 | % | 60 | bps | 41.8 | % | 80 | bps | ||||||||||
| Effective tax rate |
27.6 | % | 28.8 | % | (120 | ) bps | 30.9 | % | (330 | ) bps | ||||||||||
| As adjusted: |
||||||||||||||||||||
| Operating income (1) |
$ | 1,216 | $ | 1,227 | $ | (11 | ) | $ | 1,179 | $ | 37 | |||||||||
| Operating margin (1) |
44.8 | % | 43.9 | % | 90 | bps | 43.9 | % | 90 | bps | ||||||||||
| Nonoperating income (expense), less net income (loss) attributable to noncontrolling interests (2) |
$ | (1 | ) | $ | (32 | ) | $ | 31 | $ | (31 | ) | $ | 30 | |||||||
| Net income attributable to BlackRock, Inc. (3) |
$ | 854 | $ | 844 | $ | 10 | $ | 797 | $ | 57 | ||||||||||
| Diluted earnings attributable to BlackRock, Inc. common stockholders per share (3) (4) |
$ | 5.14 | $ | 5.00 | $ | 0.14 | $ | 4.78 | $ | 0.36 | ||||||||||
| Effective tax rate |
29.7 | % | 29.3 | % | 40 | bps | 30.6 | % | (90 | ) bps | ||||||||||
See pages 13-15 for the reconciliation to GAAP and notes (1) through (4) for more information on as adjusted items.
-4-
CONDENSED CONSOLIDATED STATEMENTS OF INCOME AND SUPPLEMENTAL INFORMATION
(in millions, except shares and per share data), (unaudited)
| Nine Months Ended September 30, |
Change | |||||||||||
| 2016 | 2015 | |||||||||||
| Revenue |
||||||||||||
| Investment advisory, administration fees and securities lending revenue |
$ | 7,394 | $ | 7,380 | $ | 14 | ||||||
| Investment advisory performance fees |
166 | 452 | (286 | ) | ||||||||
| BlackRock Solutions and advisory |
517 | 475 | 42 | |||||||||
| Distribution fees |
32 | 44 | (12 | ) | ||||||||
| Other revenue |
156 | 187 | (31 | ) | ||||||||
|
|
|
|
|
|
|
|||||||
| Total revenue |
8,265 | 8,538 | (273 | ) | ||||||||
|
|
|
|
|
|
|
|||||||
| Expense |
||||||||||||
| Employee compensation and benefits |
2,893 | 3,016 | (123 | ) | ||||||||
| Distribution and servicing costs |
320 | 306 | 14 | |||||||||
| Amortization of deferred sales commissions |
27 | 37 | (10 | ) | ||||||||
| Direct fund expense |
583 | 578 | 5 | |||||||||
| General and administration |
946 | 970 | (24 | ) | ||||||||
| Restructuring charge |
76 | — | 76 | |||||||||
| Amortization of intangible assets |
75 | 104 | (29 | ) | ||||||||
|
|
|
|
|
|
|
|||||||
| Total expense |
4,920 | 5,011 | (91 | ) | ||||||||
|
|
|
|
|
|
|
|||||||
| Operating income |
3,345 | 3,527 | (182 | ) | ||||||||
| Nonoperating income (expense) |
||||||||||||
| Net gain (loss) on investments |
49 | 59 | (10 | ) | ||||||||
| Interest and dividend income |
33 | 21 | 12 | |||||||||
| Interest expense |
(154 | ) | (153 | ) | (1 | ) | ||||||
|
|
|
|
|
|
|
|||||||
| Total nonoperating income (expense) |
(72 | ) | (73 | ) | 1 | |||||||
|
|
|
|
|
|
|
|||||||
| Income before income taxes |
3,273 | 3,454 | (181 | ) | ||||||||
| Income tax expense |
954 | 971 | (17 | ) | ||||||||
|
|
|
|
|
|
|
|||||||
| Net income |
2,319 | 2,483 | (164 | ) | ||||||||
| Less: |
||||||||||||
| Net income (loss) attributable to noncontrolling interests |
(2 | ) | (1 | ) | (1 | ) | ||||||
|
|
|
|
|
|
|
|||||||
| Net income attributable to BlackRock, Inc. |
$ | 2,321 | $ | 2,484 | $ | (163 | ) | |||||
|
|
|
|
|
|
|
|||||||
| Weighted-average common shares outstanding |
||||||||||||
| Basic |
164,756,355 | 166,579,805 | (1,823,450 | ) | ||||||||
| Diluted |
166,760,912 | 169,157,188 | (2,396,276 | ) | ||||||||
| Earnings per share attributable to BlackRock, Inc. common stockholders (4) |
||||||||||||
| Basic |
$ | 14.09 | $ | 14.91 | $ | (0.82 | ) | |||||
| Diluted |
$ | 13.92 | $ | 14.68 | $ | (0.76 | ) | |||||
| Cash dividends declared and paid per share |
$ | 6.87 | $ | 6.54 | $ | 0.33 | ||||||
| Supplemental information: |
||||||||||||
| AUM (end of period) |
$ | 5,117,421 | $ | 4,505,721 | $ | 611,700 | ||||||
| Shares outstanding (end of period) |
163,858,070 | 166,057,085 | (2,199,015 | ) | ||||||||
| GAAP: |
||||||||||||
| Operating margin |
40.5 | % | 41.3 | % | (80 | ) bps | ||||||
| Effective tax rate |
29.1 | % | 28.1 | % | 100 | bps | ||||||
| As adjusted: |
||||||||||||
| Operating income (1) |
$ | 3,442 | $ | 3,552 | $ | (110 | ) | |||||
| Operating margin (1) |
43.5 | % | 43.4 | % | 10 | bps | ||||||
| Nonoperating income (expense), less net income (loss) attributable to noncontrolling interests (2) |
$ | (70 | ) | $ | (71 | ) | $ | 1 | ||||
| Net income attributable to BlackRock, Inc. (3) |
$ | 2,362 | $ | 2,512 | $ | (150 | ) | |||||
| Diluted earnings attributable to BlackRock, Inc. common stockholders per share (3) (4) |
$ | 14.16 | $ | 14.85 | $ | (0.69 | ) | |||||
| Effective tax rate |
30.0 | % | 27.8 | % | 220 | bps | ||||||
See pages 13-15 for the reconciliation to GAAP and notes (1) through (4) for more information on as adjusted items.
-5-
ASSETS UNDER MANAGEMENT
(in millions), (unaudited)
Current Quarter Component Changes by Client Type and Product
| June 30, 2016 |
Net inflows (outflows) |
Market Change | FX impact (1) | September 30, 2016 |
Average AUM(2) |
|||||||||||||||||||
| Retail: |
||||||||||||||||||||||||
| Equity |
$ | 191,980 | $ | (3,889 | ) | $ | 8,550 | $ | (510 | ) | $ | 196,131 | $ | 195,266 | ||||||||||
| Fixed income |
223,710 | 5,801 | 1,228 | 103 | 230,842 | 228,099 | ||||||||||||||||||
| Multi-asset |
111,456 | (3,452 | ) | 3,435 | (70 | ) | 111,369 | 112,263 | ||||||||||||||||
| Alternatives |
17,281 | (688 | ) | (190 | ) | 33 | 16,436 | 16,753 | ||||||||||||||||
|
|
|
|
|
|
|
|
|
|
|
|
|
|||||||||||||
| Retail subtotal |
544,427 | (2,228 | ) | 13,023 | (444 | ) | 554,778 | 552,381 | ||||||||||||||||
| iShares: |
||||||||||||||||||||||||
| Equity |
826,768 | 25,519 | 38,628 | 95 | 891,010 | 868,747 | ||||||||||||||||||
| Fixed income |
304,896 | 22,730 | 1,607 | 229 | 329,462 | 320,249 | ||||||||||||||||||
| Multi-asset |
2,328 | 124 | 56 | (2 | ) | 2,506 | 2,430 | |||||||||||||||||
| Alternatives |
20,130 | 2,884 | 160 | 14 | 23,188 | 22,162 | ||||||||||||||||||
|
|
|
|
|
|
|
|
|
|
|
|
|
|||||||||||||
| iShares subtotal |
1,154,122 | 51,257 | 40,451 | 336 | 1,246,166 | 1,213,588 | ||||||||||||||||||
| Institutional: |
||||||||||||||||||||||||
| Active: |
||||||||||||||||||||||||
| Equity |
120,127 | (3,357 | ) | 7,455 | (455 | ) | 123,770 | 122,790 | ||||||||||||||||
| Fixed income |
549,686 | 5,060 | 6,538 | (485 | ) | 560,799 | 557,357 | |||||||||||||||||
| Multi-asset |
264,937 | 6,533 | 8,909 | 27 | 280,406 | 274,516 | ||||||||||||||||||
| Alternatives |
74,971 | (705 | ) | 565 | (153 | ) | 74,678 | 74,741 | ||||||||||||||||
|
|
|
|
|
|
|
|
|
|
|
|
|
|||||||||||||
| Active subtotal |
1,009,721 | 7,531 | 23,467 | (1,066 | ) | 1,039,653 | 1,029,404 | |||||||||||||||||
| Index: |
||||||||||||||||||||||||
| Equity |
1,293,683 | (4,923 | ) | 68,226 | (1,858 | ) | 1,355,128 | 1,335,780 | ||||||||||||||||
| Fixed income |
488,364 | 3,390 | 21,566 | (6,155 | ) | 507,165 | 499,187 | |||||||||||||||||
| Multi-asset |
7,799 | (167 | ) | 322 | 26 | 7,980 | 7,982 | |||||||||||||||||
| Alternatives |
6,808 | 324 | 169 | (73 | ) | 7,228 | 7,081 | |||||||||||||||||
|
|
|
|
|
|
|
|
|
|
|
|
|
|||||||||||||
| Index subtotal |
1,796,654 | (1,376 | ) | 90,283 | (8,060 | ) | 1,877,501 | 1,850,030 | ||||||||||||||||
|
|
|
|
|
|
|
|
|
|
|
|
|
|||||||||||||
| Institutional subtotal |
2,806,375 | 6,155 | 113,750 | (9,126 | ) | 2,917,154 | 2,879,434 | |||||||||||||||||
|
|
|
|
|
|
|
|
|
|
|
|
|
|||||||||||||
| Long-term |
4,504,924 | 55,184 | 167,224 | (9,234 | ) | 4,718,098 | 4,645,403 | |||||||||||||||||
| Cash management |
374,684 | 14,696 | 219 | (617 | ) | 388,982 | 383,424 | |||||||||||||||||
| Advisory(3) |
10,513 | (71 | ) | (14 | ) | (87 | ) | 10,341 | 10,419 | |||||||||||||||
|
|
|
|
|
|
|
|
|
|
|
|
|
|||||||||||||
| Total |
$ | 4,890,121 | $ | 69,809 | $ | 167,429 | $ | (9,938 | ) | $ | 5,117,421 | $ | 5,039,246 | |||||||||||
|
|
|
|
|
|
|
|
|
|
|
|
|
|||||||||||||
|
Current Quarter Component Changes by Product Type (Long-term)
|
|
|||||||||||||||||||||||
| June 30, 2016 |
Net inflows (outflows) |
Market Change | FX impact (1) | September 30, 2016 |
Average AUM(2) |
|||||||||||||||||||
| Equity: |
||||||||||||||||||||||||
| Active |
$ | 276,348 | $ | (7,831 | ) | $ | 13,725 | $ | (516 | ) | $ | 281,726 | $ | 281,136 | ||||||||||
| iShares |
826,768 | 25,519 | 38,628 | 95 | 891,010 | 868,747 | ||||||||||||||||||
| Non-ETF index |
1,329,442 | (4,338 | ) | 70,506 | (2,307 | ) | 1,393,303 | 1,372,700 | ||||||||||||||||
|
|
|
|
|
|
|
|
|
|
|
|
|
|||||||||||||
| Equity subtotal |
2,432,558 | 13,350 | 122,859 | (2,728 | ) | 2,566,039 | 2,522,583 | |||||||||||||||||
| Fixed income: |
||||||||||||||||||||||||
| Active |
765,431 | 10,182 | 7,455 | (210 | ) | 782,858 | 777,109 | |||||||||||||||||
| iShares |
304,896 | 22,730 | 1,607 | 229 | 329,462 | 320,249 | ||||||||||||||||||
| Non-ETF index |
496,329 | 4,069 | 21,877 | (6,327 | ) | 515,948 | 507,534 | |||||||||||||||||
|
|
|
|
|
|
|
|
|
|
|
|
|
|||||||||||||
| Fixed income subtotal |
1,566,656 | 36,981 | 30,939 | (6,308 | ) | 1,628,268 | 1,604,892 | |||||||||||||||||
| Multi-asset |
386,520 | 3,038 | 12,722 | (19 | ) | 402,261 | 397,191 | |||||||||||||||||
| Alternatives: |
||||||||||||||||||||||||
| Core |
89,912 | (1,408 | ) | 372 | (145 | ) | 88,731 | 89,149 | ||||||||||||||||
| Currency and commodities(4) |
29,278 | 3,223 | 332 | (34 | ) | 32,799 | 31,588 | |||||||||||||||||
|
|
|
|
|
|
|
|
|
|
|
|
|
|||||||||||||
| Alternatives subtotal |
119,190 | 1,815 | 704 | (179 | ) | 121,530 | 120,737 | |||||||||||||||||
|
|
|
|
|
|
|
|
|
|
|
|
|
|||||||||||||
| Long-term |
$ | 4,504,924 | $ | 55,184 | $ | 167,224 | $ | (9,234 | ) | $ | 4,718,098 | $ | 4,645,403 | |||||||||||
|
|
|
|
|
|
|
|
|
|
|
|
|
|||||||||||||
|
Current Quarter Component Changes by Investment Style (Long-term)
|
|
|||||||||||||||||||||||
| June 30, 2016 |
Net inflows (outflows) |
Market Change | FX impact (1) | September 30, 2016 |
Average AUM(2) |
|||||||||||||||||||
| Active |
$ | 1,510,424 | $ | 4,039 | $ | 33,900 | $ | (890 | ) | $ | 1,547,473 | $ | 1,536,517 | |||||||||||
| Index and iShares |
2,994,500 | 51,145 | 133,324 | (8,344 | ) | 3,170,625 | 3,108,886 | |||||||||||||||||
|
|
|
|
|
|
|
|
|
|
|
|
|
|||||||||||||
| Long-term |
$ | 4,504,924 | $ | 55,184 | $ | 167,224 | $ | (9,234 | ) | $ | 4,718,098 | $ | 4,645,403 | |||||||||||
|
|
|
|
|
|
|
|
|
|
|
|
|
|||||||||||||
| (1) | Foreign exchange reflects the impact of translating non-U.S. dollar denominated AUM into U.S. dollars for reporting purposes. |
| (2) | Average AUM is calculated as the average of the month-end spot AUM amounts for the trailing four months. |
| (3) | Advisory AUM represents long-term portfolio liquidation assignments. |
| (4) | Amounts include commodity iShares. |
-6-
ASSETS UNDER MANAGEMENT
(in millions), (unaudited)
Year-to-Date Changes by Client Type and Product
| December 31, 2015 |
Net inflows (outflows) |
Acquisition(1) | Market Change |
FX impact (2) | September 30, 2016 |
Average AUM(3) |
||||||||||||||||||||||
| Retail: |
||||||||||||||||||||||||||||
| Equity |
$ | 193,755 | $ | (9,171 | ) | $ | — | $ | 13,929 | $ | (2,382 | ) | $ | 196,131 | $ | 192,072 | ||||||||||||
| Fixed income |
212,653 | 10,239 | — | 7,929 | 21 | 230,842 | 220,956 | |||||||||||||||||||||
| Multi-asset |
115,307 | (7,668 | ) | — | 4,216 | (486 | ) | 111,369 | 112,464 | |||||||||||||||||||
| Alternatives |
19,410 | (2,279 | ) | — | (803 | ) | 108 | 16,436 | 17,904 | |||||||||||||||||||
|
|
|
|
|
|
|
|
|
|
|
|
|
|
|
|||||||||||||||
| Retail subtotal |
541,125 | (8,879 | ) | — | 25,271 | (2,739 | ) | 554,778 | 543,396 | |||||||||||||||||||
| iShares: |
||||||||||||||||||||||||||||
| Equity |
823,156 | 24,264 | — | 40,747 | 2,843 | 891,010 | 828,932 | |||||||||||||||||||||
| Fixed income |
254,190 | 60,238 | — | 14,126 | 908 | 329,462 | 296,192 | |||||||||||||||||||||
| Multi-asset |
2,730 | (340 | ) | — | 110 | 6 | 2,506 | 2,341 | ||||||||||||||||||||
| Alternatives |
12,485 | 7,016 | — | 3,642 | 45 | 23,188 | 18,100 | |||||||||||||||||||||
|
|
|
|
|
|
|
|
|
|
|
|
|
|
|
|||||||||||||||
| iShares subtotal |
1,092,561 | 91,178 | — | 58,625 | 3,802 | 1,246,166 | 1,145,565 | |||||||||||||||||||||
| Institutional: |
||||||||||||||||||||||||||||
| Active: |
||||||||||||||||||||||||||||
| Equity |
121,442 | (4,644 | ) | — | 8,459 | (1,487 | ) | 123,770 | 119,626 | |||||||||||||||||||
| Fixed income |
514,428 | 8,967 | — | 34,779 | 2,625 | 560,799 | 542,375 | |||||||||||||||||||||
| Multi-asset |
252,041 | 7,664 | — | 20,920 | (219 | ) | 280,406 | 263,307 | ||||||||||||||||||||
| Alternatives |
74,941 | (375 | ) | — | 549 | (437 | ) | 74,678 | 74,835 | |||||||||||||||||||
|
|
|
|
|
|
|
|
|
|
|
|
|
|
|
|||||||||||||||
| Active subtotal |
962,852 | 11,612 | — | 64,707 | 482 | 1,039,653 | 1,000,143 | |||||||||||||||||||||
| Index: |
||||||||||||||||||||||||||||
| Equity |
1,285,419 | (16,990 | ) | — | 83,247 | 3,452 | 1,355,128 | 1,291,634 | ||||||||||||||||||||
| Fixed income |
441,097 | 15,204 | — | 71,566 | (20,702 | ) | 507,165 | 475,562 | ||||||||||||||||||||
| Multi-asset |
6,258 | (285 | ) | — | 1,569 | 438 | 7,980 | 7,443 | ||||||||||||||||||||
| Alternatives |
6,003 | 960 | — | 576 | (311 | ) | 7,228 | 6,518 | ||||||||||||||||||||
|
|
|
|
|
|
|
|
|
|
|
|
|
|
|
|||||||||||||||
| Index subtotal |
1,738,777 | (1,111 | ) | — | 156,958 | (17,123 | ) | 1,877,501 | 1,781,157 | |||||||||||||||||||
|
|
|
|
|
|
|
|
|
|
|
|
|
|
|
|||||||||||||||
| Institutional subtotal |
2,701,629 | 10,501 | — | 221,665 | (16,641 | ) | 2,917,154 | 2,781,300 | ||||||||||||||||||||
|
|
|
|
|
|
|
|
|
|
|
|
|
|
|
|||||||||||||||
| Long-term |
4,335,315 | 92,800 | — | 305,561 | (15,578 | ) | 4,718,098 | 4,470,261 | ||||||||||||||||||||
| Cash management |
299,884 | 11,556 | 80,635 | 206 | (3,299 | ) | 388,982 | 345,881 | ||||||||||||||||||||
| Advisory(4) |
10,213 | (216 | ) | — | (120 | ) | 464 | 10,341 | 10,419 | |||||||||||||||||||
|
|
|
|
|
|
|
|
|
|
|
|
|
|
|
|||||||||||||||
| Total |
$ | 4,645,412 | $ | 104,140 | $ | 80,635 | $ | 305,647 | $ | (18,413 | ) | $ | 5,117,421 | $ | 4,826,561 | |||||||||||||
|
|
|
|
|
|
|
|
|
|
|
|
|
|
|
|||||||||||||||
|
Year-to-Date Component Changes by Product Type (Long-term)
|
| |||||||||||||||||||||||||||
| December 31, 2015 |
Net Inflows (outflows) |
Acquisition | Market Change |
FX impact (2) | September 30, 2016 |
Average AUM(3) |
||||||||||||||||||||||
| Equity: |
||||||||||||||||||||||||||||
| Active |
$ | 281,319 | $ | (15,680 | ) | $ | — | $ | 17,980 | $ | (1,893 | ) | $ | 281,726 | $ | 276,494 | ||||||||||||
| iShares |
823,156 | 24,264 | — | 40,747 | 2,843 | 891,010 | 828,932 | |||||||||||||||||||||
| Non-ETF index |
1,319,297 | (15,125 | ) | — | 87,655 | 1,476 | 1,393,303 | 1,326,838 | ||||||||||||||||||||
|
|
|
|
|
|
|
|
|
|
|
|
|
|
|
|||||||||||||||
| Equity subtotal |
2,423,772 | (6,541 | ) | — | 146,382 | 2,426 | 2,566,039 | 2,432,264 | ||||||||||||||||||||
| Fixed income: |
||||||||||||||||||||||||||||
| Active |
719,653 | 18,110 | — | 41,727 | 3,368 | 782,858 | 755,462 | |||||||||||||||||||||
| iShares |
254,190 | 60,238 | — | 14,126 | 908 | 329,462 | 296,192 | |||||||||||||||||||||
| Non-ETF index |
448,525 | 16,300 | — | 72,547 | (21,424 | ) | 515,948 | 483,431 | ||||||||||||||||||||
|
|
|
|
|
|
|
|
|
|
|
|
|
|
|
|||||||||||||||
| Fixed income subtotal |
1,422,368 | 94,648 | — | 128,400 | (17,148 | ) | 1,628,268 | 1,535,085 | ||||||||||||||||||||
| Multi-asset |
376,336 | (629 | ) | — | 26,815 | (261 | ) | 402,261 | 385,555 | |||||||||||||||||||
| Alternatives: |
||||||||||||||||||||||||||||
| Core |
92,085 | (2,382 | ) | — | (309 | ) | (663 | ) | 88,731 | 90,424 | ||||||||||||||||||
| Currency and commodities(5) |
20,754 | 7,704 | — | 4,273 | 68 | 32,799 | 26,933 | |||||||||||||||||||||
|
|
|
|
|
|
|
|
|
|
|
|
|
|
|
|||||||||||||||
| Alternatives subtotal |
112,839 | 5,322 | — | 3,964 | (595 | ) | 121,530 | 117,357 | ||||||||||||||||||||
|
|
|
|
|
|
|
|
|
|
|
|
|
|
|
|||||||||||||||
| Long-term |
$ | 4,335,315 | $ | 92,800 | $ | — | $ | 305,561 | $ | (15,578 | ) | $ | 4,718,098 | $ | 4,470,261 | |||||||||||||
|
|
|
|
|
|
|
|
|
|
|
|
|
|
|
|||||||||||||||
|
Year-to-Date Component Changes by Investment Style (Long-term)
|
| |||||||||||||||||||||||||||
| December 31, 2015 |
Net Inflows (outflows) |
Acquisition | Market Change |
FX impact (2) | September 30, 2016 |
Average AUM(3) |
||||||||||||||||||||||
| Active |
$ | 1,462,672 | $ | (228 | ) | $ | — | $ | 84,589 | $ | 440 | $ | 1,547,473 | $ | 1,500,466 | |||||||||||||
| Index and iShares |
2,872,643 | 93,028 | — | 220,972 | (16,018 | ) | 3,170,625 | 2,969,795 | ||||||||||||||||||||
|
|
|
|
|
|
|
|
|
|
|
|
|
|
|
|||||||||||||||
| Long-term |
$ | 4,335,315 | $ | 92,800 | $ | — | $ | 305,561 | $ | (15,578 | ) | $ | 4,718,098 | $ | 4,470,261 | |||||||||||||
|
|
|
|
|
|
|
|
|
|
|
|
|
|
|
|||||||||||||||
| (1) | Amount represents AUM acquired in the BofA® Global Capital Management transaction in April 2016. |
| (2) | Foreign exchange reflects the impact of converting non-U.S. dollar denominated AUM into U.S. dollars for reporting purposes. |
| (3) | Average AUM is calculated as the average of the month-end spot AUM amounts for the trailing ten months. |
| (4) | Advisory AUM represents long-term portfolio liquidation assignments. |
| (5) | Amounts include commodity iShares. |
-7-
ASSETS UNDER MANAGEMENT
(in millions), (unaudited)
Year-over-Year Component Changes by Client Type and Product
| September 30, 2015 |
Net inflows (outflows) |
Acquisitions(1) | Market Change | FX impact(2) | September 30, 2016 |
Average AUM(3) | ||||||||||||||||||||||
| Retail: |
||||||||||||||||||||||||||||
| Equity |
$ | 184,265 | $ | (2,443 | ) | $ | — | $ | 18,203 | $ | (3,894 | ) | $ | 196,131 | $ | 192,360 | ||||||||||||
| Fixed income |
210,605 | 14,175 | — | 6,755 | (693 | ) | 230,842 | 218,901 | ||||||||||||||||||||
| Multi-asset |
120,486 | (11,233 | ) | 366 | 2,444 | (694 | ) | 111,369 | 114,089 | |||||||||||||||||||
| Alternatives |
19,852 | (2,358 | ) | — | (1,025 | ) | (33 | ) | 16,436 | 18,374 | ||||||||||||||||||
|
|
|
|
|
|
|
|
|
|
|
|
|
|
|
|||||||||||||||
| Retail subtotal |
535,208 | (1,859 | ) | 366 | 26,377 | (5,314 | ) | 554,778 | 543,724 | |||||||||||||||||||
| iShares: |
||||||||||||||||||||||||||||
| Equity |
748,458 | 71,824 | — | 71,109 | (381 | ) | 891,010 | 821,038 | ||||||||||||||||||||
| Fixed income |
246,712 | 72,177 | — | 11,342 | (769 | ) | 329,462 | 286,110 | ||||||||||||||||||||
| Multi-asset |
1,808 | 577 | — | 120 | 1 | 2,506 | 2,246 | |||||||||||||||||||||
| Alternatives |
13,515 | 6,824 | — | 2,843 | 6 | 23,188 | 17,042 | |||||||||||||||||||||
|
|
|
|
|
|
|
|
|
|
|
|
|
|
|
|||||||||||||||
| iShares subtotal |
1,010,493 | 151,402 | — | 85,414 | (1,143 | ) | 1,246,166 | 1,126,436 | ||||||||||||||||||||
| Institutional: |
||||||||||||||||||||||||||||
| Active: |
||||||||||||||||||||||||||||
| Equity |
116,718 | (4,421 | ) | — | 14,226 | (2,753 | ) | 123,770 | 120,066 | |||||||||||||||||||
| Fixed income |
522,509 | 5,581 | — | 32,670 | 39 | 560,799 | 538,467 | |||||||||||||||||||||
| Multi-asset |
245,776 | 10,674 | — | 27,244 | (3,288 | ) | 280,406 | 261,256 | ||||||||||||||||||||
| Alternatives |
74,351 | 160 | 560 | 362 | (755 | ) | 74,678 | 74,820 | ||||||||||||||||||||
|
|
|
|
|
|
|
|
|
|
|
|
|
|
|
|||||||||||||||
| Active subtotal |
959,354 | 11,994 | 560 | 74,502 | (6,757 | ) | 1,039,653 | 994,609 | ||||||||||||||||||||
| Index: |
||||||||||||||||||||||||||||
| Equity |
1,223,796 | (18,036 | ) | — | 152,702 | (3,334 | ) | 1,355,128 | 1,289,332 | |||||||||||||||||||
| Fixed income |
465,811 | 2,872 | — | 66,253 | (27,771 | ) | 507,165 | 473,484 | ||||||||||||||||||||
| Multi-asset |
6,931 | (869 | ) | — | 1,557 | 361 | 7,980 | 7,282 | ||||||||||||||||||||
| Alternatives |
6,201 | 1,161 | — | 253 | (387 | ) | 7,228 | 6,454 | ||||||||||||||||||||
|
|
|
|
|
|
|
|
|
|
|
|
|
|
|
|||||||||||||||
| Index subtotal |
1,702,739 | (14,872 | ) | — | 220,765 | (31,131 | ) | 1,877,501 | 1,776,552 | |||||||||||||||||||
|
|
|
|
|
|
|
|
|
|
|
|
|
|
|
|||||||||||||||
| Institutional subtotal |
2,662,093 | (2,878 | ) | 560 | 295,267 | (37,888 | ) | 2,917,154 | 2,771,161 | |||||||||||||||||||
|
|
|
|
|
|
|
|
|
|
|
|
|
|
|
|||||||||||||||
| Long-term |
4,207,794 | 146,665 | 926 | 407,058 | (44,345 | ) | 4,718,098 | 4,441,321 | ||||||||||||||||||||
| Cash management |
285,692 | 27,323 | 80,635 | 29 | (4,697 | ) | 388,982 | 332,029 | ||||||||||||||||||||
| Advisory(4) |
12,235 | (1,963 | ) | — | (124 | ) | 193 | 10,341 | 10,596 | |||||||||||||||||||
|
|
|
|
|
|
|
|
|
|
|
|
|
|
|
|||||||||||||||
| Total |
$ | 4,505,721 | $ | 172,025 | $ | 81,561 | $ | 406,963 | $ | (48,849 | ) | $ | 5,117,421 | $ | 4,783,946 | |||||||||||||
|
|
|
|
|
|
|
|
|
|
|
|
|
|
|
|||||||||||||||
|
Year-over-Year Component Changes by Product Type (Long-term)
|
|
|||||||||||||||||||||||||||
| September 30, 2015 |
Net inflows (outflows) |
Acquisitions(1) | Market Change | FX impact(2) | September 30, 2016 |
Average AUM(3) | ||||||||||||||||||||||
| Equity: |
||||||||||||||||||||||||||||
| Active |
$ | 270,423 | $ | (10,814 | ) | $ | — | $ | 26,313 | $ | (4,196 | ) | $ | 281,726 | $ | 277,777 | ||||||||||||
| iShares |
748,458 | 71,824 | — | 71,109 | (381 | ) | 891,010 | 821,038 | ||||||||||||||||||||
| Non-ETF index |
1,254,356 | (14,086 | ) | — | 158,818 | (5,785 | ) | 1,393,303 | 1,323,981 | |||||||||||||||||||
|
|
|
|
|
|
|
|
|
|
|
|
|
|
|
|||||||||||||||
| Equity subtotal |
2,273,237 | 46,924 | — | 256,240 | (10,362 | ) | 2,566,039 | 2,422,796 | ||||||||||||||||||||
| Fixed income: |
||||||||||||||||||||||||||||
| Active |
725,802 | 18,341 | — | 38,470 | 245 | 782,858 | 749,590 | |||||||||||||||||||||
| iShares |
246,712 | 72,177 | — | 11,342 | (769 | ) | 329,462 | 286,110 | ||||||||||||||||||||
| Non-ETF index |
473,123 | 4,287 | — | 67,208 | (28,670 | ) | 515,948 | 481,262 | ||||||||||||||||||||
|
|
|
|
|
|
|
|
|
|
|
|
|
|
|
|||||||||||||||
| Fixed income subtotal |
1,445,637 | 94,805 | — | 117,020 | (29,194 | ) | 1,628,268 | 1,516,962 | ||||||||||||||||||||
| Multi-asset |
375,001 | (851 | ) | 366 | 31,365 | (3,620 | ) | 402,261 | 384,873 | |||||||||||||||||||
| Alternatives: |
||||||||||||||||||||||||||||
| Core |
91,358 | (1,424 | ) | 560 | (667 | ) | (1,096 | ) | 88,731 | 90,760 | ||||||||||||||||||
| Currency and commodities(5) |
22,561 | 7,211 | — | 3,100 | (73 | ) | 32,799 | 25,930 | ||||||||||||||||||||
|
|
|
|
|
|
|
|
|
|
|
|
|
|
|
|||||||||||||||
| Alternatives subtotal |
113,919 | 5,787 | 560 | 2,433 | (1,169 | ) | 121,530 | 116,690 | ||||||||||||||||||||
|
|
|
|
|
|
|
|
|
|
|
|
|
|
|
|||||||||||||||
| Long-term |
$ | 4,207,794 | $ | 146,665 | $ | 926 | $ | 407,058 | $ | (44,345 | ) | $ | 4,718,098 | $ | 4,441,321 | |||||||||||||
|
|
|
|
|
|
|
|
|
|
|
|
|
|
|
|||||||||||||||
|
Year-over-Year Component Changes by Investment Style (Long-term)
|
|
|||||||||||||||||||||||||||
| September 30, 2015 |
Net inflows (outflows) |
Acquisitions(1) | Market Change | FX impact(2) | September 30, 2016 |
Average AUM(3) | ||||||||||||||||||||||
| Active |
$ | 1,456,692 | $ | 4,771 | $ | 926 | $ | 93,805 | $ | (8,721 | ) | $ | 1,547,473 | $ | 1,495,906 | |||||||||||||
| Index and iShares |
2,751,102 | 141,894 | — | 313,253 | (35,624 | ) | 3,170,625 | 2,945,415 | ||||||||||||||||||||
|
|
|
|
|
|
|
|
|
|
|
|
|
|
|
|||||||||||||||
| Long-term |
$ | 4,207,794 | $ | 146,665 | $ | 926 | $ | 407,058 | $ | (44,345 | ) | $ | 4,718,098 | $ | 4,441,321 | |||||||||||||
|
|
|
|
|
|
|
|
|
|
|
|
|
|
|
|||||||||||||||
| (1) | Amounts represent $560 million of AUM acquired in the Infraestructura Institucional acquisition in October 2015, $366 million of AUM acquired in the FutureAdvisor acquisition in October 2015 and $80.6 billion of AUM acquired in the BofA Global Capital Management transaction in April 2016. The FutureAdvisor acquisition amount does not include AUM that was held in iShares holdings. |
| (2) | Foreign exchange reflects the impact of translating non-U.S. dollar denominated AUM into U.S. dollars for reporting purposes. |
| (3) | Average AUM is calculated as the average of the month-end spot AUM amounts for the trailing thirteen months. |
| (4) | Advisory AUM represents long-term portfolio liquidation assignments. |
| (5) | Amounts include commodity iShares. |
-8-
SUMMARY OF REVENUE
| Three Months Ended September 30, |
Change | Three Months Ended June 30, 2016 |
Change | Nine Months Ended September 30, |
Change | |||||||||||||||||||||||||||
| (in millions), (unaudited) |
2016 | 2015 | 2016 | 2015 | ||||||||||||||||||||||||||||
| Investment advisory, administration fees and securities lending revenue: |
||||||||||||||||||||||||||||||||
| Equity: |
||||||||||||||||||||||||||||||||
| Active |
$ | 409 | $ | 427 | $ | (18 | ) | $ | 406 | $ | 3 | $ | 1,201 | $ | 1,296 | $ | (95 | ) | ||||||||||||||
| iShares |
691 | 673 | 18 | 656 | 35 | 1,970 | 2,085 | (115 | ) | |||||||||||||||||||||||
| Non-ETF Index |
170 | 158 | 12 | 174 | (4 | ) | 508 | 511 | (3 | ) | ||||||||||||||||||||||
|
|
|
|
|
|
|
|
|
|
|
|
|
|
|
|
|
|||||||||||||||||
| Equity subtotal |
1,270 | 1,258 | 12 | 1,236 | 34 | 3,679 | 3,892 | (213 | ) | |||||||||||||||||||||||
| Fixed income: |
||||||||||||||||||||||||||||||||
| Active |
427 | 402 | 25 | 414 | 13 | 1,237 | 1,162 | 75 | ||||||||||||||||||||||||
| iShares |
188 | 139 | 49 | 172 | 16 | 512 | 407 | 105 | ||||||||||||||||||||||||
| Non-ETF Index |
78 | 70 | 8 | 69 | 9 | 217 | 210 | 7 | ||||||||||||||||||||||||
|
|
|
|
|
|
|
|
|
|
|
|
|
|
|
|
|
|||||||||||||||||
| Fixed income subtotal |
693 | 611 | 82 | 655 | 38 | 1,966 | 1,779 | 187 | ||||||||||||||||||||||||
| Multi-asset |
285 | 322 | (37 | ) | 291 | (6 | ) | 860 | 942 | (82 | ) | |||||||||||||||||||||
| Alternatives: |
||||||||||||||||||||||||||||||||
| Core |
156 | 166 | (10 | ) | 168 | (12 | ) | 488 | 481 | 7 | ||||||||||||||||||||||
| Currency and commodities |
24 | 18 | 6 | 20 | 4 | 61 | 56 | 5 | ||||||||||||||||||||||||
|
|
|
|
|
|
|
|
|
|
|
|
|
|
|
|
|
|||||||||||||||||
| Alternatives subtotal |
180 | 184 | (4 | ) | 188 | (8 | ) | 549 | 537 | 12 | ||||||||||||||||||||||
|
|
|
|
|
|
|
|
|
|
|
|
|
|
|
|
|
|||||||||||||||||
| Long-term |
2,428 | 2,375 | 53 | 2,370 | 58 | 7,054 | 7,150 | (96 | ) | |||||||||||||||||||||||
| Cash management |
118 | 81 | 37 | 119 | (1 | ) | 340 | 230 | 110 | |||||||||||||||||||||||
|
|
|
|
|
|
|
|
|
|
|
|
|
|
|
|
|
|||||||||||||||||
| Total base fees |
2,546 | 2,456 | 90 | 2,489 | 57 | 7,394 | 7,380 | 14 | ||||||||||||||||||||||||
| Investment advisory performance fees: |
||||||||||||||||||||||||||||||||
| Equity |
14 | 23 | (9 | ) | 42 | (28 | ) | 67 | 121 | (54 | ) | |||||||||||||||||||||
| Fixed income |
2 | 3 | (1 | ) | 2 | — | 9 | 10 | (1 | ) | ||||||||||||||||||||||
| Multi-asset |
1 | 3 | (2 | ) | 2 | (1 | ) | 6 | 19 | (13 | ) | |||||||||||||||||||||
| Alternatives |
41 | 179 | (138 | ) | 28 | 13 | 84 | 302 | (218 | ) | ||||||||||||||||||||||
|
|
|
|
|
|
|
|
|
|
|
|
|
|
|
|
|
|||||||||||||||||
| Total performance fees |
58 | 208 | (150 | ) | 74 | (16 | ) | 166 | 452 | (286 | ) | |||||||||||||||||||||
| BlackRock Solutions and advisory |
174 | 167 | 7 | 172 | 2 | 517 | 475 | 42 | ||||||||||||||||||||||||
| Distribution fees |
10 | 14 | (4 | ) | 11 | (1 | ) | 32 | 44 | (12 | ) | |||||||||||||||||||||
| Other revenue |
49 | 65 | (16 | ) | 58 | (9 | ) | 156 | 187 | (31 | ) | |||||||||||||||||||||
|
|
|
|
|
|
|
|
|
|
|
|
|
|
|
|
|
|||||||||||||||||
| Total revenue |
$ | 2,837 | $ | 2,910 | $ | (73 | ) | $ | 2,804 | $ | 33 | $ | 8,265 | $ | 8,538 | $ | (273 | ) | ||||||||||||||
|
|
|
|
|
|
|
|
|
|
|
|
|
|
|
|
|
|||||||||||||||||
Highlights
| • | Investment advisory, administration fees and securities lending revenue increased $90 million from the third quarter of 2015 reflecting the impact of organic growth, higher markets on long-term average AUM and the effect of AUM acquired in the BofA Global Capital Management transaction, partially offset by mix shift from equities to fixed income and cash products. Securities lending revenue of $142 million in the current quarter increased $27 million from the third quarter of 2015, primarily reflecting higher average balances of securities on loan and higher spreads. |
Investment advisory, administration fees and securities lending revenue increased $57 million from the second quarter of 2016, driven by higher average AUM and the effect of one additional day in the current quarter. Securities lending revenue decreased $9 million from the second quarter of 2016.
| • | Performance fees decreased $150 million from the third quarter of 2015, primarily reflecting strong performance from a single hedge fund with an annual measurement period that ended in the third quarter of 2015, and decreased $16 million from the second quarter of 2016. |
| • | BlackRock Solutions® and advisory revenue increased $7 million from the third quarter of 2015 and $2 million from the second quarter of 2016. BlackRock Solutions and advisory revenue included $152 million of Aladdin revenue in the current quarter compared with $135 million in the third quarter of 2015 and $146 million in the second quarter of 2016. |
-9-
SUMMARY OF OPERATING EXPENSE
| Three Months Ended September 30, |
Change | Three Months Ended June 30, 2016 |
Change | Nine Months Ended September 30, |
Change | |||||||||||||||||||||||||||
| (in millions), (unaudited) |
2016 | 2015 | 2016 | 2015 | ||||||||||||||||||||||||||||
| Operating Expense |
||||||||||||||||||||||||||||||||
| Employee compensation and benefits |
$ | 969 | $ | 1,023 | $ | (54 | ) | $ | 977 | $ | (8 | ) | $ | 2,893 | $ | 3,016 | $ | (123 | ) | |||||||||||||
| Distribution and servicing costs |
114 | 102 | 12 | 109 | 5 | 320 | 306 | 14 | ||||||||||||||||||||||||
| Amortization of deferred sales commissions |
8 | 12 | (4 | ) | 9 | (1 | ) | 27 | 37 | (10 | ) | |||||||||||||||||||||
| Direct fund expense |
200 | 198 | 2 | 195 | 5 | 583 | 578 | 5 | ||||||||||||||||||||||||
| General and administration |
312 | 319 | (7 | ) | 316 | (4 | ) | 946 | 970 | (24 | ) | |||||||||||||||||||||
| Restructuring charge |
— | — | — | — | — | 76 | — | 76 | ||||||||||||||||||||||||
| Amortization of intangible assets |
25 | 34 | (9 | ) | 25 | — | 75 | 104 | (29 | ) | ||||||||||||||||||||||
|
|
|
|
|
|
|
|
|
|
|
|
|
|
|
|
|
|||||||||||||||||
| Total Operating Expense |
$ | 1,628 | $ | 1,688 | $ | (60 | ) | $ | 1,631 | $ | (3 | ) | $ | 4,920 | $ | 5,011 | $ | (91 | ) | |||||||||||||
|
|
|
|
|
|
|
|
|
|
|
|
|
|
|
|
|
|||||||||||||||||
Highlights
| • | Employee compensation and benefits decreased $54 million from the third quarter of 2015, reflecting lower incentive compensation, driven primarily by lower performance fees, and decreased $8 million from the second quarter of 2016. |
| • | General and administration expense decreased $7 million from the third quarter of 2015, reflecting expense discipline, and decreased $4 million from the second quarter of 2016. |
INCOME TAX EXPENSE
| Three Months Ended September 30, |
Change | Three Months Ended June 30, 2016 |
Change | Nine Months Ended September 30, |
Change | |||||||||||||||||||||||||||
| (in millions), (unaudited) |
2016 | 2015 | 2016 | 2015 | ||||||||||||||||||||||||||||
| Income tax expense |
$ | 333 | $ | 342 | $ | (9 | ) | $ | 353 | $ | (20 | ) | $ | 954 | $ | 971 | $ | (17 | ) | |||||||||||||
Highlights
| • | The third quarter 2016 income tax expense included a $26 million net noncash tax benefit, primarily related to the revaluation of certain deferred income tax liabilities as a result of legislation enacted in the United Kingdom, and domestic state and local tax changes. |
| • | The second quarter 2016 income tax expense included a $4 million net noncash expense, primarily related to the revaluation of certain deferred income tax liabilities as a result of domestic state and local tax changes. |
| • | The third quarter 2015 income tax expense included a $6 million noncash tax benefit, primarily associated with the revaluation of certain deferred income tax liabilities as a result of domestic state and local tax changes. |
-10-
SUMMARY OF NONOPERATING INCOME (EXPENSE)
| Three Months Ended September 30, |
Three Months Ended June 30, 2016 |
Nine Months Ended September 30, |
||||||||||||||||||||||||||||||||||
| (in millions), (unaudited) |
2016 | 2015 | Change | Change | 2016 | 2015 | Change | |||||||||||||||||||||||||||||
| Nonoperating income (expense), GAAP basis |
|
$ | 1 | $ | (48 | ) | $ | 49 | $ | (25 | ) | $ | 26 | $ | (72 | ) | $ | (73 | ) | $ | 1 | |||||||||||||||
| Less: Net income (loss) attributable to NCI |
|
2 | (11 | ) | 13 | 6 | (4 | ) | (2 | ) | (1 | ) | (1 | ) | ||||||||||||||||||||||
|
|
|
|
|
|
|
|
|
|
|
|
|
|
|
|
|
|||||||||||||||||||||
| Nonoperating income (expense)(1) |
|
$ | (1 | ) | $ | (37 | ) | $ | 36 | $ | (31 | ) | $ | 30 | $ | (70 | ) | $ | (72 | ) | $ | 2 | ||||||||||||||
|
|
|
|
|
|
|
|
|
|
|
|
|
|
|
|
|
|||||||||||||||||||||
| Estimated economic investments at September 30, 2016(2) |
Three Months Ended September 30, |
Three Months Ended June 30, 2016 |
Nine Months Ended September 30, |
|||||||||||||||||||||||||||||||||
| (in millions), (unaudited) |
2016 | 2015 | Change | Change | 2016 | 2015 | Change | |||||||||||||||||||||||||||||
| Net gain (loss) on investments(1) |
||||||||||||||||||||||||||||||||||||
| Private equity |
15-20% | $ | 2 | $ | 25 | $ | (23 | ) | $ | 7 | $ | (5 | ) | $ | 11 | $ | 35 | $ | (24 | ) | ||||||||||||||||
| Real assets |
5-10% | 2 | 5 | (3 | ) | 1 | 1 | 5 | 9 | (4 | ) | |||||||||||||||||||||||||
| Other alternatives(3) |
10-15% | 9 | (10 | ) | 19 | 4 | 5 | 13 | (6 | ) | 19 | |||||||||||||||||||||||||
| Other investments(4) |
60-65% | 16 | (19 | ) | 35 | 2 | 14 | 22 | (23 | ) | 45 | |||||||||||||||||||||||||
|
|
|
|
|
|
|
|
|
|
|
|
|
|
|
|
|
|||||||||||||||||||||
| Subtotal |
|
29 | 1 | 28 | 14 | 15 | 51 | 15 | 36 | |||||||||||||||||||||||||||
| Other gains(5) |
|
— | — | — | — | — | — | 45 | (45 | ) | ||||||||||||||||||||||||||
|
|
|
|
|
|
|
|
|
|
|
|
|
|
|
|
|
|||||||||||||||||||||
| Total net gain (loss) on investments(1) |
|
29 | 1 | 28 | 14 | 15 | 51 | 60 | (9 | ) | ||||||||||||||||||||||||||
| Interest and dividend income |
|
22 | 12 | 10 | 6 | 16 | 33 | 21 | 12 | |||||||||||||||||||||||||||
| Interest expense |
|
(52 | ) | (50 | ) | (2 | ) | (51 | ) | (1 | ) | (154 | ) | (153 | ) | (1 | ) | |||||||||||||||||||
|
|
|
|
|
|
|
|
|
|
|
|
|
|
|
|
|
|||||||||||||||||||||
| Net interest expense |
|
(30 | ) | (38 | ) | 8 | (45 | ) | 15 | (121 | ) | (132 | ) | 11 | ||||||||||||||||||||||
|
|
|
|
|
|
|
|
|
|
|
|
|
|
|
|
|
|||||||||||||||||||||
| Total nonoperating income (expense)(1) |
|
(1 | ) | (37 | ) | 36 | (31 | ) | 30 | (70 | ) | (72 | ) | 2 | ||||||||||||||||||||||
| Compensation expense related to (appreciation) depreciation on deferred compensation plans |
|
— | 5 | (5 | ) | — | — | — | 1 | (1 | ) | |||||||||||||||||||||||||
|
|
|
|
|
|
|
|
|
|
|
|
|
|
|
|
|
|||||||||||||||||||||
| Nonoperating income (expense), as adjusted(1) |
|
$ | (1 | ) | $ | (32 | ) | $ | 31 | $ | (31 | ) | $ | 30 | $ | (70 | ) | $ | (71 | ) | $ | 1 | ||||||||||||||
|
|
|
|
|
|
|
|
|
|
|
|
|
|
|
|
|
|||||||||||||||||||||
| (1) | Net of net income (loss) attributable to noncontrolling interests (“NCI”). |
| (2) | Percentages represent estimated percentages of BlackRock’s corporate economic investment portfolio at September 30, 2016. Economic investment amounts at June 30, 2016 for private equity, real assets, other alternatives and other investments were $351 million, $106 million, $230 million and $826 million, respectively. |
| (3) | Amounts primarily include net gains (losses) related to direct hedge fund strategies and hedge fund solutions. |
| (4) | Amounts include net gains (losses) related to equity and fixed income investments, and BlackRock’s seed capital hedging program. |
| (5) | Amount for the nine months ended September 30, 2015 primarily includes a gain related to the acquisition of certain assets of BlackRock Kelso Capital Advisors LLC. |
Highlights
| • | Net interest expense in the current quarter reflected higher dividend income compared with third quarter of 2015 and second quarter of 2016. |
-11-
ECONOMIC TANGIBLE ASSETS
The Company presents economic tangible assets as additional information to enable investors to exclude certain assets that have equal and offsetting liabilities or noncontrolling interests that ultimately do not have an impact on stockholders’ equity or cash flows. In addition, goodwill and intangible assets are excluded from economic tangible assets.
Economic tangible assets include cash, receivables, seed and co-investments, regulatory investments and other assets.
| (in billions), (unaudited) |
September 30, 2016 (Est.) |
December 31, 2015 |
||||||
| Total balance sheet assets |
$ | 227 | $ | 225 | ||||
| Separate account assets and separate account collateral held under securities lending agreements |
(184 | ) | (182 | ) | ||||
| Consolidated sponsored investment funds |
— | (1 | ) | |||||
| Goodwill and intangible assets, net |
(31 | ) | (30 | ) | ||||
|
|
|
|
|
|||||
| Economic tangible assets |
$ | 12 | $ | 12 | ||||
|
|
|
|
|
|||||
-12-
RECONCILIATION OF U.S. GAAP OPERATING INCOME AND OPERATING MARGIN TO OPERATING INCOME AND OPERATING MARGIN, AS ADJUSTED
| Three Months Ended | Nine Months Ended September 30, |
|||||||||||||||||||
| September 30, | June 30, | |||||||||||||||||||
| (in millions), (unaudited) |
2016 | 2015 | 2016 | 2016 | 2015 | |||||||||||||||
| Operating income, GAAP basis |
$ | 1,209 | $ | 1,222 | $ | 1,173 | $ | 3,345 | $ | 3,527 | ||||||||||
| Non-GAAP expense adjustments: |
||||||||||||||||||||
| Restructuring charge |
— | — | — | 76 | — | |||||||||||||||
| PNC LTIP funding obligation |
7 | 10 | 6 | 21 | 26 | |||||||||||||||
| Compensation expense related to appreciation (depreciation) on deferred compensation plans |
— | (5 | ) | — | — | (1 | ) | |||||||||||||
|
|
|
|
|
|
|
|
|
|
|
|||||||||||
| Operating income, as adjusted |
1,216 | 1,227 | 1,179 | 3,442 | 3,552 | |||||||||||||||
| Product launch costs and commissions |
— | — | — | — | 5 | |||||||||||||||
|
|
|
|
|
|
|
|
|
|
|
|||||||||||
| Operating income used for operating margin measurement |
$ | 1,216 | $ | 1,227 | $ | 1,179 | $ | 3,442 | $ | 3,557 | ||||||||||
|
|
|
|
|
|
|
|
|
|
|
|||||||||||
| Revenue, GAAP basis |
$ | 2,837 | $ | 2,910 | $ | 2,804 | $ | 8,265 | $ | 8,538 | ||||||||||
| Non-GAAP adjustments: |
||||||||||||||||||||
| Distribution and servicing costs |
(114 | ) | (102 | ) | (109 | ) | (320 | ) | (306 | ) | ||||||||||
| Amortization of deferred sales commissions |
(8 | ) | (12 | ) | (9 | ) | (27 | ) | (37 | ) | ||||||||||
|
|
|
|
|
|
|
|
|
|
|
|||||||||||
| Revenue used for operating margin measurement |
$ | 2,715 | $ | 2,796 | $ | 2,686 | $ | 7,918 | $ | 8,195 | ||||||||||
|
|
|
|
|
|
|
|
|
|
|
|||||||||||
| Operating margin, GAAP basis |
42.6 | % | 42.0 | % | 41.8 | % | 40.5 | % | 41.3 | % | ||||||||||
|
|
|
|
|
|
|
|
|
|
|
|||||||||||
| Operating margin, as adjusted |
44.8 | % | 43.9 | % | 43.9 | % | 43.5 | % | 43.4 | % | ||||||||||
|
|
|
|
|
|
|
|
|
|
|
|||||||||||
See note (1) to the Condensed Consolidated Statements of Income and Supplemental Information on page 14 for more information on as adjusted items and the reconciliation to GAAP.
RECONCILIATION OF U.S. GAAP NONOPERATING INCOME NET OF NCI TO NONOPERATING INCOME NET OF NCI, AS ADJUSTED
| Three Months Ended | Nine Months Ended September 30, |
|||||||||||||||||||
| September 30, | June 30, | |||||||||||||||||||
| (in millions), (unaudited) |
2016 | 2015 | 2016 | 2016 | 2015 | |||||||||||||||
| Nonoperating income (expense), GAAP basis |
$ | 1 | $ | (48 | ) | $ | (25 | ) | $ | (72 | ) | $ | (73 | ) | ||||||
| Less: Net income (loss) attributable to NCI |
2 | (11 | ) | 6 | (2 | ) | (1 | ) | ||||||||||||
|
|
|
|
|
|
|
|
|
|
|
|||||||||||
| Nonoperating income (expense), net of NCI |
(1 | ) | (37 | ) | (31 | ) | (70 | ) | (72 | ) | ||||||||||
| Compensation expense related to (appreciation) depreciation on deferred compensation plans |
— | 5 | — | — | 1 | |||||||||||||||
|
|
|
|
|
|
|
|
|
|
|
|||||||||||
| Nonoperating income (expense), less net income (loss) attributable to NCI, as adjusted |
$ | (1 | ) | $ | (32 | ) | $ | (31 | ) | $ | (70 | ) | $ | (71 | ) | |||||
|
|
|
|
|
|
|
|
|
|
|
|||||||||||
See note (2) to the Condensed Consolidated Statements of Income and Supplemental Information on page 14 for more information on as adjusted items and the reconciliation to GAAP.
RECONCILIATION OF U.S. GAAP NET INCOME ATTRIBUTABLE TO BLACKROCK TO NET INCOME ATTRIBUTABLE TO BLACKROCK, AS ADJUSTED
| Three Months Ended | Nine Months Ended September 30, |
|||||||||||||||||||
| September 30, | June 30, | |||||||||||||||||||
| (in millions, except per share data), (unaudited) |
2016 | 2015 | 2016 | 2016 | 2015 | |||||||||||||||
| Net income attributable to BlackRock, Inc., GAAP basis |
$ | 875 | $ | 843 | $ | 789 | $ | 2,321 | $ | 2,484 | ||||||||||
| Non-GAAP adjustments: |
||||||||||||||||||||
| Restructuring charge (including $23 tax benefit) |
— | — | — | 53 | — | |||||||||||||||
| PNC LTIP funding obligation, net of tax |
5 | 7 | 4 | 14 | 18 | |||||||||||||||
| Income tax matters |
(26 | ) | (6 | ) | 4 | (26 | ) | 10 | ||||||||||||
|
|
|
|
|
|
|
|
|
|
|
|||||||||||
| Net income attributable to BlackRock, Inc., as adjusted |
$ | 854 | $ | 844 | $ | 797 | $ | 2,362 | $ | 2,512 | ||||||||||
|
|
|
|
|
|
|
|
|
|
|
|||||||||||
| Diluted weighted-average common shares outstanding(4) |
166.3 | 168.7 | 166.6 | 166.8 | 169.2 | |||||||||||||||
| Diluted earnings per common share, GAAP basis(4) |
$ | 5.26 | $ | 5.00 | $ | 4.73 | $ | 13.92 | $ | 14.68 | ||||||||||
| Diluted earnings per common share, as adjusted(4) |
$ | 5.14 | $ | 5.00 | $ | 4.78 | $ | 14.16 | $ | 14.85 | ||||||||||
See notes (3) and (4) to the Condensed Consolidated Statements of Income and Supplemental Information on page 15 for more information on as adjusted items and the reconciliation to GAAP.
-13-
NOTES TO CONDENSED CONSOLIDATED STATEMENTS OF INCOME AND SUPPLEMENTAL INFORMATION (unaudited)
BlackRock reports its financial results in accordance with accounting principles generally accepted in the United States (“GAAP”); however, management believes evaluating the Company’s ongoing operating results may be enhanced if investors have additional non-GAAP financial measures. Management reviews non-GAAP financial measures to assess ongoing operations and, for the reasons described below, considers them to be effective indicators, for both management and investors, of BlackRock’s financial performance over time. Management also uses non-GAAP financial measures as a benchmark to compare its performance with other companies and to enhance the comparability of this information for the reporting periods presented. Non-GAAP measures may pose limitations because they do not include all of BlackRock’s revenue and expense. BlackRock’s management does not advocate that investors consider such non-GAAP financial measures in isolation from, or as a substitute for, financial information prepared in accordance with GAAP.
Management uses both GAAP and non-GAAP financial measures in evaluating BlackRock’s financial performance. Adjustments to GAAP financial measures (“non-GAAP adjustments”) include certain items management deems nonrecurring or that occur infrequently, transactions that ultimately will not impact BlackRock’s book value or certain tax items that do not impact cash flow.
Computations for all periods are derived from the condensed consolidated statements of income as follows:
(1) Operating income, as adjusted, and operating margin, as adjusted: Management believes operating income, as adjusted, and operating margin, as adjusted, are effective indicators of BlackRock’s financial performance over time and, therefore, provide useful disclosure to investors.
| • | Operating income, as adjusted, includes non-GAAP expense adjustments. A restructuring charge comprised of severance and accelerated amortization expense of previously granted deferred compensation awards has been excluded to provide more meaningful analysis of BlackRock’s ongoing operations and to ensure comparability among periods presented. The portion of compensation expense associated with certain long-term incentive plans (“LTIP”) funded, or to be funded, through share distributions to participants of BlackRock stock held by The PNC Financial Services Group, Inc. (“PNC”) has been excluded because it ultimately does not impact BlackRock’s book value. Compensation expense associated with appreciation (depreciation) on investments related to certain BlackRock deferred compensation plans has been excluded, as returns on investments set aside for these plans, which substantially offset this expense, are reported in nonoperating income (expense). |
| • | Operating income used for measuring operating margin, as adjusted, is equal to operating income, as adjusted, excluding the impact of product launch costs (e.g. closed-end fund launch costs) and related commissions. Management believes the exclusion of such costs and related commissions is useful because these costs can fluctuate considerably and revenue associated with the expenditure of these costs will not fully impact BlackRock’s results until future periods. |
Revenue used for operating margin, as adjusted, excludes distribution and servicing costs paid to related parties and other third parties. Management believes the exclusion of such costs is useful because it creates consistency in the treatment for certain contracts for similar services, which due to the terms of the contracts, are accounted for under GAAP on a net basis within investment advisory, administration fees and securities lending revenue. Amortization of deferred sales commissions is excluded from revenue used for operating margin measurement, as adjusted, because such costs, over time, substantially offset distribution fee revenue the Company earns. For each of these items, BlackRock excludes from revenue used for operating margin, as adjusted, the costs related to each of these items as a proxy for such offsetting revenue.
(2) Nonoperating income (expense), less net income (loss) attributable to NCI, as adjusted: Nonoperating income (expense), less net income (loss) attributable to NCI, as adjusted, equals nonoperating income (expense), GAAP basis, less net income (loss) attributable to NCI, adjusted for compensation expense associated with (appreciation) depreciation on investments related to certain BlackRock deferred compensation plans. The compensation expense offset is recorded in operating income. This compensation expense has been included in nonoperating income (expense), less net income (loss) attributable to NCI, as adjusted, to offset returns on investments set aside for these plans, which are reported in nonoperating income (expense), GAAP basis.
Management believes nonoperating income (expense), less net income (loss) attributable to NCI, as adjusted, provides comparability of information among reporting periods and is an effective measure for reviewing BlackRock’s nonoperating contribution to results.
-14-
(3) Net income attributable to BlackRock, Inc., as adjusted: Management believes net income attributable to BlackRock, Inc., as adjusted, and diluted earnings per common share, as adjusted, are useful measures of BlackRock’s profitability and financial performance. Net income attributable to BlackRock, Inc., as adjusted, equals net income attributable to BlackRock, Inc., GAAP basis, adjusted for significant nonrecurring items, charges that ultimately will not impact BlackRock’s book value or certain tax items that do not impact cash flow.
See aforementioned discussion regarding operating income, as adjusted, and operating margin, as adjusted, for information on the PNC LTIP funding obligation and the restructuring charge.
For each period presented, the non-GAAP adjustment related to the restructuring charge and PNC LTIP funding obligation was tax effected at the respective blended rates applicable to the adjustments. Amounts for income tax matters represent net noncash (benefits) expense primarily associated with the revaluation of certain deferred tax liabilities related to intangible assets and goodwill. Amounts have been excluded from the as adjusted results as these items will not have a cash flow impact and to ensure comparability among periods presented.
Per share amounts reflect net income attributable to BlackRock, as adjusted divided by diluted weighted average common shares outstanding.
(4) Nonvoting participating preferred stock is considered to be a common stock equivalent for purposes of determining basic and diluted earnings per share calculations.
-15-
Forward-looking Statements
This earnings release, and other statements that BlackRock may make, may contain forward-looking statements within the meaning of the Private Securities Litigation Reform Act, with respect to BlackRock’s future financial or business performance, strategies or expectations. Forward-looking statements are typically identified by words or phrases such as “trend,” “potential,” “opportunity,” “pipeline,” “believe,” “comfortable,” “expect,” “anticipate,” “current,” “intention,” “estimate,” “position,” “assume,” “outlook,” “continue,” “remain,” “maintain,” “sustain,” “seek,” “achieve,” and similar expressions, or future or conditional verbs such as “will,” “would,” “should,” “could,” “may” and similar expressions.
BlackRock cautions that forward-looking statements are subject to numerous assumptions, risks and uncertainties, which change over time. Forward-looking statements speak only as of the date they are made, and BlackRock assumes no duty to and does not undertake to update forward-looking statements. Actual results could differ materially from those anticipated in forward-looking statements and future results could differ materially from historical performance.
In addition to risk factors previously disclosed in BlackRock’s Securities and Exchange Commission (“SEC”) reports and those identified elsewhere in this earnings release, the following factors, among others, could cause actual results to differ materially from forward-looking statements or historical performance: (1) the introduction, withdrawal, success and timing of business initiatives and strategies; (2) changes and volatility in political, economic or industry conditions, the interest rate environment, foreign exchange rates or financial and capital markets, which could result in changes in demand for products or services or in the value of assets under management; (3) the relative and absolute investment performance of BlackRock’s investment products; (4) the impact of increased competition; (5) the impact of future acquisitions or divestitures; (6) the unfavorable resolution of legal proceedings; (7) the extent and timing of any share repurchases; (8) the impact, extent and timing of technological changes and the adequacy of intellectual property, information and cyber security protection; (9) the impact of legislative and regulatory actions and reforms, including the Dodd-Frank Wall Street Reform and Consumer Protection Act, and regulatory, supervisory or enforcement actions of government agencies relating to BlackRock or PNC; (10) terrorist activities, international hostilities and natural disasters, which may adversely affect the general economy, domestic and local financial and capital markets, specific industries or BlackRock; (11) the ability to attract and retain highly talented professionals; (12) fluctuations in the carrying value of BlackRock’s economic investments; (13) the impact of changes to tax legislation, including income, payroll and transaction taxes, and taxation on products or transactions, which could affect the value proposition to clients and, generally, the tax position of the Company; (14) BlackRock’s success in maintaining the distribution of its products; (15) the impact of BlackRock electing to provide support to its products from time to time and any potential liabilities related to securities lending or other indemnification obligations; and (16) the impact of problems at other financial institutions or the failure or negative performance of products at other financial institutions.
BlackRock’s Annual Report on Form 10-K, Quarterly Reports on Form 10-Q and BlackRock’s subsequent filings with the SEC, accessible on the SEC’s website at www.sec.gov and on BlackRock’s website at www.blackrock.com, discuss these factors in more detail and identify additional factors that can affect forward-looking statements. The information contained on the Company’s website is not a part of this earnings release.
Performance Notes
Past performance is not indicative of future results. Except as specified, the performance information shown is as of September 30, 2016 and is based on preliminary data available at that time. The performance data shown reflects information for all actively and passively managed equity and fixed income accounts, including U.S. registered investment companies, European-domiciled retail funds and separate accounts for which performance data is available, including performance data for high net worth accounts available as of August 31, 2016. The performance data does not include accounts terminated prior to September 30, 2016 and accounts for which data has not yet been verified. If such accounts had been included, the performance data provided may have substantially differed from that shown.
Performance comparisons shown are gross-of-fees for institutional and high net worth separate accounts, and net-of-fees for retail funds. The performance tracking shown for index accounts is based on gross-of-fees performance and includes all institutional accounts and all iShares funds globally using an index strategy. AUM information is based on AUM available as of September 30, 2016 for each account or fund in the asset class shown without adjustment for overlapping management of the same account or fund. Fund performance reflects the reinvestment of dividends and distributions.
Source of performance information and peer medians is BlackRock, Inc. and is based in part on data from Lipper Inc. for U.S. funds and Morningstar, Inc. for non-U.S. funds.
-16-
| Exhibit 99.2
|
Exhibit 99.2
Q3 2016 Earnings
Earnings Release Supplement:
October 18, 2016
|
|
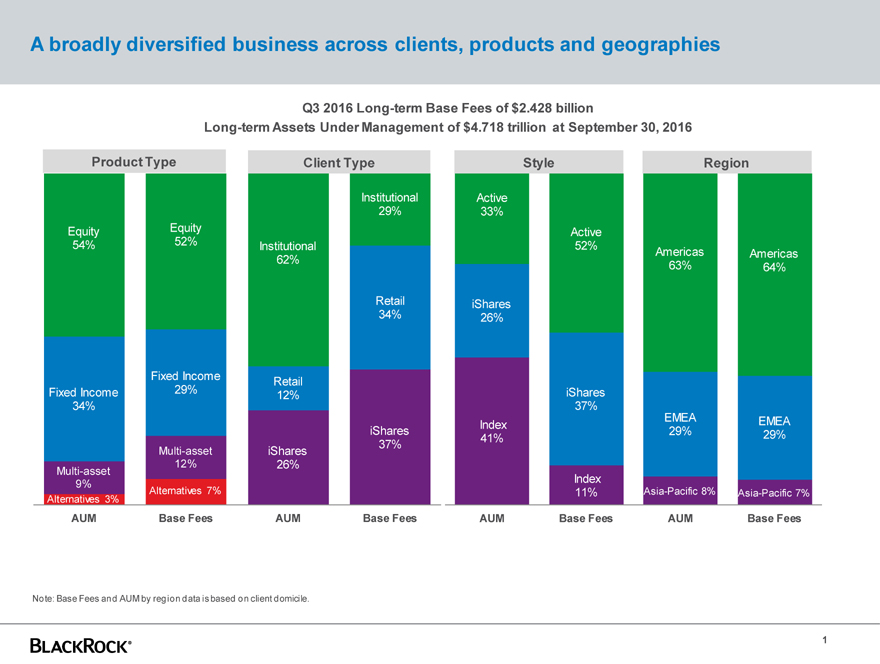
A broadly diversified business across clients, products and geographies
Q3 2016 Long-term Base Fees of $2.428 billion
Long-term Assets Under Management of $4.718 trillion at September 30, 2016
Product Type Client Type Style Region
Institutional Active
29% 33%
Equity Equity Active
54% 52% Institutional 52% Americas Americas
62% 63% 64%
Retail iShares
34% 26%
Fixed Income Retail
Fixed Income 29% 12% iShares
34% 37%
Index EMEA EMEA
iShares 41% 29% 29%
Multi-asset iShares 37%
Multi-asset 12% 26%
9% Index
Alternatives 3% Alternatives 7% 11% Asia-Pacific 8% Asia-Pacific 7%
AUM Base Fees AUM Base Fees AUM Base Fees AUM Base Fees
Note: Base Fees and AUM by region data is based on client domicile.
1
|
|
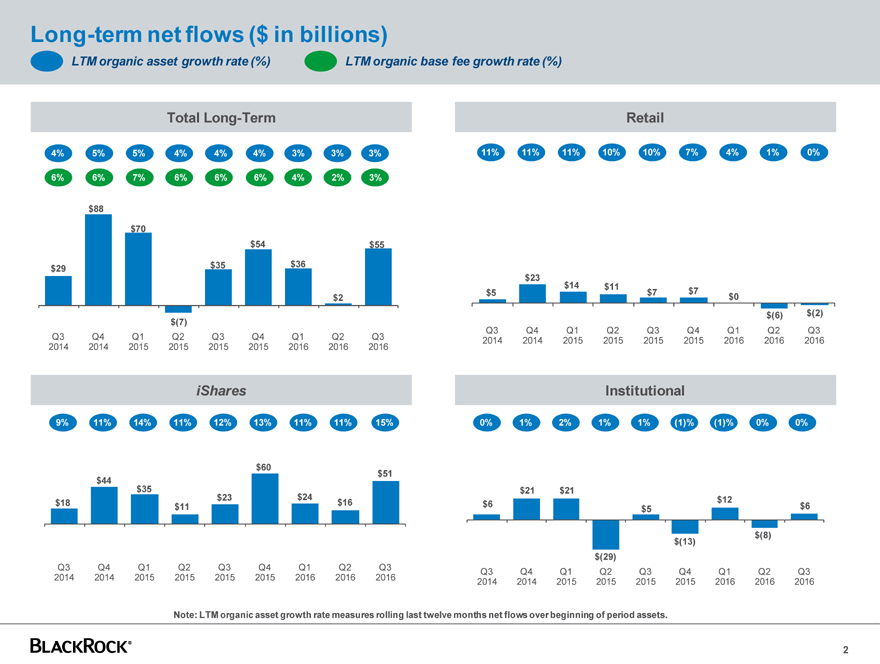
Long-term net flows ($ in billions)
LTM organic asset growth rate (%) LTM organic base fee growth rate (%)
Total Long-Term Retail
4% 5% 5% 4% 4% 4% 3% 3% 3% 11% 11% 11% 10% 10% 7% 4% 1% 0%
6% 6% 7% 6% 6% 6% 4% 2% 3%
$88
$70
$54 $55
$29 $35 $36
$23
$14 $11
$2 $5 $7 $7 $0
$(7) $(6) $(2)
Q3 Q4 Q1 Q2 Q3 Q4 Q1 Q2 Q3
Q3 Q4 Q1 Q2 Q3 Q4 Q1 Q2 Q3 2014 2014 2015 2015 2015 2015 2016 2016 2016
2014 2014 2015 2015 2015 2015 2016 2016 2016
iShares Institutional
9% 11% 14% 11% 12% 13% 11% 11% 15% 0% 1% 2% 1% 1% (1)% (1)% 0% 0%
$60 $51
$44
$35 $21 $21
$18 $23 $24 $16 $6 $12 $6
$11 $5
$(13) $(8)
$(29)
Q3 Q4 Q1 Q2 Q3 Q4 Q1 Q2 Q3 Q3 Q4 Q1 Q2 Q3 Q4 Q1 Q2 Q3
2014 2014 2015 2015 2015 2015 2016 2016 2016 2014 2014 2015 2015 2015 2015 2016 2016 2016
Note: LTM organic asset growth rate measures rolling last twelve months net flows over beginning of period assets.
2
|
|
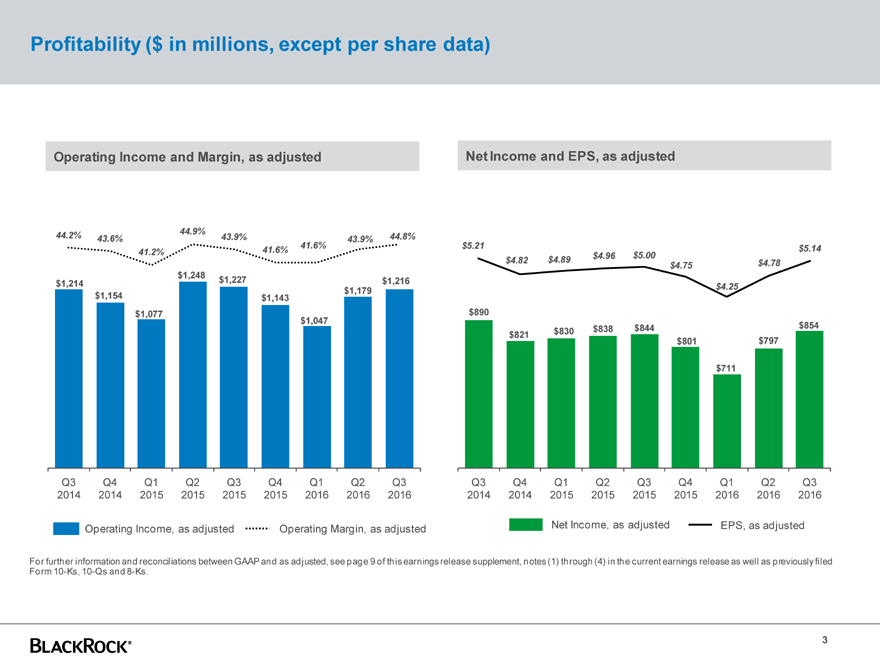
Profitability ($ in millions, except per share data)
Operating Income and Margin, as adjusted
44.9%
44.2% 43.6% 43.9% 43.9% 44.8%
41.2% 41.6% 41.6%
$1,248 $1,227
$1,214 $1,216
$1,154 $1,143 $1,179
$1,077 $1,047
Q3 Q4 Q1 Q2 Q3 Q4 Q1 Q2 Q3
2014 2014 2015 2015 2015 2015 2016 2016 2016
Net Income and EPS, as adjusted
$5.21 $5.00 $5.14
$4.82 $4.89 $4.96
$4.75 $4.78
$4.25
$890 $838 $844 $854 $821 $830 $797 $801
$711
Q3 Q4 Q1 Q2 Q3 Q4 Q1 Q2 Q3 2014 2014 2015 2015 2015 2015 2016 2016 2016
Net Income, as adjusted EPS, as adjusted
Operating Income, as adjusted Operating Margin, as adjusted
For further information and reconciliations between GAAP and as adjusted, see page 9 of this earnings release supplement, notes (1) through (4) in the current earnings release as well as previously filed Form 10-Ks, 10-Qs and 8-Ks.
3
|
|
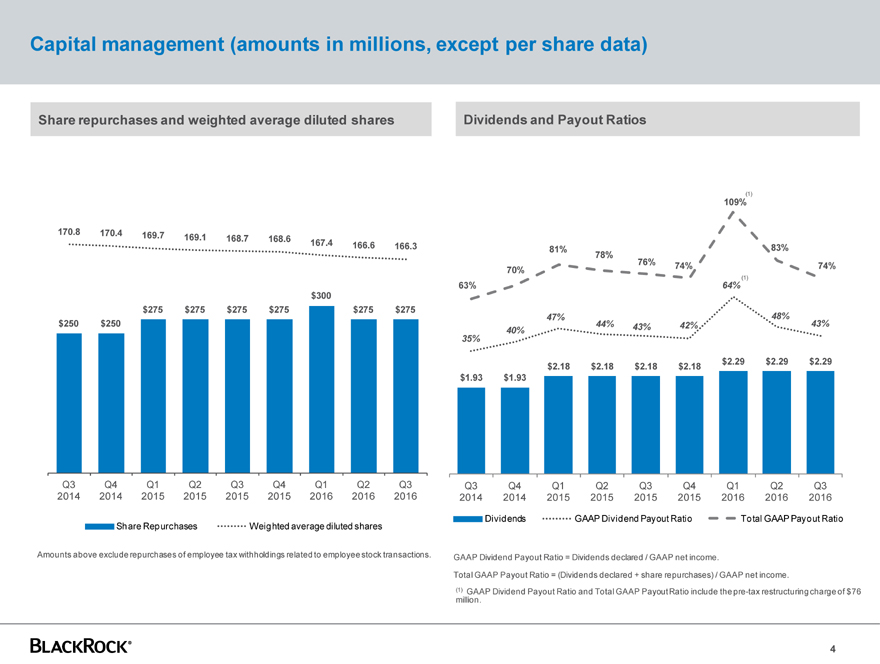
Capital management (amounts in millions, except per share data)
Share repurchases and weighted average diluted shares
170.8 170.4 169.7
169.1 168.7 168.6
167.4 166.6 166.3
$300 $275 $275 $275 $275 $275 $275 $250 $250
Q3 Q4 Q1 Q2 Q3 Q4 Q1 Q2 Q3
2014 2014 2015 2015 2015 2015 2016 2016 2016
Share Repurchases Weighted average diluted shares
Amounts above exclude repurchases of employee tax withholdings related to employee stock transactions.
Dividends and Payout Ratios
109%(1)
81% 83% 78%
76% 74% 74% 70%
(1)
63% 64%
47% 48%
44% 43% 42% 43% 40% 35%
$2.29 $2.29 $2.29
$2.18 $2.18 $2.18 $2.18
$1.93 $1.93
Q3 Q4 Q1 Q2 Q3 Q4 Q1 Q2 Q3
2014 2014 2015 2015 2015 2015 2016 2016 2016
Dividends GAAP Dividend Payout Ratio Total GAAP Payout Ratio
GAAP Dividend Payout Ratio = Dividends declared / GAAP net income.
Total GAAP Payout Ratio = (Dividends declared + share repurchases) / GAAP net income.
(1) GAAP Dividend Payout Ratio and Total GAAP Payout Ratio include the pre-tax restructuring charge of $76 million.
4
|
|
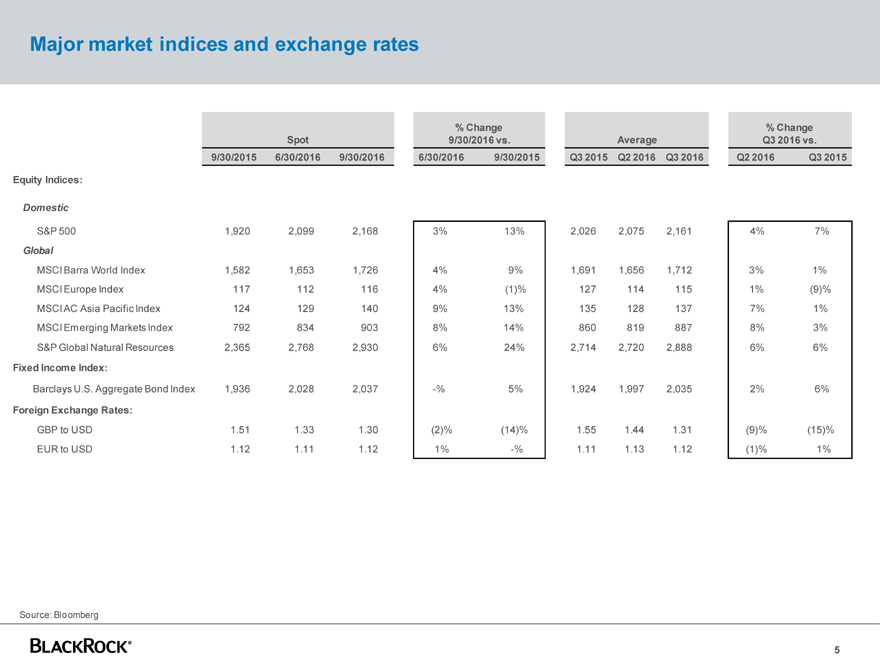
Major market indices and exchange rates
% Change % Change
Spot 9/30/2016 vs. Average Q3 2016 vs.
9/30/2015 6/30/2016 9/30/2016 6/30/2016 9/30/2015 Q3 2015 Q2 2016 Q3 2016 Q2 2016 Q3 2015
Equity Indices:
Domestic
S&P 500 1,920 2,099 2,168 3% 13% 2,026 2,075 2,161 4% 7%
Global
MSCI Barra World Index 1,582 1,653 1,726 4% 9% 1,691 1,656 1,712 3% 1%
MSCI Europe Index 117 112 116 4% (1)% 127 114 115 1% (9)%
MSCI AC Asia Pacific Index 124 129 140 9% 13% 135 128 137 7% 1%
MSCI Emerging Markets Index 792 834 903 8% 14% 860 819 887 8% 3%
S&P Global Natural Resources 2,365 2,768 2,930 6% 24% 2,714 2,720 2,888 6% 6%
Fixed Income Index:
Barclays U.S. Aggregate Bond Index 1,936 2,028 2,037 -% 5% 1,924 1,997 2,035 2% 6%
Foreign Exchange Rates:
GBP to USD 1.51 1.33 1.30 (2)% (14)% 1.55 1.44 1.31 (9)% (15)%
EUR to USD 1.12 1.11 1.12 1% -% 1.11 1.13 1.12 (1)% 1%
Source: Bloomberg
5
|
|
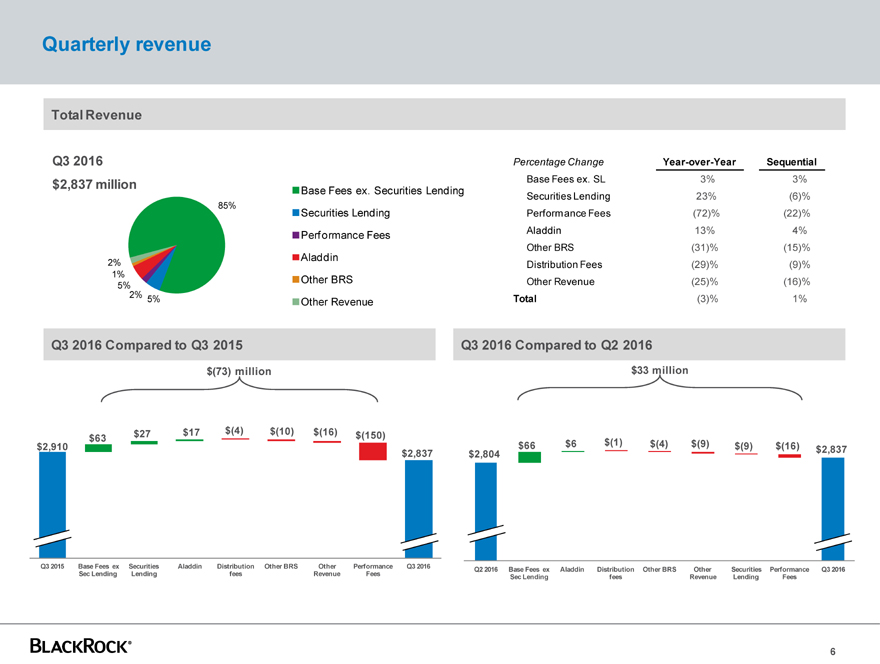
Quarterly revenue
Total Revenue
Q3 2016 $2,837 million
85%
2% 1%
5%2% 5%
Base Fees ex. Securities Lending Securities Lending Performance Fees Aladdin Other BRS
Other Revenue
Percentage Change Year-over-Year Sequential
Base Fees ex. SL 3% 3%
Securities Lending 23% (6)%
Performance Fees (72)% (22)%
Aladdin 13% 4%
Other BRS (31)% (15)%
Distribution Fees (29)% (9)%
Other Revenue (25)% (16)%
Total (3)% 1%
Q3 2016 Compared to Q3 2015
$(73) million
$27 $17 $(4) $(10) $(16) $(150) $63 $2,910 $2,837
Q3 2015 Base Fees ex Securities Aladdin Distribution Other BRS Other Performance Q3 2016 Sec Lending Lending fees Revenue Fees
Q3 2016 Compared to Q2 2016
$33 million
$66 $6 $(1) $(4) $(9) $(9) $(16) $2,804 $2,837
Q2 2016 Base Fees ex Aladdin Distribution Other BRS Other Securities Performance Q3 2016 Sec Lending fees Revenue Lending Fees
6
|
|
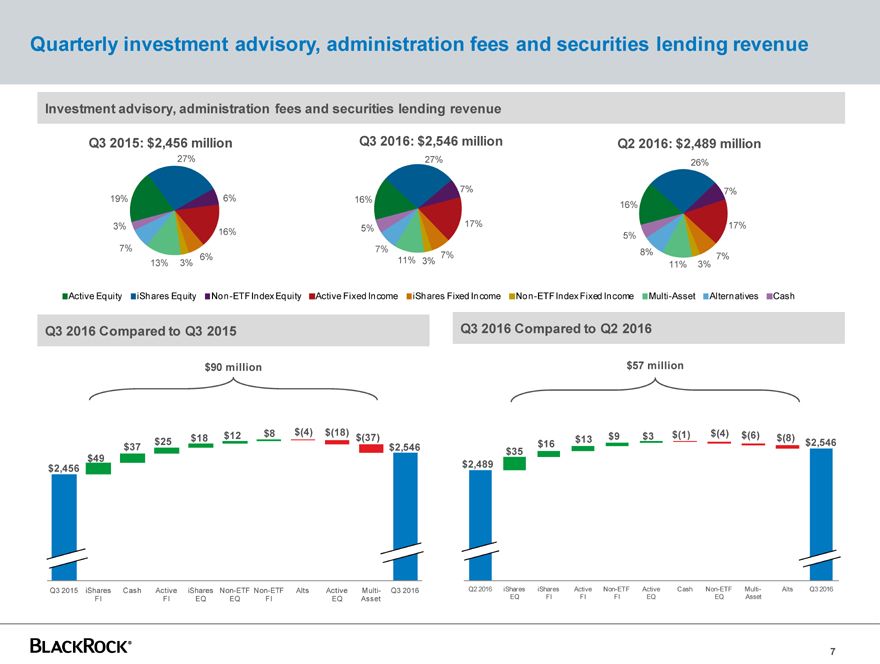
Quarterly investment advisory, administration fees and securities lending revenue
Investment advisory, administration fees and securities lending revenue
Q3 2015: $2,456 million Q3 2016: $2,546 million Q2 2016: $2,489 million
27% 27% 26%
19% 6% 7% 7% 16% 16%
3% 5% 17% 17% 16% 5%
7% 7% 8%
6% 7% 7% 13% 3% 11% 3% 11% 3%
Active Equity iShares Equity Non-ETF Index Equity Active Fixed Income iShares Fixed Income Non-ETF Index Fixed Income Multi-Asset Alternatives Cash
Q3 2016 Compared to Q3 2015
$90 million
$12 $8 $(4) $(18)
$25 $18 $(37)
$37 $2,546 $2,456 $49
Q3 2015 iShares Cash Active iShares Non-ETF Non-ETF Alts Active Multi- Q3 2016 FI FI EQ EQ FI EQ Asset
Q3 2016 Compared to Q2 2016
$57 million
$9 $3 $(1) $(4) $(6) $(8)
$16 $13 $2,546 $35 $2,489
Q2 2016 iShares iShares Active Non-ETF Active Cash Non-ETF Multi- Alts Q3 2016 EQ FI FI FI EQ EQ Asset
7
|
|
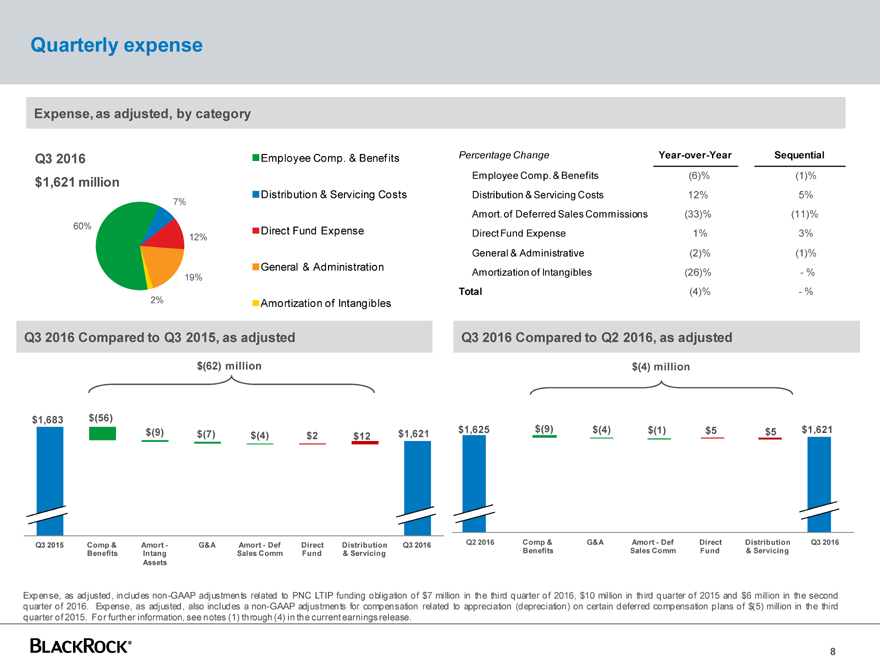
Quarterly expense
Expense, as adjusted, by category
Q3 2016 $1,621 million
7%
60%
12%
19%
2%
Employee Comp. & Benefits Distribution & Servicing Costs Direct Fund Expense General & Administration Amortization of Intangibles
Percentage Change Year-over-Year Sequential
Employee Comp. & Benefits (6)% (1)%
Distribution & Servicing Costs 12% 5%
Amort. of Deferred Sales Commissions (33)% (11)%
Direct Fund Expense 1% 3%
General & Administrative (2)% (1)%
Amortization of Intangibles (26)%—%
Total (4)%—%
Q3 2016 Compared to Q3 2015, as adjusted
$(62) million
$1,683 $(56) $(9) $(7) $(4) $2 $12 $1,621
Q3 2015 Comp & Amort—G&A Amort—Def Direct Distribution Q3 2016 Benefits Intang Sales Comm Fund & Servicing Assets
Q3 2016 Compared to Q2 2016, as adjusted
$(4) million
$1,625 $(9) $(4) $(1) $5 $5 $1,621
Q2 2016 Comp & G&A Amort—Def Direct Distribution Q3 2016 Benefits Sales Comm Fund & Servicing
Expense, as adjusted, includes non-GAAP adjustments related to PNC LTIP funding obligation of $7 million in the third quarter of 2016, $10 million in third quarter of 2015 and $6 million in the second quarter of 2016. Expense, as adjusted, also includes a non-GAAP adjustments for compensation related to appreciation (depreciation) on certain deferred compensation plans of $(5) million in the third quarter of 2015. For further information, see notes (1) through (4) in the current earnings release.
8
|
|
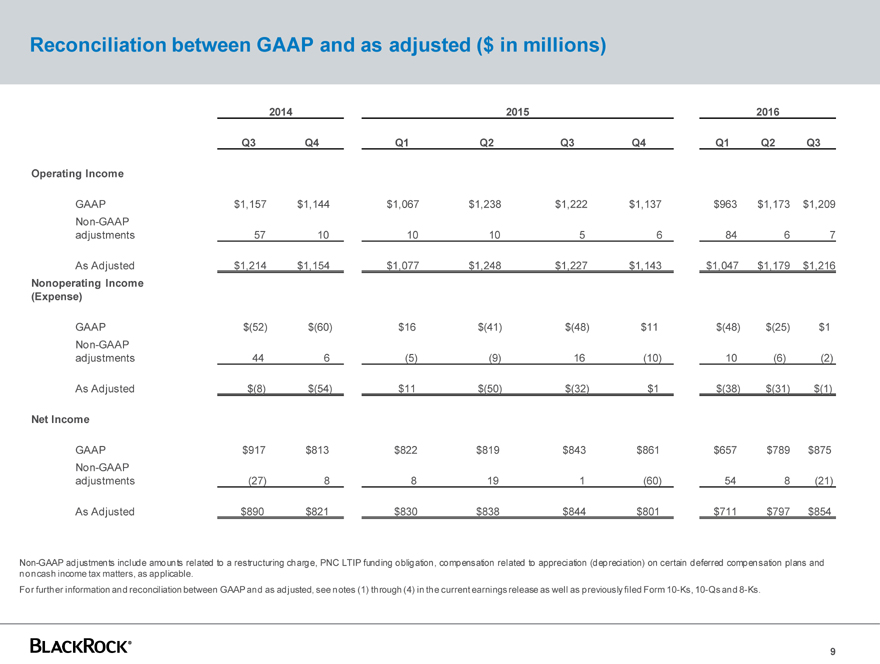
Reconciliation between GAAP and as adjusted ($ in millions)
2014 2015 2016
Q3 Q4 Q1 Q2 Q3 Q4 Q1 Q2 Q3
Operating Income
GAAP $1,157 $1,144 $1,067 $1,238 $1,222 $1,137 $963 $1,173 $1,209
Non-GAAP
adjustments 57 10 10 10 5 6 84 6 7
As Adjusted $1,214 $1,154 $1,077 $1,248 $1,227 $1,143 $1,047 $1,179 $1,216
Nonoperating Income
(Expense)
GAAP $(52) $(60) $16 $(41) $(48) $11 $(48) $(25) $1
Non-GAAP
adjustments 44 6 (5) (9) 16 (10) 10 (6) (2)
As Adjusted $(8) $(54) $11 $(50) $(32) $1 $(38) $(31) $(1)
Net Income
GAAP $917 $813 $822 $819 $843 $861 $657 $789 $875
Non-GAAP
adjustments (27) 8 8 19 1 (60) 54 8 (21)
As Adjusted $890 $821 $830 $838 $844 $801 $711 $797 $854
Non-GAAP adjustments include amounts related to a restructuring charge, PNC LTIP funding obligation, compensation related to appreciation (depreciation) on certain deferred compensation plans and noncash income tax matters, as applicable.
For further information and reconciliation between GAAP and as adjusted, see notes (1) through (4) in the current earnings release as well as previously filed Form 10-Ks, 10-Qs and 8-Ks.
9
|
|
Important Notes
This presentation, and other statements that BlackRock, Inc. (“BlackRock”) may make, may contain forward-looking statements within the meaning of the Private Securities Litigation Reform Act, with respect to BlackRock’s future financial or business performance, strategies or expectations. Forward-looking statements are typically identified by words or phrases such as “trend,” “potential,” “opportunity,” “pipeline,” “believe,” “comfortable,” “expect,” “anticipate,” “current,” “intention,” “estimate,” “position,” “assume,” “outlook,” “continue,” “remain,” “maintain,” “sustain,” “seek,” “achieve,” and similar expressions, or future or conditional verbs such as “will,” “would,” “should,” “could,” “may” and similar expressions.
BlackRock cautions that forward-looking statements are subject to numerous assumptions, risks and uncertainties, which change over time. Forward-looking statements speak only as of the date they are made, and BlackRock assumes no duty to and does not undertake to update forward-looking statements. Actual results could differ materially from those anticipated in forward-looking statements and future results could differ materially from historical performance.
In addition to risk factors previously disclosed in BlackRock’s Securities and Exchange Commission reports and those identified elsewhere in this presentation, the following factors, among others, could cause actual results to differ materially from forward-looking statements or historical performance: (1) the introduction, withdrawal, success and timing of business initiatives and strategies; (2) changes and volatility in political, economic or industry conditions, the interest rate environment, foreign exchange rates or financial and capital markets, which could result in changes in demand for products or services or in the value of assets under management; (3) the relative and absolute investment performance of BlackRock’s investment products; (4) the impact of increased competition; (5) the impact of future acquisitions or divestitures; (6) the unfavorable resolution of legal proceedings; (7) the extent and timing of any share repurchases; (8) the impact, extent and timing of technological changes and the adequacy of intellectual property, information and cyber security protection; (9) the impact of legislative and regulatory actions and reforms, including the Dodd-Frank Wall Street Reform and Consumer Protection Act, and regulatory, supervisory or enforcement actions of government agencies relating to BlackRock or The PNC Financial Services Group, Inc.; (10) terrorist activities, international hostilities and natural disasters, which may adversely affect the general economy, domestic and local financial and capital markets, specific industries or BlackRock; (11) the ability to attract and retain highly talented professionals; (12) fluctuations in the carrying value of BlackRock’s economic investments; (13) the impact of changes to tax legislation, including income, payroll and transaction taxes, and taxation on products or transactions, which could affect the value proposition to clients and, generally, the tax position of BlackRock; (14) BlackRock’s success in maintaining the distribution of its products; (15) the impact of BlackRock electing to provide support to its products from time to time and any potential liabilities related to securities lending or other indemnification obligations; and (16) the impact of problems at other financial institutions or the failure or negative performance of products at other financial institutions.
This presentation also includes non-GAAP financial measures. You can find our presentations on the most directly comparable GAAP financial measures calculated in accordance with GAAP and our reconciliations on page 9 of this earnings release supplement, our current earnings release dated October 18, 2016, and BlackRock’s other periodic reports, which are available on BlackRock’s website at www.blackrock.com.
10
Serious News for Serious Traders! Try StreetInsider.com Premium Free!
You May Also Be Interested In
- Probe Finds Billions Went To Blacklisted Chinese Cos, Probe Focused on BlackRock (BLK) and MSCI (MSCI) - WSJ
- Grape Law Announces Feature in Manage HR Magazine's "Top 10 Rising Immigration Law Firms in America" List
- U.S. earnings seasons begins: What to expect
Create E-mail Alert Related Categories
SEC FilingsSign up for StreetInsider Free!
Receive full access to all new and archived articles, unlimited portfolio tracking, e-mail alerts, custom newswires and RSS feeds - and more!
