

Form 8-K BlackRock Inc. For: Apr 20
 Tweet
Tweet Share
Share
UNITED STATES
SECURITIES AND EXCHANGE COMMISSION
Washington, D.C. 20549
FORM 8-K
CURRENT REPORT
Pursuant to Section 13 OR 15(d) of The
Securities Exchange Act of 1934
Date of Report (Date of earliest event reported): April 20, 2015
BLACKROCK, INC.
(Exact name of registrant as specified in its charter)
| DELAWARE | 001-33099 | 32-0174431 | ||
| (State or other jurisdiction of incorporation) |
(Commission File Number) |
(IRS Employer Identification No.) |
| 55 East 52nd Street, New York, New York | 10055 | |
| (Address of principal executive offices) | (Zip Code) |
Registrant’s telephone number, including area code: (212) 810-5300
(Former name or former address, if changed since last report.)
Check the appropriate box below if the Form 8-K filing is intended to simultaneously satisfy the filing obligation of the registrant under any of the following provisions (see General Instruction A.2. below):
| ¨ | Written communications pursuant to Rule 425 under the Securities Act (17 CFR 230.425) |
| ¨ | Soliciting material pursuant to Rule 14a-12 under the Exchange Act (17 CFR 240.14a-12) |
| ¨ | Pre-commencement communications pursuant to Rule 14d-2(b) under the Exchange Act (17 CFR 240.14d-2(b)) |
| ¨ | Pre-commencement communications pursuant to Rule 13e-4(c) under the Exchange Act (17 CFR 240.13e-4(c)) |
Item 8.01. Other events
Filed herewith is an investor presentation.
Item 9.01(d). Financial Statements and Exhibits.
| Exhibit 99.1 | Investor Presentation. | |
2
SIGNATURES
Pursuant to the requirements of the Securities Exchange Act of 1934, the registrant has duly caused this report to be signed on its behalf by the undersigned hereunto duly authorized.
| BlackRock, Inc. | ||||||
| (Registrant) | ||||||
| By: | /s/ Gary Shedlin | |||||
| Date: April 20, 2015 | Gary S. Shedlin | |||||
| Senior Managing Director and Chief Financial Officer | ||||||
EXHIBIT INDEX
| Exhibit No. |
Description | |
| Exhibit 99.1 | Investor Presentation. | |
4
| Exhibit 99.1
|
BlackRock
Fixed Income Investor Presentation April 2015
|
|
Forward-looking Statements
This presentation, and other statements that BlackRock may make, may contain forward-looking statements within the meaning of the Private Securities Litigation Reform Act, with respect to BlackRock’s future financial or business performance, strategies or expectations. Forward-looking statements are typically identified by words or phrases such as “trend,” “potential,” “opportunity,” “pipeline,” “believe,” “comfortable,” “expect,” “anticipate,” “current,” “intention,” “estimate,” “position,” “assume,” “outlook,” “continue,” “remain,” “maintain,” “sustain,” “seek,” “achieve,” and similar expressions, or future or conditional verbs such as “will,” “would,” “should,” “could,” “may” and similar expressions. BlackRock cautions that forward-looking statements are subject to numerous assumptions, risks and uncertainties, which change over time. Forward-looking statements speak only as of the date they are made, and BlackRock assumes no duty to and does not undertake to update forward-looking statements. Actual results could differ materially from those anticipated in forward-looking statements and future results could differ materially from historical performance.
In addition to risk factors previously disclosed in BlackRock’s Securities and Exchange Commission (“SEC”) reports and those identified elsewhere in this presentation, the following factors, among others, could cause actual results to differ materially from forward-looking statements or historical performance: (1) the introduction, withdrawal, success and timing of business initiatives and strategies; (2) changes and volatility in political, economic or industry conditions, the interest rate environment, foreign exchange rates or financial and capital markets, which could result in changes in demand for products or services or in the value of assets under management (“AUM”); (3) the relative and absolute investment performance of BlackRock’s investment products; (4) the impact of increased competition; (5) the impact of future acquisitions or divestitures; (6) the unfavorable resolution of legal proceedings; (7) the extent and timing of any share repurchases; (8) the impact, extent and timing of technological changes and the adequacy of intellectual property, information and cyber security protection; (9) the impact of legislative and regulatory actions and reforms, including the Dodd-Frank Wall Street Reform and Consumer Protection Act, and regulatory, supervisory or enforcement actions of government agencies relating to BlackRock or The PNC Financial Services Group, Inc. (“PNC”); (10) terrorist activities, international hostilities and natural disasters, which may adversely affect the general economy, domestic and local financial and capital markets, specific industries or BlackRock; (11) the ability to attract and retain highly talented professionals; (12) fluctuations in the carrying value of BlackRock’s economic investments; (13) the impact of changes to tax legislation, including income, payroll and transaction taxes, and taxation on products or transactions, which could affect the value proposition to clients and, generally, the tax position of the Company; (14) BlackRock’s success in maintaining the distribution of its products; (15) the impact of BlackRock electing to provide support to its products from time to time and any potential liabilities related to securities lending or other indemnification obligations; and (16) the impact of problems at other financial institutions or the failure or negative performance of products at other financial institutions.
BlackRock’s Annual Report on Form 10-K and BlackRock’s subsequent filings with the SEC, accessible on the SEC’s website at www.sec.gov and on BlackRock’s website at www.blackrock.com, discuss these factors in more detail and identify additional factors that can affect forward-looking statements.
This presentation also includes non-GAAP financial measures. You can find our presentations on the most directly comparable GAAP financial measures calculated in accordance with GAAP and our reconciliations in the appendix to this presentation and BlackRock’s other periodic reports which are available on BlackRock’s website at www.blackrock.com.
|
|
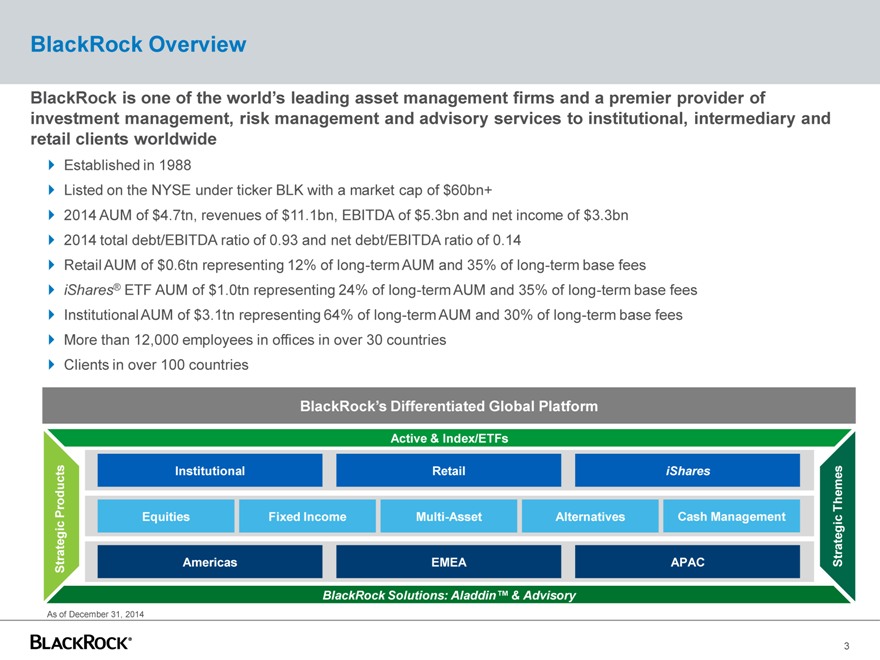
BlackRock Overview
BlackRock is one of the world’s leading asset management firms and a premier provider of investment management, risk management and advisory services to institutional, intermediary and retail clients worldwide
Established in 1988
Listed on the NYSE under ticker BLK with a market cap of $60bn+
2014 AUM of $4.7tn, revenues of $11.1bn, EBITDA of $5.3bn and net income of $3.3bn 2014 total debt/EBITDA ratio of 0.93 and net debt/EBITDA ratio of 0.14 Retail AUM of $0.6tn representing 12% of long-term AUM and 35% of long-term base fees iShares® ETF AUM of $1.0tn representing 24% of long-term AUM and 35% of long-term base fees Institutional AUM of $3.1tn representing 64% of long-term AUM and 30% of long-term base fees More than 12,000 employees in offices in over 30 countries Clients in over 100 countries
BlackRock’s Differentiated Global Platform
Active & Index/ETFs
Products Institutional Retail iShares Themes
Equities Fixed Income Multi-Asset Alternatives Cash Management
Strategic Americas EMEA APAC Strategic
BlackRock Solutions: Aladdin™ & Advisory
As of December 31, 2014
3
|
|
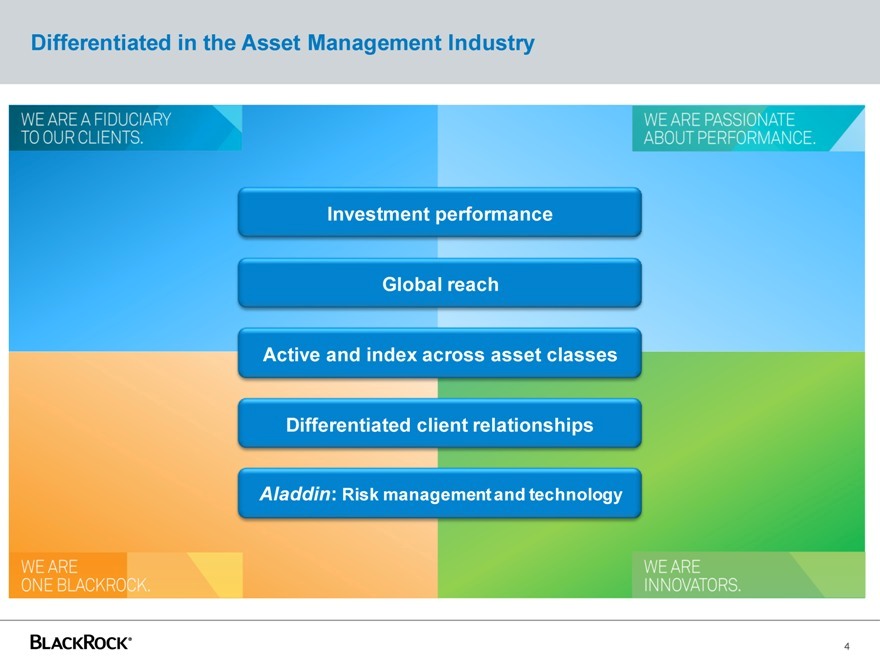
Differentiated in the Asset Management Industry
Investment performance
Global reach
Active and index across asset classes Differentiated client relationships
Aladdin: Risk management and technology
|
|
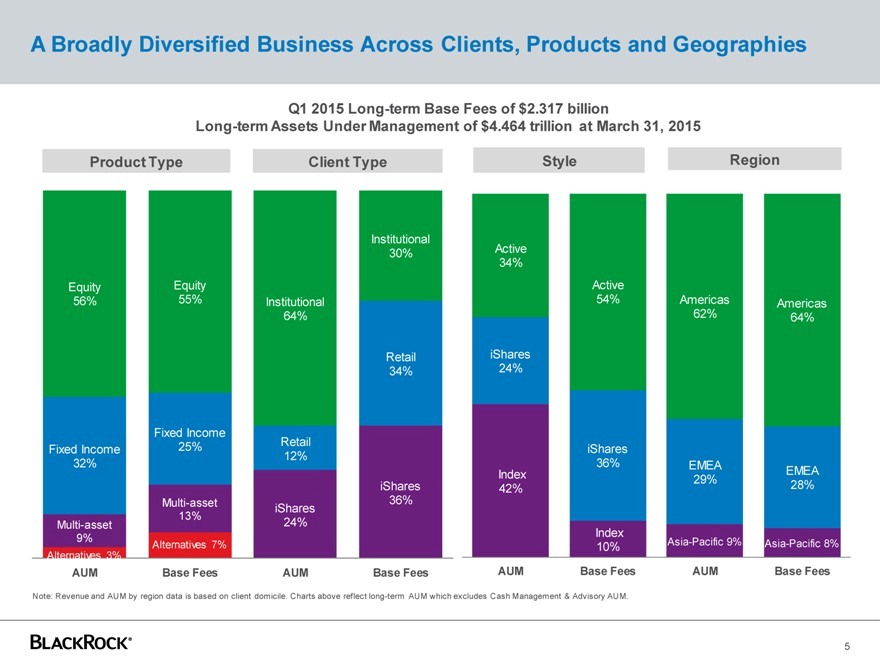
A Broadly Diversified Business Across Clients, Products and Geographies
Q1 2015 Long-term Base Fees of $2.317 billion
Long-term Assets Under Management of $4.464 trillion at March 31, 2015
Product Type Client Type Style Region
Institutional
30% Active 34%
Equity Equity Active
56% 55% Institutional 54% Americas Americas 64% 62% 64%
Retail iShares 34% 24%
Fixed Income
25% Retail
Fixed Income iShares 12%
32% 36% EMEA
Index EMEA 29% 28% iShares 42%
Multi-asset 36% iShares
13%
Multi-asset 24%
9% Index
Alternatives 7% 10% Asia-Pacific 9% Asia-Pacific 8% Alternatives 3%
AUM Base Fees AUM Base Fees AUM Base Fees AUM Base Fees
Note: Revenue and AUM by region data is based on client domicile. Charts above reflect long-term AUM which excludes Cash Management & Advisory AUM.
|
|
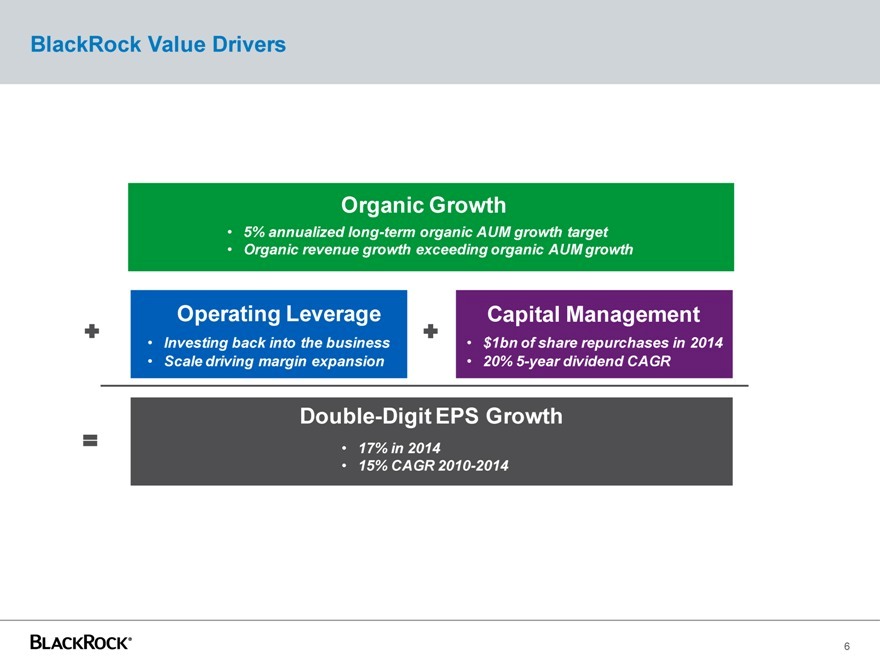
BlackRock Value Drivers
Organic Growth
• 5% annualized long-term organic AUM growth target
• Organic revenue growth exceeding organic AUM growth
Operating Leverage Capital Management
• Investing back into the business • $1bn of share repurchases in 2014
• Scale driving margin expansion • 20% 5-year dividend CAGR
Double-Digit EPS Growth
• 17% in 2014
• 15% CAGR 2010-2014
| 6 |
|
+ + = |
|
|
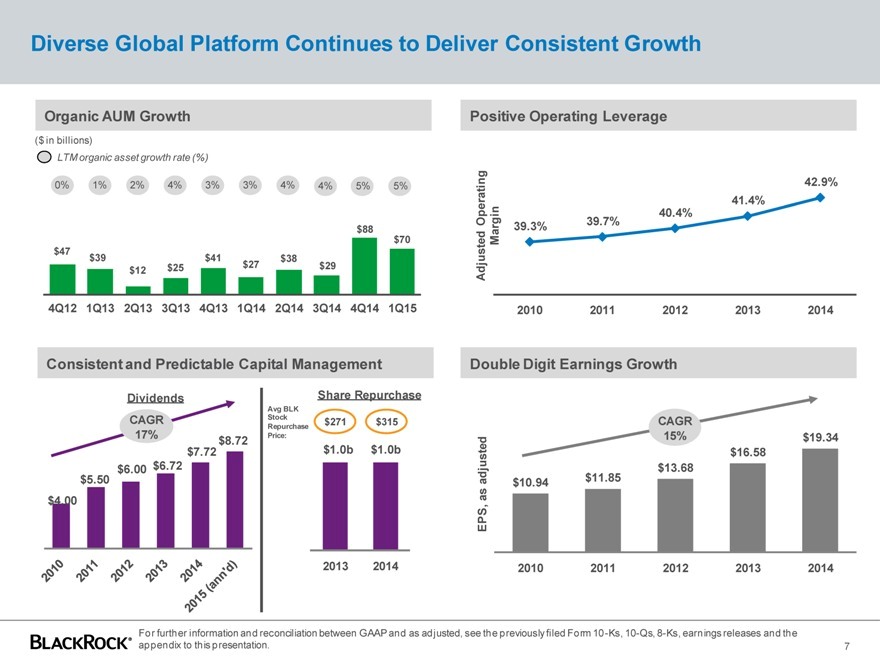
Diverse Global Platform Continues to Deliver Consistent Growth
Organic AUM Growth Positive Operating Leverage
($ in billions)
LTM organic asset growth rate (%)
0% 1% 2% 4% 3% 3% 4% 4% 5% 5%
$88 $70 $47
$39 $41 $38
$25 $27 $29 $12
4Q12 1Q13 2Q13 3Q13 4Q13 1Q14 2Q14 3Q14 4Q14 1Q15
Adjusted Operating Margin
42.9%
41.4%
40.4%
39.3% 39.7%
2010 2011 2012 2013 2014
Consistent and Predictable Capital Management Double Digit Earnings Growth
Dividends CAGR
17%
CAGR 17% $7.72 $8.72 $6.00 $6.72 $5.50 $4.00
2010 2011 2012 2013 2014 2015 (ann’d)
Share Repurchase
Avg BLK Stock
Repurchase $271 $315 Price:
$1.0b $1.0b
2013 2014
EPS, as adjusted
CAGR
15% $19.34
$16.58
$13.68
$10.94 $11.85
2010 2011 2012 2013 2014
Blackrock For further information and reconciliation between GAAP and as adjusted, see the previously filed Form 10-Ks, 10-Qs, 8-Ks, earnings releases and the appendix to this presentation. 7
|
|
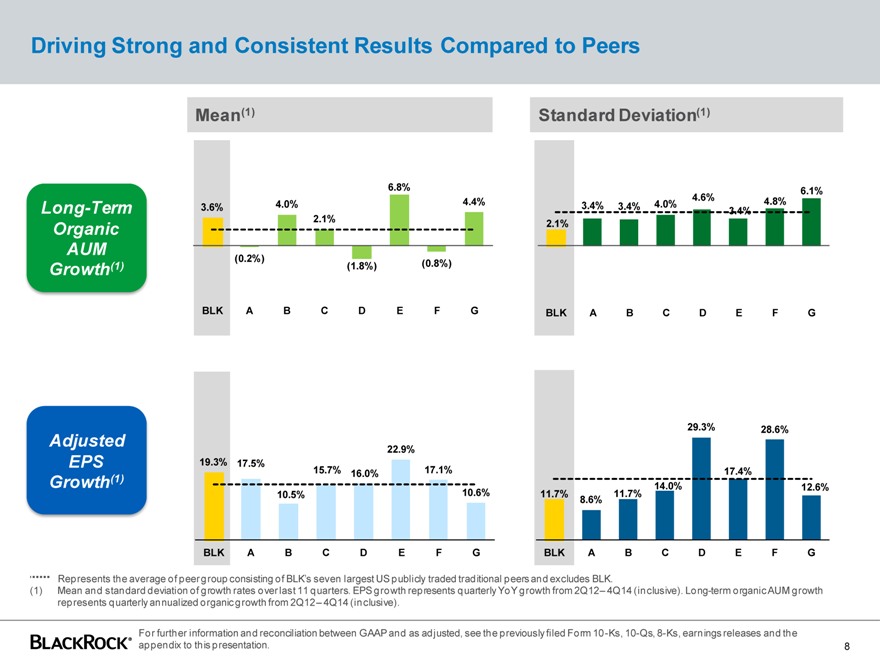
Driving Strong and Consistent Results Compared to Peers
Long-Term Organic AUM Growth(1)
Adjusted EPS Growth(1)
68% .
4.0% 4.4% 3.6% 2.1%
Mean(1) Standard Deviation(1)
(0.2%)
(1.8%) (0.8%) BLK A BCD E F G
6.1% 4.6% 4.8% 3.4% 3.4% 4.0% 3.4% 2.1%
BLK A B C D E F G
22.9%
19.3% 17.5%
15.7% 16.0% 17.1%
10.5% 10.6%
BLK A B C D E F G
29.3% 28.6%
17.4%
14.0% 12.6%
11.7% 11.7% 8.6%
BLK A B C D E F G
Represents the average of peer group consisting of BLK’s seven largest US publicly traded traditional peers and excludes BLK.
(1) Mean and standard deviation of growth rates over last 11 quarters. EPS growth represents quarterly YoY growth from 2Q12 – 4Q14 (inclusive). Long-term organic AUM growth represents quarterly annualized organic growth from 2Q12 – 4Q14 (inclusive).
Blackrock For further information and reconciliation between GAAP and as adjusted, see the previously filed Form 10-Ks, 10-Qs, 8-Ks, earnings releases and the appendix to this presentation. 8
|
|
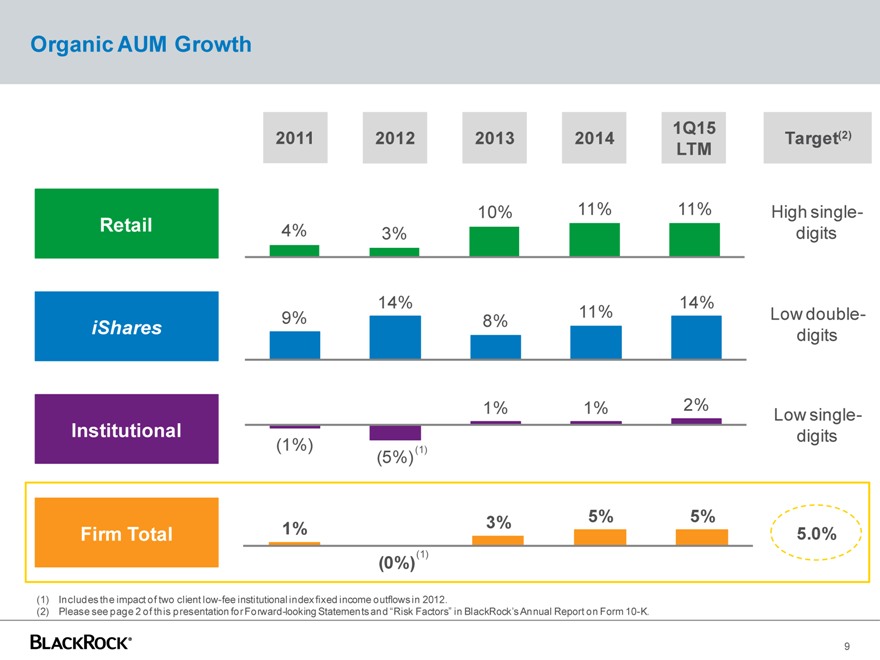
Organic AUM Growth
1Q15 (2) 2011 2012 2013 2014 Target LTM
Retail 10% 11% 11% High single-
4% 3% digits
14% 14%
9% 11% Low double-iShares 8% digits
1% 1% 2%
Institutional Low single-digits (1%) (1) (5%)
3% 5% 5%
Firm Total 1% 5.0%
| (1) |
|
(0%)
| (1) |
|
Includes the impact of two client low-fee institutional index fixed income outflows in 2012. |
(2) Please see page 2 of this presentation for Forward-looking Statements and “Risk Factors” in BlackRock’s Annual Report on Form 10-K.
BLACKROCK 9
|
|
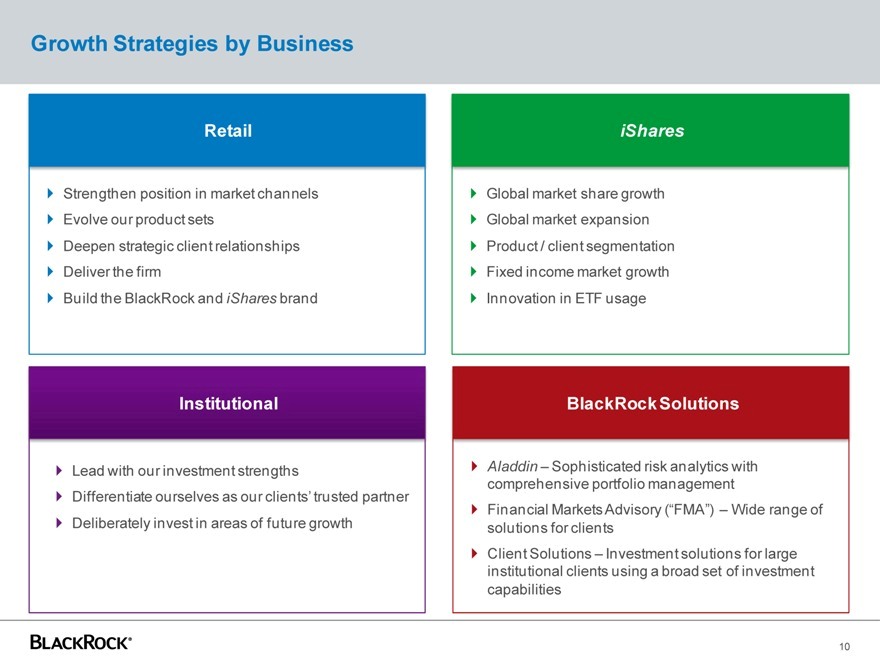
Growth Strategies by Business
Retail
? Strengthen position in market channels ? Evolve our product sets ? Deepen strategic client relationships ? Deliver the firm ? Build the BlackRock and iShares brand
iShares
? Global market share growth ? Global market expansion ? Product / client segmentation ? Fixed income market growth ? Innovation in ETF usage
Institutional
? Lead with our investment strengths
? Differentiate ourselves as our clients’ trusted partner
? Deliberately invest in areas of future growth
BlackRock Solutions
? Aladdin – Sophisticated risk analytics with comprehensive portfolio management
? Financial Markets Advisory (“FMA”) – Wide range of solutions for clients ? Client Solutions – Investment solutions for large institutional clients using a broad set of investment capabilities
BLACKROCK 10
|
|
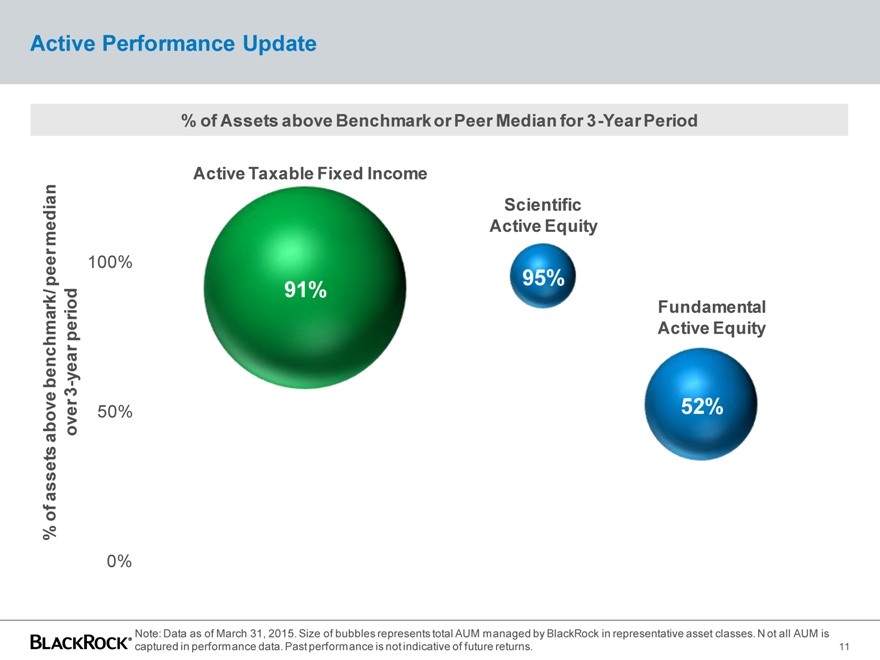
Active Performance Update
% of Assets above Benchmark or Peer Median for 3-Year Period
Active Taxable Fixed Income
Scientific
median Active Equity
100%
peer 95%
91%
Fundamental
enchmark/ period Active Equity
b—year
| 3 |
|
above over 50% 52%
ass ets 23%
of
%
0%
Note: Data as of March 31, 2015. Size of bubbles represents total AUM managed by BlackRock in representative asset classes. Not all AUM is captured in performance data. Past performance is not indicative of future returns.
11
|
|
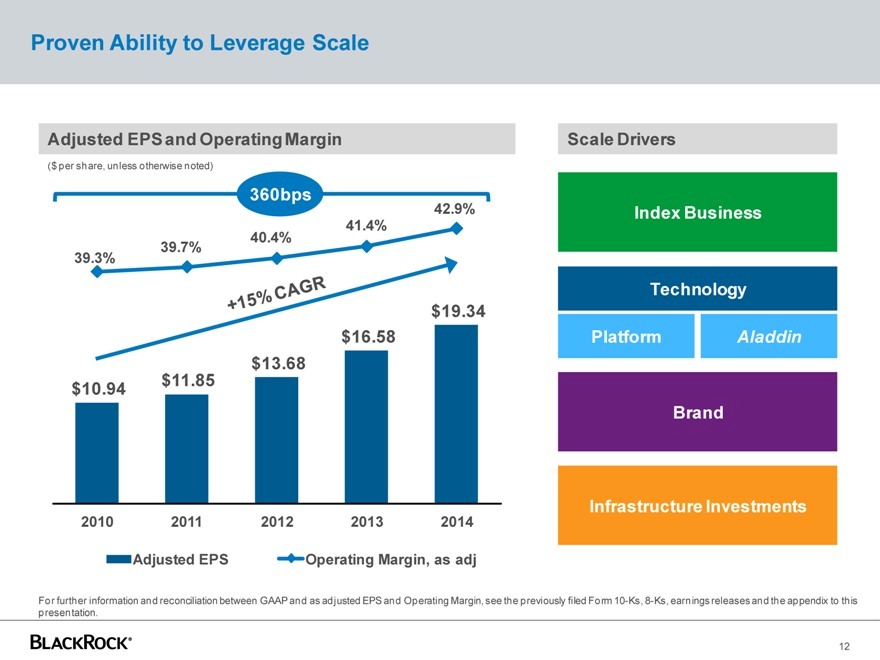
Proven Ability to Leverage Scale
Adjusted EPS and Operating Margin
($ per share, unless otherwise noted)
360bps
42.9%
41.4%
| 39.7% |
|
40.4% |
39.3%
$19.34
$16.58
$13.68
| $10.94 |
|
$11.85 |
2010 2011 2012 2013 2014
Adjusted EPS Operating Margin, as adj
Scale Drivers
Index Business
Technology
Platform Aladdin
Brand
Infrastructure Investments
For further information and reconciliation between GAAP and as adjusted EPS and Operating Margin, see the previously filed Form 10-Ks, 8-Ks, earnings releases and the appendix to this presentation.
12
|
|
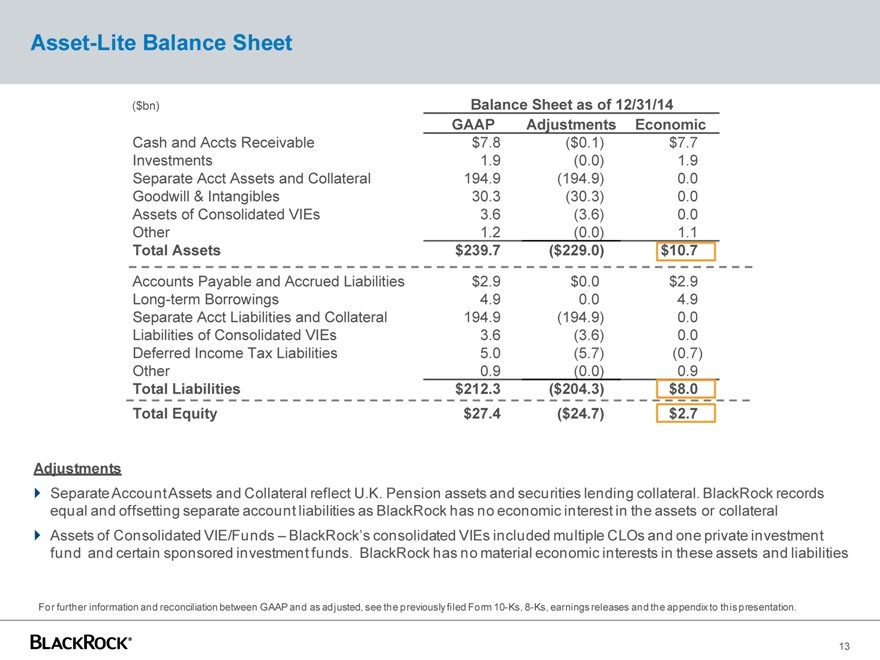
Asset-Lite Balance Sheet
($bn) Balance Sheet as of 12/31/14
GAAP Adjustments Economic
Cash and Accts Receivable $7.8($0.1) $7.7
Investments 1.9(0.0) 1.9
Separate Acct Assets and Collateral 194.9(194.9) 0.0
Goodwill & Intangibles 30.3(30.3) 0.0
Assets of Consolidated VIEs 3.6(3.6) 0.0
Other 1.2(0.0) 1.1
Total Assets $239.7($229.0) $10.7
Accounts Payable and Accrued Liabilities $2.9 $0.0 $2.9
Long-term Borrowings 4.9 0.0 4.9
Separate Acct Liabilities and Collateral 194.9(194.9) 0.0
Liabilities of Consolidated VIEs 3.6(3.6) 0.0
Deferred Income Tax Liabilities 5.0(5.7)(0.7)
Other 0.9(0.0) 0.9
Total Liabilities $212.3($204.3) $8.0
Total Equity $27.4($24.7) $2.7
Adjustments
Separate Account Assets and Collateral reflect U.K. Pension assets and securities lending collateral. BlackRock records equal and offsetting separate account liabilities as BlackRock has no economic interest in the assets or collateral Assets of Consolidated VIE/Funds – BlackRock’s consolidated VIEs included multiple CLOs and one private investment fund and certain sponsored investment funds. BlackRock has no material economic interests in these assets and liabilities
For further information and reconciliation between GAAP and as adjusted, see the previously filed Form 10-Ks, 8-Ks, earnings releases and the appendix to this presentation.
13
|
|
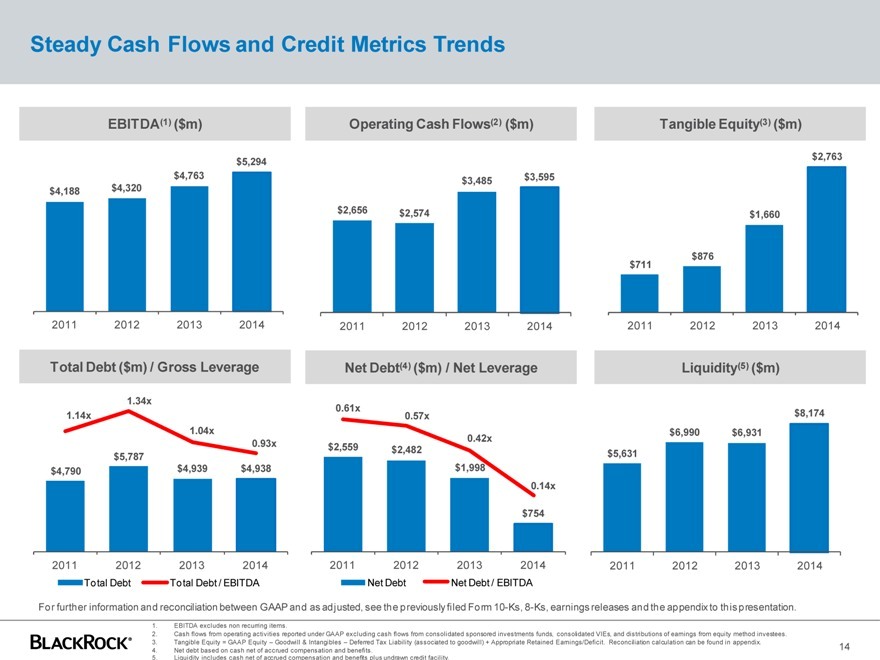
Steady Cash Flows and Credit Metrics Trends
EBITDA(1) ($m) Operating Cash Flows(2) ($m) Tangible Equity(3) ($m)
$5,294 $2,763
$4,763 $3,485 $3,595
$4,188 $4,320
$2,656 $2,574 $1,660
$876
$711
2011 2012 2013 2014 2011 2012 2013 2014 2011 2012 2013 2014
Total Debt ($m) / Gross Leverage Net Debt(4) ($m) / Net Leverage Liquidity(5) ($m)
1.34x
0.61x
| 1.14x |
|
0.57x $8,174 |
| 1.04x |
|
$6,990 $6,931 |
0.42x
| 0.93x |
|
$2,559 $2,482 |
$5,787 $5,631
$4,790 $4,939 $4,938 $1,998
0.14x
$754
2011 2012 2013 2014 2011 2012 2013 2014 2011 2012 2013 2014
Total Debt Total Debt / EBITDA Net Debt Net Debt / EBITDA
For further information and reconciliation between GAAP and as adjusted, see the previously filed Form 10-Ks, 8-Ks, earnings releases and the appendix to this presentation.
1. EBITDA excludes non recurring items.
2. Cash flows from operating activities reported under GAAP excluding cash flows from consolidated sponsored investments funds, consolidated VIEs, and distributions of earnings from equity method investees. 3. Tangible Equity = GAAP Equity – Goodwill & Intangibles – Deferred Tax Liability (associated to goodwill) + Appropriate Retained Earnings/Deficit. Reconciliation calculation can be found in appendix.
4. Net debt based on cash net of accrued compensation and benefits.
5. Liquidity includes cash net of accrued compensation and benefits plus undrawn credit facility.
14
|
|
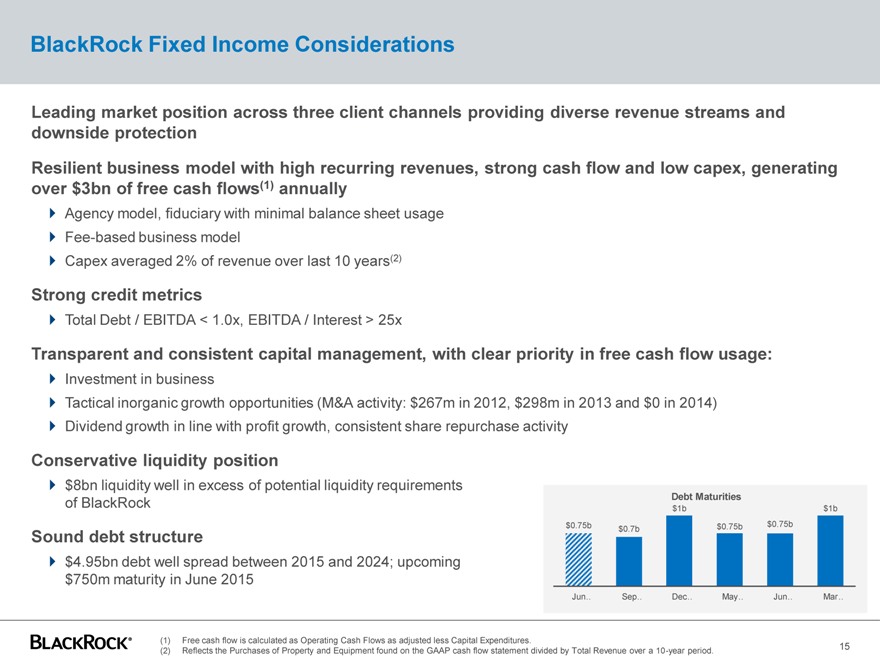
BlackRock Fixed Income Considerations
Leading market position across three client channels providing diverse revenue streams and downside protection
Resilient business model with high recurring revenues, strong cash flow and low capex, generating over $3bn of free cash flows(1) annually
Agency model, fiduciary with minimal balance sheet usage Fee-based business model Capex averaged 2% of revenue over last 10 years(2)
Strong credit metrics
Total Debt / EBITDA < 1.0x, EBITDA / Interest > 25x
Transparent and consistent capital management, with clear priority in free cash flow usage:
Investment in business
Tactical inorganic growth opportunities (M&A activity: $267m in 2012, $298m in 2013 and $0 in 2014) Dividend growth in line with profit growth, consistent share repurchase activity
Conservative liquidity position
$8bn liquidity well in excess of potential liquidity requirements of BlackRock
debt structure
Sound debt structure
$4.95bn debt well spread between 2015 and 2024; upcoming $750m maturity in June 2015
Debt Maturities
$1b $1b
$0.75b $0.7b $0.75b $0.75b
Jun… Sep… Dec… May… Jun… Mar…
(1) Free cash flow is calculated as Operating Cash Flows as adjusted less Capital Expenditures.
(2) Reflects the Purchases of Property and Equipment found on the GAAP cash flow statement divided by Total Revenue over a 10-year period.
15
|
|

Appendix
|
|
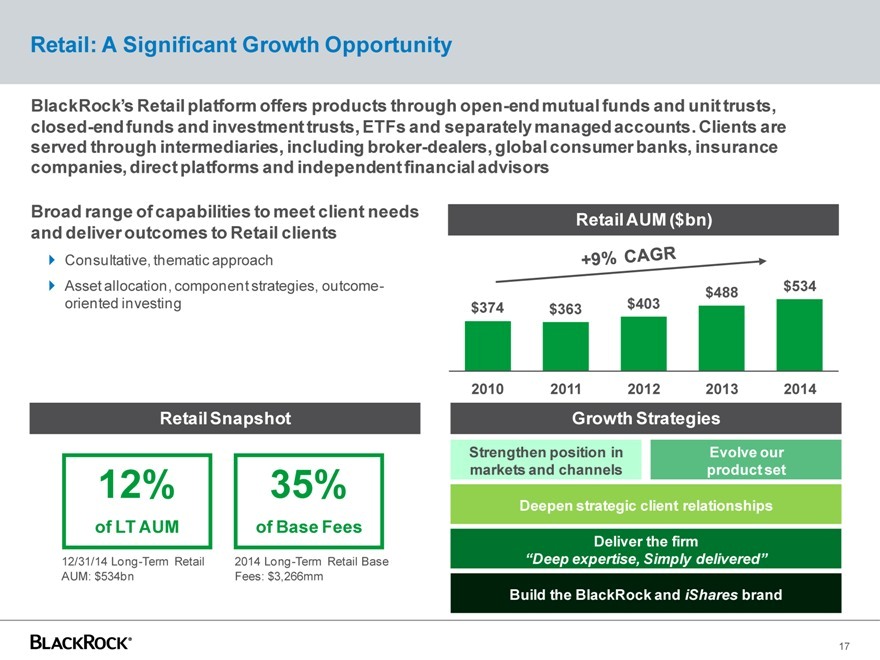
Retail: A Significant Growth Opportunity
BlackRock’s Retail platform offers products through open-end mutual funds and unit trusts, closed-end funds and investment trusts, ETFs and separately managed accounts. Clients are served through intermediaries, including broker-dealers, global consumer banks, insurance companies, direct platforms and independent financial advisors
Broad range of capabilities to meet client needs and deliver outcomes to Retail clients
? Consultative, thematic approach
? Asset allocation, component strategies, outcome-oriented investing
Retail AUM ($bn)
$488 $534
$374 $363 $403
2010 2011 2012 2013 2014
Retail Snapshot
12% 35%
of LT AUM of Base Fees
12/31/14 Long-Term Retail 2014 Long-Term Retail Base
AUM: $534bn Fees: $3,266mm
Growth Strategies
Strengthen position in Evolve our markets and channels product set
Deepen strategic client relationships
Deliver the firm
“Deep expertise, Simply delivered”
Build the BlackRock and iShares brand
17
|
|
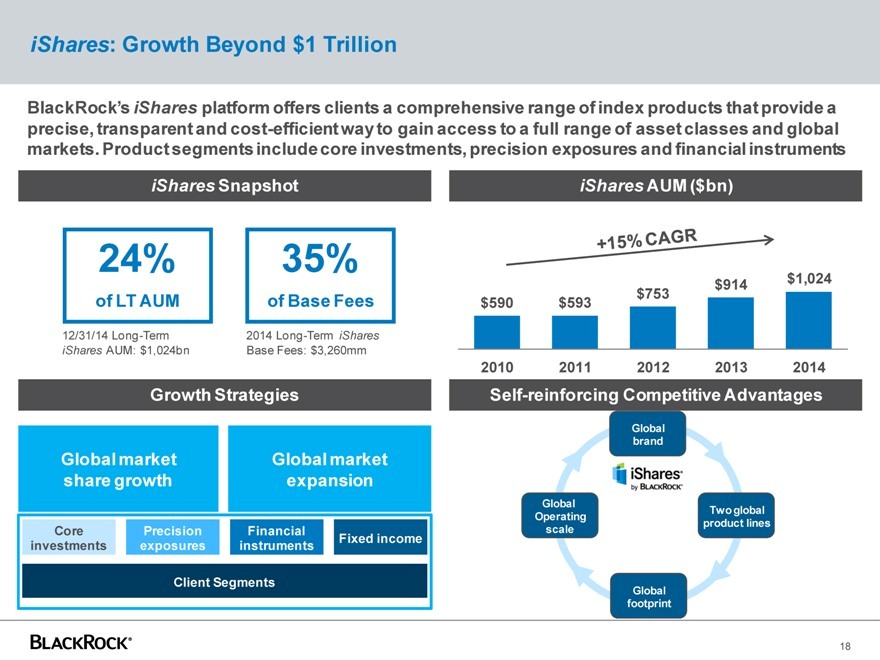
iShares: Growth Beyond $1 Trillion
BlackRock’s iShares platform offers clients a comprehensive range of index products that provide a precise, transparent and cost-efficient way to gain access to a full range of asset classes and global markets. Product segments include core investments, precision exposures and financial instruments
iShares Snapshot
24% 35%
of LT AUM of Base Fees
12/31/14 Long-Term 2014 Long-Term iShares iShares AUM: $1,024bn Base Fees: $3,260mm
iShares AUM($bn)
$914 $1,024
$590 $593 $753
2010 2011 2012 2013 2014
Growth Strategies
Global market Global market
share growth expansion
Core Precision Financial Fixed income
investments exposures instruments
Client Segments
Self-reinforcing Competitive Advantages
Global
brand
Global Two global
Operating product lines
scale
Global
footprint
18
|
|
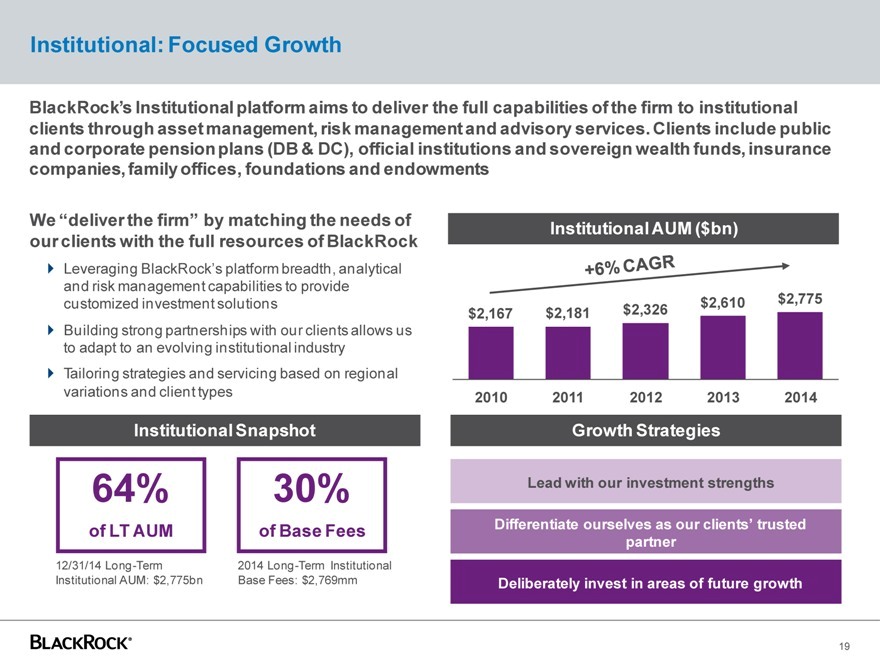
Institutional: Focused Growth
BlackRock’s Institutional platform aims to deliver the full capabilities of the firm to institutional clients through asset management, risk management and advisory services. Clients include public and corporate pension plans (DB & DC), official institutions and sovereign wealth funds, insurance companies, family offices, foundations and endowments
We “deliver the firm” by matching the needs of our clients with the full resources of BlackRock
? Leveraging BlackRock’s platform breadth, analytical and risk management capabilities to provide customized investment solutions? Building strong partnerships with our clients allows us to adapt to an evolving institutional industry? Tailoring strategies and servicing based on regional variations and client types
Institutional AUM ($bn)
$2,167 $2,181 $2,326 $2,610 $2,775
2010 2011 2012 2013 2014
Institutional Snapshot
64% 30%
of LT AUM of Base Fees
12/31/14 Long-Term 2014 Long-Term Institutional Institutional AUM: $2,775bn Base Fees: $2,769mm
Growth Strategies
Lead with our investment strengths
Differentiate ourselves as our clients’ trusted partner
Deliberately invest in areas of future growth
19
|
|
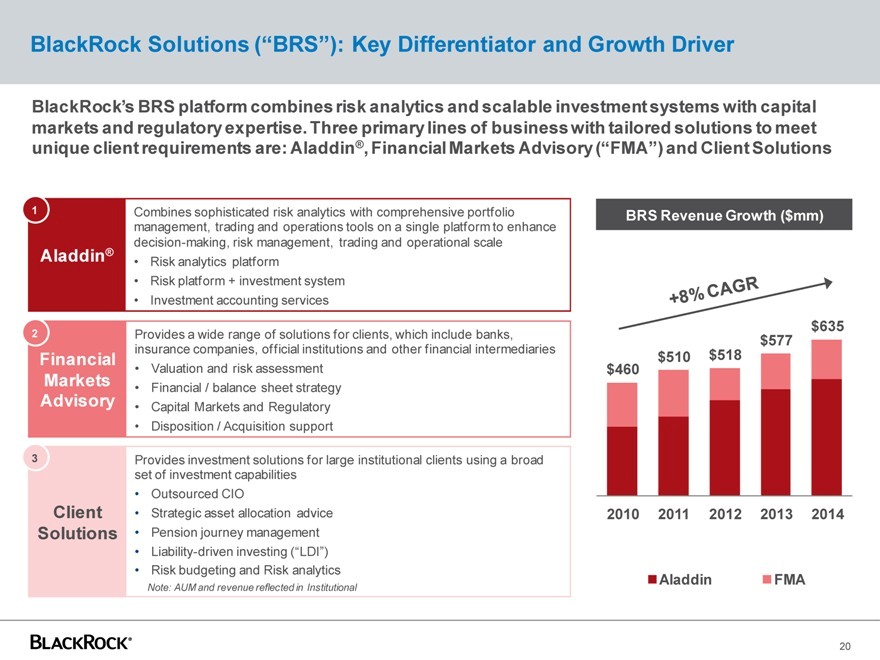
BlackRock Solutions (“BRS”): Key Differentiator and Growth Driver
BlackRock’s BRS platform combines risk analytics and scalable investment systems with capital markets and regulatory expertise. Three primary lines of business with tailored solutions to meet unique client requirements are: Aladdin®, Financial Markets Advisory (“FMA”) and Client Solutions
| 1 |
|
Combines sophisticated risk analytics with comprehensive portfolio |
management, trading and operations tools on a single platform to enhance
decision-making, risk management, trading and operational scale
Aladdin® • Risk analytics platform
• Risk platform + investment system
• Investment accounting services
| 2 |
|
Provides a wide range of solutions for clients, which include banks, |
insurance companies, official institutions and other financial intermediaries
Financial • Valuation and risk assessment
Markets • Financial / balance sheet strategy
Advisory • Capital Markets and Regulatory
• Disposition / Acquisition support
| 3 |
|
Provides investment solutions for large institutional clients using a broad |
set of investment capabilities
• Outsourced CIO
Client • Strategic asset allocation advice
Solutions • Pension journey management
• Liability-driven investing (“LDI”)
• Risk budgeting and Risk analytics
Note: AUM and revenue reflected in Institutional
BRS Revenue Growth ($mm)
$635
$577
$510 $518
$460
2010 2011 2012 2013 2014
Aladdin FMA
20
|
|
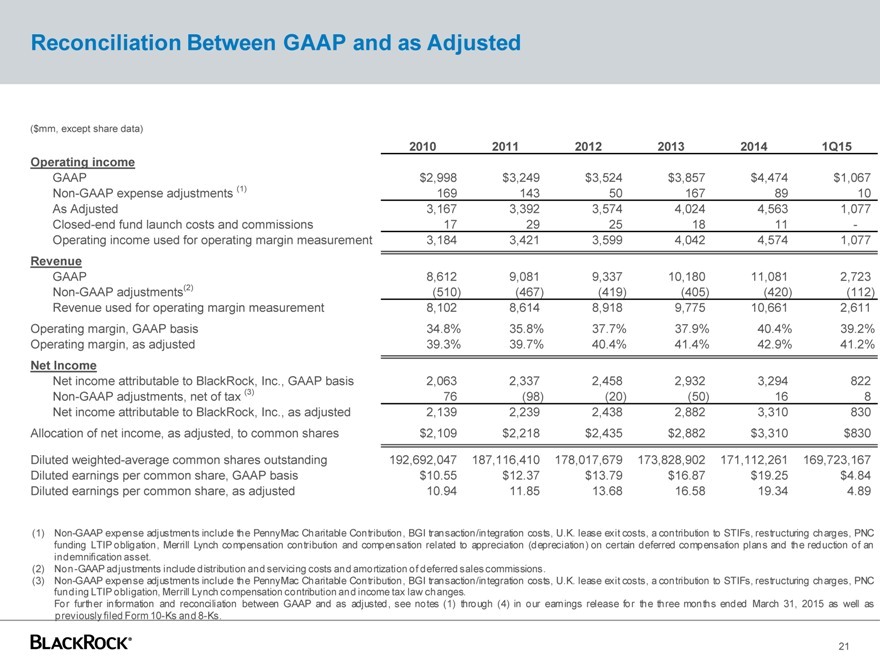
Reconciliation Between GAAP and as Adjusted
($mm, except share data)
2010 2011 2012 2013 2014 1Q15
Operating income
GAAP $2,998 $3,249 $3,524 $3,857 $4,474 $1,067
Non-GAAP expense adjustments (1) 169 143 50 167 89 10
As Adjusted 3,167 3,392 3,574 4,024 4,563 1,077
Closed-end fund launch costs and commissions 17 29 25 18 11 -
Operating income used for operating margin measurement 3,184 3,421 3,599 4,042 4,574 1,077
Revenue
GAAP 8,612 9,081 9,337 10,180 11,081 2,723
Non-GAAP adjustments(2) (510) (467) (419) (405) (420) (112)
Revenue used for operating margin measurement 8,102 8,614 8,918 9,775 10,661 2,611
Operating margin, GAAP basis 34.8% 35.8% 37.7% 37.9% 40.4% 39.2%
Operating margin, as adjusted 39.3% 39.7% 40.4% 41.4% 42.9% 41.2%
Net Income
Net income attributable to BlackRock, Inc., GAAP basis 2,063 2,337 2,458 2,932 3,294 822
Non-GAAP adjustments, net of tax (3) 76 (98) (20) (50) 16 8
Net income attributable to BlackRock, Inc., as adjusted 2,139 2,239 2,438 2,882 3,310 830
Allocation of net income, as adjusted, to common shares $2,109 $2,218 $2,435 $2,882 $3,310 $830
Diluted weighted-average common shares outstanding 192,692,047 187,116,410 178,017,679 173,828,902 171,112,261 169,723,167
Diluted earnings per common share, GAAP basis $10.55 $12.37 $13.79 $16.87 $19.25 $4.84
Diluted earnings per common share, as adjusted 10.94 11.85 13.68 16.58 19.34 4.89
(1) Non-GAAP expense adjustments include the PennyMac Charitable Contribution, BGI transaction/integration costs, U.K. lease exit costs, a contribution to STIFs, restructuring charges, PNC
funding LTIP obligation, Merrill Lynch compensation contribution and compensation related to appreciation (depreciation) on certain deferred compensation plans and the reduction of an
indemnification asset.
(2) Non-GAAP adjustments include distribution and servicing costsand amortization of deferred sales commissions.
(3) Non-GAAP expense adjustments include the PennyMac Charitable Contribution, BGI transaction/integration costs, U.K. lease exit costs, a contribution to STIFs, restructuring charges, PNC
funding LTIP obligation, Merrill Lynch compensation contribution and income tax law changes.
For further information and reconciliation between GAAP and as adjusted, see notes (1) through (4) in our earnings release for the three months ended March 31, 2015 as well as
previously filed Form 10-Ks and 8-Ks.
21
|
|
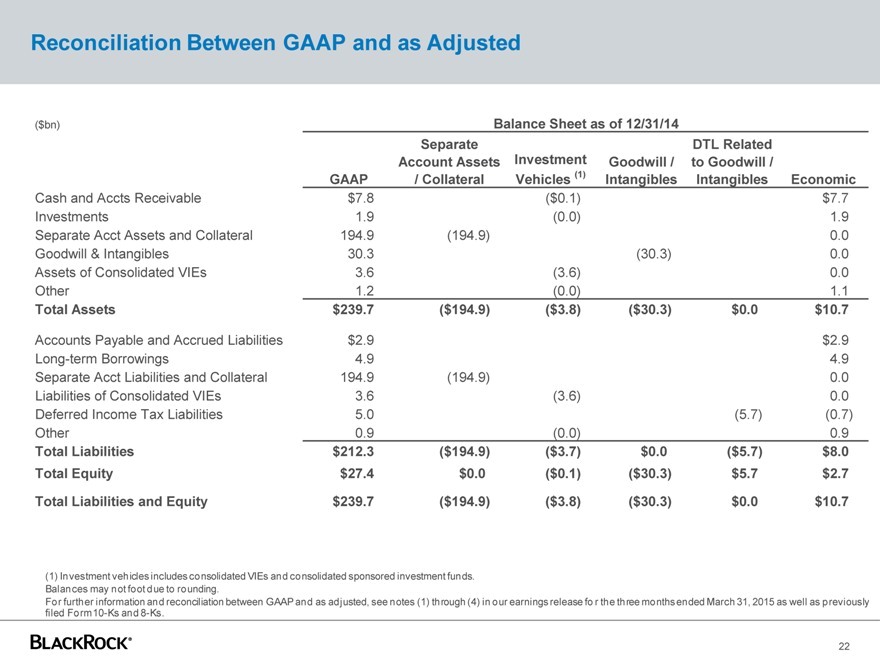
Reconciliation Between GAAP and as Adjusted
($bn) Balance Sheet as of 12/31/14
Separate DTL Related
Account Assets Investment Goodwill / to Goodwill /
GAAP / Collateral Vehicles (1) Intangibles Intangibles Economic
Cash and Accts Receivable $7.8 ($0.1) $7.7
Investments 1.9 (0.0) 1.9
Separate Acct Assets and Collateral 194.9 (194.9) 0.0
Goodwill & Intangibles 30.3 (30.3) 0.0
Assets of Consolidated VIEs 3.6 (3.6) 0.0
Other 1.2 (0.0) 1.1
Total Assets $239.7 ($194.9) ($3.8) ($30.3) $0.0 $10.7
Accounts Payable and Accrued Liabilities $2.9 $2.9
Long-term Borrowings 4.9 4.9
Separate Acct Liabilities and Collateral 194.9 (194.9) 0.0
Liabilities of Consolidated VIEs 3.6 (3.6) 0.0
Deferred Income Tax Liabilities 5.0 (5.7) (0.7)
Other 0.9 (0.0) 0.9
Total Liabilities $212.3 ($194.9) ($3.7) $0.0 ($5.7) $8.0
Total Equity $27.4 $0.0 ($0.1) ($30.3) $5.7 $2.7
Total Liabilities and Equity $239.7 ($194.9) ($3.8) ($30.3) $0.0 $10.7
(1) Investment vehicles includes consolidated VIEs and consolidated sponsored investment funds. Balances may not foot due to rounding.
For further information and reconciliation between GAAP and as adjusted, see notes (1) through (4) in our earnings release for the three months ended March 31, 2015 as well as previously filed Form 10-Ks and 8-Ks.
22
|
|
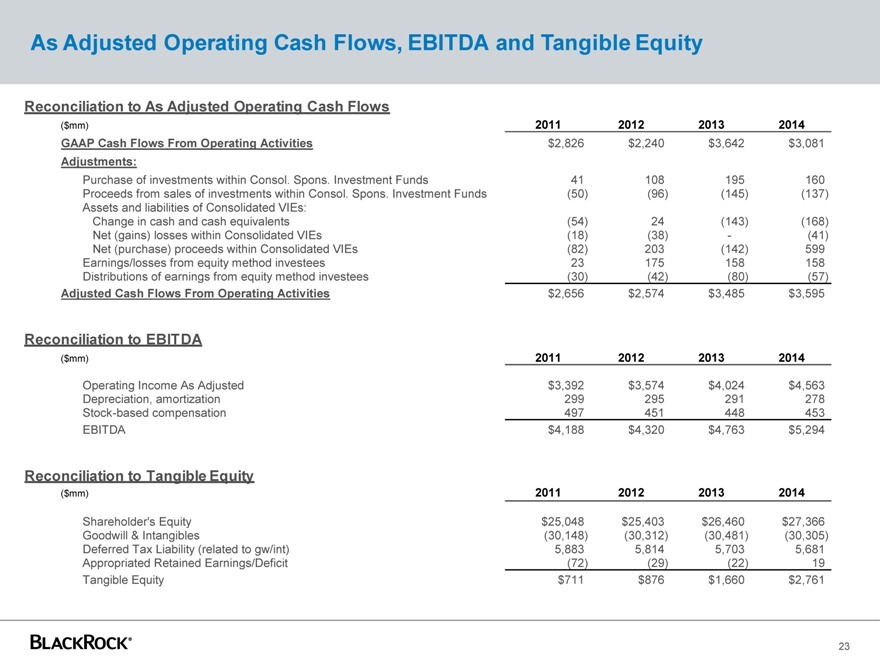
As Adjusted Operating Cash Flows, EBITDA and Tangible Equity
Reconciliation to As Adjusted Operating Cash Flows
($mm) 2011 2012 2013 2014
GAAP Cash Flows From Operating Activities $2,826 $2,240 $3,642 $3,081
Adjustments:
Purchase of investments within Consol. Spons. Investment Funds 41 108 195 160
Proceeds from sales of investments within Consol. Spons. Investment Funds (50) (96) (145) (137)
Assets and liabilities of Consolidated VIEs:
Change in cash and cash equivalents (54) 24 (143) (168)
Net (gains) losses within Consolidated VIEs (18) (38) — (41)
Net (purchase) proceeds within Consolidated VIEs (82) 203 (142) 599
Earnings/losses from equity method investees 23 175 158 158
Distributions of earnings from equity method investees (30) (42) (80) (57)
Adjusted Cash Flows From Operating Activities $2,656 $2,574 $3,485 $3,595
Reconciliation to EBITDA
($mm) 2011 2012 2013 2014
Operating Income As Adjusted $3,392 $3,574 $4,024 $4,563
Depreciation, amortization 299 295 291 278
Stock-based compensation 497 451 448 453
EBITDA $4,188 $4,320 $4,763 $5,294
Reconciliation to Tangible Equity
($mm) 2011 2012 2013 2014
Shareholder’s Equity $25,048 $25,403 $26,460 $27,366
Goodwill & Intangibles (30,148) (30,312) (30,481) (30,305)
Deferred Tax Liability (related to gw/int) 5,883 5,814 5,703 5,681
Appropriated Retained Earnings/Deficit (72) (29) (22) 19
Tangible Equity $711 $876 $1,660 $2,761
23
|
|
Important Notes
This document contains general information only and does not take into account an individual’s financial circumstances. An assessment should be made as to whether the information is appropriate in individual circumstances and consideration should be given to talking to a professional adviser before making an investment decision.
The opinions expressed are as of April 2015 and may change as subsequent conditions vary. The information and opinions contained in this material are derived from proprietary and non-proprietary sources deemed by BlackRock, Inc. and/or its subsidiaries (together, “BlackRock”) to be reliable, are not necessarily all inclusive and are not guaranteed as to accuracy.
There is no guarantee that any forecasts made will come to pass. Reliance upon information in this material is at the sole discretion of the reader. This material may contain “forward-looking” information that is not purely historical in nature. Such information may include, among other things, projections or forecasts. No representation is made that every assumption made in achieving, calculating or presenting either the forward-looking information or the historical performance information herein has been considered or stated in preparing this material. Any changes to assumptions that may have been made in preparing this material could have a material impact on the forecasts that are presented herein by way of example. Investing involves risk, including possible loss of principal. This material is not intended to provide, and should not be relied on for, accounting, legal or tax advice or investment recommendations. No part of this document may be reproduced, stored in a retrieval system or transmitted in any form or by any means, electronic, mechanical, photocopying, recording or otherwise, without the prior written consent of BlackRock.
A securities rating is not a recommendation to buy, sell or hold securities and may be subject to revision or withdrawal at any time.
© 2015 BlackRock, Inc. All Rights reserved. BLACKROCK, BLACKROCK SOLUTIONS, ALADDIN, iSHARES, are registered and unregistered trademarks of BlackRock, Inc. or its subsidiaries in the United States and elsewhere. All other trademarks are those of their respective owners.
24
|
|
BLACKROCK®
25
Serious News for Serious Traders! Try StreetInsider.com Premium Free!
You May Also Be Interested In
- Probe Finds Billions Went To Blacklisted Chinese Cos, Probe Focused on BlackRock (BLK) and MSCI (MSCI) - WSJ
- Shippeo Spring Platform Release Reveals All-new Parcel Tracking, Advanced Carbon Emissions Monitoring Features, and Enhanced Container Tracking Data Quality
- Medivir provides update from supportive Type C meeting with the FDA; preparations for enhanced phase 2b in HCC with fostrox + Lenvima continue
Create E-mail Alert Related Categories
SEC FilingsSign up for StreetInsider Free!
Receive full access to all new and archived articles, unlimited portfolio tracking, e-mail alerts, custom newswires and RSS feeds - and more!
