

Form 8-K BioMed Realty Trust Inc For: Nov 05
 Tweet
Tweet Share
ShareUNITED STATES
SECURITIES AND EXCHANGE COMMISSION
WASHINGTON, D.C. 20549
FORM 8-K
CURRENT REPORT
Pursuant to Section 13 or 15(d) of the
Securities Exchange Act of 1934
Date of Report (Date of earliest event reported): November 5, 2015
BioMed Realty Trust, Inc.
(Exact name of registrant as specified in its charter)
| Maryland | 1-32261 | 20-1142292 | ||
| (State or Other Jurisdiction of Incorporation) |
(Commission File No.) |
(I.R.S. Employer Identification No.) |
17190 Bernardo Center Drive
San Diego, California 92128
(Address of principal executive offices, including zip code)
Registrant’s telephone number, including area code: (858) 485-9840
Check the appropriate box below if the Form 8-K filing is intended to simultaneously satisfy the filing obligation of the registrant under any of the following provisions (see General Instruction A.2. below):
| ¨ | Written communications pursuant to Rule 425 under the Securities Act (17 CFR 230.425) |
| x | Soliciting material pursuant to Rule 14a-12 under the Exchange Act (17 CFR 240.14a-12) |
| ¨ | Pre-commencement communications pursuant to Rule 14d-2(b) under the Exchange Act (17 CFR 240.14d-2(b)) |
| ¨ | Pre-commencement communications pursuant to Rule 13e-4(c) under the Exchange Act (17 CFR 240.13e-4(c)) |
Item 2.02 Results of Operations and Financial Condition.
On November 5, 2015, BioMed Realty Trust, Inc. (the “Company”) issued a press release regarding its financial results for the third quarter ended September 30, 2015 which referred to certain supplemental information that is available on the Company’s website at www.biomedrealty.com. Copies of the press release and supplemental information are attached hereto as Exhibits 99.1 and 99.2, respectively, and are incorporated by reference herein.
The information contained in this Current Report, including the exhibits referenced herein, is being furnished and shall not be deemed “filed” for purposes of Section 18 of the Securities Exchange Act of 1934, as amended, or otherwise subject to the liabilities of that section. Such information shall not be incorporated by reference into any filing of the Company, whether made before or after the date hereof, regardless of any general incorporation language in such filing.
Item 8.01 Other Events.
As disclosed in Item 2.02 above, on November 5, 2015, the Company issued a press release and made available supplemental information regarding its financial results for the period ended September 30, 2015 and also commenting on the Company’s pending acquisition by affiliates of Blackstone Real Estate Partners VIII. The information set forth in Item 2.02 regarding the Company’s pending acquisition by affiliates of Blackstone Real Estate Partners VIII is hereby incorporated into this Item 8.01. All other information set forth in Item 2.02 is being furnished and shall not be deemed “filed” for purposes of Section 18 of the Securities Exchange Act of 1934, as amended, or otherwise subject to the liabilities of that section. Such information shall not be incorporated by reference into any filing of the Company, whether made before or after the date hereof, regardless of any general incorporation language in such filing.
Item 9.01 Financial Statements and Exhibits.
| (d) | The following exhibits are furnished herewith: |
| Exhibit |
Description of Exhibit | |
| 99.1 | Press release issued by BioMed Realty Trust, Inc. on November 5, 2015. | |
| 99.2 | BioMed Realty Trust, Inc. Supplemental Operating and Financial Data for the quarter ended September 30, 2015. | |
SIGNATURES
Pursuant to the requirements of the Securities Exchange Act of 1934, the registrant has duly caused this report to be signed on its behalf by the undersigned hereunto duly authorized.
| Date: November 5, 2015 |
BIOMED REALTY TRUST, INC. | |||
| By: | /s/ Greg N. Lubushkin | |||
| Name: Greg N. Lubushkin | ||||
| Title: Chief Financial Officer | ||||
Exhibit 99.1

| CONTACT: | Rick Howe | |
| Senior Director, Corporate Communications | ||
| 858.207.5859 | ||
| [email protected] |
BIOMED REALTY TRUST REPORTS THIRD QUARTER 2015 FINANCIAL RESULTS
Q3 Gross Leasing Volume of 1.3 Million SF Drives 734,000 SF of Positive Net Absorption during the Quarter
SAN DIEGO, Calif. – November 5, 2015 – BioMed Realty Trust, Inc. (NYSE: BMR), investing in the highest quality institutional real estate to meet growing demand across the life science industry, today reported funds from operations (FFO) and core FFO (CFFO) per diluted share of $0.44 for the third quarter ended September 30, 2015, driven by the company’s sustained strong leasing, development deliveries and investment acumen.
Third Quarter Highlights
During the third quarter, the company:
| • | Generated total gross leasing in the quarter of approximately 1.3 million square feet, bringing total gross leasing year-to-date to approximately 3.4 million square feet. Gross leasing drove approximately 734,000 square feet of aggregate positive net absorption; |
| • | Continued delivery of properties in its well-leased development pipeline, including completion of the 510,400 square foot 100 College Street property in New Haven, Connecticut, and the 297,000 square foot laboratory and office building in the company’s Landmark at Eastview campus, both of which are fully leased; and |
| • | Completed the acquisition of the South Street Landing property in Providence, Rhode Island, a historical rehabilitation development project which is expected to comprise approximately 268,000 square feet and is 100% pre-leased to Brown University and the Rhode Island Board of Education. |
Subsequent to the end of the third quarter, the company announced a definitive agreement with affiliates of Blackstone Real Estate Partners VIII, under which Blackstone has agreed to acquire all of the outstanding shares of common stock of the company for $23.75 per share, plus, if the transaction is consummated after January 1, 2016, a per diem amount of approximately $0.003 per share for each day from January 1, 2016 until (but not including) the closing date.
1
Third Quarter 2015 Portfolio Update
During the quarter ended September 30, 2015, the company executed 61 leasing transactions totaling approximately 1.3 million square feet of gross leasing, driving positive net absorption for the quarter of approximately 329,000 square feet within the operating portfolio and approximately 404,900 square feet within the development portfolio. As of September 30, 2015, the operating portfolio leased percentage based on square footage improved 240 basis points from the prior quarter, from 91.0% to 93.4%. At quarter end, the active new construction portfolio comprised eight projects totaling approximately 1.9 million square feet, which were collectively 71.6% pre-leased.
Third quarter leasing included:
| • | 45 new leases totaling more than 1.0 million square feet, highlighted by new or expanded tenant relationships with: |
| • | AbbVie for approximately 43,000 square feet at 200 Sidney Street in the Sidney Research Campus in Cambridge, Massachusetts; |
| • | Precision Toxicology for approximately 56,000 square feet at the newly renovated Sorrento Valley Boulevard property in San Diego, California; |
| • | Stanford Health Care for approximately 41,200 square feet at the Pacific Research Center in Newark, California, bringing the total leased percentage on the North campus to 94% and to 88% for the entire campus; |
| • | A large, multi-national biopharmaceutical company for an approximately 95,000 square foot build-to-suit lease transaction at Granta Park in Cambridge, United Kingdom; and |
| • | MacroGenics for approximately 122,600 square feet at the 9704 Medical Center Drive property in Rockville, Maryland; |
| • | 16 renewals and extensions of existing tenant relationships totaling approximately 228,200 square feet, including an extension for an additional ten years through March 2028 of the Dana Farber Cancer Institute for its 50,700 square foot lease at the Center for Life Science | Boston. |
During the third quarter, the company completed construction and delivered:
| • | The approximately 510,400 square foot laboratory and office building at 100 College Street in New Haven, Connecticut, which is adjacent to the Yale School of Medicine and Yale-New Haven Hospital. The building is fully leased to Alexion Pharmaceuticals and Yale University; and |
| • | The 297,000 square foot laboratory and office building in the company’s Landmark at Eastview campus in Tarrytown, New York, which is fully leased to Regeneron Pharmaceuticals. The campus now comprises approximately 1,461,000 square feet, which was 100% leased at September 30, 2015. |
Also during the third quarter, the company completed the acquisition of a historical rehabilitation development project in Providence, Rhode Island for an initial investment of approximately $21.4 million. The project is expected to comprise approximately 268,000 square feet and is 100% pre-leased to Brown University and the Rhode Island Board of Education for expected use as office space and a nursing school, in addition to 172 residential units primarily for use by Brown University graduate school students and a 750-space parking garage. The estimated total investment for the development, net of tax credit subsidies, is approximately $185 million.
2
In addition, the company acquired the property located at 21 Firstfield Road in Gaithersburg, Maryland for approximately $10.4 million, comprising approximately 52,800 square feet and 100% leased to Novavax through November 2026.
In the quarter, the company recorded a gain of approximately $2.0 million from the sale of its 65 West Watkins Mill Road property in Gaithersburg, Maryland for $7.9 million in gross proceeds. This gain did not impact FFO or CFFO for the quarter.
Subsequent to the end of the third quarter, the company signed new leases with:
| • | Ignyta for ten years for approximately 95,100 square feet at Towne Centre Technology Park in San Diego, California, a property which the company acquired in May 2015; and |
| • | Natera for seven years for approximately 88,400 square feet at the company’s Industrial Road property on the San Francisco Peninsula in San Carlos, California. |
Third Quarter 2015 Financial Results
Total revenues for the third quarter were approximately $174.3 million, compared to approximately $168.9 million for the same period in 2014. Rental revenues for the third quarter were approximately $123.3 million, compared to $122.8 million for the same period in 2014.
CFFO and FFO, calculated in accordance with standards established by NAREIT, for the third quarter were $0.44 per diluted share. This amount includes realized gains totaling $15.5 million, or $0.07 per diluted share, net of an allocation of income attributable to noncontrolling interests, primarily from the acquisition of a life science company in which the company held an equity investment. In addition, other revenues included approximately $3.1 million of lease termination income, or $0.01 per diluted share. CFFO and FFO for the same period in 2014 were $0.40 per diluted share.
Adjusted funds from operations (AFFO) was $0.32 per diluted share for the quarter, compared to $0.35 per diluted share for the same period in 2014. The company reported net income attributable to common stockholders for the quarter of approximately $28.2 million, or $0.14 per diluted share, compared to $16.0 million, or $0.08 per diluted share, for the same period in 2014.
Same property net operating income on a cash basis for the three months ended September 30, 2015 declined by 4.0% as compared to the same period a year ago, driven primarily by the impact of previously disclosed lease terminations.
FFO, CFFO and AFFO are supplemental non-GAAP financial measures used in the real estate industry to measure and compare the operating performance of real estate companies. A complete reconciliation containing adjustments from GAAP net income available to common stockholders to FFO, CFFO and AFFO and definitions of terms are included at the end of this release.
3
Financing Activity
During the third quarter, the company refinanced the loan secured by the 650 East Kendall Street property, which the company owns through its joint venture with Prudential Real Estate Investors. Under the terms of the new loan, the amount financed was increased to $160 million from approximately $139 million and the applicable credit spread over LIBOR was reduced from 205 basis points to 140 basis points over a new five-year term. The facility matures in August 2020, with two one-year extension options exercisable at the joint venture’s discretion.
Quarterly Distributions
On October 8, 2015, the company announced that it entered into a definitive merger agreement with affiliates of Blackstone Real Estate Partners VIII, under which Blackstone has agreed to acquire all outstanding shares of common stock of BioMed Realty for $23.75 per share. Completion of the transaction is currently expected to occur in the first quarter of 2016 and is contingent upon customary closing conditions, including the approval of the company’s stockholders, who will vote on the transaction at a special meeting on a date to be announced.
BioMed Realty’s board of directors previously declared a third quarter 2015 dividend of $0.26 per share of common stock, which is equivalent to an annualized dividend of $1.04 per common share. The third quarter dividend was paid on October 15, 2015 to stockholders of record at the close of business on September 30, 2015. Pursuant to the terms of the merger agreement with Blackstone, the company will not pay dividends on the common stock for any quarter thereafter, subject to certain exceptions. However, if the proposed merger transaction is completed after January 1, 2016, stockholders will receive a per diem amount of approximately $0.003 per share for each day from January 1, 2016 until, but not including, the closing date.
Supplemental Information
Supplemental operating and financial data are available in the Investor Relations section of the company’s website at www.biomedrealty.com.
Teleconference and Webcast
As a result of the announcement of the company’s proposed merger with Blackstone, BioMed Realty will not be conducting a conference call and webcast to discuss results for the quarter.
About BioMed Realty Trust
BioMed Realty, with its trusted expertise and valuable relationships, delivers optimal real estate solutions for biotechnology and pharmaceutical companies, scientific research institutions, government agencies and other entities involved in the life science industry. BioMed Realty owns or has interests in properties comprising approximately 18.9 million rentable square feet. Additional information is available at www.biomedrealty.com. Follow us on Twitter @biomedrealty.
4
Forward-Looking Statements
This press release contains forward-looking statements within the meaning of the Private Securities Litigation Reform Act of 1995 based on current expectations, forecasts and assumptions that involve risks and uncertainties that could cause actual outcomes and results to differ materially These forward-looking statements include, among other things, statements about the expected benefits of the proposed merger with affiliates of Blackstone Real Estate Partners VIII (“Blackstone”), the expected timing and completion of the proposed merger with affiliates of Blackstone and the future business, performance and opportunities of BioMed Realty. Forward-looking statements generally can be identified by the use of words such as “anticipate,” “believe,” “estimate,” “expect,” “intend,” “should,” “will,” or similar words intended to identify information that is not historical in nature. These risks and uncertainties include, without limitation: the ability of the company to obtain required stockholder or regulatory approvals required to consummate the proposed merger with affiliates of Blackstone; the satisfaction or waiver of other conditions to closing in the definitive agreement for the proposed merger with affiliates of Blackstone; unanticipated difficulties or expenditures relating to the proposed merger with affiliates of Blackstone; the response of business partners and competitors to the announcement of the proposed merger with affiliates of Blackstone; potential difficulties in employee retention as a result of the announcement and pendency of the proposed merger with affiliates of Blackstone; legal proceedings that have been, or may be, instituted against the company and others related to the proposed merger with affiliates of Blackstone; general risks affecting the real estate industry (including, without limitation, the inability to enter into or renew leases, dependence on tenants’ financial condition, and competition from other developers, owners and operators of real estate); adverse economic or real estate developments in the life science industry or the company’s target markets; risks associated with the availability and terms of financing, the use of debt to fund acquisitions, developments and other investments, and the ability to refinance indebtedness as it comes due; failure to maintain the company’s investment grade credit ratings with the ratings agencies; failure to manage effectively the company’s growth and expansion into new markets, or to complete or integrate acquisitions and developments successfully; reductions in asset valuations and related impairment charges; risks and uncertainties affecting property development and construction; risks associated with tax credits, grants and other subsidies to fund development activities; risks associated with downturns in foreign, domestic and local economies, changes in interest rates and foreign currency exchange rates, and volatility in the securities markets; ownership of properties outside of the United States that subject the company to different and potentially greater risks than those associated with the company’s domestic operations; risks associated with the company’s investments in loans, including borrower defaults and potential principal losses; potential liability for uninsured losses and environmental contamination; risks associated with security breaches and other disruptions to the company’s information technology networks and related systems; risks associated with the company’s potential failure to qualify as a REIT under the Internal Revenue Code of 1986, as amended, and possible adverse changes in tax and environmental laws; and risks associated with the company’s dependence on key personnel whose continued service is not guaranteed. For a further list and description of such risks and uncertainties, see the reports filed by the company with the Securities and Exchange Commission (the “SEC”), including BioMed Realty’s most recent annual report on Form 10-K and quarterly reports on Form 10-Q. Any forward-looking statement speaks only as of the date of this communication. The company disclaims any intention or obligation to update or revise any forward-looking statements, whether as a result of new information or developments, future events or otherwise.
Additional Information and Where to Find It
In connection with the proposed merger transaction involving BioMed Realty and affiliates of Blackstone, BioMed Realty will file a proxy statement and other relevant materials with the SEC. This communication does not constitute a solicitation of any vote or proxy from any stockholder of BioMed Realty. INVESTORS ARE URGED TO READ THE PROXY STATEMENT CAREFULLY AND IN ITS ENTIRETY WHEN IT BECOMES AVAILABLE AND ANY OTHER RELEVANT DOCUMENTS OR MATERIALS FILED OR TO BE FILED WITH THE SEC OR INCORPORATED BY REFERENCE IN THE PROXY STATEMENT, BECAUSE THEY WILL CONTAIN IMPORTANT INFORMATION ABOUT THE PROPOSED MERGER. The final proxy statement will be mailed to BioMed Realty stockholders. In addition, the proxy statement and other documents will be available free of charge at the SEC’s internet website, www.sec.gov. When available, the proxy statement and other pertinent documents also may be obtained free of charge at BioMed Realty’s website, www.biomedrealty.com, or by directing a written request to BioMed Realty at 17190 Bernardo Center Drive, San Diego, California 92128, Attention: Secretary.
5
Participants in the Solicitation
BioMed Realty and its directors and executive officers and other members of management and employees may be deemed to be participants in the solicitation of proxies in respect to the proposed merger with affiliates of Blackstone. Information regarding BioMed Realty’s directors and executive officers is detailed in its proxy statements and annual reports on Form 10-K and quarterly reports on Form 10-Q previously filed with the SEC, each of which can be obtained free of charge from the sources indicated above. Additional information regarding the direct and indirect interests of BioMed Realty’s directors and executive officers in the proposed transaction may be obtained by reading the proxy statement relating to the proposed transaction and other relevant materials when they become available.
# # #
(Financial Tables Follow)
6
BIOMED REALTY TRUST, INC.
CONSOLIDATED BALANCE SHEETS
(In thousands, except share data)
| September 30, 2015 |
December 31, 2014 |
|||||||
| (Unaudited) | ||||||||
| ASSETS | ||||||||
| Land |
$ | 667,391 | $ | 704,958 | ||||
| Building and improvements |
5,252,993 | 4,877,135 | ||||||
| Building and improvements |
243,623 | 151,242 | ||||||
| Construction in progress |
638,078 | 629,679 | ||||||
|
|
|
|
|
|||||
| Investments in real estate, gross |
6,802,085 | 6,363,014 | ||||||
| Accumulated depreciation |
(1,080,838 | ) | (946,439 | ) | ||||
|
|
|
|
|
|||||
| Investments in real estate, net |
5,721,247 | 5,416,575 | ||||||
| Investments in unconsolidated partnerships |
29,367 | 35,291 | ||||||
| Cash and cash equivalents |
48,675 | 46,659 | ||||||
| Accounts receivable, net |
19,139 | 14,631 | ||||||
| Accrued straight-line rents, net |
177,423 | 163,716 | ||||||
| Deferred leasing costs, net |
226,956 | 219,713 | ||||||
| Other assets |
237,889 | 274,301 | ||||||
|
|
|
|
|
|||||
| Total assets |
$ | 6,460,696 | $ | 6,170,886 | ||||
|
|
|
|
|
|||||
| LIABILITIES AND EQUITY | ||||||||
| Mortgage notes payable, net |
$ | 492,065 | $ | 496,757 | ||||
| Exchangeable senior notes |
— | 95,678 | ||||||
| Unsecured senior notes, net |
1,294,978 | 1,293,903 | ||||||
| Unsecured senior term loans |
745,126 | 749,326 | ||||||
| Unsecured line of credit |
463,000 | 84,000 | ||||||
| Accounts payable, accrued expenses and other liabilities |
419,418 | 381,280 | ||||||
|
|
|
|
|
|||||
| Total liabilities |
3,414,587 | 3,100,944 | ||||||
| Equity: |
||||||||
| Stockholders’ equity: |
||||||||
| Common stock, $.01 par value, 300,000,000 shares and 250,000,000 shares authorized, and 203,527,787 shares and 197,442,432 shares issued and outstanding at September 30, 2015 and December 31, 2014, respectively |
2,036 | 1,975 | ||||||
| Additional paid-in capital |
3,754,137 | 3,649,235 | ||||||
| Accumulated other comprehensive loss, net |
(39,725 | ) | (2,214 | ) | ||||
| Dividends in excess of earnings |
(735,627 | ) | (645,983 | ) | ||||
|
|
|
|
|
|||||
| Total stockholders’ equity |
2,980,821 | 3,003,013 | ||||||
| Noncontrolling interests |
65,288 | 66,929 | ||||||
|
|
|
|
|
|||||
| Total equity |
3,046,109 | 3,069,942 | ||||||
|
|
|
|
|
|||||
| Total liabilities and equity |
$ | 6,460,696 | $ | 6,170,886 | ||||
|
|
|
|
|
|||||
7
BIOMED REALTY TRUST, INC.
CONSOLIDATED STATEMENTS OF INCOME
(In thousands, except share data)
(Unaudited)
| For the Three Months Ended | For the Nine Months Ended | |||||||||||||||
| September 30, | September 30, | |||||||||||||||
| 2015 | 2014 | 2015 | 2014 | |||||||||||||
| Revenues: |
||||||||||||||||
| Rental |
$ | 123,332 | $ | 122,838 | $ | 357,112 | $ | 363,788 | ||||||||
| Tenant recoveries |
47,539 | 42,626 | 133,068 | 121,641 | ||||||||||||
| Other revenue |
3,477 | 3,452 | 20,152 | 23,524 | ||||||||||||
|
|
|
|
|
|
|
|
|
|||||||||
| Total revenues |
174,348 | 168,916 | 510,332 | 508,953 | ||||||||||||
|
|
|
|
|
|
|
|
|
|||||||||
| Expenses: |
||||||||||||||||
| Rental operations |
62,069 | 54,899 | 175,986 | 161,058 | ||||||||||||
| Depreciation and amortization |
64,953 | 64,452 | 193,305 | 189,597 | ||||||||||||
| General and administrative |
13,166 | 12,768 | 38,486 | 37,153 | ||||||||||||
| Executive severance |
— | — | 9,891 | — | ||||||||||||
| Acquisition-related expenses |
720 | 487 | 2,284 | 2,871 | ||||||||||||
|
|
|
|
|
|
|
|
|
|||||||||
| Total expenses |
140,908 | 132,606 | 419,952 | 390,679 | ||||||||||||
|
|
|
|
|
|
|
|
|
|||||||||
| Income from operations |
33,440 | 36,310 | 90,380 | 118,274 | ||||||||||||
| Equity in net income of unconsolidated partnerships |
242 | 733 | 534 | 585 | ||||||||||||
| Interest expense, net |
(21,228 | ) | (22,215 | ) | (61,938 | ) | (73,356 | ) | ||||||||
| Gain on sale of real estate |
1,869 | — | 1,869 | — | ||||||||||||
| Impairment of real estate |
— | — | (35,071 | ) | — | |||||||||||
| Other income, net |
18,770 | 2,148 | 95,675 | 11,338 | ||||||||||||
|
|
|
|
|
|
|
|
|
|||||||||
| Net income |
33,093 | 16,976 | 91,449 | 56,841 | ||||||||||||
| Net income attributable to noncontrolling interests |
(4,890 | ) | (1,016 | ) | (22,323 | ) | (3,412 | ) | ||||||||
|
|
|
|
|
|
|
|
|
|||||||||
| Net income attributable to the Company |
28,203 | 15,960 | 69,126 | 53,429 | ||||||||||||
| Net income per share attributable to common stockholders: |
||||||||||||||||
| Basic and diluted earnings per share |
$ | 0.14 | $ | 0.08 | $ | 0.34 | $ | 0.27 | ||||||||
|
|
|
|
|
|
|
|
|
|||||||||
| Weighted-average common shares outstanding: |
||||||||||||||||
| Basic |
202,210,976 | 194,022,619 | 201,746,167 | 191,988,661 | ||||||||||||
|
|
|
|
|
|
|
|
|
|||||||||
| Diluted |
207,801,584 | 199,574,893 | 207,325,554 | 197,651,357 | ||||||||||||
|
|
|
|
|
|
|
|
|
|||||||||
8
BIOMED REALTY TRUST, INC.
CONSOLIDATED FUNDS FROM OPERATIONS
(In thousands, except share data)
(Unaudited)
Our FFO and CFFO attributable to common shares and OP units and a reconciliation to net income for the three and nine months ended September 30, 2015 and 2014 (in thousands, except per share and share data) were as follows:
| Three Months Ended | Nine Months Ended | |||||||||||||||
| September 30, | September 30, | |||||||||||||||
| 2015 | 2014 | 2015 | 2014 | |||||||||||||
| Net income attributable to the Company |
$ | 28,203 | $ | 15,960 | $ | 69,126 | $ | 53,429 | ||||||||
| Adjustments: |
||||||||||||||||
| Gain on sale of real estate |
(1,869 | ) | — | (1,869 | ) | — | ||||||||||
| Impairment of real estate |
— | — | 35,071 | — | ||||||||||||
| Noncontrolling interests in operating partnership |
734 | 429 | 1,804 | 1,464 | ||||||||||||
| Depreciation and amortization – unconsolidated partnerships |
471 | 2,312 | 2,527 | 3,088 | ||||||||||||
| Depreciation and amortization – consolidated entities |
64,953 | 64,452 | 193,305 | 189,597 | ||||||||||||
| Depreciation and amortization – allocable to noncontrolling interest of consolidated joint ventures |
(593 | ) | (699 | ) | (2,178 | ) | (1,739 | ) | ||||||||
|
|
|
|
|
|
|
|
|
|||||||||
| FFO attributable to common shares and units – basic |
91,899 | 82,454 | 297,786 | 245,839 | ||||||||||||
| Interest expense on Exchangeable Senior Notes |
— | 1,241 | 183 | 4,616 | ||||||||||||
|
|
|
|
|
|
|
|
|
|||||||||
| FFO attributable to common shares and units – diluted |
91,899 | 83,695 | 297,969 | 250,455 | ||||||||||||
| Acquisition-related expenses |
720 | 487 | 2,284 | 2,871 | ||||||||||||
|
|
|
|
|
|
|
|
|
|||||||||
| CFFO attributable to common shares and units – diluted |
$ | 92,619 | $ | 84,182 | $ | 300,253 | $ | 253,326 | ||||||||
|
|
|
|
|
|
|
|
|
|||||||||
| FFO per share – diluted |
$ | 0.44 | $ | 0.40 | $ | 1.42 | $ | 1.20 | ||||||||
|
|
|
|
|
|
|
|
|
|||||||||
| CFFO per share – diluted |
$ | 0.44 | $ | 0.40 | $ | 1.44 | $ | 1.21 | ||||||||
|
|
|
|
|
|
|
|
|
|||||||||
| Weighted-average common shares and units outstanding – diluted (1) |
209,144,827 | 208,649,141 | 209,115,535 | 208,723,924 | ||||||||||||
|
|
|
|
|
|
|
|
|
|||||||||
9
Our AFFO available to common shares and partnership and LTIP units and a reconciliation of CFFO to AFFO for the three and nine months ended September 30, 2015 and 2014 was as follows:
| Three Months Ended | Nine Months Ended | |||||||||||||||
| September 30, | September 30, | |||||||||||||||
| 2015 | 2014 | 2015 | 2014 | |||||||||||||
| CFFO – diluted |
$ | 92,619 | $ | 84,182 | $ | 300,253 | $ | 253,326 | ||||||||
| Adjustments: |
||||||||||||||||
| Recurring capital expenditures and second generation tenant improvements |
(22,996 | ) | (17,007 | ) | (60,378 | ) | (46,291 | ) | ||||||||
| Leasing commissions |
(2,693 | ) | (1,741 | ) | (8,454 | ) | (5,580 | ) | ||||||||
| Non-cash revenue adjustments |
(7,727 | ) | (702 | ) | (16,368 | ) | (5,452 | ) | ||||||||
| Deferred revenue |
1,066 | 379 | 1,929 | 969 | ||||||||||||
| Non-cash debt adjustments |
2,755 | 3,040 | 8,196 | 9,737 | ||||||||||||
| Non-cash equity compensation |
3,442 | 3,658 | 14,796 | 11,137 | ||||||||||||
| Depreciation included in general and administrative expenses |
879 | 848 | 2,561 | 2,346 | ||||||||||||
| Share of non-cash unconsolidated partnership adjustments |
(96 | ) | 218 | (140 | ) | 254 | ||||||||||
| Adjustments for noncontrolling interests |
286 | 246 | 1,061 | 367 | ||||||||||||
|
|
|
|
|
|
|
|
|
|||||||||
| AFFO available to common shares and units |
$ | 67,535 | $ | 73,121 | $ | 243,456 | $ | 220,813 | ||||||||
|
|
|
|
|
|
|
|
|
|||||||||
| AFFO per share – diluted |
$ | 0.32 | $ | 0.35 | $ | 1.16 | $ | 1.06 | ||||||||
|
|
|
|
|
|
|
|
|
|||||||||
| Weighted-average common shares and units outstanding – diluted (1) |
209,144,827 | 208,649,141 | 209,115,535 | 208,723,924 | ||||||||||||
|
|
|
|
|
|
|
|
|
|||||||||
| (1) | The nine months ended September 30, 2015 and the three and nine months ended September 30, 2014 include 393,631, 7,589,600 and 9,571,008 shares of common stock, respectively, potentially issuable pursuant to the exchange feature of the Exchangeable Senior Notes based on the “if converted” method. The three months ended September 30, 2015 and 2014 include 1,343,243 and 1,484,648 shares of unvested restricted stock, respectively, which are considered anti-dilutive for purposes of calculating diluted earnings per share. The nine months ended September 30, 2015 and 2014 include 1,396,350 and 1,501,559 shares of unvested restricted stock, respectively, which are considered anti-dilutive for purposes of calculating diluted earnings per share. |
10
Exhibit 99.2
Supplemental Operating and Financial Data : September 30, 2015
| BioMed Realty Trust, Inc. | Investor Relations | |
| 17190 Bernardo Center Drive | Corporate Communications Contact: | |
| San Diego, CA 92128 | Rick Howe | |
| t 858.485.9840 f 858.485.9843 | Senior Director, Corporate Communications | |
| biomedrealty.com | [email protected] |

TABLE OF CONTENTS
SEPTEMBER 30, 2015
| Page |
Page |
|||||||||
| Third Quarter Highlights |
3 | Debt Analysis | 20 | |||||||
| Investor Information |
4 | Debt Maturities | 21 | |||||||
| Equity Research Coverage |
5 | Market Summary | 22 | |||||||
| Financial and Operating Highlights |
6 | Property Listing |
23-26 | |||||||
| Portfolio Summary |
7 | Development and Redevelopment | 27 | |||||||
| Consolidated Balance Sheets |
8 | Capital Expenditures | 28 | |||||||
| Consolidated Statements of Income |
9 | Lease Expirations | 29 | |||||||
| Balance Sheet / Income Statement Detail |
10 | Expirations by Market | 30 | |||||||
| FFO, CFFO and AFFO |
11 | Future Lease Commencements | 31 | |||||||
| FFO, CFFO and AFFO per Share |
12 | 20 Largest Tenants | 32 | |||||||
| Reconciliation of EBITDA and Adjusted EBITDA |
13 | Leasing Activity | 33 | |||||||
| Reconciliation of Net Operating Income |
14 | Leasing Data | 34 | |||||||
| Same Property Analysis - Three Months Ended |
15 | Acquisitions and Dispositions | 35 | |||||||
| Same Property Analysis - Six Months Ended |
16 | Non-GAAP Financial Measure Definitions |
36 | |||||||
| Interest Expense and Coverage Ratios |
17 | Definitions | 37 | |||||||
| Capital Structure |
18 | Top Twenty Tenant Notes | 38 | |||||||
| Debt Summary |
19 | |||||||||
This Supplemental Operating and Financial Data package contains forward-looking statements within the meaning of the Private Securities Litigation Reform Act of 1995 based on current expectations, forecasts and assumptions that involve risks and uncertainties that could cause actual outcomes and results to differ materially. These risks and uncertainties include, without limitation: the ability of the company to obtain required stockholder or regulatory approvals required to consummate the proposed merger with affiliates of Blackstone Real Estate Partners VIII; the satisfaction or waiver of other conditions to closing in the definitive agreement for the proposed merger with affiliates of Blackstone; unanticipated difficulties or expenditures relating to the proposed merger with affiliates of Blackstone; the response of business partners and competitors to the announcement of the proposed merger with affiliates of Blackstone; potential difficulties in employee retention as a result of the announcement and pendency of the proposed merger with affiliates of Blackstone: legal proceedings that have been, or may be instituted against the company and others related to the proposed merger with affiliates of Blackstone; general risks affecting the real estate industry (including, without limitation, the inability to enter into or renew leases, dependence on tenants’ financial condition, and competition from other developers, owners and operators of real estate); adverse economic or real estate developments in the life science industry or the company’s target markets; risks associated with the availability and terms of financing, the use of debt to fund acquisitions, developments and other investments, and the ability to refinance indebtedness as it comes due; failure to maintain the company’s investment grade credit ratings with the ratings agencies; failure to manage effectively the company’s growth and expansion into new markets, or to complete or integrate acquisitions and developments successfully; reductions in asset valuations and related impairment charges; risks and uncertainties affecting property development and construction; risks associated with tax credits, grants and other subsidies to fund development activities; risks associated with downturns in foreign, domestic and local economies, changes in interest rates and foreign currency exchange rates, and volatility in the securities markets; ownership of properties outside of the United States that subject the company to different and potentially greater risks than those associated with the company’s domestic operations; risks associated with the company’s investments in loans, including borrower defaults and potential principal losses; potential liability for uninsured losses and environmental contamination; risks associated with security breaches and other disruptions to the company’s information technology networks and related systems; risks associated with the company’s potential failure to qualify as a REIT under the Internal Revenue Code of 1986, as amended, and possible adverse changes in tax and environmental laws; and risks associated with the company’s dependence on key personnel whose continued service is not guaranteed. For a further list and description of such risks and uncertainties, see the reports filed by the company with the Securities and Exchange Commission, including the company’s most recent annual report on Form 10-K and quarterly reports on Form 10-Q. Any forward-looking statement speaks only as of the date of this communication. The company disclaims any intention or obligation to update or revise any forward-looking statements, whether as a result of new information or developments, future events or otherwise.
All amounts shown in this report are unaudited.
This Supplemental Operating and Financial Data package is not an offer to sell or solicitation to buy securities of BioMed Realty Trust, Inc. Any offers to sell or solicitations to buy securities of BioMed Realty Trust, Inc. shall be made only by means of a prospectus approved for that purpose.
THIRD QUARTER HIGHLIGHTS
SEPTEMBER 30, 2015
Financial Results
| • | Total revenues for the third quarter were approximately $174.3 million, compared to approximately $168.9 million for the same period in 2014. Rental revenues for the third quarter were approximately $123.3 million, compared to $122.8 million for the same period in 2014. |
| • | CFFO and FFO, calculated in accordance with standards established by NAREIT, for the third quarter were $0.44 per diluted share. This amount includes realized gains totaling $15.5 million, or $0.07 per diluted share, net of an allocation of income attributable to noncontrolling interests, primarily from the acquisition of a life science company in which the company held an equity investment. In addition, other revenues included approximately $3.1 million of lease termination income, or $0.01 per diluted share. CFFO and FFO for the same period in 2014 were $0.40 per diluted share. |
| • | Adjusted funds from operations (AFFO) was $0.32 per diluted share for the quarter, compared to $0.35 per diluted share for the same period in 2014. The company reported net income attributable to common stockholders for the quarter of approximately $28.2 million, or $0.14 per diluted share, compared to $16.0 million, or $0.08 per diluted share, for the same period in 2014. |
Portfolio Highlights
45 new leases totaling more than 1.0 million square feet, highlighted by new or expanded tenant relationships with:
| • | AbbVie for approximately 43,000 square feet at 200 Sidney Street in the Sidney Research Campus in Cambridge, Massachusetts; |
| • | Precision Toxicology for approximately 56,000 square feet at the newly renovated Sorrento Valley Boulevard property in San Diego, California; |
| • | Stanford Health Care for approximately 41,200 square feet at the Pacific Research Center in Newark, California, bringing the total leased percentage on the North campus to 94% and to 88% for the entire campus; |
| • | A large, multi-national biopharmaceutical company for an approximately 95,000 square foot build-to-suit lease transaction at Granta Park in Cambridge, United Kingdom; |
| • | MacroGenics for approximately 122,600 square feet at the 9704 Medical Center Drive property in Rockville, Maryland; |
16 renewals and extensions of existing tenant relationships totaling approximately 228,200 square feet, including an extension for an additional ten years through March 2028 of the Dana Farber Cancer Institute for its 50,700 square foot lease at the Center for Life Science | Boston.
During the third quarter, the company completed construction and delivered:
| • | The approximately 510,400 square foot laboratory and office building at 100 College Street in New Haven, Connecticut, which is adjacent to the Yale School of Medicine and Yale-New Haven Hospital. The building is fully leased to Alexion Pharmaceuticals and Yale University; and |
| • | The 297,000 square foot laboratory and office building in the company’s Landmark at Eastview campus in Tarrytown, New York. The building is fully leased to Regeneron Pharmaceuticals. The campus now comprises approximately 1,461,000 square feet, which was 100% leased at September 30, 2015. |
About BioMed Realty Trust
BioMed Realty, with its trusted expertise and valuable relationships, delivers optimal real estate solutions for biotechnology and pharmaceutical companies, scientific research institutions, government agencies and other entities involved in the life science industry. BioMed Realty owns or has interests in properties comprising approximately 18.9 million rentable square feet. Additional information is available at www.biomedrealty.com.Follow us on Twitter @biomedrealty.
INVESTOR INFORMATION
SEPTEMBER 30, 2015
(In thousands, except per share amounts)
| Company Information | ||||||
| Corporate Headquarters | Trading Symbol | Transfer Agent | Stock Exchange Listing | |||
| 17190 Bernardo Center Drive | BMR | Computershare Shareowner Services LLC | New York Stock Exchange | |||
| San Diego, CA 92128 | 250 Royall Street | |||||
| (858) 485-9840 | Canton, MA 02021 | |||||
| (858) 485-9843 (fax) | (877) 296-3711 | |||||
| Please visit our corporate website at: www.biomedrealty.com | ||||||
| Board of Directors |
Executive Leadership Team |
|
| |||
| Alan D. Gold | Alan D. Gold | Karen A. Sztraicher | John P. Bonanno | |||
| Chairman | Chairman, President and | Executive Vice President, | Executive Vice President, | |||
| Daniel M. Bradbury | Chief Executive Officer | Asset Management | Development & Investments | |||
| William R. Brody, M.D., Ph.D. | Gary A. Kreitzer | Jonathan P. Klassen | James R. Berens | |||
| Gary A. Kreitzer | Executive Vice President, Director | Executive Vice President, | President | |||
| Theodore D. Roth | Greg N. Lubushkin | General Counsel | Wexford Science & Technology | |||
| Janice. L. Sears | Chief Financial Officer | |||||
| Common Stock Data (NYSE: BMR) |
9/30/15 | 6/30/15 | 3/31/15 | 12/31/14 | 9/30/14 | |||||||||||||||
| High price |
$ | 22.02 | $ | 22.93 | $ | 25.11 | $ | 22.03 | $ | 22.62 | ||||||||||
| Low price |
$ | 17.94 | $ | 19.16 | $ | 20.26 | $ | 19.87 | $ | 19.92 | ||||||||||
| Average closing price |
$ | 20.00 | $ | 20.71 | $ | 22.97 | $ | 21.30 | $ | 21.73 | ||||||||||
| Closing price |
$ | 19.98 | $ | 19.34 | $ | 22.66 | $ | 21.54 | $ | 20.20 | ||||||||||
| Dividends per share - annualized |
$ | 1.04 | $ | 1.04 | $ | 1.04 | $ | 1.04 | $ | 1.00 | ||||||||||
| Closing dividend yield - annualized |
5.2 | % | 5.4 | % | 4.6 | % | 4.8 | % | 5.0 | % | ||||||||||
| Total common shares and units outstanding |
208,926 | 208,966 | 208,968 | 202,847 | 202,860 | |||||||||||||||
| Closing market value of outstanding shares and units |
$ | 4,174,341 | $ | 4,041,402 | $ | 4,735,215 | $ | 4,369,337 | $ | 4,097,785 | ||||||||||
| Consolidated Debt |
2,989,014 | 2,897,073 | 2,758,530 | 2,712,900 | 2,845,686 | |||||||||||||||
|
|
|
|
|
|
|
|
|
|
|
|||||||||||
| Total market capitalization |
$ | 7,163,355 | $ | 6,938,475 | $ | 7,493,745 | $ | 7,082,237 | $ | 6,943,471 | ||||||||||
|
|
|
|
|
|
|
|
|
|
|
|||||||||||
EQUITY RESEARCH COVERAGE
SEPTEMBER 30, 2015
| BMO Capital Markets | John Kim Thomas Polise |
(212) 885-4115 (212) 885-4127 |
||||
| Canaccord Genuity | Paul Morgan Joseph Ng |
(415) 310-7269 (212) 389-8096 |
||||
| Cowen and Company | James Sullivan Tom Catherwood |
(646) 562-1380 (646) 562-1382 |
||||
| Green Street Advisors | Michael Knott Kevin Tyler |
(949) 640-8780 (949) 640-8780 |
||||
| Jefferies & Co. | Omotayo Okusanya |
(212) 336-7076 |
||||
| KeyBanc Capital Markets | Jordan Sadler Craig Mailman |
(917) 368-2280 (917) 368-2316 |
||||
| Mizuho Securities | Richard Anderson |
(212) 205-8445 |
||||
| Morgan Stanley | Vikram Malhotra Landon Park |
(212) 761-7064 (212) 761-6368 |
||||
| Raymond James | Paul Puryear William Crow |
(727) 567-2253 (727) 567-2594 |
||||
| Robert W. Baird & Co. | David Rodgers Stephen Dye |
(216) 737-7341 (312) 609-5480 |
||||
| Stifel, Nicolaus & Company, Inc. | Daniel Bernstein Elizabeth Moran |
(443) 224-1351 (443) 224-1353 |
||||
| UBS Securities | Ross Nussbaum Nick Yulico |
(212) 713-2484 (212) 713-3402 |
||||
FINANCIAL AND OPERATING HIGHLIGHTS
SEPTEMBER 30, 2015
(In thousands, except per share and ratio amounts)
| Three Months Ended | Year to Date | |||||||||||||||||||||||||||
| 9/30/15 | 6/30/15 | 3/31/15 | 12/31/14 | 9/30/14 | 9/30/15 | 9/30/14 | ||||||||||||||||||||||
| Selected Operating Data: |
||||||||||||||||||||||||||||
| Rental revenues |
$ | 123,332 | $ | 116,260 | $ | 117,520 | $ | 121,973 | $ | 122,838 | $ | 357,112 | $ | 363,788 | ||||||||||||||
| Other revenues |
3,477 | 141 | 16,534 | 2,930 | 3,452 | 20,152 | 23,524 | |||||||||||||||||||||
| Total revenues |
174,348 | 157,974 | 178,010 | 165,656 | 168,916 | 510,332 | 508,953 | |||||||||||||||||||||
| Net operating income - GAAP (1) |
112,279 | 102,704 | 119,363 | 112,212 | 114,017 | 334,346 | 347,895 | |||||||||||||||||||||
| Net operating income - cash basis (1) |
105,843 | 98,681 | 116,766 | 111,439 | 113,662 | 321,290 | 343,896 | |||||||||||||||||||||
| Other income/(expense) |
18,770 | 64,021 | 12,884 | (184 | ) | 2,148 | 95,675 | 11,338 | ||||||||||||||||||||
| General and administrative expense |
13,166 | 12,531 | 12,789 | 12,162 | 12,768 | 38,486 | 37,153 | |||||||||||||||||||||
| Interest expense, net |
21,228 | 19,315 | 21,395 | 21,924 | 22,215 | 61,938 | 73,355 | |||||||||||||||||||||
| Capitalized interest |
6,686 | 8,191 | 6,781 | 6,143 | 6,120 | 21,657 | 15,734 | |||||||||||||||||||||
| General and administrative expense / Total revenues |
7.6 | % | 7.9 | % | 7.2 | % | 7.3 | % | 7.6 | % | 7.5 | % | 7.3 | % | ||||||||||||||
| Net income available to common stockholders (2) |
28,203 | 23,578 | 17,345 | 140,349 | 15,960 | 69,126 | 53,429 | |||||||||||||||||||||
| FFO - diluted (3) |
91,899 | 120,811 | 85,259 | 73,157 | 83,695 | 297,969 | 83,383 | |||||||||||||||||||||
| CFFO - diluted (3) |
92,619 | 121,911 | 85,723 | 74,117 | 84,182 | 300,253 | 84,633 | |||||||||||||||||||||
| AFFO - diluted (3) |
67,535 | 100,218 | 75,704 | 56,962 | 73,121 | 243,457 | 79,400 | |||||||||||||||||||||
| Selected Balance Sheet Data: |
||||||||||||||||||||||||||||
| Investments in real estate, gross |
$ | 6,802,085 | $ | 6,634,014 | $ | 6,517,174 | $ | 6,363,014 | $ | 6,473,731 | $ | 6,802,085 | $ | 6,473,731 | ||||||||||||||
| Investments in real estate, net |
5,721,247 | 5,607,912 | 5,517,629 | 5,416,575 | 5,535,115 | 5,721,247 | 5,535,115 | |||||||||||||||||||||
| Cash and cash equivalents |
48,675 | 45,329 | 64,958 | 46,659 | 33,864 | 48,675 | 33,864 | |||||||||||||||||||||
| Total assets |
6,460,696 | 6,338,209 | 6,308,418 | 6,170,886 | 6,238,312 | 6,460,696 | 6,238,312 | |||||||||||||||||||||
| Total debt |
2,989,014 | 2,897,073 | 2,758,530 | 2,712,900 | 2,845,686 | 2,989,014 | 2,845,686 | |||||||||||||||||||||
| Total liabilities |
3,414,587 | 3,257,362 | 3,151,340 | 3,100,944 | 3,228,602 | 3,414,587 | 3,228,602 | |||||||||||||||||||||
| Profitability Measures: |
||||||||||||||||||||||||||||
| Net income per share - diluted |
$ | 0.14 | $ | 0.11 | $ | 0.08 | $ | 0.70 | $ | 0.08 | $ | 0.34 | $ | 0.27 | ||||||||||||||
| FFO per share - diluted (3) |
$ | 0.44 | $ | 0.58 | $ | 0.41 | $ | 0.35 | $ | 0.40 | $ | 1.42 | $ | 1.20 | ||||||||||||||
| CFFO per share - diluted (3) |
$ | 0.44 | $ | 0.58 | $ | 0.41 | $ | 0.36 | $ | 0.40 | $ | 1.44 | $ | 1.21 | ||||||||||||||
| AFFO per share - diluted (3) |
$ | 0.32 | $ | 0.48 | $ | 0.36 | $ | 0.27 | $ | 0.35 | $ | 1.16 | $ | 1.06 | ||||||||||||||
| Dividend per share - common stock |
$ | 0.26 | $ | 0.26 | $ | 0.26 | $ | 0.26 | $ | 0.25 | $ | 0.78 | $ | 0.75 | ||||||||||||||
| CFFO payout ratio (4) |
59.1 | % | 44.8 | % | 63.4 | % | 72.2 | % | 62.5 | % | 54.2 | % | 62.0 | % | ||||||||||||||
| AFFO payout ratio (4) |
81.3 | % | 54.2 | % | 72.2 | % | 96.3 | % | 71.4 | % | 67.2 | % | 70.8 | % | ||||||||||||||
| Financial Ratios: |
||||||||||||||||||||||||||||
| EBITDA (5) |
$ | 115,776 | $ | 105,615 | $ | 107,159 | $ | 229,158 | $ | 105,677 | ||||||||||||||||||
| Adjusted EBITDA (5) |
114,675 | 141,299 | 117,508 | 100,712 | 106,103 | |||||||||||||||||||||||
| Net Debt / Adjusted EBITDA (5) (6) |
6.4 | 5.0 | 5.7 | 6.5 | 6.6 | |||||||||||||||||||||||
| Interest coverage |
6.1 | 8.4 | 6.2 | 5.2 | 5.4 | |||||||||||||||||||||||
| Fixed charge coverage |
5.4 | 7.3 | 5.5 | 4.7 | 4.9 | |||||||||||||||||||||||
| Debt / Total assets |
46.3 | % | 45.7 | % | 43.7 | % | 44.0 | % | 45.6 | % | ||||||||||||||||||
| Debt / Total gross assets |
39.6 | % | 39.3 | % | 37.7 | % | 38.1 | % | 39.7 | % | ||||||||||||||||||
| Debt / Total capitalization |
41.7 | % | 41.8 | % | 36.8 | % | 38.3 | % | 41.0 | % | ||||||||||||||||||
| (1) | See page 14 for detail of net operating income – GAAP and net operating income – cash basis. For definitions and discussions see page 36. |
| (2) | For the three months ended December 31, 2014, amount includes $136.6 million related to the gain on sale of the Company’s 9911 Belward Campus Drive property in Rockville, Maryland. |
| (3) | For definitions and discussion of FFO, CFFO and AFFO, see page 36. For a quantitative reconciliation of the differences between FFO, CFFO, AFFO and net income available to common stockholders, see page 11. |
| (4) | See page 12 for detail of the CFFO and AFFO payout ratios. |
| (5) | For definitions and discussion of EBITDA and Adjusted EBITDA, see page 36. For a quantitative reconciliation of the differences between EBITDA, Adjusted EBITDA and net income available to common stockholders, page 13. |
| (6) | Adjusted EBITDA is calculated by adding to EBITDA: (a) noncontrolling interests in our operating partnership, (b) losses from sales of real estate and (c) executive severance and by subtracting from EBITDA gains from sales of real estate, on an annualized basis. See page 13 for detail. Net Debt is calculated as debt less (cash and cash equivalents and restricted cash). |
PORTFOLIO SUMMARY
SEPTEMBER 30, 2015
| Current | ||||||||||||||||||||||||||||
| Gross | Annualized | Percent of | Rentable | Leased | ||||||||||||||||||||||||
| Book Value | Base Rent (1) | CABR | Buildings | Square Feet | Square Feet | Leased % | ||||||||||||||||||||||
| (In thousands) | (In thousands) | |||||||||||||||||||||||||||
| Operating portfolio |
||||||||||||||||||||||||||||
| Boston |
$ | 1,888,710 | $ | 162,145 | 27.9 | % | 27 | 3,088,594 | 2,765,335 | 89.5 | % | |||||||||||||||||
| San Francisco |
852,795 | 64,017 | 11.0 | % | 30 | 2,861,061 | 2,589,252 | 90.5 | % | |||||||||||||||||||
| San Diego |
784,124 | 63,021 | 10.8 | % | 40 | 1,919,676 | 1,845,403 | 96.1 | % | |||||||||||||||||||
| New York |
595,072 | 60,478 | 10.4 | % | 17 | 1,789,884 | 1,767,377 | 98.7 | % | |||||||||||||||||||
| Maryland |
557,479 | 52,977 | 9.1 | % | 20 | 1,742,573 | 1,709,154 | 98.1 | % | |||||||||||||||||||
| Cambridge, UK |
182,633 | 17,617 | 3.0 | % | 13 | 514,644 | 512,425 | 99.6 | % | |||||||||||||||||||
| North Carolina |
187,188 | 14,568 | 2.5 | % | 5 | 858,328 | 843,477 | 98.3 | % | |||||||||||||||||||
| Pennsylvania |
||||||||||||||||||||||||||||
| Philadelphia |
190,450 | 13,489 | 2.3 | % | 2 | 489,098 | 481,781 | 98.5 | % | |||||||||||||||||||
| Suburban PA |
84,175 | 6,217 | 1.1 | % | 5 | 393,149 | 264,453 | 67.3 | % | |||||||||||||||||||
| Seattle |
||||||||||||||||||||||||||||
| Downtown Seattle |
254,982 | 14,240 | 2.5 | % | 3 | 368,526 | 316,678 | 85.9 | % | |||||||||||||||||||
| Suburban Seattle |
39,005 | 2,197 | 0.4 | % | 2 | 118,799 | 97,966 | 82.5 | % | |||||||||||||||||||
| University Related (2) |
589,473 | 54,343 | 9.4 | % | 15 | 2,301,156 | 2,161,139 | 93.9 | % | |||||||||||||||||||
|
|
|
|
|
|
|
|
|
|
|
|
|
|
|
|||||||||||||||
| Total operating portfolio |
$ | 6,206,086 | $ | 525,309 | 90.4 | % | 179 | 16,445,488 | 15,354,440 | 93.4 | % | |||||||||||||||||
| Active redevelopment (3) |
||||||||||||||||||||||||||||
| San Diego |
$ | 55,907 | $ | — | — | 3 | 182,866 | — | — | |||||||||||||||||||
| Active new construction |
||||||||||||||||||||||||||||
| San Francisco |
$ | 37,036 | $ | 11,830 | 2.0 | % | 2 | 360,000 | 360,000 | 100.0 | % | |||||||||||||||||
| San Diego |
76,740 | — | — | 3 | 316,000 | — | — | |||||||||||||||||||||
| Cambridge, UK |
6,184 | 10,412 | 1.8 | % | 1 | 249,991 | 249,991 | 100.0 | % | |||||||||||||||||||
| North Carolina |
53,365 | 9,613 | 1.7 | % | 3 | 567,712 | 425,250 | 74.9 | % | |||||||||||||||||||
| Seattle |
46,589 | 2,161 | 0.4 | % | 1 | 122,702 | 46,407 | 37.8 | % | |||||||||||||||||||
| University Related (2) |
40,205 | 3,751 | 0.6 | % | 1 | 267,941 | 267,941 | 100.0 | % | |||||||||||||||||||
|
|
|
|
|
|
|
|
|
|
|
|
|
|
|
|||||||||||||||
| Total active new construction |
$ | 260,119 | $ | 37,767 | 6.5 | % | 11 | 1,884,346 | 1,349,589 | 71.6 | % | |||||||||||||||||
|
|
|
|
|
|
|
|
|
|
|
|
|
|
|
|||||||||||||||
| Total consolidated portfolio |
$ | 6,522,112 | $ | 563,076 | 96.9 | % | 193 | 18,512,700 | 16,704,029 | 90.2 | % | |||||||||||||||||
|
|
|
|
|
|
|
|
|
|
|
|
|
|
|
|||||||||||||||
| Unconsolidated partnership portfolio (4) |
||||||||||||||||||||||||||||
| Boston |
$ | 17,454 | $ | 16,083 | 2.8 | % | 2 | 282,217 | 281,987 | 99.9 | % | |||||||||||||||||
| San Diego |
11,713 | 2,037 | 0.4 | % | 1 | 72,863 | 72,863 | 100.0 | % | |||||||||||||||||||
| Maryland |
200 | — | — | — | — | — | — | |||||||||||||||||||||
|
|
|
|
|
|
|
|
|
|
|
|
|
|
|
|||||||||||||||
| Total unconsolidated partnership portfolio |
$ | 29,367 | $ | 18,120 | 3.1 | % | 3 | 355,080 | 354,850 | 99.9 | % | |||||||||||||||||
|
|
|
|
|
|
|
|
|
|
|
|
|
|
|
|||||||||||||||
| Total portfolio |
$ | 6,551,479 | $ | 581,196 | 100.0 | % | 196 | 18,867,780 | 17,058,879 | 90.4 | % | |||||||||||||||||
|
|
|
|
|
|
|
|
|
|
|
|
|
|
|
|||||||||||||||
| Total land bank |
$ | 279,973 | — | — | — | 6,381,500 | — | — | ||||||||||||||||||||
|
|
|
|
|
|||||||||||||||||||||||||
| Total portfolio including land bank |
$ | 6,831,452 | 25,249,280 | |||||||||||||||||||||||||
|
|
|
|
|
|||||||||||||||||||||||||
| (1) | Current annualized base rent is the monthly contractual rent as of the current quarter ended, or if rent has not yet commenced, the first monthly rent payment due at each rent commencement date, multiplied by 12 months. |
| (2) | Includes properties within our University platform that are not located in other markets noted above. See pages 23 – 26 for property listing. |
| (3) | Includes Towne Centre Technology Park, which was acquired in May 2015. Sidney Reseach Park properties remain within the operating portfolio. |
| (4) | See page 26 for detail of the unconsolidated partnership portfolio. |
CONSOLIDATED BALANCE SHEETS
SEPTEMBER 30, 2015
(In thousands)
| 9/30/15 | 6/30/15 | 3/31/15 | 12/31/14 | 9/30/14 | ||||||||||||||||
| Assets | ||||||||||||||||||||
| Investments in real estate: |
||||||||||||||||||||
| Land |
$ | 667,391 | $ | 651,201 | $ | 643,041 | $ | 704,958 | $ | 701,977 | ||||||||||
| Buildings and improvements |
5,252,993 | 4,956,823 | 4,909,684 | 4,877,135 | 5,018,091 | |||||||||||||||
| Land under development |
243,623 | 248,225 | 225,846 | 151,242 | 158,389 | |||||||||||||||
| Construction in progress |
638,078 | 777,766 | 738,603 | 629,679 | 595,273 | |||||||||||||||
|
|
|
|
|
|
|
|
|
|
|
|||||||||||
| Investments in real estate, gross |
6,802,085 | 6,634,015 | 6,517,174 | 6,363,014 | 6,473,730 | |||||||||||||||
| Accumulated depreciation |
(1,080,838 | ) | (1,026,103 | ) | (999,545 | ) | (946,439 | ) | (938,615 | ) | ||||||||||
|
|
|
|
|
|
|
|
|
|
|
|||||||||||
| Investments in real estate, net |
5,721,247 | 5,607,912 | 5,517,629 | 5,416,575 | 5,535,115 | |||||||||||||||
| Investments in unconsolidated partnerships |
29,367 | 34,469 | 34,978 | 35,291 | 36,275 | |||||||||||||||
| Cash and cash equivalents |
48,675 | 45,329 | 64,958 | 46,659 | 33,864 | |||||||||||||||
| Accounts receivable, net |
19,139 | 10,740 | 13,518 | 14,631 | 18,843 | |||||||||||||||
| Accrued straight-line rents, net |
177,423 | 169,592 | 164,049 | 163,716 | 183,904 | |||||||||||||||
| Deferred leasing costs, net |
226,956 | 229,290 | 219,549 | 219,713 | 224,824 | |||||||||||||||
| Other assets |
237,889 | 240,877 | 293,737 | 274,301 | 205,487 | |||||||||||||||
|
|
|
|
|
|
|
|
|
|
|
|||||||||||
| Total assets |
$ | 6,460,696 | $ | 6,338,209 | $ | 6,308,418 | $ | 6,170,886 | $ | 6,238,312 | ||||||||||
|
|
|
|
|
|
|
|
|
|
|
|||||||||||
| Liabilities and Equity | ||||||||||||||||||||
| Liabilities: |
||||||||||||||||||||
| Mortgage notes payable, net |
$ | 492,065 | $ | 488,945 | $ | 503,200 | $ | 496,757 | $ | 478,543 | ||||||||||
| Exchangeable senior notes, net |
— | — | — | 95,678 | 95,678 | |||||||||||||||
| Unsecured senior notes, net |
1,294,978 | 1,294,614 | 1,294,255 | 1,293,903 | 1,293,572 | |||||||||||||||
| Unsecured senior term loans |
745,126 | 750,856 | 741,626 | 749,326 | 755,876 | |||||||||||||||
| Unsecured line of credit |
463,000 | 369,000 | 226,000 | 84,000 | 229,000 | |||||||||||||||
| Accounts payable, accrued expenses, and other liabilities |
419,418 | 353,947 | 386,259 | 381,280 | 375,933 | |||||||||||||||
|
|
|
|
|
|
|
|
|
|
|
|||||||||||
| Total liabilities |
3,414,587 | 3,257,362 | 3,151,340 | 3,100,944 | 3,228,602 | |||||||||||||||
| Equity: |
||||||||||||||||||||
| Stockholders’ equity: |
||||||||||||||||||||
| Common stock |
2,036 | 2,036 | 2,036 | 1,975 | 1,975 | |||||||||||||||
| Additional paid-in capital |
3,754,137 | 3,750,959 | 3,746,823 | 3,649,235 | 3,643,957 | |||||||||||||||
| Accumulated other comprehensive loss, net |
(39,725 | ) | (24,544 | ) | 14,804 | (2,214 | ) | (20,915 | ) | |||||||||||
| Dividends in excess of earnings |
(735,627 | ) | (710,913 | ) | (681,564 | ) | (645,983 | ) | (675,763 | ) | ||||||||||
|
|
|
|
|
|
|
|
|
|
|
|||||||||||
| Total stockholders’ equity |
2,980,821 | 3,017,538 | 3,082,099 | 3,003,013 | 2,949,254 | |||||||||||||||
| Noncontrolling interests |
65,288 | 63,309 | 74,979 | 66,929 | 60,456 | |||||||||||||||
|
|
|
|
|
|
|
|
|
|
|
|||||||||||
| Total equity |
3,046,109 | 3,080,847 | 3,157,078 | 3,069,942 | 3,009,710 | |||||||||||||||
|
|
|
|
|
|
|
|
|
|
|
|||||||||||
| Total liabilities and equity |
$ | 6,460,696 | $ | 6,338,209 | $ | 6,308,418 | $ | 6,170,886 | $ | 6,238,312 | ||||||||||
|
|
|
|
|
|
|
|
|
|
|
|||||||||||
CONSOLIDATED STATEMENTS OF INCOME
SEPTEMBER 30, 2015
(In thousands, except share and per share data)
| Three Months Ended | Year to Date | |||||||||||||||||||||||||||
| 9/30/15 | 6/30/15 | 3/31/15 | 12/31/14 | 9/30/14 | 9/30/15 | 9/30/14 | ||||||||||||||||||||||
| Revenues: |
||||||||||||||||||||||||||||
| Rental |
$ | 123,332 | $ | 116,260 | $ | 117,520 | $ | 121,973 | $ | 122,838 | $ | 357,112 | $ | 363,788 | ||||||||||||||
| Tenant recoveries |
47,539 | 41,573 | 43,956 | 40,753 | 42,626 | 133,068 | 121,641 | |||||||||||||||||||||
| Other revenue |
3,477 | 141 | 16,534 | 2,930 | 3,452 | 20,152 | 23,524 | |||||||||||||||||||||
|
|
|
|
|
|
|
|
|
|
|
|
|
|
|
|||||||||||||||
| Total revenues |
174,348 | 157,974 | 178,010 | 165,656 | 168,916 | 510,332 | 508,953 | |||||||||||||||||||||
|
|
|
|
|
|
|
|
|
|
|
|
|
|
|
|||||||||||||||
| Expenses: |
||||||||||||||||||||||||||||
| Rental operations |
62,069 | 55,270 | 58,647 | 53,444 | 54,899 | 175,986 | 161,058 | |||||||||||||||||||||
| Depreciation and amortization |
64,953 | 61,272 | 67,080 | 64,744 | 64,452 | 193,305 | 189,597 | |||||||||||||||||||||
| General and administrative |
13,166 | 12,531 | 12,789 | 12,162 | 12,768 | 38,486 | 37,153 | |||||||||||||||||||||
| Executive severance |
— | — | 9,891 | 4,380 | — | 9,891 | — | |||||||||||||||||||||
| Acquisition-related expenses |
720 | 1,100 | 464 | 960 | 487 | 2,284 | 2,871 | |||||||||||||||||||||
|
|
|
|
|
|
|
|
|
|
|
|
|
|
|
|||||||||||||||
| Total expenses |
140,908 | 130,173 | 148,871 | 135,690 | 132,606 | 419,952 | 390,679 | |||||||||||||||||||||
|
|
|
|
|
|
|
|
|
|
|
|
|
|
|
|||||||||||||||
| Income from operations |
33,440 | 27,801 | 29,139 | 29,966 | 36,310 | 90,380 | 118,274 | |||||||||||||||||||||
| Equity in net income of unconsolidated partnerships |
242 | 139 | 153 | 160 | 733 | 534 | 585 | |||||||||||||||||||||
| Interest expense, net |
(21,228 | ) | (19,315 | ) | (21,395 | ) | (21,924 | ) | (22,215 | ) | (61,938 | ) | (73,355 | ) | ||||||||||||||
| Impairment of real estate (1) |
— | (35,071 | ) | — | — | — | (35,071 | ) | — | |||||||||||||||||||
| Gain on sale of real estate (2) |
1,869 | — | — | 136,609 | — | 1,869 | — | |||||||||||||||||||||
| Other income/(expense) (3) |
18,770 | 64,021 | 12,884 | (184 | ) | 2,148 | 95,675 | 11,338 | ||||||||||||||||||||
|
|
|
|
|
|
|
|
|
|
|
|
|
|
|
|||||||||||||||
| Net income |
33,093 | 37,575 | 20,781 | 144,627 | 16,976 | 91,449 | 56,842 | |||||||||||||||||||||
| Net income attributable to noncontrolling interests |
(4,890 | ) | (13,997 | ) | (3,436 | ) | (4,278 | ) | (1,016 | ) | (22,323 | ) | (3,413 | ) | ||||||||||||||
|
|
|
|
|
|
|
|
|
|
|
|
|
|
|
|||||||||||||||
| Net income available to common stockholders |
$ | 28,203 | $ | 23,578 | $ | 17,345 | $ | 140,349 | $ | 15,960 | $ | 69,126 | $ | 53,429 | ||||||||||||||
|
|
|
|
|
|
|
|
|
|
|
|
|
|
|
|||||||||||||||
| Net income per share available to common stockholders: |
||||||||||||||||||||||||||||
| Basic earnings per share |
$ | 0.14 | $ | 0.11 | $ | 0.08 | $ | 0.71 | $ | 0.08 | $ | 0.34 | $ | 0.27 | ||||||||||||||
|
|
|
|
|
|
|
|
|
|
|
|
|
|
|
|||||||||||||||
| Diluted earnings per share |
$ | 0.14 | $ | 0.11 | $ | 0.08 | $ | 0.70 | $ | 0.08 | $ | 0.34 | $ | 0.27 | ||||||||||||||
|
|
|
|
|
|
|
|
|
|
|
|
|
|
|
|||||||||||||||
| Weighted-average common shares outstanding: |
||||||||||||||||||||||||||||
| Basic |
202,210,976 | 202,055,325 | 200,789,795 | 196,017,579 | 194,022,619 | 201,746,167 | 191,988,661 | |||||||||||||||||||||
|
|
|
|
|
|
|
|
|
|
|
|
|
|
|
|||||||||||||||
| Diluted |
207,801,584 | 207,458,236 | 206,536,148 | 208,528,196 | 199,574,893 | 207,325,554 | 197,651,357 | |||||||||||||||||||||
|
|
|
|
|
|
|
|
|
|
|
|
|
|
|
|||||||||||||||
| (1) | Includes impairment of King of Prussia property that was sold in May 2015. |
| (2) | Includes gains on sales of 65 West Watkins Mill Road and 9911 Belward Campus Drive properties in September 2015 and December 2014, respectively. |
| (3) | See page 10 for detail. |
BALANCE SHEET / INCOME STATEMENT DETAIL
SEPTEMBER 30, 2015
(In thousands)
| 9/30/15 | 6/30/15 | 3/31/15 | 12/31/14 | 9/30/14 | ||||||||||||||||
| Investment in equity securities, cost basis |
$ | 80,082 | $ | 68,276 | $ | 58,204 | $ | 53,708 | $ | 38,334 | ||||||||||
| Unrealized gain on equity securities |
454 | 17,857 | 71,662 | 48,341 | 22,001 | |||||||||||||||
|
|
|
|
|
|
|
|
|
|
|
|||||||||||
| Investment in equity securities, net |
80,536 | 86,133 | 129,866 | 102,049 | 60,335 | |||||||||||||||
| Restricted cash |
15,181 | 18,202 | 24,019 | 30,057 | 8,297 | |||||||||||||||
| Acquired above-market leases, net |
9,765 | 10,240 | 10,692 | 11,207 | 12,197 | |||||||||||||||
| Acquired below-market ground lease, net |
21,326 | 21,569 | 24,669 | 24,975 | 25,256 | |||||||||||||||
| Deferred loan costs, net |
12,522 | 13,683 | 14,851 | 16,154 | 16,997 | |||||||||||||||
| Lease incentives, net |
30,724 | 23,090 | 23,790 | 24,414 | 23,907 | |||||||||||||||
| Prepaid ground rent |
18,240 | 18,286 | 18,333 | 18,380 | 18,380 | |||||||||||||||
| Other |
49,595 | 49,674 | 47,517 | 47,065 | 40,118 | |||||||||||||||
|
|
|
|
|
|
|
|
|
|
|
|||||||||||
| Other assets |
$ | 237,889 | $ | 240,877 | $ | 293,737 | $ | 274,301 | $ | 205,487 | ||||||||||
|
|
|
|
|
|
|
|
|
|
|
|||||||||||
| Security deposits |
$ | 17,490 | $ | 14,649 | $ | 14,312 | $ | 14,931 | $ | 14,766 | ||||||||||
| Dividends and distributions payable |
54,321 | 54,331 | 54,332 | 52,740 | 50,715 | |||||||||||||||
| Accounts payable, accrued expenses and other liabilities |
309,638 | 247,266 | 278,553 | 276,176 | 271,634 | |||||||||||||||
| Derivative instruments |
2,774 | 2,256 | 2,632 | 1,635 | 1,328 | |||||||||||||||
| Acquired below-market leases, net |
35,195 | 35,445 | 36,430 | 35,798 | 37,490 | |||||||||||||||
|
|
|
|
|
|
|
|
|
|
|
|||||||||||
| Accounts payable, accrued expenses and other liabilities |
$ | 419,418 | $ | 353,947 | $ | 386,259 | $ | 381,280 | $ | 375,933 | ||||||||||
|
|
|
|
|
|
|
|
|
|
|
|||||||||||
| Three Months Ended | ||||||||||||||||||||
| 9/30/15 | 6/30/15 | 3/31/15 | 12/31/14 | 9/30/14 | ||||||||||||||||
| Lease termination revenue |
$ | 3,091 | $ | 28 | $ | 16,150 | $ | 2,801 | $ | 3,300 | ||||||||||
| Other revenue |
386 | 113 | 384 | 129 | 152 | |||||||||||||||
|
|
|
|
|
|
|
|
|
|
|
|||||||||||
| Other revenue |
$ | 3,477 | $ | 141 | $ | 16,534 | $ | 2,930 | $ | 3,452 | ||||||||||
|
|
|
|
|
|
|
|
|
|
|
|||||||||||
| Rental operations expenses |
$ | 47,357 | $ | 40,983 | $ | 44,904 | $ | 38,902 | $ | 39,359 | ||||||||||
| Real estate taxes |
14,712 | 14,287 | 13,743 | 14,542 | 15,540 | |||||||||||||||
|
|
|
|
|
|
|
|
|
|
|
|||||||||||
| Rental operations |
$ | 62,069 | $ | 55,270 | $ | 58,647 | $ | 53,444 | $ | 54,899 | ||||||||||
|
|
|
|
|
|
|
|
|
|
|
|||||||||||
| Gain on extinguishment of debt |
$ | — | $ | 15 | $ | — | $ | — | $ | — | ||||||||||
| Gain/(loss) on derivative instruments |
11 | 189 | (170 | ) | 276 | (190 | ) | |||||||||||||
| Income on investment securities, net |
19,551 | 63,814 | 13,412 | 843 | 2,972 | |||||||||||||||
| Realized (loss)/gain on foreign currency transactions |
(107 | ) | 218 | (211 | ) | (167 | ) | (96 | ) | |||||||||||
| Income tax expense |
(685 | ) | (215 | ) | (147 | ) | (1,136 | ) | (538 | ) | ||||||||||
|
|
|
|
|
|
|
|
|
|
|
|||||||||||
| Other income/(expense) |
$ | 18,770 | $ | 64,021 | $ | 12,884 | $ | (184 | ) | $ | 2,148 | |||||||||
|
|
|
|
|
|
|
|
|
|
|
|||||||||||
FFO, CFFO AND AFFO (1)
SEPTEMBER 30, 2015
(In thousands)
| Three Months Ended | Year to Date | |||||||||||||||||||||||||||
| 9/30/15 | 6/30/15 | 3/31/15 | 12/31/14 | 9/30/14 | 9/30/15 | 9/30/14 | ||||||||||||||||||||||
| Reconciliation of net income available to common stockholders to funds from operations excluding acquisition-related expenses (CFFO): |
||||||||||||||||||||||||||||
| Net income available to common stockholders |
$ | 28,203 | $ | 23,578 | $ | 17,345 | $ | 140,349 | $ | 15,960 | $ | 69,126 | $ | 53,429 | ||||||||||||||
| Adjustments: |
||||||||||||||||||||||||||||
| Gain on sale of real estate (2) |
(1,869 | ) | — | — | (136,609 | ) | — | (1,869 | ) | — | ||||||||||||||||||
| Impairment of real estate (3) |
— | 35,071 | — | — | — | 35,071 | — | |||||||||||||||||||||
| Noncontrolling interests in operating partnership |
734 | 613 | 457 | 3,782 | 429 | 1,804 | 1,464 | |||||||||||||||||||||
| Depreciation & amortization - unconsolidated partnerships |
471 | 1,050 | 1,006 | 821 | 2,312 | 2,527 | 3,088 | |||||||||||||||||||||
| Depreciation & amortization - consolidated entities |
64,953 | 61,272 | 67,080 | 64,744 | 64,452 | 193,305 | 189,597 | |||||||||||||||||||||
| Depreciation & amortization - allocable to noncontrolling interests of consolidated joint ventures |
(593 | ) | (773 | ) | (812 | ) | (847 | ) | (699 | ) | (2,178 | ) | (1,739 | ) | ||||||||||||||
|
|
|
|
|
|
|
|
|
|
|
|
|
|
|
|||||||||||||||
| Funds from operations (FFO) - basic |
$ | 91,899 | $ | 120,811 | $ | 85,076 | $ | 72,240 | $ | 82,454 | $ | 297,786 | $ | 245,839 | ||||||||||||||
| Interest expense - exchangeable senior notes due 2030 (4) |
— | — | 183 | 917 | 1,241 | 183 | 4,616 | |||||||||||||||||||||
|
|
|
|
|
|
|
|
|
|
|
|
|
|
|
|||||||||||||||
| FFO - diluted |
$ | 91,899 | $ | 120,811 | $ | 85,259 | $ | 73,157 | $ | 83,695 | $ | 297,969 | $ | 250,455 | ||||||||||||||
| Acquisition-related expenses |
720 | 1,100 | 464 | 960 | 487 | 2,284 | 2,871 | |||||||||||||||||||||
|
|
|
|
|
|
|
|
|
|
|
|
|
|
|
|||||||||||||||
| CFFO - diluted |
$ | 92,619 | $ | 121,911 | $ | 85,723 | $ | 74,117 | $ | 84,182 | $ | 300,253 | $ | 253,326 | ||||||||||||||
|
|
|
|
|
|
|
|
|
|
|
|
|
|
|
|||||||||||||||
| Reconciliation of CFFO to adjusted funds from operations (AFFO): |
||||||||||||||||||||||||||||
| Adjustments: |
||||||||||||||||||||||||||||
| Recurring capital expenditures and second generation tenant improvements |
(22,996 | ) | (21,600 | ) | (15,782 | ) | (22,591 | ) | (17,007 | ) | (60,378 | ) | (46,291 | ) | ||||||||||||||
| Leasing commissions (5) |
(2,693 | ) | (2,205 | ) | (3,556 | ) | (2,078 | ) | (1,741 | ) | (8,454 | ) | (5,580 | ) | ||||||||||||||
| Gain on extinguishment of debt |
— | (15 | ) | — | — | — | (15 | ) | — | |||||||||||||||||||
| Non-cash debt adjustments |
2,766 | 2,686 | 2,790 | 2,950 | 2,850 | 8,242 | 9,439 | |||||||||||||||||||||
| (Gain)/loss on derivative instruments |
(11 | ) | (189 | ) | 170 | (276 | ) | 190 | (30 | ) | 298 | |||||||||||||||||
| Depreciation included in general and administrative expense |
879 | 838 | 844 | 771 | 848 | 2,561 | 2,346 | |||||||||||||||||||||
| Non-cash equity compensation |
3,442 | 3,347 | 8,007 | 4,625 | 3,658 | 14,796 | 11,137 | |||||||||||||||||||||
| Straight line rents |
(8,266 | ) | (5,889 | ) | (3,781 | ) | (1,941 | ) | (1,174 | ) | (17,936 | ) | (6,315 | ) | ||||||||||||||
| Amortization of lease incentives |
1,049 | 1,004 | 1,016 | 910 | 656 | 3,069 | 1,774 | |||||||||||||||||||||
| Fair-value lease revenue |
(510 | ) | (520 | ) | (471 | ) | (506 | ) | (184 | ) | (1,501 | ) | (911 | ) | ||||||||||||||
| Deferred revenue (6) |
1,066 | 520 | 343 | 395 | 379 | 1,929 | 969 | |||||||||||||||||||||
| Share of unconsolidated partnership adjustments (7) |
(96 | ) | (90 | ) | 46 | 281 | 218 | (140 | ) | 254 | ||||||||||||||||||
| Adjustments for noncontrolling interests |
286 | 420 | 355 | 305 | 246 | 1,061 | 367 | |||||||||||||||||||||
|
|
|
|
|
|
|
|
|
|
|
|
|
|
|
|||||||||||||||
| AFFO - diluted |
$ | 67,535 | $ | 100,218 | $ | 75,704 | $ | 56,962 | $ | 73,121 | $ | 243,457 | $ | 220,813 | ||||||||||||||
|
|
|
|
|
|
|
|
|
|
|
|
|
|
|
|||||||||||||||
| (1) | For definitions and discussion of FFO, CFFO and AFFO, see page 36. |
| (2) | Includes gains on sales of 65 West Watkins Mill Road and 9911 Belward Campus Drive properties in September 2015 and December 2014, respectively. |
| (3) | Includes impairment of King of Prussia property that was sold in May 2015. |
| (4) | The calculations of FFO, CFFO and AFFO per share diluted include the assumed issuance of common stock pursuant to the exchange provision of the exchangeable senior notes due 2030, which is dilutive based on the “if converted” method for all periods presented since the original issuance in January 2010. Under the if converted method, if the add back of interest charges relating to the exchangeable senior notes due 2030 divided by the corresponding number of common shares issuable upon exchange is dilutive, the potentially issuable shares are included in the calculations of FFO, CFFO and AFFO per diluted share. |
| (5) | Leasing commissions associated with obtaining new or renewal leases are recorded at cost and amortized on a straight-line basis over the terms of the respective leases for AFFO purposes. |
| (6) | Consists of rental cash receipts deferred for GAAP purposes. |
| (7) | Share of unconsolidated partnership adjustments includes the Company’s share of amortization of deferred loan costs, lease incentives, straight line rents and fair-value lease revenue. |
FFO, CFFO AND AFFO PER SHARE (1)
SEPTEMBER 30, 2015
(In thousands, except share, per share and ratio amounts)
| Three Months Ended | Year to Date | |||||||||||||||||||||||||||
| 9/30/15 | 6/30/15 | 3/31/15 | 12/31/14 | 9/30/14 | 9/30/15 | 9/30/14 | ||||||||||||||||||||||
| FFO - basic |
$ | 91,899 | $ | 120,811 | $ | 85,076 | $ | 72,240 | $ | 82,454 | $ | 297,786 | $ | 245,839 | ||||||||||||||
| FFO - diluted |
91,899 | 120,811 | 85,259 | 73,157 | 83,695 | 297,969 | 250,455 | |||||||||||||||||||||
| CFFO - diluted |
92,619 | 121,911 | 85,723 | 74,117 | 84,182 | 300,253 | 253,326 | |||||||||||||||||||||
| AFFO - diluted |
67,535 | 100,218 | 75,704 | 56,962 | 73,121 | 243,457 | 220,813 | |||||||||||||||||||||
| FFO per share - basic |
$ | 0.44 | $ | 0.58 | $ | 0.41 | $ | 0.36 | $ | 0.41 | $ | 1.43 | $ | 1.23 | ||||||||||||||
| FFO per share - diluted (2) |
0.44 | 0.58 | 0.41 | 0.35 | 0.40 | 1.42 | 1.20 | |||||||||||||||||||||
| CFFO per share - diluted (2) |
0.44 | 0.58 | 0.41 | 0.36 | 0.40 | 1.44 | 1.21 | |||||||||||||||||||||
| AFFO per share - diluted (2) |
0.32 | 0.48 | 0.36 | 0.27 | 0.35 | 1.16 | 1.06 | |||||||||||||||||||||
| Dividends and distributions declared per common share (4) |
$ | 0.26 | $ | 0.26 | $ | 0.26 | $ | 0.26 | $ | 0.25 | $ | 0.78 | $ | 0.75 | ||||||||||||||
|
|
|
|
|
|
|
|
|
|
|
|
|
|
|
|||||||||||||||
| CFFO payout ratio |
59.1 | % | 44.8 | % | 63.4 | % | 72.2 | % | 62.5 | % | 54.2 | % | 62.0 | % | ||||||||||||||
| AFFO payout ratio |
81.3 | % | 54.2 | % | 72.2 | % | 96.3 | % | 71.4 | % | 67.2 | % | 70.8 | % | ||||||||||||||
| CFFO payout ratio - trailing twelve months |
58.1 | % | 58.9 | % | 65.0 | % | 64.3 | % | 64.1 | % | ||||||||||||||||||
| AFFO payout ratio - trailing twelve months |
72.2 | % | 70.1 | % | 77.9 | % | 75.9 | % | 73.0 | % | ||||||||||||||||||
| Weighted-average common shares and units outstanding diluted (3) |
209,144,827 | 208,969,199 | 208,039,538 | 202,850,109 | 201,059,541 | 208,721,904 | 199,152,916 | |||||||||||||||||||||
|
|
|
|
|
|
|
|
|
|
|
|
|
|
|
|||||||||||||||
| Weighted-average common shares and units outstanding diluted - FFO, CFFO and AFFO |
209,144,827 | 208,969,199 | 209,233,553 | 208,528,196 | 208,649,141 | 209,115,535 | 208,723,924 | |||||||||||||||||||||
|
|
|
|
|
|
|
|
|
|
|
|
|
|
|
|||||||||||||||
| (1) | For definitions and discussion of FFO, CFFO and AFFO, see page 36. |
| (2) | The calculations of FFO, CFFO and AFFO per share diluted include the assumed issuance of common stock pursuant to the exchange provision of the exchangeable senior notes due 2030, which is dilutive based on the “if converted” method for all periods presented since the original issuance in January 2010. Under the if converted method, if the add back of the exchangeable senior notes due 2030 divided by the corresponding number of common shares issuable upon exchange is dilutive, the potentially issuable shares are included in the interest charges relating to calculations of FFO, CFFO and AFFO per diluted share. |
| (3) | The three months ended September 30, 2015, June 30, 2015, March 31, 2015 and September 30, 2014 include 1,343,243, 1,510,963, 1,503,390 and 1,484,648 shares of unvested restricted stock, respectively, which are considered anti-dilutive for purposes of calculating diluted earnings per share. The three months ended December 31, 2014 include 1,427,056 shares of unvested restricted stock which are considered dilutive for purposes of calculating diluted earnings per share. The nine months ended September 30, 2015 and September 30, 2014 include 1,396,350 and 1,501,559 shares of unvested restricted stock, respectively, which are considered anti-dilutive for purposes of calculating diluted earnings per share. |
| (4) | Excludes the special dividend of $0.30 per share paid on December 29, 2014 to stockholders of record as of the close of business on December 22, 2014. |
RECONCILIATION OF EBITDA AND ADJUSTED EBITDA (1)
SEPTEMBER 30, 2015
(In thousands)
| Three Months Ended | ||||||||||||||||||||
| 9/30/15 | 6/30/15 | 3/31/15 | 12/31/14 | 9/30/14 | ||||||||||||||||
| Reconciliation of net income available to common stockholders to earnings before interest, taxes, depreciation and amortization (EBITDA) and Adjusted EBITDA: |
||||||||||||||||||||
| Net income available to common stockholders |
$ | 28,203 | $ | 23,578 | $ | 17,345 | $ | 140,349 | $ | 15,960 | ||||||||||
| Interest expense, net |
21,228 | 19,315 | 21,395 | 21,924 | 22,215 | |||||||||||||||
| Interest expense - unconsolidated partnerships |
236 | 185 | 186 | 184 | 200 | |||||||||||||||
| Income tax expense |
685 | 215 | 147 | 1,136 | 538 | |||||||||||||||
| Depreciation & amortization - consolidated entities |
64,953 | 61,272 | 67,080 | 64,744 | 64,452 | |||||||||||||||
| Depreciation & amortization - unconsolidated partnerships |
471 | 1,050 | 1,006 | 821 | 2,312 | |||||||||||||||
|
|
|
|
|
|
|
|
|
|
|
|||||||||||
| EBITDA |
115,776 | 105,615 | 107,159 | 229,158 | 105,677 | |||||||||||||||
| Noncontrolling interests (2) |
768 | 613 | 458 | 3,783 | 426 | |||||||||||||||
| Gain on sale of real estate (3) |
(1,869 | ) | — | — | (136,609 | ) | — | |||||||||||||
| Impairment of real estate (4) |
— | 35,071 | — | — | — | |||||||||||||||
| Executive severance |
— | — | 9,891 | 4,380 | — | |||||||||||||||
|
|
|
|
|
|
|
|
|
|
|
|||||||||||
| Adjusted EBITDA |
$ | 114,675 | $ | 141,299 | $ | 117,508 | $ | 100,712 | $ | 106,103 | ||||||||||
|
|
|
|
|
|
|
|
|
|
|
|||||||||||
| (1) | For definitions and discussion of EBITDA and Adjusted EBITDA, see page 36. |
| (2) | Includes noncontrolling interests of operating partnership units, consolidated joint ventures with debt and investment in equity securities. |
| (3) | Includes gains on sales of 65 West Watkins Mill Road and 9911 Belward Campus Drive properties in September 2015 and December 2014, respectively. |
| (4) | Includes impairment of King of Prussia property that was sold in May 2015. |
RECONCILIATION OF NET OPERATING INCOME (1)
SEPTEMBER 30, 2015
(In thousands, except ratio amounts)
| Three Months Ended | ||||||||||||||||||||
| 9/30/15 | 6/30/15 | 3/31/15 | 12/31/14 | 9/30/14 | ||||||||||||||||
| Net income |
$ | 33,093 | $ | 37,575 | $ | 20,781 | $ | 144,627 | $ | 16,976 | ||||||||||
| Equity in net income of unconsolidated partnerships |
(242 | ) | (139 | ) | (153 | ) | (160 | ) | (733 | ) | ||||||||||
| Interest expense, net |
21,228 | 19,315 | 21,395 | 21,924 | 22,215 | |||||||||||||||
| Gain on sale of real estate (2) |
(1,869 | ) | — | — | (136,609 | ) | — | |||||||||||||
| Impairment of real estate (3) |
— | 35,071 | — | — | — | |||||||||||||||
| Other (income)/expense |
(18,770 | ) | (64,021 | ) | (12,884 | ) | 184 | (2,148 | ) | |||||||||||
|
|
|
|
|
|
|
|
|
|
|
|||||||||||
| Income from operations |
33,440 | 27,801 | 29,139 | 29,966 | 36,310 | |||||||||||||||
| Depreciation and amortization |
64,953 | 61,272 | 67,080 | 64,744 | 64,452 | |||||||||||||||
| General and administrative |
13,166 | 12,531 | 12,789 | 12,162 | 12,768 | |||||||||||||||
| Executive severance |
— | — | 9,891 | 4,380 | — | |||||||||||||||
| Acquisition-related expenses |
720 | 1,100 | 464 | 960 | 487 | |||||||||||||||
|
|
|
|
|
|
|
|
|
|
|
|||||||||||
| Consolidated net operating income |
$ | 112,279 | $ | 102,704 | $ | 119,363 | $ | 112,212 | $ | 114,017 | ||||||||||
|
|
|
|
|
|
|
|
|
|
|
|||||||||||
| Revenues: |
||||||||||||||||||||
| Rental |
$ | 123,332 | $ | 116,260 | $ | 117,520 | $ | 121,973 | $ | 122,838 | ||||||||||
| Tenant recoveries |
47,539 | 41,573 | 43,956 | 40,753 | 42,626 | |||||||||||||||
| Other revenue (4) |
3,477 | 141 | 16,534 | 2,930 | 3,452 | |||||||||||||||
|
|
|
|
|
|
|
|
|
|
|
|||||||||||
| Total revenues |
174,348 | 157,974 | 178,010 | 165,656 | 168,916 | |||||||||||||||
| Expenses: |
||||||||||||||||||||
| Rental operations |
62,069 | 55,270 | 58,647 | 53,444 | 54,899 | |||||||||||||||
|
|
|
|
|
|
|
|
|
|
|
|||||||||||
| Consolidated net operating income |
$ | 112,279 | $ | 102,704 | $ | 119,363 | $ | 112,212 | $ | 114,017 | ||||||||||
|
|
|
|
|
|
|
|
|
|
|
|||||||||||
| Consolidated net operating income - cash basis (5) |
$ | 105,843 | $ | 98,681 | $ | 116,766 | $ | 111,439 | $ | 113,662 | ||||||||||
|
|
|
|
|
|
|
|
|
|
|
|||||||||||
| Operating expense recovery (6) |
76.6 | % | 75.2 | % | 75.0 | % | 76.3 | % | 77.6 | % | ||||||||||
| (1) | For a definition and discussion of net operating income and net operating income - cash basis, see page 36. |
| (2) | Includes gains on sales of 65 West Watkins Mill Road and 9911 Belward Campus Drive properties in September 2015 and December 2014, respectively. |
| (3) | Includes impairment of King of Prussia property that was sold in May 2015. |
| (4) | Includes lease termination income, see page 10 for detail. |
| (5) | Consolidated net operating income - cash basis is calculated as (consolidated net operating income - straight line rents - fair value lease revenue - lease incentive revenue - bad debt expense + rental cash receipts deferred for GAAP purposes). |
| (6) | Operating expense recovery is calculated as (tenant recovery revenues / rental operations). |
SAME PROPERTY ANALYSIS - THREE MONTHS ENDED
SEPTEMBER 30, 2015
(Dollars in thousands)
| Same Property (1) | Previous Same (2) | Total | Development (3) | New Properties (4) | Other (5) | Total | ||||||||||||||||||||||
| Three Months Ended |
9/30/15 | 9/30/15 | 9/30/15 | 9/30/15 | 9/30/15 | 9/30/15 | 9/30/15 | |||||||||||||||||||||
| Rentable square feet |
14,987,573 | — | 14,987,573 | 3,356,123 | 169,004 | — | 18,512,700 | |||||||||||||||||||||
| Percent of total portfolio |
81.0 | % | — | 81.0 | % | 18.1 | % | 0.9 | % | — | 100.0 | % | ||||||||||||||||
| Percent leased |
92.8 | % | — | 92.8 | % | 78.2 | % | 76.7 | % | — | 90.2 | % | ||||||||||||||||
| Revenues: |
||||||||||||||||||||||||||||
| Rental |
$ | 114,439 | $ | — | $ | 114,439 | $ | 7,428 | $ | 1,491 | $ | (26 | ) | $ | 123,332 | |||||||||||||
| Tenant recoveries |
45,572 | — | 45,572 | 1,187 | 533 | 247 | 47,539 | |||||||||||||||||||||
| Other revenues (6) |
— | — | — | — | — | 3,477 | 3,477 | |||||||||||||||||||||
|
|
|
|
|
|
|
|
|
|
|
|
|
|
|
|||||||||||||||
| Total revenues |
160,011 | — | 160,011 | 8,615 | 2,024 | 3,698 | 174,348 | |||||||||||||||||||||
| Expenses: |
||||||||||||||||||||||||||||
| Rental operations |
55,542 | 278 | 55,820 | 3,537 | 468 | 2,244 | 62,069 | |||||||||||||||||||||
|
|
|
|
|
|
|
|
|
|
|
|
|
|
|
|||||||||||||||
| Net operating income / (loss) (8) |
$ | 104,469 | $ | (278 | ) | $ | 104,191 | $ | 5,078 | $ | 1,556 | $ | 1,454 | $ | 112,279 | |||||||||||||
| Less adjustments to cash basis (7) |
(3,059 | ) | — | (3,059 | ) | (3,197 | ) | (213 | ) | 33 | (6,436 | ) | ||||||||||||||||
|
|
|
|
|
|
|
|
|
|
|
|
|
|
|
|||||||||||||||
| Net operating income - cash basis (8) |
$ | 101,410 | $ | (278 | ) | $ | 101,132 | $ | 1,881 | $ | 1,343 | $ | 1,487 | $ | 105,843 | |||||||||||||
| Rental revenue - cash basis (8) |
$ | 109,691 | $ | — | $ | 109,691 | $ | 4,066 | $ | 1,278 | $ | 8 | $ | 115,043 | ||||||||||||||
|
|
|
|
|
|
|
|
|
|
|
|
|
|
|
|||||||||||||||
| Same Property (1) | Previous Same (2) | Total | Development (3) | New Properties (4) | Other (5) | Total | ||||||||||||||||||||||
| Three Months Ended |
9/30/14 | 9/30/14 | 9/30/14 | 9/30/14 | 9/30/14 | 9/30/14 | 9/30/14 | |||||||||||||||||||||
| Rentable square feet |
14,987,573 | 107,231 | 15,094,804 | 1,409,960 | — | 332,812 | 16,837,576 | |||||||||||||||||||||
| Percent of total portfolio |
89.0 | % | 0.6 | % | 89.6 | % | 8.4 | % | — | 2.0 | % | 100.0 | % | |||||||||||||||
| Percent leased |
90.6 | % | 70.7 | % | 89.5 | % | 83.8 | % | — | 100.0 | % | 90.3 | % | |||||||||||||||
| Revenues: |
||||||||||||||||||||||||||||
| Rental |
$ | 115,068 | $ | 805 | $ | 115,873 | $ | 971 | $ | — | $ | 5,994 | $ | 122,838 | ||||||||||||||
| Tenant recoveries |
41,850 | 216 | 42,066 | 178 | — | 382 | 42,626 | |||||||||||||||||||||
| Other revenues (6) |
— | — | — | — | — | 3,452 | 3,452 | |||||||||||||||||||||
|
|
|
|
|
|
|
|
|
|
|
|
|
|
|
|||||||||||||||
| Total revenues |
156,918 | 1,021 | 157,939 | 1,149 | — | 9,828 | 168,916 | |||||||||||||||||||||
| Expenses: |
||||||||||||||||||||||||||||
| Rental operations |
50,823 | 502 | 51,325 | 994 | — | 2,580 | 54,899 | |||||||||||||||||||||
|
|
|
|
|
|
|
|
|
|
|
|
|
|
|
|||||||||||||||
| Net operating income (8) |
$ | 106,095 | $ | 519 | $ | 106,614 | $ | 155 | $ | — | $ | 7,248 | $ | 114,017 | ||||||||||||||
| Less adjustments to cash basis (7) |
(449 | ) | 623 | 174 | (325 | ) | — | (204 | ) | (355 | ) | |||||||||||||||||
|
|
|
|
|
|
|
|
|
|
|
|
|
|
|
|||||||||||||||
| Net operating income - cash basis (8) |
$ | 105,646 | $ | 1,142 | $ | 106,788 | $ | (170 | ) | $ | — | $ | 7,044 | $ | 113,662 | |||||||||||||
| Rental revenue - cash basis (8) |
$ | 113,447 | $ | 1,428 | $ | 114,875 | $ | 478 | $ | — | $ | 5,790 | $ | 121,143 | ||||||||||||||
|
|
|
|
|
|
|
|
|
|
|
|
|
|
|
|||||||||||||||
| Rental Revenues - GAAP basis |
(0.5 | %) | — | (1.2 | %) | |||||||||||||||||||||||
| Rental Revenues - Cash basis (9) |
(3.3 | %) | — | (4.5 | %) | |||||||||||||||||||||||
| NOI - GAAP basis |
(1.5 | %) | — | (2.3 | %) | |||||||||||||||||||||||
| NOI - Cash basis |
(4.0 | %) | — | (5.3 | %) | |||||||||||||||||||||||
| (1) | The same property portfolio includes properties in the operating portfolio that were not under development or redevelopment for any part of the quarter in both the current year and the prior year. |
| (2) | Properties previously included in same property portfolio in prior year quarters that are now in the Land Bank, comprised of 700 and 750 Gateway properties. |
| (3) | Development includes properties that were entirely or primarily under active new construction during the quarter for the current or prior year. |
| (4) | New properties include properties that were not owned for the full quarter in the prior year. |
| (5) | Other includes legal entities performing corporate level functions and properties that were sold during, or in between the comparative periods, which includes revenue and operating expenses relating to 65 West Watkins Mill Road, which was sold on September 24, 2015, 9911 Belward Campus Drive, which was sold on December 9, 2014, and King of Prussia, which was sold on May 29, 2015. |
| (6) | Includes lease termination revenue of $3.1 million and $3.3 million for the three months ended September 30, 2015 and 2014, respectively. |
| (7) | Adjustments to cash basis exclude adjustments to expenses accrued in rental operations, but include straight line rents, fair-value lease revenue, lease incentive revenue, bad debt expense and rental cash receipts deferred for GAAP purposes. |
| (8) | For definition and discussion of Net Operating Income and Net Operating Income - cash basis, see page 36. |
| (9) | Rental revenues - cash basis calculated by adjusting for straight-line rents, lease incentives, fair value lease revenue and rental cash receipts deferred for GAAP purposes. |
SAME PROPERTY ANALYSIS - YEAR TO DATE
SEPTEMBER 30, 2015
(Dollars in thousands)
| Same Property (1) | Previous Same (2) | Total | Development (3) | New Properties (4) | Other (5) | Total | ||||||||||||||||||||||
| Year to Date |
9/30/15 | 9/30/15 | 9/30/15 | 9/30/15 | 9/30/15 | 9/30/15 | 9/30/15 | |||||||||||||||||||||
| Rentable square feet |
14,363,890 | — | 14,363,890 | 3,460,866 | 687,944 | — | 18,512,700 | |||||||||||||||||||||
| Percent of total portfolio |
77.6 | % | — | 77.6 | % | 18.7 | % | 3.7 | % | — | 100.0 | % | ||||||||||||||||
| Percent leased |
92.6 | % | — | 90.3 | % | 78.9 | % | 98.8 | % | — | 90.2 | % | ||||||||||||||||
| Revenues: |
||||||||||||||||||||||||||||
| Rental |
$ | 328,855 | $ | 122 | $ | 328,977 | $ | 16,189 | $ | 11,994 | $ | (48 | ) | $ | 357,112 | |||||||||||||
| Tenant recoveries |
122,620 | (69 | ) | 122,551 | 2,823 | 6,978 | 716 | 133,068 | ||||||||||||||||||||
| Other revenues (6) |
— | — | — | — | — | 20,152 | 20,152 | |||||||||||||||||||||
|
|
|
|
|
|
|
|
|
|
|
|
|
|
|
|||||||||||||||
| Total revenues |
451,475 | 53 | 451,528 | 19,012 | 18,972 | 20,820 | 510,332 | |||||||||||||||||||||
| Expenses: |
||||||||||||||||||||||||||||
| Rental operations |
154,047 | 218 | 154,265 | 8,010 | 7,678 | 6,033 | 175,986 | |||||||||||||||||||||
|
|
|
|
|
|
|
|
|
|
|
|
|
|
|
|||||||||||||||
| Net operating income / (loss) (8) |
$ | 297,428 | $ | (165 | ) | $ | 297,263 | $ | 11,002 | $ | 11,294 | $ | 14,787 | $ | 334,346 | |||||||||||||
| Less adjustments to cash basis (7) |
(7,389 | ) | — | (7,389 | ) | (5,160 | ) | (948 | ) | 441 | (13,056 | ) | ||||||||||||||||
|
|
|
|
|
|
|
|
|
|
|
|
|
|
|
|||||||||||||||
| Net operating income - cash basis (8) |
$ | 290,039 | $ | (165 | ) | $ | 289,874 | $ | 5,842 | $ | 10,346 | $ | 15,228 | $ | 321,290 | |||||||||||||
| Rental revenue - cash basis (9) |
$ | 316,522 | $ | 122 | $ | 316,644 | $ | 10,533 | $ | 11,046 | $ | 33 | $ | 338,256 | ||||||||||||||
|
|
|
|
|
|
|
|
|
|
|
|
|
|
|
|||||||||||||||
| Same Property (1) | Previous Same (2) | Total | Development (3) | New Properties (4) | Other (5) | Total | ||||||||||||||||||||||
| Year to Date |
9/30/14 | 9/30/14 | 9/30/14 | 9/30/14 | 9/30/14 | 9/30/14 | 9/30/14 | |||||||||||||||||||||
| Rentable square feet |
14,363,890 | 107,231 | 14,471,121 | 1,514,703 | 518,940 | 332,812 | 16,837,576 | |||||||||||||||||||||
| Percent of total portfolio |
85.3 | % | 0.6 | % | 85.9 | % | 9.0 | % | 3.1 | % | 2.0 | % | 100.0 | % | ||||||||||||||
| Percent leased |
89.4 | % | 70.7 | % | 89.4 | % | 84.5 | % | 98.7 | % | 100.0 | % | 90.3 | % | ||||||||||||||
| Revenues: |
||||||||||||||||||||||||||||
| Rental |
$ | 332,922 | $ | 2,416 | $ | 335,338 | $ | 2,844 | $ | 5,400 | $ | 20,206 | $ | 363,788 | ||||||||||||||
| Tenant recoveries |
115,263 | 640 | 115,903 | 202 | 3,842 | 1,694 | 121,641 | |||||||||||||||||||||
| Other revenues (6) |
— | — | — | — | — | 23,524 | 23,524 | |||||||||||||||||||||
|
|
|
|
|
|
|
|
|
|
|
|
|
|
|
|||||||||||||||
| Total revenues |
448,185 | 3,056 | 451,241 | 3,046 | 9,242 | 45,424 | 508,953 | |||||||||||||||||||||
| Expenses: |
||||||||||||||||||||||||||||
| Rental operations |
145,184 | 1,506 | 146,690 | 2,098 | 4,373 | 7,897 | 161,058 | |||||||||||||||||||||
|
|
|
|
|
|
|
|
|
|
|
|
|
|
|
|||||||||||||||
| Net operating income (8) |
$ | 303,001 | $ | 1,550 | $ | 304,551 | $ | 948 | $ | 4,869 | $ | 37,527 | $ | 347,895 | ||||||||||||||
| Less adjustments to cash basis (7) |
(4,707 | ) | 1,865 | (2,842 | ) | (313 | ) | (261 | ) | (685 | ) | (4,101 | ) | |||||||||||||||
|
|
|
|
|
|
|
|
|
|
|
|
|
|
|
|||||||||||||||
| Net operating income - cash basis (8) |
$ | 298,294 | $ | 3,415 | $ | 301,709 | $ | 635 | $ | 4,608 | $ | 36,842 | $ | 343,794 | ||||||||||||||
| Rental revenue - cash basis (9) |
$ | 324,124 | $ | 4,281 | $ | 328,405 | $ | 2,049 | $ | 5,139 | $ | 19,522 | $ | 355,115 | ||||||||||||||
|
|
|
|
|
|
|
|
|
|
|
|
|
|
|
|||||||||||||||
| Rental Revenues - GAAP basis |
(1.2 | %) | — | (1.9 | %) | |||||||||||||||||||||||
| Rental Revenues - Cash basis (9) |
(2.3 | %) | — | (3.6 | %) | |||||||||||||||||||||||
| NOI - GAAP basis |
(1.8 | %) | — | (2.4 | %) | |||||||||||||||||||||||
| NOI - Cash basis |
(2.8 | %) | — | (3.9 | %) | |||||||||||||||||||||||
| (1) | The same property portfolio includes properties in the operating portfolio that were not under development or redevelopment for any part of the quarter in both the current year and the prior year. |
| (2) | Properties previously included in same property portfolio in the nine months ended September 30, 2014 that are now in the Land Bank, comprised of 700 and 750 Gateway properties. |
| (3) | Development includes properties that were entirely or primarily under active new construction during the nine months ended September 30, 2015 or September 30, 2014. |
| (4) | New properties include properties that were not owned for the nine months ended September 30, 2014. |
| (5) | Other includes legal entities performing corporate level functions and properties that were sold during, or in between the comparative periods, which includes revenue and operating expenses relating to 65 West Watkins Mill Road, which was sold on September 24, 2015, 9911 Belward Campus Drive, which was sold on December 9, 2014, and King of Prussia, which was sold on May 29, 2015. |
| (6) | Includes lease termination revenue of $19.3 million and $9.8 million in the nine months ended September 30, 2015 and 2014, respectively. Also includes construction loan revenue of $11.5 million in the nine months ended September 30, 2014, net of deferred loan fees write-offs. |
| (7) | Adjustments to cash basis exclude adjustments to expenses accrued in rental operations, but include straight line rents, fair-value lease revenue, lease incentive revenue, bad debt expense and rental cash receipts deferred for GAAP purposes. |
| (8) | For definition and discussion of Net Operating Income and Net Operating Income - cash basis, see page 36. |
| (9) | Rental revenues - cash basis calculated by adjusting for straight-line rents, lease incentives, fair value lease revenue and rental cash receipts deferred for GAAP purposes. |
INTEREST EXPENSE & COVERAGE RATIOS (1)
SEPTEMBER 30, 2015
(In thousands, except ratio amounts)
| Three Months Ended | ||||||||||||||||||||
| 9/30/15 | 6/30/15 | 3/31/15 | 12/31/14 | 9/30/14 | ||||||||||||||||
| Mortgage notes payable |
$ | 6,181 | $ | 6,293 | $ | 6,220 | $ | 6,253 | $ | 6,156 | ||||||||||
| Exchangeable senior notes |
— | — | 183 | 917 | 1,241 | |||||||||||||||
| Unsecured senior notes |
12,957 | 12,991 | 12,959 | 12,959 | 12,959 | |||||||||||||||
| Unsecured senior term loan |
1,747 | 1,705 | 1,653 | 1,717 | 1,785 | |||||||||||||||
| Unsecured line of credit |
2,479 | 1,997 | 1,577 | 1,786 | 1,793 | |||||||||||||||
| Line of credit fees |
460 | 455 | 450 | 460 | 460 | |||||||||||||||
| Derivative instruments |
828 | 883 | 844 | 860 | 895 | |||||||||||||||
| Preferred returns on tax credits |
495 | 496 | 1,500 | 165 | 196 | |||||||||||||||
|
|
|
|
|
|
|
|
|
|
|
|||||||||||
| Interest expense - cash basis |
$ | 25,147 | $ | 24,820 | $ | 25,386 | $ | 25,117 | $ | 25,485 | ||||||||||
|
|
|
|
|
|
|
|
|
|
|
|||||||||||
| Non-cash interest expense: |
||||||||||||||||||||
| Amortization of fair-value of debt acquired |
(554 | ) | (565 | ) | (569 | ) | (548 | ) | (665 | ) | ||||||||||
| Amortization of debt discounts |
363 | 358 | 351 | 331 | 327 | |||||||||||||||
| Amortization of deferred loan costs |
1,160 | 1,183 | 1,214 | 1,433 | 1,451 | |||||||||||||||
| Amortization of deferred interest costs |
1,647 | 1,656 | 1,662 | 1,670 | 1,677 | |||||||||||||||
| Amortization of put/call |
151 | 54 | 132 | 64 | 60 | |||||||||||||||
|
|
|
|
|
|
|
|
|
|
|
|||||||||||
| Non-cash debt adjustments |
2,767 | 2,686 | 2,790 | 2,950 | 2,850 | |||||||||||||||
| Capitalized interest |
(6,686 | ) | (8,191 | ) | (6,781 | ) | (6,143 | ) | (6,120 | ) | ||||||||||
|
|
|
|
|
|
|
|
|
|
|
|||||||||||
| Interest expense, net |
$ | 21,228 | $ | 19,315 | $ | 21,395 | $ | 21,924 | $ | 22,215 | ||||||||||
|
|
|
|
|
|
|
|
|
|
|
|||||||||||
| Interest coverage ratio |
||||||||||||||||||||
| Adjusted EBITDA |
$ | 114,675 | $ | 141,299 | $ | 117,508 | $ | 100,712 | $ | 106,103 | ||||||||||
| Interest expense: |
||||||||||||||||||||
| Interest expense, net |
21,228 | 19,315 | 21,395 | 21,924 | 22,215 | |||||||||||||||
| Interest expense - unconsolidated partnerships |
236 | 185 | 186 | 184 | 200 | |||||||||||||||
| Amortization of deferred interest costs |
(1,647 | ) | (1,655 | ) | (1,662 | ) | (1,670 | ) | (1,677 | ) | ||||||||||
| Amortization of deferred loan costs |
(1,160 | ) | (1,183 | ) | (1,214 | ) | (1,433 | ) | (1,451 | ) | ||||||||||
| Amortization of debt discounts |
(363 | ) | (358 | ) | (351 | ) | (331 | ) | (327 | ) | ||||||||||
| Amortization of fair-value of debt acquired |
554 | 565 | 569 | 548 | 665 | |||||||||||||||
|
|
|
|
|
|
|
|
|
|
|
|||||||||||
| Total interest expense |
$ | 18,848 | $ | 16,869 | $ | 18,923 | $ | 19,222 | $ | 19,625 | ||||||||||
|
|
|
|
|
|
|
|
|
|
|
|||||||||||
| Interest coverage ratio |
6.1 | 8.4 | 6.2 | 5.2 | 5.4 | |||||||||||||||
|
|
|
|
|
|
|
|
|
|
|
|||||||||||
| Interest coverage ratio - trailing twelve months |
6.4 | 6.2 | 5.5 | 5.0 | 4.7 | |||||||||||||||
|
|
|
|
|
|
|
|
|
|
|
|||||||||||
| Fixed charge coverage ratio |
||||||||||||||||||||
| Adjusted EBITDA |
$ | 114,675 | $ | 141,299 | $ | 117,508 | $ | 100,712 | $ | 106,103 | ||||||||||
| Fixed charges: |
||||||||||||||||||||
| Interest expense, net |
21,228 | 19,315 | 21,395 | 21,924 | 22,215 | |||||||||||||||
| Interest expense - unconsolidated partnerships |
236 | 185 | 186 | 184 | 200 | |||||||||||||||
| Amortization of deferred interest costs |
(1,647 | ) | (1,655 | ) | (1,662 | ) | (1,670 | ) | (1,677 | ) | ||||||||||
| Amortization of deferred loan costs |
(1,160 | ) | (1,183 | ) | (1,214 | ) | (1,433 | ) | (1,451 | ) | ||||||||||
| Amortization of debt discounts |
(363 | ) | (358 | ) | (351 | ) | (331 | ) | (327 | ) | ||||||||||
| Amortization of fair-value of debt acquired |
554 | 565 | 569 | 548 | 665 | |||||||||||||||
| Principal payments |
2,550 | 2,499 | 2,514 | 2,080 | 2,020 | |||||||||||||||
|
|
|
|
|
|
|
|
|
|
|
|||||||||||
| Total fixed charges |
$ | 21,398 | $ | 19,368 | $ | 21,437 | $ | 21,302 | $ | 21,645 | ||||||||||
|
|
|
|
|
|
|
|
|
|
|
|||||||||||
| Fixed charge coverage ratio |
5.4 | 7.3 | 5.5 | 4.7 | 4.9 | |||||||||||||||
|
|
|
|
|
|
|
|
|
|
|
|||||||||||
| Fixed charge coverage ratio - trailing twelve months |
5.7 | 5.6 | 5.0 | 4.6 | 4.2 | |||||||||||||||
|
|
|
|
|
|
|
|
|
|
|
|||||||||||
| (1) | For a discussion of coverage ratios, see page 36. |
CAPITAL STRUCTURE
SEPTEMBER 30, 2015
(In thousands, except per share amounts)
| Consolidated Debt |
9/30/15 | 6/30/15 | 3/31/15 | 12/31/14 | 9/30/14 | |||||||||||||||
| Mortgage notes payable, net |
$ | 492,065 | $ | 488,945 | $ | 503,200 | $ | 496,757 | $ | 478,543 | ||||||||||
| Exchangeable senior notes, net |
— | — | — | 95,678 | 95,678 | |||||||||||||||
| Unsecured senior notes, net |
1,294,978 | 1,294,614 | 1,294,255 | 1,293,903 | 1,293,572 | |||||||||||||||
| Unsecured senior term loans |
745,126 | 750,856 | 741,626 | 749,326 | 755,876 | |||||||||||||||
| Unsecured line of credit |
463,000 | 369,000 | 226,000 | 84,000 | 229,000 | |||||||||||||||
|
|
|
|
|
|
|
|
|
|
|
|||||||||||
| Total Debt |
2,995,169 | 2,903,415 | 2,765,081 | 2,719,664 | 2,852,669 | |||||||||||||||
| Premium on consolidated debt, net |
(6,155 | ) | (6,342 | ) | (6,551 | ) | (6,764 | ) | (6,983 | ) | ||||||||||
|
|
|
|
|
|
|
|
|
|
|
|||||||||||
| Total Consolidated Debt |
$ | 2,989,014 | $ | 2,897,073 | $ | 2,758,530 | $ | 2,712,900 | $ | 2,845,686 | ||||||||||
|
|
|
|
|
|
|
|
|
|
|
|||||||||||
| Equity |
9/30/15 | 6/30/15 | 3/31/15 | 12/31/14 | 9/30/14 | |||||||||||||||
| Closing share price |
$ | 19.98 | $ | 19.34 | $ | 22.66 | $ | 21.54 | $ | 20.20 | ||||||||||
| Total common shares and units outstanding |
208,926 | 208,966 | 208,968 | 202,847 | 202,860 | |||||||||||||||
|
|
|
|
|
|
|
|
|
|
|
|||||||||||
| Total Equity Value |
$ | 4,174,341 | $ | 4,041,402 | $ | 4,735,215 | $ | 4,369,337 | $ | 4,097,785 | ||||||||||
|
|
|
|
|
|
|
|
|
|
|
|||||||||||
| Total consolidated debt |
2,989,014 | 2,897,073 | 2,758,530 | 2,712,900 | 2,845,686 | |||||||||||||||
|
|
|
|
|
|
|
|
|
|
|
|||||||||||
| Total Market Capitalization |
$ | 7,163,355 | $ | 6,938,475 | $ | 7,493,745 | $ | 7,082,237 | $ | 6,943,471 | ||||||||||
|
|
|
|
|
|
|
|
|
|
|
|||||||||||
| Three Months Ended | ||||||||||||||||||||
| Summary of Common Shares |
9/30/15 | 6/30/15 | 3/31/15 | 12/31/14 | 9/30/14 | |||||||||||||||
| Earnings per share |
||||||||||||||||||||
| Weighted-average common shares outstanding |
202,211 | 202,055 | 200,790 | 196,018 | 194,023 | |||||||||||||||
| Weighted-average OP and LTIP units outstanding |
5,398 | 5,399 | 5,405 | 5,405 | 5,405 | |||||||||||||||
| Dilutive effect of performance units |
192 | 4 | 341 | — | 147 | |||||||||||||||
| Dilutive effect of restricted stock |
— | — | — | 1,427 | — | |||||||||||||||
| Dilutive effect of exchangeable senior notes due 2030 (1) |
— | — | — | 5,678 | — | |||||||||||||||
|
|
|
|
|
|
|
|
|
|
|
|||||||||||
| Diluted common shares - EPS |
207,802 | 207,458 | 206,536 | 208,528 | 199,575 | |||||||||||||||
|
|
|
|
|
|
|
|
|
|
|
|||||||||||
| Funds from operations |
||||||||||||||||||||
| Weighted-average common shares outstanding |
202,211 | 202,055 | 200,790 | 196,018 | 194,023 | |||||||||||||||
| Weighted-average OP and LTIP units outstanding |
5,398 | 5,399 | 5,405 | 5,405 | 5,405 | |||||||||||||||
| Dilutive effect of performance units |
192 | 4 | 341 | — | 147 | |||||||||||||||
| Dilutive effect of restricted stock |
1,343 | 1,511 | 1,503 | 1,427 | 1,485 | |||||||||||||||
| Dilutive effect of exchangeable senior notes due 2030 (1) |
— | — | 1,194 | 5,678 | 7,590 | |||||||||||||||
|
|
|
|
|
|
|
|
|
|
|
|||||||||||
| Diluted common shares - FFO |
209,145 | 208,969 | 209,234 | 208,528 | 208,649 | |||||||||||||||
|
|
|
|
|
|
|
|
|
|
|
|||||||||||
| (1) | In January 2015, the entire principal amount of the Operating Partnership’s Exchangeable Senior Notes due 2030 was exchanged for 5,764,026 shares of the Parent Company’s common stock, at the request of the holders. |
DEBT SUMMARY
SEPTEMBER 30, 2015
(Dollars in thousands)
| Unamortized | ||||||||||||||||||||||||
| Stated | Effective | Principal | Premium / | Carrying | Maturity | |||||||||||||||||||
| Rate | Rate | Balance | (Discount) | Value | Date | |||||||||||||||||||
| Consolidated Debt: |
||||||||||||||||||||||||
| Mortgage Notes Payable: |
||||||||||||||||||||||||
| 9900 Belward Campus Drive |
5.64 | % | 3.99 | % | $ | 10,373 | $ | 313 | $ | 10,686 | 07/17 | |||||||||||||
| 9901 Belward Campus Drive |
5.64 | % | 3.99 | % | 12,773 | 383 | 13,156 | 07/17 | ||||||||||||||||
| 100 College Street |
2.40 | % | 2.40 | % | 108,224 | — | 108,224 | 08/16 | ||||||||||||||||
| 300 George Street |
6.20 | % | 4.91 | % | 43,721 | 3,368 | 47,089 | 07/25 | ||||||||||||||||
| Hershey Center for Applied Research |
6.15 | % | 4.71 | % | 12,516 | 1,166 | 13,682 | 05/27 | ||||||||||||||||
| 500 Kendall Street (Kendall D) |
6.38 | % | 5.45 | % | 52,506 | 1,263 | 53,769 | 12/18 | ||||||||||||||||
| Shady Grove Road |
5.97 | % | 5.97 | % | 139,606 | — | 139,606 | 09/16 | ||||||||||||||||
| University of Maryland BioPark I |
5.93 | % | 4.69 | % | 15,483 | 1,181 | 16,664 | 05/25 | ||||||||||||||||
| University of Maryland BioPark II |
5.20 | % | 4.33 | % | 61,088 | 3,123 | 64,211 | 09/21 | ||||||||||||||||
| University of Maryland BioPark Garage |
5.20 | % | 4.33 | % | 4,598 | 235 | 4,833 | 09/21 | ||||||||||||||||
| University of Miami Life Science & Technology Park |
4.00 | % | 2.89 | % | 20,000 | 145 | 20,145 | 02/16 | ||||||||||||||||
|
|
|
|
|
|
|
|
|
|
|
|||||||||||||||
| Total / Weighted-Average on Mortgage Notes Payable |
5.03 | % | 4.49 | % | 480,888 | 11,177 | 492,065 | |||||||||||||||||
| Unsecured Fixed Rate Debt: |
||||||||||||||||||||||||
| Unsecured Senior Notes Due 2016 |
3.85 | % | 3.99 | % | 400,000 | (296 | ) | 399,704 | 04/16 | |||||||||||||||
| Unsecured Senior Notes Due 2019 |
2.63 | % | 2.72 | % | 400,000 | (1,789 | ) | 398,211 | 05/19 | |||||||||||||||
| Unsecured Senior Notes Due 2020 |
6.13 | % | 6.27 | % | 250,000 | (1,360 | ) | 248,640 | 04/20 | |||||||||||||||
| Unsecured Senior Notes Due 2022 |
4.25 | % | 4.36 | % | 250,000 | (1,577 | ) | 248,423 | 07/22 | |||||||||||||||
| Unsecured Variable Rate Debt: |
||||||||||||||||||||||||
| Unsecured Senior Term Loan Due 2017 - U.S. Dollar (1) |
1.60 | % | 2.39 | % | 243,596 | — | 243,596 | 03/17 | ||||||||||||||||
| Unsecured Senior Term Loan Due 2017 - GBP (2) |
1.91 | % | 2.14 | % | 151,530 | — | 151,530 | 03/17 | ||||||||||||||||
| Unsecured Senior Term Loan Due 2018 (3) |
1.40 | % | 1.69 | % | 350,000 | — | 350,000 | 03/18 | ||||||||||||||||
| Unsecured Line of Credit (4) |
1.31 | % | 1.31 | % | 463,000 | — | 463,000 | 03/18 | ||||||||||||||||
|
|
|
|
|
|
|
|
|
|
|
|||||||||||||||
| Total / Weighted-Average on Consolidated Debt |
3.14 | % | 3.21 | % | $ | 2,989,014 | $ | 6,155 | $ | 2,995,169 | ||||||||||||||
|
|
|
|
|
|
|
|
|
|
|
|||||||||||||||
| Share of Unconsolidated Partnership Debt: |
||||||||||||||||||||||||
| BioPark Fremont (50%) (fixed) |
2.75 | % | 2.70 | % | 1,431 | 6 | 1,437 | 05/17 | ||||||||||||||||
| PREI Secured Loan (20%) (variable) |
1.60 | % | 3.08 | % | 32,000 | — | 32,000 | 08/20 | ||||||||||||||||
|
|
|
|
|
|
|
|
|
|
|
|||||||||||||||
| Total / Weighted-Average on Share of Unconsolidated Partnership Debt |
1.65 | % | 3.06 | % | 33,431 | 6 | 33,437 | |||||||||||||||||
|
|
|
|
|
|
|
|
|
|
|
|||||||||||||||
| Total / Weighted-Average on Consolidated and Share of Unconsolidated Partnership Debt |
3.12 | % | 3.21 | % | $ | 3,022,445 | $ | 6,161 | $ | 3,028,606 | ||||||||||||||
|
|
|
|
|
|
|
|
|
|
|
|||||||||||||||
| (1) | The Company entered into interest rate swap agreements that effectively fix the interest rate on $200 million of the unsecured senior term loan facility due 2017 at 2.56% for the remaining term of the loan, subject to adjustments based on the Company’s credit ratings. Including the effect of these swaps, the weighted-average effective interest rate for the $243.6 million outstanding under the unsecured senior term loan facility due 2017 was 2.39% at September 30, 2015. |
| (2) | The Company amended the unsecured senior term loan facility and converted $156.4 million of outstanding borrowings into British pounds sterling equal to £100 million. The principal balance represents the dollar amount based on the exchange rate of 1.5153 to £1.00 at the end of the quarter. The Company entered into interest rate swap agreements that effectively fix the interest rate on £100 million at 2.14% for the remaining term of the loan, subject to adjustments based on the Company’s credit ratings. |
| (3) | The Company entered into interest rate swap agreements effective October 1, 2013 that effectively fix the interest rate on $200 million of the unsecured senior term loan facility due 2018 at 1.90% for three years, subject to adjustments based on the Company’s credit ratings. |
| (4) | Effective rate excludes facility fee of 20 bps on the entire capacity of the unsecured line of credit, which equals approximately $450,000 per quarter. |
DEBT ANALYSIS
SEPTEMBER 30, 2015
(Dollars in thousands)
| Credit Ratings |
Rating | Outlook | ||
| Standard & Poors |
BBB | Stable | ||
| Moody’s Investors Service |
Baa2 | Rating(s) Under Review (1) |
| Principal | Percentage | Wtd. - Avg. | Wtd. - Avg. | |||||||||||||
| Variable and Fixed Rate Debt |
Balance | of Total | Stated Rate | Effective Rate | ||||||||||||
| Fixed Rate Debt |
$ | 1,678,819 | 56.1 | % | 4.39 | % | 4.33 | % | ||||||||
| Variable Rate Debt - Hedged |
||||||||||||||||
| Unsecured Senior Term Loan Due 2017 - U.S. Dollar |
$ | 200,000 | 6.7 | % | 1.60 | % | 2.56 | % | ||||||||
| Unsecured Senior Term Loan Due 2017 - GBP |
151,530 | 5.1 | % | 1.91 | % | 2.14 | % | |||||||||
| Unsecured Senior Term Loan Due 2018 |
200,000 | 6.7 | % | 1.40 | % | 1.90 | % | |||||||||
|
|
|
|
|
|
|
|
|
|||||||||
| Subtotal / Weighted-Average on Variable Rate Debt - Hedged |
$ | 551,530 | 18.4 | % | 1.61 | % | 2.21 | % | ||||||||
|
|
|
|
|
|
|
|
|
|||||||||
| Variable Rate Debt - Unhedged |
||||||||||||||||
| Variable Rate Mortgages |
$ | 108,224 | 3.6 | % | 2.40 | % | 2.40 | % | ||||||||
| Unsecured Senior Term Loan Due 2017 - U.S. Dollar |
43,596 | 1.5 | % | 1.60 | % | 1.60 | % | |||||||||
| Unsecured Senior Term Loan Due 2018 |
150,000 | 5.0 | % | 1.40 | % | 1.40 | % | |||||||||
| Unsecured Line of Credit |
463,000 | 15.5 | % | 1.31 | % | 1.31 | % | |||||||||
|
|
|
|
|
|
|
|
|
|||||||||
| Subtotal / Weighted-Average on Variable Rate Debt - Unhedged |
$ | 764,820 | 25.5 | % | 1.50 | % | 1.50 | % | ||||||||
|
|
|
|
|
|
|
|
|
|||||||||
| Total / Weighted-Average on Consolidated Debt |
$ | 2,995,169 | 100.0 | % | 3.14 | % | 3.21 | % | ||||||||
|
|
|
|
|
|
|
|
|
|||||||||
| Total Consolidated Debt |
9/30/15 | 6/30/15 | 3/31/15 | 12/31/14 | 9/30/14 | |||||||||||||||||
| Secured debt / Total gross assets |
6.5 | % | 6.6 | % | 6.9 | % | 7.0 | % | 6.7 | % | ||||||||||||
| Floating rate debt / Total debt |
44.0 | % | 42.2 | % | 38.4 | % | 33.7 | % | 36.8 | % | ||||||||||||
| Adjusted floating rate debt / Total debt (2) |
25.5 | % | 22.9 | % | 18.5 | % | 13.2 | % | 17.0 | % | ||||||||||||
| Unencumbered real estate / Total real estate |
90.4 | % | 90.1 | % | 90.2 | % | 85.7 | % | 86.1 | % | ||||||||||||
| Unencumbered CABR / Total CABR (3) |
84.3 | % | 83.8 | % | 82.6 | % | 82.9 | % | 83.4 | % | ||||||||||||
| Unsecured line of credit capacity |
$ | 437,000 | $ | 531,000 | $ | 674,000 | $ | 816,000 | $ | 671,000 | ||||||||||||
| Net Debt / Adjusted EBITDA (4) |
6.4 | 5.0 | 5.7 | 6.5 | 6.6 | |||||||||||||||||
| Net Debt / Adjusted EBITDA - trailing twelve months |
6.2 | 6.1 | 6.2 | 6.2 | 6.6 | |||||||||||||||||
| Bond Covenants (5) |
Requirements | |||||||||||||||||||||
| Total outstanding debt / Total assets |
Must be < 60% | 40.5 | % | 40.2 | % | 38.6 | % | 39.1 | % | 40.7 | % | |||||||||||
| Secured debt / Total assets |
Must be < 40% | 6.7 | % | 6.8 | % | 7.0 | % | 7.1 | % | 6.8 | % | |||||||||||
| Consolidated income available for debt service / Annual debt service charge |
Must be > 1.5X | 4.6 | 4.6 | 4.5 | 4.2 | 4.3 | ||||||||||||||||
| Unencumbered assets / Unsecured debt - Notes due 2020 |
Must be > 150% | 249 | % | 254 | % | 264 | % | 260 | % | 246 | % | |||||||||||
| Unencumbered assets / Unsecured debt - Notes due 2016, 2019 and 2022 |
Must be > 150% | 248 | % | 253 | % | 263 | % | 259 | % | 244 | % | |||||||||||
| (1) | Outlook Stable as of September 30, 2015. Placed under review for possible downgrade as of October 12, 2015. |
| (2) | Includes effect of interest rate swaps on the Company’s unsecured senior term loan facilities. See page 20 for more information. |
| (3) | For current annualized base rent (CABR) by market, see page 30. |
| (4) | Adjusted EBITDA is calculated by adding to EBITDA: (a) noncontrolling interests in our operating partnership, (b) impairment of real estate, and (c) executive severance, and by subtracting from EBITDA gains from sales of real estate, on an annualized basis. Net Debt is calculated as debt less (cash and cash equivalents and restricted cash). |
| (5) | For discussion on bond covenants, see page 37. |
DEBT MATURITIES
SEPTEMBER 30, 2015
(In thousands)
Weighted-average debt maturity is 2.9 years for consolidated debt (excluding extension options).
| 2015 | 2016 | 2017 | 2018 | 2019 | 2020 | Thereafter | Total | |||||||||||||||||||||||||
| Consolidated debt: |
||||||||||||||||||||||||||||||||
| Mortgage notes payable: |
||||||||||||||||||||||||||||||||
| Principal amortization |
$ | 2,620 | $ | 13,560 | $ | 9,796 | $ | 9,852 | $ | 5,724 | $ | 6,139 | $ | 29,332 | $ | 77,023 | ||||||||||||||||
| Maturity payments |
— | 263,073 | 22,510 | 37,952 | — | — | 80,330 | $ | 403,865 | |||||||||||||||||||||||
|
|
|
|
|
|
|
|
|
|
|
|
|
|
|
|
|
|||||||||||||||||
| Total mortgage notes payable |
2,620 | 276,633 | 32,306 | 47,804 | 5,724 | 6,139 | 109,662 | 480,888 | ||||||||||||||||||||||||
| Unsecured debt: |
||||||||||||||||||||||||||||||||
| Unsecured senior notes due 2016 |
— | 400,000 | — | — | — | — | — | 400,000 | ||||||||||||||||||||||||
| Unsecured senior notes due 2019 |
— | — | — | — | 400,000 | — | — | 400,000 | ||||||||||||||||||||||||
| Unsecured senior notes due 2020 |
— | — | — | — | — | 250,000 | — | 250,000 | ||||||||||||||||||||||||
| Unsecured senior notes due 2022 |
— | — | — | — | — | — | 250,000 | 250,000 | ||||||||||||||||||||||||
| Unsecured senior term loan due 2017 - U.S. Dollar |
— | — | 243,596 | — | — | — | — | 243,596 | ||||||||||||||||||||||||
| Unsecured senior term loan due 2017 - GBP |
— | — | 151,530 | — | — | — | — | 151,530 | ||||||||||||||||||||||||
| Unsecured senior term loan due 2018 |
— | — | — | 350,000 | — | — | — | 350,000 | ||||||||||||||||||||||||
| Unsecured line of credit |
— | — | — | 463,000 | — | — | — | 463,000 | ||||||||||||||||||||||||
|
|
|
|
|
|
|
|
|
|
|
|
|
|
|
|
|
|||||||||||||||||
| Total unsecured debt |
— | 400,000 | 395,126 | 813,000 | 400,000 | 250,000 | 250,000 | 2,508,126 | ||||||||||||||||||||||||
| Total consolidated debt |
$ | 2,620 | $ | 676,633 | $ | 427,432 | $ | 860,804 | $ | 405,724 | $ | 256,139 | $ | 359,662 | $ | 2,989,014 | ||||||||||||||||
|
|
|
|
|
|
|
|
|
|
|
|
|
|
|
|
|
|||||||||||||||||
| Share of unconsolidated partnership debt: |
||||||||||||||||||||||||||||||||
| BioPark Fremont (50%) (fixed) |
— | — | 1,431 | — | — | — | — | 1,431 | ||||||||||||||||||||||||
| PREI secured loan (20%) (variable) |
— | — | — | — | — | 32,000 | — | 32,000 | ||||||||||||||||||||||||
|
|
|
|
|
|
|
|
|
|
|
|
|
|
|
|
|
|||||||||||||||||
| Share of total unconsolidated partnership debt |
$ | — | $ | — | $ | 1,431 | $ | — | $ | — | $ | 32,000 | $ | — | $ | 33,431 | ||||||||||||||||
|
|
|
|
|
|
|
|
|
|
|
|
|
|
|
|
|
|||||||||||||||||
| Total consolidated and share of unconsolidated partnership debt |
$ | 2,620 | $ | 676,633 | $ | 428,863 | $ | 860,804 | $ | 405,724 | $ | 288,139 | $ | 359,662 | $ | 3,022,445 | ||||||||||||||||
|
|
|
|
|
|
|
|
|
|
|
|
|
|
|
|
|
|||||||||||||||||
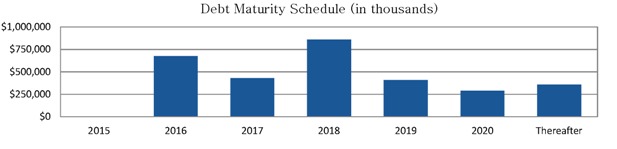
MARKET SUMMARY
SEPTEMBER 30, 2015
| Current (1) | Expiration (2) | GAAP | ||||||||||||||||||||||||||||||||||
| Market |
Leased Square Feet |
Annualized Base Rent |
Percent of Annualized Base Rent |
Annualized Base Rent per Leased Sq Ft |
Annualized Base Rent |
Percent of Annualized Base Rent |
Annualized Base Rent per Leased Sq Ft |
Annualized Base Rent |
Annualized Base Rent per Leased Sq Ft |
|||||||||||||||||||||||||||
| (In thousands) | (In thousands) | (In thousands) | ||||||||||||||||||||||||||||||||||
| Boston |
3,047,322 | $ | 178,228 | 30.7 | % | $ | 58.49 | $ | 192,899 | 28.5 | % | $ | 63.30 | $ | 175,255 | $ | 57.51 | |||||||||||||||||||
| San Francisco |
2,949,252 | 75,847 | 13.1 | % | 25.72 | 93,134 | 13.8 | % | 31.58 | 79,748 | 27.04 | |||||||||||||||||||||||||
| San Diego |
1,918,266 | 65,058 | 11.2 | % | 33.92 | 79,324 | 11.7 | % | 41.35 | 66,642 | 34.74 | |||||||||||||||||||||||||
| New York |
1,767,377 | 60,478 | 10.4 | % | 34.22 | 72,843 | 10.8 | % | 41.22 | 63,025 | 35.66 | |||||||||||||||||||||||||
| Maryland |
1,709,154 | 52,977 | 9.1 | % | 31.00 | 61,537 | 9.1 | % | 36.00 | 53,426 | 31.26 | |||||||||||||||||||||||||
| Cambridge, UK |
762,416 | 28,029 | 4.8 | % | 36.76 | 28,199 | 4.2 | % | 36.99 | 27,731 | 36.37 | |||||||||||||||||||||||||
| North Carolina |
1,268,727 | 24,181 | 4.2 | % | 19.06 | 31,329 | 4.6 | % | 24.69 | 28,465 | 22.44 | |||||||||||||||||||||||||
| Pennsylvania |
746,234 | 19,706 | 3.4 | % | 26.41 | 24,515 | 3.6 | % | 32.85 | 21,349 | 28.61 | |||||||||||||||||||||||||
| Seattle |
461,051 | 18,598 | 3.2 | % | 40.34 | 23,370 | 3.5 | % | 50.69 | 20,066 | 43.52 | |||||||||||||||||||||||||
| University Related (3) |
2,429,080 | 58,094 | 9.9 | % | 23.92 | 68,535 | 10.2 | % | 28.21 | 61,749 | 25.42 | |||||||||||||||||||||||||
|
|
|
|
|
|
|
|
|
|
|
|
|
|
|
|
|
|
|
|||||||||||||||||||
| Total portfolio |
17,058,879 | $ | 581,196 | 100.0 | % | $ | 34.07 | $ | 675,685 | 100.0 | % | $ | 39.61 | $ | 597,456 | $ | 35.02 | |||||||||||||||||||
|
|
|
|
|
|
|
|
|
|
|
|
|
|
|
|
|
|
|
|||||||||||||||||||
| Active New | Active | Unconsolidated | ||||||||||||||||||||||||||||||||||
| Construction | Redevelopment | Partnership | Total Operating Portfolio | |||||||||||||||||||||||||||||||||
| Percent Leased by Market |
(4) | (4) | Portfolio (5) | 9/30/15 | 6/30/15 | 3/31/15 | 12/31/14 | 9/30/14 | ||||||||||||||||||||||||||||
| Boston |
— | — | 99.9 | % | 89.5 | % | 87.1 | % | 86.0 | % | 96.5 | % | 99.2 | % | ||||||||||||||||||||||
| San Francisco |
100.0 | % | — | — | 90.5 | % | 87.6 | % | 86.1 | % | 81.4 | % | 83.7 | % | ||||||||||||||||||||||
| San Diego |
— | — | 100.0 | % | 96.1 | % | 94.6 | % | 94.0 | % | 93.6 | % | 92.7 | % | ||||||||||||||||||||||
| New York |
— | — | — | 98.7 | % | 98.0 | % | 86.8 | % | 86.8 | % | 86.8 | % | |||||||||||||||||||||||
| Maryland |
— | — | — | 98.1 | % | 93.9 | % | 91.7 | % | 92.1 | % | 95.4 | % | |||||||||||||||||||||||
| Cambridge, UK |
100.0 | % | — | — | 99.6 | % | 99.6 | % | 99.5 | % | 99.5 | % | 99.5 | % | ||||||||||||||||||||||
| North Carolina |
74.9 | % | — | — | 98.3 | % | 98.3 | % | 98.3 | % | 97.0 | % | 92.9 | % | ||||||||||||||||||||||
| Pennsylvania |
— | — | — | 84.6 | % | 84.5 | % | 83.0 | % | 75.9 | % | 75.9 | % | |||||||||||||||||||||||
| Seattle |
37.8 | % | — | — | 85.1 | % | 84.6 | % | 84.2 | % | 72.9 | % | 69.7 | % | ||||||||||||||||||||||
| University Related (3) |
100.0 | % | — | — | 93.9 | % | 90.1 | % | 91.9 | % | 91.3 | % | 91.2 | % | ||||||||||||||||||||||
|
|
|
|
|
|
|
|
|
|
|
|
|
|
|
|
|
|||||||||||||||||||||
| Total portfolio |
71.6 | % | — | 99.9 | % | 93.4 | % | 91.0 | % | 89.2 | % | 89.6 | % | 90.6 | % | |||||||||||||||||||||
|
|
|
|
|
|
|
|
|
|
|
|
|
|
|
|
|
|||||||||||||||||||||
| (1) | Current annualized base rent is the monthly contractual rent as of the current quarter ended, or if rent has not yet commenced, the first monthly rent payment due at each rent commencement date, multiplied by 12 months. |
| (2) | Annualized base rent at expiration is the monthly contractual rent as of date of expiration of the applicable lease (not including any extension option(s)), multiplied by 12 months. |
| (3) | Includes properties not located in a core market. See pages 23-26 for property listing. |
| (4) | See pages 23 - 25 for detail of the consolidated portfolio and page 37 for definitions of terms. |
| (5) | See page 26 for detail of the unconsolidated partnership portfolio. |
PROPERTY LISTING
SEPTEMBER 30, 2015
| Excluded from Same Property |
Rentable Square Feet | Leased Square Feet |
Percent Leased (1) | |||||||||||||||||||||||||||||||||||||||||||
| Property |
3 months |
9 months |
Land Bank |
Active New Construction |
Active Redevelopment |
Operating Portfolio |
9/30/15 | 6/30/15 | 3/31/15 | 12/31/14 | 9/30/14 | |||||||||||||||||||||||||||||||||||
| Boston | ||||||||||||||||||||||||||||||||||||||||||||||
| 1 |
Albany Street |
— | — | — | 75,003 | 75,003 | 100.0 | % | 100.0 | % | 100.0 | % | 100.0 | % | 100.0 | % | ||||||||||||||||||||||||||||||
| 2 |
320 Bent Street |
— | — | — | 195,198 | 195,137 | 100.0 | % | 100.0 | % | 100.0 | % | 100.0 | % | 100.0 | % | ||||||||||||||||||||||||||||||
| 3 |
301 Binney Street |
— | — | — | 417,290 | 417,290 | 100.0 | % | 100.0 | % | 100.0 | % | 79.7 | % | 98.8 | % | ||||||||||||||||||||||||||||||
| 4 |
301 Binney Street Garage |
— | — | — | 528 Stalls | n/a | 100.0 | % | 100.0 | % | 100.0 | % | 100.0 | % | 100.0 | % | ||||||||||||||||||||||||||||||
| 5 |
210 Broadway |
— | — | — | 64,812 | 64,812 | 100.0 | % | 100.0 | % | 100.0 | % | 100.0 | % | 100.0 | % | ||||||||||||||||||||||||||||||
| 6 |
Center for Life Science | Boston |
— | — | — | 704,159 | 704,159 | 100.0 | % | 100.0 | % | 100.0 | % | 98.9 | % | 98.9 | % | ||||||||||||||||||||||||||||||
| 7 |
Charles Street |
— | — | — | 47,912 | 47,912 | 100.0 | % | 100.0 | % | 100.0 | % | 100.0 | % | 100.0 | % | ||||||||||||||||||||||||||||||
| 8 |
320 Charles Street |
— | — | — | 99,513 | 99,513 | 100.0 | % | 100.0 | % | 100.0 | % | 100.0 | % | 100.0 | % | ||||||||||||||||||||||||||||||
| 9 |
Coolidge Avenue |
— | — | — | 37,684 | 34,580 | 91.8 | % | 91.8 | % | 91.8 | % | 91.8 | % | 91.8 | % | ||||||||||||||||||||||||||||||
| 10 |
21 Erie Street |
— | — | — | 48,627 | 28,019 | 57.6 | % | 57.6 | % | 57.6 | % | 100.0 | % | 100.0 | % | ||||||||||||||||||||||||||||||
| 11 |
40 Erie Street |
— | — | — | 100,854 | — | — | — | — | 100.0 | % | 100.0 | % | |||||||||||||||||||||||||||||||||
| 12 |
47 Erie Street Parking Structure |
— | — | — | 440 Stalls | n/a | 28.2 | % | 28.2 | % | 28.2 | % | 73.2 | % | 73.2 | % | ||||||||||||||||||||||||||||||
| 13 |
Fresh Pond Research Park |
— | — | — | 90,702 | 84,496 | 93.2 | % | 98.3 | % | 98.3 | % | 98.3 | % | 98.3 | % | ||||||||||||||||||||||||||||||
| 14 |
50 Hampshire Street |
— | — | — | 200,360 | 103,694 | 51.8 | % | 51.8 | % | 51.8 | % | 100.0 | % | 100.0 | % | ||||||||||||||||||||||||||||||
| 15 |
60 Hampshire Street |
ü | ü | — | — | — | 41,257 | 41,257 | 100.0 | % | 100.0 | % | 86.5 | % | 86.5 | % | 86.5 | % | ||||||||||||||||||||||||||||
| 16 |
Kendall Crossing Apartments |
— | — | — | 37 Apts. | n/a | 100.0 | % | 97.3 | % | 97.3 | % | 94.7 | % | 97.6 | % | ||||||||||||||||||||||||||||||
| 17 |
450 Kendall Street (Kendall G) |
ü | ü | — | — | — | 63,520 | 53,944 | 84.9 | % | 49.3 | % | 22.8 | % | 22.8 | % | — | |||||||||||||||||||||||||||||
| 18 |
500 Kendall Street (Kendall D) |
— | — | — | 349,325 | 346,535 | 99.2 | % | 99.2 | % | 99.2 | % | 99.2 | % | 98.5 | % | ||||||||||||||||||||||||||||||
| 19 |
675 W. Kendall Street (Kendall A) |
— | — | — | 302,919 | 302,919 | 100.0 | % | 100.0 | % | 100.0 | % | 100.0 | % | 100.0 | % | ||||||||||||||||||||||||||||||
| 20 |
Sidney Street |
— | — | — | 188,614 | 105,220 | 55.8 | % | 25.3 | % | — | 100.0 | % | 100.0 | % | |||||||||||||||||||||||||||||||
| 21 |
Vassar Street |
— | — | — | 60,845 | 60,845 | 100.0 | % | 100.0 | % | 100.0 | % | 100.0 | % | 100.0 | % | ||||||||||||||||||||||||||||||
|
|
|
|
|
|
|
|
|
|
|
|
|
|
|
|
|
|
|
|
|
|||||||||||||||||||||||||||
| Total Boston |
— | — | — | 3,088,594 | 2,765,335 | 89.5 | % | 87.1 | % | 84.7 | % | 95.0 | % | 97.0 | % | |||||||||||||||||||||||||||||||
|
|
|
|
|
|
|
|
|
|
|
|
|
|
|
|
|
|
|
|
|
|||||||||||||||||||||||||||
| San Francisco |
||||||||||||||||||||||||||||||||||||||||||||||
| 22 |
Ardentech Court |
— | — | — | 55,588 | 55,588 | 100.0 | % | 100.0 | % | 100.0 | % | 100.0 | % | 100.0 | % | ||||||||||||||||||||||||||||||
| 23 |
Ardenwood Venture (2) |
— | — | — | 72,500 | 72,500 | 100.0 | % | 100.0 | % | 100.0 | % | 100.0 | % | 100.0 | % | ||||||||||||||||||||||||||||||
| 24 |
Bayshore Boulevard |
— | — | — | 183,344 | 183,344 | 100.0 | % | 100.0 | % | 100.0 | % | 100.0 | % | 100.0 | % | ||||||||||||||||||||||||||||||
| 25 |
Bridgeview Technology Park I |
— | — | — | 201,567 | 128,676 | 63.8 | % | 63.8 | % | 66.8 | % | 52.9 | % | 52.9 | % | ||||||||||||||||||||||||||||||
| 26 |
Bridgeview Technology Park II |
— | — | — | 50,400 | 50,400 | 100.0 | % | 100.0 | % | 100.0 | % | 100.0 | % | 100.0 | % | ||||||||||||||||||||||||||||||
| 27 |
550 Broadway Street |
— | — | — | 71,239 | 71,239 | 100.0 | % | 100.0 | % | 100.0 | % | 100.0 | % | 100.0 | % | ||||||||||||||||||||||||||||||
| 28 |
Dumbarton Circle |
— | — | — | 44,000 | 44,000 | 100.0 | % | 100.0 | % | 100.0 | % | 100.0 | % | 100.0 | % | ||||||||||||||||||||||||||||||
| 29 |
Eccles Avenue |
ü | ü | 265,000 | — | — | — | — | — | — | — | — | — | |||||||||||||||||||||||||||||||||
| 30 |
Gateway Business Park |
770,000 | — | — | 69,272 | 69,272 | 100.0 | % | 100.0 | % | 62.8 | % | 43.2 | % | 82.2 | % | ||||||||||||||||||||||||||||||
| 31 |
Gateway Business Park II |
ü | ü | 650,000 | — | — | — | — | — | — | — | — | — | |||||||||||||||||||||||||||||||||
| 32 |
Industrial Road |
— | — | — | 175,144 | 175,144 | 100.0 | % | 100.0 | % | 100.0 | % | 100.0 | % | 100.0 | % | ||||||||||||||||||||||||||||||
| 33 |
Kaiser Drive |
— | — | — | 87,953 | 71,215 | 81.0 | % | 81.0 | % | 81.0 | % | 81.0 | % | 81.0 | % | ||||||||||||||||||||||||||||||
| 34 |
Lincoln Centre |
ü | ü | 160,000 | 360,000 | — | — | 360,000 | 100.0 | % | 100.0 | % | 100.0 | % | 100.0 | % | — | |||||||||||||||||||||||||||||
| 35 |
Pacific Industrial Center |
— | — | — | 305,026 | 305,026 | 100.0 | % | 85.9 | % | 86.4 | % | 86.4 | % | 85.9 | % | ||||||||||||||||||||||||||||||
| 36 |
Pacific Research Center North |
— | — | — | 661,245 | 623,870 | 94.3 | % | 88.1 | % | 83.7 | % | 79.2 | % | 79.2 | % | ||||||||||||||||||||||||||||||
| 37 |
Pacific Research Center South |
400,000 | — | — | 423,246 | 296,525 | 70.1 | % | 70.1 | % | 70.1 | % | 62.3 | % | 62.3 | % | ||||||||||||||||||||||||||||||
| 38 |
Science Center at Oyster Point |
— | — | — | 204,887 | 204,887 | 100.0 | % | 100.0 | % | 100.0 | % | 100.0 | % | 100.0 | % | ||||||||||||||||||||||||||||||
| 39 |
Woodside Technology Park |
— | — | — | 255,650 | 237,566 | 92.9 | % | 92.9 | % | 100.0 | % | 100.0 | % | 100.0 | % | ||||||||||||||||||||||||||||||
|
|
|
|
|
|
|
|
|
|
|
|
|
|
|
|
|
|
|
|
|
|||||||||||||||||||||||||||
| Total San Francisco |
2,245,000 | 360,000 | — | 2,861,061 | 2,949,252 | 91.6 | % | 88.9 | % | 87.6 | % | 83.5 | % | 83.7 | % | |||||||||||||||||||||||||||||||
|
|
|
|
|
|
|
|
|
|
|
|
|
|
|
|
|
|
|
|
|
|||||||||||||||||||||||||||
| San Diego |
||||||||||||||||||||||||||||||||||||||||||||||
| 40 |
Balboa Avenue |
— | — | — | 35,344 | 35,344 | 100.0 | % | 100.0 | % | 100.0 | % | 100.0 | % | 100.0 | % | ||||||||||||||||||||||||||||||
| 41 |
Bernardo Center Drive |
— | — | — | 61,286 | 61,286 | 100.0 | % | 100.0 | % | 100.0 | % | 100.0 | % | 100.0 | % | ||||||||||||||||||||||||||||||
| 42 |
Coast 9 |
— | — | — | 162,074 | 156,345 | 96.5 | % | 98.8 | % | 96.7 | % | 84.6 | % | 84.6 | % | ||||||||||||||||||||||||||||||
| 43 |
4570 Executive Drive |
— | — | — | 125,219 | 125,219 | 100.0 | % | 100.0 | % | 100.0 | % | 100.0 | % | 100.0 | % | ||||||||||||||||||||||||||||||
| 44 |
Faraday Avenue |
— | — | — | 28,704 | 28,704 | 100.0 | % | 100.0 | % | 100.0 | % | 100.0 | % | 100.0 | % | ||||||||||||||||||||||||||||||
| 45 |
Gazelle Court |
— | — | — | 176,000 | 176,000 | 100.0 | % | 100.0 | % | 100.0 | % | 100.0 | % | 100.0 | % | ||||||||||||||||||||||||||||||
PROPERTY LISTING
SEPTEMBER 30, 2015
| Excluded from Same Property Analysis |
Rentable Square Feet | Leased Square Feet |
Percent Leased (1) | |||||||||||||||||||||||||||||||||||||||||||
| Property |
3 months |
9 months |
Land Bank |
Active New Construction |
Active Redevelopment |
Operating Portfolio |
9/30/15 | 6/30/15 | 3/31/15 | 12/31/14 | 9/30/14 | |||||||||||||||||||||||||||||||||||
| San Diego (Continued) | ||||||||||||||||||||||||||||||||||||||||||||||
| 46 |
i3 |
ü | ü | — | 316,000 | — | — | — | — | — | — | — | — | |||||||||||||||||||||||||||||||||
| 47 |
3525 John Hopkins Court |
— | — | — | 48,306 | 48,306 | 100.0 | % | 100.0 | % | 100.0 | % | 100.0 | % | 100.0 | % | ||||||||||||||||||||||||||||||
| 48 |
3545-3575 John Hopkins Court |
— | — | — | 72,192 | 72,192 | 100.0 | % | 100.0 | % | 84.7 | % | 84.7 | % | 87.9 | % | ||||||||||||||||||||||||||||||
| 49 |
6114-6154 Nancy Ridge Drive |
— | — | — | 196,557 | 196,557 | 100.0 | % | 100.0 | % | 100.0 | % | 100.0 | % | 100.0 | % | ||||||||||||||||||||||||||||||
| 50 |
6122-6126 Nancy Ridge Drive |
— | — | — | 68,000 | 68,000 | 100.0 | % | 100.0 | % | 100.0 | % | 100.0 | % | 100.0 | % | ||||||||||||||||||||||||||||||
| 51 |
6828 Nancy Ridge Drive |
— | — | — | 42,138 | 42,138 | 100.0 | % | 100.0 | % | 100.0 | % | 100.0 | % | 100.0 | % | ||||||||||||||||||||||||||||||
| 52 |
Pacific Center Boulevard |
— | — | — | 66,745 | 66,745 | 100.0 | % | 100.0 | % | 100.0 | % | 100.0 | % | 100.0 | % | ||||||||||||||||||||||||||||||
| 53 |
Road to the Cure |
— | — | — | 67,998 | 48,248 | 71.0 | % | 71.0 | % | 71.0 | % | 100.0 | % | 100.0 | % | ||||||||||||||||||||||||||||||
| 54 |
San Diego Science Center |
— | — | — | 105,364 | 90,607 | 86.0 | % | 83.8 | % | 89.8 | % | 83.5 | % | 81.6 | % | ||||||||||||||||||||||||||||||
| 55 |
10240 Science Center Drive |
— | — | — | 49,347 | 29,019 | 58.8 | % | 100.0 | % | 100.0 | % | 100.0 | % | 100.0 | % | ||||||||||||||||||||||||||||||
| 56 |
10255 Science Center Drive |
— | — | — | 53,740 | 53,740 | 100.0 | % | 100.0 | % | 100.0 | % | 100.0 | % | 100.0 | % | ||||||||||||||||||||||||||||||
| 57 |
Sorrento Plaza |
— | — | — | 31,184 | 31,184 | 100.0 | % | 100.0 | % | 100.0 | % | 100.0 | % | 100.0 | % | ||||||||||||||||||||||||||||||
| 58 |
Sorrento Valley Boulevard |
— | — | — | 56,053 | 56,053 | 100.0 | % | — | — | — | — | ||||||||||||||||||||||||||||||||||
| 59 |
11388 Sorrento Valley Road |
— | — | — | 35,940 | 35,940 | 100.0 | % | 100.0 | % | 100.0 | % | 100.0 | % | 100.0 | % | ||||||||||||||||||||||||||||||
| 60 |
Summers Ridge |
— | — | — | — | — | 100.0 | % | 100.0 | % | 100.0 | % | 100.0 | % | 100.0 | % | ||||||||||||||||||||||||||||||
| 61 |
Torreyana Road |
— | — | — | 81,204 | 81,204 | 100.0 | % | 100.0 | % | 100.0 | % | 100.0 | % | 100.0 | % | ||||||||||||||||||||||||||||||
| 62 |
9865 Towne Centre Drive |
— | — | — | 94,866 | 90,466 | 95.4 | % | 100.0 | % | 100.0 | % | 100.0 | % | 100.0 | % | ||||||||||||||||||||||||||||||
| 63 |
9885 Towne Centre Drive |
— | — | — | 104,870 | 104,870 | 100.0 | % | 100.0 | % | 100.0 | % | 100.0 | % | 100.0 | % | ||||||||||||||||||||||||||||||
| 64 |
Towne Centre Technology Park |
ü | ü | 104,500 | — | 182,866 | — | — | — | — | — | — | — | |||||||||||||||||||||||||||||||||
| 65 |
Waples Street |
— | — | — | 50,055 | 40,746 | 81.4 | % | 81.4 | % | 81.4 | % | 81.4 | % | 43.9 | % | ||||||||||||||||||||||||||||||
| 66 |
Wateridge Circle |
— | — | — | 106,490 | 106,490 | 100.0 | % | 100.0 | % | 95.6 | % | 95.6 | % | 95.6 | % | ||||||||||||||||||||||||||||||
|
|
|
|
|
|
|
|
|
|
|
|
|
|
|
|
|
|
|
|
|
|||||||||||||||||||||||||||
| Total San Diego |
104,500 | 316,000 | 182,866 | 1,919,676 | 1,845,403 | 76.3 | % | 75.1 | % | 80.7 | % | 93.6 | % | 92.7 | % | |||||||||||||||||||||||||||||||
|
|
|
|
|
|
|
|
|
|
|
|
|
|
|
|
|
|
|
|
|
|||||||||||||||||||||||||||
| New York |
||||||||||||||||||||||||||||||||||||||||||||||
| 67 |
Ardsley Park |
50,000 | — | — | 209,283 | 187,785 | 89.7 | % | 89.7 | % | 89.4 | % | 89.4 | % | 89.4 | % | ||||||||||||||||||||||||||||||
| 68 |
Graphics Drive |
— | — | — | 69,406 | 68,397 | 98.5 | % | 98.5 | % | 64.2 | % | 64.2 | % | 64.2 | % | ||||||||||||||||||||||||||||||
| 69 |
Landmark at Eastview |
273,000 | — | — | 803,094 | 803,094 | 100.0 | % | 99.0 | % | 81.5 | % | 81.5 | % | 81.5 | % | ||||||||||||||||||||||||||||||
| 70 |
Landmark at Eastview II |
— | — | — | 360,520 | 360,520 | 100.0 | % | 100.0 | % | 100.0 | % | 100.0 | % | 100.0 | % | ||||||||||||||||||||||||||||||
| 71 |
Landmark at Eastview III |
ü | ü | — | — | — | 297,000 | 297,000 | 100.0 | % | 100.0 | % | 100.0 | % | 100.0 | % | 100.0 | % | ||||||||||||||||||||||||||||
| 72 |
One Research Way |
— | — | — | 50,581 | 50,581 | 100.0 | % | 100.0 | % | 100.0 | % | 100.0 | % | 100.0 | % | ||||||||||||||||||||||||||||||
|
|
|
|
|
|
|
|
|
|
|
|
|
|
|
|
|
|
|
|
|
|||||||||||||||||||||||||||
| Total New York |
323,000 | — | — | 1,789,884 | 1,767,377 | 98.7 | % | 98.3 | % | 89.0 | % | 89.0 | % | 89.0 | % | |||||||||||||||||||||||||||||||
|
|
|
|
|
|
|
|
|
|
|
|
|
|
|
|
|
|
|
|
|
|||||||||||||||||||||||||||
| Maryland |
||||||||||||||||||||||||||||||||||||||||||||||
| 73 |
Beckley Street |
— | — | — | 77,225 | 77,225 | 100.0 | % | 100.0 | % | 100.0 | % | 100.0 | % | 100.0 | % | ||||||||||||||||||||||||||||||
| 74 |
9900 Belward Campus Drive |
— | — | — | 49,317 | 41,816 | 84.8 | % | 84.8 | % | 84.8 | % | 84.8 | % | 84.8 | % | ||||||||||||||||||||||||||||||
| 75 |
9901 Belward Campus Drive |
— | — | — | 57,152 | 57,110 | 99.9 | % | 99.9 | % | 99.9 | % | 99.9 | % | 99.9 | % | ||||||||||||||||||||||||||||||
| 76 |
9920 Belward Campus Drive |
— | — | — | 51,181 | 51,181 | 100.0 | % | 100.0 | % | 100.0 | % | 100.0 | % | 100.0 | % | ||||||||||||||||||||||||||||||
| 77 |
Firstfield Road |
ü | ü | — | — | — | 52,790 | 52,790 | 100.0 | % | — | — | — | — | ||||||||||||||||||||||||||||||||
| 78 |
9704 Medical Center Drive |
— | — | — | 122,600 | 122,600 | 100.0 | % | 100.0 | % | 100.0 | % | 100.0 | % | 100.0 | % | ||||||||||||||||||||||||||||||
| 79 |
9708-9714 Medical Center Drive |
— | — | — | 92,125 | 80,131 | 87.0 | % | 54.4 | % | 54.4 | % | 54.2 | % | 54.2 | % | ||||||||||||||||||||||||||||||
| 80 |
1701 / 1711 Research Boulevard |
ü | — | — | — | 104,743 | 104,743 | 100.0 | % | 100.0 | % | 100.0 | % | 100.0 | % | 100.0 | % | |||||||||||||||||||||||||||||
| 81 |
Shady Grove Road |
500,000 | — | — | 635,058 | 635,058 | 100.0 | % | 100.0 | % | 100.0 | % | 100.0 | % | 100.0 | % | ||||||||||||||||||||||||||||||
| 82 |
Tributary Street |
— | — | — | 91,592 | 91,592 | 100.0 | % | 100.0 | % | 100.0 | % | 100.0 | % | 100.0 | % | ||||||||||||||||||||||||||||||
| 83 |
University of Maryland BioPark I |
— | — | — | 76,542 | 72,909 | 95.3 | % | 95.3 | % | 98.7 | % | 98.7 | % | 98.5 | % | ||||||||||||||||||||||||||||||
| 84 |
University of Maryland BioPark II |
— | — | — | 235,333 | 225,084 | 95.6 | % | 95.1 | % | 94.1 | % | 97.5 | % | 98.0 | % | ||||||||||||||||||||||||||||||
| 85 |
University of Maryland BioPark III |
ü | ü | 200,000 | — | — | — | — | — | — | — | — | — | |||||||||||||||||||||||||||||||||
| 86 |
University of Maryland BioPark Garage |
— | — | — | 638 Stalls | n/a | 100.0 | % | 66.5 | % | 100.0 | % | 100.0 | % | 100.0 | % | ||||||||||||||||||||||||||||||
| 87 |
50 West Watkins Mill Road |
— | — | — | 57,410 | 57,410 | 100.0 | % | 34.8 | % | 34.8 | % | 34.8 | % | 34.8 | % | ||||||||||||||||||||||||||||||
| 88 |
55 West Watkins Mill Road |
— | — | — | 39,505 | 39,505 | 100.0 | % | 100.0 | % | 100.0 | % | 100.0 | % | 100.0 | % | ||||||||||||||||||||||||||||||
|
|
|
|
|
|
|
|
|
|
|
|
|
|
|
|
|
|
|
|
|
|||||||||||||||||||||||||||
| Total Maryland |
700,000 | — | — | 1,742,573 | 1,709,154 | 98.1 | % | 93.9 | % | 91.7 | % | 92.1 | % | 95.4 | % | |||||||||||||||||||||||||||||||
|
|
|
|
|
|
|
|
|
|
|
|
|
|
|
|
|
|
|
|
|
|||||||||||||||||||||||||||
PROPERTY LISTING
SEPTEMBER 30, 2015
| Excluded from Same Property |
Rentable Square Feet | Leased Square Feet |
Percent Leased (1) | |||||||||||||||||||||||||||||||||||||||||||
| Property |
3 months |
9 months |
Land Bank |
Active New Construction |
Active Redevelopment |
Operating Portfolio |
9/30/15 | 6/30/15 | 3/31/15 | 12/31/14 | 9/30/14 | |||||||||||||||||||||||||||||||||||
| Cambridge, UK | ||||||||||||||||||||||||||||||||||||||||||||||
| 89 |
Granta Park |
138,000 | 94,991 | — | 472,234 | 565,006 | 99.6 | % | 99.5 | % | 99.5 | % | 99.5 | % | 99.5 | % | ||||||||||||||||||||||||||||||
| 90 |
Granta Park II |
ü | ü | — | 155,000 | — | — | 155,000 | 100.0 | % | 100.0 | % | — | — | — | |||||||||||||||||||||||||||||||
| 91 |
430 Cambridge Science Park |
ü | ü | — | — | — | 42,410 | 42,410 | 100.0 | % | 100.0 | % | 100.0 | % | 100.0 | % | 100.0 | % | ||||||||||||||||||||||||||||
|
|
|
|
|
|
|
|
|
|
|
|
|
|
|
|
|
|
|
|
|
|||||||||||||||||||||||||||
| Total Cambridge, UK | 138,000 | 249,991 | — | 514,644 | 762,416 | 99.7 | % | 99.7 | % | 99.6 | % | 99.6 | % | 99.6 | % | |||||||||||||||||||||||||||||||
|
|
|
|
|
|
|
|
|
|
|
|
|
|
|
|
|
|
|
|
|
|||||||||||||||||||||||||||
| North Carolina | ||||||||||||||||||||||||||||||||||||||||||||||
| 92 |
Chesterfield |
ü | ü | 150,000 | 284,462 | — | — | 142,000 | 49.9 | % | 35.2 | % | — | — | — | |||||||||||||||||||||||||||||||
| 93 |
Paramount Parkway |
— | — | — | 61,603 | 61,603 | 100.0 | % | 100.0 | % | 100.0 | % | 100.0 | % | 100.0 | % | ||||||||||||||||||||||||||||||
| 94 |
Patriot Drive |
— | — | — | 48,394 | 48,394 | 100.0 | % | 100.0 | % | 100.0 | % | 100.0 | % | 100.0 | % | ||||||||||||||||||||||||||||||
| 95 |
Piedmont Triad Research - Wake 90 |
ü | — | — | — | 475,742 | 460,891 | 96.9 | % | 96.9 | % | 96.9 | % | 94.6 | % | 87.3 | % | |||||||||||||||||||||||||||||
| 96 |
Wake 60 |
ü | ü | — | 283,250 | — | — | 283,250 | 100.0 | % | 100.0 | % | 59.3 | % | 59.3 | % | — | |||||||||||||||||||||||||||||
| 97 |
Wake Forest Biotech Place |
— | — | — | 242,000 | 242,000 | 100.0 | % | 100.0 | % | 100.0 | % | 100.0 | % | 100.0 | % | ||||||||||||||||||||||||||||||
| 98 |
Weston Parkway |
— | — | — | 30,589 | 30,589 | 100.0 | % | 100.0 | % | 100.0 | % | 100.0 | % | 100.0 | % | ||||||||||||||||||||||||||||||
|
|
|
|
|
|
|
|
|
|
|
|
|
|
|
|
|
|
|
|
|
|||||||||||||||||||||||||||
| Total North Carolina | 150,000 | 567,712 | — | 858,328 | 1,268,727 | 89.0 | % | 86.0 | % | 88.6 | % | 87.6 | % | 92.9 | % | |||||||||||||||||||||||||||||||
|
|
|
|
|
|
|
|
|
|
|
|
|
|
|
|
|
|
|
|
|
|||||||||||||||||||||||||||
| Pennsylvania | ||||||||||||||||||||||||||||||||||||||||||||||
| 99 |
Drexel |
ü | ü | 2,271,000 | — | — | — | — | — | — | — | — | — | |||||||||||||||||||||||||||||||||
| 100 |
George Patterson Boulevard |
— | — | — | 71,500 | 71,500 | 100.0 | % | 100.0 | % | 100.0 | % | 100.0 | % | 100.0 | % | ||||||||||||||||||||||||||||||
| 101 |
Hershey Center for Applied Research |
— | — | — | 80,867 | 78,596 | 97.2 | % | 96.6 | % | 96.6 | % | 95.7 | % | 96.9 | % | ||||||||||||||||||||||||||||||
| 102 |
3711 Market Street (4) |
— | — | — | 154,793 | 147,476 | 95.3 | % | 95.3 | % | 95.3 | % | 96.2 | % | 95.5 | % | ||||||||||||||||||||||||||||||
| 103 |
3737 Market Street (3) (4) |
ü | ü | — | — | — | 334,305 | 334,305 | 100.0 | % | 100.0 | % | 100.0 | % | 82.4 | % | 82.4 | % | ||||||||||||||||||||||||||||
| 104 |
Phoenixville Pike |
— | — | — | 104,400 | 48,181 | 46.2 | % | 46.2 | % | 41.8 | % | 41.8 | % | 41.8 | % | ||||||||||||||||||||||||||||||
| 105 |
Spring Mill Drive |
— | — | — | 76,561 | 66,176 | 86.4 | % | 86.4 | % | 86.4 | % | 80.5 | % | 80.5 | % | ||||||||||||||||||||||||||||||
| 106 |
1000 Uniqema Boulevard |
— | — | — | 59,821 | — | — | — | — | — | — | |||||||||||||||||||||||||||||||||||
|
|
|
|
|
|
|
|
|
|
|
|
|
|
|
|
|
|
|
|
|
|||||||||||||||||||||||||||
| Total Pennsylvania | 2,271,000 | — | — | 882,247 | 746,234 | 84.6 | % | 84.5 | % | 83.0 | % | 75.9 | % | 75.9 | % | |||||||||||||||||||||||||||||||
|
|
|
|
|
|
|
|
|
|
|
|
|
|
|
|
|
|
|
|
|
|||||||||||||||||||||||||||
| Seattle | ||||||||||||||||||||||||||||||||||||||||||||||
| 107 |
Elliott Avenue |
— | — | — | 151,194 | 101,025 | 66.8 | % | 65.3 | % | 64.0 | % | 64.0 | % | 56.0 | % | ||||||||||||||||||||||||||||||
| 108 |
500 Fairview Avenue |
ü | ü | — | 122,702 | — | — | 46,407 | 37.8 | % | 37.8 | % | 37.8 | % | 37.8 | % | 20.5 | % | ||||||||||||||||||||||||||||
| 109 |
530 Fairview Avenue |
— | — | — | 101,118 | 100,501 | 99.4 | % | 99.4 | % | 99.4 | % | 100.0 | % | 100.0 | % | ||||||||||||||||||||||||||||||
| 110 |
Monte Villa Parkway |
— | — | — | 51,000 | 30,167 | 59.2 | % | 59.2 | % | 59.2 | % | 59.2 | % | 59.2 | % | ||||||||||||||||||||||||||||||
| 111 |
Westlake |
ü | ü | — | — | — | 116,214 | 115,152 | 99.1 | % | 99.1 | % | 99.1 | % | — | — | ||||||||||||||||||||||||||||||
| 112 |
217th Place |
50,000 | — | — | 67,799 | 67,799 | 100.0 | % | 100.0 | % | 100.0 | % | 62.9 | % | 100.0 | % | ||||||||||||||||||||||||||||||
|
|
|
|
|
|
|
|
|
|
|
|
|
|
|
|
|
|
|
|
|
|||||||||||||||||||||||||||
| Total Seattle | 50,000 | 122,702 | — | 487,325 | 461,051 | 75.6 | % | 75.2 | % | 74.9 | % | 64.2 | % | 57.5 | % | |||||||||||||||||||||||||||||||
|
|
|
|
|
|
|
|
|
|
|
|
|
|
|
|
|
|
|
|
|
|||||||||||||||||||||||||||
| University Related | ||||||||||||||||||||||||||||||||||||||||||||||
| 113 |
BRDG Park at Danforth Plant Science Center |
— | — | — | 109,731 | 86,522 | 78.8 | % | 65.0 | % | 90.6 | % | 90.6 | % | 90.6 | % | ||||||||||||||||||||||||||||||
| 114 |
100 College Street (5) |
ü | ü | — | — | — | 510,419 | 505,683 | 99.1 | % | 99.1 | % | 99.1 | % | 99.1 | % | 99.1 | % | ||||||||||||||||||||||||||||
| 115 |
4320 Forest Park Avenue |
— | — | — | 152,403 | 152,403 | 100.0 | % | 100.0 | % | 100.0 | % | 100.0 | % | 100.0 | % | ||||||||||||||||||||||||||||||
| 116 |
300 George Street (5) |
ü | — | — | — | 518,940 | 511,971 | 98.7 | % | 98.7 | % | 98.7 | % | 98.7 | % | 98.7 | % | |||||||||||||||||||||||||||||
| 117 |
Heritage @ 4240 |
ü | — | — | — | 202,529 | 176,816 | 87.3 | % | 90.0 | % | 90.0 | % | 89.0 | % | 89.0 | % | |||||||||||||||||||||||||||||
| 118 |
Innovation Research Park at ODU I |
— | — | — | 95,634 | 84,419 | 88.3 | % | 86.5 | % | 90.0 | % | 90.0 | % | 90.0 | % | ||||||||||||||||||||||||||||||
| 119 |
Innovation Research Park at ODU II |
— | — | — | 95,634 | 78,472 | 82.1 | % | 82.1 | % | 82.7 | % | 82.7 | % | 82.7 | % | ||||||||||||||||||||||||||||||
| 120 |
311 South Sarah |
ü | ü | 300,000 | — | — | — | — | — | — | — | — | — | |||||||||||||||||||||||||||||||||
| 121 |
South Street Landing |
ü | ü | — | 267,941 | — | — | 267,941 | 100.0 | % | — | — | — | — | ||||||||||||||||||||||||||||||||
| 122 |
Trade Centre Avenue |
— | — | — | 78,023 | 49,223 | 63.1 | % | 100.0 | % | 100.0 | % | 100.0 | % | 100.0 | % | ||||||||||||||||||||||||||||||
| 123 |
University of Miami Life Science & Technology Park |
— | — | — | 258,681 | 236,468 | 91.4 | % | 68.3 | % | 68.4 | % | 64.7 | % | 64.4 | % | ||||||||||||||||||||||||||||||
| 124 |
University Tech Park at IIT |
— | — | — | 129,178 | 129,178 | 100.0 | % | 100.0 | % | 100.0 | % | 100.0 | % | 100.0 | % | ||||||||||||||||||||||||||||||
| 125 |
Walnut Street |
— | — | — | 149,984 | 149,984 | 100.0 | % | 100.0 | % | 100.0 | % | 100.0 | % | 100.0 | % | ||||||||||||||||||||||||||||||
|
|
|
|
|
|
|
|
|
|
|
|
|
|
|
|
|
|
|
|
|
|||||||||||||||||||||||||||
| Total University Related | 300,000 | 267,941 | — | 2,301,156 | 2,429,080 | 94.5 | % | 92.1 | % | 93.5 | % | 93.0 | % | 93.0 | % | |||||||||||||||||||||||||||||||
|
|
|
|
|
|
|
|
|
|
|
|
|
|
|
|
|
|
|
|
|
|||||||||||||||||||||||||||
| Total Consolidated Portfolio | 6,281,500 | 1,884,346 | 182,866 | 16,445,488 | 16,704,029 | 90.2 | % | 89.0 | % | 87.3 | % | 89.2 | % | 90.2 | % | |||||||||||||||||||||||||||||||
|
|
|
|
|
|
|
|
|
|
|
|
|
|
|
|
|
|
|
|
|
|||||||||||||||||||||||||||
PROPERTY LISTING
SEPTEMBER 30, 2015
| Excluded from Same Property Analysis |
Rentable Square Feet | Leased Square Feet |
Percent Leased (1) | |||||||||||||||||||||||||||||||||||||||||||
| Property |
3 months |
9 months |
Land Bank |
Active New Construction |
Active Redevelopment |
Operating Portfolio |
9/30/15 | 6/30/15 | 3/31/15 | 12/31/14 | 9/30/14 | |||||||||||||||||||||||||||||||||||
| Unconsolidated Partnership Portfolio |
||||||||||||||||||||||||||||||||||||||||||||||
| 126 |
BioPark Fremont |
ü | ü | 100,000 | — | — | — | — | — | — | — | — | — | |||||||||||||||||||||||||||||||||
| 127 |
McKellar Court |
ü | ü | — | — | — | 72,863 | 72,863 | 100.0 | % | 100.0 | % | 100.0 | % | 100.0 | % | 100.0 | % | ||||||||||||||||||||||||||||
| 128 |
350 E. Kendall Street Garage (Kendall F) |
ü | ü | — | — | — | 1,409 Stalls | n/a | 100.0 | % | 100.0 | % | 100.0 | % | 100.0 | % | 100.0 | % | ||||||||||||||||||||||||||||
| 129 |
650 E. Kendall Street (Kendall B) |
ü | ü | — | — | — | 282,217 | 281,987 | 99.9 | % | 99.9 | % | 99.9 | % | 99.9 | % | 99.9 | % | ||||||||||||||||||||||||||||
|
|
|
|
|
|
|
|
|
|
|
|
|
|
|
|
|
|
|
|
|
|||||||||||||||||||||||||||
| Total Unconsolidated Partnership Portfolio |
100,000 | — | — | 355,080 | 354,850 | 99.9 | % | 99.9 | % | 99.9 | % | 99.9 | % | 99.9 | % | |||||||||||||||||||||||||||||||
|
|
|
|
|
|
|
|
|
|
|
|
|
|
|
|
|
|
|
|
|
|||||||||||||||||||||||||||
| Total Portfolio | 6,381,500 | 1,884,346 | 182,866 | 16,800,568 | 17,058,879 | 90.4 | % | 88.3 | % | 87.5 | % | 89.4 | % | 90.4 | % | |||||||||||||||||||||||||||||||
|
|
|
|
|
|
|
|
|
|
|
|
|
|
|
|
|
|
|
|
|
|||||||||||||||||||||||||||
| (1) | Percentage leased excludes estimated square feet in the Land Bank. |
| (2) | The Company owns 87.5% of the limited liability company that owns the Ardenwood Venture property. |
| (3) | The Company owns 68% of the limited liability company that owns the 3737 Market Street property. |
| (4) | The Company has entered into a joint development agreement to explore the potential acquisition of an estimated additional 2.1 million square feet next to the Market Street properties. |
| (5) | The Company owns 93% of the limited liability companies that own the 300 George Street property. Upon debt repayment the Company is expected to own 97.5% of the limited liability company that owns the 100 College Street property. |
DEVELOPMENT AND REDEVELOPMENT
SEPTEMBER 30, 2015
(Dollars in thousands)
| Active Development: Property |
Market | Rentable Square Feet |
Pre-Leased Square Feet |
Percent Pre-Leased |
Investment to Date (1) |
Cost to Complete |
Estimated Total Investment (2) |
Estimated In-Service Date (3) | ||||||||||||||||||||
| Active New Construction: |
|
|||||||||||||||||||||||||||
| South Street Landing (4) |
University Related |
267,941 | 267,941 | 100.0 | % | $ | 37,100 | $ | 147,900 | $ | 185,000 | Q3 2016 - Q3 2017 | ||||||||||||||||
| i3 |
San Diego | 316,000 | — | — | 65,000 | 116,500 | 181,500 | Q3 2017 | ||||||||||||||||||||
| Lincoln Centre (5) |
San Francisco |
360,000 | 360,000 | 100.0 | % | 35,800 | 111,200 | 147,000 | Q3 2017 & Q3 2018 | |||||||||||||||||||
| Chesterfield |
North Carolina |
284,462 | 142,000 | 49.9 | % | 9,100 | 76,900 | 86,000 | Q4 2017 | |||||||||||||||||||
| Granta Park II |
Cambridge, UK |
155,000 | 155,000 | 100.0 | % | 3,000 | 73,000 | 76,000 | Q4 2017 | |||||||||||||||||||
| 500 Fairview Avenue |
Seattle | 122,702 | 46,407 | 37.8 | % | 37,700 | 36,800 | 74,500 | Q1 2016 | |||||||||||||||||||
| Wake 60 |
North Carolina |
283,250 | 283,250 | 100.0 | % | 22,600 | 32,700 | 55,300 | Q3 2016 | |||||||||||||||||||
| Granta Park |
Cambridge, UK |
94,991 | 94,991 | 100.0 | % | 100 | 51,900 | 52,000 | Q1 2017 | |||||||||||||||||||
|
|
|
|
|
|
|
|
|
|
|
|
|
|||||||||||||||||
| Total / weighted-average |
1,884,346 | 1,349,589 | 71.6 | % | $ | 210,400 | $ | 646,900 | $ | 857,300 | ||||||||||||||||||
|
|
|
|
|
|
|
|
|
|
|
|
|
|||||||||||||||||
| Active Redevelopment: Property |
Market | Rentable Square Feet |
Leased Square Feet |
Percent Leased |
Investment to Date (1) |
Cost to Complete |
Estimated Total Investment (2) |
Estimated In-Service Date (3) | ||||||||||||||||||||
| Active Redevelopment: |
||||||||||||||||||||||||||||
| Sidney Street/40 Erie Street |
Boston | 289,468 | 105,220 | 36.3 | % | $ | 119,500 | $ | 86,500 | $ | 206,000 | Q4 2015 - 2017 | ||||||||||||||||
| Towne Centre Technology Park |
San Diego | 182,866 | — | — | 55,400 | 49,600 | 105,000 | Q1 2016 - 2017 | ||||||||||||||||||||
|
|
|
|
|
|
|
|
|
|
|
|
|
|||||||||||||||||
| Total / weighted-average |
472,334 | 105,220 | 22.3 | % | $ | 174,900 | $ | 136,100 | $ | 311,000 | ||||||||||||||||||
|
|
|
|
|
|
|
|
|
|
|
|
|
|||||||||||||||||
| Recently Delivered Development: Property |
Market | Rentable Square Feet |
Leased Square Feet |
Percent Leased |
Percent In-Service |
Capitalized Interest (6) |
In-Service Date | |||||||||||||||||
| Recently Delivered Development: |
||||||||||||||||||||||||
| 430 Cambridge Science Park |
United Kingdom |
42,410 | 42,410 | 100.0 | % | 100.0 | % | $ | — | Q2 2015 | ||||||||||||||
| 100 College Street |
University Related |
510,419 | 505,683 | 99.1 | % | 80.1 | % | 211 | Q3 2015 | |||||||||||||||
| 450 Kendall Street (Kendall G) |
Boston | 63,520 | 53,944 | 84.9 | % | 22.8 | % | 282 | Q2 2015 | |||||||||||||||
| Landmark at Eastview III |
New York | 297,000 | 297,000 | 100.0 | % | 75.0 | % | 1,320 | Q3 2015 | |||||||||||||||
|
|
|
|
|
|
|
|
|
|
|
|||||||||||||||
| Total / weighted-average |
913,349 | 899,037 | 98.4 | % | 75.4 | % | $ | 1,813 | ||||||||||||||||
|
|
|
|
|
|
|
|
|
|
|
|||||||||||||||
| (1) | Includes amounts paid for acquiring the property, landlord improvements, tenant improvement allowances and capitalized payroll, interest, ground rent and operating expenses, but excludes any amounts accrued as of September 30, 2015. |
| (2) | Includes construction costs associated with speculative leasing and forecasted capitalized payroll, interest, ground rent and operating expenses. |
| (3) | Management’s estimate of the time in which construction is substantially completed. A project is considered substantially complete and held available for occupancy upon the completion of tenant improvements, but no later than one year from cessation of major construction activity. Upon completion, management expects the property to enter the |
Same Property Portfolio one year subsequent to the in-service date.
| (4) | Includes a 750 stall garage and 172 unit residential graduate student housing complex currently under development as of September 30, 2015. |
| (5) | Phase I of the project is comprised of 200,000 square feet and is estimated to be substantially completed in Q3 2017. Phase II comprising 160,000 square feet is estimated to be substantially completed in Q3 2018. |
| (6) | Capitalized interest for the three months ended September 30, 2015. |
CAPITAL EXPENDITURES
SEPTEMBER 30, 2015
(Dollars in thousands)
| Capital Expenditures: | Three Months Ended | |||||||||||||||||||||||
| 9/30/15 | 6/30/15 | 3/31/15 | 12/31/14 | 9/30/14 | ||||||||||||||||||||
| Active new construction |
$ | 62,824 | $ | 75,710 | $ | 33,619 | $ | 69,530 | $ | 73,264 | ||||||||||||||
| Tax credit funding receipts, net of deferred costs |
(8,606 | ) | (3,332 | ) | — | (26,232 | ) | — | ||||||||||||||||
| Land bank |
2,608 | 2,115 | 3,618 | 6,139 | 6,998 | |||||||||||||||||||
| Active redevelopment |
8,827 | 679 | — | — | — | |||||||||||||||||||
| Tenant improvements – first generation (1) |
3,082 | 17,972 | 14,534 | 10,386 | 13,304 | |||||||||||||||||||
| Recurring capital expenditures and second generation tenant improvements (1) (2) |
22,996 | 21,600 | 15,782 | 22,591 | 17,007 | |||||||||||||||||||
| Other capital |
4,674 | 13,321 | 3,200 | 5,093 | 10,454 | |||||||||||||||||||
|
|
|
|
|
|
|
|
|
|
|
|||||||||||||||
| Total capital expenditures |
$ | 96,405 | $ | 128,065 | $ | 70,753 | $ | 87,507 | $ | 121,027 | ||||||||||||||
|
|
|
|
|
|
|
|
|
|
|
|||||||||||||||
| Capitalized Interest: | Investment | Three Months Ended | ||||||||||||||||||||||
| to Date (3) | 9/30/15 | 6/30/15 | 3/31/15 | 12/31/14 | 9/30/14 | |||||||||||||||||||
| Active new construction |
$ | 210,400 | $ | 1,580 | $ | 3,489 | $ | 3,395 | $ | 2,634 | $ | 1,983 | ||||||||||||
| Active redevelopment |
55,400 | 796 | 496 | — | — | — | ||||||||||||||||||
| Recently delivered development projects (4) |
119,268 | 1,813 | 288 | 129 | 373 | 738 | ||||||||||||||||||
| Other portfolio improvements (5) |
241,329 | 1,406 | 2,472 | 1,576 | 1,506 | 1,696 | ||||||||||||||||||
| Land bank |
122,591 | 1,091 | 1,446 | 1,681 | 1,630 | 1,703 | ||||||||||||||||||
|
|
|
|
|
|
|
|
|
|
|
|
|
|||||||||||||
| Total |
$ | 748,988 | $ | 6,686 | $ | 8,191 | $ | 6,781 | $ | 6,143 | $ | 6,120 | ||||||||||||
|
|
|
|
|
|
|
|
|
|
|
|
|
|||||||||||||
| Average interest rate capitalized |
3.71 | % | 3.81 | % | 3.95 | % | 3.96 | % | 3.97 | % | ||||||||||||||
| (1) | For definitions of first and second generation leases, see page 37. |
| (2) | Includes revenue enhancing and non-revenue enhancing recurring capital expenditures. For a definition of recurring capital expenditures, see page 37. |
| (3) | Includes amounts paid for acquiring the property, landlord improvements, tenant improvement allowances and capitalized payroll, interest, ground rent and operating expenses, but excludes any amounts accrued as of September 30, 2015. |
| (4) | Includes 100 College Street (Q3 2015), Landmark at Eastview III (Q3 2015), 450 Kendall Street (Kendall G) (Q2 2015), Heritage @4240 (Q4 2013), 3737 Market Street (Q2 2014) and Piedmont Triad Research – Wake 90 (Q4 2013). See page 27 for recently delivered projects during the quarter. |
| (5) | Includes improvements on operating properties, including major tenant improvement projects on properties which are not considered to be in Active New Construction, Active Redevelopment or Land Bank for the respective periods. |
LEASE EXPIRATIONS
SEPTEMBER 30, 2015
The weighted-average remaining lease term is 8.7 years for the total portfolio.
| Current (1) | Expiration (2) | GAAP | ||||||||||||||||||||||||||||||||||||||||||
| Expiration |
Leased Square Feet |
Percent of Leased Square Feet |
Annualized Base Rent |
Percent of Annualized Base Rent |
Annualized Base Rent per Leased Square Feet |
Annualized Base Rent |
Percent of Annualized Base Rent |
Annualized Base Rent per Leased Square Feet |
Annualized Base Rent |
Percent of Annualized Base Rent |
Annualized Base Rent per Leased Square Feet |
|||||||||||||||||||||||||||||||||
| (In thousands) | (In thousands) | (In thousands) | ||||||||||||||||||||||||||||||||||||||||||
| Month-to-month |
32,578 | 0.2 | % | $ | 291 | 0.1 | % | $ | 8.93 | $ | 291 | — | $ | 8.93 | $ | 291 | — | $ | 8.93 | |||||||||||||||||||||||||
| Fourth quarter 2015 |
265,166 | 1.6 | % | 6,153 | 1.1 | % | 23.20 | 6,426 | 1.0 | % | 24.23 | 6,140 | 1.0 | % | 23.16 | |||||||||||||||||||||||||||||
|
|
|
|
|
|
|
|
|
|
|
|
|
|
|
|
|
|
|
|
|
|
|
|||||||||||||||||||||||
| 2015 |
265,166 | 1.6 | % | 6,153 | 1.1 | % | 23.20 | 6,426 | 1.0 | % | 24.23 | 6,140 | 1.0 | % | 23.16 | |||||||||||||||||||||||||||||
| 2016 |
702,182 | 4.1 | % | 23,478 | 4.0 | % | 33.44 | 23,736 | 3.5 | % | 33.80 | 22,646 | 3.8 | % | 32.25 | |||||||||||||||||||||||||||||
| 2017 |
946,360 | 5.5 | % | 28,566 | 4.9 | % | 30.19 | 29,767 | 4.4 | % | 31.45 | 26,569 | 4.4 | % | 28.07 | |||||||||||||||||||||||||||||
| 2018 |
1,874,703 | 11.0 | % | 82,360 | 14.2 | % | 43.93 | 84,882 | 12.6 | % | 45.28 | 75,887 | 12.7 | % | 40.48 | |||||||||||||||||||||||||||||
| 2019 |
1,154,345 | 6.8 | % | 32,968 | 5.7 | % | 28.56 | 35,366 | 5.2 | % | 30.64 | 33,182 | 5.6 | % | 28.75 | |||||||||||||||||||||||||||||
| 2020 |
1,041,108 | 6.1 | % | 33,165 | 5.7 | % | 31.86 | 36,796 | 5.4 | % | 35.34 | 33,075 | 5.5 | % | 31.77 | |||||||||||||||||||||||||||||
| 2021 |
414,051 | 2.4 | % | 14,900 | 2.6 | % | 35.99 | 17,521 | 2.6 | % | 42.32 | 15,425 | 2.6 | % | 37.25 | |||||||||||||||||||||||||||||
| 2022 |
451,323 | 2.6 | % | 13,194 | 2.3 | % | 29.23 | 15,617 | 2.3 | % | 34.60 | 13,786 | 2.3 | % | 30.55 | |||||||||||||||||||||||||||||
| 2023 |
1,877,548 | 11.0 | % | 73,014 | 12.6 | % | 38.89 | 80,419 | 11.9 | % | 42.83 | 73,183 | 12.2 | % | 38.98 | |||||||||||||||||||||||||||||
| 2024 |
672,157 | 3.9 | % | 22,428 | 3.9 | % | 33.37 | 26,719 | 4.0 | % | 39.75 | 23,136 | 3.9 | % | 34.42 | |||||||||||||||||||||||||||||
| Thereafter |
7,627,358 | 44.8 | % | 250,679 | 42.9 | % | 32.87 | 318,145 | 47.1 | % | 41.71 | 274,136 | 46.0 | % | 35.94 | |||||||||||||||||||||||||||||
|
|
|
|
|
|
|
|
|
|
|
|
|
|
|
|
|
|
|
|
|
|
|
|||||||||||||||||||||||
| Total / weighted- |
17,058,879 | 100.0 | % | $ | 581,196 | 100.0 | % | $ | 34.07 | $ | 675,685 | 100.0 | % | $ | 39.61 | $ | 597,456 | 100.0 | % | $ | 35.02 | |||||||||||||||||||||||
|
|
|
|
|
|
|
|
|
|
|
|
|
|
|
|
|
|
|
|
|
|
|
|||||||||||||||||||||||
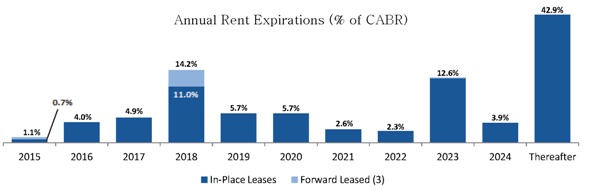
| (1) | Current annualized base rent (CABR) is the monthly contractual rent as of the current quarter ended, or if rent has not yet commenced, the first monthly rent payment due at each rent commencement date, multiplied by 12 months. |
| (2) | Annualized base rent at expiration is the monthly contractual rent as of the date of expiration of the applicable lease (not including any extension option(s)), multiplied by 12 months. |
| (3) | For a definition of “forward leased”, see page 37. |
EXPIRATIONS BY MARKET
SEPTEMBER 30, 2015
| Leased Square Feet | ||||||||||||||||||||||||||||||||||||||||||||
| Expiration |
Boston | San Francisco |
San Diego | New York | Maryland | Cambridge, UK |
North Carolina |
Pennsylvania | Seattle | University Related |
Total | |||||||||||||||||||||||||||||||||
| Month-to-month |
— | — | 728 | 11,311 | 5,156 | 1,038 | — | 1,014 | — | 13,331 | 32,578 | |||||||||||||||||||||||||||||||||
| 2015 |
20,559 | 15,189 | 8,186 | — | 131,166 | 21,576 | — | 8,163 | — | 60,327 | 265,166 | |||||||||||||||||||||||||||||||||
| 2016 |
113,624 | 230,602 | 81,568 | 110,891 | 58,150 | 1,103 | 30,589 | 26,313 | 14,124 | 35,218 | 702,182 | |||||||||||||||||||||||||||||||||
| 2017 |
130,965 | 266,952 | 205,147 | 90,063 | 122,760 | 29,884 | 7,853 | 28,448 | 34,581 | 29,707 | 946,360 | |||||||||||||||||||||||||||||||||
| 2018 |
1,123,540 | 99,067 | 352,249 | 82,124 | 64,508 | — | 15,117 | 11,839 | — | 126,259 | 1,874,703 | |||||||||||||||||||||||||||||||||
| 2019 |
155,305 | 204,179 | 104,228 | — | 275,328 | 185,535 | 8,932 | 92,019 | — | 128,819 | 1,154,345 | |||||||||||||||||||||||||||||||||
| 2020 |
210,705 | 300,260 | 59,182 | 34,371 | 53,185 | 136,434 | 35,753 | 118,727 | 1,744 | 90,747 | 1,041,108 | |||||||||||||||||||||||||||||||||
| 2021 |
122,214 | 50,327 | 70,952 | 45,626 | 24,985 | — | 71,663 | 7,142 | 2,695 | 18,447 | 414,051 | |||||||||||||||||||||||||||||||||
| 2022 |
64,780 | 216,430 | 20,235 | 27,524 | 42,009 | — | — | 30,771 | 1,733 | 47,841 | 451,323 | |||||||||||||||||||||||||||||||||
| 2023 |
614,882 | 636,666 | 330,381 | 68,039 | 33,843 | 26,294 | — | 8,542 | — | 158,901 | 1,877,548 | |||||||||||||||||||||||||||||||||
| 2024 |
75,903 | — | — | 264,557 | 11,120 | 64,617 | 23,932 | — | 34,980 | 197,048 | 672,157 | |||||||||||||||||||||||||||||||||
| Thereafter |
414,845 | 929,580 | 685,410 | 1,032,871 | 886,944 | 295,935 | 1,074,888 | 413,256 | 371,194 | 1,522,435 | 7,627,358 | |||||||||||||||||||||||||||||||||
|
|
|
|
|
|
|
|
|
|
|
|
|
|
|
|
|
|
|
|
|
|
|
|||||||||||||||||||||||
| Total |
3,047,322 | 2,949,252 | 1,918,266 | 1,767,377 | 1,709,154 | 762,416 | 1,268,727 | 746,234 | 461,051 | 2,429,080 | 17,058,879 | |||||||||||||||||||||||||||||||||
|
|
|
|
|
|
|
|
|
|
|
|
|
|
|
|
|
|
|
|
|
|
|
|||||||||||||||||||||||
| Current Annualized Base Rent at Expiration (1) | ||||||||||||||||||||||||||||||||||||||||||||
| Expiration |
Boston | San Francisco |
San Diego | New York | Maryland | Cambridge, UK |
North Carolina |
Pennsylvania | Seattle | University Related |
Total | |||||||||||||||||||||||||||||||||
| (in thousands) | ||||||||||||||||||||||||||||||||||||||||||||
| Month-to-month |
$ | — | $ | — | $ | — | $ | 13 | $ | 79 | $ | — | $ | — | $ | 24 | $ | — | $ | 175 | $ | 291 | ||||||||||||||||||||||
| 2015 |
373 | 210 | 132 | — | 2,203 | 881 | — | 181 | 3 | 2,442 | 6,426 | |||||||||||||||||||||||||||||||||
| 2016 |
6,333 | 8,061 | 1,693 | 3,191 | 1,543 | 52 | 663 | 845 | 630 | 725 | 23,736 | |||||||||||||||||||||||||||||||||
| 2017 |
5,685 | 6,173 | 7,211 | 2,687 | 3,680 | 1,114 | 133 | 851 | 1,405 | 829 | 29,767 | |||||||||||||||||||||||||||||||||
| 2018 |
62,136 | 2,898 | 10,237 | 2,402 | 3,176 | — | 343 | 502 | — | 3,188 | 84,882 | |||||||||||||||||||||||||||||||||
| 2019 |
7,886 | 3,790 | 3,367 | — | 7,448 | 7,167 | 217 | 2,096 | — | 3,395 | 35,366 | |||||||||||||||||||||||||||||||||
| 2020 |
13,342 | 8,766 | 2,142 | 1,224 | 1,215 | 3,950 | 650 | 3,299 | 80 | 2,128 | 36,796 | |||||||||||||||||||||||||||||||||
| 2021 |
9,416 | 984 | 2,705 | 877 | 797 | — | 1,829 | 190 | 84 | 638 | 17,521 | |||||||||||||||||||||||||||||||||
| 2022 |
4,491 | 6,922 | 1,007 | — | 975 | — | — | 998 | 72 | 1,151 | 15,617 | |||||||||||||||||||||||||||||||||
| 2023 |
47,751 | 10,934 | 14,572 | 2,397 | 722 | 937 | — | 279 | — | 2,828 | 80,419 | |||||||||||||||||||||||||||||||||
| 2024 |
4,739 | — | — | 8,867 | 503 | 2,088 | 314 | — | 942 | 9,264 | 26,719 | |||||||||||||||||||||||||||||||||
| Thereafter |
30,747 | 44,395 | 36,259 | 51,185 | 39,195 | 12,010 | 27,179 | 15,251 | 20,153 | 41,772 | 318,145 | |||||||||||||||||||||||||||||||||
|
|
|
|
|
|
|
|
|
|
|
|
|
|
|
|
|
|
|
|
|
|
|
|||||||||||||||||||||||
| Total |
$ | 192,899 | $ | 93,134 | $ | 79,324 | $ | 72,843 | $ | 61,537 | $ | 28,199 | $ | 31,329 | $ | 24,515 | $ | 23,370 | $ | 68,535 | $ | 675,686 | ||||||||||||||||||||||
|
|
|
|
|
|
|
|
|
|
|
|
|
|
|
|
|
|
|
|
|
|
|
|||||||||||||||||||||||
| (1) | Annualized base rent at expiration is the monthly contractual rent as of date of expiration of the applicable lease (not including any extension option(s)), multiplied by 12 months. |
FUTURE LEASE COMMENCEMENTS
SEPTEMBER 30, 2015
(Dollars in thousands)
| Annualized Base Rent (1) | ||||||||||||||||||||||||
| Operating | Development | Total | ||||||||||||||||||||||
| Expected Commencement Quarter (1) |
GAAP (2) | Cash (3) | GAAP (2) | Cash (3) | GAAP (2) | Cash (3) | ||||||||||||||||||
| 4Q15 |
$ | 16,724 | $ | 18,588 | $ | — | $ | — | $ | 16,724 | $ | 18,588 | ||||||||||||
| 2016 |
23,561 | 31,078 | 9,951 | 9,067 | 33,513 | 40,145 | ||||||||||||||||||
| 2017 |
1,912 | 5,230 | 22,257 | 9,214 | 24,169 | 14,444 | ||||||||||||||||||
| 2018 |
— | — | 8,134 | 12,262 | 8,134 | 12,262 | ||||||||||||||||||
| 2019 |
24,509 | 19,767 | — | 7,195 | 24,509 | 26,962 | ||||||||||||||||||
|
|
|
|
|
|
|
|
|
|
|
|
|
|||||||||||||
| $ | 66,707 | $ | 74,663 | $ | 40,342 | $ | 37,738 | $ | 107,049 | $ | 112,400 | |||||||||||||
|
|
|
|
|
|
|
|
|
|
|
|
|
|||||||||||||
| Leased Square Feet | ||||||||||||||||||||||||
| Operating | Development | Total | ||||||||||||||||||||||
| Expected Commencement Quarter (1) |
GAAP (4) | Cash (4) | GAAP (4) | Cash (4) | GAAP (4) | Cash (4) | ||||||||||||||||||
| 4Q15 |
496,996 | 519,488 | — | — | 496,996 | 519,488 | ||||||||||||||||||
| 2016 |
739,226 | 949,583 | 462,106 | 462,106 | 1,201,332 | 1,411,689 | ||||||||||||||||||
| 2017 |
99,342 | 265,611 | 657,483 | 365,492 | 756,825 | 631,103 | ||||||||||||||||||
| 2018 |
— | — | 230,000 | 319,991 | 230,000 | 319,991 | ||||||||||||||||||
| 2019 |
295,030 | 295,030 | — | 202,000 | 295,030 | 497,030 | ||||||||||||||||||
|
|
|
|
|
|
|
|
|
|
|
|
|
|||||||||||||
| 1,630,594 | 2,029,712 | 1,349,589 | 1,349,589 | 2,980,183 | 3,379,301 | |||||||||||||||||||
|
|
|
|
|
|
|
|
|
|
|
|
|
|||||||||||||
| (1) | Current estimates of future lease commencement timing. Actual results may vary from current estimates. Excludes unconsolidated joint ventures. |
| (2) | The annualized GAAP monthly rent (GABR). |
| (3) | The annualized first monthly cash rent payment due (CABR). |
| (4) | The leased square feet for GAAP and Cash correspond with the applicable annualized base rent commencement dates above. |
20 LARGEST TENANTS
SEPTEMBER 30, 2015
BioMed’s properties were leased to 395 tenants.
| Tenant |
Leased Square Feet |
Percent of Leased Sq Ft |
Annualized Base Rent Current (1) (In thousands) |
Annualized Base Rent per Leased Sq Ft Current |
Percent of Annualized Base Rent Current Total Portfolio |
Lease Expiration (2) |
||||||||||||||||||||
| 1 |
Regeneron Pharmaceuticals, Inc. | 1,111,455 | 6.5 | % | 44,079 | 39.66 | 7.6 | % | Multiple | |||||||||||||||||
| 2 |
Beth Israel Deaconess Medical Center, Inc. | 362,364 | 2.1 | % | 26,823 | 74.02 | 4.6 | % | June 2023 | |||||||||||||||||
| 3 |
Illumina, Inc. | 705,732 | 4.1 | % | 25,807 | 36.57 | 4.4 | % | Multiple | |||||||||||||||||
| 4 |
GlaxoSmithKline plc | 635,058 | 3.7 | % | 23,603 | 37.17 | 4.1 | % | May 2026 | |||||||||||||||||
| 5 |
Sanofi | 418,003 | 2.5 | % | 23,100 | 55.26 | 4.0 | % | Multiple | |||||||||||||||||
| 6 |
Vertex Pharmaceuticals Incorporated | 371,920 | 2.2 | % | 21,425 | 57.61 | 3.7 | % | Multiple | |||||||||||||||||
| 7 |
Children’s Hospital Corporation | 207,909 | 1.2 | % | 15,506 | 74.58 | 2.7 | % | April 2023 | |||||||||||||||||
| 8 |
Ironwood Pharmaceuticals, Inc. | 311,702 | 1.8 | % | 15,483 | 49.67 | 2.7 | % | January 2018 | |||||||||||||||||
| 9 |
Wake Forest University | 655,420 | 3.8 | % | 12,049 | 18.38 | 2.1 | % | Multiple | |||||||||||||||||
| 10 |
Baxter Healthcare Corporation | 206,084 | 1.2 | % | 12,024 | 58.35 | 2.1 | % | January 2027 | |||||||||||||||||
| 11 |
Alexion Pharmaceuticals, Inc. | 413,545 | 2.4 | % | 10,428 | 25.22 | 1.8 | % | Multiple | |||||||||||||||||
| 12 |
Arena Pharmaceuticals, Inc. | 264,557 | 1.6 | % | 8,137 | 30.76 | 1.4 | % | May 2027 | |||||||||||||||||
| 13 |
Yale University | 397,402 | 2.3 | % | 8,027 | 20.20 | 1.4 | % | Multiple | |||||||||||||||||
| 14 |
MedImmune, Inc. | 221,371 | 1.3 | % | 7,586 | 34.27 | 1.3 | % | Multiple | |||||||||||||||||
| 15 |
Isis Pharmaceuticals, Inc. | 204,704 | 1.2 | % | 7,268 | 35.50 | 1.3 | % | Multiple | |||||||||||||||||
| 16 |
Life Technologies Corporation | 204,887 | 1.2 | % | 7,251 | 35.39 | 1.2 | % | March 2028 | |||||||||||||||||
| 17 |
Bristol-Myers Squibb Company | 237,435 | 1.4 | % | 7,042 | 29.66 | 1.2 | % | Multiple | |||||||||||||||||
| 18 |
Momenta Pharmaceuticals, Inc. | 104,678 | 0.6 | % | 6,281 | 60.00 | 1.1 | % | August 2016 | |||||||||||||||||
| 19 |
Penn Presbyterian Medical Center | 269,238 | 1.6 | % | 5,923 | 22.00 | 1.0 | % | August 2034 | |||||||||||||||||
| 20 |
Gilead Sciences, Inc. | 133,945 | 0.8 | % | 5,300 | 39.57 | 0.9 | % | Multiple | |||||||||||||||||
|
|
|
|
|
|
|
|
|
|
|
|||||||||||||||||
| Total / weighted-average (3) | 7,437,409 | 43.5 | % | $ | 293,142 | $ | 39.41 | 50.6 | % | |||||||||||||||||
|
|
|
|
|
|
|
|
|
|
|
|||||||||||||||||
| (1) | Based on current annualized base rent. Current annualized base rent is the monthly contractual rent as of the current quarter ended, or if rent has not yet commenced, the first monthly rent payment due at each rent commencement date, multiplied by 12 months. |
| (2) | See page 38 for additional information. |
| (3) | Without regard to any renewal options, but includes management’s assessment on early termination options. |
LEASING ACTIVITY (1)
SEPTEMBER 30, 2015
| Leased Square Feet |
Current Annualized Base Rent per Leased Sq Ft |
GAAP Annualized Base Rent per Leased Sq Ft |
Forward-Leased Square Feet |
Current Annualized Base Rent per Forward- Leased Sq Ft |
GAAP Annualized Base Rent per Forward- Leased Sq Ft |
|||||||||||||||||||
| Leased Square Feet as of June 30, 2015 |
16,272,140 | 417,140 | ||||||||||||||||||||||
| Acquisitions |
52,790 | $ | 23.22 | $ | 24.67 | 10,524 | $ | 23.11 | $ | 23.63 | ||||||||||||||
| Expirations and terminations |
(510,718 | ) | 32.02 | 30.25 | ||||||||||||||||||||
| Forward-lease delivery (2) |
121,014 | 26.25 | 27.27 | (121,014 | ) | 26.25 | 27.27 | |||||||||||||||||
| Renewals and extensions |
228,244 | 33.29 | 34.23 | |||||||||||||||||||||
| New leases (3) |
895,409 | 28.92 | 28.94 | 151,606 | 13.94 | 15.84 | ||||||||||||||||||
|
|
|
|
|
|||||||||||||||||||||
| Leased Square Feet as of September 30, 2015 |
17,058,879 | 458,256 | ||||||||||||||||||||||
|
|
|
|
|
|||||||||||||||||||||
| Three Months Ended | Year to Date | |||||||||||||||||||||||
| Leased Square Feet |
9/30/15 | 6/30/15 | 3/31/15 | 12/31/14 | 9/30/14 | 9/30/15 | ||||||||||||||||||
| Renewals and extensions |
228,244 | 264,780 | 84,392 | 219,817 | 277,313 | 577,416 | ||||||||||||||||||
| New leases |
1,047,015 | 1,037,786 | 696,408 | 656,157 | 380,433 | 2,781,209 | ||||||||||||||||||
|
|
|
|
|
|
|
|
|
|
|
|
|
|||||||||||||
| Gross Leasing Activity |
1,275,259 | 1,302,566 | 780,800 | 875,974 | 657,746 | 3,358,625 | ||||||||||||||||||
|
|
|
|
|
|
|
|
|
|
|
|
|
|||||||||||||
| Expirations |
(374,142 | ) | (353,486 | ) | (137,441 | ) | (423,634 | ) | (385,365 | ) | (865,069 | ) | ||||||||||||
| Terminations |
(136,576 | ) | (107,715 | ) | (759,588 | ) | (9,189 | ) | (106,629 | ) | (1,003,879 | ) | ||||||||||||
| Forward-lease delivery (2) |
121,014 | 53,095 | 18,396 | — | 103,192 | 192,505 | ||||||||||||||||||
| Renewals and extensions |
228,244 | 264,780 | 84,392 | 219,817 | 277,313 | 577,416 | ||||||||||||||||||
| New leases - 1st & 2nd generation (2) |
490,477 | 361,696 | 692,713 | 92,158 | 331,153 | 1,544,886 | ||||||||||||||||||
| New leases - pre-leased (3) |
404,932 | 370,303 | — | 563,999 | — | 775,235 | ||||||||||||||||||
|
|
|
|
|
|
|
|
|
|
|
|
|
|||||||||||||
| Net Absorption (4) |
733,949 | 588,673 | (101,528 | ) | 443,151 | 219,664 | 1,221,094 | |||||||||||||||||
|
|
|
|
|
|
|
|
|
|
|
|
|
|||||||||||||
| Operating portfolio |
329,017 | 218,370 | (101,528 | ) | (120,848 | ) | 214,172 | 445,859 | ||||||||||||||||
| Active redevelopment |
— | — | — | — | — | — | ||||||||||||||||||
| Active new construction |
404,932 | 370,303 | — | 563,999 | 5,492 | 775,235 | ||||||||||||||||||
|
|
|
|
|
|
|
|
|
|
|
|
|
|||||||||||||
| Net Absorption (4) |
733,949 | 588,673 | (101,528 | ) | 443,151 | 219,664 | 1,221,094 | |||||||||||||||||
|
|
|
|
|
|
|
|
|
|
|
|
|
|||||||||||||
| Operating portfolio |
870,327 | 932,263 | 780,800 | 311,975 | 652,254 | 2,583,390 | ||||||||||||||||||
| Active redevelopment |
— | — | — | — | — | — | ||||||||||||||||||
| Active new construction |
404,932 | 370,303 | — | 563,999 | 5,492 | 775,235 | ||||||||||||||||||
|
|
|
|
|
|
|
|
|
|
|
|
|
|||||||||||||
| Gross Leasing Activity |
1,275,259 | 1,302,566 | 780,800 | 875,974 | 657,746 | 3,358,625 | ||||||||||||||||||
|
|
|
|
|
|
|
|
|
|
|
|
|
|||||||||||||
| (1) | Leasing activity for leases signed during the periods presented, which may be different than the period of actual occupancy. |
| (2) | For definition of forward-leased, see page 37. |
| (3) | Includes first and second generation leases, forward-leases, and pre-leased. For definitions see page 37. |
| (4) | Net absorption is calculated as total square footage of new leases, renewals and extensions, and forward-lease deliveries, less expirations and terminated square feet for the given period. |
LEASING DATA
SEPTEMBER 30, 2015
| Three Months Ended | Year to Date | |||||||||||||||||||||||
| 9/30/15 | 6/30/15 | 3/31/15 | 12/31/14 | 9/30/14 | 9/30/15 | |||||||||||||||||||
| Renewals and Extensions (1) |
||||||||||||||||||||||||
| Number of renewals |
16 | 18 | 16 | 14 | 14 | 50 | ||||||||||||||||||
| Square feet |
228,244 | 264,780 | 84,392 | 219,817 | 277,313 | 577,416 | ||||||||||||||||||
| Percentage change - CABR (2) |
14.3 | % | -15.3 | % | 6.4 | % | -5.5 | % | 0.4 | % | -1.4 | % | ||||||||||||
| Percentage change - GABR (2) |
22.6 | % | -0.1 | % | 11.4 | % | -1.5 | % | 3.3 | % | 4.6 | % | ||||||||||||
| Free rent months |
0.3 | 0.2 | 3.4 | 1.1 | — | 0.7 | ||||||||||||||||||
| Weighted-average lease term years |
5.2 | 9.0 | 4.8 | 6.4 | 7.2 | 6.9 | ||||||||||||||||||
| Tenant improvement costs per square foot |
$ | 8.87 | $ | 11.37 | $ | — | $ | 8.78 | $ | 1.50 | $ | 8.72 | ||||||||||||
| Leasing commission costs per square foot |
5.41 | 9.47 | 1.55 | 4.61 | 1.46 | 6.70 | ||||||||||||||||||
|
|
|
|
|
|
|
|
|
|
|
|
|
|||||||||||||
| Total tenant improvement and leasing commission costs psf |
$ | 14.27 | $ | 20.84 | $ | 1.55 | $ | 13.39 | $ | 2.96 | $ | 15.43 | ||||||||||||
|
|
|
|
|
|
|
|
|
|
|
|
|
|||||||||||||
| New Leases - 1st Generation (3) |
||||||||||||||||||||||||
| Number of leases |
15 | 9 | 9 | 5 | 12 | 33 | ||||||||||||||||||
| Square feet |
203,392 | 87,381 | 160,674 | 40,107 | 152,380 | 451,447 | ||||||||||||||||||
| Free rent months |
4.1 | 0.5 | 3.3 | 7.8 | 0.2 | 3.1 | ||||||||||||||||||
| Weighted-average lease term years |
7.1 | 7.5 | 12.6 | 9.4 | 9.5 | 9.2 | ||||||||||||||||||
| Tenant improvement costs per square foot |
$ | 72.01 | $ | 59.16 | $ | 45.04 | $ | 87.64 | $ | 62.99 | $ | 59.93 | ||||||||||||
| Leasing commission costs per square foot |
6.47 | 9.05 | 9.16 | 6.57 | 12.60 | 7.92 | ||||||||||||||||||
|
|
|
|
|
|
|
|
|
|
|
|
|
|||||||||||||
| Total tenant improvement and leasing commission costs psf |
$ | 78.48 | $ | 68.20 | $ | 54.20 | $ | 94.22 | $ | 75.59 | $ | 67.85 | ||||||||||||
|
|
|
|
|
|
|
|
|
|
|
|
|
|||||||||||||
| New Leases - 2nd Generation (3) |
||||||||||||||||||||||||
| Number of leases |
26 | 16 | 24 | 11 | 21 | 66 | ||||||||||||||||||
| Square feet |
438,691 | 580,102 | 535,734 | 52,051 | 228,053 | 1,554,527 | ||||||||||||||||||
| Percentage change - CABR (2) |
3.7 | % | 3.4 | % | -5.9 | % | 66.0 | % | 15.3 | % | -0.1 | % | ||||||||||||
| Percentage change - GABR (2) |
12.4 | % | 27.9 | % | 14.7 | % | 50.4 | % | 16.0 | % | 20.5 | % | ||||||||||||
| Free rent months |
3.3 | 2.4 | 1.5 | 0.4 | 5.8 | 2.3 | ||||||||||||||||||
| Weighted-average lease term years |
7.1 | 12.1 | 8.6 | 3.9 | 9.4 | 9.5 | ||||||||||||||||||
| Tenant improvement costs per square foot |
$ | 59.77 | $ | 118.04 | $ | 39.77 | $ | 23.59 | $ | 87.14 | $ | 74.62 | ||||||||||||
| Leasing commission costs per square foot |
7.21 | 17.18 | 10.77 | 5.16 | 12.19 | 12.16 | ||||||||||||||||||
|
|
|
|
|
|
|
|
|
|
|
|
|
|||||||||||||
| Total tenant improvement and leasing commission costs psf |
$ | 66.98 | $ | 135.21 | $ | 50.54 | $ | 28.74 | $ | 99.33 | $ | 86.78 | ||||||||||||
|
|
|
|
|
|
|
|
|
|
|
|
|
|||||||||||||
| New Leases - Pre-Leased |
||||||||||||||||||||||||
| Number of leases |
4 | 3 | — | 4 | — | 7 | ||||||||||||||||||
| Square feet |
404,932 | 370,303 | 563,999 | 775,235 | ||||||||||||||||||||
| Free rent months |
6.0 | 2.5 | — | 3.5 | — | 4.3 | ||||||||||||||||||
| Weighted-average lease term years |
13.6 | 17.1 | — | 14.6 | — | 15.3 | ||||||||||||||||||
| Tenant improvement costs per square foot |
$ | 161.26 | $ | 113.67 | $ | — | $ | 84.49 | $ | — | $ | 138.53 | ||||||||||||
| Leasing commission costs per square foot |
0.88 | 7.81 | — | 10.62 | — | 4.19 | ||||||||||||||||||
|
|
|
|
|
|
|
|
|
|
|
|
|
|||||||||||||
| Total tenant improvement and leasing commission costs psf |
$ | 162.14 | $ | 121.48 | $ | — | $ | 95.11 | $ | — | $ | 142.72 | ||||||||||||
|
|
|
|
|
|
|
|
|
|
|
|
|
|||||||||||||
| Total |
||||||||||||||||||||||||
| Number of leases and renewals |
61 | 46 | 49 | 34 | 47 | 156 | ||||||||||||||||||
| Square feet |
1,275,259 | 1,302,566 | 780,800 | 875,974 | 657,746 | 3,358,625 | ||||||||||||||||||
| Percentage change - CABR (2) |
8.1 | % | -1.6 | % | -4.6 | % | 1.4 | % | 8.7 | % | -0.4 | % | ||||||||||||
| Percentage change - GABR (2) |
16.5 | % | 20.6 | % | 14.6 | % | 3.7 | % | 10.5 | % | 16.4 | % | ||||||||||||
| Free rent months |
3.8 | 1.8 | 2.0 | 2.9 | 2.1 | 2.6 | ||||||||||||||||||
| Weighted-average lease term years |
8.8 | 12.6 | 9.0 | 11.7 | 8.5 | 10.3 | ||||||||||||||||||
| Tenant improvement costs per square foot |
$ | 84.84 | $ | 91.16 | $ | 36.56 | $ | 62.02 | $ | 45.44 | $ | 76.07 | ||||||||||||
| Leasing commission costs per square foot |
4.76 | 12.40 | 9.44 | 8.60 | 7.76 | 8.81 | ||||||||||||||||||
|
|
|
|
|
|
|
|
|
|
|
|
|
|||||||||||||
| Total tenant improvement and leasing commission costs psf |
$ | 89.60 | $ | 103.56 | $ | 46.00 | $ | 70.62 | $ | 53.20 | $ | 84.88 | ||||||||||||
|
|
|
|
|
|
|
|
|
|
|
|
|
|||||||||||||
| (1) | Does not include retained tenants that have relocated to new space or expanded into new space. |
| (2) | Excludes retail leases, leases less than 5,000 square feet, and leases for space unoccupied for a period greater than 24 months. |
| (3) | Includes forward-leasing activity and retained tenants that have relocated or expanded into new space within the Company’s portfolio. For definitions of first and second generation leases, see page 37. |
ACQUISITIONS AND DISPOSITIONS
SEPTEMBER 30, 2015
| Acquisitions Detail for 2015: |
Rentable | Percent | ||||||||||||||
| Square | Leased at | |||||||||||||||
| Property |
Market |
Closing Date | Feet | Investment | Acquisition | |||||||||||
| (In thousands) | ||||||||||||||||
| First Quarter 2015 |
||||||||||||||||
| Westlake |
Seattle | February 11, 2015 | 116,214 | $ | 89,700 | 99.1 | % | |||||||||
| Second Quarter 2015 |
||||||||||||||||
| Towne Centre Technology Park (1) |
San Diego | May 5, 2015 | 182,866 | $ | 84,000 | — | ||||||||||
| Third Quarter 2015 |
||||||||||||||||
| South Street Landing (2) |
University Related | July 24, 2015 | 267,941 | $ | 21,352 | 100.0 | % | |||||||||
| Firstfield Road |
Maryland | September 3, 2015 | 52,790 | 10,418 | 100.0 | % | ||||||||||
|
|
|
|
|
|
|
|||||||||||
| Third Quarter Total |
320,731 | $ | 31,770 | 100.0 | % | |||||||||||
|
|
|
|
|
|
|
|||||||||||
| Total 2015 Acquisitions |
619,811 | $ | 205,470 | 70.3 | % | |||||||||||
|
|
|
|
|
|
|
|||||||||||
| Dispositions Detail for 2015: |
||||||||||||
| Rentable | ||||||||||||
| Square | Gross | |||||||||||
| Property |
Market |
Closing Date | Feet | Proceeds | ||||||||
| (In thousands) | ||||||||||||
| Second Quarter 2015 |
||||||||||||
| King of Prussia |
Pennsylvania | May 29, 2015 | 547,000 | $ | 35,223 | |||||||
| Third Quarter 2015 |
||||||||||||
| 65 West Watkins Mill Road |
Maryland | September 24, 2015 | 42,900 | $ | 7,900 | |||||||
|
|
|
|
|
|||||||||
| Total 2015 Dispositions |
589,900 | $ | 43,123 | |||||||||
|
|
|
|
|
|||||||||
| (1) | Investment includes approximately 104,500 SF of estimated development potential. |
| (2) | Property is currently under active new construction and is expected to also include a 750 stall garage and 172 unit residential graduate student housing complex. Total estimated remaining cost to complete the project is $147.9 million as of September 30, 2015. |
NON-GAAP FINANCIAL MEASURE DEFINITIONS
SEPTEMBER 30, 2015
This document includes certain non-GAAP financial measures that management believes are helpful in understanding our business, as further described below. Our definition and calculation of non-GAAP financial measures may differ from those of other REITs, and therefore, may not be comparable. The non-GAAP measures should not be considered an alternative to net income as an indicator of our performance and should be considered only a supplement to cash flows from operating, investing or financing activities as a measure of liquidity, computed in accordance with GAAP.
FFO, CFFO and AFFO
We present funds from operations, or FFO, FFO excluding acquisition-related expenses, or CFFO, and adjusted funds from operations, or AFFO, available to common shares and OP units because we consider them to be important supplemental measures of our operating performance and believe they are frequently used by securities analysts, investors and other interested parties in the evaluation of REITs, many of which present FFO, CFFO and AFFO when reporting their results.
FFO, CFFO and AFFO are intended to exclude GAAP historical cost depreciation and amortization of real estate and related assets, which assumes that the value of real estate assets diminishes ratably over time. Historically, however, real estate values have risen or fallen with market conditions. Because FFO, CFFO and AFFO exclude depreciation and amortization unique to real estate, gains and losses from property dispositions and extraordinary items, they provide performance measures that, when compared year over year, reflect the impact to operations from trends in occupancy rates, rental rates, operating costs, development activities and interest costs, providing perspective not immediately apparent from net income. We compute FFO in accordance with standards established by the Board of Governors of the National Association of Real Estate Investment Trusts, or NAREIT. As defined by NAREIT, FFO represents net income (computed in accordance with GAAP), excluding gains (or losses) from sales of depreciable property, impairment charges on depreciable real estate, real estate related depreciation and amortization (excluding amortization of loan origination costs) and after adjustments for unconsolidated partnerships and joint ventures.
We calculate CFFO by adding acquisition-related expenses to FFO. We calculate AFFO by adding to CFFO: (a) non-cash revenues and expenses, (b) recurring capital expenditures and second generation tenant improvements and (c) leasing commissions.
Our computations may differ from the methodologies for calculating FFO, CFFO and AFFO utilized by other equity REITs and, accordingly, may not be comparable to such other REITs. Further, FFO, CFFO and AFFO do not represent amounts available for management’s discretionary use because of needed capital replacement or expansion, debt service obligations, or other commitments and uncertainties. FFO, CFFO and AFFO should not be considered alternatives to net income/(loss) (computed in accordance with GAAP) as indicators of our financial performance or to cash flow from operating activities (computed in accordance with GAAP) as indicators of our liquidity, nor are they indicative of funds available to fund our cash needs, including our ability to pay dividends or make distributions. FFO, CFFO and AFFO should be considered only as supplements to net income computed in accordance with GAAP as measures of our operations.
Earnings before Interest, Taxes, Depreciation and Amortization (EBITDA), and Adjusted EBITDA
EBITDA is defined as earnings before interest, taxes, depreciation and amortization. We calculate Adjusted EBITDA by adding to EBITDA: (a) noncontrolling interests in our operating partnership, (b) losses from sales of real estate, and (c) executive severance, and by subtracting from EBITDA gains from sales of real estate. Management uses EBITDA and Adjusted EBITDA as indicators of our ability to incur and service debt. In addition, we consider EBITDA and Adjusted EBITDA to be appropriate supplemental measures of our performance because they eliminate depreciation and interest, which permits investors to view income from operations without the impact of non-cash depreciation or the cost of debt. However, because EBITDA and Adjusted EBITDA are calculated before recurring cash charges including interest expense and taxes, and are not adjusted for capital expenditures or other recurring cash requirements of our business, their utility is limited.
Coverage Ratios
We present interest and fixed charge ratios as supplemental liquidity measures. Management uses these ratios as indicators of our financial flexibility to service current interest expense and debt amortization from current cash net operating income. In addition, we believe that these coverage ratios represent common metrics used by securities analysts, investors and other interested parties to evaluate our ability to service fixed cash payments. However, because these ratios are derived from Adjusted EBITDA, their utility is limited by the same factors that limit the usefulness of Adjusted EBITDA as a liquidity measure.
Net Operating Income (NOI)
We use net operating income, or NOI, as a performance measure and believe NOI provides useful information to investors regarding our financial condition and results of operations because it reflects only those income and expense items that are incurred at the property level. We compute NOI by adding or subtracting certain items from net income, noncontrolling interest in the operating partnership, gains/losses from investment in unconsolidated partnerships, interest expense, interest income, depreciation and amortization and general and administrative expenses. NOI presented by us may not be comparable to NOI reported by other REITs that define NOI differently. NOI should not be considered as an alternative to net income as an indication of our performance or to cash flows as a measure of liquidity or ability to make distributions.
Net Operating Income (NOI) - Cash Basis
We believe that net operating income on a cash basis is helpful to investors as an additional measure of operating performance because it eliminates straight-line rent, amortization of lease incentives, above and below market amortization on acquired leases, bad debt expense and rental cash adjustments to rental revenue recorded on a GAAP basis. NOI presented by us may not be comparable to NOI reported by other REITs that define NOI differently. NOI should not be considered as an alternative to net income as an indication of our performance or to cash flows as a measure of liquidity or ability to make distributions.
DEFINITIONS
SEPTEMBER 30, 2015
Property Status
Active Redevelopment
Represents properties that we are currently preparing for their intended use, and accordingly are capitalizing interest and other costs as of the end of the quarter.
Active New Construction
Represents properties that we are currently developing through ground up construction.
Land Bank
Represents estimates of the additional rentable square footage that we could put into service if management made the strategic election to pursue additional development. Also includes properties that may be held for future development or are currently engaged in activities related to planning, entitlement or other preparations for future construction.
Lease Type
First Generation
Leases on space which, in management’s evaluation, require significant improvements to prepare or condition the premises for its intended purpose or enhance the value of the property. This generally includes capital expenditures for development, redevelopment or repositioning a property.
Second Generation
Leases which are not considered by management to be first generation leases.
Pre-Leased
Leases on space classified as active new construction or, prior to execution, was included in the land bank and is expected to enter the Company’s operating portfolio at a future date.
Forward-Leased
Leases on space which is currently occupied and which are expected to commence upon vacancy of the existing tenants.
Recurring Capital Expenditures
Recurring capital expenditures exclude (1) items associated with the expansion of a building or its improvements, (2) renovations to a building which change the underlying classification of the building, incurred to prepare or condition the premises for its intended purpose (for example, from office to laboratory) or (3) capital improvements that represent an addition to the property rather than the replacement of property, plant or equipment.
Bond Covenants
Calculated in accordance with the covenants contained in the indenture that governs the terms of the Company’s unsecured senior notes due 2020 and supplemental and base indentures that govern the terms of the Company’s unsecured senior notes due 2016, unsecured senior notes due 2019, and unsecured senior notes due 2022, which are included as exhibits to the Company’s Forms 8-K filed with the SEC on April 30, 2010, March 30, 2011, April 23, 2014, and June 28, 2012, respectively. The covenants for the unsecured senior notes due 2020, unsecured senior notes due 2016, unsecured senior notes due 2019, and unsecured senior notes due 2022 are identical, except that the unencumbered total asset value definition for the unsecured senior notes due 2020 includes investments in unconsolidated partnerships accounted for under the equity method of accounting, whereas the unencumbered total asset value definition for the unsecured senior notes due 2016, unsecured senior notes due 2019, and unsecured senior notes due 2022 excludes such investments in unconsolidated partnerships.
TOP TWENTY TENANT NOTES
SEPTEMBER 30, 2015
Regeneron Pharmaceuticals, Inc.
5,081 square feet will expire in November 2015, 7,568 square feet in December 2016, 42,170 square feet in December 2018, 264,557 square feet in June 2024, 455,125 square feet in June 2029, and 297,000 square feet in July 2029.
Illumina, Inc.
Includes build-to-suit transactions to construct three new buildings pre-leased to Illumina for a 15 year term totaling approximately 360,000 square feet at Lincoln Centre and another new building on a 20 year term totaling approximately 155,000 square feet at Granta Park II. 28,057 square feet will expire in June 2017, 162,675 square feet in October 2023, 200,000 square feet in June 2032, 160,000 square feet in June 2033, and 155,000 square feet in September 2037.
GlaxoSmithKline plc
The Company’s tenant is Human Genome Sciences (HGS), a wholly owned subsidiary of GlaxoSmithKline plc (GSK).
Sanofi
343,000 square feet expire July 2018 and 75,003 square feet expire September 2018.
Vertex Pharmaceuticals Incorporated
81,204 square feet are leased with a subsidiary of Vertex Pharmaceuticals Incorporated. 290,716 square feet expire April 2018, and 81,204 square feet expire December 2018.
Children’s Hospital Corporation
This tenant guarantees rent on 49,866 square feet leased at the Center for Life Science | Boston.
Wake Forest University
242,000 square feet expire December 2027, 130,170 square feet in March 2029, 167,947 square feet in June 2031, and 115,303 square feet expire in December 2031. Wake Forest University is the sole member of the tenant, Wake Forest University Health Sciences.
Alexion Pharmaceuticals, Inc.
3,134 square feet are currently month-to-month and 410,411 square feet expire November 2027.
Yale University
9,330 square feet are currently month-to-month, 8,478 square feet expire May 2016, 10,578 square feet expire February 2018, 15,436 square feet expire August 2020, 20,143 square feet expire February 2022, 19,912 square feet expire May 2025, 4,796 square feet expire October 2025, 208,777 square feet expire April 2032 and 95,272 square feet expire February 2036.
MedImmune, Inc.
21,576 square feet expire December 2015, 39,505 square feet expire December 2020 and 160,290 square feet expire in December 2021.
Isis Pharmaceuticals, Inc.
176,000 square feet expire July 2031 and 28,704 square feet expire December 2031.
Bristol-Myers Squibb Company
13,160 square feet expire July 2016, 30,167 square feet expire April 2024 and 194,108 square feet expire May 2025.
Gilead Sciences, Inc.
38,954 square feet expire July 2017 and 101,597 square feet expire April 2027.
Serious News for Serious Traders! Try StreetInsider.com Premium Free!
You May Also Be Interested In
- u-blox Secures Significant Project Wins in the Robotic Lawnmower Market With its High-Precision Positioning Technology
- TAL Education Group Announces Unaudited Financial Results for the Fourth Fiscal Quarter and the Fiscal Year 2024
- Trakx launches a new product: Trakx USDc Earn CTI powered by OpenTrade
Create E-mail Alert Related Categories
SEC FilingsSign up for StreetInsider Free!
Receive full access to all new and archived articles, unlimited portfolio tracking, e-mail alerts, custom newswires and RSS feeds - and more!
