

Form 8-K BROCADE COMMUNICATIONS For: Nov 23
 Tweet
Tweet Share
ShareUNITED STATES
SECURITIES AND EXCHANGE COMMISSION
Washington, D.C. 20549
FORM 8-K
CURRENT REPORT
Pursuant to Section 13 or 15(d) of the
Securities Exchange Act of 1934
Date of report (Date of earliest event reported): November 23, 2015

Brocade Communications Systems, Inc.
(Exact name of registrant as specified in its charter)
Delaware | 000-25601 | 77-0409517 | ||
(State or other jurisdiction of incorporation) | (Commission File Number) | (I.R.S. Employer Identification Number) | ||
130 Holger Way
San Jose, CA 95134-1376
(Address, including zip code, of principal executive offices)
(408) 333-8000
(Registrant’s telephone number, including area code)
Not Applicable
(Former name or former address, if changed since last report)
Check the appropriate box below if the Form 8-K filing is intended to simultaneously satisfy the filing obligation of the registrant under any of the following provisions (see General Instruction A.2. below):
¨ | Written communications pursuant to Rule 425 under the Securities Act (17 CFR 230.425) |
¨ | Soliciting material pursuant to Rule 14a-12 under the Exchange Act (17 CFR 240.14a-12) |
¨ | Pre-commencement communications pursuant to Rule 14d-2(b) under the Exchange Act (17 CFR 240.14d-2(b)) |
¨ | Pre-commencement communications pursuant to Rule 13e-4(c) under the Exchange Act (17 CFR 240.13e-4(c)) |
Item 2.02 Results of Operations and Financial Condition.
On November 23, 2015, Brocade Communications Systems, Inc. (the “Company”) issued a press release regarding financial results for the fourth quarter and fiscal year ended October 31, 2015. The Company also posted on its website (www.brcd.com) slides with accompanying prepared remarks regarding such financial results and forward-looking statements, including statements relating to the Company’s estimated financial results of the first quarter of fiscal year 2016. Copies of the press release and slides with accompanying prepared remarks by the Company are attached as Exhibits 99.1 and 99.2, respectively, and the information in Exhibits 99.1 and 99.2 is incorporated herein by reference.
The information in Item 2.02 and Item 9.01 in this Current Report on Form 8-K and the exhibits attached hereto shall not be deemed “filed” for the purposes of Section 18 of the Securities Exchange Act of 1934, as amended, or otherwise subject to the liabilities of that Section, nor shall it be deemed incorporated by reference into any filing under the Securities Act of 1933, as amended, or the Securities Exchange Act of 1934, as amended.
Item 9.01 Financial Statements and Exhibits.
(d) Exhibits.
Exhibit
Number | Description of Document |
99.1 | Press release, dated November 23, 2015, regarding financial results of Brocade Communications Systems, Inc. for the fourth quarter and fiscal year ended October 31, 2015. |
99.2 | Slides with accompanying prepared remarks of Brocade Communications Systems, Inc., dated November 23, 2015, regarding financial results for the fourth quarter and fiscal year ended October 31, 2015, and forward-looking statements, including statements relating to the Company’s estimated financial results of the first quarter of fiscal year 2016. |
SIGNATURES
Pursuant to the requirements of the Securities Exchange Act of 1934, the registrant has duly caused this report to be signed on its behalf by the undersigned hereunto duly authorized.
BROCADE COMMUNICATIONS SYSTEMS, INC. | |||||||
Date: | November 23, 2015 | By: | /s/ Daniel W. Fairfax | ||||
Daniel W. Fairfax | |||||||
Senior Vice President and Chief Financial Officer | |||||||
Exhibit 99.1
BROCADE CONTACTS | ||
Public Relations Ed Graczyk Tel: 408-333-1836 | Investor Relations Michael Iburg Tel: 408-333-0233 | |
Brocade Reports Fourth Quarter and Fiscal 2015 Earnings
Record Total Revenue, IP Networking Revenue, and Earnings per Share in Fiscal 2015
SAN JOSE, Calif., November 23, 2015 — Brocade® (NASDAQ: BRCD) today reported financial results for its fourth quarter and full fiscal year 2015 ended October 31, 2015. Brocade reported fourth quarter revenue of $589 million, an increase of 4% year-over-year and 7% quarter-over-quarter. Revenue for fiscal year 2015 was $2,263 million, up 2% year-over-year. The resulting GAAP diluted earnings per share (EPS) was $0.20 for the fourth quarter and $0.79 for fiscal year 2015, up 6% and up 48% year-over-year, respectively. The fiscal year 2014 GAAP EPS included a non-cash goodwill impairment charge associated with the strategic repositioning of the Brocade ADX® product family. Non-GAAP diluted EPS was $0.26 for the fourth quarter and $1.01 for fiscal year 2015, up 8% and up 12% year-over-year, respectively.
“Fiscal 2015 was a productive year in which we achieved many significant milestones,” said Lloyd Carney, CEO of Brocade. “We delivered annual revenue growth in fiscal 2015, with a year-over-year revenue increase in each fiscal quarter. We grew our non-GAAP EPS by 12% for the fiscal year, delivering more than a dollar per share for the first time. We continued to expand our portfolio of software and hardware products through both technology innovation and strategic acquisitions. Looking forward, these investments create new opportunities for us to continue to grow revenue and EPS in 2016 and beyond.”
Quarterly Key Financial Metrics: (1)
Q4 2015 | Q3 2015 | Q4 2014 | Q4 2015 vs. Q3 2015 | Q4 2015 vs. Q4 2014 | |||||||||||||
Revenue | $ | 589 | M | $ | 552 | M | $ | 564 | M | 7 | % | 4 | % | ||||
GAAP EPS—diluted | $ | 0.20 | $ | 0.21 | $ | 0.19 | (7 | %) | 6 | % | |||||||
Non-GAAP EPS—diluted | $ | 0.26 | $ | 0.27 | $ | 0.24 | (4 | %) | 8 | % | |||||||
GAAP gross margin | 67.0 | % | 67.4 | % | 66.8 | % | (0.4) pts | 0.2 pts | |||||||||
Non-GAAP gross margin | 67.9 | % | 68.6 | % | 67.7 | % | (0.7) pts | 0.2 pts | |||||||||
GAAP operating margin | 20.2 | % | 21.7 | % | 22.4 | % | (1.5) pts | (2.2) pts | |||||||||
Non-GAAP operating margin | 25.0 | % | 26.9 | % | 26.8 | % | (1.9) pts | (1.8) pts | |||||||||
(1) Full fiscal year financial metrics are detailed in the financial statements and schedules presented below.
Please see important note of explanation about the use of non-GAAP financial measures below, including a detailed reconciliation between GAAP and non-GAAP information in the tables included herein.
Highlights:
• | Q4 2015 SAN product revenue was $325 million, flat year-over-year and up 5% quarter-over-quarter. The Q4 year-over-year product revenue performance reflects a 14% increase in director sales and a 1% increase in embedded switch sales, offset by a 12% decrease in switch sales. For fiscal year 2015, SAN product revenue was $1,301 million, down 2% year-over-year, primarily due to lower switch and embedded switch sales, partially offset by higher director sales. |
• | Q4 2015 IP Networking product revenue was $170 million, up 12% year-over-year and 10% quarter-over-quarter. The Q4 year-over-year increase was primarily driven by a 28% increase in Ethernet switch sales and improved software sales, partially offset by a 20% decline in router revenue. For fiscal year 2015, IP Networking product revenue was $601 million, up 14% year-over-year due to stronger switch, router, and software sales. |
• | During Q4, Brocade launched the Brocade Analytics Monitoring Platform, a new, innovative, SAN solution designed for both new and existing Fibre Channel storage networking customers. This solution allows customers to better monitor, analyze and control their SAN environments, while also improving the operational performance, stability, and security of data flowing between servers and storage devices. |
Page 1 of 15
• | In fiscal year 2015, Brocade’s full-year GAAP gross margin and operating margin were 67.5% and 21.8%, respectively. Full-year non-GAAP gross margin and operating margin increased to 68.4% and 26.3%, a full-year improvement of 110 basis points and 30 basis points, respectively. The full-year non-GAAP gross margin improvement was primarily due to lower excess and obsolete inventory charges and lower manufacturing overhead spending, while the operating margin improvement was due to higher gross margins, partially offset by higher sales and marketing and research and development expenses. |
• | Full-year fiscal 2015 operating cash flow was $447 million, a 17% decrease from fiscal year 2014. The decrease in operating cash flow was primarily due to higher payments with respect to employee incentive compensation earned in fiscal year 2014 and paid in fiscal year 2015, changes in accounts receivable collections, and higher fiscal year 2015 tax payments related to fiscal year 2014 earnings. During fiscal year 2015, the Company repurchased $344 million of stock, or approximately 30 million shares, and paid $67 million in dividends. This return of capital to shareholders represents 96% of adjusted free cash flow for the year. |
Board Declares Dividend
• | The Brocade Board of Directors has declared a quarterly cash dividend of $0.045 per share of the Company’s common stock. The dividend payment will be made on January 4, 2016, to shareholders of record at the close of market on December 10, 2015. |
Brocade management will host a conference call today at 2:30 p.m. PT (5:30 p.m. ET) to discuss Q4 and fiscal year 2015 results, as well as Brocade’s Q1 2016 outlook. To access the webcast, please go to www.brcd.com/events.cfm. A replay of the conference call, prepared comments and slides, as well as a written transcript, will be available at www.brcd.com.
Other Q4 2015 product, customer, and partner announcements are available at http://newsroom.brocade.com/.
Brocade (www.brocade.com)
130 Holger Way, San Jose, CA 95134
T. 408.333.8000 F. 408.333.8101
Page 2 of 15
Financial Highlights and Additional Financial Information
Q4 2015 | Q3 2015 | Q4 2014 | ||||||
Routes to market as a % of total net revenues: | ||||||||
OEM revenues | 62 | % | 62 | % | 63 | % | ||
Channel/Direct revenues | 38 | % | 38 | % | 37 | % | ||
10% or greater customer revenues | 29 | % | 43 | % | 44 | % | ||
Geographic split as a % of total net revenues (1): | ||||||||
Domestic revenues | 54 | % | 57 | % | 61 | % | ||
International revenues | 46 | % | 43 | % | 39 | % | ||
Segment split as a % of total net revenues: | ||||||||
SAN product revenues | 55 | % | 56 | % | 58 | % | ||
IP Networking product revenues | 29 | % | 28 | % | 27 | % | ||
Global Services revenues | 16 | % | 16 | % | 15 | % | ||
SAN business revenues (2) | 65 | % | 66 | % | 67 | % | ||
IP Networking business revenues (2) | 35 | % | 34 | % | 33 | % | ||
IP Networking product revenues by use category (3) (4): | ||||||||
Data Center | 60 | % | 52 | % | 58 | % | ||
Enterprise Campus | 35 | % | 40 | % | 34 | % | ||
Carrier Network (MAN/WAN) | 5 | % | 8 | % | 8 | % | ||
Additional information: | Q4 2015 | Q3 2015 | Q4 2014 | ||||||||
GAAP net income | $ | 84 | M | $ | 92 | M | $ | 83 | M | ||
Non-GAAP net income | $ | 108 | M | $ | 115 | M | $ | 104 | M | ||
GAAP operating income | $ | 119 | M | $ | 120 | M | $ | 127 | M | ||
Non-GAAP operating income | $ | 147 | M | $ | 149 | M | $ | 151 | M | ||
EBITDA | $ | 141 | M | $ | 142 | M | $ | 147 | M | ||
GAAP effective tax rate (5) | 23.6 | % | 17.4 | % | 29.1 | % | |||||
Non-GAAP effective tax rate (5) | 24.2 | % | 20.1 | % | 26.6 | % | |||||
Cash and cash equivalents | $ | 1,441 | M | $ | 1,320 | M | $ | 1,255 | M | ||
Deferred revenues | $ | 317 | M | $ | 301 | M | $ | 312 | M | ||
Capital expenditures | $ | 16 | M | $ | 19 | M | $ | 14 | M | ||
Total debt, net of discount (6) | $ | 796 | M | $ | 792 | M | $ | 597 | M | ||
Cash, net of senior debt, convertible debt and capitalized leases | $ | 566 | M | $ | 444 | M | $ | 653 | M | ||
Cash provided by operations | $ | 180 | M | $ | 55 | M | $ | 158 | M | ||
Days sales outstanding | 36 days | 33 days | 36 days | ||||||||
Employees at end of period | 4,640 | 4,626 | 4,161 | ||||||||
SAN port shipments | 1.0 | M | 0.9 | M | 1.1 | M | |||||
Share repurchases | $ | 31.1 | M | $ | 103.1 | M | $ | 32.8 | M | ||
Please see important note of explanation about the use of non-GAAP financial measures below, including a detailed reconciliation between GAAP and non-GAAP information in the tables included herein.
(1) | Revenues are attributed to geographic areas based on product delivery location. Since some OEM partners take delivery of Brocade products domestically and then ship internationally to their end users, the percentage of international revenues based on end-user location would likely be higher. |
(2) | SAN and IP Networking business revenues include hardware and software product, support, and services revenues. |
(3) | Product revenue by use category is estimated based on analysis of the information the Company collects in its sales management system. The estimated percentage of revenue by use category may fluctuate quarter to quarter due to seasonality and the timing of large customer orders. |
(4) | Each use category includes enterprise, service provider, and government revenues. |
(5) | The lower effective tax rates in Q3 2015 were, in part, due to various tax benefits recognized in the quarter including a domestic manufacturing deduction and releases of previously reserved tax provisions. |
(6) | Q4 2015 and Q3 2015 total debt, net of discount, includes the debt discount recorded for the conversion feature that is required to be separately accounted for as equity for the $575 million convertible debt, thereby reducing the carrying value of the debt. The unamortized debt discount for the conversion feature was $69 million as of October 31, 2015, and $73 million as of August 1, 2015. |
Page 3 of 15
Non-GAAP Financial Measures
To supplement financial information presented on a GAAP basis, Brocade provides information presented on a non-GAAP basis. These non-GAAP financial measures are not computed in accordance with, or as an alternative to, financial information presented on a GAAP basis. The presentation of this additional information is not meant to be considered in isolation or as a substitute for the most directly comparable GAAP measures. The most directly comparable GAAP information and a reconciliation between the GAAP and non-GAAP amounts is provided in the tables at the end of this press release.
Management believes that the non-GAAP financial measures used in this press release allow management to gain a better understanding of Brocade’s comparative operating performance, both from period to period and relative to its competitors. These non-GAAP financial measures also help with the determination of Brocade’s baseline performance before gains, losses or charges that are considered by management to be outside of ongoing operating results. Accordingly, management uses these non-GAAP financial measures for planning and forecasting of future periods and in making decisions regarding operations and the allocation of resources.
Management believes these non-GAAP financial measures, when read in conjunction with Brocade’s GAAP financials, provide useful information to investors by offering:
• | the ability to make more meaningful period-to-period comparisons of Brocade’s ongoing operating results; |
• | the ability to make more meaningful comparisons of Brocade’s operating performance relative to its competitors; |
• | the ability to better identify trends in Brocade’s underlying business and to perform related trend analyses; and |
• | a better understanding of how management plans and measures Brocade’s underlying business. |
Management excludes certain gains or losses and benefits or costs in determining non-GAAP financial measures that are the result of infrequent events or events that arise outside the ordinary course of Brocade’s continuing operations. Management believes that it is appropriate to evaluate Brocade’s operating performance by excluding those items that are not indicative of ongoing operating results or limit comparability. Such items include, but are not limited to: (i) call premium cost and write-off of debt discount and debt issuance costs related to lenders that did not participate in Brocade’s debt refinancings; (ii) acquisition and integration costs; (iii) restructuring, goodwill impairment, and other related costs (benefits); (iv) gain on sale of non-marketable equity investment; (v) (gain) loss on sale of business; (vi) legal provision (recovery) associated with certain pre-acquisition litigation; (vii) legal fees (recovery) associated with indemnification obligations and other related costs, net; (viii) gain on litigation settlement, net; and (ix) specific non-cash and non-recurring tax benefits or detriments.
Management also excludes the following non-cash charges in determining non-GAAP financial measures: (i) stock-based compensation expense; (ii) amortization of purchased intangible assets; and (iii) non-cash interest expense related to the convertible debt.
Management believes that the exclusion of stock-based compensation allows for more accurate comparisons of Brocade’s operating results to Brocade’s peer companies because of the varying use of valuation methodologies and subjective assumptions and the variety of award types. In addition, the exclusion of the expense associated with the amortization of acquisition-related intangible assets is appropriate because a significant portion of the purchase price for acquisitions may be allocated to intangible assets that have short lives, and the exclusion of amortization expense allows comparisons of operating results that are consistent over time for Brocade’s newly acquired and long-held businesses. In connection with the convertible debt, under the relevant accounting guidance, a non-cash interest expense is recognized for the convertible debt as an imputed interest expense for the conversion feature. Management believes excluding the non-cash interest expense related to the convertible debt from its non-GAAP financial measures is useful for investors because the expense does not represent a cash outflow in the respective reporting periods and is not indicative of ongoing operating performance.
Finally, management believes that it is appropriate to exclude the tax effects of the items noted above in order to present a more meaningful measure of non-GAAP net income.
Page 4 of 15
Limitations: These non-GAAP financial measures have limitations because they do not include all items of income and expense that impact the company. In addition, these non-GAAP financial measures may not be comparable to similar measurements reported by other companies. Management compensates for these limitations by relying primarily on its GAAP results and using non-GAAP financial measures only supplementally. Management also provides robust and detailed reconciliations of each non-GAAP financial measure to its most directly comparable GAAP measure, and management encourages investors to review carefully those reconciliations.
Forward-Looking Statements
This press release contains forward-looking statements including, but not limited to, statements regarding Brocade’s financial results, goals, plans, strategy, business outlook and prospects. These statements are based on current expectations as of the date of this presentation and involve a number of risks, uncertainties and assumptions that may cause actual results to differ significantly. The risks, uncertainties and assumptions include, but are not limited to: the effect on Brocade of increasing market competition and changes in the industry; Brocade’s ability to execute on its sales strategy and plans for future operations; the impact on Brocade of macroeconomic trends and events and changes in IT spending levels; Brocade’s ability to introduce and achieve market acceptance of new products and support offerings on a timely basis; risks associated with Brocade’s international operations; and integration and other risks associated with acquisitions, divestitures and strategic investments. These and other risks are set forth in more detail in Brocade’s Form 10-Q for the fiscal quarter ended August 1, 2015, and in Brocade’s Annual Report on Form 10-K for the fiscal year ended November 1, 2014. Brocade expressly assumes no obligation to update any such forward-looking statements whether as the result of new developments or otherwise.
About Brocade
Brocade (NASDAQ: BRCD) networking solutions help the world’s leading organizations transition smoothly to a world where applications and information reside anywhere. (www.brocade.com)
ADX, Brocade, Brocade Assurance, the B-wing symbol, DCX, Fabric OS, Fabric Vision, HyperEdge, ICX, MLX, MyBrocade, OpenScript, The Effortless Network, vADX, VCS, VDX, vPlane, and Vyatta are registered trademarks of Brocade Communications Systems, Inc., in the United States and/or in other countries. Other brands, products, or service names mentioned may be trademarks of Brocade or others.
© 2015 Brocade Communications Systems, Inc. All Rights Reserved.
Page 5 of 15
BROCADE COMMUNICATIONS SYSTEMS, INC. CONSOLIDATED STATEMENTS OF INCOME (Unaudited) | |||||||||||||||
Three Months Ended | For the Year Ended | ||||||||||||||
October 31, 2015 | November 1, 2014 | October 31, 2015 | November 1, 2014 | ||||||||||||
(In thousands, except per share amounts) | |||||||||||||||
Net revenues: | |||||||||||||||
Product | $ | 494,720 | $ | 476,905 | $ | 1,902,401 | $ | 1,852,187 | |||||||
Service | 94,107 | 87,453 | 361,059 | 359,080 | |||||||||||
Total net revenues | 588,827 | 564,358 | 2,263,460 | 2,211,267 | |||||||||||
Cost of revenues: | |||||||||||||||
Product | 155,734 | 151,025 | 587,515 | 592,441 | |||||||||||
Service | 38,816 | 36,215 | 147,872 | 153,033 | |||||||||||
Total cost of revenues | 194,550 | 187,240 | 735,387 | 745,474 | |||||||||||
Gross margin | 394,277 | 377,118 | 1,528,073 | 1,465,793 | |||||||||||
Operating expenses: | |||||||||||||||
Research and development | 94,547 | 83,687 | 356,720 | 345,549 | |||||||||||
Sales and marketing | 157,031 | 144,991 | 585,230 | 554,515 | |||||||||||
General and administrative | 21,808 | 21,546 | 87,623 | 84,941 | |||||||||||
Amortization of intangible assets | 902 | 135 | 2,556 | 10,280 | |||||||||||
Acquisition and integration costs | 809 | — | 3,942 | — | |||||||||||
Restructuring, goodwill impairment, and other related costs (benefits) | (41 | ) | 229 | (678 | ) | 89,280 | |||||||||
Gain on sale of network adapter business | — | — | — | (4,884 | ) | ||||||||||
Total operating expenses | 275,056 | 250,588 | 1,035,393 | 1,079,681 | |||||||||||
Income from operations | 119,221 | 126,530 | 492,680 | 386,112 | |||||||||||
Interest expense | (9,824 | ) | (9,151 | ) | (55,578 | ) | (36,757 | ) | |||||||
Interest and other income, net | 1,095 | 323 | 1,949 | 4,266 | |||||||||||
Income before income tax | 110,492 | 117,702 | 439,051 | 353,621 | |||||||||||
Income tax expense | 26,104 | 34,283 | 98,689 | 115,650 | |||||||||||
Net income | $ | 84,388 | $ | 83,419 | $ | 340,362 | $ | 237,971 | |||||||
Net income per share—basic | $ | 0.20 | $ | 0.19 | $ | 0.81 | $ | 0.55 | |||||||
Net income per share—diluted | $ | 0.20 | $ | 0.19 | $ | 0.79 | $ | 0.53 | |||||||
Shares used in per share calculation—basic | 414,769 | 431,843 | 420,331 | 435,258 | |||||||||||
Shares used in per share calculation—diluted | 422,315 | 441,649 | 430,556 | 446,859 | |||||||||||
Cash dividends declared per share | $ | 0.045 | $ | 0.035 | $ | 0.16 | $ | 0.07 | |||||||
Page 6 of 15
BROCADE COMMUNICATIONS SYSTEMS, INC.
CONSOLIDATED STATEMENTS OF COMPREHENSIVE INCOME
(Unaudited)
Three Months Ended | For the Year Ended | ||||||||||||||
October 31, 2015 | November 1, 2014 | October 31, 2015 | November 1, 2014 | ||||||||||||
(In thousands) | |||||||||||||||
Net income | $ | 84,388 | $ | 83,419 | $ | 340,362 | $ | 237,971 | |||||||
Other comprehensive income and loss, net of tax: | |||||||||||||||
Unrealized gains (losses) on cash flow hedges: | |||||||||||||||
Change in unrealized gains and losses | (1,055 | ) | (1,953 | ) | (3,387 | ) | (1,939 | ) | |||||||
Net gains and losses reclassified into earnings | 1,211 | (18 | ) | 3,755 | (235 | ) | |||||||||
Net unrealized gains (losses) on cash flow hedges | 156 | (1,971 | ) | 368 | (2,174 | ) | |||||||||
Foreign currency translation adjustments | (775 | ) | (3,480 | ) | (6,556 | ) | (3,196 | ) | |||||||
Total other comprehensive loss | (619 | ) | (5,451 | ) | (6,188 | ) | (5,370 | ) | |||||||
Total comprehensive income | $ | 83,769 | $ | 77,968 | $ | 334,174 | $ | 232,601 | |||||||
Page 7 of 15
BROCADE COMMUNICATIONS SYSTEMS, INC.
CONSOLIDATED BALANCE SHEETS
(Unaudited)
October 31, 2015 | November 1, 2014 | ||||||
(In thousands, except par value) | |||||||
ASSETS | |||||||
Current assets: | |||||||
Cash and cash equivalents | $ | 1,440,882 | $ | 1,255,017 | |||
Accounts receivable, net of allowances for doubtful accounts of $1,838 and $80 as of October 31, 2015, and November 1, 2014, respectively | 235,883 | 224,913 | |||||
Inventories | 40,524 | 38,718 | |||||
Deferred tax assets | 78,675 | 92,692 | |||||
Prepaid expenses and other current assets | 56,235 | 46,665 | |||||
Total current assets | 1,852,199 | 1,658,005 | |||||
Property and equipment, net | 439,224 | 445,433 | |||||
Goodwill | 1,617,161 | 1,567,723 | |||||
Intangible assets, net | 75,623 | 26,658 | |||||
Other assets | 53,971 | 35,856 | |||||
Total assets | $ | 4,038,178 | $ | 3,733,675 | |||
LIABILITIES AND STOCKHOLDERS’ EQUITY | |||||||
Current liabilities: | |||||||
Accounts payable | $ | 98,143 | $ | 93,705 | |||
Accrued employee compensation | 142,075 | 169,018 | |||||
Deferred revenue | 244,622 | 239,993 | |||||
Other accrued liabilities | 77,524 | 84,592 | |||||
Total current liabilities | 562,364 | 587,308 | |||||
Long-term debt, net of current portion | 795,804 | 595,450 | |||||
Non-current deferred revenue | 72,065 | 71,746 | |||||
Non-current income tax liability | 47,010 | 39,647 | |||||
Non-current deferred tax liabilities | 24,024 | 27,153 | |||||
Other non-current liabilities | 3,376 | 4,310 | |||||
Total liabilities | 1,504,643 | 1,325,614 | |||||
Commitments and contingencies | |||||||
Stockholders’ equity: | |||||||
Preferred stock, $0.001 par value, 5,000 shares authorized, no shares issued and outstanding | — | — | |||||
Common stock, $0.001 par value, 800,000 shares authorized: | |||||||
Issued and outstanding: 413,923 and 431,470 shares as of October 31, 2015, and November 1, 2014, respectively | 414 | 431 | |||||
Additional paid-in capital | 1,632,984 | 1,774,197 | |||||
Accumulated other comprehensive loss | (25,002 | ) | (18,814 | ) | |||
Retained earnings | 925,139 | 652,247 | |||||
Total stockholders’ equity | 2,533,535 | 2,408,061 | |||||
Total liabilities and stockholders’ equity | $ | 4,038,178 | $ | 3,733,675 | |||
Page 8 of 15
BROCADE COMMUNICATIONS SYSTEMS, INC. CONSOLIDATED STATEMENTS OF CASH FLOWS (Unaudited) | |||||||
Three Months Ended | |||||||
October 31, 2015 | November 1, 2014 | ||||||
(In thousands) | |||||||
Cash flows from operating activities: | |||||||
Net income | $ | 84,388 | $ | 83,419 | |||
Adjustments to reconcile net income to net cash provided by operating activities: | |||||||
Excess tax benefits from stock-based compensation | (6,962 | ) | (26,865 | ) | |||
Depreciation and amortization | 22,238 | 20,277 | |||||
Loss on disposal of property and equipment | 1,543 | 1,788 | |||||
Amortization of debt issuance costs and debt discount | 4,272 | 295 | |||||
Net gain on sale of investment | — | (50 | ) | ||||
Provision for doubtful accounts receivable and sales allowances | 1,278 | 2,043 | |||||
Non-cash stock-based compensation expense | 23,934 | 23,700 | |||||
Changes in assets and liabilities, net of acquisitions: | |||||||
Accounts receivable | (37,242 | ) | (35,140 | ) | |||
Inventories | (27 | ) | 1,869 | ||||
Prepaid expenses and other assets | 5,010 | (6,188 | ) | ||||
Deferred tax assets | (297 | ) | (934 | ) | |||
Accounts payable | (2,159 | ) | 6,748 | ||||
Accrued employee compensation | 35,149 | 26,754 | |||||
Deferred revenue | 15,565 | 12,672 | |||||
Other accrued liabilities | 33,888 | 48,198 | |||||
Restructuring liabilities | (311 | ) | (733 | ) | |||
Net cash provided by operating activities | 180,267 | 157,853 | |||||
Cash flows from investing activities: | |||||||
Proceeds from sale of non-marketable equity investment | — | 50 | |||||
Purchases of property and equipment | (15,601 | ) | (13,559 | ) | |||
Net cash paid in connection with acquisition | — | (16,900 | ) | ||||
Net cash used in investing activities | (15,601 | ) | (30,409 | ) | |||
Cash flows from financing activities: | |||||||
Payment of principal related to capital leases | (141 | ) | (103 | ) | |||
Common stock repurchases | (31,085 | ) | (32,820 | ) | |||
Proceeds from issuance of common stock | 31 | 2,701 | |||||
Payment of cash dividends to stockholders | (18,651 | ) | (15,114 | ) | |||
Excess tax benefits from stock-based compensation | 6,962 | 26,865 | |||||
Net cash used in financing activities | (42,884 | ) | (18,471 | ) | |||
Effect of exchange rate fluctuations on cash and cash equivalents | (571 | ) | (3,343 | ) | |||
Net increase in cash and cash equivalents | 121,211 | 105,630 | |||||
Cash and cash equivalents, beginning of period | 1,319,671 | 1,149,387 | |||||
Cash and cash equivalents, end of period | $ | 1,440,882 | $ | 1,255,017 | |||
Page 9 of 15
BROCADE COMMUNICATIONS SYSTEMS, INC. CONSOLIDATED STATEMENTS OF CASH FLOWS (Unaudited) | |||||||
For the Year Ended | |||||||
October 31, 2015 | November 1, 2014 | ||||||
(In thousands) | |||||||
Cash flows from operating activities: | |||||||
Net income | $ | 340,362 | $ | 237,971 | |||
Adjustments to reconcile net income to net cash provided by operating activities: | |||||||
Excess tax benefits from stock-based compensation | (48,943 | ) | (64,563 | ) | |||
Depreciation and amortization | 84,807 | 100,647 | |||||
Loss on disposal of property and equipment | 3,163 | 5,118 | |||||
Gain on sale of network adapter business | — | (4,884 | ) | ||||
Amortization of debt issuance costs and debt discount | 13,715 | 1,151 | |||||
Write-off of debt discount and debt issuance costs related to lenders that did not participate in refinancing | 4,808 | — | |||||
Net gain on sale of investments | — | (5,292 | ) | ||||
Provision for doubtful accounts receivable and sales allowances | 5,173 | 7,563 | |||||
Non-cash stock-based compensation expense | 88,528 | 84,914 | |||||
Goodwill impairment charge | — | 83,382 | |||||
Changes in assets and liabilities, net of acquisitions: | |||||||
Accounts receivable | (15,989 | ) | 17,121 | ||||
Inventories | (1,805 | ) | 6,626 | ||||
Prepaid expenses and other assets | (15,844 | ) | (10,984 | ) | |||
Deferred tax assets | 234 | (887 | ) | ||||
Accounts payable | 107 | 2,339 | |||||
Accrued employee compensation | (59,703 | ) | (11,382 | ) | |||
Deferred revenue | 1,345 | 8,652 | |||||
Other accrued liabilities | 50,366 | 96,376 | |||||
Restructuring liabilities | (2,825 | ) | (12,271 | ) | |||
Net cash provided by operating activities | 447,499 | 541,597 | |||||
Cash flows from investing activities: | |||||||
Purchases of non-marketable equity and debt investments | (2,150 | ) | (223 | ) | |||
Proceeds from sale of non-marketable equity investments | 1,489 | 10,798 | |||||
Purchases of property and equipment | (68,743 | ) | (54,734 | ) | |||
Purchase of intangible assets | (7,750 | ) | — | ||||
Net cash paid in connection with acquisitions | (95,452 | ) | (16,900 | ) | |||
Proceeds from collection of note receivable | 250 | 250 | |||||
Proceeds from sale of network adapter business | — | 9,995 | |||||
Net cash used in investing activities | (172,356 | ) | (50,814 | ) | |||
Page 10 of 15
BROCADE COMMUNICATIONS SYSTEMS, INC. CONSOLIDATED STATEMENTS OF CASH FLOWS—Continued (Unaudited) | |||||||
For the Year Ended | |||||||
October 31, 2015 | November 1, 2014 | ||||||
(In thousands) | |||||||
Cash flows from financing activities: | |||||||
Payment of principal related to senior secured notes | (300,000 | ) | — | ||||
Payment of debt issuance costs | (1,718 | ) | — | ||||
Payment of principal related to capital leases | (1,818 | ) | (2,485 | ) | |||
Common stock repurchases | (343,686 | ) | (335,380 | ) | |||
Proceeds from issuance of common stock | 51,376 | 83,994 | |||||
Payment of cash dividends to stockholders | (67,470 | ) | (30,384 | ) | |||
Proceeds from convertible notes | 565,656 | — | |||||
Purchase of convertible note hedge | (86,135 | ) | — | ||||
Proceeds from issuance of warrants | 51,175 | — | |||||
Excess tax benefits from stock-based compensation | 48,943 | 64,563 | |||||
Net cash used in financing activities | (83,677 | ) | (219,692 | ) | |||
Effect of exchange rate fluctuations on cash and cash equivalents | (5,601 | ) | (3,071 | ) | |||
Net increase in cash and cash equivalents | 185,865 | 268,020 | |||||
Cash and cash equivalents, beginning of year | 1,255,017 | 986,997 | |||||
Cash and cash equivalents, end of year | $ | 1,440,882 | $ | 1,255,017 | |||
Page 11 of 15
BROCADE COMMUNICATIONS SYSTEMS, INC. RECONCILIATION BETWEEN GAAP AND NON-GAAP FINANCIAL MEASURES (Unaudited) | |||||||||||
Three Months Ended | |||||||||||
October 31, 2015 | August 1, 2015 | November 1, 2014 | |||||||||
(In thousands, except per share amounts) | |||||||||||
Non-GAAP adjustments | |||||||||||
Stock-based compensation expense included in cost of revenues | $ | 3,189 | $ | 3,955 | $ | 4,225 | |||||
Amortization of intangible assets expense included in cost of revenues | 2,598 | 2,549 | 600 | ||||||||
Total gross margin impact from non-GAAP adjustments | 5,787 | 6,504 | 4,825 | ||||||||
Stock-based compensation expense included in research and development | 5,475 | 5,226 | 5,527 | ||||||||
Stock-based compensation expense included in sales and marketing | 10,689 | 10,601 | 8,832 | ||||||||
Stock-based compensation expense included in general and administrative | 4,581 | 4,655 | 5,116 | ||||||||
Amortization of intangible assets expense included in operating expenses | 902 | 889 | 135 | ||||||||
Acquisition and integration costs | 809 | 789 | — | ||||||||
Restructuring and other related costs (benefits) | (41 | ) | — | 229 | |||||||
Total operating income impact from non-GAAP adjustments | 28,202 | 28,664 | 24,664 | ||||||||
Convertible debt interest | 3,730 | 3,684 | — | ||||||||
Income tax effect of non-GAAP adjustments | (8,363 | ) | (9,494 | ) | (3,587 | ) | |||||
Total net income impact from non-GAAP adjustments | $ | 23,569 | $ | 22,854 | $ | 21,077 | |||||
Gross margin reconciliation | |||||||||||
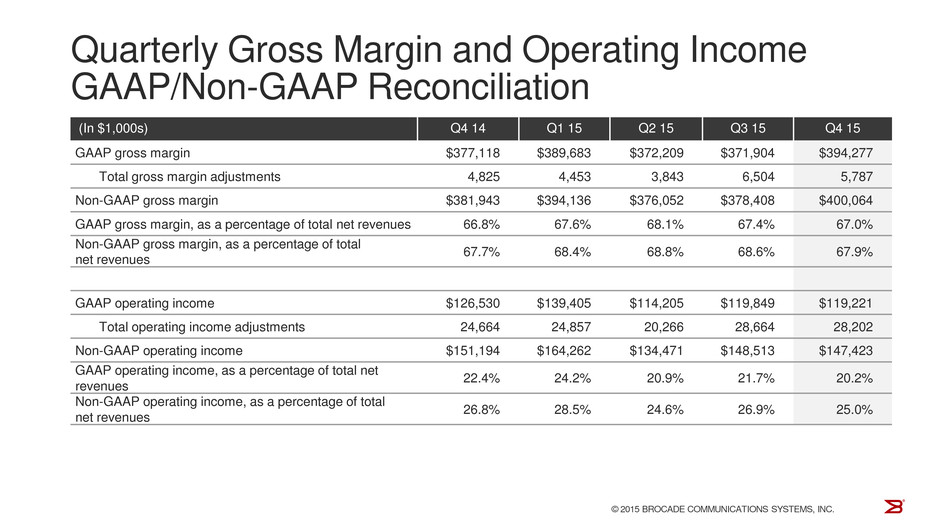
GAAP gross margin | $ | 394,277 | $ | 371,904 | $ | 377,118 | |||||
Total gross margin impact from non-GAAP adjustments | 5,787 | 6,504 | 4,825 | ||||||||
Non-GAAP gross margin | $ | 400,064 | $ | 378,408 | $ | 381,943 | |||||
GAAP gross margin, as a percent of total net revenues | 67.0 | % | 67.4 | % | 66.8 | % | |||||
Non-GAAP gross margin, as a percent of total net revenues | 67.9 | % | 68.6 | % | 67.7 | % | |||||
Operating income reconciliation | |||||||||||
GAAP operating income | $ | 119,221 | $ | 119,849 | $ | 126,530 | |||||
Total operating income impact from non-GAAP adjustments | 28,202 | 28,664 | 24,664 | ||||||||
Non-GAAP operating income | $ | 147,423 | $ | 148,513 | $ | 151,194 | |||||
GAAP operating income, as a percent of total net revenues | 20.2 | % | 21.7 | % | 22.4 | % | |||||
Non-GAAP operating income, as a percent of total net revenues | 25.0 | % | 26.9 | % | 26.8 | % | |||||
BROCADE COMMUNICATIONS SYSTEMS, INC. RECONCILIATION BETWEEN GAAP AND NON-GAAP FINANCIAL MEASURES—Continued (Unaudited) | |||||||||||
Three Months Ended | |||||||||||
October 31, 2015 | August 1, 2015 | November 1, 2014 | |||||||||
(In thousands, except per share amounts) | |||||||||||
Net income and net income per share reconciliation | |||||||||||
Net income on a GAAP basis | $ | 84,388 | $ | 91,667 | $ | 83,419 | |||||
Total net income impact from non-GAAP adjustments | 23,569 | 22,854 | 21,077 | ||||||||
Non-GAAP net income | $ | 107,957 | $ | 114,521 | $ | 104,496 | |||||
Non-GAAP net income per share—basic | $ | 0.26 | $ | 0.27 | $ | 0.24 | |||||
Non-GAAP net income per share—diluted | $ | 0.26 | $ | 0.27 | $ | 0.24 | |||||
Shares used in non-GAAP per share calculation—basic | 414,769 | 417,299 | 431,843 | ||||||||
Shares used in non-GAAP per share calculation—diluted | 422,315 | 427,518 | 441,649 | ||||||||
Effective tax rate reconciliation | |||||||||||
GAAP effective tax rate | 23.6 | % | 17.4 | % | 29.1 | % | |||||
Total tax impact from non-GAAP adjustments | 0.6 | % | 2.7 | % | (2.5 | )% | |||||
Non-GAAP effective tax rate | 24.2 | % | 20.1 | % | 26.6 | % | |||||
Page 12 of 15
BROCADE COMMUNICATIONS SYSTEMS, INC. RECONCILIATION BETWEEN GAAP AND NON-GAAP FINANCIAL MEASURES (Unaudited) | |||||||
For the Year Ended | |||||||
October 31, 2015 | November 1, 2014 | ||||||
(In thousands, except per share amounts) | |||||||
Non-GAAP adjustments | |||||||
Stock-based compensation expense included in cost of revenues | $ | 12,946 | $ | 14,962 | |||
Amortization of intangible assets expense included in cost of revenues | 7,641 | 8,010 | |||||
Total gross margin impact from non-GAAP adjustments | 20,587 | 22,972 | |||||
Stock-based compensation expense included in research and development | 18,714 | 18,635 | |||||
Stock-based compensation expense included in sales and marketing | 38,340 | 31,651 | |||||
Stock-based compensation expense included in general and administrative | 18,528 | 19,666 | |||||
Amortization of intangible assets expense included in operating expenses | 2,556 | 10,280 | |||||
Acquisition and integration costs | 3,942 | — | |||||
Restructuring, goodwill impairment, and other related costs (benefits) | (678 | ) | 89,280 | ||||
Gain on sale of network adapter business | — | (4,884 | ) | ||||
Total operating income impact from non-GAAP adjustments | 101,989 | 187,600 | |||||
Call premium cost and write-off of debt discount and debt issuance costs related to lenders that did not participate in refinancing | 15,122 | — | |||||
Gain on sale of non-marketable equity investment | — | (5,242 | ) | ||||
Convertible debt interest | 11,731 | — | |||||
Income tax effect of non-GAAP adjustments | (33,179 | ) | (17,643 | ) | |||
Total net income impact from non-GAAP adjustments | $ | 95,663 | $ | 164,715 | |||
Gross margin reconciliation | |||||||
GAAP gross margin | $ | 1,528,073 | $ | 1,465,793 | |||
Total gross margin impact from non-GAAP adjustments | 20,587 | 22,972 | |||||
Non-GAAP gross margin | $ | 1,548,660 | $ | 1,488,765 | |||
GAAP gross margin, as a percent of total net revenues | 67.5 | % | 66.3 | % | |||
Non-GAAP gross margin, as a percent of total net revenues | 68.4 | % | 67.3 | % | |||
Operating income reconciliation | |||||||
GAAP operating income | $ | 492,680 | $ | 386,112 | |||
Total operating income impact from non-GAAP adjustments | 101,989 | 187,600 | |||||
Non-GAAP operating income | $ | 594,669 | $ | 573,712 | |||
GAAP operating income, as a percent of total net revenues | 21.8 | % | 17.5 | % | |||
Non-GAAP operating income, as a percent of total net revenues | 26.3 | % | 25.9 | % | |||
Page 13 of 15
BROCADE COMMUNICATIONS SYSTEMS, INC. RECONCILIATION BETWEEN GAAP AND NON-GAAP FINANCIAL MEASURES—Continued (Unaudited) | |||||||
For the Year Ended | |||||||
October 31, 2015 | November 1, 2014 | ||||||
(In thousands, except per share amounts) | |||||||
Net income and net income per share reconciliation | |||||||
Net income on a GAAP basis | $ | 340,362 | $ | 237,971 | |||
Total net income impact from non-GAAP adjustments | 95,663 | 164,715 | |||||
Non-GAAP net income | $ | 436,025 | $ | 402,686 | |||
Non-GAAP net income per share—basic | $ | 1.04 | $ | 0.93 | |||
Non-GAAP net income per share—diluted | $ | 1.01 | $ | 0.90 | |||
Shares used in non-GAAP per share calculation—basic | 420,331 | 435,258 | |||||
Shares used in non-GAAP per share calculation—diluted | 430,556 | 446,859 | |||||
Page 14 of 15
|
Q4 FY 2015 Earnings
Prepared Comments and Slides
November 23, 2015
Michael Iburg
Investor Relations
Phone: 408-333-0233
Ed Graczyk
Public Relations
Phone: 408-333-1836
NASDAQ: BRCD
Brocade Q4 FY 2015 Earnings 11/23/2015

Prepared comments provided by Michael Iburg, Investor Relations
Thank you for your interest in Brocade’s Q4 fiscal year 2015 earnings presentation, which includes prepared remarks, cautionary statements and disclosures, slides, and a press release detailing fiscal fourth quarter and fiscal year 2015 results. The press release, along with these prepared comments and slides, has been furnished to the SEC on Form 8-K and has been made available on the Brocade Investor Relations website at www.brcd.com. The press release will be issued subsequently via Marketwired.
© 2015 Brocade Communications Systems, Inc. Page 2 of 27
Brocade Q4 FY 2015 Earnings 11/23/2015
 |
© 2015 Brocade Communications Systems, Inc. Page 3 of 27
Brocade Q4 FY 2015 Earnings 11/23/2015
 |
Today’s prepared comments include remarks by Lloyd Carney, Brocade CEO, regarding the company’s quarterly and full-year results, its strategy, and a review of operations, as well as industry trends and market/technology drivers related to its business; and by Dan Fairfax, Brocade CFO, who will provide a financial review.
A management discussion and live question and answer conference call will be webcast at
2:30 p.m. PT on November 23 at www.brcd.com and will be archived on the Brocade Investor Relations website.
© 2015 Brocade Communications Systems, Inc. Page 4 of 27
Brocade Q4 FY 2015 Earnings 11/23/2015
 |
Prepared comments provided by Lloyd Carney, CEO
© 2015 Brocade Communications Systems, Inc. Page 5 of 27
Brocade Q4 FY 2015 Earnings 11/23/2015
 |
FY15 was a productive year in which we achieved many important milestones. We delivered annual revenue growth of 2%, with a year-over-year increase in each fiscal quarter. We expanded both our gross and operating margins over the prior year, and grew non-GAAP EPS by 12%. We generated strong free cash flow, allowing us to increase our dividend and repurchase more than $340M of common stock. And finally, Brocade delivered more than a dollar per share of non-GAAP earnings for the first time in our history.
From a market perspective, FY15 was a year of both challenges and opportunities for Brocade. For the year, our SAN revenue declined 2%, largely the result of weakness in our Fibre Channel switch and embedded switch sales. As we noted at our Investor Day in September, this is an area of focus for us, and in Q4 we saw encouraging signs of progress. At the same time, our IP Networking product revenue grew 14% for the full year and exceeded our two-year target model of 8% - 12% annual growth.
With the proliferation of cloud services as a growing element in enterprise IT platforms, channel models continued to evolve significantly in FY15. Increasingly, business solutions are being delivered to customers by a myriad of interdependent partner alliances. This is a great trend for Brocade, as we have been building our company and our reputation on strong partnerships for more than 20 years. During FY15, we both expanded our ecosystem and deepened many of our relationships with key partners across all of our major product areas.
On the product and technology front, we were awarded 86 patents and delivered more than two dozen hardware and major software releases. Among them, a full portfolio of IP storage products and capabilities, a new analytics platform for our Brocade Gen 5 Fibre Channel technology, the expansion of our Brocade VDX® product family with new software-defined networking (SDN) and cloud orchestration capabilities, and several SDN applications, optimized for our Brocade MLX® product family.
During the year, we continued to expand our software-centric capabilities for New IP architectures through both technology innovation and strategic acquisitions. We acquired and integrated Connectem (virtual evolved packet core (vEPC)) and Riverbed’s SteelApp™ product line (virtual application delivery controller (vADC)) further strengthening our software portfolio in key areas. These acquisitions complement our broad portfolio of SDN and network functions virtualization (NFV) technologies, including our industry-leading Brocade SDN controller, virtual router, firewall, and VPN products, as well as our network visibility and analytics solutions.
© 2015 Brocade Communications Systems, Inc. Page 6 of 27
Brocade Q4 FY 2015 Earnings 11/23/2015
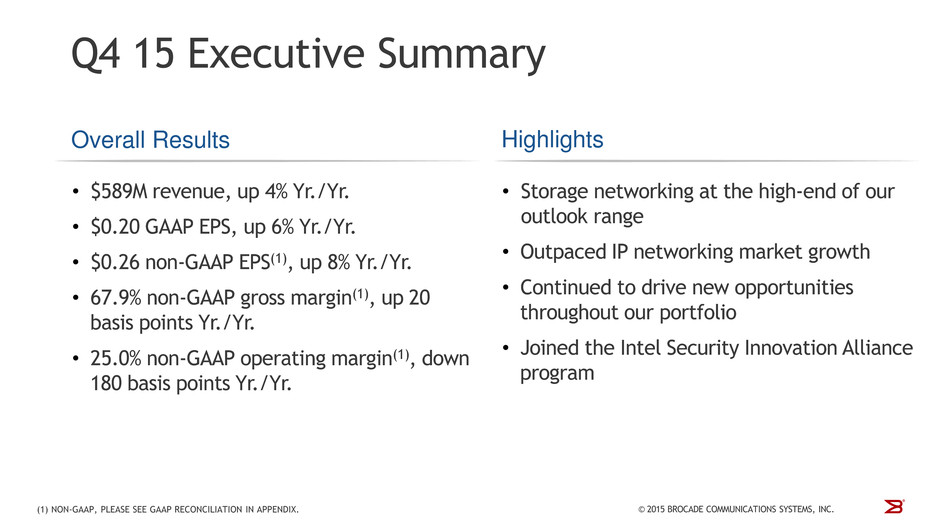 |
Turning to our fourth quarter results, storage networking revenue was at the high-end of our outlook, underscoring the continued importance of Fibre Channel connectivity in both traditional and flash-based storage networking environments. We also achieved record IP networking sales, outpacing industry growth rates with broad-based strength across most of our key markets.
Throughout the year, we have invested strategically in the expansion of our hardware and software portfolio, and are beginning to see these investments create new opportunities throughout our portfolio.
We also continue to optimize our solutions to lead in the industry transition to New IP architectures. In particular, the growth of cloud-based services will have major implications for data security. During Q4, we were pleased to join the Intel Security Innovation Alliance program, announcing our intention to integrate Intel security products and technologies with Brocade solutions. This will enable enterprises to deploy a more pervasive and fully integrated security layer as they migrate to Brocade’s cloud-ready New IP architectures.
© 2015 Brocade Communications Systems, Inc. Page 7 of 27
Brocade Q4 FY 2015 Earnings 11/23/2015
 |
Our storage networking product revenue this quarter was at the high-end of our outlook range, primarily driven by a recovery in our embedded business. We continue to expand our engagements with our traditional global systems partners, as well as a number of new partners in emerging storage technologies, such as all-flash storage arrays. This is enabling us to maximize our business opportunities and diversify our revenues more broadly across our partner base.
During Q4, we were pleased to announce the expansion of two key partnerships in China: Huawei and Lenovo. Huawei is one of the world’s largest telecommunications and networking equipment providers, and its server business is one of the fastest growing in the world. Lenovo is one of the world’s largest technology companies and has significantly increased its enterprise IT infrastructure offerings. The expansion of these partnerships gives Brocade greater access to China’s dynamic economy, which is emerging as a growth market for Fibre Channel storage networking.
During the quarter, we launched the Brocade Analytics Monitoring Platform, an innovative new SAN solution that represents an incremental offering to our sizable installed base of Fibre Channel customers. This offering allows organizations to achieve a greater return on investment and reduced operating expenses by providing non-disruptive monitoring and analytics between servers and storage.
Similarly, we continue to drive new sales opportunities with our purpose-built IP storage and IP storage extension solutions. These solutions deliver predictable performance for business critical workloads, provide security for storage data flows between data centers, and enable efficient data replication. Our differentiated approach stems from decades of leadership in building mission-critical storage networks, and we are successfully leveraging longstanding partnerships to achieve greater market penetration.
© 2015 Brocade Communications Systems, Inc. Page 8 of 27
Brocade Q4 FY 2015 Earnings 11/23/2015
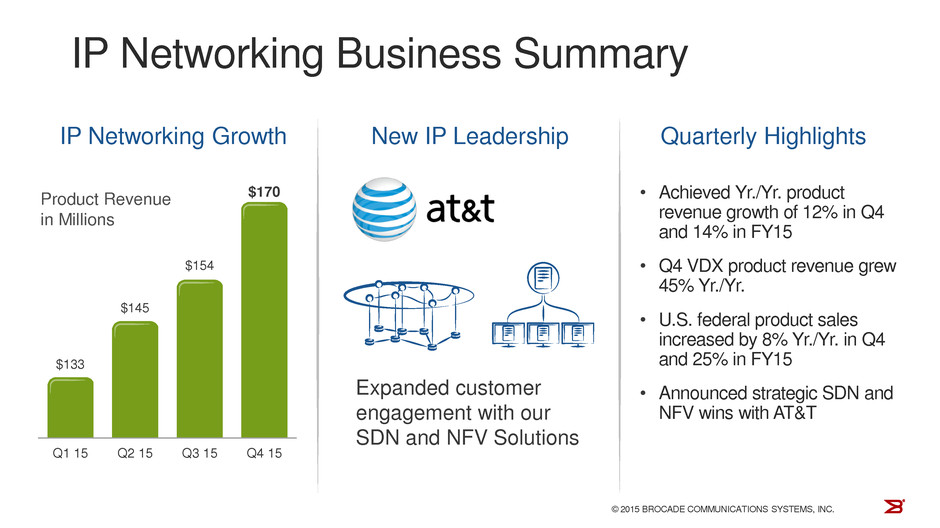 |
With broad-based strength across most key markets, we delivered fourth quarter IP Networking product revenue at the high end of our fourth quarter outlook, resulting in growth for fiscal year 2015 of 14%. We had several significant data center IP wins in the quarter, including one of the largest Brocade VDX deals in our history with a major automotive manufacturer.
The fourth quarter concluded a successful year for our campus switching business, with continued traction in enterprise, education, healthcare, and government. In particular, solid execution by our U.S. Federal team in Q4 resulted in a full-year increase in our U.S. federal product sales of more than 25% over the prior year.
Routing revenue in the fourth quarter was down 20% year-over-year as we shipped fewer next-generation line cards into our installed base. We began a line-card refresh cycle in the fourth quarter of 2014, and this contributed to the 13% router revenue growth we saw in fiscal year 2015. Looking forward, we expect the revenue benefits from this upgrade cycle to moderate through the course of FY 16.
In the fourth quarter, we further extended our software leadership in open source SDN with the announcement of the Brocade SDN Controller 2.0, as well as two new SDN applications. Brocade’s product strategy is driven by our early traction and close collaboration with leading telco, cloud, and enterprise customers. This has enabled us to deliver unique, high-value, software-based networking solutions that are being deployed today in a number of the most advanced networking environments in the world.
For example, during the fourth quarter, we were pleased that AT&T, one of the most aggressive adopters of New IP architectures, announced it is using our SDN and NFV technologies as part of its software-centric Network on Demand. The deployment of the Brocade SDN and NFV solutions underscores AT&T’s continued progress in virtualizing the majority of its network over the next five years.
We continue to focus on the expansion of our vADC revenue and customer base. Cloud providers were among the first to virtualize application delivery within their software-based networks. But today, enterprise customers are also deploying virtualized ADCs to substantially reduce infrastructure costs without having to make major architectural changes. As enterprise workloads extend to the cloud, vADC software is becoming a key enabler for cloud-optimized networks. We now have more than 400 customers deploying our vADC solution.
© 2015 Brocade Communications Systems, Inc. Page 9 of 27
Brocade Q4 FY 2015 Earnings 11/23/2015
 |
In closing, our fourth quarter achievements conclude another solid year of execution for Brocade. We continue to invest strategically in our product and technology roadmap, through both internal development and M&A. We are pleased that these investments are beginning to open up incremental opportunities across our portfolio.
Brocade remains committed to returning cash to our shareholders and, as such, leveraged our strong cash flow during the year to increase our dividend and continue to aggressively execute on our stock repurchase program.
I want to extend my sincere thanks to Brocade employees around the world whose dedication to our mission made our achievements in the past year possible. I also want to thank our shareholders, customers, and partners for their continued support.
© 2015 Brocade Communications Systems, Inc. Page 10 of 27
Brocade Q4 FY 2015 Earnings 11/23/2015
 |
Prepared comments provided by Dan Fairfax, CFO
© 2015 Brocade Communications Systems, Inc. Page 11 of 27
Brocade Q4 FY 2015 Earnings 11/23/2015
 |
Q4 15 revenue of $589M grew 4% Yr./Yr. primarily driven by increased IP Networking revenue. SAN product revenue was flat Yr./Yr. as the growth in director sales of 14% was offset by a 12% decline in switch sales, and embedded sales were up 1%. IP Networking product revenue was up 12% Yr./Yr. due to stronger Ethernet switch and software sales, partially offset by lower router sales.
Non-GAAP gross margin was 67.9% in Q4 15, up approximately 20 basis points year-over-year due primarily to lower product costs and favorable customer and product mix within our SAN and IP Networking product families. Non-GAAP operating margin was 25.0% in Q4 15, down 180 basis points from Q4 14 primarily due to higher operating expenses from increased headcount and related expenses, including acquisitions.
Q4 15 non-GAAP diluted EPS was $0.26, up from $0.24 in Q4 14 due to higher revenue and lower number of shares outstanding as a result of our share repurchase program.
Operating cash flow and adjusted free cash flow were above the forecasted ranges of $140M-$155M and $130M-$145M, respectively, as DSOs were lower than we expected but higher quarter-over-quarter.
Inventory turns were flat year-over-year, but increased slightly sequentially.
Our channels to market have remained stable year-over-year, with total OEM revenue remaining at 62% of total revenue.
© 2015 Brocade Communications Systems, Inc. Page 12 of 27
Brocade Q4 FY 2015 Earnings 11/23/2015
 |
Revenue from our total SAN business, including hardware products and SAN-based support and services, in Q4 15 was $380M, up slightly from Q4 14 as overall product revenue was flat and global service revenue was up 2% year-over-year.
Our SAN product revenue was $325M in the quarter, flat Yr./Yr. as director revenue was up 14%, but was offset by a 12% reduction in switch revenue, while our embedded revenue was up 1% year-over-year.
SAN-based global services revenue was $55M, up 2% Yr./Yr., and included several million dollars of catch-up support renewals. The timing and magnitude of the support contracts may cause quarter-over-quarter fluctuations in our revenue.
© 2015 Brocade Communications Systems, Inc. Page 13 of 27
Brocade Q4 FY 2015 Earnings 11/23/2015
 |
Revenue from our total IP Networking business, including hardware and IP-based support and services, was $209M, up 13% Yr./Yr.
Q4 15 IP Networking product revenue was a record $170M, up 12% Yr./Yr., and at the high end of our two-year target model for IP revenue growth. The Yr./Yr. revenue improvement was broad based across most geographies with EMEA up 41%, APAC up 17%, and Japan up 39%. The Americas region was up slightly year-over-year as the growth in U.S. federal was offset by lower routing sales due to pent-up demand in Q4 2014 for the next-generation line cards. From a product perspective, in Q4 15 we experienced strong year-over-year growth in switches, up 28%, while routers were down 20%. The routing decline was primarily due to a more normalized volume of next-generation line cards.
IP-based Global Services revenue was $39M, up 16% Yr./Yr. due to the higher volume of IP Networking product shipments and the incremental maintenance revenue associated with the recently acquired virtual application delivery software business we acquired in Q2 FY15.
The split of our IP Networking business based on customer use cases is an important measurement of the progress we are making on our data center strategy. Although it is difficult to identify all end users and their specific network deployments due to our two-tier distribution channel, we are providing estimates of the split of our IP Networking business by data center use case. Our data center customers(1) represented approximately 60% of IP Networking revenue in Q4 15, compared to 58% in Q4 14 and 52% in Q3 15.
(1) The estimated percentage of revenue coming from data center IP Networking customers primarily varies due to the timing of large data center customer transactions, minor changes to classification from improved visibility of actual customer deployments, as well as the seasonality of the public sector, including federal. Other use cases, such as enterprise campus and carrier networks (MAN/WAN) represent the balance of the business.
© 2015 Brocade Communications Systems, Inc. Page 14 of 27
Brocade Q4 FY 2015 Earnings 11/23/2015
 |
FY 15 was another year in which we continued to improve our financial performance resulting in record full-year non-GAAP gross margin, non-GAAP operating margin, and non-GAAP EPS.
Non-GAAP gross margin for the full year continued to improve with FY 15 margin up 110 basis points over FY 14 due to higher revenue volumes and a more favorable customer and product mix within our SAN and IP Networking product families, coupled with lower excess and obsolete inventory charges and lower manufacturing overhead.
Non-GAAP operating margin reached 26.3% for FY 15, up 30 basis points over the prior year. The improvement was primarily due to higher gross margins offset by increased operating expenses primarily driven by acquisitions and other software investments.
We delivered $1.01 in non-GAAP EPS. The 12% Yr./Yr. non-GAAP EPS growth was attributed to higher revenue, improved profitability, lower tax rate, and reduced shares outstanding due to our regular share repurchase program.
Through our dividend and share repurchases, we returned $411M to shareholders during FY 15, a 12% increase over FY 14. This represents a 96% return of adjusted free cash flow to our shareholders, above the 60% minimum Company commitment.
© 2015 Brocade Communications Systems, Inc. Page 15 of 27
Brocade Q4 FY 2015 Earnings 11/23/2015
 |
• | Looking forward to Q1 16, we considered a number of factors, including the following, in setting our outlook: |
• | Our Q4 15 Global Services revenue included several large catch-up billings which contributed a one-time benefit of approximately $3M |
• | The next-gen line-card product cycle that benefitted our router business in FY15 has begun to moderate |
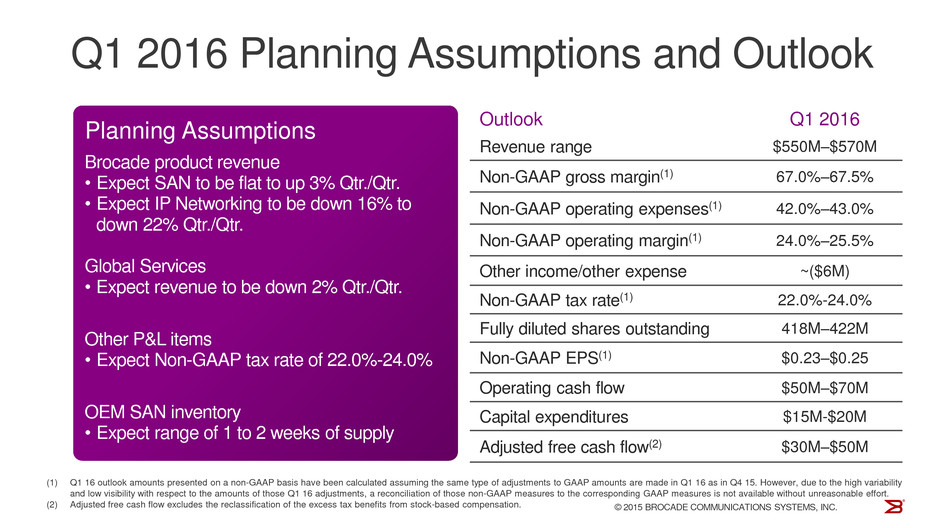
• | For Q1 16, we expect SAN product revenue to be flat to up 3% Qtr./Qtr. as we typically see stronger buying patterns from our OEM partners in our fiscal Q1. |
• | We expect our Q1 16 IP Networking revenue to be down 16% to down 22% Qtr./Qtr. principally driven by U.S. federal seasonality and lower router sales. |
• | We expect our Global Services revenue to be down 2% Qtr./Qtr. due to the approximate $3 million one-time catch-up benefit realized in Q4 15. |
• | We expect Q1 16 non-GAAP gross margin to be between 67.0% to 67.5%, and non-GAAP operating margin to be between 24.0% to 25.5%. |
• | At the end of Q4 15, OEM inventory was approximately 1.3 weeks of supply based on SAN business revenue. We expect inventory to be between one to two weeks in Q1 16. |
© 2015 Brocade Communications Systems, Inc. Page 16 of 27
Brocade Q4 FY 2015 Earnings 11/23/2015
 |
Prepared comments provided by Michael Iburg, Investor Relations
That concludes Brocade’s prepared comments. At 2:30 p.m. Pacific Time on November 23, Brocade will host a webcast conference call at www.brcd.com.
Thank you for your interest in Brocade.
© 2015 Brocade Communications Systems, Inc. Page 17 of 27
Brocade Q4 FY 2015 Earnings 11/23/2015
 |
© 2015 Brocade Communications Systems, Inc. Page 18 of 27
Brocade Q4 FY 2015 Earnings 11/23/2015
 |
© 2015 Brocade Communications Systems, Inc. Page 19 of 27
Brocade Q4 FY 2015 Earnings 11/23/2015
 |
Additional Financial Information:
Q4 14 | Q3 15 | Q4 15 | ||||
GAAP product gross margin | 68.3 | % | 68.9 | % | 68.5 | % |
Non-GAAP product gross margin | 68.9 | % | 69.8 | % | 69.3 | % |
GAAP services gross margin | 58.6 | % | 59.7 | % | 58.8 | % |
Non-GAAP services gross margin | 61.0 | % | 62.3 | % | 60.7 | % |
© 2015 Brocade Communications Systems, Inc. Page 20 of 27
Brocade Q4 FY 2015 Earnings 11/23/2015
 |
© 2015 Brocade Communications Systems, Inc. Page 21 of 27
Brocade Q4 FY 2015 Earnings 11/23/2015
 |
© 2015 Brocade Communications Systems, Inc. Page 22 of 27
Brocade Q4 FY 2015 Earnings 11/23/2015
 |
© 2015 Brocade Communications Systems, Inc. Page 23 of 27
Brocade Q4 FY 2015 Earnings 11/23/2015
 |
© 2015 Brocade Communications Systems, Inc. Page 24 of 27
Brocade Q4 FY 2015 Earnings 11/23/2015
 |
© 2015 Brocade Communications Systems, Inc. Page 25 of 27
Brocade Q4 FY 2015 Earnings 11/23/2015
 |
© 2015 Brocade Communications Systems, Inc. Page 26 of 27
Brocade Q4 FY 2015 Earnings 11/23/2015
 |
© 2015 Brocade Communications Systems, Inc. Page 27 of 27
Serious News for Serious Traders! Try StreetInsider.com Premium Free!
You May Also Be Interested In
- Loop Energy Provides Update to Previously Announced Merger Transaction
- Lula reconoce tierras indígenas en Bahía y Mato Grosso
- Ensino a distância estimula inclusão indígena, mas qualidade é desafio
Create E-mail Alert Related Categories
SEC FilingsSign up for StreetInsider Free!
Receive full access to all new and archived articles, unlimited portfolio tracking, e-mail alerts, custom newswires and RSS feeds - and more!
