

Form 8-K BOSTON PROPERTIES INC For: Oct 25
 Tweet
Tweet Share
Share
UNITED STATES
SECURITIES AND EXCHANGE COMMISSION
Washington, D.C. 20549
FORM 8-K
CURRENT REPORT
Pursuant to Section 13 or 15(d)
of the Securities Exchange Act of 1934
Date of report (Date of earliest event reported): October 25, 2016
BOSTON PROPERTIES, INC.
BOSTON PROPERTIES LIMITED PARTNERSHIP
(Exact Name of Registrants As Specified in its Charter)
| Boston Properties, Inc. | Delaware | 1-13087 | 04-2473675 | |||
| (State or Other Jurisdiction of Incorporation) |
(Commission File Number) |
(IRS Employer Identification No.) | ||||
| Boston Properties Limited Partnership | Delaware | 0-50209 | 04-3372948 | |||
| (State or Other Jurisdiction of Incorporation) |
(Commission File Number) |
(IRS Employer Identification No.) | ||||
800 Boylston Street, Suite 1900, Boston, Massachusetts 02199
(Address of Principal Executive Offices) (Zip Code)
(617) 236-3300
(Registrants’ telephone number, including area code)
Check the appropriate box below if the Form 8-K filing is intended to simultaneously satisfy the filing obligation of the registrants under any of the following provisions (see General Instruction A.2. below):
| ☐ | Written communications pursuant to Rule 425 under the Securities Act (17 CFR 230.425) |
| ☐ | Soliciting material pursuant to Rule 14a-12 under the Exchange Act (17 CFR 240.14a-12) |
| ☐ | Pre-commencement communications pursuant to Rule 14d-2(b) under the Exchange Act (17 CFR 240.14d-2(b)) |
| ☐ | Pre-commencement communications pursuant to Rule 13e-4(c) under the Exchange Act (17 CFR 240.13e-4(c)) |
Item 2.02. Results of Operations and Financial Condition.
The information in this Item 2.02 - “Results of Operations and Financial Condition” is being furnished. Such information, including Exhibits 99.1 and 99.2 hereto, shall not be deemed “filed” for any purpose, including for the purposes of Section 18 of the Securities Exchange Act of 1934, as amended (the “Exchange Act”), or otherwise subject to the liabilities of that Section. The information in this Item 2.02, including Exhibits 99.1 and 99.2, shall not be deemed incorporated by reference into any filing under the Securities Act of 1933, as amended, or the Exchange Act regardless of any general incorporation language in such filing.
On October 25, 2016, Boston Properties, Inc. (the “Company”), the general partner of Boston Properties Limited Partnership, issued a press release announcing its financial results for the third quarter of 2016. That press release referred to certain supplemental information that is available on the Company’s website. The text of the supplemental information and the press release are attached hereto as Exhibits 99.1 and 99.2, respectively, and are incorporated by reference herein.
Item 9.01. Financial Statements and Exhibits.
| (d) | Exhibits. |
| Exhibit No. |
Description | |
| *99.1 | Boston Properties, Inc. Supplemental Operating and Financial Data for the quarter ended September 30, 2016. | |
| *99.2 | Press release dated October 25, 2016. | |
| * | Filed herewith. |
2
SIGNATURES
Pursuant to the requirements of the Securities Exchange Act of 1934, the registrants have duly caused this report to be signed on their behalf by the undersigned hereunto duly authorized.
| BOSTON PROPERTIES, INC. | ||
| By: | /s/ Michael E. LaBelle | |
|
| ||
| Michael E. LaBelle | ||
| Executive Vice President, Chief Financial Officer and Treasurer | ||
| BOSTON PROPERTIES LIMITED PARTNERSHIP | ||
| By: Boston Properties, Inc., its General Partner | ||
| By: | /s/ Michael E. LaBelle | |
|
| ||
| Michael E. LaBelle | ||
| Executive Vice President, Chief Financial Officer and Treasurer | ||
Date: October 25, 2016
3
EXHIBIT INDEX
| Exhibit No. |
Description | |
| *99.1 | Boston Properties, Inc. Supplemental Operating and Financial Data for the quarter ended September 30, 2016. | |
| *99.2 | Press release dated October 25, 2016. | |
| * | Filed herewith. |
4
Exhibit 99.1

Supplemental Operating and Financial Data
for the Quarter Ended September 30, 2016

THIRD QUARTER 2016
Table of Contents
| Page | ||||
| Company Profile |
3 | |||
| Investor Information |
4 | |||
| Research Coverage |
5 | |||
| Guidance and Assumptions |
6 | |||
| Financial Highlights |
7-8 | |||
| Consolidated Balance Sheets |
9 | |||
| Consolidated Income Statements |
10 | |||
| Funds From Operations |
11 | |||
| Funds Available for Distribution |
12 | |||
| Interest Coverage Ratios |
13 | |||
| Capital Structure |
14 | |||
| Debt Analysis |
15-16 | |||
| Unconsolidated Joint Ventures |
17-18 | |||
| Consolidated Joint Ventures |
19-20 | |||
| Reconciliation to Same Property Performance and Net Income |
21-23 | |||
| Residential and Hotel Performance |
24 | |||
| Capital Expenditures, Tenant Improvements and Leasing Commissions |
25 | |||
| Portfolio Overview |
26 | |||
| In-Service Property Listing |
27-29 | |||
| Occupancy by Location |
30 | |||
| Top 20 Tenants and Tenant Diversification |
31 | |||
| Aggregate Lease Expiration Roll Out |
32 | |||
| Boston Lease Expiration Roll Out |
33-34 | |||
| New York Lease Expiration Roll Out |
35-36 | |||
| San Francisco and Los Angeles Lease Expiration Roll Out |
37-38 | |||
| Washington, DC Lease Expiration Roll Out |
39-40 | |||
| CBD/Suburban Lease Expiration Roll Out |
41-42 | |||
| Leasing Activity |
43 | |||
| Acquisitions/Dispositions |
44 | |||
| Value Creation Pipeline - Construction in Progress |
45 | |||
| Value Creation Pipeline - Land Parcels and Purchase Options |
46 | |||
| Definitions |
47-48 | |||
This supplemental package contains forward-looking statements within the meaning of the Federal securities laws. You can identify these statements by our use of the words “assumes,” “believes,” “estimates,” “expects,” “guidance,” “intends,” “may,” “might,” “plans,” “projects,” “should,” “will” and similar expressions that do not relate to historical matters. You should exercise caution in interpreting and relying on forward-looking statements because they involve known and unknown risks, uncertainties and other factors that are, in some cases, beyond Boston Properties’ control and could materially affect actual results, performance or achievements. These factors include, without limitation, the ability to enter into new leases or renew leases on favorable terms, dependence on tenants’ financial condition, the uncertainties of real estate development, acquisition and disposition activity, the ability to effectively integrate acquisitions, the uncertainties of investing in new markets, the ability of our joint venture partners to satisfy their obligations, the costs and availability of financing, the effectiveness of our interest rate hedging programs, the effects of local, national and international economic and market conditions, the effects of acquisitions, dispositions and possible impairment charges on our operating results, the impact of newly adopted accounting principles on the Company’s accounting policies and on period-to-period comparisons of financial results, regulatory changes and other risks and uncertainties detailed from time to time in the Company’s filings with the Securities and Exchange Commission. These forward-looking statements speak only as of the date hereof and are not guarantees of future results, performance or achievements. Boston Properties does not undertake a duty to update or revise any forward-looking statement, whether as a result of new information, future events or otherwise.
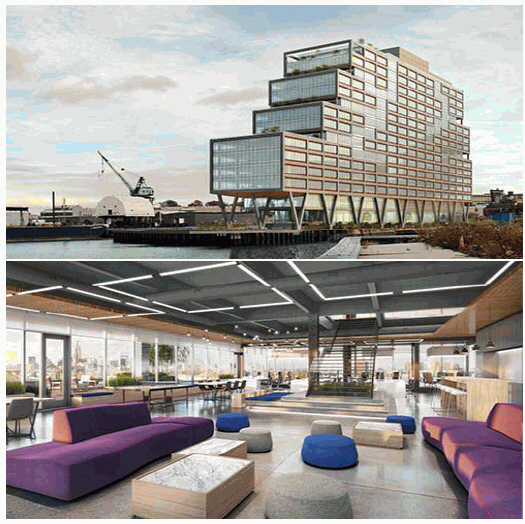
(Cover photo: Renderings of Dock72, Brooklyn, NY)
2
THIRD QUARTER 2016
COMPANY PROFILE
The Company
Boston Properties, Inc. (“Boston Properties,” “BXP” or the “Company”), a self-administered and self-managed real estate investment trust (REIT), is one of the largest owners, managers, and developers of first-class office properties in the United States, with a significant presence in five markets: Boston, Los Angeles, New York, San Francisco, and Washington, DC. The Company was founded in 1970 by Mortimer B. Zuckerman and Edward H. Linde in Boston, where it maintains its headquarters. Boston Properties became a public company in June 1997. The Company acquires, develops and manages its properties through full-service regional offices. Its property portfolio is comprised primarily of Class A office properties, five retail properties, four residential properties (including two properties under construction) and one hotel. Boston Properties is well-known for its in-house building management expertise and responsiveness to tenants’ needs. The Company holds a superior track record in developing premium Central Business District (CBD) office buildings, successful mixed-use complexes, suburban office centers and build-to-suit projects for the U.S. government and a diverse array of creditworthy tenants.
Management
Boston Properties’ senior management team is among the most respected and accomplished in the REIT industry. Our deep and talented team of 35 individuals averages 30 years of real estate experience and 19 years with Boston Properties. We believe that our size, management depth, financial strength, reputation, and relationships of key personnel provide a competitive advantage to realize growth through property development and acquisitions. Boston Properties benefits from the reputation and relationships of key personnel, including Owen D. Thomas, Chief Executive Officer; Douglas T. Linde, President; Raymond A. Ritchey, Senior Executive Vice President; and Michael E. LaBelle, Executive Vice President, Chief Financial Officer and Treasurer. Our senior management team’s national reputation helps us attract business and investment opportunities. In addition, our other executive officers that serve as Regional Managers have strong reputations that assist in identifying and closing on new opportunities, having opportunities brought to us, and in negotiating with tenants and build-to-suit prospects. Additionally, Boston Properties’ Board of Directors consists of 11 distinguished members, the majority of whom are Independent Directors.
Strategy
Boston Properties’ primary business objective is to maximize return on investment in an effort to provide its investors with the greatest possible total return in all points of the economic cycle. To achieve this objective, the Company maintains consistent strategies that include the following:
| • | concentrating on carefully targeted markets characterized by high barriers to the creation of new supply and strong real estate fundamentals where tenants have demonstrated a preference for high-quality office buildings and other facilities—currently Boston, Los Angeles, New York, San Francisco and Washington, DC; |
| • | investing in the highest quality buildings (primarily office) that are able to maintain high occupancy and achieve premium rental rates through economic cycles; |
| • | in our core markets, maintaining scale and a full service real estate capability (leasing, development, construction and property management) to ensure we (1) see all relevant investment deal flow and (2) maintain an ability to execute on all types of real estate opportunities, such as acquisitions, dispositions, repositioning and development, throughout the real estate investment cycle; |
| • | be astute in market timing for investment decisions by acquiring properties in times of opportunity, developing into economic growth and selectively selling assets to either take advantage of the demand for our premier properties or pare from the portfolio properties that we believe have slower future growth potential, resulting in continuous portfolio refreshment; |
| • | taking on complex, technically-challenging development projects that leverage the skills of our management team to successfully develop, acquire, and reposition properties; |
| • | exploring joint-venture opportunities with partners who seek to benefit from our depth of development and management expertise; |
| • | ensuring a strong balance sheet to maintain consistent access to capital and the resultant ability to make opportunistic investments; and |
| • | fostering a culture and reputation of integrity and fair dealing, making us the counterparty of choice for tenants and real estate industry participants. |
| Snapshot (as of September 30, 2016) |
||
| Corporate Headquarters | Boston, Massachusetts | |
| Markets | Boston, Los Angeles, New York, San Francisco and Washington, DC | |
| Fiscal Year-End | December 31 | |
| Total Properties (includes unconsolidated joint ventures) | 174 | |
| Total Square Feet (includes unconsolidated joint ventures) | 47.7 million | |
| Common shares outstanding, plus common units and LTIP units (including Outperformance Plan Units and 2013 Multi-Year Long-Term Incentive Program (“MYLTIP”) Units when earned) on an as-converted basis (excludes 2014, 2015 and 2016 MYLTIP Units because not yet earned) (1) | 171.8 million | |
| Dividend - Quarter/Annualized | $0.65/$2.60 | |
| Dividend Yield | 1.91% | |
| Consolidated Market Capitalization | $33.4 billion | |
| BXP’s Share of Combined Market Capitalization (2) | $32.6 billion | |
| Senior Debt Ratings | A- (S&P); BBB+ (Fitch); Baa2 (Moody’s) |
| (1) | For additional detail, see page 14. |
| (2) | For the Company’s definition of BXP’s Share of Combined Market Capitalization and related disclosures, see page 47. For a quantitative reconciliation of Consolidated Market Capitalization to BXP’s Share of Combined Market Capitalization, see page 14. |
3
THIRD QUARTER 2016
INVESTOR INFORMATION
| Board of Directors |
Management | |||||
| Joel I. Klein | Dr. Jacob A. Frenkel | Raymond A. Ritchey | John F. Powers | |||
| Lead Independent Director | Director, Chair of Nominating & Corporate Governance Committee | Senior Executive Vice President | Executive Vice President, | |||
| New York Region | ||||||
| Owen D. Thomas | Michael E. LaBelle | |||||
| Chief Executive Officer and Director | Matthew J. Lustig | Executive Vice President, Chief Financial Officer and Treasurer | Frank D. Burt | |||
| Director | Senior Vice President, General Counsel | |||||
| Douglas T. Linde | ||||||
| President and Director | Alan J. Patricof | Peter D. Johnston | Michael R. Walsh | |||
| Director | Executive Vice President, | Senior Vice President, Chief Accounting Officer | ||||
| Bruce W. Duncan | Washington, DC Region | |||||
| Director | Martin Turchin | |||||
| Director | Bryan J. Koop | |||||
| Karen E. Dykstra | Executive Vice President, | |||||
| Director | David A. Twardock | Boston Region | ||||
| Director, Chair of Audit Committee | ||||||
| Carol B. Einiger | Robert E. Pester | |||||
| Director, Chair of Compensation Committee | Executive Vice President, | |||||
| San Francisco Region | ||||||
| Chairman Emeritus |
||||||
| Mortimer B. Zuckerman | ||||||
| Company Information | ||||||
| Corporate Headquarters | Trading Symbol | Investor Relations | Inquires | |||
| 800 Boylston Street | BXP | Boston Properties, Inc. | Inquiries should be directed to | |||
| Suite 1900 | 800 Boylston Street, Suite 1900 | Michael E. LaBelle | ||||
| Boston, MA 02199 | Stock Exchange Listing | Boston, MA 02199 | Executive Vice President, Chief Financial Officer | |||
| (t) 617.236.3300 | New York Stock Exchange | (t) 617.236.3322 | and Treasurer | |||
| (f) 617.236.3311 | (f) 617.236.3311 | at 617.236.3352 or | ||||
| www.bostonproperties.com | [email protected] | |||||
| Arista Joyner, Investor Relations Manager | ||||||
| at 617.236.3343 or | ||||||
| [email protected] | ||||||
Common Stock Data (NYSE: BXP)
Boston Properties’ common stock has the following characteristics (based on information reported by the New York Stock Exchange):
| Q3 2016 | Q2 2016 | Q1 2016 | Q4 2015 | Q3 2015 | ||||||||||||||||
| High Closing Price |
$ | 143.61 | $ | 133.13 | $ | 127.26 | $ | 130.15 | $ | 126.32 | ||||||||||
| Low Closing Price |
$ | 130.03 | $ | 123.71 | $ | 108.18 | $ | 118.62 | $ | 108.65 | ||||||||||
| Average Closing Price |
$ | 138.78 | $ | 128.38 | $ | 118.69 | $ | 124.47 | $ | 119.54 | ||||||||||
| Closing Price, at the end of the quarter |
$ | 136.29 | $ | 131.90 | $ | 127.08 | $ | 127.54 | $ | 118.40 | ||||||||||
| Dividends per share |
$ | 0.65 | $ | 0.65 | $ | 0.65 | $ | 0.65 | $ | 0.65 | ||||||||||
| Special dividends per share |
$ | — | $ | — | $ | — | $ | 1.25 | $ | — | ||||||||||
|
|
|
|
|
|
|
|
|
|
|
|||||||||||
| Total dividends |
$ | 0.65 | $ | 0.65 | $ | 0.65 | $ | 1.90 | $ | 0.65 | ||||||||||
|
|
|
|
|
|
|
|
|
|
|
|||||||||||
| Closing dividend yield - annualized |
1.91 | % | 1.97 | % | 2.05 | % | 3.02 | %(1) | 2.20 | % | ||||||||||
| Closing common shares outstanding, plus common units and LTIP units (including Outperformance Plan Units and 2013 MYLTIP Units when earned) on an as-converted basis (excludes 2014, 2015 and 2016 MYLTIP Units because not yet earned) (thousands) (2) |
171,775 | 171,772 | 171,763 | 171,509 | 171,509 | |||||||||||||||
| Closing market value of outstanding shares and units (thousands) |
$ | 23,611,215 | $ | 22,856,727 | $ | 22,027,642 | $ | 22,074,258 | $ | 20,506,666 | ||||||||||
| (1) | Includes the special dividend of $1.25 per share paid on January 28, 2016 to shareholders of record as of the close of business on December 31, 2015. |
| (2) | For additional detail, see page 14. |
| Timing | ||||
| Quarterly results for the next four quarters will be announced according to the following schedule: | ||||
| Fourth Quarter, 2016 |
Tentatively January 31, 2017 | |||
| First Quarter, 2017 |
Tentatively April 25, 2017 | |||
| Second Quarter, 2017 |
Tentatively August 1, 2017 | |||
| Third Quarter, 2017 |
Tentatively November 1, 2017 | |||
4
THIRD QUARTER 2016
RESEARCH COVERAGE
| Equity Research Coverage |
Debt Research Coverage |
Rating Agencies | ||||
| Jacob Kilstein | Anthony Paolone | Andrew Mollay | Stephen Boyd | |||
| Argus Research Company | J.P. Morgan Securities | Bank of America Merrill Lynch | Fitch Ratings | |||
| 646.747.5447 | 212.622.6682 | 646.855.6435 | 212.908.9153 | |||
| Jeffrey Spector / Jamie Feldman | Craig Mailman / Jordan Sadler | Peter Troisi | Ranjini Venkatesan | |||
| Bank of America Merrill Lynch | KeyBanc Capital Markets | Barclays | Moody’s Investors Service | |||
| 646.855.1363 / 646.855.5808 | 917.368.2316 / 917.368.2280 | 212.412.3695 | 212.553.3828 | |||
| Ross Smotrich / Peter Siciliano | Richard Anderson | Thomas Cook | Anita Ogbara | |||
| Barclays Capital | Mizuho Securities | Citi Investment Research | Standard & Poor’s | |||
| 212.526.2306 / 212.526.3098 | 212.205.8445 | 212.723.1112 | 212.438.5077 | |||
| John Kim | Sumit Sharma / Vikram Malhotra | John Giordano | ||||
| BMO Capital | Morgan Stanley | Credit Suisse Securities | ||||
| 212.885.4115 | 212.761.7567 / 212.761.7064 | 212.538.4935 | ||||
| Thomas Lesnick / Tom Catherwood | Mike Carroll | Ron Perrotta | ||||
| Capital One Securities | RBC Capital Markets | Goldman Sachs | ||||
| 571.633.8191 | 440.715.2649 | 212.702.7885 | ||||
| Michael Bilerman / Emmanuel Korchman | David Rodgers / Richard Schiller | Mark Streeter | ||||
| Citigroup Global Markets | RW Baird | J.P. Morgan Securities | ||||
| 212.816.1383 / 212.816.1382 | 216.737.7341 / 312.609.5485 | 212.834.5086 | ||||
| Barry Oxford | Alexander Goldfarb / Daniel Santos | Thierry Perrein / Jason Jones | ||||
| D.A. Davidson & Co. | Sandler O’Neill & Partners | Wells Fargo | ||||
| 212.240.9871 | 212.466.7937 / 212.466.7927 | 704.715.8455 / 704.715.7932 | ||||
| Vincent Chao / Mike Husseini | John Guinee / Erin Aslakson | |||||
| Deutsche Bank Securities | Stifel, Nicolaus & Company | |||||
| 212.250.6799 / 212.250.7703 | 443.224.1307 / 443.224.1350 | |||||
| Steve Sakwa / Robert Simone | Michael Lewis | |||||
| Evercore ISI | SunTrust Robinson Humphrey | |||||
| 212.446.9462 / 212.446.9459 | 212.319.5659 | |||||
| Brad Burke | Nick Yulico | |||||
| Goldman Sachs | UBS Securities | |||||
| 917.343.2082 | 212.713.3402 | |||||
| Jed Reagan / Tyler Grant | Blaine Heck | |||||
| Green Street Advisors | Wells Fargo Securities | |||||
| 949.640.8780 | 443.263.6529 | |||||
| Jonathan Petersen / Omotayo Okusanya | ||||||
| Jefferies & Co. | ||||||
| 212.284.1705 / 212.336.7076 | ||||||
With the exception of Green Street Advisors, an independent research firm, the equity analysts listed above are those analysts that, according to First Call Corporation, have published research material on the Company and are listed as covering the Company. Please note that any opinions, estimates or forecasts regarding Boston Properties’ performance made by the analysts listed above do not represent the opinions, estimates or forecasts of Boston Properties or its management. Boston Properties does not by its reference above imply its endorsement of or concurrence with any information, conclusions or recommendations made by any of such analysts.
5
THIRD QUARTER 2016
GUIDANCE
The Company’s guidance for the full year 2016 and 2017 for diluted earnings per common share attributable to Boston Properties, Inc. common shareholders (“EPS”) and diluted funds from operations (“FFO”) per common share attributable to Boston Properties, Inc. common shareholders is set forth and reconciled below. Except as described below, the estimates reflect management’s view of current and future market conditions, including assumptions with respect to rental rates, occupancy levels and the earnings impact of the events referenced in the earnings release issued on October 25, 2016 and otherwise referenced during the Company’s conference call scheduled for October 26, 2016. The estimates do not include possible future gains or losses or the impact on operating results from other possible future property acquisitions or dispositions, other possible capital markets activity or possible future impairment charges. EPS estimates may be subject to fluctuations as a result of several factors, including changes in the recognition of depreciation and amortization expense and any gains or losses associated with disposition activity. The Company is not able to assess at this time the potential impact of these factors on projected EPS. By definition, FFO does not include real estate-related depreciation and amortization, impairment losses on depreciable real estate or gains or losses associated with disposition activities. There can be no assurance that the Company’s actual results will not differ materially from the estimates set forth below.
| Full Year 2016 | Full Year 2017 | |||||||||||||||||||||||
| Low | High | Low | High | |||||||||||||||||||||
| Projected EPS (diluted) |
$ | 2.98 | - | $ | 3.00 | $ | 2.58 | - | $ | 2.76 | ||||||||||||||
| Add: |
||||||||||||||||||||||||
| Projected Company share of real estate depreciation and amortization |
3.46 | - | 3.46 | 3.47 | - | 3.47 | ||||||||||||||||||
| Less: |
||||||||||||||||||||||||
| Projected Company share of gains on sales of real estate |
0.47 | - | 0.47 | — | - | — | ||||||||||||||||||
|
|
|
|
|
|
|
|
|
|||||||||||||||||
| Projected FFO per share (diluted) |
$ | 5.97 | - | $ | 5.99 | $ | 6.05 | - | $ | 6.23 | ||||||||||||||
|
|
|
|
|
|
|
|
|
|||||||||||||||||
ASSUMPTIONS
(dollars in thousands)
| Full Year 2016 | Full Year 2017 | |||||||||||||||||||||||
| Low | High | Low | High | |||||||||||||||||||||
| Operating property activity: |
||||||||||||||||||||||||
| Average In-service portfolio occupancy |
89.0 | % | - | 90.0 | % | 90.0 | % | - | 91.0 | % | ||||||||||||||
| Increase (decrease) in BXP’s Share of Combined Same Property net operating income (1) |
1.25 | % | - | 1.75 | % | 2.00 | % | - | 3.50 | % | ||||||||||||||
| Increase (decrease) in BXP’s Share of Combined Same Property net operating income — cash basis (1) |
3.50 | % | - | 4.00 | % | 2.00 | % | - | 4.00 | % | ||||||||||||||
| BXP’s Share of Combined Non Same Properties’ incremental contribution over prior year |
$ | 40,000 | - | $ | 43,000 | $ | 18,000 | - | $ | 30,000 | ||||||||||||||
| BXP’s Share of Combined Straight-line rent and fair value lease revenue (non-cash revenue) |
$ | 60,000 | - | $ | 64,000 | $ | 50,000 | - | $ | 70,000 | ||||||||||||||
| Hotel net operating income |
$ | 13,000 | - | $ | 14,000 | $ | 13,000 | - | $ | 15,000 | ||||||||||||||
| Lease termination fees |
$ | 58,000 | - | $ | 59,000 | $ | 4,000 | - | $ | 5,000 | ||||||||||||||
| Other income (expense): |
||||||||||||||||||||||||
| Development and management services income |
$ | 24,000 | - | $ | 25,000 | $ | 24,000 | - | $ | 28,000 | ||||||||||||||
| General and administrative expense |
$ | (107,000 | ) | - | $ | (104,000 | ) | $ | (114,000 | ) | - | $ | (108,000 | ) | ||||||||||
| Net interest expense |
$ | (407,000 | ) | - | $ | (403,000 | ) | $ | (391,000 | ) | - | $ | (378,000 | ) | ||||||||||
| Noncontrolling interest: |
||||||||||||||||||||||||
| Noncontrolling interest in property partnerships’ share of FFO |
$ | (102,000 | ) | - | $ | (104,000 | ) | $ | (105,000 | ) | - | $ | (90,000 | ) | ||||||||||
| (1) | Increase (decrease) in Combined Same Property Net Operating Income and Combined Same Property Net Operating Income – cash basis is assumed to be 0.25%-0.75% and 2.50%-3.00%, respectively. Full year 2016 and 2017 percentages are assumed changes from 2015 and 2016, respectively. |
6
THIRD QUARTER 2016
FINANCIAL HIGHLIGHTS
(unaudited and in thousands, except ratios and per share amounts)
This section includes non-GAAP financial measures, which are accompanied by what the Company considers the most directly comparable financial measures calculated and presented in accordance with GAAP. Quantitative reconciliations of the differences between the most directly comparable GAAP financial measures and the non-GAAP financial measures presented are shown on pages 11-13. Definitions of the non-GAAP financial measures the Company presents and statements of the reasons why management believes the non-GAAP measures provide useful information to investors about the Company’s financial condition and results of operations can be found on pages 47-48.
| Three Months Ended | ||||||||||||||||||||
| 30-Sep-16 | 30-Jun-16 | 31-Mar-16 | 31-Dec-15 | 30-Sep-15 | ||||||||||||||||
| Net income attributable to Boston Properties, Inc. common shareholders |
$ | 76,753 | $ | 96,597 | $ | 181,747 | $ | 137,851 | $ | 184,082 | ||||||||||
| Net income attributable to Boston Properties, Inc. per share - basic |
$ | 0.50 | $ | 0.63 | $ | 1.18 | $ | 0.90 | $ | 1.20 | ||||||||||
| Net income attributable to Boston Properties, Inc. per share - diluted |
$ | 0.50 | $ | 0.63 | $ | 1.18 | $ | 0.90 | $ | 1.20 | ||||||||||
| FFO attributable to Boston Properties, Inc. (1) |
$ | 219,564 | $ | 220,595 | $ | 250,688 | $ | 197,339 | $ | 217,261 | ||||||||||
| FFO per share - diluted (1) |
$ | 1.42 | $ | 1.43 | $ | 1.63 | $ | 1.28 | $ | 1.41 | ||||||||||
| Dividends per common share |
$ | 0.65 | $ | 0.65 | $ | 0.65 | $ | 1.90 | (2) | $ | 0.65 | |||||||||
| Funds available for distribution to common shareholders and common unitholders (FAD) (1) (3) |
$ | 149,725 | $ | 160,948 | $ | 188,204 | $ | 138,872 | $ | 142,301 | ||||||||||
| Ratios: |
||||||||||||||||||||
| Interest Coverage Ratio (excluding capitalized interest) (4) |
3.49 | 3.63 | 3.79 | 3.20 | 3.28 | |||||||||||||||
| Interest Coverage Ratio (including capitalized interest) (4) |
3.17 | 3.28 | 3.45 | 2.95 | 3.00 | |||||||||||||||
| FFO Payout Ratio (3) |
45.77 | % | 45.45 | % | 39.88 | % | 50.78 | % | 46.10 | % | ||||||||||
| FAD Payout Ratio (3) |
74.63 | % | 69.42 | % | 59.35 | % | 80.33 | % | 78.39 | % | ||||||||||
| Selected Items (5): |
||||||||||||||||||||
| Revenue |
$ | 625,228 | $ | 623,546 | $ | 665,985 | $ | 624,240 | $ | 629,884 | ||||||||||
| Partners’ share of revenue from consolidated joint ventures |
(69,391 | ) | (69,609 | ) | (73,667 | ) | (73,697 | ) | (83,117 | ) | ||||||||||
| BXP’s share of revenue from unconsolidated joint ventures |
25,271 | 18,825 | 18,447 | 18,672 | 18,745 | |||||||||||||||
|
|
|
|
|
|
|
|
|
|
|
|||||||||||
| BXP’s Share of Combined revenue |
$ | 581,108 | $ | 572,762 | $ | 610,765 | $ | 569,215 | $ | 565,512 | ||||||||||
| Straight-line rent |
$ | 11,107 | $ | (6,503 | )(6) | $ | 14,424 | $ | 19,623 | $ | 15,992 | |||||||||
| Partners’ share of straight-line rent from consolidated joint ventures |
(707 | ) | (718 | )(6) | (1,696 | ) | (2,605 | ) | (3,204 | ) | ||||||||||
| BXP’s share of straight-line rent from unconsolidated joint ventures |
3,285 | 1,787 | 1,064 | 1,131 | (158 | ) | ||||||||||||||
|
|
|
|
|
|
|
|
|
|
|
|||||||||||
| BXP’s Share of Combined straight-line rent |
$ | 13,685 | $ | (5,434 | ) | $ | 13,792 | $ | 18,149 | $ | 12,630 | |||||||||
| Fair value lease revenue (7) |
$ | 6,547 | $ | 8,808 | $ | 8,186 | $ | 7,450 | $ | 8,838 | ||||||||||
| Partners’ share of fair value lease revenue from consolidated joint ventures (7) |
(2,084 | ) | (3,031 | ) | (2,810 | ) | (2,483 | ) | (2,889 | ) | ||||||||||
| BXP’s share of fair value lease revenue from unconsolidated joint ventures (7) |
511 | (1 | ) | (1 | ) | (1 | ) | (12 | ) | |||||||||||
|
|
|
|
|
|
|
|
|
|
|
|||||||||||
| BXP’s Share of Combined fair value lease revenue |
$ | 4,974 | $ | 5,776 | $ | 5,375 | $ | 4,966 | $ | 5,937 | ||||||||||
| Lease termination fees (8) |
$ | (170 | ) | $ | 7,654 | $ | 51,306 | $ | 7,701 | $ | 9,589 | |||||||||
| Partners’ share of lease termination fees from consolidated joint ventures |
421 | (44 | ) | (1,852 | ) | (2,113 | ) | (1,829 | ) | |||||||||||
| BXP’s share of lease termination fees from unconsolidated joint ventures |
8 | 4 | (9 | ) | 17 | — | ||||||||||||||
|
|
|
|
|
|
|
|
|
|
|
|||||||||||
| BXP’s Share of Combined lease termination fees |
$ | 259 | $ | 7,614 | $ | 49,445 | $ | 5,605 | $ | 7,760 | ||||||||||
| Fair value interest adjustment |
$ | 10,378 | $ | 11,272 | $ | 12,321 | $ | 13,076 | $ | 13,204 | ||||||||||
| Partners’ share of fair value interest adjustment from consolidated joint ventures |
(4,569 | ) | (4,540 | ) | (4,511 | ) | (4,483 | ) | (5,142 | ) | ||||||||||
| BXP’s share of fair value interest adjustment from unconsolidated joint ventures |
— | — | — | — | — | |||||||||||||||
|
|
|
|
|
|
|
|
|
|
|
|||||||||||
| BXP’s Share of Combined fair value interest adjustment |
$ | 5,809 | $ | 6,732 | $ | 7,810 | $ | 8,593 | $ | 8,062 | ||||||||||
| Ground rent expense (9) |
$ | 3,471 | $ | 3,469 | $ | 3,471 | $ | 3,463 | $ | 3,534 | ||||||||||
| Losses from early extinguishments of debt |
$ | (371 | ) | $ | — | $ | — | $ | (22,040 | ) | $ | — | ||||||||
| Capitalized interest |
$ | 9,788 | $ | 9,899 | $ | 9,269 | $ | 8,298 | $ | 9,100 | ||||||||||
| Capitalized wages |
$ | 4,155 | $ | 4,467 | $ | 4,344 | $ | 4,130 | $ | 4,111 | ||||||||||
| Operating margins [(rental revenue—rental expense)/rental revenue] |
62.3 | % | 64.0 | % | 66.3 | % | 64.3 | % | 64.0 | % | ||||||||||
| Income from unconsolidated joint ventures |
$ | 1,464 | $ | 2,234 | $ | 1,791 | $ | 2,211 | $ | 2,647 | ||||||||||
| BXP’s share of funds from operations (FFO) from unconsolidated joint ventures |
$ | 10,592 | (10) | $ | 6,852 | $ | 6,287 | $ | 6,205 | $ | 6,455 | |||||||||
| Net income attributable to noncontrolling interests in property partnerships |
$ | (17,225 | ) | $ | 6,814 | $ | 10,464 | $ | 10,143 | $ | 115,240 | |||||||||
| FFO attributable to noncontrolling interests in property partnerships |
$ | 23,682 | (11) | $ | 26,183 | $ | 30,019 | $ | 30,828 | $ | 35,527 | |||||||||
| Income before gains on sales of real estate |
$ | 58,521 | $ | 117,357 | $ | 148,599 | $ | 85,406 | $ | 123,792 | ||||||||||
| (1) | For the Company’s definitions and related disclosures, see pages 47-48. |
| (2) | For the three months ended December 31, 2015, dividends per common share includes the $1.25 per common share special dividend paid on January 28, 2016 to shareholders of record as of the close of business on December 31, 2015. |
| (3) | FFO Payout Ratio equals dividends per common share (excluding any special dividends) divided by FFO per share-diluted. For a quantitative reconciliation of FFO, see page 11. FAD Payout Ratio equals distributions to common shareholders and unitholders (excluding any special distributions) divided by FAD. For a quantitative reconciliation of FAD, see page 12. |
| (4) | For a quantitative reconciliation and related disclosures, see page 13. |
| (5) | Partners’ share and BXP’s share of line items below are based upon percentage ownership interests in the applicable joint ventures. |
| (6) | During the three months ended June 30, 2016, the Company recognized an aggregate of approximately $15.4 million of lump sum rental income amounts from three tenants that will be straight-lined through each tenant’s lease term. These amounts are in addition to the tenants’ monthly rental payments. |
| (7) | Represents the net adjustment for above- and below-market leases that are being amortized over the terms of the respective leases in place at the property acquisition dates. |
| (8) | For the three months ended March 31, 2016, includes approximately $45.0 million received from a tenant that terminated its lease for approximately 85,000 square feet at the Company’s 250 West 55th Street property located in New York City. For the three months ended June 30, 2016 and September 30, 2015, includes distributions received by the Company from its unsecured creditor claim against Lehman Brothers, Inc. of approximately $1.4 million and $3.6 million, respectively. |
| (9) | Includes non-cash straight-line adjustments to ground rent. See page 13 for the straight-line adjustments to the ground rent expense. |
| (10) | For additional detail, see page 18. |
| (11) | For additional detail, see page 20. |
7
THIRD QUARTER 2016
FINANCIAL HIGHLIGHTS (continued)
(unaudited and in thousands, except ratios and per share amounts)
This section includes non-GAAP financial measures, which are accompanied by what the Company considers the most directly comparable financial measures calculated and presented in accordance with GAAP. Quantitative reconciliations of the differences between the most directly comparable GAAP financial measures and the non-GAAP financial measures presented are shown on pages 11-13. Definitions of the non-GAAP financial measures the Company presents and statements of the reasons why management believes the non-GAAP measures provide useful information to investors about the Company’s financial condition and results of operations can be found on pages 47-48.
| 30-Sep-16 | 30-Jun-16 | 31-Mar-16 | 31-Dec-15 | 30-Sep-15 | ||||||||||||||||
| Balance Sheet Items: |
|
|||||||||||||||||||
| Above-market rents (included within Prepaid Expenses and Other Assets) |
$ | 40,346 | $ | 43,780 | $ | 47,388 | $ | 51,397 | $ | 55,434 | ||||||||||
| Below-market rents (included within Other Liabilities) |
$ | 142,595 | $ | 152,576 | $ | 160,504 | $ | 172,670 | $ | 184,154 | ||||||||||
| Accrued ground rent expense, net (included within Prepaid Expenses and Other Assets and Other Liabilities) |
$ | 41,718 | $ | 40,687 | $ | 39,752 | $ | 38,765 | $ | 42,962 | ||||||||||
| Outside members’ notes payable (1) |
$ | 180,000 | $ | 180,000 | $ | 180,000 | $ | 180,000 | $ | 180,000 | ||||||||||
| Accrued interest payable on outside members’ notes payable (included within Accrued Interest Payable) (1) |
$ | 144,825 | $ | 136,131 | $ | 127,670 | $ | 119,436 | $ | 111,422 | ||||||||||
| Capitalization: |
||||||||||||||||||||
| Common Stock Price @ Quarter End |
$ | 136.29 | $ | 131.90 | $ | 127.08 | $ | 127.54 | $ | 118.40 | ||||||||||
| Equity Value @ Quarter End |
$ | 23,611,215 | $ | 22,856,727 | $ | 22,027,642 | $ | 22,074,258 | $ | 20,506,666 | ||||||||||
| Consolidated Debt |
$ | 9,808,922 | $ | 9,934,084 | $ | 10,160,366 | $ | 9,188,543 | $ | 9,879,187 | ||||||||||
| BXP’s share of Unconsolidated Joint Venture Debt (2) |
350,225 | 350,831 | 351,394 | 351,926 | 351,340 | |||||||||||||||
|
|
|
|
|
|
|
|
|
|
|
|||||||||||
| Combined Debt (3)(4) |
10,159,147 | 10,284,915 | 10,511,760 | 9,540,469 | 10,230,527 | |||||||||||||||
| Less: |
||||||||||||||||||||
| Partners’ share of Consolidated Debt (5) |
1,150,462 | 1,156,399 | 1,162,292 | 1,168,142 | 1,173,988 | |||||||||||||||
|
|
|
|
|
|
|
|
|
|
|
|||||||||||
| BXP’s Share of Combined Debt (3)(4) |
$ | 9,008,685 | $ | 9,128,516 | $ | 9,349,468 | $ | 8,372,327 | $ | 9,056,539 | ||||||||||
|
|
|
|
|
|
|
|
|
|
|
|||||||||||
| Consolidated Market Capitalization |
$ | 33,420,137 | $ | 32,790,811 | $ | 32,188,008 | $ | 31,262,801 | $ | 30,385,853 | ||||||||||
| Consolidated Debt/Consolidated Market Capitalization (3) |
29.35 | % | 30.30 | % | 31.57 | % | 29.39 | % | 32.51 | % | ||||||||||
| BXP’s Share of Combined Market Capitalization (3)(4) |
$ | 32,619,900 | (6) | $ | 31,985,243 | $ | 31,377,110 | $ | 30,446,585 | $ | 29,563,205 | |||||||||
| BXP’s Share of Combined Debt/BXP’s Share of Combined Market Capitalization (3)(4) |
27.62 | %(6) | 28.54 | % | 29.80 | % | 27.50 | % | 30.63 | % | ||||||||||
| (1) | Amount is allocated to the Company’s 767 Fifth Avenue (The GM Building) partners through noncontrolling interests in property partnerships. |
| (2) | Amount is calculated based on the Company’s percentage ownership interest in the unconsolidated joint venture entities. For additional detail, see page 17. |
| (3) | For the Company’s definitions, see pages 47-48. |
| (4) | The Company notes that the ownership percentages used in calculating “Combined” amounts and “BXP’s Share” of any Combined amounts may not completely and accurately depict the legal and economic implications of holding an interest in a consolidated or unconsolidated joint venture. For additional detail, see page 47. |
| Management also uses these measures to evaluate regional decisions about resource allocations. |
| (5) | Amount is calculated based on the outside partners’ percentage ownership interest in the consolidated joint venture entities. For additional detail, see page 19. |
| (6) | For additional detail, see page 14. |
8
THIRD QUARTER 2016
CONSOLIDATED BALANCE SHEETS
(unaudited and in thousands)
| 30-Sep-16 | 30-Jun-16 | 31-Mar-16 | 31-Dec-15 | 30-Sep-15 | ||||||||||||||||
| ASSETS |
||||||||||||||||||||
| Real estate |
$ | 18,704,856 | $ | 18,690,403 | $ | 18,424,542 | $ | 18,465,405 | $ | 18,412,086 | ||||||||||
| Construction in progress (1) |
954,013 | 865,359 | 857,578 | 763,935 | 725,601 | |||||||||||||||
| Land held for future development (2) |
243,887 | 241,106 | 256,952 | 252,195 | 264,598 | |||||||||||||||
| Less accumulated depreciation |
(4,113,553 | ) | (4,056,716 | ) | (3,969,648 | ) | (3,925,894 | ) | (3,833,277 | ) | ||||||||||
|
|
|
|
|
|
|
|
|
|
|
|||||||||||
| Total real estate |
15,789,203 | 15,740,152 | 15,569,424 | 15,555,641 | 15,569,008 | |||||||||||||||
| Cash and cash equivalents |
419,323 | 1,180,044 | 1,605,678 | 723,718 | 1,387,007 | |||||||||||||||
| Cash held in escrows |
63,980 | 65,654 | 71,349 | 73,790 | 90,379 | |||||||||||||||
| Investments in securities |
23,022 | 21,775 | 21,077 | 20,380 | 19,645 | |||||||||||||||
| Tenant and other receivables, net |
76,258 | 84,861 | 73,759 | 97,865 | 66,446 | |||||||||||||||
| Accrued rental income, net |
785,569 | 776,816 | 767,864 | 754,883 | 737,145 | |||||||||||||||
| Deferred charges, net (3) |
680,192 | 697,823 | 693,976 | 704,867 | 719,019 | |||||||||||||||
| Prepaid expenses and other assets |
176,693 | 144,222 | 136,799 | 185,118 | 143,476 | |||||||||||||||
| Investments in unconsolidated joint ventures |
775,659 | 252,618 | 235,904 | 235,224 | 217,529 | |||||||||||||||
|
|
|
|
|
|
|
|
|
|
|
|||||||||||
| Total assets |
$ | 18,789,899 | $ | 18,963,965 | $ | 19,175,830 | $ | 18,351,486 | $ | 18,949,654 | ||||||||||
|
|
|
|
|
|
|
|
|
|
|
|||||||||||
| LIABILITIES AND EQUITY |
||||||||||||||||||||
| Liabilities: |
||||||||||||||||||||
| Mortgage notes payable, net (3) |
$ | 2,077,707 | $ | 3,189,013 | $ | 3,416,622 | $ | 3,435,242 | $ | 4,127,007 | ||||||||||
| Unsecured senior notes, net (3) |
7,243,767 | 6,257,274 | 6,255,602 | 5,264,819 | 5,263,363 | |||||||||||||||
| Unsecured line of credit |
— | — | — | — | — | |||||||||||||||
| Mezzanine notes payable |
307,448 | 307,797 | 308,142 | 308,482 | 308,817 | |||||||||||||||
| Outside members’ notes payable |
180,000 | 180,000 | 180,000 | 180,000 | 180,000 | |||||||||||||||
| Accounts payable and accrued expenses |
312,979 | 287,464 | 252,727 | 274,709 | 245,200 | |||||||||||||||
| Dividends and distributions payable |
113,038 | 113,071 | 113,079 | 327,320 | 112,912 | |||||||||||||||
| Accrued interest payable |
234,628 | 222,175 | 221,578 | 190,386 | 200,916 | |||||||||||||||
| Other liabilities |
461,079 | 508,952 | 498,290 | 483,601 | 448,680 | |||||||||||||||
|
|
|
|
|
|
|
|
|
|
|
|||||||||||
| Total liabilities |
10,930,646 | 11,065,746 | 11,246,040 | 10,464,559 | 10,886,895 | |||||||||||||||
|
|
|
|
|
|
|
|
|
|
|
|||||||||||
| Commitments and contingencies |
— | — | — | — | — | |||||||||||||||
|
|
|
|
|
|
|
|
|
|
|
|||||||||||
| Equity: |
||||||||||||||||||||
| Stockholders’ equity attributable to Boston Properties, Inc.: |
||||||||||||||||||||
| Excess stock, $0.01 par value, 150,000,000 shares authorized, none issued or outstanding |
— | — | — | — | — | |||||||||||||||
| Preferred stock, $0.01 par value, 50,000,000 shares authorized; 5.25% Series B cumulative redeemable preferred stock, $0.01 par value, liquidation preference $2,500 per share, 92,000 shares authorized, 80,000 shares issued and outstanding |
200,000 | 200,000 | 200,000 | 200,000 | 200,000 | |||||||||||||||
| Common stock, $0.01 par value, 250,000,000 shares authorized, 153,773,012, 153,674,930, 153,604,966, 153,579,966 and 153,574,600 outstanding, respectively |
1,538 | 1,537 | 1,536 | 1,536 | 1,536 | |||||||||||||||
| Additional paid-in capital |
6,326,580 | 6,316,191 | 6,306,723 | 6,305,687 | 6,300,780 | |||||||||||||||
| Dividends in excess of earnings |
(725,522 | ) | (702,361 | ) | (699,048 | ) | (780,952 | ) | (627,054 | ) | ||||||||||
| Treasury common stock, at cost |
(2,722 | ) | (2,722 | ) | (2,722 | ) | (2,722 | ) | (2,722 | ) | ||||||||||
| Accumulated other comprehensive loss |
(73,943 | ) | (79,748 | ) | (56,706 | ) | (14,114 | ) | (20,625 | ) | ||||||||||
|
|
|
|
|
|
|
|
|
|
|
|||||||||||
| Total stockholders’ equity attributable to Boston Properties, Inc. |
5,725,931 | 5,732,897 | 5,749,783 | 5,709,435 | 5,851,915 | |||||||||||||||
| Noncontrolling interests: |
||||||||||||||||||||
| Common units of the Operating Partnership |
608,280 | 612,385 | 616,095 | 603,092 | 620,036 | |||||||||||||||
| Property partnerships |
1,525,042 | 1,552,937 | 1,563,912 | 1,574,400 | 1,590,808 | |||||||||||||||
|
|
|
|
|
|
|
|
|
|
|
|||||||||||
| Total equity |
7,859,253 | 7,898,219 | 7,929,790 | 7,886,927 | 8,062,759 | |||||||||||||||
|
|
|
|
|
|
|
|
|
|
|
|||||||||||
| Total liabilities and equity |
$ | 18,789,899 | $ | 18,963,965 | $ | 19,175,830 | $ | 18,351,486 | $ | 18,949,654 | ||||||||||
|
|
|
|
|
|
|
|
|
|
|
|||||||||||
| (1) | Represents the portion of the Company’s consolidated development projects that qualifies for interest capitalization. Such portion generally excludes intangible assets. |
| (2) | Includes land held for future development and pre-development costs. |
| (3) | On January 1, 2016, the Company adopted Accounting Standards Update 2015-03, “Simplifying the Presentation of Debt Issuance Costs,” which requires that debt issuance costs related to a recognized debt liability be presented in the balance sheet as a direct deduction from the carrying amount of that debt liability, consistent with debt discounts. The Company retrospectively adopted the guidance resulting in the presentation of deferred financing costs, net (previously included within Deferred Charges, Net) as a reduction to Mortgage Notes Payable, Net and Unsecured Senior Notes, Net for all periods presented. The recognition and measurement guidance for debt issuance costs was not affected. |
9
THIRD QUARTER 2016
CONSOLIDATED INCOME STATEMENTS
(unaudited and in thousands, except for per share amounts)
| Three Months Ended | ||||||||||||||||||||
| 30-Sep-16 | 30-Jun-16 | 31-Mar-16 | 31-Dec-15 | 30-Sep-15 | ||||||||||||||||
| Revenue |
||||||||||||||||||||
| Rental |
||||||||||||||||||||
| Base rent |
$ | 489,312 | $ | 493,386 | $ | 536,128 | $ | 493,141 | $ | 494,300 | ||||||||||
| Recoveries from tenants |
92,560 | 85,706 | 89,586 | 88,576 | 91,544 | |||||||||||||||
| Parking and other |
24,638 | 26,113 | 24,825 | 25,132 | 25,509 | |||||||||||||||
|
|
|
|
|
|
|
|
|
|
|
|||||||||||
| Total rental revenue |
606,510 | 605,205 | 650,539 | 606,849 | 611,353 | |||||||||||||||
| Hotel revenue |
12,354 | 12,808 | 8,757 | 10,939 | 12,619 | |||||||||||||||
| Development and management services |
6,364 | 5,533 | 6,689 | 6,452 | 5,912 | |||||||||||||||
|
|
|
|
|
|
|
|
|
|
|
|||||||||||
| Total revenue |
625,228 | 623,546 | 665,985 | 624,240 | 629,884 | |||||||||||||||
|
|
|
|
|
|
|
|
|
|
|
|||||||||||
| Expenses |
||||||||||||||||||||
| Operating |
117,728 | 113,212 | 114,467 | 112,846 | 113,962 | |||||||||||||||
| Real estate taxes |
109,480 | 104,726 | 104,705 | 103,796 | 105,834 | |||||||||||||||
| Demolition costs |
1,352 | — | — | — | — | |||||||||||||||
| Hotel operating |
8,118 | 7,978 | 7,634 | 7,888 | 8,125 | |||||||||||||||
| General and administrative (1) |
25,165 | 25,418 | 29,353 | 24,300 | 20,944 | |||||||||||||||
| Transaction costs |
249 | 913 | 25 | 470 | 254 | |||||||||||||||
| Impairment loss |
1,783 | — | — | — | — | |||||||||||||||
| Depreciation and amortization |
203,748 | (2) | 153,175 | 159,448 | 164,460 | 153,015 | ||||||||||||||
|
|
|
|
|
|
|
|
|
|
|
|||||||||||
| Total expenses |
467,623 | 405,422 | 415,632 | 413,760 | 402,134 | |||||||||||||||
|
|
|
|
|
|
|
|
|
|
|
|||||||||||
| Operating income |
157,605 | 218,124 | 250,353 | 210,480 | 227,750 | |||||||||||||||
| Other income (expense) |
||||||||||||||||||||
| Income from unconsolidated joint ventures |
1,464 | 2,234 | 1,791 | 2,211 | 2,647 | |||||||||||||||
| Interest and other income |
3,628 | 1,524 | 1,505 | 440 | 3,637 | |||||||||||||||
| Gains (losses) from investments in securities (1) |
976 | 478 | 259 | 493 | (1,515 | ) | ||||||||||||||
| Interest expense (3) |
(104,641 | ) | (105,003 | ) | (105,309 | ) | (106,178 | ) | (108,727 | ) | ||||||||||
| Losses from early extinguishments of debt |
(371 | ) | — | — | (22,040 | ) | — | |||||||||||||
| Losses from interest rate contracts |
(140 | ) | — | — | — | — | ||||||||||||||
|
|
|
|
|
|
|
|
|
|
|
|||||||||||
| Income before gains on sales of real estate |
58,521 | 117,357 | 148,599 | 85,406 | 123,792 | |||||||||||||||
| Gains on sales of real estate (4) |
12,983 | — | 67,623 | 81,332 | 199,479 | |||||||||||||||
|
|
|
|
|
|
|
|
|
|
|
|||||||||||
| Net income |
71,504 | 117,357 | 216,222 | 166,738 | 323,271 | |||||||||||||||
| Net income attributable to noncontrolling interests |
||||||||||||||||||||
| Noncontrolling interest in property partnerships |
17,225 | (6,814 | ) | (10,464 | ) | (10,143 | ) | (115,240 | )(5) | |||||||||||
| Noncontrolling interest - common units of the Operating Partnership (6) |
(9,387 | ) | (11,357 | ) | (21,393 | ) | (16,098 | ) | (21,302 | ) | ||||||||||
|
|
|
|
|
|
|
|
|
|
|
|||||||||||
| Net income attributable to Boston Properties, Inc. |
79,342 | 99,186 | 184,365 | 140,497 | 186,729 | |||||||||||||||
| Preferred dividends |
(2,589 | ) | (2,589 | ) | (2,618 | ) | (2,646 | ) | (2,647 | ) | ||||||||||
|
|
|
|
|
|
|
|
|
|
|
|||||||||||
| Net income attributable to Boston Properties, Inc. common shareholders |
$ | 76,753 | $ | 96,597 | $ | 181,747 | $ | 137,851 | $ | 184,082 | ||||||||||
|
|
|
|
|
|
|
|
|
|
|
|||||||||||
| INCOME PER SHARE OF COMMON STOCK (EPS) |
||||||||||||||||||||
| Net income attributable to Boston Properties, Inc. per share - basic |
$ | 0.50 | $ | 0.63 | $ | 1.18 | $ | 0.90 | $ | 1.20 | ||||||||||
|
|
|
|
|
|
|
|
|
|
|
|||||||||||
| Net income attributable to Boston Properties, Inc. per share - diluted |
$ | 0.50 | $ | 0.63 | $ | 1.18 | $ | 0.90 | $ | 1.20 | ||||||||||
|
|
|
|
|
|
|
|
|
|
|
|||||||||||
| (1) | General and administrative expense includes $(976), $(478), $(259), $(493) and $1,515 and gains (losses) from investments in securities include $976, $478, $259, $493 and $(1,515) for the three months ended September 30, 2016, June 30, 2016, March 31, 2016, December 31, 2015 and September 30, 2015, respectively, related to the Company’s deferred compensation plan. |
| (2) | For the three months ended September 30, 2016, includes approximately $50.8 million (including approximately $3.2 million related to an allocation of corporate real estate step-up assets) of accelerated depreciation expense related to the redevelopment of the Company’s 601 Lexington Avenue property. |
| (3) | For the three months ended September 30, 2016, June 30, 2016, March 31, 2016, December 31, 2015 and September 30, 2015, interest expense includes $8,694, $8,461, $8,234, $8,014 and $7,800, respectively, consisting of the interest expense on the partner loans for the 767 Fifth Avenue (The GM Building) consolidated joint venture, which amount is allocated to the partners within noncontrolling interests in property partnerships. The Company’s share of the interest expense on its loan to the joint venture eliminates in consolidation. |
| (4) | See page 44 for additional information. |
| (5) | For the three months ended September 30, 2015, noncontrolling interest in property partnerships includes approximately $101.1 million consisting of the allocation of the gain on sale of real estate to the outside partners in the consolidated entity that sold 505 9th Street, N.W. located in Washington, DC. |
| (6) | Equals noncontrolling interest—common units of the Operating Partnership’s share of 10.28%, 10.33%, 10.32%, 10.26% and 10.26% of income before net income attributable to noncontrolling interests in Operating Partnership after deduction for preferred distributions for the three months ended September 30, 2016, June 30, 2016, March 31, 2016, December 31, 2015 and September 30, 2015, respectively. |
10
THIRD QUARTER 2016
FUNDS FROM OPERATIONS (FFO)
(unaudited and in thousands, except for per share amounts)
| Three Months Ended | ||||||||||||||||||||
| 30-Sep-16 | 30-Jun-16 | 31-Mar-16 | 31-Dec-15 | 30-Sep-15 | ||||||||||||||||
| Net income attributable to Boston Properties, Inc. common shareholders |
$ | 76,753 | $ | 96,597 | $ | 181,747 | $ | 137,851 | $ | 184,082 | ||||||||||
| Add: |
||||||||||||||||||||
| Preferred dividends |
2,589 | 2,589 | 2,618 | 2,646 | 2,647 | |||||||||||||||
| Noncontrolling interest - common units of the Operating Partnership |
9,387 | 11,357 | 21,393 | 16,098 | 21,302 | |||||||||||||||
| Noncontrolling interests in property partnerships |
(17,225 | ) | 6,814 | 10,464 | 10,143 | 115,240 | ||||||||||||||
| Less: |
||||||||||||||||||||
| Gains on sales of real estate |
12,983 | — | 67,623 | 81,332 | 199,479 | |||||||||||||||
|
|
|
|
|
|
|
|
|
|
|
|||||||||||
| Income before gains on sales of real estate |
58,521 | 117,357 | 148,599 | 85,406 | 123,792 | |||||||||||||||
| Add: |
||||||||||||||||||||
| Depreciation and amortization |
203,748 | 153,175 | 159,448 | 164,460 | 153,015 | |||||||||||||||
| Noncontrolling interests in property partnerships’ share of depreciation and amortization |
(40,907 | ) | (19,369 | ) | (19,555 | ) | (20,685 | ) | (21,405 | ) | ||||||||||
| BXP’s share of depreciation and amortization from unconsolidated joint ventures |
9,128 | 4,618 | 4,496 | 3,994 | 3,808 | |||||||||||||||
| Corporate-related depreciation and amortization |
(393 | ) | (362 | ) | (364 | ) | (486 | ) | (334 | ) | ||||||||||
| Less: |
||||||||||||||||||||
| Noncontrolling interests in property partnerships |
(17,225 | ) | 6,814 | 10,464 | 10,143 | 14,122 | (1) | |||||||||||||
| Preferred dividends |
2,589 | 2,589 | 2,618 | 2,646 | 2,647 | |||||||||||||||
|
|
|
|
|
|
|
|
|
|
|
|||||||||||
| FFO attributable to the Operating Partnership common unitholders (including Boston Properties, Inc.) (“Basic FFO”) |
244,733 | 246,016 | 279,542 | 219,900 | 242,107 | |||||||||||||||
| Less: |
||||||||||||||||||||
| Noncontrolling interest - common units of the Operating Partnership’s share of FFO |
25,169 | 25,421 | 28,854 | 22,561 | 24,846 | |||||||||||||||
|
|
|
|
|
|
|
|
|
|
|
|||||||||||
| FFO attributable to Boston Properties, Inc. common shareholders |
$ | 219,564 | $ | 220,595 | $ | 250,688 | $ | 197,339 | $ | 217,261 | ||||||||||
|
|
|
|
|
|
|
|
|
|
|
|||||||||||
| Boston Properties, Inc.’s percentage share of FFO - basic |
89.72 | % | 89.67 | % | 89.68 | % | 89.74 | % | 89.74 | % | ||||||||||
|
|
|
|
|
|
|
|
|
|
|
|||||||||||
| FFO per share - basic |
$ | 1.43 | $ | 1.44 | $ | 1.63 | $ | 1.28 | $ | 1.41 | ||||||||||
|
|
|
|
|
|
|
|
|
|
|
|||||||||||
| Weighted average shares outstanding - basic |
153,754 | 153,662 | 153,626 | 153,602 | 153,595 | |||||||||||||||
|
|
|
|
|
|
|
|
|
|
|
|||||||||||
| FFO per share - diluted |
$ | 1.42 | $ | 1.43 | $ | 1.63 | $ | 1.28 | $ | 1.41 | ||||||||||
|
|
|
|
|
|
|
|
|
|
|
|||||||||||
| Weighted average shares outstanding - diluted |
154,136 | 153,860 | 153,917 | 153,897 | 153,786 | |||||||||||||||
|
|
|
|
|
|
|
|
|
|
|
|||||||||||
| Reconciliation to Diluted FFO: |
||||||||||||||||||||
| Basic FFO |
$ | 244,733 | $ | 246,016 | $ | 279,542 | $ | 219,900 | $ | 242,107 | ||||||||||
| Add: |
||||||||||||||||||||
| Effect of dilutive securities - stock-based compensation |
— | — | — | — | — | |||||||||||||||
|
|
|
|
|
|
|
|
|
|
|
|||||||||||
| Diluted FFO |
244,733 | 246,016 | 279,542 | 219,900 | 242,107 | |||||||||||||||
| Less: |
||||||||||||||||||||
| Noncontrolling interest - common units of the Operating Partnership’s share of diluted FFO |
25,113 | 25,391 | 28,805 | 22,522 | 24,818 | |||||||||||||||
|
|
|
|
|
|
|
|
|
|
|
|||||||||||
| Boston Properties, Inc.’s share of diluted FFO |
$ | 219,620 | $ | 220,625 | $ | 250,737 | $ | 197,378 | $ | 217,289 | ||||||||||
|
|
|
|
|
|
|
|
|
|
|
|||||||||||
| Reconciliation of Shares/Units for Diluted FFO: |
||||||||||||||||||||
| Shares/units for Basic FFO |
171,379 | 171,370 | 171,309 | 171,162 | 171,160 | |||||||||||||||
| Add: |
||||||||||||||||||||
| Effect of dilutive securities - stock-based compensation (shares/units) |
382 | 198 | 291 | 295 | 191 | |||||||||||||||
|
|
|
|
|
|
|
|
|
|
|
|||||||||||
| Shares/units for Diluted FFO |
171,761 | 171,568 | 171,600 | 171,457 | 171,351 | |||||||||||||||
| Less: |
||||||||||||||||||||
| Noncontrolling interest - common units of the Operating Partnership’s share of diluted FFO (shares/units) |
17,625 | 17,708 | 17,683 | 17,560 | 17,565 | |||||||||||||||
|
|
|
|
|
|
|
|
|
|
|
|||||||||||
| Boston Properties, Inc.’s share of shares/units for diluted FFO |
154,136 | 153,860 | 153,917 | 153,897 | 153,786 | |||||||||||||||
|
|
|
|
|
|
|
|
|
|
|
|||||||||||
| Boston Properties, Inc.’s percentage share of FFO - diluted |
89.74 | % | 89.68 | % | 89.70 | % | 89.76 | % | 89.75 | % | ||||||||||
|
|
|
|
|
|
|
|
|
|
|
|||||||||||
| (1) | For the three months ended September 30, 2015, excludes the noncontrolling interests in property partnerships’ share of a gain on sale of real estate totaling approximately $101.1 million. |
11
THIRD QUARTER 2016
FUNDS AVAILABLE FOR DISTRIBUTION (FAD)
(in thousands, except for ratio amounts)
| Three Months Ended | ||||||||||||||||||||
| 30-Sep-16 | 30-Jun-16 | 31-Mar-16 | 31-Dec-15 | 30-Sep-15 | ||||||||||||||||
| Net income attributable to Boston Properties, Inc. common shareholders |
$ | 76,753 | $ | 96,597 | $ | 181,747 | $ | 137,851 | $ | 184,082 | ||||||||||
| Add: |
||||||||||||||||||||
| Preferred dividends |
2,589 | 2,589 | 2,618 | 2,646 | 2,647 | |||||||||||||||
| Noncontrolling interest - common units of the Operating Partnership |
9,387 | 11,357 | 21,393 | 16,098 | 21,302 | |||||||||||||||
| Noncontrolling interests in property partnerships |
(17,225 | ) | 6,814 | 10,464 | 10,143 | 115,240 | ||||||||||||||
| Less: |
||||||||||||||||||||
| Gains on sales of real estate |
12,983 | — | 67,623 | 81,332 | 199,479 | |||||||||||||||
|
|
|
|
|
|
|
|
|
|
|
|||||||||||
| Income before gains on sales of real estate |
58,521 | 117,357 | 148,599 | 85,406 | 123,792 | |||||||||||||||
| Add: |
||||||||||||||||||||
| Depreciation and amortization |
203,748 | 153,175 | 159,448 | 164,460 | 153,015 | |||||||||||||||
| Noncontrolling interests in property partnerships’ share of depreciation and amortization |
(40,907 | ) | (19,369 | ) | (19,555 | ) | (20,685 | ) | (21,405 | ) | ||||||||||
| BXP’s share of depreciation and amortization from unconsolidated joint ventures |
9,128 | 4,618 | 4,496 | 3,994 | 3,808 | |||||||||||||||
| Corporate-related depreciation and amortization |
(393 | ) | (362 | ) | (364 | ) | (486 | ) | (334 | ) | ||||||||||
| Less: |
||||||||||||||||||||
| Noncontrolling interests in property partnerships |
(17,225 | ) | 6,814 | 10,464 | 10,143 | 14,122 | (1) | |||||||||||||
| Preferred dividends |
2,589 | 2,589 | 2,618 | 2,646 | 2,647 | |||||||||||||||
|
|
|
|
|
|
|
|
|
|
|
|||||||||||
| Basic FFO |
244,733 | 246,016 | 279,542 | 219,900 | 242,107 | |||||||||||||||
| Straight-line rent |
(11,107 | ) | 6,503 | (2) | (14,424 | ) | (19,623 | ) | (15,992 | ) | ||||||||||
| Partners’ share of straight-line rent from consolidated joint ventures |
707 | 718 | (2) | 1,696 | 2,605 | 3,204 | ||||||||||||||
| BXP’s share of straight-line rent from unconsolidated joint ventures |
(3,285 | ) | (1,787 | ) | (1,064 | ) | (1,131 | ) | 158 | |||||||||||
| Lease transaction costs that qualify as rent inducements (3) |
861 | 2,200 | 5,305 | 1,939 | 1,911 | |||||||||||||||
| Partners’ share of lease transaction costs that qualify as rent inducements from consolidated joint ventures (3) |
— | — | (17 | ) | (18 | ) | (412 | ) | ||||||||||||
| BXP’s share of lease transaction costs that qualify as rent inducements from unconsolidated joint ventures (3) |
15 | — | — | 24 | 147 | |||||||||||||||
| Fair value lease revenue (4) |
(6,547 | ) | (8,808 | ) | (8,186 | ) | (7,450 | ) | (8,838 | ) | ||||||||||
| Partners’ share of fair value lease revenue from consolidated joint ventures (4) |
2,084 | 3,031 | 2,810 | 2,483 | 2,889 | |||||||||||||||
| BXP’s share of fair value lease revenue from unconsolidated joint ventures (4) |
(511 | ) | 1 | 1 | 1 | 12 | ||||||||||||||
| Non-cash losses (gains) from early extinguishments of debt |
371 | — | — | (3,604 | ) | — | ||||||||||||||
| Non-cash termination income adjustment (fair value lease amounts) |
— | 141 | 29 | 3 | (1,389 | ) | ||||||||||||||
| Partners’ share of non-cash termination income adjustment (fair value lease amounts) from consolidated joint ventures |
— | (41 | ) | — | — | 555 | ||||||||||||||
| BXP’s share of non-cash termination income adjustment (fair value lease amounts) from unconsolidated joint ventures |
— | — | — | — | — | |||||||||||||||
| Straight-line ground rent expense adjustment (5) |
1,031 | 935 | 987 | (3,983 | ) | 891 | ||||||||||||||
| Stock-based compensation |
7,643 | 7,578 | 10,069 | 6,358 | 6,345 | |||||||||||||||
| Non-real estate depreciation |
393 | 362 | 364 | 486 | 334 | |||||||||||||||
| Impairment loss |
1,783 | — | — | — | — | |||||||||||||||
| Fair value interest adjustment |
(10,378 | ) | (11,272 | ) | (12,321 | ) | (13,076 | ) | (13,204 | ) | ||||||||||
| Partners’ share of fair value interest adjustment from consolidated joint ventures |
4,569 | 4,540 | 4,511 | 4,483 | 5,142 | |||||||||||||||
| BXP’s share of fair value interest adjustment from unconsolidated joint ventures |
— | — | — | — | — | |||||||||||||||
| 2nd generation tenant improvements and leasing commissions |
(69,742 | ) | (74,719 | ) | (58,100 | ) | (34,206 | ) | (53,268 | ) | ||||||||||
| Partners’ share of 2nd generation tenant improvements and leasing commissions from consolidated joint ventures |
805 | 1,247 | 2,525 | 2,075 | 742 | |||||||||||||||
| BXP’s share of 2nd generation tenant improvements and leasing commissions from unconsolidated joint ventures |
(18 | ) | (8,616 | ) | (4,769 | ) | (207 | ) | (12,279 | ) | ||||||||||
| Unearned portion of capitalized fees |
250 | 2,697 | 1,191 | 451 | 616 | |||||||||||||||
| Maintenance capital expenditures (6) |
(11,889 | ) | (9,654 | ) | (21,961 | ) | (18,963 | ) | (17,148 | ) | ||||||||||
| Partners’ share of maintenance capital expenditures from consolidated joint ventures (6) |
377 | 422 | 573 | 2,134 | 886 | |||||||||||||||
| BXP’s share of maintenance capital expenditures from unconsolidated joint ventures (6) |
(283 | ) | (112 | ) | (197 | ) | (578 | ) | (672 | ) | ||||||||||
| Hotel improvements, equipment upgrades and replacements |
(2,137 | ) | (434 | ) | (360 | ) | (1,231 | ) | (436 | ) | ||||||||||
|
|
|
|
|
|
|
|
|
|
|
|||||||||||
| Funds available for distribution to common shareholders and common unitholders (FAD) (A) |
$ | 149,725 | $ | 160,948 | $ | 188,204 | $ | 138,872 | $ | 142,301 | ||||||||||
|
|
|
|
|
|
|
|
|
|
|
|||||||||||
| Distributions to common shareholders and unitholders (excluding any special distributions) (B) |
$ | 111,739 | $ | 111,737 | $ | 111,708 | $ | 111,556 | $ | 111,552 | ||||||||||
| FAD Payout Ratio (B÷A) |
74.63 | % | 69.42 | % | 59.35 | % | 80.33 | % | 78.39 | % | ||||||||||
|
|
|
|
|
|
|
|
|
|
|
|||||||||||
| (1) | For the three months ended September 30, 2015, excludes the noncontrolling interests in property partnerships’ share of a gain on sale of real estate totaling approximately $101.1 million. |
| (2) | During the three months ended June 30, 2016, the Company recognized an aggregate of approximately $15.4 million of lump sum rental income amounts from three tenants that will be straight-lined through each tenant’s lease term. These amounts are in addition to the tenants’ monthly rental payments. |
| (3) | Consists of lease transaction costs that qualify as rent inducements in accordance with GAAP. Lease transaction costs are generally included in 2nd generation tenant improvements and leasing commissions in the period the lease commences. |
| (4) | Represents the net adjustment for above- and below-market leases that are being amortized over the terms of the respective leases in place at the property acquisition dates. |
| (5) | For the three months ended September 30, 2016, June 30, 2016, March 31, 2016 and December 31, 2015, includes the straight-line impact of the Company’s 99-year ground and air rights lease related to the Company’s 200 Clarendon Street property’s adjacent 100 Clarendon Street garage and Back Bay Station concourse level. The Company has allocated contractual ground lease payments aggregating approximately $34.4 million, which it expects to incur over the next three years with no payments thereafter. The Company is recognizing these amounts on a straight-line basis over the 99-year term of the ground and air rights lease. For additional information, see page 7. |
| (6) | Maintenance capital expenditures do not include planned capital expenditures related to acquisitions and repositioning capital expenditures – see page 25 for additional detail. |
12
INTEREST COVERAGE RATIOS
(in thousands, except for ratio amounts)
| Three Months Ended | ||||||||||||||||||||
| 30-Sep-16 | 30-Jun-16 | 31-Mar-16 | 31-Dec-15 | 30-Sep-15 | ||||||||||||||||
| Net income attributable to Boston Properties, Inc. common shareholders |
$ | 76,753 | $ | 96,597 | $ | 181,747 | $ | 137,851 | $ | 184,082 | ||||||||||
| Add: |
||||||||||||||||||||
| Preferred dividends |
2,589 | 2,589 | 2,618 | 2,646 | 2,647 | |||||||||||||||
| Noncontrolling interest - common units of the Operating Partnership |
9,387 | 11,357 | 21,393 | 16,098 | 21,302 | |||||||||||||||
| Noncontrolling interests in property partnerships |
(17,225 | ) | 6,814 | 10,464 | 10,143 | 115,240 | ||||||||||||||
| Less: |
||||||||||||||||||||
| Gains on sales of real estate |
12,983 | — | 67,623 | 81,332 | 199,479 | |||||||||||||||
|
|
|
|
|
|
|
|
|
|
|
|||||||||||
| Income before gains on sales of real estate |
58,521 | 117,357 | 148,599 | 85,406 | 123,792 | |||||||||||||||
| Noncontrolling interests in property partnerships |
17,225 | (6,814 | ) | (10,464 | ) | (10,143 | ) | (14,122 | )(1) | |||||||||||
| Interest expense |
104,641 | 105,003 | 105,309 | 106,178 | 108,727 | |||||||||||||||
| Partners’ share of interest expense from consolidated joint ventures |
(17,460 | ) | (17,177 | ) | (16,988 | ) | (16,928 | ) | (18,339 | ) | ||||||||||
| BXP’s share of interest expense from unconsolidated joint ventures |
4,025 | 4,010 | 4,015 | 3,908 | 3,830 | |||||||||||||||
| Depreciation and amortization expense |
203,748 | 153,175 | 159,448 | 164,460 | 153,015 | |||||||||||||||
| Noncontrolling interests in property partnerships’ share of depreciation and amortization |
(40,907 | ) | (19,369 | ) | (19,555 | ) | (20,685 | ) | (21,405 | ) | ||||||||||
| BXP’s share of depreciation and amortization from unconsolidated joint ventures |
9,128 | 4,618 | 4,496 | 3,994 | 3,808 | |||||||||||||||
| Losses from early extinguishments of debt |
371 | — | — | 22,040 | — | |||||||||||||||
| Impairment loss |
1,783 | — | — | — | — | |||||||||||||||
| Non-cash termination income adjustment (fair value lease amounts) |
— | 141 | 29 | 3 | (1,389 | ) | ||||||||||||||
| Partners’ share of non-cash termination income adjustment (fair value lease amounts) from consolidated joint ventures |
— | (41 | ) | — | — | 555 | ||||||||||||||
| BXP’s share of non-cash termination income adjustment (fair value lease amounts) from unconsolidated joint ventures |
— | — | — | — | — | |||||||||||||||
| Stock-based compensation |
7,643 | 7,578 | 10,069 | 6,358 | 6,345 | |||||||||||||||
| Straight-line ground rent expense adjustment (2) |
1,031 | 935 | 987 | (3,983 | ) | 891 | ||||||||||||||
| Straight-line rent |
(11,107 | ) | 6,503 | (3) | (14,424 | ) | (19,623 | ) | (15,992 | ) | ||||||||||
| Partners’ share of straight-line rent from consolidated joint ventures |
707 | 718 | (3) | 1,696 | 2,605 | 3,204 | ||||||||||||||
| BXP’s share of straight-line rent from unconsolidated joint ventures |
(3,285 | ) | (1,787 | ) | (1,064 | ) | (1,131 | ) | 158 | |||||||||||
| Lease transaction costs that qualify as rent inducements (4) |
861 | 2,200 | 5,305 | 1,939 | 1,911 | |||||||||||||||
| Partners’ share of lease transaction costs that qualify as rent inducements from consolidated joint ventures (4) |
— | — | (17 | ) | (18 | ) | (412 | ) | ||||||||||||
| BXP’s share of lease transaction costs that qualify as rent inducements from unconsolidated joint ventures (4) |
15 | — | — | 24 | 147 | |||||||||||||||
| Fair value lease revenue (5) |
(6,547 | ) | (8,808 | ) | (8,186 | ) | (7,450 | ) | (8,838 | ) | ||||||||||
| Partners’ share of fair value lease revenue from consolidated joint ventures (5) |
2,084 | 3,031 | 2,810 | 2,483 | 2,889 | |||||||||||||||
| BXP’s share of fair value lease revenue from unconsolidated joint ventures (5) |
(511 | ) | 1 | 1 | 1 | 12 | ||||||||||||||
|
|
|
|
|
|
|
|
|
|
|
|||||||||||
| Subtotal (A) |
$ | 331,966 | $ | 351,274 | $ | 372,066 | $ | 319,438 | $ | 328,787 | ||||||||||
|
|
|
|
|
|
|
|
|
|
|
|||||||||||
| Divided by: |
||||||||||||||||||||
| Interest expense |
$ | 104,641 | $ | 105,003 | $ | 105,309 | $ | 106,178 | $ | 108,727 | ||||||||||
| Partners’ share of interest expense from consolidated joint ventures |
(17,460 | ) | (17,177 | ) | (16,988 | ) | (16,928 | ) | (18,339 | ) | ||||||||||
| BXP’s share of interest expense from unconsolidated joint ventures |
4,025 | 4,010 | 4,015 | 3,908 | 3,830 | |||||||||||||||
| Fair value interest adjustment |
10,378 | 11,272 | 12,321 | 13,076 | 13,204 | |||||||||||||||
| Partners’ share of fair value interest adjustment from consolidated joint ventures |
(4,569 | ) | (4,540 | ) | (4,511 | ) | (4,483 | ) | (5,142 | ) | ||||||||||
| BXP’s share of fair value interest adjustment from unconsolidated joint ventures |
— | — | — | — | — | |||||||||||||||
| Amortization of financing costs |
(1,889 | ) | (1,704 | ) | (1,829 | ) | (1,921 | ) | (1,935 | ) | ||||||||||
| Partners’ share of amortization of financing costs from consolidated joint ventures |
38 | 38 | 38 | 39 | 64 | |||||||||||||||
| BXP’s share of amortization of financing costs from unconsolidated joint ventures |
(113 | ) | (112 | ) | (120 | ) | (113 | ) | (102 | ) | ||||||||||
|
|
|
|
|
|
|
|
|
|
|
|||||||||||
| Adjusted interest expense excluding capitalized interest (B) |
95,051 | 96,790 | 98,235 | 99,756 | 100,307 | |||||||||||||||
| Capitalized interest |
9,788 | 10,222 | 9,525 | 8,380 | 9,223 | |||||||||||||||
| Partners’ share of capitalized interest from consolidated joint ventures |
(21 | ) | — | — | — | — | ||||||||||||||
| BXP’s share of capitalized interest from unconsolidated joint ventures |
— | — | — | 50 | 123 | |||||||||||||||
|
|
|
|
|
|
|
|
|
|
|
|||||||||||
| Adjusted interest expense including capitalized interest (C) |
$ | 104,818 | $ | 107,012 | $ | 107,760 | $ | 108,186 | $ | 109,653 | ||||||||||
|
|
|
|
|
|
|
|
|
|
|
|||||||||||
| Interest Coverage Ratio (excluding capitalized interest) (A ÷ B) (6) |
3.49 | 3.63 | 3.79 | 3.20 | 3.28 | |||||||||||||||
|
|
|
|
|
|
|
|
|
|
|
|||||||||||
| Interest Coverage Ratio (including capitalized interest) (A ÷ C) (6) |
3.17 | 3.28 | 3.45 | 2.95 | 3.00 | |||||||||||||||
|
|
|
|
|
|
|
|
|
|
|
|||||||||||
| (1) | For the three months ended September 30, 2015, excludes the noncontrolling interests in property partnerships’ share of a gain on sale of real estate totaling approximately $101.1 million. |
| (2) | For the three months ended September 30, 2016, June 30, 2016, March 31, 2016 and December 31, 2015, includes the straight-line impact of the Company’s 99-year ground and air rights lease related to the 100 Clarendon Street garage and Back Bay Station concourse level, which are adjacent to the the Company’s 200 Clarendon Street property. The Company has allocated contractual ground lease payments aggregating approximately $34.4 million, which it expects to incur over the next three years with no payments thereafter. The Company is recognizing these amounts on a straight-line basis over the 99-year term of the ground and air rights lease. For additional information, see page 7. |
| (3) | During the three months ended June 30, 2016, the Company recognized an aggregate of approximately $15.4 million of lump sum rental income amounts from three tenants that will be straight-lined through each tenant's lease term. These amounts are in addition to the tenants’ monthly rental payments. |
| (4) | Consists of lease transaction costs that qualify as rent inducements in accordance with GAAP. Lease transaction costs are generally included in 2nd generation tenant improvements and leasing commissions. |
| (5) | Represents the net adjustment for above- and below-market leases that are being amortized over the terms of the respective leases in place at the property acquisition dates. |
| (6) | The Company believes that the presentation of its Interest Coverage Ratio provides investors with useful information about the Company’s financial condition because it measures the margin it has for paying interest expense as of a certain date. In addition, by analyzing interest coverage ratios over a period of time, trends may emerge that provide investors a better sense of whether a company’s financial condition is improving or worsening. The ratios may also be used to compare the ability of different companies to meet their interest expense obligations, which can help when making an investment decision. The Company presents its Interest Coverage Ratio in two ways - including capitalized interest and excluding capitalized interest. GAAP requires the capitalization of interest expense during development. Therefore, for a company like Boston Properties, Inc. that is an active developer of real estate, presenting the Interest Coverage Ratio (excluding capitalized interest) provides an alternative measure of financial condition that may be more indicative of the Company’s ability to meet its interest expense obligations. |
13
THIRD QUARTER 2016
CAPITAL STRUCTURE
(in thousands, except percentages)
Consolidated Debt
| Aggregate Principal | ||||
| September 30, 2016 | ||||
| Mortgage Notes Payable |
$ | 2,035,195 | ||
| Mezzanine Notes Payable |
306,000 | |||
| Unsecured Line of Credit |
— | |||
| Unsecured Senior Notes, at face value |
7,300,000 | |||
| Outside Members’ Notes Payable |
180,000 | |||
|
|
|
|||
| Subtotal |
9,821,195 | |||
| Fair Value Interest Adjustment on Mortgage Notes Payable |
44,970 | |||
| Fair Value Interest Adjustment on Mezzanine Notes Payable |
1,448 | |||
| Discount on Unsecured Senior Notes |
(19,429 | ) | ||
| Deferred Financing Costs, Net |
(39,262 | ) | ||
|
|
|
|||
| Consolidated Debt |
$ | 9,808,922 | ||
|
|
|
|||
Boston Properties Limited Partnership Unsecured Senior Notes (1)
| Settlement Date |
Maturity Date | Principal | Yield (on issue date) |
Coupon | Public Offering Price |
Discount | Deferred Financing Costs, Net |
Unsecured Senior Notes, net |
||||||||||||||||||||||||
| 8/17/2016 |
10/1/2026 | $ | 1,000,000 | 3.495 | %(2) | 2.750 | % | 99.271 | % | $ | 7,242 | $ | 8,093 | $ | 984,665 | |||||||||||||||||
| 1/20/2016 |
2/1/2026 | 1,000,000 | 3.766 | % | 3.650 | % | 99.708 | % | 2,756 | 7,598 | 989,646 | |||||||||||||||||||||
| 6/27/2013 |
2/1/2024 | 700,000 | 3.916 | % | 3.800 | % | 99.694 | % | 1,553 | 4,124 | 694,323 | |||||||||||||||||||||
| 4/11/2013 |
9/1/2023 | 500,000 | 3.279 | % | 3.125 | % | 99.379 | % | 2,184 | 2,781 | 495,035 | |||||||||||||||||||||
| 6/11/2012 |
2/1/2023 | 1,000,000 | 3.954 | % | 3.850 | % | 99.779 | % | 1,410 | 4,951 | 993,639 | |||||||||||||||||||||
| 11/10/2011 |
11/15/2018 | 850,000 | 3.853 | % | 3.700 | % | 99.767 | % | 652 | 2,100 | 847,248 | |||||||||||||||||||||
| 11/18/2010 |
5/15/2021 | 850,000 | 4.289 | % | 4.125 | % | 99.260 | % | 3,104 | 3,116 | 843,780 | |||||||||||||||||||||
| 4/19/2010 |
11/15/2020 | 700,000 | 5.708 | % | 5.625 | % | 99.891 | % | 348 | 2,316 | 697,336 | |||||||||||||||||||||
| 10/9/2009 |
10/15/2019 | 700,000 | 5.967 | % | 5.875 | % | 99.931 | % | 180 | 1,725 | 698,095 | |||||||||||||||||||||
|
|
|
|
|
|
|
|
|
|||||||||||||||||||||||||
| $ | 7,300,000 | $ | 19,429 | $ | 36,804 | $ | 7,243,767 | |||||||||||||||||||||||||
|
|
|
|
|
|
|
|
|
|||||||||||||||||||||||||
Equity
| Shares/Units | ||||||||||||
| Outstanding | Common Stock | Equivalent | ||||||||||
| as of 9/30/2016 | Equivalents | Value (3) | ||||||||||
| Common Stock |
153,773 | 153,773 | (4) | $ | 20,957,722 | |||||||
| Common Operating Partnership Units |
18,002 | 18,002 | (5) | 2,453,493 | ||||||||
| 5.25% Series B Cumulative Redeemable Preferred Stock |
80 | — | 200,000 | (6) | ||||||||
|
|
|
|
|
|||||||||
| Total Equity |
171,775 | $ | 23,611,215 | |||||||||
|
|
|
|
|
|||||||||
| Consolidated Debt |
$ | 9,808,922 | ||||||||||
| Add: |
||||||||||||
| BXP’s share of unconsolidated joint venture debt (7) |
350,225 | |||||||||||
|
|
|
|||||||||||
| Combined Debt (8) |
10,159,147 | |||||||||||
| Less: |
||||||||||||
| Partners’ share of consolidated debt (9) |
1,150,462 | |||||||||||
|
|
|
|||||||||||
| BXP’s Share of Combined Debt (8) |
$ | 9,008,685 | ||||||||||
|
|
|
|||||||||||
| Consolidated Market Capitalization |
$ | 33,420,137 | ||||||||||
|
|
|
|||||||||||
| BXP’s Share of Combined Market Capitalization (8) |
$ | 32,619,900 | ||||||||||
|
|
|
|||||||||||
| (1) | All unsecured senior notes are rated A- (stable), BBB+ (stable) and Baa2 (positive) by S&P, Fitch and Moody’s, respectively. |
| (2) | Includes the impact of the cash settlement of certain forward-starting interest rate swap contracts that fixed the 10-year swap rate at a weighted-average rate of approximately 2.423% per annum on notional amounts aggregating $550.0 million. |
| (3) | Values based on September 30, 2016 closing price of $136.29 per share of common stock, except the shares of Series B Cumulative Redeemable Preferred Stock have been valued at the liquidation preference of $2,500.00 per share (see Note 6 below). |
| (4) | Includes 59,777 shares of restricted stock. |
| (5) | Includes 905,494 long-term incentive plan units (including 166,629 Outperformance Plan Units and 93,928 2013 MYLTIP Units), but excludes an aggregate of 1,314,993 2014, 2015 and 2016 MYLTIP Units because the performance periods for these MYLTIP Units have not ended and therefore none of such units have been earned. |
| (6) | On or after March 27, 2018, the Company, at its option, may redeem the Series B Preferred Stock for a cash redemption price of $2,500.00 per share ($25.00 per depositary share), plus all accrued and unpaid dividends. The Series B Preferred Stock is not redeemable by the holders, has no maturity date and is not convertible into or exchangeable for any other security of the Company or any of its affiliates. |
| (7) | Amount is calculated based on the Company’s percentage ownership interest in the unconsolidated joint venture entities. For additional detail, see page 17. |
| (8) | For the Company’s definitions, see pages 47-48. |
| (9) | Amount is calculated based on the outside partners’ percentage ownership interest in the consolidated joint venture entities. For additional detail, see page 19. |
14
THIRD QUARTER 2016
DEBT ANALYSIS (1)
as of September 30, 2016
(dollars in thousands)
Debt Maturities and Principal Payments
| 2016 | 2017 | 2018 | 2019 | 2020 | Thereafter | Total | ||||||||||||||||||||||
| Floating Rate Debt: |
|
|||||||||||||||||||||||||||
| Mortgage Notes Payable |
$ | — | $ | — | $ | — | $ | — | $ | — | $ | — | $ | — | ||||||||||||||
| Unsecured Line of Credit |
— | — | — | — | — | — | — | |||||||||||||||||||||
|
|
|
|
|
|
|
|
|
|
|
|
|
|
|
|||||||||||||||
| Total Floating Rate Debt |
$ | — | $ | — | $ | — | $ | — | $ | — | $ | — | $ | — | ||||||||||||||
|
|
|
|
|
|
|
|
|
|
|
|
|
|
|
|||||||||||||||
| Fixed Rate Debt: |
||||||||||||||||||||||||||||
| 767 Fifth Avenue (The GM Building) (60% ownership) |
$ | — | $ | 1,300,000 | $ | — | $ | — | $ | — | $ | — | $ | 1,300,000 | (2) | |||||||||||||
| 601 Lexington Avenue (55% ownership) |
3,167 | 13,051 | 13,684 | 14,349 | 15,045 | 630,486 | 689,782 | |||||||||||||||||||||
| New Dominion Technology Park, Building One |
— | 2,878 | 3,100 | 3,340 | 3,598 | 22,906 | 35,822 | |||||||||||||||||||||
| University Place |
413 | 1,725 | 1,849 | 1,981 | 2,123 | 1,500 | 9,591 | |||||||||||||||||||||
|
|
|
|
|
|
|
|
|
|
|
|
|
|
|
|||||||||||||||
| Mortgage Notes Payable |
3,580 | 1,317,654 | 18,633 | 19,670 | 20,766 | 654,892 | 2,035,195 | |||||||||||||||||||||
| Fair Value Interest Adjustment |
11,140 | 33,830 | — | — | — | — | 44,970 | |||||||||||||||||||||
| Deferred Financing Costs, Net |
(109 | ) | (629 | ) | (431 | ) | (431 | ) | (431 | ) | (427 | ) | (2,458 | ) | ||||||||||||||
|
|
|
|
|
|
|
|
|
|
|
|
|
|
|
|||||||||||||||
| Mortgage Notes Payable, Net |
$ | 14,611 | $ | 1,350,855 | $ | 18,202 | $ | 19,239 | $ | 20,335 | $ | 654,465 | $ | 2,077,707 | ||||||||||||||
|
|
|
|
|
|
|
|
|
|
|
|
|
|
|
|||||||||||||||
| Mezzanine Notes Payable |
$ | — | $ | 306,000 | $ | — | $ | — | $ | — | $ | — | $ | 306,000 | ||||||||||||||
| Fair Value Interest Adjustment |
355 | 1,093 | — | — | — | — | 1,448 | |||||||||||||||||||||
|
|
|
|
|
|
|
|
|
|
|
|
|
|
|
|||||||||||||||
| Mezzanine Notes Payable |
$ | 355 | $ | 307,093 | $ | — | $ | — | $ | — | $ | — | $ | 307,448 | ||||||||||||||
|
|
|
|
|
|
|
|
|
|
|
|
|
|
|
|||||||||||||||
| Unsecured Senior Notes, Face Amount |
$ | — | $ | — | $ | 850,000 | $ | 700,000 | $ | 700,000 | $ | 5,050,000 | $ | 7,300,000 | ||||||||||||||
| Discount Amortization |
(645 | ) | (2,643 | ) | (2,696 | ) | (2,503 | ) | (2,528 | ) | (8,414 | ) | (19,429 | ) | ||||||||||||||
| Deferred Financing Costs, Net |
(1,547 | ) | (6,187 | ) | (6,019 | ) | (5,036 | ) | (4,510 | ) | (13,505 | ) | (36,804 | ) | ||||||||||||||
|
|
|
|
|
|
|
|
|
|
|
|
|
|
|
|||||||||||||||
| Unsecured Senior Notes, Net |
$ | (2,192 | ) | $ | (8,830 | ) | $ | 841,285 | $ | 692,461 | $ | 692,962 | $ | 5,028,081 | $ | 7,243,767 | ||||||||||||
|
|
|
|
|
|
|
|
|
|
|
|
|
|
|
|||||||||||||||
| Outside Members’ Notes Payable |
$ | — | $ | 180,000 | $ | — | $ | — | $ | — | $ | — | $ | 180,000 | ||||||||||||||
|
|
|
|
|
|
|
|
|
|
|
|
|
|
|
|||||||||||||||
| Total Fixed Rate Debt |
$ | 12,774 | $ | 1,829,118 | $ | 859,487 | $ | 711,700 | $ | 713,297 | $ | 5,682,546 | $ | 9,808,922 | ||||||||||||||
|
|
|
|
|
|
|
|
|
|
|
|
|
|
|
|||||||||||||||
| Consolidated Debt |
$ | 12,774 | $ | 1,829,118 | $ | 859,487 | $ | 711,700 | $ | 713,297 | $ | 5,682,546 | $ | 9,808,922 | ||||||||||||||
|
|
|
|
|
|
|
|
|
|
|
|
|
|
|
|||||||||||||||
| % of Consolidated Debt |
0.13 | % | 18.65 | % | 8.76 | % | 7.26 | % | 7.27 | % | 57.93 | % | 100.00 | % | ||||||||||||||
|
|
|
|
|
|
|
|
|
|
|
|
|
|
|
|||||||||||||||
| Balloon Payments |
$ | — | $ | 1,786,000 | $ | 850,000 | $ | 700,000 | $ | 700,000 | $ | 5,683,554 | $ | 9,719,554 | ||||||||||||||
| Scheduled Principal Amortization |
$ | 3,580 | $ | 17,654 | $ | 18,633 | $ | 19,670 | $ | 20,766 | $ | 21,338 | $ | 101,641 | ||||||||||||||
| GAAP Weighted Average Floating Rate Debt (3) (4) |
— | — | — | — | — | — | — | |||||||||||||||||||||
|
|
|
|
|
|
|
|
|
|
|
|
|
|
|
|||||||||||||||
| GAAP Weighted Average Fixed Rate Debt (3) (4) |
5.03 | % | 3.04 | % | 3.89 | % | 5.96 | % | 5.70 | % | 3.94 | % | 4.06 | % | ||||||||||||||
|
|
|
|
|
|
|
|
|
|
|
|
|
|
|
|||||||||||||||
| Total GAAP Weighted Average Rate (3) (4) |
5.03 | % | 3.04 | % | 3.89 | % | 5.96 | % | 5.70 | % | 3.94 | % | 4.06 | % | ||||||||||||||
|
|
|
|
|
|
|
|
|
|
|
|
|
|
|
|||||||||||||||
| Total Stated Weighted Average Rate (4) |
4.99 | % | 5.96 | % | 3.77 | % | 5.87 | % | 5.63 | % | 3.86 | % | 4.50 | % | ||||||||||||||
|
|
|
|
|
|
|
|
|
|
|
|
|
|
|
|||||||||||||||
Unsecured Line of Credit - Matures July 26, 2018
| Outstanding | Letters of | Remaining Capacity | ||||||||||
| Facility |
at 9/30/2016 | Credit | at 9/30/2016 | |||||||||
| $ 1,000,000 |
$ | — | $ | 6,716 | $ | 993,284 | ||||||
Unsecured and Secured Debt Analysis (4)
| Stated Weighted | GAAP Weighted | Weighted Average | ||||||||||||||
| % of Total Debt | Average Rate | Average Rate | Maturity (years) | |||||||||||||
| Unsecured Debt |
75.23 | % | 4.12 | % | 4.21 | % | 6.2 | |||||||||
| Secured Debt |
24.77 | % | 5.64 | % | 3.61 | % | 2.4 | |||||||||
|
|
|
|
|
|
|
|
|
|||||||||
| Consolidated Debt |
100.00 | % | 4.50 | % | 4.06 | % | 5.2 | |||||||||
|
|
|
|
|
|
|
|
|
|||||||||
Floating and Fixed Rate Debt Analysis (4)
| Stated Weighted | GAAP Weighted | Weighted Average | ||||||||||||||
| % of Total Debt | Average Rate | Average Rate | Maturity (years) | |||||||||||||
| Floating Rate Debt |
— | — | — | — | ||||||||||||
| Fixed Rate Debt |
100.00 | % | 4.50 | % | 4.06 | % | 5.2 | |||||||||
|
|
|
|
|
|
|
|
|
|||||||||
| Consolidated Debt |
100.00 | % | 4.50 | % | 4.06 | % | 5.2 | |||||||||
|
|
|
|
|
|
|
|
|
|||||||||
Interest Rate Hedging Instruments
| Weighted-Average | ||||||||||||||||
| Notional Amount | 10-Year Swap Rate | Effective Date | Termination Date | |||||||||||||
| Forward-starting interest rate swaps (5) |
450,000 | 2.619 | % | June 1, 2017 | June 1, 2027 | |||||||||||
| (1) | Excludes unconsolidated joint ventures. For information on BXP’s unconsolidated joint venture debt, see page 17. |
| (2) | This property has a fair value interest adjustment that is shown on the Fair Value Interest Adjustment line. |
| (3) | The GAAP interest rate differs from the stated interest rate due to the inclusion of the amortization of financing charges, effects of hedging transactions and adjustments required to reflect loans at their fair values upon acquisition or consolidation. |
| (4) | Percentage of total debt, weighted average rates and weighted average maturities exclude the Outside Members’ Notes Payable because they are allocated to the Company’s partners through noncontrolling interests in property partnerships. |
| (5) | Represents forward interest rate swap contracts entered into by the Company’s 767 Fifth Partners LLC consolidated entity (the entity in which the Company has a 60% interest and that owns 767 Fifth Avenue (the GM Building) in New York City). |
15
THIRD QUARTER 2016
SENIOR UNSECURED DEBT COVENANT COMPLIANCE RATIOS
(dollars in thousands)
In the fourth quarter of 2002, the Company’s Operating Partnership (Boston Properties Limited Partnership) received investment grade ratings on its senior unsecured debt securities and thereafter issued unsecured notes. The notes were issued under an indenture, dated as of December 13, 2002, by and between Boston Properties Limited Partnership and The Bank of New York Mellon Trust Company, N.A., as trustee, as supplemented from time to time (the “Indenture”), which, among other things, requires us to comply with the following limitations on incurrence of debt: Limitation on Outstanding Debt; Limitation on Secured Debt; Ratio of Annualized Consolidated EBITDA to Annualized Interest Expense; and Maintenance of Unencumbered Assets. Compliance with these restrictive covenants requires us to apply specialized terms the meanings of which are described in detail in our filings with the SEC, and to calculate ratios in the manner prescribed by the Indenture.
This section presents such ratios as of September 30, 2016 to show that the Company’s Operating Partnership was in compliance with the terms of the Indenture, which has been filed with the SEC. Management is not presenting these ratios and the related calculations for any other purpose or for any other period, and is not intending for these measures to otherwise provide information to investors about the Company’s financial condition or results of operations. Investors should not rely on these measures other than for purposes of testing our compliance with the Indenture. This section also presents certain other indenture-related data that we believe assists investors in evaluating the Company’s unsecured debt securities.
| Senior Notes | Senior Notes | |||||||||||
| Issued Prior to | Issued On or After | |||||||||||
| October 9, 2009 | October 9, 2009 | |||||||||||
| September 30, 2016 | ||||||||||||
| Total Assets: |
||||||||||||
| Capitalized Property Value (1) |
$ | 22,985,995 | $ | 23,424,925 | ||||||||
| Cash and Cash Equivalents |
419,323 | 419,323 | ||||||||||
| Investments in Securities |
23,022 | 23,022 | ||||||||||
| Undeveloped Land, at Cost (including Joint Venture %) |
290,594 | 290,594 | ||||||||||
| Development in Process, at Cost (including Joint Venture %) |
1,080,398 | 1,080,398 | ||||||||||
|
|
|
|
|
|||||||||
| Total Assets |
$ | 24,799,332 | $ | 25,238,262 | ||||||||
|
|
|
|
|
|||||||||
| Unencumbered Assets |
$ | 19,440,151 | $ | 19,860,307 | ||||||||
|
|
|
|
|
|||||||||
| Consolidated Secured Debt (Fixed and Variable) (2) |
$ | 2,035,195 | $ | 2,035,195 | ||||||||
| Mezzanine Notes Payable (3) |
306,000 | 306,000 | ||||||||||
| Unconsolidated Joint Venture Debt (4) |
351,397 | 351,397 | ||||||||||
| Outside Members’ Notes Payable |
180,000 | 180,000 | ||||||||||
| Contingent Liabilities & Letters of Credit |
14,032 | 14,032 | ||||||||||
| Unsecured Debt (5) |
7,300,000 | 7,300,000 | ||||||||||
|
|
|
|
|
|||||||||
| Total Outstanding Debt |
$ | 10,186,624 | $ | 10,186,624 | ||||||||
|
|
|
|
|
|||||||||
| Consolidated EBITDA: |
||||||||||||
| Income before Gains on Sales of Real Estate (per Consolidated Income Statement) |
$ | 58,521 | $ | 58,521 | ||||||||
| Subtract: Income from Unconsolidated Joint Ventures (per Consolidated Income Statement) |
|
(1,464 | ) | (1,464 | ) | |||||||
| Subtract: Gains from Investments in Securities (per Consolidated Income Statement) |
(976 | ) | (976 | ) | ||||||||
| Add: Losses from Interest Rate Contracts (per Consolidated Income Statement) |
140 | 140 | ||||||||||
| Add: Losses from Early Extinguishments of Debt (per Consolidated Income Statement) |
371 | 371 | ||||||||||
| Add: Interest Expense (per Consolidated Income Statement) |
104,641 | 104,641 | ||||||||||
| Add: Depreciation and Amortization (per Consolidated Income Statement) |
203,748 | 203,748 | ||||||||||
| Add: Impairment Loss (per Consolidated Income Statement) |
1,783 | 1,783 | ||||||||||
|
|
|
|
|
|||||||||
| EBITDA |
366,764 | 366,764 | ||||||||||
| Add: BXP’s share of unconsolidated joint venture EBITDA |
14,436 | 14,436 | ||||||||||
|
|
|
|
|
|||||||||
| Consolidated EBITDA |
$ | 381,200 | $ | 381,200 | ||||||||
|
|
|
|
|
|||||||||
| Adjusted Interest Expense: |
||||||||||||
| Interest Expense (per Consolidated Income Statement) |
$ | 104,641 | $ | 104,641 | ||||||||
| Add: BXP’s share of unconsolidated joint venture interest expense |
4,025 | 4,025 | ||||||||||
| Less: Amortization of financing costs (including BXP’s share of unconsolidated joint ventures) |
|
(2,002 | ) | (2,002 | ) | |||||||
| Less: Interest expense funded by construction loan draws |
(75 | ) | (75 | ) | ||||||||
|
|
|
|
|
|||||||||
| Adjusted Interest Expense |
$ | 106,589 | $ | 106,589 | ||||||||
|
|
|
|
|
|||||||||
| Test | Actual | Actual | ||||||||||
| Covenant Ratios and Related Data |
||||||||||||
| Total Outstanding Debt/Total Assets |
Less than 60% | 41.1 | % | 40.4 | % | |||||||
| Secured Debt/Total Assets |
Less than 50% | 10.9 | % | 10.7 | % | |||||||
| Interest Coverage (Annualized Consolidated EBITDA to Annualized Interest Expense) |
Greater than 1.50x | 3.58 | 3.58 | |||||||||
| Unencumbered Assets/ Unsecured Debt |
Greater than 150% | 266.3 | % | 272.1 | % | |||||||
|
|
|
|
|
|||||||||
| Unencumbered Consolidated Property EBITDA (6) |
$ | 323,398 | $ | 323,398 | ||||||||
|
|
|
|
|
|||||||||
| Unencumbered Interest Coverage (Unencumbered Consolidated Property EBITDA to Unsecured Interest Expense) |
4.59 | 4.59 | ||||||||||
|
|
|
|
|
|||||||||
| % of Unencumbered Consolidated Property EBITDA to Consolidated EBITDA |
84.8 | % | 84.8 | % | ||||||||
|
|
|
|
|
|||||||||
| # of in-service unencumbered properties |
153 | 153 | ||||||||||
|
|
|
|
|
|||||||||
| (1) | For senior notes issued prior to October 9, 2009, Capitalized Property Value is determined for each property and is the greater of (A) annualized EBITDA capitalized at an 8.5% rate for CBD properties and a 9.0% rate for non-CBD properties, and (B) the undepreciated book value as determined under GAAP. Capitalized Property Value for senior notes issued on or after October 9, 2009 is determined for each property and is the greater of (A) annualized EBITDA capitalized at an 8.0% rate for CBD properties and a 9.0% rate for non-CBD properties, and (B) the undepreciated book value as determined under GAAP. |
| (2) | Excludes aggregate fair value interest adjustment of $44,970 and deferred financing costs, net of $2,458. |
| (3) | Excludes aggregate fair value interest adjustment of $1,448. |
| (4) | Excludes aggregate deferred financing costs, net of $1,172. |
| (5) | Excludes aggregate debt discount of $19,429 and deferred financing costs, net of $36,804. |
| (6) | Unencumbered Consolidated Property EBITDA is a non-GAAP financial measure equal to Consolidated EBITDA excluding corporate revenue and expenses, encumbered consolidated Property EBITDA, EBITDA from land and properties that have either been disposed of or not fully placed in-service and items that, in the Company’s view, are not representative of a property’s standard ongoing performance, such as termination income and other similar items. For the three months ended September 30, 2016, these excluded amounts were approximately $(17,072), $74,375, $(1,637) and $2,136, respectively. |
16
THIRD QUARTER 2016
UNCONSOLIDATED JOINT VENTURES (1)
as of September 30, 2016
(dollars in thousands)
Balance Sheet Information
| Mortgage/ | ||||||||||||
| Construction | ||||||||||||
| BXP’s Nominal | Loans | |||||||||||
| Property |
Ownership | Net Equity (2) | Payable, Net | |||||||||
| 540 Madison Avenue |
60.00 | % | $ | 69,602 | $ | 71,796 | ||||||
| Market Square North |
50.00 | % | (8,483 | ) | 61,820 | |||||||
| Metropolitan Square |
51.00 | % | 9,552 | 84,965 | ||||||||
| 901 New York Avenue |
25.00 | % | (10,898 | ) | 55,882 | |||||||
| Wisconsin Place (3) |
33.33 | % | 42,073 | — | ||||||||
| Annapolis Junction (4) |
50.00 | % | 21,075 | 44,380 | ||||||||
| 500 North Capitol Street, N.W. |
30.00 | % | (3,395 | ) | 31,382 | |||||||
| Colorado Center |
49.80 | % | 507,259 | — | ||||||||
| The Hub on Causeway (Phase 1) |
50.00 | % | 33,820 | — | ||||||||
| 1001 6th Street |
50.00 | % | 42,541 | — | ||||||||
| Dock72 |
50.00 | % | 25,980 | — | ||||||||
| 1265 Main Street |
50.00 | % | 23,757 | — | ||||||||
|
|
|
|
|
|||||||||
| $ | 752,883 | $ | 350,225 | |||||||||
|
|
|
|
|
|||||||||
Debt Maturities and Principal Payments by Property
| Property |
2016 | 2017 | 2018 | 2019 | 2020 | Thereafter | Total | |||||||||||||||||||||
| Metropolitan Square (51%) |
$ | 340 | $ | 1,410 | $ | 1,493 | $ | 1,582 | $ | 80,327 | $ | — | $ | 85,152 | ||||||||||||||
| 540 Madison Avenue (60%) |
— | — | 72,000 | — | — | — | 72,000 | |||||||||||||||||||||
| Market Square North (50%) |
279 | 1,148 | 1,205 | 1,265 | 58,091 | — | 61,988 | |||||||||||||||||||||
| 901 New York Avenue (25%) |
— | — | — | — | 955 | 55,295 | 56,250 | |||||||||||||||||||||
| 500 North Capitol Street, N.W. (30%) |
— | — | — | — | — | 31,500 | 31,500 | |||||||||||||||||||||
| Annapolis Junction Building One (50%) |
70 | 279 | 19,519 | — | — | — | 19,868 | (5) | ||||||||||||||||||||
| Annapolis Junction Building Six (50%) |
6,477 | — | — | — | — | — | 6,477 | |||||||||||||||||||||
| Annapolis Junction Building Seven (50%) |
— | 10,797 | — | — | — | — | 10,797 | (6) | ||||||||||||||||||||
| Annapolis Junction Building Eight (50%) |
— | 7,365 | — | — | — | — | 7,365 | (7) | ||||||||||||||||||||
|
|
|
|
|
|
|
|
|
|
|
|
|
|
|
|||||||||||||||
| 7,166 | 20,999 | 94,217 | 2,847 | 139,373 | 86,795 | 351,397 | ||||||||||||||||||||||
| Deferred Financing Costs, Net |
(106 | ) | (359 | ) | (219 | ) | (156 | ) | (111 | ) | (221 | ) | (1,172 | ) | ||||||||||||||
|
|
|
|
|
|
|
|
|
|
|
|
|
|
|
|||||||||||||||
| Mortgage/Construction Loans Payable, Net |
$ | 7,060 | $ | 20,640 | $ | 93,998 | $ | 2,691 | $ | 139,262 | $ | 86,574 | $ | 350,225 | ||||||||||||||
|
|
|
|
|
|
|
|
|
|
|
|
|
|
|
|||||||||||||||
| GAAP Weighted Average Rate |
3.07 | % | 2.84 | % | 2.30 | % | 5.15 | % | 5.42 | % | 3.87 | % | 4.00 | % | ||||||||||||||
| % of Total Debt |
2.02 | % | 5.89 | % | 26.84 | % | 0.77 | % | 39.76 | % | 24.72 | % | 100.00 | % | ||||||||||||||
| Balloon Payments |
$ | 6,477 | $ | 18,162 | $ | 91,472 | $ | — | $ | 136,880 | $ | 81,932 | $ | 334,923 | ||||||||||||||
| Scheduled Amortization |
$ | 689 | $ | 2,837 | $ | 2,745 | $ | 2,847 | $ | 2,493 | $ | 4,863 | $ | 16,474 | ||||||||||||||
Floating and Fixed Rate Debt Analysis
| Stated Weighted | GAAP Weighted | Weighted Average | ||||||||||||||
| % of Total Debt | Average Rate | Average Rate | Maturity (years) | |||||||||||||
| Floating Rate Debt |
33.17 | % | 2.09 | % | 2.28 | % | 1.4 | |||||||||
| Fixed Rate Debt |
66.83 | % | 4.79 | % | 4.85 | % | 5.2 | |||||||||
|
|
|
|
|
|
|
|
|
|||||||||
| Total Debt |
100.00 | % | 3.89 | % | 4.00 | % | 4.0 | |||||||||
|
|
|
|
|
|
|
|
|
|||||||||
| (1) | Amounts represent the Company’s share based on its ownership percentage. |
| (2) | As of September 30, 2016, certain investments with deficit balances aggregating ($22,776) have been reflected within Other Liabilities on the Company’s Consolidated Balance Sheet. |
| (3) | Represents the Company’s interest in the joint venture entity that owns the land, parking garage and infrastructure. The Company’s entity that owns 100% of the office component of the project is consolidated within the accounts of the Company. |
| (4) | Annapolis Junction includes four in-service properties and two undeveloped land parcels. |
| (5) | On April 11, 2016, a notice of event of default was received from the lender because the loan to value ratio is not in compliance with the applicable covenant in the loan agreement. On October 17, 2016, the lender notified the joint venture that it has elected to charge the default rate on the loan. The default rate is defined as LIBOR plus 5.75% per annum. The loan has one, three-year extension option, subject to certain conditions including that no event of default exists or is ongoing. |
| (6) | Loan has one, one-year extension option, subject to certain conditions. |
| (7) | Loan has two, one-year extension options, subject to certain conditions. |
17
THIRD QUARTER 2016
UNCONSOLIDATED JOINT VENTURES (continued)
(unaudited and dollars in thousands)
Results of Operations
for the three months ended September 30, 2016
| 500 North | Total | |||||||||||||||||||||||||||||||||||||||||||||||||||
| 540 Madison | Market Square | Metropolitan | 901 New York | Wisconsin | Annapolis | Capitol | Colorado | The Hub on Causeway | 1001 | 1265 Main | Unconsolidated | |||||||||||||||||||||||||||||||||||||||||
| Avenue | North | Square | Avenue | Place (1) | Junction (2) | Street, N.W. | Center | (Phase 1) | 6th Street | Dock72 | Street | Joint Ventures | ||||||||||||||||||||||||||||||||||||||||
| REVENUE |
||||||||||||||||||||||||||||||||||||||||||||||||||||
| Rental (3) |
$ | 6,531 | $ | 3,798 | $ | 4,499 | $ | 6,356 | $ | 982 | $ | 2,023 | $ | 2,738 | $ | 9,736 | $ | — | $ | 241 | $ | — | $ | — | $ | 36,904 | ||||||||||||||||||||||||||
| Operating recoveries |
965 | 842 | 1,357 | 1,173 | 352 | 513 | 1,142 | 418 | — | — | — | — | 6,762 | |||||||||||||||||||||||||||||||||||||||
| Straight-line rent |
(56 | ) | 1,085 | 1,986 | 509 | — | 41 | 311 | 1,354 | — | — | — | — | 5,230 | ||||||||||||||||||||||||||||||||||||||
| Fair value lease revenue |
(2 | ) | — | — | — | — | — | — | 96 | — | — | — | — | 94 | ||||||||||||||||||||||||||||||||||||||
| Lease termination fees |
22 | — | (10 | ) | — | — | — | — | — | — | — | — | — | 12 | ||||||||||||||||||||||||||||||||||||||
|
|
|
|
|
|
|
|
|
|
|
|
|
|
|
|
|
|
|
|
|
|
|
|
|
|
|
|||||||||||||||||||||||||||
| Total revenue |
7,460 | 5,725 | 7,832 | 8,038 | 1,334 | 2,577 | 4,191 | 11,604 | — | 241 | — | — | 49,002 | |||||||||||||||||||||||||||||||||||||||
|
|
|
|
|
|
|
|
|
|
|
|
|
|
|
|
|
|
|
|
|
|
|
|
|
|
|
|||||||||||||||||||||||||||
| EXPENSES |
||||||||||||||||||||||||||||||||||||||||||||||||||||
| Operating |
3,680 | 2,298 | 3,639 | 3,304 | 575 | 1,658 | 1,365 | 4,907 | — | 327 | — | — | 21,753 | |||||||||||||||||||||||||||||||||||||||
|
|
|
|
|
|
|
|
|
|
|
|
|
|
|
|
|
|
|
|
|
|
|
|
|
|
|
|||||||||||||||||||||||||||
| NET OPERATING INCOME/(LOSS) |
3,780 | 3,427 | 4,193 | 4,734 | 759 | 919 | 2,826 | 6,697 | — | (86 | ) | — | — | 27,249 | ||||||||||||||||||||||||||||||||||||||
| Interest |
676 | 1,526 | 2,428 | 2,075 | — | 577 | 1,118 | — | — | — | — | — | 8,400 | |||||||||||||||||||||||||||||||||||||||
| Depreciation and amortization |
1,891 | 975 | 1,707 | 1,386 | 1,383 | 1,044 | 911 | 2,741 | — | — | — | — | 12,038 | |||||||||||||||||||||||||||||||||||||||
|
|
|
|
|
|
|
|
|
|
|
|
|
|
|
|
|
|
|
|
|
|
|
|
|
|
|
|||||||||||||||||||||||||||
| SUBTOTAL |
2,567 | 2,501 | 4,135 | 3,461 | 1,383 | 1,621 | 2,029 | 2,741 | — | — | — | — | 20,438 | |||||||||||||||||||||||||||||||||||||||
|
|
|
|
|
|
|
|
|
|
|
|
|
|
|
|
|
|
|
|
|
|
|
|
|
|
|
|||||||||||||||||||||||||||
| NET INCOME/(LOSS) |
$ | 1,213 | $ | 926 | $ | 58 | $ | 1,273 | $ | (624 | ) | $ | (702 | ) | $ | 797 | $ | 3,956 | $ | — | $ | (86 | ) | $ | — | $ | — | $ | 6,811 | |||||||||||||||||||||||
|
|
|
|
|
|
|
|
|
|
|
|
|
|
|
|
|
|
|
|
|
|
|
|
|
|
|
|||||||||||||||||||||||||||
| BXP’s nominal ownership percentage |
60.00 | % | 50.00 | % | 51.00 | % | 25.00 | % | 33.33 | % | 50.00 | % | 30.00 | % | 49.80 | % | 50.00 | % | 50.00 | % | 50.00 | % | 50.00 | % | ||||||||||||||||||||||||||||
|
|
|
|
|
|
|
|
|
|
|
|
|
|
|
|
|
|
|
|
|
|
|
|
|
|||||||||||||||||||||||||||||
| BXP’s share of net income/(loss) |
$ | 728 | $ | 463 | $ | 30 | $ | 350 | (4) | $ | (207 | ) | $ | (351 | ) | $ | 239 | $ | 1,970 | $ | — | $ | (43 | ) | $ | — | $ | — | $ | 3,179 | ||||||||||||||||||||||
| Basis differential |
||||||||||||||||||||||||||||||||||||||||||||||||||||
| Straight-line rent |
— | — | — | — | — | — | — | 732 | (5) | — | — | — | — | 732 | ||||||||||||||||||||||||||||||||||||||
| Fair value lease revenue |
1 | — | — | — | — | — | — | 462 | (5) | — | — | — | — | 463 | ||||||||||||||||||||||||||||||||||||||
| Depreciation and amortization |
171 | (7 | ) | 17 | (5 | ) | (7 | ) | (7 | ) | (25 | ) | (3,047 | )(5) | — | — | — | — | (2,910 | ) | ||||||||||||||||||||||||||||||||
|
|
|
|
|
|
|
|
|
|
|
|
|
|
|
|
|
|
|
|
|
|
|
|
|
|
|
|||||||||||||||||||||||||||
| Total basis differential (6) |
172 | (7 | ) | 17 | (5 | ) | (7 | ) | (7 | ) | (25 | ) | (1,853 | )(5) | — | — | — | — | (1,715 | ) | ||||||||||||||||||||||||||||||||
|
|
|
|
|
|
|
|
|
|
|
|
|
|
|
|
|
|
|
|
|
|
|
|
|
|
|
|||||||||||||||||||||||||||
| Income/(loss) from unconsolidated joint ventures |
$ | 900 | $ | 456 | $ | 47 | $ | 345 | (4) | $ | (214 | ) | $ | (358 | ) | $ | 214 | $ | 117 | $ | — | $ | (43 | ) | $ | — | $ | — | $ | 1,464 | ||||||||||||||||||||||
| BXP’s share of depreciation & amortization |
1,024 | 499 | 882 | 1,003 | (4) | 466 | 533 | 308 | 4,413 | — | — | — | — | 9,128 | ||||||||||||||||||||||||||||||||||||||
|
|
|
|
|
|
|
|
|
|
|
|
|
|
|
|
|
|
|
|
|
|
|
|
|
|
|
|||||||||||||||||||||||||||
| BXP’s share of Funds from Operations (FFO) |
$ | 1,924 | $ | 955 | $ | 929 | $ | 1,348 | $ | 252 | $ | 175 | $ | 522 | $ | 4,530 | $ | — | $ | (43 | ) | $ | — | $ | — | $ | 10,592 | |||||||||||||||||||||||||
|
|
|
|
|
|
|
|
|
|
|
|
|
|
|
|
|
|
|
|
|
|
|
|
|
|
|
|||||||||||||||||||||||||||
| BXP’s share of interest expense |
$ | 406 | $ | 763 | $ | 1,238 | $ | 994 | (4) | $ | — | $ | 289 | $ | 335 | $ | — | $ | — | $ | — | $ | — | $ | — | $ | 4,025 | |||||||||||||||||||||||||
|
|
|
|
|
|
|
|
|
|
|
|
|
|
|
|
|
|
|
|
|
|
|
|
|
|
|
|||||||||||||||||||||||||||
| BXP’s share of fair value interest adjustment |
$ | — | $ | — | $ | — | $ | — | $ | — | $ | — | $ | — | $ | — | $ | — | $ | — | $ | — | $ | — | $ | — | ||||||||||||||||||||||||||
|
|
|
|
|
|
|
|
|
|
|
|
|
|
|
|
|
|
|
|
|
|
|
|
|
|
|
|||||||||||||||||||||||||||
| BXP’s share of amortization of financing costs |
$ | 31 | $ | 11 | $ | 13 | $ | 21 | $ | — | $ | 33 | $ | 4 | $ | — | $ | — | $ | — | $ | — | $ | — | $ | 113 | ||||||||||||||||||||||||||
|
|
|
|
|
|
|
|
|
|
|
|
|
|
|
|
|
|
|
|
|
|
|
|
|
|
|
|||||||||||||||||||||||||||
| BXP’s share of capitalized interest |
$ | — | $ | — | $ | — | $ | — | $ | — | $ | — | $ | — | $ | — | $ | 172 | $ | — | $ | 119 | $ | 125 | $ | 416 | ||||||||||||||||||||||||||
|
|
|
|
|
|
|
|
|
|
|
|
|
|
|
|
|
|
|
|
|
|
|
|
|
|
|
|||||||||||||||||||||||||||
| BXP’s share of non-cash termination income adjustment (fair value lease amounts) |
$ | — | $ | — | $ | — | $ | — | $ | — | $ | — | $ | — | $ | — | $ | — | $ | — | $ | — | $ | — | $ | — | ||||||||||||||||||||||||||
|
|
|
|
|
|
|
|
|
|
|
|
|
|
|
|
|
|
|
|
|
|
|
|
|
|
|
|||||||||||||||||||||||||||
| BXP’s share of revenue (7) (8) |
$ | 4,476 | $ | 2,863 | $ | 3,994 | $ | 3,852 | (4) | $ | 445 | $ | 1,289 | $ | 1,257 | $ | 6,974 | $ | — | $ | 121 | $ | — | $ | — | $ | 25,271 | |||||||||||||||||||||||||
| BXP’s share of operating expenses |
2,208 | 1,149 | 1,856 | 1,583 | (4) | 192 | 829 | 410 | 2,444 | 164 | 10,835 | |||||||||||||||||||||||||||||||||||||||||
|
|
|
|
|
|
|
|
|
|
|
|
|
|
|
|
|
|
|
|
|
|
|
|
|
|
|
|||||||||||||||||||||||||||
| BXP’s share of net operating income/(loss) (7) (8) |
2,268 | 1,714 | 2,138 | 2,269 | (4) | 253 | 460 | 847 | 4,530 | — | (43 | ) | — | — | 14,436 | |||||||||||||||||||||||||||||||||||||
| Less: |
||||||||||||||||||||||||||||||||||||||||||||||||||||
| BXP’s share of lease termination fees |
13 | — | (5 | ) | — | (4) | — | — | — | — | — | — | — | — | 8 | |||||||||||||||||||||||||||||||||||||
| BXP’s share of straight-line rent |
(34 | ) | 543 | 1,013 | 244 | (4) | — | 21 | 93 | 1,405 | — | — | — | — | 3,285 | |||||||||||||||||||||||||||||||||||||
| BXP’s share of fair value lease revenue |
(1 | ) | — | — | — | (4) | — | — | — | 512 | — | — | — | — | 511 | |||||||||||||||||||||||||||||||||||||
| Add: |
||||||||||||||||||||||||||||||||||||||||||||||||||||
| BXP’s share of lease transaction costs that qualify as rent inducements |
— | — | 15 | — | (4) | — | — | — | — | — | — | — | — | 15 | ||||||||||||||||||||||||||||||||||||||
|
|
|
|
|
|
|
|
|
|
|
|
|
|
|
|
|
|
|
|
|
|
|
|
|
|
|
|||||||||||||||||||||||||||
| BXP’s share of net operating income/(loss) (excluding lease termination fees) - cash basis (7) (8) |
$ | 2,290 | $ | 1,171 | $ | 1,145 | $ | 2,025 | (4) | $ | 253 | $ | 439 | $ | 754 | $ | 2,613 | $ | — | $ | (43 | ) | $ | — | $ | — | $ | 10,647 | ||||||||||||||||||||||||
|
|
|
|
|
|
|
|
|
|
|
|
|
|
|
|
|
|
|
|
|
|
|
|
|
|
|
|||||||||||||||||||||||||||
| (1) | Represents the Company’s interest in the joint venture entity that owns the land, parking garage and infrastructure. The Company’s entity that owns 100% of the office component of the project is consolidated within the accounts of the Company. |
| (2) | Annapolis Junction includes four properties in service and two undeveloped land parcels. |
| (3) | Includes approximately $61 of management services income and approximately $34 of interest and other income. |
| (4) | Reflects the allocation percentages pursuant to the achievement of specified investment return thresholds as provided for in the joint venture agreement. |
| (5) | The Company’s purchase price allocation under ASC 805 for Colorado Center differs from the historical basis of the venture resulting in the majority of the basis differential for this venture. |
| (6) | Represents adjustments related to the carrying values and depreciation of certain of the Company’s investment in unconsolidated joint ventures. |
| (7) | Includes the Company’s share of approximately $3,179 of operating recoveries. |
| (8) | Includes the Company’s share of approximately $36 of management services income and approximately $16 of interest and other income. |
18
THIRD QUARTER 2016
CONSOLIDATED JOINT VENTURES
(unaudited and in thousands)
Balance Sheets
as of September 30, 2016
| BXP’s ownership percentage |
60.00 | % | 55.00 | % | 95.00 | % | ||||||||||
|
|
|
|
|
|
|
|||||||||||
| Norges Joint Ventures | ||||||||||||||||
| 767 Fifth Avenue (The GM Building) |
Times Square Tower 601 Lexington Avenue 100 Federal Street Atlantic Wharf Office |
Salesforce Tower | Total Consolidated Joint Ventures |
|||||||||||||
| ASSETS |
||||||||||||||||
| Real estate, net |
$ | 3,436,843 | $ | 2,154,339 | (1) | $ | 668,376 | $ | 6,259,558 | |||||||
| Cash and cash held in escrows |
82,671 | 138,898 | 27,446 | 249,015 | ||||||||||||
| Other assets |
123,083 | 191,954 | 344 | 315,381 | ||||||||||||
|
|
|
|
|
|
|
|
|
|||||||||
| Total assets |
$ | 3,642,597 | $ | 2,485,191 | $ | 696,166 | $ | 6,823,954 | ||||||||
|
|
|
|
|
|
|
|
|
|||||||||
| LIABILITIES AND EQUITY |
||||||||||||||||
| Liabilities: |
||||||||||||||||
| Mortgage notes payable, net |
$ | 1,344,772 | $ | 687,942 | $ | — | $ | 2,032,714 | ||||||||
| Mezzanine notes payable |
307,448 | — | — | 307,448 | ||||||||||||
| Outside members’ notes payable |
180,000 | — | — | 180,000 | ||||||||||||
| Accrued interest on related party notes |
144,825 | — | — | 144,825 | ||||||||||||
| Other liabilities |
183,641 | 60,628 | 90,328 | 334,597 | ||||||||||||
|
|
|
|
|
|
|
|
|
|||||||||
| Total liabilities |
2,160,686 | 748,570 | 90,328 | 2,999,584 | ||||||||||||
|
|
|
|
|
|
|
|
|
|||||||||
| Equity: |
||||||||||||||||
| Boston Properties, Inc. |
1,084,393 | (2) | 634,079 | 582,146 | 2,300,618 | |||||||||||
| Noncontrolling interests |
397,518 | 1,102,542 | 23,692 | 1,523,752 | (3) | |||||||||||
|
|
|
|
|
|
|
|
|
|||||||||
| Total equity |
1,481,911 | 1,736,621 | 605,838 | 3,824,370 | ||||||||||||
|
|
|
|
|
|
|
|
|
|||||||||
| Total liabilities and equity |
$ | 3,642,597 | $ | 2,485,191 | $ | 696,166 | $ | 6,823,954 | ||||||||
|
|
|
|
|
|
|
|
|
|||||||||
| Partners’ share of mortgage notes payable, net |
$ | 537,909 | $ | 309,574 | $ | — | $ | 847,483 | ||||||||
| Partners’ share of mezzanine notes payable |
122,979 | — | — | 122,979 | ||||||||||||
| Outside members’ notes payable |
180,000 | — | — | 180,000 | ||||||||||||
|
|
|
|
|
|
|
|
|
|||||||||
| Partners’ share of consolidated debt |
$ | 840,888 | $ | 309,574 | $ | — | $ | 1,150,462 | ||||||||
|
|
|
|
|
|
|
|
|
|||||||||
| (1) | During the three months ended September 30, 2016, the consolidated entity recognized approximately $47.6 million of depreciation expense associated with the acceleration of depreciation on the assets being removed from service as part of the redevelopment of the low-rise portion of 601 Lexington Avenue. |
| (2) | Amount is adjusted for related party notes and accrued interest that are allocated to BXP’s partners through noncontrolling interests in property partnerships. |
| (3) | Amount excludes preferred shareholders’ capital of approximately $0.1 million. |
19
THIRD QUARTER 2016
CONSOLIDATED JOINT VENTURES (continued)
(unaudited and in thousands)
Income Statements
for the three months ended September 30, 2016
| Norges Joint Ventures | ||||||||||||||||
| 767 Fifth Avenue (The GM Building) |
Times Square Tower 601 Lexington Avenue 100 Federal Street Atlantic Wharf Office |
Salesforce Tower | Total Consolidated Joint Ventures |
|||||||||||||
| REVENUE |
||||||||||||||||
| Rental |
$ | 68,619 | $ | 85,969 | $ | — | $ | 154,588 | ||||||||
| Straight-line rent |
1,717 | 44 | — | 1,761 | ||||||||||||
| Fair value lease revenue |
3,466 | 1,552 | — | 5,018 | ||||||||||||
| Termination income |
— | (935 | ) | — | (935 | ) | ||||||||||
| Parking and other |
624 | 1,417 | — | 2,041 | ||||||||||||
|
|
|
|
|
|
|
|
|
|||||||||
| Total revenue |
74,426 | 88,047 | — | 162,473 | ||||||||||||
|
|
|
|
|
|
|
|
|
|||||||||
| EXPENSES |
||||||||||||||||
| Operating |
29,212 | 34,302 | (1) | — | 63,514 | |||||||||||
|
|
|
|
|
|
|
|
|
|||||||||
| NET OPERATING INCOME |
45,214 | 53,745 | — | 98,959 | ||||||||||||
| Management services income |
(375 | ) | (651 | ) | — | (1,026 | ) | |||||||||
| Interest and other income |
(90 | ) | (168 | ) | — | (258 | ) | |||||||||
| Interest expense |
24,156 | 8,243 | — | 32,399 | ||||||||||||
| Interest expense - outside members’ notes |
8,694 | — | — | 8,694 | ||||||||||||
| Fair value interest adjustment |
(11,422 | ) | — | — | (11,422 | ) | ||||||||||
| Depreciation and amortization |
24,571 | 69,173 | (1) | — | 93,744 | |||||||||||
| Other |
— | — | — | — | ||||||||||||
|
|
|
|
|
|
|
|
|
|||||||||
| SUBTOTAL |
45,534 | 76,597 | — | 122,131 | ||||||||||||
|
|
|
|
|
|
|
|
|
|||||||||
| NET INCOME/(LOSS) |
$ | (320 | ) | $ | (22,852 | ) | $ | — | $ | (23,172 | ) | |||||
|
|
|
|
|
|
|
|
|
|||||||||
| BXP’s ownership percentage |
60.00 | % | 55.00 | % | 95.00 | % | ||||||||||
|
|
|
|
|
|
|
|||||||||||
| Partners’ share of NOI (2) |
$ | 18,086 | $ | 24,185 | $ | — | $ | 42,271 | ||||||||
|
|
|
|
|
|
|
|
|
|||||||||
| BXP’s share of NOI |
$ | 27,128 | $ | 29,560 | $ | — | $ | 56,688 | ||||||||
|
|
|
|
|
|
|
|
|
|||||||||
| Unearned portion of capitalized fees (3) |
$ | 189 | $ | 61 | $ | — | $ | 250 | ||||||||
|
|
|
|
|
|
|
|
|
|||||||||
| Reconciliation of partners’ noncontrolling interest (NCI): |
||||||||||||||||
| Net income/(loss) |
$ | (320 | ) | $ | (22,852 | ) | $ | — | $ | (23,172 | ) | |||||
| Add depreciation & amortization - BXP’s basis difference |
83 | 35 | — | 118 | ||||||||||||
| Special allocation - BXP’s basis |
— | (482 | ) | — | (482 | ) | ||||||||||
| Add partners’ share of outside members’ loan interest |
8,694 | — | — | 8,694 | ||||||||||||
|
|
|
|
|
|
|
|
|
|||||||||
| Net income/(loss) before interest allocation |
$ | 8,457 | $ | (23,299 | ) | $ | — | $ | (14,842 | ) | ||||||
|
|
|
|
|
|
|
|
|
|||||||||
| Partners’ share of net income before interest allocation (2) |
$ | 3,383 | $ | (10,485 | ) | $ | — | $ | (7,102 | ) | ||||||
| Partners’ share of outside members’ loan interest (2) |
(8,694 | ) | — | — | (8,694 | ) | ||||||||||
| Allocation of management and other fees to non-controlling partners (2) |
(625 | ) | (801 | ) | — | (1,426 | ) | |||||||||
| Accretion and adjustments (2) |
— | — | (3 | ) | (3 | ) | ||||||||||
|
|
|
|
|
|
|
|
|
|||||||||
| Partners’ NCI (2) |
$ | (5,936 | ) | $ | (11,286 | ) | $ | (3 | ) | $ | (17,225 | ) | ||||
|
|
|
|
|
|
|
|
|
|||||||||
| Reconciliation of partners’ share of FFO: |
||||||||||||||||
| Net income/(loss) |
$ | (320 | ) | $ | (22,852 | ) | $ | — | $ | (23,172 | ) | |||||
| Add depreciation & amortization |
24,571 | 69,173 | — | 93,744 | ||||||||||||
|
|
|
|
|
|
|
|
|
|||||||||
| Entity FFO |
$ | 24,251 | $ | 46,321 | $ | — | $ | 70,572 | ||||||||
|
|
|
|
|
|
|
|
|
|||||||||
| Partners’ NCI (2) |
$ | (5,936 | ) | $ | (11,286 | ) | $ | (3 | ) | $ | (17,225 | ) | ||||
| Partners’ share of depreciation and amortization after BXP’s basis differential (2) |
9,795 | 31,112 | — | 40,907 | ||||||||||||
|
|
|
|
|
|
|
|
|
|||||||||
| Partners’ share FFO (2) |
$ | 3,859 | $ | 19,826 | $ | (3 | ) | $ | 23,682 | |||||||
|
|
|
|
|
|
|
|
|
|||||||||
| Reconciliation of BXP’s share of FFO: |
||||||||||||||||
| BXP’s share of net income/(loss) adjusted for partners’ NCI |
$ | 5,616 | $ | (11,566 | ) | $ | 3 | $ | (5,947 | ) | ||||||
| Depreciation & amortization - BXP’s basis difference |
83 | 35 | — | 118 | ||||||||||||
| BXP’s share of depreciation & amortization |
14,693 | 38,026 | — | 52,719 | ||||||||||||
|
|
|
|
|
|
|
|
|
|||||||||
| BXP’s share of FFO |
$ | 20,392 | $ | 26,495 | $ | 3 | $ | 46,890 | ||||||||
|
|
|
|
|
|
|
|
|
|||||||||
| Partners’ share of select items: |
||||||||||||||||
| Partners’ share of revenue (2) |
$ | 29,770 | $ | 39,621 | $ | — | $ | 69,391 | ||||||||
|
|
|
|
|
|
|
|
|
|||||||||
| Partners’ share of interest expense (2) |
$ | 18,356 | $ | 3,673 | $ | — | $ | 22,029 | ||||||||
|
|
|
|
|
|
|
|
|
|||||||||
| Partners’ share of fair value interest adjustment (2) |
$ | (4,569 | ) | $ | — | $ | — | $ | (4,569 | ) | ||||||
|
|
|
|
|
|
|
|
|
|||||||||
| Partners’ share of amortization of financing costs (2) |
$ | 2 | $ | 36 | $ | — | $ | 38 | ||||||||
|
|
|
|
|
|
|
|
|
|||||||||
| Partners’ share of capitalized interest (2) |
$ | — | $ | 21 | $ | — | $ | 21 | ||||||||
|
|
|
|
|
|
|
|
|
|||||||||
| Partners’ share of non-cash termination income adjustment (fair value lease amounts) (2) |
$ | — | $ | — | $ | — | $ | — | ||||||||
|
|
|
|
|
|
|
|
|
|||||||||
| Reconciliation of Partners’ share of NOI (2): |
||||||||||||||||
| Rental revenue |
$ | 29,770 | $ | 39,621 | $ | — | $ | 69,391 | ||||||||
| Less: Lease termination fees |
— | (421 | ) | — | (421 | ) | ||||||||||
|
|
|
|
|
|
|
|
|
|||||||||
| Rental revenue (excluding lease termination fees) |
29,770 | 40,042 | — | 69,812 | ||||||||||||
| Operating expenses |
11,684 | 15,436 | — | 27,120 | ||||||||||||
|
|
|
|
|
|
|
|
|
|||||||||
| NOI (excluding lease termination fees) |
$ | 18,086 | $ | 24,606 | $ | — | $ | 42,692 | ||||||||
|
|
|
|
|
|
|
|
|
|||||||||
| Rental revenue (excluding lease termination fees) |
$ | 29,770 | $ | 40,042 | — | $ | 69,812 | |||||||||
| Less: Straight-line rent |
687 | 20 | — | 707 | ||||||||||||
| Fair value lease revenue |
1,386 | 698 | — | 2,084 | ||||||||||||
| Add: Lease transaction costs that qualify as rent inducements (4) |
— | — | — | — | ||||||||||||
|
|
|
|
|
|
|
|
|
|||||||||
| Subtotal |
27,697 | 39,324 | — | 67,021 | ||||||||||||
| Less: Operating expenses |
11,684 | 15,436 | — | 27,120 | ||||||||||||
| Straight-line ground rent expense |
— | — | — | — | ||||||||||||
|
|
|
|
|
|
|
|
|
|||||||||
| NOI (excluding lease termination fees) - cash basis |
$ | 16,013 | $ | 23,888 | $ | — | $ | 39,901 | ||||||||
|
|
|
|
|
|
|
|
|
|||||||||
| (1) | During the three months ended September 30, 2016, the consolidated entity recognized approximately $0.8 million of demolition costs and approximately $47.6 million of depreciation expense associated with the acceleration of depreciation on the assets being removed from service as part of the redevelopment of the low-rise portion of 601 Lexington Avenue. |
| (2) | Amounts represent the partners’ share based on their respective ownership percentage. |
| (3) | Capitalized fees are eliminated in consolidation and recognized over the life of the asset as depreciation and amortization are added back to the Company’s net income. |
| (4) | Consists of lease transaction costs that qualify as rent inducements in accordance with GAAP. Leasing transaction costs are generally included in 2nd generation tenant improvements and leasing commissions in the Company’s FAD calculation on page 12. |
20
THIRD QUARTER 2016
RECONCILIATION OF NET INCOME TO NET OPERATING INCOME (NOI)
(in thousands)
| For the three months ended | ||||||||
| September 30, 2016 | September 30, 2015 | |||||||
| Net income attributable to Boston Properties, Inc. common shareholders |
$ | 76,753 | $ | 184,082 | ||||
| Preferred dividends |
2,589 | 2,647 | ||||||
|
|
|
|
|
|||||
| Net income attributable to Boston Properties, Inc. |
79,342 | 186,729 | ||||||
| Net income attributable to noncontrolling interests: |
||||||||
| Noncontrolling interest - common units of the Operating Partnership |
9,387 | 21,302 | ||||||
| Noncontrolling interest in property partnerships (1) |
(17,225 | ) | 115,240 | |||||
|
|
|
|
|
|||||
| Net income |
71,504 | 323,271 | ||||||
| Gains on sales of real estate |
(12,983 | ) | (199,479 | ) | ||||
|
|
|
|
|
|||||
| Income before gains on sales of real estate |
58,521 | 123,792 | ||||||
| Add: |
||||||||
| Losses from interest rate contracts |
140 | — | ||||||
| Losses from early extinguishments of debt |
371 | — | ||||||
| Interest expense |
104,641 | 108,727 | ||||||
| Depreciation and amortization |
203,748 | 153,015 | ||||||
| Impairment loss |
1,783 | — | ||||||
| Transaction costs |
249 | 254 | ||||||
| General and administrative expense |
25,165 | 20,944 | ||||||
| Subtract: |
||||||||
| Gains (losses) from investments in securities |
(976 | ) | 1,515 | |||||
| Interest and other income |
(3,628 | ) | (3,637 | ) | ||||
| Income from unconsolidated joint ventures |
(1,464 | ) | (2,647 | ) | ||||
| Development and management services income |
(6,364 | ) | (5,912 | ) | ||||
|
|
|
|
|
|||||
| Net Operating Income (NOI) |
382,186 | 396,051 | ||||||
| Add: |
||||||||
| BXP’s share of NOI from unconsolidated joint ventures |
14,436 | (2) | 10,827 | |||||
|
|
|
|
|
|||||
| Combined NOI |
396,622 | 406,878 | ||||||
| Subtract: |
||||||||
| Partners’ share of NOI from consolidated joint ventures |
(42,271 | )(3) | (55,450 | ) | ||||
|
|
|
|
|
|||||
| BXP’s Share of Combined NOI |
354,351 | 351,428 | ||||||
| Subtract: |
||||||||
| Lease termination fees |
170 | (9,589 | ) | |||||
| BXP’s share of lease termination fees from unconsolidated joint ventures |
(8 | )(2) | — | |||||
| Add: |
||||||||
| Partners’ share of lease termination fees from consolidated joint ventures |
(421 | )(3) | 1,829 | |||||
|
|
|
|
|
|||||
| BXP’s Share of Combined NOI (excluding lease termination fees) |
$ | 354,092 | $ | 343,668 | ||||
|
|
|
|
|
|||||
| Net Operating Income (NOI) |
$ | 382,186 | $ | 396,051 | ||||
| Subtract: |
||||||||
| NOI from non Same Properties (excluding lease termination fees) (4)(5) |
(14,312 | ) | (15,562 | ) | ||||
| Lease termination fees |
170 | (9,589 | ) | |||||
|
|
|
|
|
|||||
| Same Property NOI (excluding lease termination fees) |
368,044 | 370,900 | ||||||
| Add: |
||||||||
| BXP’s share of NOI from unconsolidated joint ventures |
14,436 | (2) | 10,827 | |||||
| Subtract: |
||||||||
| BXP’s share of NOI from non Same Properties from unconsolidated joint ventures (4) |
(4,862 | ) | (95 | ) | ||||
| BXP’s share of lease termination fees from unconsolidated joint ventures |
(8 | )(2) | — | |||||
|
|
|
|
|
|||||
| Combined Same Property NOI (excluding lease termination fees) |
377,610 | 381,632 | ||||||
| Subtract: |
||||||||
| Partners’ share of NOI from consolidated joint ventures |
(42,271 | )(3) | (55,450 | ) | ||||
| Add: |
||||||||
| Partners’ share of lease termination fees from consolidated joint ventures |
(421 | )(3) | 1,829 | |||||
| Partners’ share of NOI from non Same Properties from consolidated joint ventures (excluding lease termination fees) (4)(5) |
(460 | )(3) | 5,323 | |||||
|
|
|
|
|
|||||
| BXP’s Share of Combined Same Property NOI (excluding lease termination fees) |
$ | 334,458 | $ | 333,334 | ||||
|
|
|
|
|
|||||
| (1) | These partnerships include 505 9th Street, N.W. in Washington, DC, which was sold on September 18, 2015, Fountain Square in Reston, VA, of which the Company acquired the remaining 50% interest on September 15, 2015, 767 Fifth Avenue (The GM Building), 601 Lexington Avenue and Times Square Tower in New York City, Salesforce Tower in San Francisco, CA and 100 Federal Street and Atlantic Wharf Office Building in Boston, MA. For additional information, refer to page 10. |
| (2) | For disclosures related to the calculation of BXP’s share from unconsolidated joint ventures, see page 18. |
| (3) | For disclosures related to the calculation of Partners’ share from consolidated joint ventures, see page 20. |
| (4) | Pages 27-29 indicate by footnote the properties that are not included as part of Same Property NOI. Non Same Properties include properties that were sold prior to September 30, 2016 and therefore are no longer a part of the Company’s property portfolio. |
| (5) | During the three months ended September 30, 2016, approximately 13% of 601 Lexington Avenue complex was removed from the in-service portfolio as part of a planned redevelopment. As a result, the partners’ share of NOI for the three months ended September 30, 2015, related to the planned redevelopment at 601 Lexington Avenue, is included in Partners’ share of NOI from non Same Properties from consolidated joint ventures. |
21
THIRD QUARTER 2016
RECONCILIATION OF NET INCOME TO NET OPERATING INCOME (NOI) - CASH BASIS
(in thousands)
| For the three months ended | ||||||||
| September 30, 2016 | September 30, 2015 | |||||||
| Net income attributable to Boston Properties, Inc. common shareholders |
$ | 76,753 | $ | 184,082 | ||||
| Preferred dividends |
2,589 | 2,647 | ||||||
|
|
|
|
|
|||||
| Net income attributable to Boston Properties, Inc. |
79,342 | 186,729 | ||||||
| Net income attributable to noncontrolling interests: |
||||||||
| Noncontrolling interest - common units of the Operating Partnership |
9,387 | 21,302 | ||||||
| Noncontrolling interest in property partnerships (1) |
(17,225 | ) | 115,240 | |||||
|
|
|
|
|
|||||
| Net income |
71,504 | 323,271 | ||||||
| Gains on sales of real estate |
(12,983 | ) | (199,479 | ) | ||||
|
|
|
|
|
|||||
| Income before gains on sales of real estate |
58,521 | 123,792 | ||||||
| Add: |
||||||||
| Losses from interest rate contracts |
140 | — | ||||||
| Losses from early extinguishments of debt |
371 | — | ||||||
| Interest expense |
104,641 | 108,727 | ||||||
| Depreciation and amortization |
203,748 | 153,015 | ||||||
| Impairment loss |
1,783 | — | ||||||
| Transaction costs |
249 | 254 | ||||||
| General and administrative expense |
25,165 | 20,944 | ||||||
| Subtract: |
||||||||
| Gains (losses) from investments in securities |
(976 | ) | 1,515 | |||||
| Interest and other income |
(3,628 | ) | (3,637 | ) | ||||
| Income from unconsolidated joint ventures |
(1,464 | ) | (2,647 | ) | ||||
| Development and management services income |
(6,364 | ) | (5,912 | ) | ||||
|
|
|
|
|
|||||
| Net Operating Income (NOI) |
382,186 | 396,051 | ||||||
| Subtract: |
||||||||
| Straight-line rent |
(11,107 | ) | (15,992 | ) | ||||
| Fair value lease revenue |
(6,547 | ) | (8,838 | ) | ||||
| Add: |
||||||||
| Straight-line ground rent expense adjustment (2) |
1,031 | 891 | ||||||
| Lease transaction costs that qualify as rent inducements (3) |
861 | 1,911 | ||||||
|
|
|
|
|
|||||
| NOI - cash basis |
366,424 | $ | 374,023 | |||||
| Subtract: |
||||||||
| NOI (excluding lease termination fees) - cash basis from non Same Properties (4)(7) |
(12,000 | ) | (13,240 | ) | ||||
| Lease termination fees |
170 | (9,589 | ) | |||||
|
|
|
|
|
|||||
| Same Property NOI (excluding lease termination fees) - cash basis |
354,594 | 351,194 | ||||||
| Add: |
||||||||
| BXP’s share of NOI - cash basis from unconsolidated joint ventures |
10,655 | (5) | 11,145 | |||||
| Subtract: |
||||||||
| BXP’s share of NOI (excluding lease termination fees) - cash basis from non Same Properties from unconsolidated joint ventures (4) |
(2,924 | ) | (899 | ) | ||||
| BXP’s share of lease termination fees from unconsolidated joint ventures |
(8 | )(5) | — | |||||
|
|
|
|
|
|||||
| Combined Same Property NOI (excluding lease termination fees) - cash basis |
362,317 | 361,440 | ||||||
| Subtract: |
||||||||
| Partners’ share of NOI - cash basis from consolidated joint ventures |
(39,480 | )(6) | (49,726 | ) | ||||
| Add: |
||||||||
| Partners’ share of lease termination fees from consolidated joint ventures |
(421 | )(6) | 1,829 | |||||
| Partners’ share of NOI (excluding lease termination fees) - cash basis from non Same Properties from consolidated joint ventures (4)(7) |
(231 | )(6) | 5,290 | |||||
|
|
|
|
|
|||||
| BXP’s Share of Combined Same Property NOI (excluding lease termination fees) - cash basis |
$ | 322,185 | $ | 318,833 | ||||
|
|
|
|
|
|||||
| (1) | These partnerships include 505 9th Street, N.W. in Washington, DC, which was sold on September 18, 2015, Fountain Square in Reston, VA, of which the Company acquired the remaining 50% interest on September 15, 2015, 767 Fifth Avenue (The GM Building), 601 Lexington Avenue and Times Square Tower in New York City, Salesforce Tower in San Francisco, CA and 100 Federal Street and Atlantic Wharf Office Building in Boston, MA. For additional information, refer to page 10. |
| (2) | For additional information, refer to page 13. |
| (3) | Consists of lease transaction costs that qualify as rent inducements in accordance with GAAP. Lease transaction costs are generally included in 2nd generation tenant improvements and leasing commissions in the Company’s FAD calculation on page 13. |
| (4) | Pages 27-29 indicate by footnote the properties that are not included as part of Same Property NOI. Non Same Properties include dispositions that occurred prior to September 30, 2016 and therefore are no longer a part of the Company’s property portfolio. |
| (5) | For disclosures related to the calculation of BXP’s share from unconsolidated joint ventures, see page 18. |
| (6) | For disclosures related to the calculation of Partners’ share from consolidated joint ventures, see page 20. |
| (7) | During the three months ended September 30, 2016, approximately 13% of 601 Lexington Avenue complex was removed from the in-service portfolio as part of a planned redevelopment. As a result, the partners’s share of NOI—cash basis for the three months ended September 30, 2015, related to the planned redevelopment at 601 Lexington Avenue, is included in NOI—cash basis from non Same Properties from Partners’ share of consolidated joint ventures. |
22
THIRD QUARTER 2016
SAME PROPERTY NET OPERATING INCOME (NOI) BY REPORTABLE SEGMENT
(dollars in thousands)
| Office (1) | Hotel & Residential | |||||||||||||||||||||||||||||||
| For the three months ended | For the three months ended | |||||||||||||||||||||||||||||||
| 30-Sep-16 | 30-Sep-15 | $ Change | % Change | 30-Sep-16 | 30-Sep-15 | $ Change | % Change | |||||||||||||||||||||||||
| Rental Revenue |
$ | 580,778 | $ | 585,352 | $ | 16,726 | $ | 16,730 | ||||||||||||||||||||||||
| Less: Lease termination fees |
836 | 10,133 | — | — | ||||||||||||||||||||||||||||
|
|
|
|
|
|
|
|
|
|||||||||||||||||||||||||
| Rental revenue (excluding lease termination fees) (2) |
579,942 | 575,219 | $ | 4,723 | 0.8 | % | 16,726 | 16,730 | $ | (4 | ) | (0.0 | )% | |||||||||||||||||||
| Less: Operating expenses and real estate taxes |
218,906 | 211,390 | 7,516 | 3.6 | % | 9,718 | 9,659 | 59 | 0.6 | % | ||||||||||||||||||||||
|
|
|
|
|
|
|
|
|
|
|
|
|
|
|
|
|
|||||||||||||||||
| NOI (excluding lease termination fees) (3) |
$ | 361,036 | $ | 363,829 | $ | (2,793 | ) | (0.8 | )% | $ | 7,008 | $ | 7,071 | $ | (63 | ) | (0.9 | )% | ||||||||||||||
|
|
|
|
|
|
|
|
|
|
|
|
|
|
|
|
|
|||||||||||||||||
| Rental revenue (excluding lease termination fees) |
$ | 579,942 | $ | 575,219 | $ | 16,726 | $ | 16,730 | ||||||||||||||||||||||||
| Less: Straight-line rent and fair value lease revenue |
15,160 | 21,946 | (6,786 | ) | (30.9 | )% | 15 | 20 | (5 | ) | (25.0 | )% | ||||||||||||||||||||
| Add: Lease transaction costs that qualify as rent inducements (4) |
694 | 1,369 | (675 | ) | (49.3 | )% | — | — | — | — | ||||||||||||||||||||||
|
|
|
|
|
|
|
|
|
|
|
|
|
|
|
|
|
|||||||||||||||||
| Subtotal |
565,476 | 554,642 | 10,834 | 2.0 | % | 16,711 | 16,710 | 1 | 0.0 | % | ||||||||||||||||||||||
| Less: Operating expenses and real estate taxes |
218,906 | 211,390 | 7,516 | 3.6 | % | 9,718 | 9,659 | 59 | 0.6 | % | ||||||||||||||||||||||
| Add: Straight-line ground rent expense (5) |
1,031 | 891 | 140 | 15.7 | % | — | — | — | — | |||||||||||||||||||||||
|
|
|
|
|
|
|
|
|
|
|
|
|
|
|
|
|
|||||||||||||||||
| NOI (excluding lease termination fees) - cash basis |
$ | 347,601 | $ | 344,143 | $ | 3,458 | 1.0 | % | $ | 6,993 | $ | 7,051 | $ | (58 | ) | (0.8 | )% | |||||||||||||||
|
|
|
|
|
|
|
|
|
|
|
|
|
|
|
|
|
|||||||||||||||||
| Consolidated Total (1) | Unconsolidated Joint Ventures (BXP’s Share) | |||||||||||||||||||||||||||||||
| For the three months ended | For the three months ended | |||||||||||||||||||||||||||||||
| 30-Sep-16 | 30-Sep-15 | $ Change | % Change | 30-Sep-16 | 30-Sep-15 | $ Change | % Change | |||||||||||||||||||||||||
| Rental Revenue |
$ | 597,504 | $ | 602,082 | $ | 17,720 | $ | 18,563 | ||||||||||||||||||||||||
| Less: Lease termination fees |
836 | 10,133 | 8 | — | ||||||||||||||||||||||||||||
|
|
|
|
|
|
|
|
|
|||||||||||||||||||||||||
| Rental revenue (excluding lease termination fees) (2) |
596,668 | 591,949 | $ | 4,719 | 0.8 | % | 17,712 | 18,563 | $ | (851 | ) | (4.6 | )% | |||||||||||||||||||
| Less: Operating expenses and real estate taxes |
228,624 | 221,049 | 7,575 | 3.4 | % | 8,146 | 7,831 | 315 | 4.0 | % | ||||||||||||||||||||||
|
|
|
|
|
|
|
|
|
|
|
|
|
|
|
|
|
|||||||||||||||||
| NOI (excluding lease termination fees) (3) |
$ | 368,044 | $ | 370,900 | $ | (2,856 | ) | (0.8 | )% | $ | 9,566 | $ | 10,732 | $ | (1,166 | ) | (10.9 | )% | ||||||||||||||
|
|
|
|
|
|
|
|
|
|
|
|
|
|
|
|
|
|||||||||||||||||
| Rental revenue (excluding lease termination fees) |
$ | 596,668 | $ | 591,949 | $ | 17,712 | $ | 18,563 | ||||||||||||||||||||||||
| Less: Straight-line rent and fair value lease revenue |
15,175 | 21,966 | (6,791 | ) | (30.9 | )% | 1,858 | 633 | 1,225 | 193.5 | % | |||||||||||||||||||||
| Add: Lease transaction costs that qualify as rent inducements (4) |
694 | 1,369 | (675 | ) | (49.3 | )% | 15 | 147 | (132 | ) | (89.8 | )% | ||||||||||||||||||||
|
|
|
|
|
|
|
|
|
|
|
|
|
|
|
|
|
|||||||||||||||||
| Subtotal |
582,187 | 571,352 | 10,835 | 1.9 | % | 15,869 | 18,077 | (2,208 | ) | (12.2 | )% | |||||||||||||||||||||
| Less: Operating expenses and real estate taxes |
228,624 | 221,049 | 7,575 | 3.4 | % | 8,146 | 7,831 | 315 | 4.0 | % | ||||||||||||||||||||||
| Add: Straight-line ground rent expense (5) |
1,031 | 891 | 140 | 15.7 | % | — | — | — | — | |||||||||||||||||||||||
|
|
|
|
|
|
|
|
|
|
|
|
|
|
|
|
|
|||||||||||||||||
| NOI (excluding lease termination fees) - cash basis |
$ | 354,594 | (6) | $ | 351,194 | (6) | $ | 3,400 | 1.0 | % | $ | 7,723 | $ | 10,246 | $ | (2,523 | ) | (24.6 | )% | |||||||||||||
|
|
|
|
|
|
|
|
|
|
|
|
|
|
|
|
|
|||||||||||||||||
| Combined | BXP’s Share of Combined (7) | |||||||||||||||||||||||||||||||
| For the three months ended | For the three months ended | |||||||||||||||||||||||||||||||
| 30-Sep-16 | 30-Sep-15 | $ Change | % Change | 30-Sep-16 | 30-Sep-15 | $ Change | % Change | |||||||||||||||||||||||||
| Rental Revenue |
$ | 615,224 | $ | 620,645 | $ | 545,881 | $ | 544,508 | ||||||||||||||||||||||||
| Less: Lease termination fees |
844 | 10,133 | 812 | 8,549 | ||||||||||||||||||||||||||||
|
|
|
|
|
|
|
|
|
|||||||||||||||||||||||||
| Rental revenue (excluding lease termination fees) (2) |
614,380 | 610,512 | $ | 3,868 | 0.6 | % | 545,069 | 535,959 | $ | 9,110 | 1.7 | % | ||||||||||||||||||||
| Less: Operating expenses and real estate taxes |
236,770 | 228,880 | 7,890 | 3.4 | % | 210,611 | 202,625 | 7,986 | 3.9 | % | ||||||||||||||||||||||
|
|
|
|
|
|
|
|
|
|
|
|
|
|
|
|
|
|||||||||||||||||
| NOI (excluding lease termination fees) (3) |
$ | 377,610 | $ | 381,632 | $ | (4,022 | ) | (1.1 | )% | $ | 334,458 | $ | 333,334 | $ | 1,124 | 0.3 | % | |||||||||||||||
|
|
|
|
|
|
|
|
|
|
|
|
|
|
|
|
|
|||||||||||||||||
| Rental revenue (excluding lease termination fees) |
$ | 614,380 | $ | 610,512 | $ | 545,069 | $ | 535,959 | ||||||||||||||||||||||||
| Less: Straight-line rent and fair value lease revenue |
17,033 | $ | 22,599 | (5,566 | ) | (24.6 | )% | 14,013 | 16,494 | (2,481 | ) | (15.0 | )% | |||||||||||||||||||
| Add: Lease transaction costs that qualify as rent inducements (4) |
709 | $ | 1,516 | (807 | ) | (53.2 | )% | 709 | 1,103 | (394 | ) | (35.7 | )% | |||||||||||||||||||
|
|
|
|
|
|
|
|
|
|
|
|
|
|
|
|
|
|||||||||||||||||
| Subtotal |
598,056 | $ | 589,429 | 8,627 | 1.5 | % | 531,765 | 520,568 | 11,197 | 2.2 | % | |||||||||||||||||||||
| Less: Operating expenses and real estate taxes |
236,770 | $ | 228,880 | 7,890 | 3.4 | % | 210,611 | 202,625 | 7,986 | 3.9 | % | |||||||||||||||||||||
| Add: Straight-line ground rent expense (5) |
1,031 | $ | 891 | 140 | 15.7 | % | 1,031 | 890 | 141 | 15.8 | % | |||||||||||||||||||||
|
|
|
|
|
|
|
|
|
|
|
|
|
|
|
|
|
|||||||||||||||||
| NOI (excluding lease termination fees) - cash basis (6) |
$ | 362,317 | $ | 361,440 | $ | 877 | 0.2 | % | $ | 322,185 | $ | 318,833 | $ | 3,352 | 1.1 | % | ||||||||||||||||
|
|
|
|
|
|
|
|
|
|
|
|
|
|
|
|
|
|||||||||||||||||
| (1) | Includes 100% share of consolidated joint ventures. Same Property consolidated joint venture properties includes Fountain Square in Reston, VA, of which the Company acquired the remaining 50% interest on September 15, 2015, 767 Fifth Avenue (The GM Building), 601 Lexington Avenue (excluding the low-rise portion that is under redevelopment) and Times Square Tower in New York City and 100 Federal Street and Atlantic Wharf Office Building in Boston, MA. |
| (2) | Rental Revenue (excluding lease termination fees) is used internally by the Company as a performance measure and provides investors with additional information regarding operating performance at a property level that allows them to compare operating performance between periods without taking into account lease termination fees, which can distort the results for any given period because they generally represent multiple months or years of a tenant’s rental obligations that are paid in a lump sum in connection with a negotiated early termination of the tenant’s lease and are not reflective of the core ongoing operating performance of the Company’s properties. |
| (3) | For a quantitative reconciliation of net income attributable to Boston Properties, Inc. common shareholders to net operating income (NOI) (excluding lease termination fees), see page 21. For disclosures relating to the Company’s use of NOI, see page 48. |
| (4) | Consists of lease transaction costs that qualify as rent inducements in accordance with GAAP. Lease transaction costs are generally included in 2nd generation tenant improvements and leasing commissions in the Company’s FAD calculation on page 13. |
| (5) | For additional information, see page 13. |
| (6) | For a quantitative reconciliation of net income attributable to Boston Properties, Inc. common shareholders to NOI (excluding lease termination fees)—cash basis, see page 22. For disclosures relating to the Company’s use of NOI, see page 48. |
| (7) | See page 20 for the partners’ share of each line item. |
23
THIRD QUARTER 2016
RESIDENTIAL and HOTEL PERFORMANCE
Rental Rates and Occupancy
| Third Quarter | Percent | YTD | Percent | |||||||||||||||||||||
| 2016 | 2015 | Change | 2016 | 2015 | Change | |||||||||||||||||||
| The Avant at Reston Town Center (359 units) |
||||||||||||||||||||||||
| Reston, VA |
||||||||||||||||||||||||
| Average Monthly Rental Rate (1) |
$ | 2,429 | $ | 2,264 | 7.3 | % | $ | 2,375 | $ | 2,257 | 5.2 | % | ||||||||||||
| Average Rental Rate Per Occupied Square Foot (1) |
$ | 2.68 | $ | 2.45 | 9.4 | % | $ | 2.61 | $ | 2.44 | 7.0 | % | ||||||||||||
| Average Physical Occupancy (1) (2) |
95.6 | % | 94.4 | % | 1.3 | % | 94.2 | % | 89.5 | % | 5.3 | % | ||||||||||||
| Average Economic Occupancy (2) |
95.6 | % | 93.9 | % | 1.8 | % | 94.1 | % | 87.6 | % | 7.4 | % | ||||||||||||
| The Lofts at Atlantic Wharf (86 units) |
||||||||||||||||||||||||
| Boston, MA |
||||||||||||||||||||||||
| Average Monthly Rental Rate (3) |
$ | 4,146 | $ | 4,054 | 2.3 | % | $ | 4,150 | $ | 4,027 | 3.1 | % | ||||||||||||
| Average Rental Rate Per Occupied Square Foot (3) |
$ | 4.63 | $ | 4.53 | 2.2 | % | $ | 4.59 | $ | 4.49 | 2.2 | % | ||||||||||||
| Average Physical Occupancy (2) (3) |
97.3 | % | 95.4 | % | 2.0 | % | 96.3 | % | 96.8 | % | (0.5 | )% | ||||||||||||
| Average Economic Occupancy (2) |
97.7 | % | 97.1 | % | 0.6 | % | 97.3 | % | 97.6 | % | (0.3 | )% | ||||||||||||
| Boston Marriott Cambridge (433 rooms) |
||||||||||||||||||||||||
| Cambridge, MA |
||||||||||||||||||||||||
| Average Occupancy |
87.2 | % | 86.8 | % | 0.5 | % | 82.2 | % | 84.1 | % | (2.3 | )% | ||||||||||||
| Average Daily Rate |
$ | 279.03 | $ | 288.43 | (3.3 | )% | $ | 269.10 | $ | 271.88 | (1.0 | )% | ||||||||||||
| Revenue per available room |
$ | 243.19 | $ | 250.41 | (2.9 | )% | $ | 221.28 | $ | 294.63 | (24.9 | )% | ||||||||||||
Net Operating Income (dollars in thousands) (4)
| Residential | Hotel | |||||||||||||||||||||||
| Third Quarter | Percent | Third Quarter | Percent | |||||||||||||||||||||
| 2016 | 2015 | Change | 2016 | 2015 | Change | |||||||||||||||||||
| Rental Revenue |
$ | 4,372 | (5) | $ | 4,111 | (5) | 6.3 | % | $ | 12,354 | $ | 12,619 | (2.1 | )% | ||||||||||
| Less: Operating expenses and real estate taxes |
2,223 | (6) | 1,534 | 44.9 | % | 8,118 | 8,125 | (0.1 | )% | |||||||||||||||
|
|
|
|
|
|
|
|
|
|
|
|
|
|||||||||||||
| Net Operating Income |
$ | 2,149 | (5) | $ | 2,577 | (5) | (16.6 | )% | $ | 4,236 | $ | 4,494 | (5.7 | )% | ||||||||||
|
|
|
|
|
|
|
|
|
|
|
|
|
|||||||||||||
| Rental Revenue |
$ | 4,372 | (5) | $ | 4,111 | (5) | $ | 12,354 | $ | 12,619 | ||||||||||||||
| Less: Straight-line rent and fair value lease revenue |
14 | 19 | (26.3 | )% | 1 | 1 | — | |||||||||||||||||
|
|
|
|
|
|
|
|
|
|
|
|
|
|||||||||||||
| Subtotal |
4,358 | 4,092 | 6.5 | % | 12,353 | 12,618 | (2.1 | )% | ||||||||||||||||
| Less: Operating expenses and real estate taxes |
2,223 | (6) | 1,534 | 44.9 | % | 8,118 | 8,125 | (0.1 | )% | |||||||||||||||
| Add: Straight-line ground rent expense |
— | — | — | — | — | — | ||||||||||||||||||
|
|
|
|
|
|
|
|
|
|
|
|
|
|||||||||||||
| Net Operating Income - cash basis |
$ | 2,135 | (5) | $ | 2,558 | (5) | (16.5 | )% | $ | 4,235 | $ | 4,493 | (5.7 | )% | ||||||||||
|
|
|
|
|
|
|
|
|
|
|
|
|
|||||||||||||
| (1) | Excludes 26,179 square feet of retail space which is 100% leased. |
| (2) | For disclosures related to the Company’s definition of Average Physical and Average Economic Occupancy, see page 47. |
| (3) | Excludes 9,617 square feet of retail space which is 100% leased. |
| (4) | For disclosures related to the Company’s definition of Net Operating Income, see page 48. |
| (5) | Includes 35,796 square feet of retail space, which had revenue of approximately $672 and $618 for the three months ended September 30, 2016 and September 30, 2015, respectively. |
| (6) | Includes approximately $623 of demolition costs related to the Cambridge Residential / 88 Ames Street development project. |
24
THIRD QUARTER 2016
HISTORICALLY GENERATED CAPITAL EXPENDITURES, TENANT IMPROVEMENT COSTS and LEASING COMMISSIONS
(dollars in thousands, except PSF amounts)
Historical Capital Expenditures
| Q3 2016 | Q2 2016 | Q1 2016 | 2015 | 2014 | 2013 | |||||||||||||||||||
| Maintenance capital expenditures |
$ | 11,889 | $ | 9,654 | $ | 21,961 | $ | 56,383 | $ | 45,618 | $ | 48,353 | ||||||||||||
| Partners’ share of maintenance capital expenditures from consolidated joint ventures |
(377 | ) | (422 | ) | (573 | ) | (5,565 | ) | (4,377 | ) | (766 | ) | ||||||||||||
| BXP’s share of maintenance capital expenditures from unconsolidated joint ventures |
283 | 112 | 197 | 1,653 | 1,369 | 3,439 | ||||||||||||||||||
| Hotel improvements, equipment upgrades and replacements |
2,137 | 434 | 360 | 2,430 | 2,894 | 2,070 | ||||||||||||||||||
| Planned capital expenditures associated with acquisition properties |
— | — | 87 | 6,914 | 14,652 | 21,041 | ||||||||||||||||||
| Partners’ share of planned capital expenditures associated with acquisition properties from consolidated joint ventures |
— | — | — | (845 | ) | (1,565 | ) | (535 | ) | |||||||||||||||
| BXP’s share of planned capital expenditures associated with acquisition properties from unconsolidated joint ventures |
92 | — | — | — | — | 0 | ||||||||||||||||||
| Repositioning capital expenditures |
7,932 | (1) | 12,461 | (1) | 13,007 | (1) | 9,744 | — | — | |||||||||||||||
| Partners’ share of repositioning capital expenditures from consolidated joint ventures |
— | — | — | — | — | — | ||||||||||||||||||
| BXP’s share of repositioning capital expenditures from unconsolidated joint ventures |
216 | (2) | 14 | (2) | 8 | (2) | 76 | — | — | |||||||||||||||
|
|
|
|
|
|
|
|
|
|
|
|
|
|||||||||||||
| $ | 22,172 | $ | 22,253 | $ | 35,047 | $ | 70,790 | $ | 58,591 | $ | 73,602 | |||||||||||||
|
|
|
|
|
|
|
|
|
|
|
|
|
|||||||||||||
2nd Generation Tenant Improvements and Leasing Commissions (3)
| Q3 2016 | Q2 2016 | Q1 2016 | 2015 | 2014 | 2013 | |||||||||||||||||||
| Square feet |
1,177,378 | 1,304,751 | 1,376,563 | 5,204,123 | 3,936,046 | 3,610,088 | ||||||||||||||||||
|
|
|
|
|
|
|
|
|
|
|
|
|
|||||||||||||
| Tenant improvements and lease commissions PSF |
$ | 59.26 | $ | 70.13 | $ | 48.87 | $ | 45.40 | $ | 29.60 | $ | 36.99 | ||||||||||||
|
|
|
|
|
|
|
|
|
|
|
|
|
|||||||||||||
| (1) | Includes capital expenditures related to the repositioning activities designed to enhance revenue potential at 1330 Connecticut Avenue in Washington, DC, Prudential Center Retail Improvements in Boston, MA, and 399 Park Avenue in New York City. |
| (2) | Includes capital expenditures related to the repositioning activities designed to enhance revenue potential at Metropolitan Square in Washington, DC. |
| (3) | Includes 100% of unconsolidated joint ventures. |
25
THIRD QUARTER 2016
PORTFOLIO OVERVIEW
for the three months ended September 30, 2016
(dollars in thousands)
Rentable Square Footage of In-Service Properties by Location and Unit Type (1) (2)
| Geographic Area |
Office | Retail | Residential | Hotel | Total | |||||||||||||||
| Boston |
12,789,730 | 869,227 | 77,480 | 330,000 | 14,066,437 | |||||||||||||||
| New York |
11,184,690 | 339,936 | — | — | 11,524,626 | |||||||||||||||
| San Francisco and Los Angeles |
6,847,982 | 348,946 | — | — | 7,196,928 | |||||||||||||||
| Washington, DC |
9,898,661 | 689,563 | 329,168 | — | 10,917,392 | |||||||||||||||
|
|
|
|
|
|
|
|
|
|
|
|||||||||||
| Total |
40,721,063 | 2,247,672 | 406,648 | 330,000 | 43,705,383 | |||||||||||||||
|
|
|
|
|
|
|
|
|
|
|
|||||||||||
| % of Total |
93.2 | % | 5.1 | % | 0.9 | % | 0.8 | % | 100.0 | % | ||||||||||
Rentable Square Footage and Rental Revenue of In-Service Properties by Unit Type (1)(2)(3)
| Partners’ Share | BXP’s Share of | |||||||||||||||||||||||
| of Revenue from | Revenue from | |||||||||||||||||||||||
| Consolidated | Consolidated | Unconsolidated | ||||||||||||||||||||||
| Unit Type |
Square Feet | Revenue | Joint Ventures (4) | Joint Ventures (5) | Total | % of Total | ||||||||||||||||||
| Office |
40,721,063 | $ | 451,606 | $ | (51,036 | ) | $ | 18,862 | $ | 419,432 | 85.4 | % | ||||||||||||
| Retail |
2,247,672 | 34,244 | (5,067 | ) | 909 | 30,086 | 6.1 | % | ||||||||||||||||
| Residential |
406,648 | 3,529 | — | — | 3,529 | 0.7 | % | |||||||||||||||||
| Hotel |
330,000 | 12,262 | (6) | — | — | 12,262 | 2.5 | % | ||||||||||||||||
| Parking and other |
N/A | 24,638 | (7) | (887 | ) | 2,269 | 26,020 | 5.3 | % | |||||||||||||||
|
|
|
|
|
|
|
|
|
|
|
|
|
|||||||||||||
| Total |
43,705,383 | $ | 526,279 | $ | (56,990 | ) | $ | 22,040 | $ | 491,329 | 100.0 | % | ||||||||||||
|
|
|
|
|
|
|
|
|
|
|
|
|
|||||||||||||
Rentable Square Footage of In-Service Same Properties by Unit Type (1)(2)(8)
| Same Properties |
Office | Retail | Residential | Hotel | Total | |||||||||||||||
| Square Feet |
38,039,279 | 2,141,520 | 406,648 | 330,000 | 40,917,447 | |||||||||||||||
| % of Properties In-Service |
93.4 | % | 95.3 | % | 100.0 | % | 100.0 | % | 93.6 | % | ||||||||||
Percentage of BXP’s Share of Combined Net Operating Income (excluding lease termination fees) by Location and Type of Property (1) (9)
| Geographic Area |
Office | Residential | Hotel | Total | ||||||||||||
| Boston |
29.3 | % | 0.2 | % | 1.2 | % | 30.7 | % | ||||||||
| New York |
31.2 | % | — | — | 31.2 | % | ||||||||||
| San Francisco and Los Angeles |
16.5 | % | — | — | 16.5 | % | ||||||||||
| Washington, DC |
21.0 | % | 0.6 | % | — | 21.6 | % | |||||||||
|
|
|
|
|
|
|
|
|
|||||||||
| Total |
98.0 | % | 0.8 | % | 1.2 | % | 100.0 | % | ||||||||
|
|
|
|
|
|
|
|
|
|||||||||
| Geographic Area |
CBD | Suburban | Total | |||||||||||||
| Boston |
24.1 | % | 6.6 | % | 30.7 | % | ||||||||||
| New York |
28.7 | % | 2.5 | % | 31.2 | % | ||||||||||
| San Francisco and Los Angeles |
13.2 | % | 3.3 | % | 16.5 | % | ||||||||||
| Washington, DC |
9.4 | % | 12.2 | % | 21.6 | % | ||||||||||
|
|
|
|
|
|
|
|||||||||||
| Total |
75.4 | % | 24.6 | % | 100.0 | % | ||||||||||
|
|
|
|
|
|
|
|||||||||||
| (1) | For the definition of In-Service Properties and related disclosures, see page 48. |
| (2) | Includes 100% of the rentable square footage of the Company’s In-Service Properties. For additional detail relating to the Company’s In-Service Properties, see pages 27-29. |
| (3) | Excludes recoveries from tenants. |
| (4) | For additional information, see page 20. |
| (5) | Represents the Company’s share. For additional information, see page 18. |
| (6) | Excludes approximately $67 of base rent from retail tenants which is included in Retail above and approximately $25 of recoveries from tenants. |
| (7) | Includes approximately $1,700 of other income. |
| (8) | Pages 27-29 indicate by footnote the properties which are not included as part of Same Properties. |
| (9) | BXP’s Share of Combined Net Operating Income (NOI) (excluding lease termination fees) is a non-GAAP financial measure. For a quantitative reconciliation of net income attributable to Boston Properties, Inc. common shareholders to BXP’s Share of Combined NOI (excluding lease termination fees), see page 21. For disclosures relating to the Company’s use of BXP’s Share of Combined NOI (excluding lease termination fees), see pages 47-48. |
26
THIRD QUARTER 2016
IN-SERVICE PROPERTY LISTING
as of September 30, 2016
| Sub Market |
Number of Buildings |
Square Feet |
Leased % (1) |
Annualized Rental Obligations Per Leased SF (2) |
Encumbered with secured debt (Y/N) |
Central Business District (CBD) or Suburban (S) |
||||||||||||||||||||||
| Boston |
||||||||||||||||||||||||||||
| Office |
||||||||||||||||||||||||||||
| 200 Clarendon Street |
CBD Boston MA |
1 | 1,746,151 | 80.2 | % | $ | 63.94 | N | CBD | |||||||||||||||||||
| 100 Federal Street (55% ownership) |
CBD Boston MA |
1 | 1,273,968 | 85.8 | % | 51.57 | N | CBD | ||||||||||||||||||||
| 800 Boylston Street - The Prudential Center |
CBD Boston MA |
1 | 1,229,384 | 93.1 | % | 59.87 | N | CBD | ||||||||||||||||||||
| 111 Huntington Avenue - The Prudential Center |
CBD Boston MA |
1 | 860,455 | 97.1 | % | 63.30 | N | CBD | ||||||||||||||||||||
| Atlantic Wharf Office (55% ownership) |
CBD Boston MA |
1 | 793,827 | 100.0 | % | 67.94 | N | CBD | ||||||||||||||||||||
| 101 Huntington Avenue - The Prudential Center |
CBD Boston MA |
1 | 505,583 | 96.9 | % | 48.07 | N | CBD | ||||||||||||||||||||
| (3) |
Prudential Center (retail shops) |
CBD Boston MA |
1 | 491,399 | 97.4 | % | 81.61 | N | CBD | |||||||||||||||||||
| (3) |
Star Market at the Prudential Center |
CBD Boston MA |
1 | 57,235 | 100.0 | % | 54.37 | N | CBD | |||||||||||||||||||
|
|
|
|
|
|
|
|
|
|||||||||||||||||||||
| 8 | 6,958,002 | 90.4 | % | $ | 61.51 | |||||||||||||||||||||||
|
|
|
|
|
|
|
|
|
|||||||||||||||||||||
| 355 Main Street |
East Cambridge MA |
1 | 265,342 | 99.7 | % | $ | 69.98 | N | CBD | |||||||||||||||||||
| 90 Broadway |
East Cambridge MA |
1 | 223,771 | 100.0 | % | 51.40 | N | CBD | ||||||||||||||||||||
| 255 Main Street |
East Cambridge MA |
1 | 215,629 | 100.0 | % | 55.53 | N | CBD | ||||||||||||||||||||
| 300 Binney Street |
East Cambridge MA |
1 | 195,191 | 100.0 | % | 53.49 | N | CBD | ||||||||||||||||||||
| 150 Broadway |
East Cambridge MA |
1 | 177,226 | 100.0 | % | 47.07 | N | CBD | ||||||||||||||||||||
| 105 Broadway |
East Cambridge MA |
1 | 152,664 | 100.0 | % | 60.71 | N | CBD | ||||||||||||||||||||
| 325 Main Street |
East Cambridge MA |
1 | 115,361 | 100.0 | % | 46.89 | N | CBD | ||||||||||||||||||||
| 145 Broadway |
East Cambridge MA |
1 | 79,616 | 100.0 | % | 46.38 | N | CBD | ||||||||||||||||||||
| 250 Binney Street |
East Cambridge MA |
1 | 67,362 | 100.0 | % | 42.75 | N | CBD | ||||||||||||||||||||
| University Place |
Mid-Cambridge MA |
1 | 195,282 | 100.0 | % | 47.26 | Y | CBD | ||||||||||||||||||||
|
|
|
|
|
|
|
|
|
|||||||||||||||||||||
| 10 | 1,687,444 | 99.9 | % | $ | 54.11 | |||||||||||||||||||||||
|
|
|
|
|
|
|
|
|
|||||||||||||||||||||
| Bay Colony Corporate Center |
Route 128 Mass Turnpike MA |
4 | 1,010,113 | 78.4 | % | $ | 35.61 | N | S | |||||||||||||||||||
| Reservoir Place |
Route 128 Mass Turnpike MA |
1 | 528,885 | 98.3 | % | 33.40 | N | S | ||||||||||||||||||||
| 140 Kendrick Street |
Route 128 Mass Turnpike MA |
3 | 380,987 | 84.2 | % | 37.22 | N | S | ||||||||||||||||||||
| Weston Corporate Center |
Route 128 Mass Turnpike MA |
1 | 356,995 | 100.0 | % | 52.18 | N | S | ||||||||||||||||||||
| Waltham Weston Corporate Center |
Route 128 Mass Turnpike MA |
1 | 306,687 | 92.4 | % | 34.65 | N | S | ||||||||||||||||||||
| 230 CityPoint |
Route 128 Mass Turnpike MA |
1 | 301,429 | 84.9 | % | 34.37 | N | S | ||||||||||||||||||||
| 200 West Street |
Route 128 Mass Turnpike MA |
1 | 256,245 | 97.8 | % | 36.84 | N | S | ||||||||||||||||||||
| (4) |
10 CityPoint |
Route 128 Mass Turnpike MA |
1 | 241,460 | 92.7 | % | 51.29 | N | S | |||||||||||||||||||
| 77 CityPoint |
Route 128 Mass Turnpike MA |
1 | 209,707 | 100.0 | % | 47.55 | N | S | ||||||||||||||||||||
| 195 West Street |
Route 128 Mass Turnpike MA |
1 | 63,500 | 100.0 | % | 40.82 | N | S | ||||||||||||||||||||
| Quorum Office Park |
Route 128 Northwest MA |
2 | 267,527 | 90.0 | % | 18.92 | N | S | ||||||||||||||||||||
| Lexington Office Park |
Route 128 Northwest MA |
2 | 166,858 | 73.8 | % | 26.29 | N | S | ||||||||||||||||||||
| 191 Spring Street |
Route 128 Northwest MA |
1 | 158,900 | 7.2 | % | 26.41 | N | S | ||||||||||||||||||||
| 40 Shattuck Road |
Route 128 Northwest MA |
1 | 121,542 | 68.7 | % | 23.08 | N | S | ||||||||||||||||||||
| 91 Hartwell Avenue |
Route 128 Northwest MA |
1 | 119,216 | 100.0 | % | 27.47 | N | S | ||||||||||||||||||||
| 201 Spring Street |
Route 128 Northwest MA |
1 | 106,300 | 100.0 | % | 37.82 | N | S | ||||||||||||||||||||
| 33 Hayden Avenue |
Route 128 Northwest MA |
1 | 80,872 | 100.0 | % | 43.89 | N | S | ||||||||||||||||||||
| 32 Hartwell Avenue |
Route 128 Northwest MA |
1 | 69,154 | 100.0 | % | 24.48 | N | S | ||||||||||||||||||||
| 164 Lexington Road |
Route 128 Northwest MA |
1 | 64,140 | 0.0 | % | — | N | S | ||||||||||||||||||||
| 100 Hayden Avenue |
Route 128 Northwest MA |
1 | 55,924 | 100.0 | % | 41.17 | N | S | ||||||||||||||||||||
| 181 Spring Street |
Route 128 Northwest MA |
1 | 55,793 | 100.0 | % | 31.40 | N | S | ||||||||||||||||||||
| 92 Hayden Avenue |
Route 128 Northwest MA |
1 | 31,100 | 100.0 | % | 41.80 | N | S | ||||||||||||||||||||
| 17 Hartwell Avenue |
Route 128 Northwest MA |
1 | 30,000 | 100.0 | % | 33.26 | N | S | ||||||||||||||||||||
| (3)(4) |
The Point |
Route 128 Northwest MA |
1 | 16,300 | 84.7 | % | 52.27 | N | S | |||||||||||||||||||
|
|
|
|
|
|
|
|
|
|||||||||||||||||||||
| 31 | 4,999,634 | 85.9 | % | $ | 36.69 | |||||||||||||||||||||||
|
|
|
|
|
|
|
|
|
|||||||||||||||||||||
| Total Boston Office: |
49 | 13,645,080 | 90.0 | % | $ | 51.74 | ||||||||||||||||||||||
|
|
|
|
|
|
|
|
|
|||||||||||||||||||||
| Residential |
||||||||||||||||||||||||||||
| The Lofts at Atlantic Wharf (86 units) |
CBD Boston MA |
1 | 87,097 | N | CBD | |||||||||||||||||||||||
|
|
|
|
|
|||||||||||||||||||||||||
| Total Boston Residential: |
1 | 87,097 | ||||||||||||||||||||||||||
|
|
|
|
|
|||||||||||||||||||||||||
| Hotel |
||||||||||||||||||||||||||||
| Boston Marriott Cambridge (433 rooms) |
East Cambridge MA |
1 | 334,260 | N | CBD | |||||||||||||||||||||||
|
|
|
|
|
|||||||||||||||||||||||||
| Total Boston Hotel: |
1 | 334,260 | ||||||||||||||||||||||||||
|
|
|
|
|
|||||||||||||||||||||||||
| Total Boston: |
51 | 14,066,437 | ||||||||||||||||||||||||||
|
|
|
|
|
|||||||||||||||||||||||||
| (1) | Represents signed leases for which revenue recognition has commenced in accordance with GAAP. |
| (2) | For disclosures relating to the Company’s definition of Annualized Rental Obligations, see page 47. |
| (3) | This is a retail property. |
| (4) | Not included in Same Property analysis. |
27
THIRD QUARTER 2016
IN-SERVICE PROPERTY LISTING (continued)
as of September 30, 2016
| Sub Market |
Number of Buildings |
Square Feet |
Leased % (1) |
Annualized Rental Obligations Per Leased SF (2) |
Encumbered with secured debt (Y/N) |
Central Business District (CBD) or Suburban (S) |
||||||||||||||||||||||
| New York |
||||||||||||||||||||||||||||
| Office |
||||||||||||||||||||||||||||
| 767 Fifth Avenue (The GM Building) (60% ownership) |
Plaza District NY |
1 | 1,839,505 | 94.5 | % | $ | 146.53 | Y | CBD | |||||||||||||||||||
| 399 Park Avenue |
Park Avenue NY |
1 | 1,712,880 | 93.9 | % | 90.49 | N | CBD | ||||||||||||||||||||
| (3) |
601 Lexington Avenue (55% ownership) |
Park Avenue NY |
1 | 1,436,241 | 93.8 | % | 95.73 | Y | CBD | |||||||||||||||||||
| 599 Lexington Avenue |
Park Avenue NY |
1 | 1,058,008 | 96.0 | % | 87.46 | N | CBD | ||||||||||||||||||||
| Times Square Tower (55% ownership) |
Times Square NY |
1 | 1,248,521 | 98.6 | % | 77.92 | N | CBD | ||||||||||||||||||||
| 250 West 55th Street |
Times Square / West Side NY |
1 | 988,326 | 85.2 | % | 86.03 | N | CBD | ||||||||||||||||||||
| 510 Madison Avenue |
Fifth/Madison Avenue NY |
1 | 355,598 | 100.0 | % | 120.26 | N | CBD | ||||||||||||||||||||
| (4) |
540 Madison Avenue (60% ownership) |
Fifth/Madison Avenue NY |
1 | 283,695 | 92.4 | % | 101.50 | Y | CBD | |||||||||||||||||||
|
|
|
|
|
|
|
|
|
|||||||||||||||||||||
| 8 | 8,922,774 | 94.2 | % | $ | 101.89 | |||||||||||||||||||||||
|
|
|
|
|
|
|
|
|
|||||||||||||||||||||
| One Tower Center |
East Brunswick NJ |
1 | 412,797 | 21.2 | % | $ | 31.57 | N | S | |||||||||||||||||||
| 510 Carnegie Center |
Princeton NJ |
1 | 234,160 | 100.0 | % | 34.74 | N | S | ||||||||||||||||||||
| 210 Carnegie Center |
Princeton NJ |
1 | 162,372 | 79.3 | % | 33.38 | N | S | ||||||||||||||||||||
| 206 Carnegie Center |
Princeton NJ |
1 | 161,763 | 100.0 | % | 31.87 | N | S | ||||||||||||||||||||
| 212 Carnegie Center |
Princeton NJ |
1 | 151,547 | 86.9 | % | 36.27 | N | S | ||||||||||||||||||||
| 214 Carnegie Center |
Princeton NJ |
1 | 150,774 | 67.6 | % | 33.53 | N | S | ||||||||||||||||||||
| 506 Carnegie Center |
Princeton NJ |
1 | 149,312 | 59.0 | % | 34.60 | N | S | ||||||||||||||||||||
| 508 Carnegie Center |
Princeton NJ |
1 | 134,433 | 100.0 | % | 33.17 | N | S | ||||||||||||||||||||
| 202 Carnegie Center |
Princeton NJ |
1 | 134,381 | 86.3 | % | 37.80 | N | S | ||||||||||||||||||||
| (5) |
804 Carnegie Center |
Princeton NJ |
1 | 130,000 | 100.0 | % | 36.25 | N | S | |||||||||||||||||||
| 101 Carnegie Center |
Princeton NJ |
1 | 125,627 | 90.8 | % | 34.01 | N | S | ||||||||||||||||||||
| 504 Carnegie Center |
Princeton NJ |
1 | 121,990 | 100.0 | % | 30.83 | N | S | ||||||||||||||||||||
| 502 Carnegie Center |
Princeton NJ |
1 | 121,460 | 91.3 | % | 36.75 | N | S | ||||||||||||||||||||
| 701 Carnegie Center |
Princeton NJ |
1 | 120,000 | 100.0 | % | 39.28 | N | S | ||||||||||||||||||||
| 104 Carnegie Center |
Princeton NJ |
1 | 102,830 | 40.3 | % | 34.97 | N | S | ||||||||||||||||||||
| 105 Carnegie Center |
Princeton NJ |
1 | 69,955 | 56.3 | % | 32.53 | N | S | ||||||||||||||||||||
| 302 Carnegie Center |
Princeton NJ |
1 | 64,926 | 100.0 | % | 34.36 | N | S | ||||||||||||||||||||
| 211 Carnegie Center |
Princeton NJ |
1 | 47,025 | 100.0 | % | 33.40 | N | S | ||||||||||||||||||||
| 201 Carnegie Center |
Princeton NJ |
— | 6,500 | 100.0 | % | 33.33 | N | S | ||||||||||||||||||||
|
|
|
|
|
|
|
|
|
|||||||||||||||||||||
| 18 | 2,601,852 | 76.1 | % | $ | 34.50 | |||||||||||||||||||||||
|
|
|
|
|
|
|
|
|
|||||||||||||||||||||
| Total New York: |
26 | 11,524,626 | 90.1 | % | $ | 89.03 | ||||||||||||||||||||||
|
|
|
|
|
|
|
|
|
|||||||||||||||||||||
| San Francisco and Los Angeles |
||||||||||||||||||||||||||||
| Office |
||||||||||||||||||||||||||||
| Embarcadero Center Four | CBD San Francisco CA |
1 | 937,954 | 86.2 | % | $ | 64.77 | N | CBD | |||||||||||||||||||
| Embarcadero Center One |
CBD San Francisco CA |
1 | 831,078 | 97.6 | % | 56.21 | N | CBD | ||||||||||||||||||||
| Embarcadero Center Two |
CBD San Francisco CA |
1 | 786,709 | 93.8 | % | 64.43 | N | CBD | ||||||||||||||||||||
| Embarcadero Center Three |
CBD San Francisco CA |
1 | 779,318 | 83.4 | % | 54.99 | N | CBD | ||||||||||||||||||||
| 680 Folsom Street |
CBD San Francisco CA |
2 | 524,793 | 98.4 | % | 58.65 | N | CBD | ||||||||||||||||||||
| (5) |
535 Mission Street |
CBD San Francisco CA |
1 | 307,235 | 100.0 | % | 71.94 | N | CBD | |||||||||||||||||||
| (5) |
690 Folsom Street |
CBD San Francisco CA |
1 | 26,080 | 100.0 | % | 69.75 | N | CBD | |||||||||||||||||||
|
|
|
|
|
|
|
|
|
|||||||||||||||||||||
| 8 | 4,193,167 | 92.0 | % | $ | 61.02 | |||||||||||||||||||||||
|
|
|
|
|
|
|
|
|
|||||||||||||||||||||
| 601 and 651 Gateway |
South San Francisco CA |
2 | 506,279 | 99.6 | % | $ | 39.33 | N | S | |||||||||||||||||||
| 611 Gateway |
South San Francisco CA |
1 | 260,337 | 28.2 | % | 40.77 | N | S | ||||||||||||||||||||
| Mountain View Research Park |
Mountain View CA |
15 | 540,433 | 100.0 | % | 41.15 | N | S | ||||||||||||||||||||
| 2440 West El Camino Real |
Mountain View CA |
1 | 141,392 | 100.0 | % | 57.46 | N | S | ||||||||||||||||||||
| 453 Ravendale Drive |
Mountain View CA |
1 | 29,620 | 85.8 | % | 36.68 | N | S | ||||||||||||||||||||
| (5)(6) |
3625-3635 Peterson Way |
Santa Clara CA |
1 | 218,366 | 100.0 | % | 21.84 | N | S | |||||||||||||||||||
| (6) |
North First Business Park |
San Jose CA |
5 | 190,636 | 100.0 | % | 18.87 | N | S | |||||||||||||||||||
|
|
|
|
|
|
|
|
|
|||||||||||||||||||||
| 26 | 1,887,063 | 89.8 | % | $ | 36.89 | |||||||||||||||||||||||
|
|
|
|
|
|
|
|
|
|||||||||||||||||||||
| (4)(5)(7) |
Colorado Center |
West Los Angeles CA |
6 | 1,116,698 | 65.5 | % | $ | 54.96 | N | CBD | ||||||||||||||||||
|
|
|
|
|
|
|
|
|
|||||||||||||||||||||
| Total San Francisco and |
||||||||||||||||||||||||||||
| Los Angeles: |
40 | 7,196,928 | 87.3 | % | $ | 53.81 | ||||||||||||||||||||||
|
|
|
|
|
|
|
|
|
|||||||||||||||||||||
| (1) | Represents signed leases for which revenue recognition has commenced in accordance with GAAP. |
| (2) | For disclosures relating to the Company’s definition of Annualized Rental Obligations, see page 47. |
| (3) | Approximately 13% of this complex was removed from the in-service portfolio upon commencement of construction of the planned redevelopment that occurred this quarter. As a result the portion related to the planned redevelopment is not included in Same Property analysis. |
| (4) | This is an unconsolidated joint venture property. |
| (5) | Not included in Same Property analysis. |
| (6) | Property held for redevelopment. |
| (7) | Excludes approximately 59,000 square feet of storage space and 8,000 square feet of remeasurement upon lease expirations. |
28
THIRD QUARTER 2016
IN-SERVICE PROPERTY LISTING (continued)
as of September 30, 2016
| Sub Market |
Number of Buildings |
Square Feet |
Leased % (1) |
Annualized Rental Obligations Per Leased SF (2) |
Encumbered with secured debt (Y/N) |
Central Business District (CBD) or Suburban (S) |
||||||||||||||||||||||
| Washington, DC |
||||||||||||||||||||||||||||
| Office |
||||||||||||||||||||||||||||
| Capital Gallery |
Southwest Washington DC |
1 | 631,029 | 98.6 | % | $ | 59.16 | N | CBD | |||||||||||||||||||
| 500 E Street, S.W. |
Southwest Washington DC |
1 | 251,994 | 100.0 | % | 49.52 | N | CBD | ||||||||||||||||||||
| (3) |
Metropolitan Square (51% ownership) |
East End Washington DC |
1 | 607,041 | 74.7 | % | 61.10 | Y | CBD | |||||||||||||||||||
| (3) |
901 New York Avenue (25% ownership) |
East End Washington DC |
1 | 539,680 | 92.4 | % | 59.75 | Y | CBD | |||||||||||||||||||
| (4) |
601 Massachusetts Avenue |
East End Washington DC |
1 | 478,883 | 90.2 | % | 68.96 | N | CBD | |||||||||||||||||||
| (3) |
Market Square North (50% ownership) |
East End Washington DC |
1 | 415,246 | 82.6 | % | 62.83 | Y | CBD | |||||||||||||||||||
| 2200 Pennsylvania Avenue |
CBD Washington DC |
1 | 458,831 | 100.0 | % | 87.99 | N | CBD | ||||||||||||||||||||
| 1333 New Hampshire Avenue |
CBD Washington DC |
1 | 315,371 | 100.0 | % | 47.27 | N | CBD | ||||||||||||||||||||
| 1330 Connecticut Avenue |
CBD Washington DC |
1 | 253,190 | 98.0 | % | 61.00 | N | CBD | ||||||||||||||||||||
| Sumner Square |
CBD Washington DC |
1 | 208,892 | 100.0 | % | 50.54 | N | CBD | ||||||||||||||||||||
| (3) |
500 North Capitol Street, N.W. (30% ownership) |
Capitol Hill Washington DC |
1 | 230,860 | 100.0 | % | 66.32 | Y | CBD | |||||||||||||||||||
|
|
|
|
|
|
|
|
|
|||||||||||||||||||||
| 11 | 4,391,017 | 92.5 | % | $ | 62.47 | |||||||||||||||||||||||
|
|
|
|
|
|
|
|
|
|||||||||||||||||||||
| South of Market |
Reston VA |
3 | 623,666 | 93.6 | % | $ | 54.03 | N | S | |||||||||||||||||||
| Fountain Square |
Reston VA |
2 | 518,345 | 93.2 | % | 47.69 | N | S | ||||||||||||||||||||
| One Freedom Square |
Reston VA |
1 | 432,581 | 93.0 | % | 47.64 | N | S | ||||||||||||||||||||
| Two Freedom Square |
Reston VA |
1 | 421,757 | 98.5 | % | 45.34 | N | S | ||||||||||||||||||||
| One and Two Discovery Square |
Reston VA |
2 | 366,990 | 100.0 | % | 44.58 | N | S | ||||||||||||||||||||
| One Reston Overlook |
Reston VA |
1 | 319,519 | 100.0 | % | 38.55 | N | S | ||||||||||||||||||||
| Reston Corporate Center |
Reston VA |
2 | 261,046 | 100.0 | % | 39.30 | N | S | ||||||||||||||||||||
| Democracy Tower |
Reston VA |
1 | 259,441 | 100.0 | % | 59.50 | N | S | ||||||||||||||||||||
| (5) |
Fountain Square Retail |
Reston VA |
1 | 237,209 | 96.5 | % | 52.35 | N | S | |||||||||||||||||||
| Two Reston Overlook |
Reston VA |
1 | 134,615 | 97.1 | % | 37.70 | N | S | ||||||||||||||||||||
|
|
|
|
|
|
|
|
|
|||||||||||||||||||||
| 15 | 3,575,169 | 96.5 | % | $ | 47.48 | |||||||||||||||||||||||
|
|
|
|
|
|
|
|
|
|||||||||||||||||||||
| Wisconsin Place Office |
Montgomery County MD |
1 | 299,186 | 96.5 | % | $ | 50.63 | N | S | |||||||||||||||||||
| 2600 Tower Oaks Boulevard |
Montgomery County MD |
1 | 179,369 | 48.1 | % | 32.79 | N | S | ||||||||||||||||||||
| New Dominion Technology Park - Building Two |
Herndon VA |
1 | 257,400 | 100.0 | % | 39.58 | N | S | ||||||||||||||||||||
| New Dominion Technology Park - Building One |
Herndon VA |
1 | 235,201 | 100.0 | % | 33.60 | Y | S | ||||||||||||||||||||
| Kingstowne Two |
Springfield VA |
1 | 156,251 | 74.1 | % | 40.97 | N | S | ||||||||||||||||||||
| Kingstowne One |
Springfield VA |
1 | 151,483 | 75.6 | % | 40.28 | N | S | ||||||||||||||||||||
| 7601 Boston Boulevard |
Springfield VA |
1 | 114,028 | 100.0 | % | 18.60 | N | S | ||||||||||||||||||||
| 7435 Boston Boulevard |
Springfield VA |
1 | 103,557 | 100.0 | % | 19.06 | N | S | ||||||||||||||||||||
| 8000 Grainger Court |
Springfield VA |
1 | 88,775 | 37.6 | % | 23.64 | N | S | ||||||||||||||||||||
| (5) |
Kingstowne Retail |
Springfield VA |
1 | 88,288 | 100.0 | % | 36.02 | N | S | |||||||||||||||||||
| 7500 Boston Boulevard |
Springfield VA |
1 | 79,971 | 100.0 | % | 19.66 | N | S | ||||||||||||||||||||
| 7501 Boston Boulevard |
Springfield VA |
1 | 75,756 | 100.0 | % | 28.67 | N | S | ||||||||||||||||||||
| 7450 Boston Boulevard |
Springfield VA |
1 | 62,402 | 0.0 | % | — | N | S | ||||||||||||||||||||
| 7374 Boston Boulevard |
Springfield VA |
1 | 57,321 | 100.0 | % | 17.90 | N | S | ||||||||||||||||||||
| 8000 Corporate Court |
Springfield VA |
1 | 52,539 | 100.0 | % | 14.10 | N | S | ||||||||||||||||||||
| 7451 Boston Boulevard |
Springfield VA |
1 | 45,615 | 67.4 | % | 26.08 | N | S | ||||||||||||||||||||
| 7300 Boston Boulevard |
Springfield VA |
1 | 32,000 | 100.0 | % | 23.64 | N | S | ||||||||||||||||||||
| 7375 Boston Boulevard |
Springfield VA |
1 | 26,865 | 79.2 | % | 28.70 | N | S | ||||||||||||||||||||
| (3)(4) |
Annapolis Junction Building Seven (50% ownership) |
Anne Arundel County MD |
1 | 127,229 | 100.0 | % | 31.79 | Y | S | |||||||||||||||||||
| (3)(4) |
Annapolis Junction Building Eight (50% ownership) |
Anne Arundel County MD |
1 | 125,685 | 0.0 | % | — | Y | S | |||||||||||||||||||
| (3) |
Annapolis Junction Building Six (50% ownership) |
Anne Arundel County MD |
1 | 119,339 | 48.9 | % | 30.55 | Y | S | |||||||||||||||||||
| (3) |
Annapolis Junction Building One (50% ownership) |
Anne Arundel County MD |
1 | 117,599 | 21.9 | % | 113.09 | Y | S | |||||||||||||||||||
|
|
|
|
|
|
|
|
|
|||||||||||||||||||||
| 22 | 2,595,859 | 77.0 | % | $ | 34.72 | |||||||||||||||||||||||
|
|
|
|
|
|
|
|
|
|||||||||||||||||||||
| Total Washington Office: |
48 | 10,562,045 | 90.1 | % | $ | 51.20 | ||||||||||||||||||||||
|
|
|
|
|
|
|
|
|
|||||||||||||||||||||
| Residential |
||||||||||||||||||||||||||||
| The Avant at Reston Town Center (359 units) |
Reston VA |
1 | 355,347 | N | S | |||||||||||||||||||||||
|
|
|
|
|
|||||||||||||||||||||||||
| Total Washington Residential: |
1 | 355,347 | ||||||||||||||||||||||||||
|
|
|
|
|
|||||||||||||||||||||||||
| Total Washington, DC: |
49 | 10,917,392 | ||||||||||||||||||||||||||
|
|
|
|
|
|||||||||||||||||||||||||
| Total In-Service Properties: |
166 | 43,705,383 | 89.6 | %(6) | $ | 62.02 | (6) | |||||||||||||||||||||
|
|
|
|
|
|
|
|
|
|||||||||||||||||||||
| (1) | Represents signed leases for which revenue recognition has commenced in accordance with GAAP. |
| (2) | For disclosures relating to the Company’s definition of Annualized Rental Obligations, see page 47. |
| (3) | This is an unconsolidated joint venture property. |
| (4) | Not included in Same Property analysis. |
| (5) | This is a retail property. |
| (6) | Excludes Hotel and Residential properties. For disclosures relating to the Company’s Hotel and Residential properties, see page 24. |
29
THIRD QUARTER 2016
OCCUPANCY BY LOCATION
Total In-Service Properties (1)
| CBD | Suburban | Total | ||||||||||||||||||||||
| Location |
30-Sep-16 | 30-Sep-15 | 30-Sep-16 | 30-Sep-15 | 30-Sep-16 | 30-Sep-15 | ||||||||||||||||||
| Boston |
92.3 | % | 91.2 | % | 85.9 | % | 90.8 | % | 90.0 | % | 91.1 | % | ||||||||||||
| New York |
94.2 | % | 96.2 | % | 76.1 | % | 73.9 | % | 90.1 | % | 91.5 | % | ||||||||||||
| San Francisco and Los Angeles |
86.4 | % | 94.4 | % | 89.8 | % | 78.5 | % | 87.3 | % | 88.6 | % | ||||||||||||
| Washington, DC |
92.5 | % | 93.7 | % | 88.3 | % | 92.4 | % | 90.1 | % | 92.9 | % | ||||||||||||
|
|
|
|
|
|
|
|
|
|
|
|
|
|||||||||||||
| Total Portfolio |
91.8 | % | 93.9 | % | 85.7 | % | 87.0 | % | 89.6 | % | 91.3 | % | ||||||||||||
|
|
|
|
|
|
|
|
|
|
|
|
|
|||||||||||||
Same Property Portfolio (1) (2)
| CBD | Suburban | Total | ||||||||||||||||||||||
| Location |
30-Sep-16 | 30-Sep-15 | 30-Sep-16 | 30-Sep-15 | 30-Sep-16 | 30-Sep-15 | ||||||||||||||||||
| Boston |
92.3 | % | 91.0 | % | 85.6 | % | 90.8 | % | 89.9 | % | 90.9 | % | ||||||||||||
| New York |
94.2 | % | 96.2 | % | 74.9 | % | 73.9 | % | 90.0 | % | 91.3 | % | ||||||||||||
| San Francisco and Los Angeles |
91.3 | % | 94.4 | % | 88.4 | % | 97.7 | % | 90.4 | % | 95.4 | % | ||||||||||||
| Washington, DC |
92.8 | % | 93.7 | % | 89.9 | % | 92.3 | % | 91.1 | % | 92.8 | % | ||||||||||||
|
|
|
|
|
|
|
|
|
|
|
|
|
|||||||||||||
| Total Portfolio |
92.9 | % | 93.8 | % | 85.9 | % | 89.3 | % | 90.3 | % | 92.1 | % | ||||||||||||
|
|
|
|
|
|
|
|
|
|
|
|
|
|||||||||||||
| (1) | Represents signed leases for which revenue recognition has commenced in accordance with GAAP. Includes 100% of joint venture properties. Does not include residential and hotel properties. |
| (2) | For disclosures related to the Company’s definition of Same Properties, see page 48. |
30
THIRD QUARTER 2016
TOP 20 TENANTS LISTING AND PORTFOLIO TENANT DIVERSIFICATION
TOP 20 TENANTS (1)
| Tenant |
% of BXP’s Share of Combined Annualized Rental Obligations |
|||||
| 1. | US Government |
2.75 | % | |||
| 2. | Citibank |
2.51 | % | |||
| 3. | Arnold & Porter |
2.19 | % | |||
| 4. | Biogen |
2.01 | % | |||
| 5. | Shearman & Sterling |
1.88 | % | |||
| 6. | Ropes & Gray |
1.62 | % | |||
| 7. | Kirkland & Ellis |
1.47 | % | |||
| 8. | O’Melveny & Myers |
1.37 | % | |||
| 9. | Wellington Management |
1.30 | % | |||
| 10. | Bank of America |
1.27 | % | |||
| 11. | |
1.08 | % | |||
| 12. | Weil Gotshal Manges |
1.08 | % | |||
| 13. | Aramis (Estee Lauder) |
1.03 | % | |||
| 14. | Kaye Scholer |
0.97 | % | |||
| 15. | Microsoft |
0.94 | % | |||
| 16. | Mass Financial Services |
0.89 | % | |||
| 17. | Morgan Lewis Bockius |
0.89 | % | |||
| 18. | Morrison Foerster |
0.87 | % | |||
| 19. | Hunton & Williams |
0.87 | % | |||
| 20. | Smithsonian Institution |
0.81 | % | |||
|
|
|
|||||
| BXP’s Share of Combined Rental Obligations |
27.80 | % | ||||
|
|
|
|||||
| BXP’s Share of Combined Square Feet |
22.90 | % | ||||
NOTABLE SIGNED DEALS (2)
| Tenant |
Property |
Square Feet | ||||
| salesforce.com |
Salesforce Tower | 732,000 | ||||
| Putnam Investments |
100 Federal Street | 249,000 | ||||
TENANT DIVERSIFICATION (1)

| (1) | For disclosures relating to the Company’s definition of Annualized Rental Obligations and Rental Obligations, see pages 47-48. |
| (2) | Represents leases signed with occupancy commencing in the future. |
31
THIRD QUARTER 2016
LEASE EXPIRATIONS (1) (2) (3)
IN-SERVICE OFFICE PROPERTIES
| Year of Lease |
Rentable Square Footage Subject to Expiring Leases |
Current Annualized Rental Obligations Under Expiring Leases |
Current Annualized Rental Obligations Under Expiring Leases p.s.f. |
Annualized Rental Obligations Under Expiring Leases with future step-ups |
Annualized Rental Obligations Under Expiring Leases with future step-ups - p.s.f. |
Percentage of Total Square Feet |
||||||||||||||||||
| 2016 | 505,444 | $ | 23,099,549 | $ | 45.70 | $ | 23,104,069 | $ | 45.71 | 1.31 | %(4) | |||||||||||||
| 2017 | 2,473,358 | 144,153,854 | 58.28 | 146,241,435 | 59.13 | 6.39 | % | |||||||||||||||||
| 2018 | 1,577,970 | 92,146,939 | 58.40 | 93,839,576 | 59.47 | 4.08 | % | |||||||||||||||||
| 2019 | 3,484,863 | 182,917,736 | 52.49 | 187,768,836 | 53.88 | 9.00 | % | |||||||||||||||||
| 2020 | 4,438,254 | 280,881,506 | 63.29 | 292,110,236 | 65.82 | 11.47 | % | |||||||||||||||||
| 2021 | 3,389,711 | 171,834,706 | 50.69 | 186,086,092 | 54.90 | 8.76 | % | |||||||||||||||||
| 2022 | 4,013,608 | 226,223,512 | 56.36 | 250,943,010 | 62.52 | 10.37 | % | |||||||||||||||||
| 2023 | 1,430,451 | 78,763,385 | 55.06 | 90,923,475 | 63.56 | 3.70 | % | |||||||||||||||||
| 2024 | 2,598,539 | 150,354,200 | 57.86 | 166,571,649 | 64.10 | 6.71 | % | |||||||||||||||||
| 2025 | 2,315,731 | 135,423,138 | 58.48 | 155,684,974 | 67.23 | 5.98 | % | |||||||||||||||||
| Thereafter | 9,837,553 | 701,754,463 | 71.33 | 893,329,360 | 90.81 | 25.41 | % | |||||||||||||||||
| IN-SERVICE RETAIL PROPERTIES | ||||||||||||||||||||||||
| Year of Lease |
Rentable Square Footage Subject to Expiring Leases |
Current Annualized Rental Obligations Under Expiring Leases |
Current Annualized Rental Obligations Under Expiring Leases p.s.f. |
Annualized Rental Obligations Under Expiring Leases with future step-ups |
Annualized Rental Obligations Under Expiring Leases with future step-ups - p.s.f. |
Percentage of Total Square Feet |
||||||||||||||||||
| 2016 | 117,127 | $ | 6,445,274 | $ | 55.03 | $ | 6,450,074 | $ | 55.07 | 5.83 | %(4) | |||||||||||||
| 2017 | 148,967 | 14,975,314 | 100.53 | 15,003,734 | 100.72 | 7.41 | % | |||||||||||||||||
| 2018 | 234,020 | 21,316,981 | 91.09 | 21,949,618 | 93.79 | 11.64 | % | |||||||||||||||||
| 2019 | 92,242 | 6,381,908 | 69.19 | 6,498,477 | 70.45 | 4.59 | % | |||||||||||||||||
| 2020 | 184,493 | 11,574,011 | 62.73 | 12,000,588 | 65.05 | 9.18 | % | |||||||||||||||||
| 2021 | 162,156 | 21,668,436 | 133.63 | 23,219,617 | 143.19 | 8.07 | % | |||||||||||||||||
| 2022 | 200,612 | 17,688,028 | 88.17 | 19,372,402 | 96.57 | 9.98 | % | |||||||||||||||||
| 2023 | 171,652 | 14,948,187 | 87.08 | 16,519,437 | 96.24 | 8.54 | % | |||||||||||||||||
| 2024 | 113,910 | 10,252,730 | 90.01 | 12,098,072 | 106.21 | 5.67 | % | |||||||||||||||||
| 2025 | 130,667 | 8,576,305 | 65.63 | 9,560,636 | 73.17 | 6.50 | % | |||||||||||||||||
| Thereafter | 453,977 | 40,129,446 | 88.40 | 65,288,607 | 143.81 | 22.59 | % | |||||||||||||||||
| TOTAL IN-SERVICE PROPERTIES | ||||||||||||||||||||||||
| Year of Lease |
Rentable Square Footage Subject to Expiring Leases |
Current Annualized Rental Obligations Under Expiring Leases |
Current Annualized Rental Obligations Under Expiring Leases p.s.f. |
Annualized Rental Obligations Under Expiring Leases with future step-ups |
Annualized Rental Obligations Under Expiring Leases with future step-ups - p.s.f. |
Percentage of Total Square Feet |
||||||||||||||||||
| 2016 | 622,571 | $ | 29,544,823 | $ | 47.46 | $ | 29,554,143 | $ | 47.47 | 1.53 | %(4) | |||||||||||||
| 2017 | 2,622,325 | 159,129,168 | 60.68 | 161,245,170 | 61.49 | 6.44 | % | |||||||||||||||||
| 2018 | 1,811,990 | 113,463,920 | 62.62 | 115,789,194 | 63.90 | 4.45 | % | |||||||||||||||||
| 2019 | 3,577,105 | 189,299,643 | 52.92 | 194,267,312 | 54.31 | 8.78 | % | |||||||||||||||||
| 2020 | 4,622,747 | 292,455,517 | 63.26 | 304,110,823 | 65.79 | 11.35 | % | |||||||||||||||||
| 2021 | 3,551,867 | 193,503,142 | 54.48 | 209,305,709 | 58.93 | 8.72 | % | |||||||||||||||||
| 2022 | 4,214,220 | 243,911,540 | 57.88 | 270,315,413 | 64.14 | 10.35 | % | |||||||||||||||||
| 2023 | 1,602,103 | 93,711,572 | 58.49 | 107,442,912 | 67.06 | 3.93 | % | |||||||||||||||||
| 2024 | 2,712,449 | 160,606,931 | 59.21 | 178,669,721 | 65.87 | 6.66 | % | |||||||||||||||||
| 2025 | 2,446,398 | 143,999,443 | 58.86 | 165,245,610 | 67.55 | 6.01 | % | |||||||||||||||||
| Thereafter | 10,291,530 | 741,883,910 | 72.09 | 958,617,966 | 93.15 | 25.27 | % | |||||||||||||||||
| (1) | For disclosures relating to the Company’s definition of Annualized Rental Obligations, see page 47. |
| (2) | Includes 100% of joint venture properties. Does not include residential units and hotel. |
| (3) | Does not include data for leases expiring in a particular year when leases for the same space have already been signed with replacement tenants with future commencement dates. In those cases, the data is included in the year in which the future lease expires. |
| (4) | Includes square feet expiring on the last day of the current quarter. |
32
THIRD QUARTER 2016
IN-SERVICE BOSTON REGION PROPERTIES
Lease Expirations—Boston Region (1) (2) (3)
OFFICE
| Annualized | ||||||||||||||||||||
| Year of | Rentable Square | Current Annualized | Per | Rental Obligations Under | Per | |||||||||||||||
| Lease | Footage Subject to | Rental Obligations Under | Square | Expiring Leases | Square | |||||||||||||||
| Expiration |
Expiring Leases | Expiring Leases | Foot | with future step-ups | Foot | |||||||||||||||
| 2016 | 168,082 | $ | 7,375,447 | $ | 43.88 | $ | 7,375,447 | $ | 43.88 | (4) | ||||||||||
| 2017 | 619,293 | 27,868,446 | 45.00 | 27,968,875 | 45.16 | |||||||||||||||
| 2018 | 455,604 | 18,626,029 | 40.88 | 19,065,211 | 41.85 | |||||||||||||||
| 2019 | 1,115,519 | 53,771,678 | 48.20 | 54,283,161 | 48.66 | |||||||||||||||
| 2020 | 499,150 | 22,614,812 | 45.31 | 24,218,127 | 48.52 | |||||||||||||||
| 2021 | 1,034,642 | 41,114,174 | 39.74 | 42,633,321 | 41.21 | |||||||||||||||
| 2022 | 1,570,620 | 75,261,393 | 47.92 | 79,264,246 | 50.47 | |||||||||||||||
| 2023 | 528,479 | 26,992,742 | 51.08 | 30,861,300 | 58.40 | |||||||||||||||
| 2024 | 525,842 | 24,062,805 | 45.76 | 27,335,619 | 51.98 | |||||||||||||||
| 2025 | 1,099,603 | 62,060,293 | 56.44 | 70,082,107 | 63.73 | |||||||||||||||
| Thereafter | 3,712,044 | 212,492,056 | 57.24 | 243,083,010 | 65.48 | |||||||||||||||
| RETAIL | ||||||||||||||||||||
| Annualized | ||||||||||||||||||||
| Year of | Rentable Square | Current Annualized | Per | Rental Obligations Under | Per | |||||||||||||||
| Lease | Footage Subject to | Rental Obligations Under | Square | Expiring Leases | Square | |||||||||||||||
| Expiration |
Expiring Leases | Expiring Leases | Foot | with future step-ups | Foot | |||||||||||||||
| 2016 | 56,362 | $ | 3,490,514 | $ | 61.93 | $ | 3,495,314 | $ | 62.02 | (4) | ||||||||||
| 2017 | 52,703 | 4,408,998 | 83.66 | 4,413,706 | 83.75 | |||||||||||||||
| 2018 | 140,449 | 6,527,048 | 46.47 | 6,552,408 | 46.65 | |||||||||||||||
| 2019 | 11,787 | 1,910,167 | 162.06 | 1,933,358 | 164.02 | |||||||||||||||
| 2020 | 91,659 | 5,746,610 | 62.70 | 5,919,399 | 64.58 | |||||||||||||||
| 2021 | 37,107 | 2,712,752 | 73.11 | 2,863,976 | 77.18 | |||||||||||||||
| 2022 | 80,640 | 4,604,889 | 57.10 | 5,055,232 | 62.69 | |||||||||||||||
| 2023 | 79,937 | 7,672,466 | 95.98 | 8,221,865 | 102.85 | |||||||||||||||
| 2024 | 70,570 | 4,183,931 | 59.29 | 4,578,284 | 64.88 | |||||||||||||||
| 2025 | 30,224 | 3,672,537 | 121.51 | 4,105,612 | 135.84 | |||||||||||||||
| Thereafter | 148,681 | 10,144,741 | 68.23 | 11,276,634 | 75.84 | |||||||||||||||
| TOTAL PROPERTY TYPES | ||||||||||||||||||||
| Annualized | ||||||||||||||||||||
| Year of | Rentable Square | Current Annualized | Per | Rental Obligations Under | Per | |||||||||||||||
| Lease | Footage Subject to | Rental Obligations Under | Square | Expiring Leases | Square | |||||||||||||||
| Expiration |
Expiring Leases | Expiring Leases | Foot | with future step-ups | Foot | |||||||||||||||
| 2016 | 224,444 | $ | 10,865,961 | $ | 48.41 | $ | 10,870,761 | $ | 48.43 | (4) | ||||||||||
| 2017 | 671,996 | 32,277,445 | 48.03 | 32,382,581 | 48.19 | |||||||||||||||
| 2018 | 596,053 | 25,153,077 | 42.20 | 25,617,619 | 42.98 | |||||||||||||||
| 2019 | 1,127,306 | 55,681,846 | 49.39 | 56,216,519 | 49.87 | |||||||||||||||
| 2020 | 590,809 | 28,361,422 | 48.00 | 30,137,527 | 51.01 | |||||||||||||||
| 2021 | 1,071,749 | 43,826,927 | 40.89 | 45,497,297 | 42.45 | |||||||||||||||
| 2022 | 1,651,260 | 79,866,283 | 48.37 | 84,319,478 | 51.06 | |||||||||||||||
| 2023 | 608,416 | 34,665,208 | 56.98 | 39,083,165 | 64.24 | |||||||||||||||
| 2024 | 596,412 | 28,246,736 | 47.36 | 31,913,903 | 53.51 | |||||||||||||||
| 2025 | 1,129,827 | 65,732,830 | 58.18 | 74,187,719 | 65.66 | |||||||||||||||
| Thereafter | 3,860,725 | 222,636,797 | 57.67 | 254,359,644 | 65.88 | |||||||||||||||
| (1) | For disclosures relating to the Company’s definition of Annualized Rental Obligations, see page 47. |
| (2) | Includes 100% of joint venture properties. Does not include residential units and hotel. |
| (3) | Does not include data for leases expiring in a particular year when leases for the same space have already been signed with replacement tenants with future commencement dates. In those cases, the data is included in the year in which the future lease expires. |
| (4) | Includes square feet expiring on the last day of the current quarter. |
33
THIRD QUARTER 2016
IN-SERVICE BOSTON REGION PROPERTIES
Quarterly Lease Expirations—Boston Region (1) (2) (3)
| OFFICE | ||||||||||||||||||||
| Annualized | ||||||||||||||||||||
| Rentable Square | Current Annualized | Per | Rental Obligations Under | Per | ||||||||||||||||
| Lease Expiration | Footage Subject to | Rental Obligations Under | Square | Expiring Leases | Square | |||||||||||||||
| by Quarter |
Expiring Leases | Expiring Leases | Foot | with future step-ups | Foot | |||||||||||||||
| Q1 2016 |
— | $ | — | $ | — | $ | — | $ | — | |||||||||||
| Q2 2016 |
— | — | — | — | — | |||||||||||||||
| Q3 2016 |
26,907 | 1,254,896 | 46.64 | 1,254,896 | 46.64 | (4) | ||||||||||||||
| Q4 2016 |
141,175 | 6,120,551 | 43.35 | 6,120,551 | 43.35 | |||||||||||||||
|
|
|
|
|
|
|
|
|
|
|
|||||||||||
| Total 2016 |
168,082 | $ | 7,375,447 | $ | 43.88 | $ | 7,375,447 | $ | 43.88 | |||||||||||
|
|
|
|
|
|
|
|
|
|
|
|||||||||||
| Q1 2017 |
83,540 | $ | 3,546,914 | $ | 42.46 | $ | 3,546,914 | $ | 42.46 | |||||||||||
| Q2 2017 |
102,367 | 4,990,335 | 48.75 | 5,037,129 | 49.21 | |||||||||||||||
| Q3 2017 |
67,379 | 3,071,672 | 45.59 | 3,087,576 | 45.82 | |||||||||||||||
| Q4 2017 |
366,007 | 16,259,525 | 44.42 | 16,297,256 | 44.53 | |||||||||||||||
|
|
|
|
|
|
|
|
|
|
|
|||||||||||
| Total 2017 |
619,293 | $ | 27,868,446 | $ | 45.00 | $ | 27,968,875 | $ | 45.16 | |||||||||||
|
|
|
|
|
|
|
|
|
|
|
|||||||||||
| RETAIL | ||||||||||||||||||||
| Annualized | ||||||||||||||||||||
| Rentable Square | Current Annualized | Per | Rental Obligations Under | Per | ||||||||||||||||
| Lease Expiration | Footage Subject to | Rental Obligations Under | Square | Expiring Leases | Square | |||||||||||||||
| by Quarter |
Expiring Leases | Expiring Leases | Foot | with future step-ups | Foot | |||||||||||||||
| Q1 2016 |
— | $ | — | $ | — | $ | — | $ | — | |||||||||||
| Q2 2016 |
— | — | — | — | — | |||||||||||||||
| Q3 2016 |
32,079 | 96,237 | 3.00 | 96,237 | 3.00 | (4) | ||||||||||||||
| Q4 2016 |
24,283 | 3,394,277 | 139.78 | 3,399,077 | 139.98 | |||||||||||||||
|
|
|
|
|
|
|
|
|
|
|
|||||||||||
| Total 2016 |
56,362 | $ | 3,490,514 | $ | 61.93 | $ | 3,495,314 | $ | 62.02 | |||||||||||
|
|
|
|
|
|
|
|
|
|
|
|||||||||||
| Q1 2017 |
10,549 | $ | 1,274,865 | $ | 120.85 | $ | 1,277,301 | $ | 121.08 | |||||||||||
| Q2 2017 |
28,504 | 1,940,812 | 68.09 | 1,940,812 | 68.09 | |||||||||||||||
| Q3 2017 |
3,388 | 526,440 | 155.38 | 526,440 | 155.38 | |||||||||||||||
| Q4 2017 |
10,262 | 666,880 | 64.99 | 669,152 | 65.21 | |||||||||||||||
|
|
|
|
|
|
|
|
|
|
|
|||||||||||
| Total 2017 |
52,703 | $ | 4,408,998 | $ | 83.66 | $ | 4,413,706 | $ | 83.75 | |||||||||||
|
|
|
|
|
|
|
|
|
|
|
|||||||||||
| TOTAL PROPERTY TYPES | ||||||||||||||||||||
| Annualized | ||||||||||||||||||||
| Rentable Square | Current Annualized | Per | Rental Obligations Under | Per | ||||||||||||||||
| Lease Expiration | Footage Subject to | Rental Obligations Under | Square | Expiring Leases | Square | |||||||||||||||
| by Quarter |
Expiring Leases | Expiring Leases | Foot | with future step-ups | Foot | |||||||||||||||
| Q1 2016 |
— | $ | — | $ | — | $ | — | $ | — | |||||||||||
| Q2 2016 |
— | — | — | — | — | |||||||||||||||
| Q3 2016 |
58,986 | 1,351,133 | 22.91 | 1,351,133 | 22.91 | (4) | ||||||||||||||
| Q4 2016 |
165,458 | 9,514,828 | 57.51 | 9,519,628 | 57.54 | |||||||||||||||
|
|
|
|
|
|
|
|
|
|
|
|||||||||||
| Total 2016 |
224,444 | $ | 10,865,961 | $ | 48.41 | $ | 10,870,761 | $ | 48.43 | |||||||||||
|
|
|
|
|
|
|
|
|
|
|
|||||||||||
| Q1 2017 |
94,089 | $ | 4,821,780 | $ | 51.25 | $ | 4,824,216 | $ | 51.27 | |||||||||||
| Q2 2017 |
130,871 | 6,931,147 | 52.96 | 6,977,941 | 53.32 | |||||||||||||||
| Q3 2017 |
70,767 | 3,598,113 | 50.84 | 3,614,017 | 51.07 | |||||||||||||||
| Q4 2017 |
376,269 | 16,926,405 | 44.98 | 16,966,408 | 45.09 | |||||||||||||||
|
|
|
|
|
|
|
|
|
|
|
|||||||||||
| Total 2017 |
671,996 | $ | 32,277,445 | $ | 48.03 | $ | 32,382,581 | $ | 48.19 | |||||||||||
|
|
|
|
|
|
|
|
|
|
|
|||||||||||
| (1) | For disclosures relating to the Company’s definition of Annualized Rental Obligations, see page 47. |
| (2) | Includes 100% of joint venture properties. Does not include residential units and hotel. |
| (3) | Does not include data for leases expiring in a particular year when leases for the same space have already been signed with replacement tenants with future commencement dates. In those cases, the data is included in the year in which the future lease expires. |
| (4) | Includes square feet expiring on the last day of the quarter. |
34
THIRD QUARTER 2016
IN-SERVICE NEW YORK REGION PROPERTIES
Lease Expirations—New York Region (1) (2) (3)
| OFFICE | ||||||||||||||||||||
| Annualized | ||||||||||||||||||||
| Rentable Square | Current Annualized | Per | Rental Obligations Under | Per | ||||||||||||||||
| Year of Lease | Footage Subject to | Rental Obligations Under | Square | Expiring Leases | Square | |||||||||||||||
| Expiration |
Expiring Leases | Expiring Leases | Foot | with future step-ups | Foot | |||||||||||||||
| 2016 | 81,014 | $ | 5,003,203 | $ | 61.76 | $ | 5,003,203 | $ | 61.76 | (4) | ||||||||||
| 2017 | 781,141 | 65,057,518 | 83.29 | 65,057,518 | 83.29 | |||||||||||||||
| 2018 | 525,434 | 42,080,919 | 80.09 | 42,219,142 | 80.35 | |||||||||||||||
| 2019 | 488,304 | 38,756,482 | 79.37 | 38,942,619 | 79.75 | |||||||||||||||
| 2020 | 1,859,183 | 152,265,608 | 81.90 | 156,383,386 | 84.11 | |||||||||||||||
| 2021 | 388,115 | 33,826,099 | 87.15 | 35,019,730 | 90.23 | |||||||||||||||
| 2022 | 923,972 | 80,408,965 | 87.03 | 86,105,136 | 93.19 | |||||||||||||||
| 2023 | 94,316 | 8,482,716 | 89.94 | 9,382,670 | 99.48 | |||||||||||||||
| 2024 | 1,045,709 | 72,172,295 | 69.02 | 78,762,512 | 75.32 | |||||||||||||||
| 2025 | 442,855 | 36,613,682 | 82.68 | 40,077,558 | 90.50 | |||||||||||||||
| Thereafter | 3,348,175 | 306,639,583 | 91.58 | 409,721,723 | 122.37 | |||||||||||||||
| RETAIL | ||||||||||||||||||||
| Annualized | ||||||||||||||||||||
| Rentable Square | Current Annualized | Per | Rental Obligations Under | Per | ||||||||||||||||
| Year of Lease | Footage Subject to | Rental Obligations Under | Square | Expiring Leases | Square | |||||||||||||||
| Expiration |
Expiring Leases | Expiring Leases | Foot | with future step-ups | Foot | |||||||||||||||
| 2016 | 5,927 | $ | 649,793 | $ | 109.63 | $ | 649,793 | $ | 109.63 | (4) | ||||||||||
| 2017 | 36,901 | 7,015,689 | 190.12 | 7,015,689 | 190.12 | |||||||||||||||
| 2018 | 8,114 | 9,023,731 | 1,112.12 | 9,549,453 | 1,176.91 | |||||||||||||||
| 2019 | — | — | — | — | — | |||||||||||||||
| 2020 | 3,452 | 253,056 | 73.31 | 253,056 | 73.31 | |||||||||||||||
| 2021 | 26,225 | 12,586,842 | 479.96 | 13,635,533 | 519.94 | |||||||||||||||
| 2022 | 58,093 | 9,911,629 | 170.62 | 10,845,627 | 186.69 | |||||||||||||||
| 2023 | 2,850 | 2,844,360 | 998.02 | 3,455,985 | 1,212.63 | |||||||||||||||
| 2024 | 12,745 | 4,195,277 | 329.17 | 5,380,865 | 422.19 | |||||||||||||||
| 2025 | 1,872 | 654,764 | 349.77 | 730,700 | 390.33 | |||||||||||||||
| Thereafter | 144,516 | 22,220,454 | 153.76 | 44,794,342 | 309.96 | |||||||||||||||
| TOTAL PROPERTY TYPES | ||||||||||||||||||||
| Annualized | ||||||||||||||||||||
| Rentable Square | Current Annualized | Per | Rental Obligations Under | Per | ||||||||||||||||
| Year of Lease | Footage Subject to | Rental Obligations Under | Square | Expiring Leases | Square | |||||||||||||||
| Expiration |
Expiring Leases | Expiring Leases | Foot | with future step-ups | Foot | |||||||||||||||
| 2016 | 86,941 | $ | 5,652,996 | $ | 65.02 | $ | 5,652,996 | $ | 65.02 | (4) | ||||||||||
| 2017 | 818,042 | 72,073,207 | 88.10 | 72,073,207 | 88.10 | |||||||||||||||
| 2018 | 533,548 | 51,104,651 | 95.78 | 51,768,596 | 97.03 | |||||||||||||||
| 2019 | 488,304 | 38,756,482 | 79.37 | 38,942,619 | 79.75 | |||||||||||||||
| 2020 | 1,862,635 | 152,518,664 | 81.88 | 156,636,442 | 84.09 | |||||||||||||||
| 2021 | 414,340 | 46,412,941 | 112.02 | 48,655,262 | 117.43 | |||||||||||||||
| 2022 | 982,065 | 90,320,594 | 91.97 | 96,950,763 | 98.72 | |||||||||||||||
| 2023 | 97,166 | 11,327,077 | 116.57 | 12,838,655 | 132.13 | |||||||||||||||
| 2024 | 1,058,454 | 76,367,572 | 72.15 | 84,143,377 | 79.50 | |||||||||||||||
| 2025 | 444,727 | 37,268,446 | 83.80 | 40,808,257 | 91.76 | |||||||||||||||
| Thereafter | 3,492,691 | 328,860,037 | 94.16 | 454,516,064 | 130.13 | |||||||||||||||
| (1) | For disclosures relating to the Company’s definition of Annualized Rental Obligations, see page 47. |
| (2) | Includes 100% of joint venture properties. |
| (3) | Does not include data for leases expiring in a particular year when leases for the same space have already been signed with replacement tenants with future commencement dates. In those cases, the data is included in the year in which the future lease expires. |
| (4) | Includes square feet expiring on the last day of the current quarter. |
35
THIRD QUARTER 2016
IN-SERVICE NEW YORK REGION PROPERTIES
Quarterly Lease Expirations—New York Region (1) (2) (3)
| OFFICE | ||||||||||||||||||||
| Annualized | ||||||||||||||||||||
| Rentable Square | Current Annualized | Per | Rental Obligations Under | Per | ||||||||||||||||
| Lease Expiration | Footage Subject to | Rental Obligations Under | Square | Expiring Leases | Square | |||||||||||||||
| by Quarter |
Expiring Leases | Expiring Leases | Foot | with future step-ups | Foot | |||||||||||||||
| Q1 2016 |
— | $ | — | $ | — | $ | — | $ | — | |||||||||||
| Q2 2016 |
— | — | — | — | — | |||||||||||||||
| Q3 2016 |
8,338 | 1,049,640 | 125.89 | 1,049,640 | 125.89 | (4) | ||||||||||||||
| Q4 2016 |
72,676 | 3,953,563 | 54.40 | 3,953,563 | 54.40 | |||||||||||||||
|
|
|
|
|
|
|
|
|
|
|
|||||||||||
| Total 2016 |
81,014 | $ | 5,003,203 | $ | 61.76 | $ | 5,003,203 | $ | 61.76 | |||||||||||
|
|
|
|
|
|
|
|
|
|
|
|||||||||||
| Q1 2017 |
82,865 | $ | 5,933,797 | $ | 71.61 | $ | 5,933,797 | $ | 71.61 | |||||||||||
| Q2 2017 |
142,222 | 12,227,116 | 85.97 | 12,227,116 | 85.97 | |||||||||||||||
| Q3 2017 |
518,167 | 43,805,827 | 84.54 | 43,805,827 | 84.54 | |||||||||||||||
| Q4 2017 |
37,887 | 3,090,778 | 81.58 | 3,090,778 | 81.58 | |||||||||||||||
|
|
|
|
|
|
|
|
|
|
|
|||||||||||
| Total 2017 |
781,141 | $ | 65,057,518 | $ | 83.29 | $ | 65,057,518 | $ | 83.29 | |||||||||||
|
|
|
|
|
|
|
|
|
|
|
|||||||||||
| RETAIL | ||||||||||||||||||||
| Annualized | ||||||||||||||||||||
| Rentable Square | Current Annualized | Per | Rental Obligations Under | Per | ||||||||||||||||
| Lease Expiration | Footage Subject to | Rental Obligations Under | Square | Expiring Leases | Square | |||||||||||||||
| by Quarter |
Expiring Leases | Expiring Leases | Foot | with future step-ups | Foot | |||||||||||||||
| Q1 2016 |
— | $ | — | $ | — | $ | — | $ | — | |||||||||||
| Q2 2016 |
— | — | — | — | — | |||||||||||||||
| Q3 2016 |
2,526 | 353,715 | 140.03 | 353,715 | 140.03 | (4) | ||||||||||||||
| Q4 2016 |
3,401 | 296,078 | 87.06 | 296,078 | 87.06 | |||||||||||||||
|
|
|
|
|
|
|
|
|
|
|
|||||||||||
| Total 2016 |
5,927 | $ | 649,793 | $ | 109.63 | $ | 649,793 | $ | 109.63 | |||||||||||
|
|
|
|
|
|
|
|
|
|
|
|||||||||||
| Q1 2017 |
10,216 | $ | 4,439,371 | $ | 434.55 | $ | 4,439,371 | $ | 434.55 | |||||||||||
| Q2 2017 |
626 | 180,160 | 287.79 | 180,160 | 287.79 | |||||||||||||||
| Q3 2017 |
26,059 | 2,396,159 | 91.95 | 2,396,159 | 91.95 | |||||||||||||||
| Q4 2017 |
— | — | — | — | — | |||||||||||||||
|
|
|
|
|
|
|
|
|
|
|
|||||||||||
| Total 2017 |
36,901 | $ | 7,015,689 | $ | 190.12 | $ | 7,015,689 | $ | 190.12 | |||||||||||
|
|
|
|
|
|
|
|
|
|
|
|||||||||||
| TOTAL PROPERTY TYPES | ||||||||||||||||||||
| Annualized | ||||||||||||||||||||
| Rentable Square | Current Annualized | Per | Rental Obligations Under | Per | ||||||||||||||||
| Lease Expiration | Footage Subject to | Rental Obligations Under | Square | Expiring Leases | Square | |||||||||||||||
| by Quarter |
Expiring Leases | Expiring Leases | Foot | with future step-ups | Foot | |||||||||||||||
| Q1 2016 |
— | $ | — | $ | — | $ | — | $ | — | |||||||||||
| Q2 2016 |
— | — | — | — | — | |||||||||||||||
| Q3 2016 |
10,864 | 1,403,355 | 129.17 | 1,403,355 | 129.17 | (4) | ||||||||||||||
| Q4 2016 |
76,077 | 4,249,641 | 55.86 | 4,249,641 | 55.86 | |||||||||||||||
|
|
|
|
|
|
|
|
|
|
|
|||||||||||
| Total 2016 |
86,941 | $ | 5,652,996 | $ | 65.02 | $ | 5,652,996 | $ | 65.02 | |||||||||||
|
|
|
|
|
|
|
|
|
|
|
|||||||||||
| Q1 2017 |
93,081 | $ | 10,373,168 | $ | 111.44 | $ | 10,373,168 | $ | 111.44 | |||||||||||
| Q2 2017 |
142,848 | 12,407,276 | 86.86 | 12,407,276 | 86.86 | |||||||||||||||
| Q3 2017 |
544,226 | 46,201,986 | 84.89 | 46,201,986 | 84.89 | |||||||||||||||
| Q4 2017 |
37,887 | 3,090,778 | 81.58 | 3,090,778 | 81.58 | |||||||||||||||
|
|
|
|
|
|
|
|
|
|
|
|||||||||||
| Total 2017 |
818,042 | $ | 72,073,207 | $ | 88.10 | $ | 72,073,207 | $ | 88.10 | |||||||||||
|
|
|
|
|
|
|
|
|
|
|
|||||||||||
| (1) | For disclosures relating to the Company’s definition of Annualized Rental Obligations, see page 47. |
| (2) | Includes 100% of joint venture properties. |
| (3) | Does not include data for leases expiring in a particular year when leases for the same space have already been signed with replacement tenants with future commencement dates. In those cases, the data is included in the year in which the future lease expires. |
| (4) | Includes square feet expiring on the last day of the quarter. |
36
THIRD QUARTER 2016
IN-SERVICE SAN FRANCISCO AND LOS ANGELES REGIONS PROPERTIES
Lease Expirations—San Francisco and Los Angeles Regions (1) (2) (3)
| OFFICE | ||||||||||||||||||||
| Annualized | ||||||||||||||||||||
| Rentable Square | Current Annualized | Per | Rental Obligations Under | Per | ||||||||||||||||
| Year of Lease | Footage Subject to | Rental Obligations Under | Square | Expiring Leases | Square | |||||||||||||||
| Expiration |
Expiring Leases | Expiring Leases | Foot | with future step-ups | Foot | |||||||||||||||
| 2016 | 87,141 | $ | 3,144,928 | $ | 36.09 | $ | 3,146,128 | $ | 36.10 | (4) | ||||||||||
| 2017 | 508,246 | 23,186,645 | 45.62 | 25,046,505 | 49.28 | |||||||||||||||
| 2018 | 195,064 | 10,411,063 | 53.37 | 10,690,049 | 54.80 | |||||||||||||||
| 2019 | 836,131 | 41,254,699 | 49.34 | 43,724,811 | 52.29 | |||||||||||||||
| 2020 | 787,254 | 48,976,128 | 62.21 | 51,390,887 | 65.28 | |||||||||||||||
| 2021 | 761,906 | 33,679,606 | 44.20 | 38,631,464 | 50.70 | |||||||||||||||
| 2022 | 782,406 | 37,620,802 | 48.08 | 47,994,521 | 61.34 | |||||||||||||||
| 2023 | 301,611 | 19,529,785 | 64.75 | 22,928,272 | 76.02 | |||||||||||||||
| 2024 | 394,472 | 22,162,314 | 56.18 | 23,501,649 | 59.58 | |||||||||||||||
| 2025 | 313,833 | 17,119,817 | 54.55 | 21,828,149 | 69.55 | |||||||||||||||
| Thereafter | 967,911 | 61,950,804 | 64.00 | 82,304,682 | 85.03 | |||||||||||||||
| RETAIL | ||||||||||||||||||||
| Annualized | ||||||||||||||||||||
| Rentable Square | Current Annualized | Per | Rental Obligations Under | Per | ||||||||||||||||
| Year of Lease | Footage Subject to | Rental Obligations Under | Square | Expiring Leases | Square | |||||||||||||||
| Expiration |
Expiring Leases | Expiring Leases | Foot | with future step-ups | Foot | |||||||||||||||
| 2016 | 41,692 | $ | 1,456,086 | $ | 34.92 | $ | 1,456,086 | $ | 34.92 | |||||||||||
| 2017 | 15,277 | 1,054,806 | 69.05 | 1,058,353 | 69.28 | |||||||||||||||
| 2018 | 35,502 | 2,131,323 | 60.03 | 2,165,211 | 60.99 | |||||||||||||||
| 2019 | 14,168 | 769,355 | 54.30 | 793,047 | 55.97 | |||||||||||||||
| 2020 | 35,924 | 2,218,546 | 61.76 | 2,348,273 | 65.37 | |||||||||||||||
| 2021 | 22,132 | 1,420,869 | 64.20 | 1,505,709 | 68.03 | |||||||||||||||
| 2022 | 27,445 | 1,086,007 | 39.57 | 1,161,032 | 42.30 | |||||||||||||||
| 2023 | 29,753 | 1,661,776 | 55.85 | 1,770,434 | 59.50 | |||||||||||||||
| 2024 | 8,545 | 559,033 | 65.42 | 648,935 | 75.94 | |||||||||||||||
| 2025 | 21,461 | 1,329,773 | 61.96 | 1,527,889 | 71.19 | |||||||||||||||
| Thereafter | 36,174 | 2,467,228 | 68.20 | 3,014,625 | 83.34 | |||||||||||||||
| TOTAL PROPERTY TYPES | ||||||||||||||||||||
| Annualized | ||||||||||||||||||||
| Rentable Square | Current Annualized | Per | Rental Obligations Under | Per | ||||||||||||||||
| Year of Lease | Footage Subject to | Rental Obligations Under | Square | Expiring Leases | Square | |||||||||||||||
| Expiration |
Expiring Leases | Expiring Leases | Foot | with future step-ups | Foot | |||||||||||||||
| 2016 | 128,833 | $ | 4,601,013 | $ | 35.71 | $ | 4,602,213 | $ | 35.72 | (4) | ||||||||||
| 2017 | 523,523 | 24,241,450 | 46.30 | 26,104,857 | 49.86 | |||||||||||||||
| 2018 | 230,566 | 12,542,386 | 54.40 | 12,855,260 | 55.76 | |||||||||||||||
| 2019 | 850,299 | 42,024,054 | 49.42 | 44,517,858 | 52.36 | |||||||||||||||
| 2020 | 823,178 | 51,194,675 | 62.19 | 53,739,160 | 65.28 | |||||||||||||||
| 2021 | 784,038 | 35,100,475 | 44.77 | 40,137,172 | 51.19 | |||||||||||||||
| 2022 | 809,851 | 38,706,810 | 47.79 | 49,155,553 | 60.70 | |||||||||||||||
| 2023 | 331,364 | 21,191,561 | 63.95 | 24,698,706 | 74.54 | |||||||||||||||
| 2024 | 403,017 | 22,721,347 | 56.38 | 24,150,584 | 59.92 | |||||||||||||||
| 2025 | 335,294 | 18,449,590 | 55.03 | 23,356,038 | 69.66 | |||||||||||||||
| Thereafter | 1,004,085 | 64,418,032 | 64.16 | 85,319,307 | 84.97 | |||||||||||||||
| (1) | For disclosures relating to the Company’s definition of Annualized Rental Obligations, see page 47. |
| (2) | Includes 100% of joint venture properties. |
| (3) | Does not include data for leases expiring in a particular year when leases for the same space have already been signed with replacement tenants with future commencement dates. In those cases, the data is included in the year in which the future lease expires. |
| (4) | Includes square feet expiring on the last day of the quarter. |
37
THIRD QUARTER 2016
IN-SERVICE SAN FRANCISCO AND LOS ANGELES REGIONS PROPERTIES
Quarterly Lease Expirations—San Francisco and Los Angeles Regions (1) (2) (3)
| OFFICE | ||||||||||||||||||||
| Annualized | ||||||||||||||||||||
| Rentable Square | Current Annualized | Per | Rental Obligations Under | Per | ||||||||||||||||
| Lease Expiration | Footage Subject to | Rental Obligations Under | Square | Expiring Leases | Square | |||||||||||||||
| by Quarter |
Expiring Leases | Expiring Leases | Foot | with future step-ups | Foot | |||||||||||||||
| Q1 2016 |
— | $ | — | $ | — | $ | — | $ | — | |||||||||||
| Q2 2016 |
— | — | — | — | — | |||||||||||||||
| Q3 2016 |
6,692 | 344,139 | 51.43 | 344,139 | 51.43 | (4) | ||||||||||||||
| Q4 2016 |
80,449 | 2,800,789 | 34.81 | 2,801,989 | 34.83 | |||||||||||||||
|
|
|
|
|
|
|
|
|
|
|
|||||||||||
| Total 2016 |
87,141 | $ | 3,144,928 | $ | 36.09 | $ | 3,146,128 | $ | 36.10 | |||||||||||
|
|
|
|
|
|
|
|
|
|
|
|||||||||||
| Q1 2017 |
92,602 | $ | 5,014,048 | $ | 54.15 | $ | 5,016,186 | $ | 54.17 | |||||||||||
| Q2 2017 |
176,105 | 6,295,225 | 35.75 | 6,514,577 | 36.99 | |||||||||||||||
| Q3 2017 |
184,296 | 9,654,704 | 52.39 | 11,000,015 | 59.69 | |||||||||||||||
| Q4 2017 |
55,243 | 2,222,668 | 40.23 | 2,515,727 | 45.54 | |||||||||||||||
|
|
|
|
|
|
|
|
|
|
|
|||||||||||
| Total 2017 |
508,246 | $ | 23,186,645 | $ | 45.62 | $ | 25,046,505 | $ | 49.28 | |||||||||||
|
|
|
|
|
|
|
|
|
|
|
|||||||||||
| RETAIL | ||||||||||||||||||||
| Annualized | ||||||||||||||||||||
| Rentable Square | Current Annualized | Per | Rental Obligations Under | Per | ||||||||||||||||
| Lease Expiration | Footage Subject to | Rental Obligations Under | Square | Expiring Leases | Square | |||||||||||||||
| by Quarter |
Expiring Leases | Expiring Leases | Foot | with future step-ups | Foot | |||||||||||||||
| Q1 2016 |
— | $ | — | $ | — | $ | — | $ | — | |||||||||||
| Q2 2016 |
— | — | — | — | — | |||||||||||||||
| Q3 2016 |
— | — | — | — | — | |||||||||||||||
| Q4 2016 |
41,692 | 1,456,086 | 34.92 | 1,456,086 | 34.92 | |||||||||||||||
|
|
|
|
|
|
|
|
|
|
|
|||||||||||
| Total 2016 |
41,692 | $ | 1,456,086 | $ | 34.92 | $ | 1,456,086 | $ | 34.92 | |||||||||||
|
|
|
|
|
|
|
|
|
|
|
|||||||||||
| Q1 2017 |
30 | $ | 14,400 | $ | 480.00 | $ | 14,400 | $ | 480.00 | |||||||||||
| Q2 2017 |
130 | 26,046 | 200.35 | 26,046 | 200.35 | |||||||||||||||
| Q3 2017 |
8,793 | 635,152 | 72.23 | 636,741 | 72.41 | |||||||||||||||
| Q4 2017 |
6,324 | 379,208 | 59.96 | 381,166 | 60.27 | |||||||||||||||
|
|
|
|
|
|
|
|
|
|
|
|||||||||||
| Total 2017 |
15,277 | $ | 1,054,806 | $ | 69.05 | $ | 1,058,353 | $ | 69.28 | |||||||||||
|
|
|
|
|
|
|
|
|
|
|
|||||||||||
| TOTAL PROPERTY TYPES | ||||||||||||||||||||
| Annualized | ||||||||||||||||||||
| Rentable Square | Current Annualized | Per | Rental Obligations Under | Per | ||||||||||||||||
| Lease Expiration | Footage Subject to | Rental Obligations Under | Square | Expiring Leases | Square | |||||||||||||||
| by Quarter |
Expiring Leases | Expiring Leases | Foot | with future step-ups | Foot | |||||||||||||||
| Q1 2016 |
— | $ | — | $ | — | $ | — | $ | — | |||||||||||
| Q2 2016 |
— | — | — | — | — | |||||||||||||||
| Q3 2016 |
6,692 | 344,139 | 51.43 | 344,139 | 51.43 | (4) | ||||||||||||||
| Q4 2016 |
122,141 | 4,256,874 | 34.85 | 4,258,074 | 34.86 | |||||||||||||||
|
|
|
|
|
|
|
|
|
|
|
|||||||||||
| Total 2016 |
128,833 | $ | 4,601,013 | $ | 35.71 | $ | 4,602,213 | $ | 35.72 | |||||||||||
|
|
|
|
|
|
|
|
|
|
|
|||||||||||
| Q1 2017 |
92,632 | $ | 5,028,448 | $ | 54.28 | $ | 5,030,586 | $ | 54.31 | |||||||||||
| Q2 2017 |
176,235 | 6,321,270 | 35.87 | 6,540,623 | 37.11 | |||||||||||||||
| Q3 2017 |
193,089 | 10,289,857 | 53.29 | 11,636,756 | 60.27 | |||||||||||||||
| Q4 2017 |
61,567 | 2,601,875 | 42.26 | 2,896,893 | 47.05 | |||||||||||||||
|
|
|
|
|
|
|
|
|
|
|
|||||||||||
| Total 2017 |
523,523 | $ | 24,241,450 | $ | 46.30 | $ | 26,104,857 | $ | 49.86 | |||||||||||
|
|
|
|
|
|
|
|
|
|
|
|||||||||||
| (1) | For disclosures relating to the Company’s definition of Annualized Rental Obligations, see page 47. |
| (2) | Includes 100% of joint venture properties. |
| (3) | Does not include data for leases expiring in a particular year when leases for the same space have already been signed with replacement tenants with future commencement dates. In those cases, the data is included in the year in which the future lease expires. |
| (4) | Includes square feet expiring on the last day of the quarter. |
38
THIRD QUARTER 2016
IN-SERVICE WASHINGTON, DC REGION PROPERTIES
Lease Expirations—Washington, DC Region (1) (2) (3)
| OFFICE | ||||||||||||||||||||
| Annualized | ||||||||||||||||||||
| Rentable Square | Current Annualized | Per | Rental Obligations Under | Per | ||||||||||||||||
| Year of Lease | Footage Subject to | Rental Obligations Under | Square | Expiring Leases | Square | |||||||||||||||
| Expiration |
Expiring Leases | Expiring Leases | Foot | with future step-ups | Foot | |||||||||||||||
| 2016 | 169,207 | $ | 7,575,971 | $ | 44.77 | $ | 7,579,291 | $ | 44.79 | (4)(5) | ||||||||||
| 2017 | 564,678 | 28,041,245 | 49.66 | 28,168,537 | 49.88 | (5) | ||||||||||||||
| 2018 | 401,868 | 21,028,927 | 52.33 | 21,865,174 | 54.41 | |||||||||||||||
| 2019 | 1,044,909 | 49,134,877 | 47.02 | 50,818,245 | 48.63 | |||||||||||||||
| 2020 | 1,292,667 | 57,024,958 | 44.11 | 60,117,834 | 46.51 | |||||||||||||||
| 2021 | 1,205,048 | 63,214,826 | 52.46 | 69,801,579 | 57.92 | |||||||||||||||
| 2022 | 736,610 | 32,932,351 | 44.71 | 37,579,107 | 51.02 | |||||||||||||||
| 2023 | 506,045 | 23,758,141 | 46.95 | 27,751,232 | 54.84 | |||||||||||||||
| 2024 | 632,516 | 31,956,786 | 50.52 | 36,971,869 | 58.45 | |||||||||||||||
| 2025 | 459,440 | 19,629,346 | 42.72 | 23,697,161 | 51.58 | |||||||||||||||
| Thereafter | 1,809,423 | 120,672,020 | 66.69 | 158,219,946 | 87.44 | |||||||||||||||
| RETAIL | ||||||||||||||||||||
| Annualized | ||||||||||||||||||||
| Rentable Square | Current Annualized | Per | Rental Obligations Under | Per | ||||||||||||||||
| Year of Lease | Footage Subject to | Rental Obligations Under | Square | Expiring Leases | Square | |||||||||||||||
| Expiration |
Expiring Leases | Expiring Leases | Foot | with future step-ups | Foot | |||||||||||||||
| 2016 | 13,146 | $ | 848,881 | $ | 64.57 | $ | 848,881 | $ | 64.57 | |||||||||||
| 2017 | 44,086 | 2,495,820 | 56.61 | 2,515,987 | 57.07 | |||||||||||||||
| 2018 | 49,955 | 3,634,879 | 72.76 | 3,682,546 | 73.72 | |||||||||||||||
| 2019 | 66,287 | 3,702,386 | 55.85 | 3,772,072 | 56.91 | |||||||||||||||
| 2020 | 53,458 | 3,355,798 | 62.77 | 3,479,860 | 65.10 | |||||||||||||||
| 2021 | 76,692 | 4,947,973 | 64.52 | 5,214,399 | 67.99 | |||||||||||||||
| 2022 | 34,434 | 2,085,502 | 60.57 | 2,310,512 | 67.10 | |||||||||||||||
| 2023 | 59,112 | 2,769,585 | 46.85 | 3,071,154 | 51.95 | |||||||||||||||
| 2024 | 22,050 | 1,314,490 | 59.61 | 1,489,989 | 67.57 | |||||||||||||||
| 2025 | 77,110 | 2,919,231 | 37.86 | 3,196,435 | 41.45 | |||||||||||||||
| Thereafter | 124,606 | 5,297,023 | 42.51 | 6,203,006 | 49.78 | |||||||||||||||
| TOTAL PROPERTY TYPES | ||||||||||||||||||||
| Annualized | ||||||||||||||||||||
| Rentable Square | Current Annualized | Per | Rental Obligations Under | Per | ||||||||||||||||
| Year of Lease | Footage Subject to | Rental Obligations Under | Square | Expiring Leases | Square | |||||||||||||||
| Expiration |
Expiring Leases | Expiring Leases | Foot | with future step-ups | Foot | |||||||||||||||
| 2016 | 182,353 | $ | 8,424,852 | $ | 46.20 | $ | 8,428,172 | $ | 46.22 | (4) | ||||||||||
| 2017 | 608,764 | 30,537,065 | 50.16 | 30,684,524 | 50.40 | |||||||||||||||
| 2018 | 451,823 | 24,663,807 | 54.59 | 25,547,720 | 56.54 | |||||||||||||||
| 2019 | 1,111,196 | 52,837,263 | 47.55 | 54,590,317 | 49.13 | |||||||||||||||
| 2020 | 1,346,125 | 60,380,756 | 44.86 | 63,597,695 | 47.25 | |||||||||||||||
| 2021 | 1,281,740 | 68,162,799 | 53.18 | 75,015,978 | 58.53 | |||||||||||||||
| 2022 | 771,044 | 35,017,853 | 45.42 | 39,889,619 | 51.73 | |||||||||||||||
| 2023 | 565,157 | 26,527,726 | 46.94 | 30,822,386 | 54.54 | |||||||||||||||
| 2024 | 654,566 | 33,271,275 | 50.83 | 38,461,857 | 58.76 | |||||||||||||||
| 2025 | 536,550 | 22,548,577 | 42.03 | 26,893,596 | 50.12 | |||||||||||||||
| Thereafter | 1,934,029 | 125,969,043 | 65.13 | 164,422,951 | 85.02 | |||||||||||||||
| (1) | For disclosures relating to the Company’s definition of Annualized Rental Obligations, see page 47. |
| (2) | Includes 100% of joint venture properties. Does not include residential units. |
| (3) | Does not include data for leases expiring in a particular year when leases for the same space have already been signed with replacement tenants with future commencement dates. In those cases, the data is included in the year in which the future lease expires. |
| (4) | Includes square feet expiring on the last day of the current quarter. |
| (5) | Includes 10,922 and 14,887 square feet of Sensitive Compartmented Information Facility (SCIF) space in 2016 and 2017, respectively. Excluding the SCIF space, the current and future expiring rental rates per square foot would be $40.84 and $40.86 and $47.72 and $47.93, respectively. |
39
THIRD QUARTER 2016
IN-SERVICE WASHINGTON, DC REGION PROPERTIES
Quarterly Lease Expirations—Washington, DC Region (1) (2) (3)
| OFFICE | ||||||||||||||||||||
|
|
||||||||||||||||||||
| Annualized | ||||||||||||||||||||
| Rentable Square | Current Annualized | Per | Rental Obligations Under | Per | ||||||||||||||||
| Lease Expiration | Footage Subject to | Rental Obligations Under | Square | Expiring Leases | Square | |||||||||||||||
| by Quarter |
Expiring Leases | Expiring Leases | Foot | with future step-ups | Foot | |||||||||||||||
| Q1 2016 |
— | $ | — | $ | — | $ | — | $ | — | |||||||||||
| Q2 2016 |
— | — | — | — | — | |||||||||||||||
| Q3 2016 |
42,422 | 1,036,190 | 24.43 | 1,036,190 | 24.43 | (4) | ||||||||||||||
| Q4 2016 |
126,785 | 6,539,781 | 51.58 | 6,543,102 | 51.61 | (5) | ||||||||||||||
|
|
|
|
|
|
|
|
|
|
|
|||||||||||
| Total 2016 |
169,207 | $ | 7,575,971 | $ | 44.77 | $ | 7,579,291 | $ | 44.79 | |||||||||||
|
|
|
|
|
|
|
|
|
|
|
|||||||||||
| Q1 2017 |
114,048 | $ | 5,261,529 | $ | 46.13 | $ | 5,263,431 | $ | 46.15 | |||||||||||
| Q2 2017 |
87,296 | 5,413,006 | 62.01 | 5,445,204 | 62.38 | (5) | ||||||||||||||
| Q3 2017 |
232,720 | 11,242,054 | 48.31 | 11,265,402 | 48.41 | |||||||||||||||
| Q4 2017 |
130,614 | 6,124,656 | 46.89 | 6,194,500 | 47.43 | |||||||||||||||
|
|
|
|
|
|
|
|
|
|
|
|||||||||||
| Total 2017 |
564,678 | $ | 28,041,245 | $ | 49.66 | $ | 28,168,537 | $ | 49.88 | |||||||||||
|
|
|
|
|
|
|
|
|
|
|
|||||||||||
| RETAIL | ||||||||||||||||||||
|
|
||||||||||||||||||||
| Annualized | ||||||||||||||||||||
| Rentable Square | Current Annualized | Per | Rental Obligations Under | Per | ||||||||||||||||
| Lease Expiration | Footage Subject to | Rental Obligations Under | Square | Expiring Leases | Square | |||||||||||||||
| by Quarter |
Expiring Leases | Expiring Leases | Foot | with future step-ups | Foot | |||||||||||||||
| Q1 2016 |
— | $ | — | $ | — | $ | — | $ | — | |||||||||||
| Q2 2016 |
— | — | — | — | — | |||||||||||||||
| Q3 2016 |
— | — | — | — | — | |||||||||||||||
| Q4 2016 |
13,146 | 848,881 | 64.57 | 848,881 | 64.57 | |||||||||||||||
|
|
|
|
|
|
|
|
|
|
|
|||||||||||
| Total 2016 |
13,146 | $ | 848,881 | $ | 64.57 | $ | 848,881 | $ | 64.57 | |||||||||||
|
|
|
|
|
|
|
|
|
|
|
|||||||||||
| Q1 2017 |
21,273 | $ | 1,274,401 | $ | 59.91 | $ | 1,274,401 | $ | 59.91 | |||||||||||
| Q2 2017 |
5,066 | 140,592 | 27.75 | 140,592 | 27.75 | |||||||||||||||
| Q3 2017 |
6,842 | 446,730 | 65.29 | 446,730 | 65.29 | |||||||||||||||
| Q4 2017 |
10,905 | 634,097 | 58.15 | 654,263 | 60.00 | |||||||||||||||
|
|
|
|
|
|
|
|
|
|
|
|||||||||||
| Total 2017 |
44,086 | $ | 2,495,820 | $ | 56.61 | $ | 2,515,987 | $ | 57.07 | |||||||||||
|
|
|
|
|
|
|
|
|
|
|
|||||||||||
| TOTAL PROPERTY TYPES | ||||||||||||||||||||
|
|
||||||||||||||||||||
| Annualized | ||||||||||||||||||||
| Rentable Square | Current Annualized | Per | Rental Obligations Under | Per | ||||||||||||||||
| Lease Expiration | Footage Subject to | Rental Obligations Under | Square | Expiring Leases | Square | |||||||||||||||
| by Quarter |
Expiring Leases | Expiring Leases | Foot | with future step-ups | Foot | |||||||||||||||
| Q1 2016 |
— | $ | — | $ | — | $ | — | $ | — | |||||||||||
| Q2 2016 |
— | — | — | — | — | |||||||||||||||
| Q3 2016 |
42,422 | 1,036,190 | 24.43 | 1,036,190 | 24.43 | (4) | ||||||||||||||
| Q4 2016 |
139,931 | 7,388,662 | 52.80 | 7,391,982 | 52.83 | |||||||||||||||
|
|
|
|
|
|
|
|
|
|
|
|||||||||||
| Total 2016 |
182,353 | $ | 8,424,852 | $ | 46.20 | $ | 8,428,172 | $ | 46.22 | |||||||||||
|
|
|
|
|
|
|
|
|
|
|
|||||||||||
| Q1 2017 |
135,321 | $ | 6,535,931 | $ | 48.30 | $ | 6,537,833 | $ | 48.31 | |||||||||||
| Q2 2017 |
92,362 | 5,553,598 | 60.13 | 5,585,796 | 60.48 | |||||||||||||||
| Q3 2017 |
239,562 | 11,688,783 | 48.79 | 11,712,132 | 48.89 | |||||||||||||||
| Q4 2017 |
141,519 | 6,758,753 | 47.76 | 6,848,763 | 48.39 | |||||||||||||||
|
|
|
|
|
|
|
|
|
|
|
|||||||||||
| Total 2017 |
608,764 | $ | 30,537,065 | $ | 50.16 | $ | 30,684,524 | $ | 50.40 | |||||||||||
|
|
|
|
|
|
|
|
|
|
|
|||||||||||
| (1) | For disclosures relating to the Company’s definition of Annualized Rental Obligations, see page 47. |
| (2) | Includes 100% of joint venture properties. Does not include residential units. |
| (3) | Does not include data for leases expiring in a particular year when leases for the same space have already been signed with replacement tenants with future commencement dates. In those cases, the data is included in the year in which the future lease expires. |
| (4) | Includes square feet expiring on the last day of the current quarter. |
| (5) | Includes 10,922 and 14,887 square feet of Sensitive Compartmented Information Facility (SCIF) space in Q4 2016 and Q2 2017, respectively. Excluding the SCIF space, the current and future expiring rental rates per square foot would be $46.85 and $46.88 and $49.79 and $50.10, respectively. |
40
THIRD QUARTER 2016
CBD PROPERTIES
Lease Expirations (1) (2) (3)
| Boston | San Francisco and Los Angeles | |||||||||||||||||||||||||||||||||||||||
| Year of Lease Expiration |
Rentable Square Footage Subject to Expiring Leases |
Current Annualized Rental Obligations Under Expiring Leases |
Per Square Foot |
Annualized Rental Obligations Under Expiring Leases with future step-ups |
Per Square Foot |
Rentable Square Footage Subject to Expiring Leases |
Current Annualized Rental Obligations Under Expiring Leases |
Per Square Foot |
Annualized Rental Obligations Under Expiring Leases with future step-ups |
Per Square Foot |
||||||||||||||||||||||||||||||
| 2016 |
127,483 | $ | 7,621,847 | $ | 59.79 | $ | 7,626,647 | $ | 59.82 | (4) | 84,256 | $ | 3,215,217 | $ | 38.16 | $ | 3,216,417 | $ | 38.17 | (4) | ||||||||||||||||||||
| 2017 |
348,617 | 21,215,474 | 60.86 | 21,289,022 | 61.07 | 295,474 | 17,801,141 | 60.25 | 19,310,182 | 65.35 | ||||||||||||||||||||||||||||||
| 2018 |
320,907 | 15,939,908 | 49.67 | 16,204,392 | 50.50 | 171,523 | 10,293,190 | 60.01 | 10,525,952 | 61.37 | ||||||||||||||||||||||||||||||
| 2019 |
650,121 | 36,945,959 | 56.83 | 37,294,412 | 57.37 | 380,470 | 22,315,095 | 58.65 | 23,384,286 | 61.46 | ||||||||||||||||||||||||||||||
| 2020 |
315,699 | 18,840,650 | 59.68 | 19,496,726 | 61.76 | 747,531 | 47,763,200 | 63.89 | 50,038,818 | 66.94 | ||||||||||||||||||||||||||||||
| 2021 |
422,738 | 23,922,186 | 56.59 | 24,619,328 | 58.24 | 448,368 | 26,515,451 | 59.14 | 30,375,396 | 67.75 | ||||||||||||||||||||||||||||||
| 2022 |
955,602 | 54,345,121 | 56.87 | 58,504,105 | 61.22 | 405,507 | 21,793,379 | 53.74 | 28,222,940 | 69.60 | ||||||||||||||||||||||||||||||
| 2023 |
412,150 | 27,809,272 | 67.47 | 30,939,587 | 75.07 | 290,707 | 19,001,813 | 65.36 | 21,856,052 | 75.18 | ||||||||||||||||||||||||||||||
| 2024 |
272,428 | 15,614,664 | 57.32 | 17,233,344 | 63.26 | 378,505 | 21,765,379 | 57.50 | 22,939,592 | 60.61 | ||||||||||||||||||||||||||||||
| 2025 |
689,507 | 44,618,581 | 64.71 | 50,945,581 | 73.89 | 329,652 | 18,255,875 | 55.38 | 23,103,875 | 70.09 | ||||||||||||||||||||||||||||||
| Thereafter |
3,358,767 | 202,968,147 | 60.43 | 232,590,417 | 69.25 | 1,004,085 | 64,418,032 | 64.16 | 85,319,307 | 84.97 | ||||||||||||||||||||||||||||||
| New York | Washington, DC | |||||||||||||||||||||||||||||||||||||||
| Year of Lease Expiration |
Rentable Square Footage Subject to Expiring Leases |
Current Annualized Rental Obligations Under Expiring Leases |
Per Square Foot |
Annualized Rental Obligations Under Expiring Leases with future step-ups |
Per Square Foot |
Rentable Square Footage Subject to Expiring Leases |
Current Annualized Rental Obligations Under Expiring Leases |
Per Square Foot |
Annualized Rental Obligations Under Expiring Leases with future step-ups |
Per Square Foot |
||||||||||||||||||||||||||||||
| 2016 |
54,418 | $ | 4,387,989 | $ | 80.63 | $ | 4,387,989 | $ | 80.63 | (4) | 55,237 | $ | 2,695,440 | $ | 48.80 | $ | 2,695,440 | $ | 48.80 | (4) | ||||||||||||||||||||
| 2017 |
659,576 | 66,208,560 | 100.38 | 66,208,560 | 100.38 | 307,930 | 16,062,338 | 52.16 | 16,080,727 | 52.22 | ||||||||||||||||||||||||||||||
| 2018 |
320,479 | 43,877,084 | 136.91 | 44,402,806 | 138.55 | 116,353 | 6,864,525 | 59.00 | 7,130,559 | 61.28 | ||||||||||||||||||||||||||||||
| 2019 |
331,971 | 32,952,800 | 99.26 | 33,021,221 | 99.47 | 463,931 | 29,230,779 | 63.01 | 30,811,383 | 66.41 | ||||||||||||||||||||||||||||||
| 2020 |
1,554,040 | 141,870,013 | 91.29 | 145,505,560 | 93.63 | 449,101 | 24,928,827 | 55.51 | 26,453,343 | 58.90 | ||||||||||||||||||||||||||||||
| 2021 |
311,243 | 42,996,530 | 138.14 | 45,054,180 | 144.76 | 545,869 | 35,596,045 | 65.21 | 39,291,367 | 71.98 | ||||||||||||||||||||||||||||||
| 2022 |
915,419 | 88,137,018 | 96.28 | 94,553,309 | 103.29 | 100,909 | 5,812,055 | 57.60 | 6,433,114 | 63.75 | ||||||||||||||||||||||||||||||
| 2023 |
88,867 | 11,062,880 | 124.49 | 12,557,860 | 141.31 | 46,648 | 2,899,372 | 62.15 | 3,471,497 | 74.42 | ||||||||||||||||||||||||||||||
| 2024 |
669,101 | 62,857,518 | 93.94 | 69,837,758 | 104.38 | 193,400 | 12,614,112 | 65.22 | 14,658,060 | 75.79 | ||||||||||||||||||||||||||||||
| 2025 |
310,980 | 32,436,710 | 104.30 | 35,491,958 | 114.13 | 82,103 | 4,228,304 | 51.50 | 5,107,216 | 62.20 | ||||||||||||||||||||||||||||||
| Thereafter |
3,154,689 | 317,328,180 | 100.59 | 441,695,914 | 140.01 | 1,628,455 | 113,562,141 | 69.74 | 148,326,140 | 91.08 | ||||||||||||||||||||||||||||||
| (1) | For disclosures relating to the Company’s definition of Annualized Rental Obligations, see page 47. |
| (2) | Includes 100% of joint venture properties. Does not include residential units and hotel. |
| (3) | Does not include data for leases expiring in a particular year when leases for the same space have already been signed with replacement tenants with future commencement dates. In those cases, the data is included in the year in which the future lease expires. |
| (4) | Includes square feet expiring on the last day of the current quarter. |
41
THIRD QUARTER 2016
SUBURBAN PROPERTIES
Lease Expirations (1) (2) (3)
| Boston | San Francisco | |||||||||||||||||||||||||||||||||||||||
| Year of Lease Expiration |
Rentable Square Footage Subject to Expiring Leases |
Current Annualized Rental Obligations Under Expiring Leases |
Per Square Foot |
Annualized Rental Obligations Under Expiring Leases with future step-ups |
Per Square Foot |
Rentable Square Footage Subject to Expiring Leases |
Current Annualized Rental Obligations Under Expiring Leases |
Per Square Foot |
Annualized Rental Obligations Under Expiring Leases with future step-ups |
Per Square Foot |
||||||||||||||||||||||||||||||
| 2016 |
96,961 | $ | 3,244,115 | $ | 33.46 | $ | 3,244,115 | $ | 33.46 | (4) | 44,577 | $ | 1,385,796 | $ | 31.09 | $ | 1,385,796 | $ | 31.09 | |||||||||||||||||||||
| 2017 |
323,379 | 11,061,971 | 34.21 | 11,093,559 | 34.31 | 228,049 | 6,440,309 | 28.24 | 6,794,675 | 29.79 | ||||||||||||||||||||||||||||||
| 2018 |
275,146 | 9,213,169 | 33.48 | 9,413,226 | 34.21 | 59,043 | 2,249,196 | 38.09 | 2,329,308 | 39.45 | ||||||||||||||||||||||||||||||
| 2019 |
477,185 | 18,735,887 | 39.26 | 18,922,107 | 39.65 | 469,829 | 19,708,959 | 41.95 | 21,133,571 | 44.98 | ||||||||||||||||||||||||||||||
| 2020 |
275,110 | 9,520,772 | 34.61 | 10,640,801 | 38.68 | 75,647 | 3,431,475 | 45.36 | 3,700,342 | 48.92 | ||||||||||||||||||||||||||||||
| 2021 |
649,011 | 19,904,740 | 30.67 | 20,877,969 | 32.17 | 335,670 | 8,585,024 | 25.58 | 9,761,777 | 29.08 | ||||||||||||||||||||||||||||||
| 2022 |
695,658 | 25,521,161 | 36.69 | 25,815,374 | 37.11 | 404,344 | 16,913,430 | 41.83 | 20,932,613 | 51.77 | ||||||||||||||||||||||||||||||
| 2023 |
196,266 | 6,855,936 | 34.93 | 8,143,578 | 41.49 | 40,657 | 2,189,748 | 53.86 | 2,842,655 | 69.92 | ||||||||||||||||||||||||||||||
| 2024 |
323,984 | 12,632,071 | 38.99 | 14,680,559 | 45.31 | 24,512 | 955,968 | 39.00 | 1,210,992 | 49.40 | ||||||||||||||||||||||||||||||
| 2025 |
440,320 | 21,114,248 | 47.95 | 23,242,138 | 52.78 | 5,642 | 193,716 | 34.33 | 252,162 | 44.69 | ||||||||||||||||||||||||||||||
| Thereafter |
501,958 | 19,668,650 | 39.18 | 21,769,227 | 43.37 | — | — | — | — | — | ||||||||||||||||||||||||||||||
| New York | Washington, DC | |||||||||||||||||||||||||||||||||||||||
| Year of Lease Expiration |
Rentable Square Footage Subject to Expiring Leases |
Current Annualized Rental Obligations Under Expiring Leases |
Per Square Foot |
Annualized Rental Obligations Under Expiring Leases with future step-ups |
Per Square Foot |
Rentable Square Footage Subject to Expiring Leases |
Current Annualized Rental Obligations Under Expiring Leases |
Per Square Foot |
Annualized Rental Obligations Under Expiring Leases with future step-ups |
Per Square Foot |
||||||||||||||||||||||||||||||
| 2016 |
32,523 | $ | 1,265,008 | $ | 38.90 | $ | 1,265,008 | $ | 38.90 | 127,116 | $ | 5,729,412 | $ | 45.07 | $ | 5,732,732 | $ | 45.10 | (4)(5) | |||||||||||||||||||||
| 2017 |
158,466 | 5,864,647 | 37.01 | 5,864,647 | 37.01 | 300,834 | 14,474,728 | 48.12 | 14,603,797 | 48.54 | (5) | |||||||||||||||||||||||||||||
| 2018 |
213,069 | 7,227,566 | 33.92 | 7,365,789 | 34.57 | 335,470 | 17,799,281 | 53.06 | 18,417,161 | 54.90 | ||||||||||||||||||||||||||||||
| 2019 |
156,333 | 5,803,682 | 37.12 | 5,921,398 | 37.88 | 647,265 | 23,606,483 | 36.47 | 23,778,934 | 36.74 | ||||||||||||||||||||||||||||||
| 2020 |
308,595 | 10,648,651 | 34.51 | 11,130,882 | 36.07 | 897,024 | 35,451,929 | 39.52 | 37,144,351 | 41.41 | ||||||||||||||||||||||||||||||
| 2021 |
103,097 | 3,416,411 | 33.14 | 3,601,082 | 34.93 | 735,871 | 32,566,754 | 44.26 | 35,724,611 | 48.55 | ||||||||||||||||||||||||||||||
| 2022 |
66,646 | 2,183,577 | 32.76 | 2,397,454 | 35.97 | 670,135 | 29,205,798 | 43.58 | 33,456,505 | 49.93 | ||||||||||||||||||||||||||||||
| 2023 |
8,299 | 264,197 | 31.83 | 280,795 | 33.83 | 518,509 | 23,628,354 | 45.57 | 27,350,889 | 52.75 | ||||||||||||||||||||||||||||||
| 2024 |
389,353 | 13,510,054 | 34.70 | 14,305,618 | 36.74 | 461,166 | 20,657,163 | 44.79 | 23,803,798 | 51.62 | ||||||||||||||||||||||||||||||
| 2025 |
133,747 | 4,831,735 | 36.13 | 5,316,299 | 39.75 | 454,447 | 18,320,273 | 40.31 | 21,786,380 | 47.94 | ||||||||||||||||||||||||||||||
| Thereafter |
338,002 | 11,531,857 | 34.12 | 12,820,150 | 37.93 | 305,574 | 12,406,902 | 40.60 | 16,096,811 | 52.68 | ||||||||||||||||||||||||||||||
| (1) | For disclosures relating to the Company’s definition of Annualized Rental Obligations, see page 47. |
| (2) | Includes 100% of joint venture properties. Does not include residential units and hotel. |
| (3) | Does not include data for leases expiring in a particular year when leases for the same space have already been signed with replacement tenants with future commencement dates. In those cases, the data is included in the year in which the future lease expires. |
| (4) | Includes square feet expiring on the last day of the current quarter. |
| (5) | Includes 10,922 and 14,887 square feet of Sensitive Compartmented Information Facility (SCIF) space in 2016 and 2017, respectively. Excluding the SCIF space, the current and future expiring rental rates per square foot would be $39.75 and $39.77 and $44.30 and $44.72, respectively. |
42
THIRD QUARTER 2016
LEASING ACTIVITY
for the three months ended September 30, 2016
All In-Service Properties
| Total | ||||
| Vacant space available @ 7/1/2016 (sf) |
3,869,290 | |||
| Property dispositions/ properties taken out of service (sf) |
(211,110 | ) | ||
| Properties acquired vacant space (sf) |
511,789 | |||
| Properties placed in-service (sf) (1) |
52,340 | |||
| Leases expiring or terminated 7/1/2016-9/30/2016 (sf) |
1,553,284 | |||
|
|
|
|||
| Total space available for lease (sf) |
5,775,593 | |||
|
|
|
|||
| 1st generation leases (sf) |
122,885 | |||
| 2nd generation leases with new tenants (sf) |
864,280 | |||
| 2nd generation lease renewals (sf) |
313,098 | |||
|
|
|
|||
| Total space leased (sf) |
1,300,263 | |||
|
|
|
|||
| Vacant space available for lease @ 9/30/2016 (sf) |
4,475,330 | |||
|
|
|
|||
| Net (increase)/decrease in available space (sf) |
(606,040 | ) | ||
| Second generation leasing information: (2) |
||||
| Leases commencing during the period (sf) |
1,177,378 | |||
| Weighted average lease term (months) |
100 | |||
| Weighted average free rent period (days) |
129 | |||
| Total transaction costs per square foot (3) |
$ | 59.26 | ||
| Increase (decrease) in gross rents (4) |
5.95 | % | ||
| Increase (decrease) in net rents (5) |
8.44 | % | ||
| All leases 1st Generation (sf) |
All leases 2nd Generation (sf) |
Incr (decr) in 2nd gen. gross cash rents (4) |
Incr (decr) in 2nd gen. net cash rents (5) |
Total Leased (sf) (6) |
Total square feet of leases executed in the quarter (7) |
|||||||||||||||||||
| Boston |
52,340 | 339,977 | 5.15 | % | 7.90 | % | 392,317 | 240,598 | ||||||||||||||||
| New York |
44,863 | 247,392 | (11.41 | %) | (16.74 | %) | 292,255 | 169,494 | ||||||||||||||||
| San Francisco and Los Angeles |
— | 453,771 | 48.72 | % | 77.86 | % | 453,771 | 261,320 | ||||||||||||||||
| Washington, DC |
25,682 | 136,238 | (7.23 | %) | (9.52 | %) | 161,920 | 222,316 | ||||||||||||||||
|
|
|
|
|
|
|
|
|
|
|
|
|
|||||||||||||
| Total / Weighted Average |
122,885 | 1,177,378 | 5.95 | % | 8.44 | % | 1,300,263 | 893,728 | ||||||||||||||||
|
|
|
|
|
|
|
|
|
|||||||||||||||||
| (1) | Total vacant square feet of properties placed in service in Q3 2016 consist of 52,340 square feet of existing vacancy at 888 Boylston Street. |
| (2) | Second generation leases are defined as leases for space that had previously been leased by the Company. Of the 1,177,378 square feet of second generation leases that commenced in Q3 2016, leases for 906,639 square feet were signed in prior periods. |
| (3) | Total transaction costs include tenant improvements and leasing commissions and exclude free rent concessions. |
| (4) | Represents the increase/(decrease) in gross rent (base rent plus expense reimbursements) on the new vs. expired leases on the 825,356 square feet of second generation leases that had been occupied within the prior 12 months; excludes leases that management considers temporary because the tenant is not expected to occupy the space on a long-term basis (e.g., the tenant is occupying “swing space”). |
| (5) | Represents the increase/(decrease) in net rent (gross rent less operating expenses) on the new vs. expired leases on the 825,356 square feet of second generation leases that had been occupied within the prior 12 months; excludes leases that management considers temporary because the tenant is not expected to occupy the space on a long-term basis (e.g., the tenant is occupying “swing space”). |
| (6) | Represents leases for which rental revenue recognition has commenced in accordance with GAAP during the quarter. |
| (7) | Represents leases executed in the quarter for which the Company either (1) commenced rental revenue recognition in such quarter or (2) will commence rental revenue recognition in subsequent quarters, in accordance with GAAP, and includes leases at properties currently under development. The total square feet of leases executed in the current quarter and recognized in the current quarter is 287,244. |
43
THIRD QUARTER 2016
ACQUISITIONS/DISPOSITIONS
as of September 30, 2016
ACQUISITIONS
For the period from January 1, 2016 through September 30, 2016
| Anticipated | ||||||||||||||||||||||||
| Initial | Future | Total | Percentage | |||||||||||||||||||||
| Property |
Date Acquired | Square Feet | Investment | Investment | Investment | Leased | ||||||||||||||||||
| 3625-3635 Peterson Way |
April 22, 2016 | 218,366 | $ | 78,000,000 | $ | — | $ | 78,000,000 | 100 | % | ||||||||||||||
| Colorado Center (49.8% ownership interest) |
July 1, 2016 | 1,116,698 | (1) | 502,988,000 | — | (2) | 502,988,000 | 66 | % | |||||||||||||||
|
|
|
|
|
|
|
|
|
|
|
|||||||||||||||
| Total Acquisitions |
1,335,064 | $ | 580,988,000 | $ | — | $ | 580,988,000 | 71 | % | |||||||||||||||
|
|
|
|
|
|
|
|
|
|
|
|||||||||||||||
| (1) | Excludes approximately 59,000 square feet of storage space and 8,000 square feet of remeasurement upon lease expirations. |
| (2) | The venture is reviewing plans to renovate the common areas and will provide a budget upon approval. |
DISPOSITIONS
For the period from January 1, 2016 through September 30, 2016
| Gross | Net Cash | |||||||||||||||||||
| Property |
Date Disposed | Square Feet | Sales Price | Proceeds | Book Gain | |||||||||||||||
| 415 Main Street |
February 1, 2016 | 231,028 | $ | 105,360,000 | $ | 104,868,000 | $ | 60,803,000 | ||||||||||||
| Broad Run Business Park (land parcel) |
August 16, 2016 | N/A | 18,019,000 | 17,934,000 | 12,983,000 | |||||||||||||||
|
|
|
|
|
|
|
|
|
|||||||||||||
| Total Dispositions |
231,028 | $ | 123,379,000 | $ | 122,802,000 | $ | 73,786,000 | (1) | ||||||||||||
|
|
|
|
|
|
|
|
|
|||||||||||||
| (1) | Excludes approximately $6,820,000 of gain on sale of real estate recognized during the three months ended March 31, 2016 related to a previously deferred gain amount from a 2014 sale of real estate. |
44
THIRD QUARTER 2016
VALUE CREATION PIPELINE—CONSTRUCTION IN PROGRESS (1)
as of September 30, 2016
| Construction Properties |
Actual / Estimated Initial Occupancy |
Actual / Estimated Stabilization Date |
Location | # of Buildings |
Square feet |
Investment to Date (2) |
Estimated Total Investment (2) |
Total Financing (2) |
Amount Drawn at 9/30/2016 (2) |
Estimated Future Equity Requirement (2) |
Percentage Leased (3) |
Percentage Placed in service (4) |
||||||||||||||||||||||||||||||||||||
| Office and Retail |
||||||||||||||||||||||||||||||||||||||||||||||||
| 1265 Main Street (50% ownership) |
Q4 2016 | Q4 2016 | Waltham, MA | 1 | 115,000 | $ | 22,374,119 | $ | 26,090,000 | $ | — | $ | — | $ | 3,715,881 | 100 | % | — | ||||||||||||||||||||||||||||||
| Prudential Center Retail Expansion |
Q1 2016 | Q3 2017 | Boston, MA | — | 15,000 | 9,108,230 | 10,760,000 | — | — | 1,651,770 | 100 | % | 39 | % | ||||||||||||||||||||||||||||||||||
| 888 Boylston Street |
Q3 2016 | Q4 2017 | Boston, MA | 1 | 425,000 | 227,871,847 | 271,500,000 | — | — | 43,628,153 | 71 | % | 14 | % | ||||||||||||||||||||||||||||||||||
| Salesforce Tower (95% ownership) |
Q4 2017 | Q1 2019 | San Francisco, CA | 1 | 1,400,000 | 638,148,808 | 1,073,500,000 | (25,389,074 | )(5) | 2,009,206 | (5) | 462,749,472 | 59 | % | — | |||||||||||||||||||||||||||||||||
| The Hub on Causeway (50% ownership) |
Q4 2018 | Q4 2019 | Boston, MA | 1 | 385,000 | 21,936,753 | 141,870,000 | — | — | 119,933,247 | 33 | % | — | |||||||||||||||||||||||||||||||||||
| Dock72 (50% ownership) |
Q2 2018 | Q1 2020 | Brooklyn, NY | 1 | 670,000 | 29,723,774 | 204,900,000 | — | — | 175,176,226 | 33 | % | — | |||||||||||||||||||||||||||||||||||
|
|
|
|
|
|
|
|
|
|
|
|
|
|
|
|
|
|
|
|||||||||||||||||||||||||||||||
| Total Office Properties under Construction |
5 | 3,010,000 | $ | 949,163,531 | $ | 1,728,620,000 | $ | (25,389,074 | ) | $ | 2,009,206 | $ | 806,854,749 | 54 | % | 4 | % | |||||||||||||||||||||||||||||||
|
|
|
|
|
|
|
|
|
|
|
|
|
|
|
|||||||||||||||||||||||||||||||||||
| Residential |
||||||||||||||||||||||||||||||||||||||||||||||||
| Cambridge Residential / 88 Ames (274 units) |
Q1 2018 | Q1 2019 | Cambridge, MA | 1 | 164,000 | $ | 20,317,513 | $ | 140,170,000 | $ | — | $ | — | $ | 119,852,487 | N/A | — | |||||||||||||||||||||||||||||||
| Reston Signature Site (508 units) |
Q4 2017 | Q2 2020 | Reston, VA | 1 | 490,000 | 62,935,559 | (6) | 234,854,025 | (6) | — | — | 171,918,466 | N/A | — | ||||||||||||||||||||||||||||||||||
| Reston Signature Site - Retail |
— | 24,600 | — | — | — | — | — | 81 | % | — | ||||||||||||||||||||||||||||||||||||||
|
|
|
|
|
|
|
|
|
|
|
|
|
|
|
|
|
|
|
|||||||||||||||||||||||||||||||
| Total Residential Properties under Construction |
2 | 678,600 | $ | 83,253,072 | $ | 375,024,025 | $ | — | $ | — | $ | 291,770,953 | 59 | %(7) | — | |||||||||||||||||||||||||||||||||
|
|
|
|
|
|
|
|
|
|
|
|
|
|
|
|||||||||||||||||||||||||||||||||||
| Redevelopment Properties |
||||||||||||||||||||||||||||||||||||||||||||||||
| Reservoir Place North |
Q3 2017 | Q3 2017 | Waltham, MA | 1 | 73,000 | $ | 14,999,489 | $ | 24,510,000 | $ | — | $ | — | $ | 9,510,511 | — | 4 | % | ||||||||||||||||||||||||||||||
| 159 East 53rd (55% ownership) (8) |
Q2 2018 | Q4 2019 | New York, NY | — | 220,000 | 8,245,649 | 106,000,000 | — | — | 97,754,351 | — | — | ||||||||||||||||||||||||||||||||||||
|
|
|
|
|
|
|
|
|
|
|
|
|
|
|
|
|
|
|
|||||||||||||||||||||||||||||||
| Total Redevelopment Properties under Construction |
1 | 293,000 | $ | 23,245,138 | $ | 130,510,000 | $ | — | $ | — | $ | 107,264,862 | — | 3 | % | |||||||||||||||||||||||||||||||||
|
|
|
|
|
|
|
|
|
|
|
|
|
|
|
|
|
|
|
|||||||||||||||||||||||||||||||
| Total Properties Under Construction and Redevelopment |
8 | 3,981,600 | $ | 1,055,661,741 | $ | 2,234,154,025 | $ | (25,389,074 | ) | $ | 2,009,206 | $ | 1,205,890,564 | 49 | %(7) | 3 | % | |||||||||||||||||||||||||||||||
|
|
|
|
|
|
|
|
|
|
|
|
|
|
|
|||||||||||||||||||||||||||||||||||
PROJECTS FULLY PLACED IN-SERVICE DURING 2016
| Actual / Estimated Initial Occupancy |
Actual / Estimated Stabilization Date |
Location | # of Buildings |
Square feet |
Investment to Date (2) |
Estimated Total Investment (2) |
Total Financing (2) |
Amount Drawn at 9/30/2016 (2) |
Estimated Future Equity Requirement (2) |
Percentage Leased (3) |
||||||||||||||||||||||||||||
| 804 Carnegie Center |
Q2 2016 | Q2 2016 | Princeton, NJ | 1 | 130,000 | $ | 45,906,709 | $ | 47,000,000 | $ | — | $ | — | $ | 1,093,291 | 100 | % | |||||||||||||||||||||
| 601 Massachusetts Avenue |
Q3 2015 | Q1 2017 | Washington, DC | 1 | 478,883 | 299,663,325 | 339,760,000 | — | — | 40,096,675 | 90 | % | ||||||||||||||||||||||||||
| 10 CityPoint |
Q2 2016 | Q2 2016 | Waltham, MA | 1 | 241,460 | 89,681,015 | 100,400,000 | — | — | 10,718,985 | 97 | % | ||||||||||||||||||||||||||
|
|
|
|
|
|
|
|
|
|
|
|
|
|
|
|
|
|||||||||||||||||||||||
| Total Projects placed In-Service |
3 | 850,343 | $ | 435,251,049 | $ | 487,160,000 | $ | — | $ | — | $ | 51,908,951 | 94 | % | ||||||||||||||||||||||||
|
|
|
|
|
|
|
|
|
|
|
|
|
|
|
|||||||||||||||||||||||||
IN-SERVICE PROPERTIES HELD FOR REDEVELOPMENT
| Sub Market | # of Buildings |
Existing Square Feet |
Leased % | Annualized Rental Obligations Per Leased SF (9) |
Encumbered with secured debt (Y/N) |
Central Business District (CBD) or Suburban (S) |
Incremental Estimated Future SF (10) |
|||||||||||||||||||||
| North First Business Park |
San Jose CA | 5 | 190,636 | 100.0 | % | $ | 18.87 | N | S | 1,359,364 | ||||||||||||||||||
| 3625-3635 Peterson Way |
Santa Clara CA | 1 | 218,366 | 100.0 | % | 21.84 | N | S | 413,690 | |||||||||||||||||||
|
|
|
|
|
|
|
|
|
|
|
|||||||||||||||||||
| Total Properties held for Redevelopment |
6 | 409,002 | 100.0 | % | $ | 20.46 | 1,773,054 | |||||||||||||||||||||
|
|
|
|
|
|
|
|
|
|||||||||||||||||||||
| (1) | A project is classified as Construction in Progress when construction or supply contracts have been signed, physical improvements have commenced or a lease has been signed and capitalize interest has commenced. |
| (2) | Represents the Company’s share. Includes income (loss) and interest carry. |
| (3) | Represents percentage leased as of October 21, 2016, including leases with future commencement dates and excluding residential units. |
| (4) | Represents the portion of the project that no longer qualifies for capitalization of interest in accordance with GAAP. |
| (5) | Under the joint venture agreement, if the project is funded with 100% equity, the Company has agreed to fund 50% of our partner’s equity requirement, structured as preferred equity. The Company will fund approximately $25.4 million at a rate of LIBOR plus 3.0% per annum and receive priority distributions until the principal and interest are repaid. As of September 30, 2016, the Company has funded $2,009,206. |
| (6) | Includes approximately $17 million for overbuilding parking structure to support future development requirements and excludes $10 million of the purchase price for the site that is allocated to rights for future development in Reston Town Center. |
| (7) | Includes approximately 9,000 square feet of retail space from Cambridge Residential / 88 Ames residential development which is 0% leased. |
| (8) | Formerly the low-rise portion of 601 Lexington Avenue. |
| (9) | For disclosures relating to the Company’s definition of Annualized Rental Obligations, see page 47. |
| (10) | Incremental Future Square Footage is included in Approximate Developable Square Feet of Value Creation Pipeline—Owned Land Parcels on page 46. |
45
THIRD QUARTER 2016
VALUE CREATION PIPELINE
as of September 30, 2016
Owned Land Parcels
| Approximate | ||||
| Developable | ||||
| Location |
Square Feet | |||
| San Jose, CA (1) |
2,199,000 | |||
| Reston, VA |
1,160,000 | |||
| Waltham, MA |
805,000 | |||
| Springfield, VA |
800,000 | |||
| Dulles, VA (2) |
310,000 | |||
| Rockville, MD |
759,000 | |||
| Santa Clara, CA (1) |
414,000 | |||
| Gaithersburg, MD (3) |
240,000 | |||
| Washington, DC (50% ownership) |
520,000 | |||
| Marlborough, MA |
400,000 | |||
| Annapolis, MD (50% ownership) |
300,000 | |||
| Andover, MA |
110,000 | |||
|
|
|
|||
| 8,017,000 | ||||
|
|
|
|||
Land Purchase Options
| Approximate | ||||
| Developable | ||||
| Location |
Square Feet | |||
| Princeton, NJ |
1,650,000 | |||
| Boston, MA (50% ownership) |
1,415,000 | |||
| Boston, MA |
1,300,000 | |||
| Cambridge, MA |
940,000 | |||
| Brooklyn, NY (50% ownership) |
600,000 | |||
| San Francisco, CA |
TBD | |||
|
|
|
|||
| 5,905,000 | ||||
|
|
|
|||
| (1) | Excludes the existing square footage related to in-service properties being held for future re-development included on page 45. |
| (2) | On August 16, 2016, the Company completed the sale of a parcel of land within its Broad Run Business Park property located in Loudoun County, Virginia for a gross sale price of approximately $18.0 million. Net cash proceeds totaled approximately $17.9 million, resulting in a gain on sale of real estate totaling approximately $13.0 million. |
| (3) | On September 27, 2016, the Company executed a letter of intent for the sale of the remaining parcel of land at its Washingtonian North property located in Gaithersburg, Maryland. The letter of intent caused the Company to reevaluate its strategy for the land and based on a shorter than expected hold period, the Company reduced the carrying value of the land to the estimated net sales price and recognized an impairment loss of approximately $1.8 million during the three months ended September 30, 2016. |
46
THIRD QUARTER 2016
DEFINITIONS
This section contains definitions of certain non-GAAP financial measures and other terms that we use in this supplemental package and, where applicable, the reasons why management believes these non-GAAP financial measures provide useful information to investors about the Company’s financial condition and results of operations. Additional detail can be found in the Company’s most recent annual report on Form 10-K and quarterly report on Form 10-Q, as well as other documents filed with or furnished to the SEC from time to time.
The Company also presents certain of these measures (1) on a “Combined” basis, which is defined as the consolidated amount, plus the Company’s share of the measure from its unconsolidated joint ventures (calculated based upon the Company’s percentage ownership interest), and (2) showing “BXP’s Share” of the Combined amount, which is defined as the Combined amount, minus the Company’s partners’ share of the amount from the Company’s consolidated joint ventures (calculated based upon the partners’ percentage ownership interests). Management believes that the “Combined” measures provide useful information to investors regarding the Company’s financial condition and/or results of operations because they include the Company’s share of the applicable amount from unconsolidated joint ventures and, for “BXP’s Share” of the Combined amount, exclude the Company’s partners’ share from consolidated joint ventures, in each case presented on the same basis. The Company has several significant joint ventures and presenting various financial measures in this manner can help investors better understand the Company’s financial condition and/or results of operations after taking into account its economic interest in these joint ventures. The Company cautions investors that the ownership percentages used in calculating “Combined” amounts and “BXP’s Share” of any Combined amounts may not completely and accurately depict all of the legal and economic implications of holding an interest in a consolidated or unconsolidated joint venture. For example, in addition to partners’ interests in profits and capital, partnership agreements vary in the allocation of rights regarding decision making (both routine and major decisions), distributions, transferability of interests, liquidations, etc. As a result, presentations of measures on a Combined basis and showing BXP’s Share of the Combined amount should be considered with and as a supplement to the Company’s financial information presented in accordance with GAAP.
Annualized Rental Obligations
Annualized Rental Obligations is defined as rental obligations at the end of the reporting period, including contractual base rents (but excluding percentage rent) and budgeted reimbursements from tenants under existing leases, multiplied by twelve (12). These annualized amounts exclude rent abatements.
Average Economic Occupancy
Average Economic Occupancy is defined as total possible revenue less vacancy loss as a percentage of total possible revenue. Total possible revenue is determined by valuing average occupied units at contract rates and average vacant units at Market Rents. Vacancy loss is determined by valuing vacant units at current Market Rents. By measuring vacant units at their Market Rents, Average Economic Occupancy takes into account the fact that units of different sizes and locations within a residential property have different economic impacts on a residential property’s total possible gross revenue.
Average Monthly Rental Rates
Average Rental Rates are calculated by the Company as rental revenue in accordance with GAAP, divided by the weighted monthly average number of occupied units.
Average Physical Occupancy
Average Physical Occupancy is defined as the average number of occupied units divided by the total number of units, expressed as a percentage.
Debt to Market Capitalization Ratio
Consolidated Debt to Consolidated Market Capitalization Ratio is defined as consolidated debt as a percentage of the market value of the Company’s outstanding equity securities plus the Company’s consolidated debt, and it is a measure of leverage commonly used by analysts in the REIT sector. Consolidated Market Capitalization is the sum of (A) the Company’s consolidated debt plus (B) the market value of the Company’s outstanding equity securities calculated using the closing price per share of common stock of the Company, as reported by the New York Stock Exchange, multiplied by the sum of (1) outstanding shares of common stock of the Company, (2) outstanding common units of limited partnership interest in Boston Properties Limited Partnership (excluding common units held by the Company), (3) common units issuable upon conversion of all outstanding LTIP Units, assuming all conditions have been met for the conversion of the LTIP Units, (4) on and after February 6, 2015, which was the end of the performance period for 2012 OPP Units and thus the date earned, common units issuable upon conversion of 2012 OPP Units that were issued in the form of LTIP Units and (5) on and after February 4, 2016, which was the end of the performance period for 2013 MYLTIP Units and thus the date earned, common units issuable upon conversion of 2013 MYLTIP Units that were issued in the form of LTIP Units plus (C) outstanding shares of 5.25% Series B Cumulative Redeemable Preferred Stock multiplied by their fixed liquidation preference of $2,500 per share. The calculation of Consolidated Market Capitalization does not include LTIP Units issued in the form of MYLTIP Awards unless and until certain performance thresholds are achieved and they are earned. Because their three-year periods have not yet ended, 2014, 2015 and 2016 MYLTIP Units are not included. The Company also presents BXP’s Share of Combined Market Capitalization, which is calculated in a similar manner, except that BXP’s Share of Combined Debt is utilized instead of the Company’s consolidated debt in both the numerator and the denominator. The Company presents these ratios because its degree of leverage could affect its ability to obtain additional financing for working capital, capital expenditures, acquisitions, development or other general corporate purposes and because different investors and lenders consider one or both of these ratios. Investors should understand that these ratios, are in part, a function of the market price of the common stock of the Company, and as such will fluctuate with changes in such price and does not necessarily reflect the Company’s capacity to incur additional debt to finance its activities or its ability to manage its existing debt obligations. However, for a company like Boston Properties, Inc., whose assets are primarily income-producing real estate, these ratios may provide investors with an alternate indication of leverage, so long they are evaluated along with the ratio of indebtedness to other measures of asset value used by financial analysts and other financial ratios, as well as the various components of the Company’s outstanding indebtedness.
Funds Available for Distribution (FAD) and FAD Payout Ratio
In addition to FFO, the Company presents funds available for distribution to common shareholders and common unitholders (FAD), which is a non-GAAP financial measure that is calculated by (1) adding to FFO lease transaction costs that qualify as rent inducements, non-real estate depreciation, non-cash losses from early extinguishments of debt, stock-based compensation expense, partners’ share of consolidated and unconsolidated joint venture 2nd generation tenant improvement and leasing commissions (included in the period in which the lease commences) and unearned portion of capitalized fees, (2) eliminating the effects of straight-line rent, straight-line ground rent expense adjustment, fair value interest adjustment and fair value lease revenue, and (3) subtracting maintenance capital expenditures, hotel improvements, equipment upgrades and replacements, 2nd generation tenant improvement and leasing commissions (included in the period in which the lease commences), non-cash termination income adjustment (fair value lease amounts) and impairments of non-depreciable real estate. The Company believes that the presentation of FAD provides useful information to investors regarding the Company’s results of operations because FAD provides supplemental information regarding the Company’s operating performance that would not otherwise be available and may be useful to investors in assessing the Company’s operating performance. Additionally, although FAD is not intended to be a liquidity measure, as it does not make adjustments to reflect changes in working capital or the actual timing of the payment of income or expense items that are accrued in the period, the Company believes that FAD may provide investors with useful supplemental information regarding the Company’s ability to generate cash from its operating performance and the impact of the Company’s operating performance on its ability to make distributions to its stockholders. Furthermore, the Company believes that FAD is frequently used by analysts, investors and other interested parties in the evaluation of its performance as a REIT and, as a result, by presenting FAD the Company is assisting these parties in their evaluation. FAD should not be considered as a substitute for net income (loss) attributable to Boston Properties, Inc.’s common shareholders determined in accordance with GAAP or any other GAAP financial measures and should only be considered together with and as a supplement to the Company’s financial information prepared in accordance with GAAP.
FAD Payout Ratio is defined as distributions to common shareholders and unitholders (excluding any special distributions) divided by FAD.
47
THIRD QUARTER 2016
DEFINITIONS (continued)
Funds from Operations (FFO)
Pursuant to the revised definition of Funds from Operations adopted by the Board of Governors of the National Association of Real Estate Investment Trusts (“NAREIT”), the Company calculates Funds from Operations, or “FFO,” by adjusting net income (loss) attributable to Boston Properties, Inc. common shareholders (computed in accordance with GAAP) for gains (or losses) from sales of properties, impairment losses on depreciable real estate consolidated on the Company’s balance sheet, impairment losses on its investments in unconsolidated joint ventures driven by a measurable decrease in the fair value of depreciable real estate held by the unconsolidated joint ventures, real estate-related depreciation and amortization, and the Company’s share of income (loss) from unconsolidated partnerships and joint ventures. FFO is a non-GAAP financial measure, but the Company believes the presentation of FFO, combined with the presentation of required GAAP financial measures, has improved the understanding of operating results of REITs among the investing public and has helped make comparisons of REIT operating results more meaningful. Management generally considers FFO and FFO per share to be useful measures for understanding and comparing the Company’s operating results because, by excluding gains and losses related to sales of previously depreciated operating real estate assets, impairment losses and real estate asset depreciation and amortization (which can differ across owners of similar assets in similar condition based on historical cost accounting and useful life estimates), FFO and FFO per share can help investors compare the operating performance of a company’s real estate across reporting periods and to the operating performance of other companies.
FFO presented by the Company may not be comparable to FFO reported by other REITs or real estate companies that do not define the term in accordance with the current NAREIT definition or that interpret the current NAREIT definition differently. The Company believes that in order to facilitate a clear understanding of its operating results, FFO should be examined in conjunction with net income attributable to Boston Properties, Inc. common shareholders as presented in the Company’s consolidated financial statements. FFO should not be considered as a substitute for net income attributable to Boston Properties, Inc. common shareholders determined in accordance with GAAP or any other GAAP financial measures and should only be considered together with and as a supplement to the Company’s financial information prepared in accordance with GAAP.
In-Service Properties
The Company treats a property as being “in-service” upon the earlier of (1) lease-up and completion of tenant improvements or (2) one year after cessation of major construction activity under GAAP. The determination as to when an entire property should be treated as “in-service” involves a degree of judgment and is made by management based on the relevant facts and circumstances of the particular property. For portfolio operating and occupancy statistics, the Company specifies a single date for treating a property as “in-service,” which is generally later than the date the property is partially placed in-service under GAAP. Under GAAP, a property may be placed in-service in stages as construction is completed and the property is held available for occupancy. In accordance with GAAP, when a portion of a property has been substantially completed and either occupied or held available for occupancy, the Company ceases capitalizing costs on that portion, even though it may not treat the property as being “in-service,” and continues to capitalize only those costs associated with the portion still under construction. In-service properties include properties held by the Company’s unconsolidated joint ventures. In-service Office properties exclude hotel and residential properties.
Market Rents
Market Rents used by the Company in calculating Average Economic Occupancy are based on the current market rates set by the managers of the Company’s residential properties based on their experience in renting their residential property’s units and publicly available market data. Trends in market rents for a region as reported by others could vary. Market Rents for a period are based on the average Market Rents during that period and do not reflect any impact for cash concessions.
Net Operating Income (NOI)
Net operating income (NOI) is a non-GAAP financial measure equal to net income attributable to Boston Properties, Inc. common shareholders, the most directly comparable GAAP financial measure, plus (1) preferred dividends, net income attributable to noncontrolling interests, corporate general and administrative expense, transaction costs, impairment loss, depreciation and amortization, interest expense, losses from early extinguishments of debt and losses from interest rate contracts, less (2) gains on sales of real estate, development and management services income, income from unconsolidated joint ventures, interest and other income and gains (losses) from investments in securities. In some cases the Company also presents (1) NOI – cash basis, which is NOI after eliminating the effects of straight-lining of rent, fair value lease revenue and lease transaction costs that qualify as rent inducements in accordance with GAAP and (2) NOI and NOI – cash basis, in each case excluding lease termination fees.
The Company uses these measures internally as performance measures and believes they provide useful information to investors regarding the Company’s results of operations and financial condition because, when compared across periods, they reflect the impact on operations from trends in occupancy rates, rental rates, operating costs and acquisition and development activity on an unleveraged basis, providing perspective not immediately apparent from net income. For example, interest expense is not necessarily linked to the operating performance of a real estate asset and is often incurred at the corporate level as opposed to the property level. Similarly, interest expense may be incurred at the property level even though the financing proceeds may be used at the corporate level (e.g., other investment activity). In addition, depreciation and amortization, because of historical cost accounting and useful life estimates, may distort operating performance measures at the property level. Presenting NOI – cash basis allows investors to compare NOI performance across periods without taking into account the effect of certain non-cash rental revenues. Similar to depreciation and amortization, fair value lease revenues, because of historical cost accounting, may distort operating performance measures at the property level. Additionally, presenting NOI excluding the impact of the straight-lining of rent provides investors with an alternative view of operating performance at the property level that more closely reflects net cash generated at the property level on an unleveraged basis. Presenting NOI measures that exclude lease termination fees provides investors with additional information regarding operating performance at a property level that allow them to compare operating performance between periods without taking into account lease termination fees, which can distort the results for any given period because they generally represent multiple months or years of a tenant’s rental obligations that are paid in a lump sum in connection with a negotiated early termination of the tenant’s lease and are not reflective of the core ongoing operating performance of the Company’s properties.
Rental Obligations
Rental Obligations is defined as the contractual base rents (but excluding percentage rent) and budgeted reimbursements from tenants under existing leases. These amounts exclude rent abatements.
Same Properties
In the Company’s analysis of NOI, particularly to make comparisons of NOI between periods meaningful, it is important to provide information for properties that were in-service and owned by the Company throughout each period presented. The Company refers to properties acquired or placed in-service prior to the beginning of the earliest period presented and owned by the Company through the end of the latest period presented as “Same Properties.” “Same Properties” therefore exclude properties placed in-service, acquired, repositioned, or in development or redevelopment after the beginning of the earliest period presented or disposed of prior to the end of the latest period presented. Accordingly, it takes at least one year and one quarter after a property is acquired or treated as “in-service” for that property to be included in “Same Properties.” Pages 27-29 indicate by footnote the “In-Service Properties” that are not included in “Same Properties.”
48
Exhibit 99.2


800 Boylston Street
Boston, MA 02199
AT THE COMPANY
Michael LaBelle
Executive Vice President,
Chief Financial Officer and Treasurer
(617) 236-3352
Arista Joyner
Investor Relations Manager
(617) 236-3343
BOSTON PROPERTIES ANNOUNCES
THIRD QUARTER 2016 RESULTS
BOSTON, MA, October 25, 2016 - Boston Properties, Inc. (NYSE: BXP), a real estate investment trust, reported results today for the third quarter ended September 30, 2016.
Net income attributable to common shareholders was $76.8 million for the quarter ended September 30, 2016, compared to $184.1 million for the quarter ended September 30, 2015. Net income attributable to common shareholders per share (EPS) for the quarter ended September 30, 2016 was $0.50 basic and $0.50 on a diluted basis. This compares to EPS for the quarter ended September 30, 2015 of $1.20 basic and $1.20 on a diluted basis. Net income attributable to common shareholders for the quarter ended September 30, 2016 includes gains on sales of real estate aggregating approximately $13.0 million, or $0.08 per share basic and $0.08 per share on a diluted basis, compared to $199.5 million, or $0.58 per share basic and $0.58 per share on a diluted basis, for the quarter ended September 30, 2015. In addition, net income attributable to common shareholders for the quarter ended September 30, 2016 includes accelerated depreciation expense of approximately $50.8 million, or $(0.17) per share basic and $(0.17) per share on a diluted basis, related to the redevelopment of the Company’s 601 Lexington Avenue property. The weighted-average number of basic and diluted shares outstanding totaled approximately 153,754,000 and 154,136,000, respectively, for the quarter ended September 30, 2016 and 153,595,000 and 153,786,000, respectively, for the quarter ended September 30, 2015.
–more–
Funds from Operations (FFO) for the quarter ended September 30, 2016 were $219.6 million, or $1.43 per share basic and $1.42 per share diluted. This compares to FFO for the quarter ended September 30, 2015 of $217.3 million, or $1.41 per share basic and $1.41 per share diluted.
The Company’s reported FFO of $1.42 per share diluted was greater than the mid-point of the guidance previously provided of $1.40-$1.42 per share diluted primarily due to better than expected portfolio operations of $0.02 per share, partially offset by a $(0.01) per share impairment loss related to the anticipated sale of the remaining parcel of land at the Company’s Washingtonian North property located in Gaithersburg, Maryland.
The reported results are unaudited and there can be no assurance that these reported results will not vary from the final information for the quarter ended September 30, 2016. In the opinion of management, all adjustments considered necessary for a fair presentation of these reported results have been made.
As of September 30, 2016, the Company’s portfolio consisted of 174 properties aggregating approximately 47.7 million square feet, including eight properties under construction/redevelopment totaling approximately 4.0 million square feet. The overall percentage of leased space for the 163 properties in service (excluding the Company’s two residential properties and hotel) as of September 30, 2016 was 89.6%.
Significant events during the third quarter included:
| • | On July 1, 2016, the Company entered the Los Angeles market through its acquisition of a 49.8% interest in an existing joint venture that owns and operates Colorado Center located in Santa Monica, California for a gross purchase price of approximately $511.1 million, or approximately $503.6 million in cash net of credits for free rent, unfunded leasing costs and other adjustments. Colorado Center is a six-building office complex that sits on a 15-acre site and contains an aggregate of approximately 1,184,000 net rentable square feet with an underground parking garage for 3,100 vehicles. The property is 66% leased. |
| • | On August 16, 2016, the Company completed the sale of a parcel of land within its Broad Run Business Park property located in Loudoun County, Virginia for a gross sale price of approximately $18.0 million. Net cash proceeds totaled approximately $17.9 million, resulting in a gain on sale of real estate totaling approximately $13.0 million. |
| • | On August 17, 2016, the Company’s Operating Partnership completed a public offering of $1.0 billion in aggregate principal amount of its 2.750% senior unsecured notes due 2026. The notes were priced at 99.271% of the principal amount to yield an effective rate, including financing fees and the impact of the settlement of certain forward-starting interest rate swap contracts, of approximately 3.495% to maturity. The notes will mature on October 1, 2026, unless earlier redeemed. The aggregate net proceeds from the offering were approximately $984.7 million after deducting underwriting discounts and transaction expenses. |
–more–
| • | On August 17, 2016, in conjunction with the Company’s Operating Partnership’s offering of senior unsecured notes, the Company terminated forward-starting interest rate swap contracts which fixed the ten-year swap rate at a weighted-average rate of approximately 2.423% per annum on notional amounts aggregating $550.0 million. The Company cash-settled the contracts and made cash payments to the counterparties aggregating approximately $49.3 million. The Company recognized approximately $0.1 million of losses on interest rate contracts during the three months ended September 30, 2016 related to the partial ineffectiveness of the interest rate contracts. The Company will reclassify into earnings over the ten-year term of the 2.750% senior unsecured notes due 2026 as an increase to interest expense approximately $49.2 million (or approximately $4.9 million per year) of the amounts recorded on the consolidated balance sheets within accumulated other comprehensive loss, which represents the effective portion of the applicable interest rate contracts. |
| • | On August 19, 2016, the consolidated entity in which the Company has a 55% interest and that owns 601 Lexington Avenue located in New York City commenced the redevelopment of the six-story low-rise office and retail building component of the complex. The redeveloped portion of the low-rise building will contain approximately 195,000 net rentable square feet of Class A office space and approximately 25,000 net rentable square feet of retail space. The Company recorded approximately $50.8 million of accelerated depreciation expense for the portion of the complex to be demolished. |
| • | On September 1, 2016, the Company used a portion of the net proceeds from its Operating Partnership’s offering of senior unsecured notes and available cash to repay the mortgage loan collateralized by its 599 Lexington Avenue property located in New York City totaling $750.0 million. The mortgage loan bore interest at a fixed rate of 5.57% per annum (5.41% per annum GAAP interest rate) and was scheduled to mature on March 1, 2017. There was no prepayment penalty. The Company recognized a gain from early extinguishment of debt totaling approximately $0.4 million consisting of the acceleration of the remaining balance related to the effective portion of a previous interest rate hedging program included within accumulated other comprehensive loss, offset by the write-off of unamortized deferred financing costs. |
| • | On September 1, 2016, the Company used a portion of the net proceeds from its Operating Partnership’s offering of senior unsecured notes and available cash to repay the mortgage loan collateralized by its Embarcadero Center Four property located in San Francisco, California totaling approximately $344.8 million. The mortgage loan bore interest at a fixed rate of 6.10% per annum (7.02% per annum GAAP interest rate) and was scheduled to mature on December 1, 2016. There was no prepayment penalty. The Company recognized a loss from early extinguishment of debt totaling approximately $0.7 million consisting of the write-off of unamortized deferred financing costs and the acceleration of the remaining balance related to the effective portion of a previous interest rate hedging program included within accumulated other comprehensive loss. |
| • | On September 16, 2016, the Company partially placed in-service 888 Boylston Street, a Class A office project with approximately 425,000 net rentable square feet located in Boston, Massachusetts. The property is 71% leased. |
–more–
| • | On September 27, 2016, the Company executed a letter of intent for the sale of the remaining parcel of land at its Washingtonian North property located in Gaithersburg, Maryland. The letter of intent caused the Company to reevaluate its strategy for the land and based on a shorter than expected hold period, the Company reduced the carrying value of the land to the estimated net sales price and recognized an impairment loss of approximately $1.8 million during the three months ended September 30, 2016. |
Transactions completed subsequent to September 30, 2016:
| • | On October 1, 2016, a joint venture in which the Company has a 50% interest completed and fully placed in-service 1265 Main Street, a Class A office project with approximately 115,000 net rentable feet located in Waltham, Massachusetts. The property is 100% leased. |
| • | On October 20, 2016, the Company and its partner in the unconsolidated joint venture that owns Metropolitan Square located in Washington, DC, completed the sale of an 80% interest in the joint venture for a gross sale price of approximately $288.1 million, including the assumption by the buyer of its pro rata share of the mortgage loan collateralized by the property totaling approximately $133.4 million and certain unfunded leasing costs totaling approximately $5.7 million. Prior to the sale, the Company owned a 51% interest and its partner owned a 49% interest in the joint venture. Following the sale, the Company continues to own a 20% interest in the joint venture with the buyer owning the remaining 80%. Metropolitan Square is an approximately 607,000 net rentable square foot Class A office property. |
EPS and FFO per Share Guidance:
The Company’s guidance for the fourth quarter, full year 2016 and full year 2017 for EPS (diluted) and FFO per share (diluted) is set forth and reconciled below. Except as described below, the estimates reflect management’s view of current and future market conditions, including assumptions with respect to rental rates, occupancy levels and the earnings impact of the events referenced in this release and otherwise referenced during the conference call referred to below. The estimates do not include possible future gains or losses or the impact on operating results from other possible future property acquisitions or dispositions, other possible capital markets activity or possible future impairment charges. EPS estimates may be subject to fluctuations as a result of several factors, including changes in the recognition of depreciation and amortization expense and any gains or losses associated with disposition activity. The Company is not able to assess at this time the potential impact of these factors on projected EPS. By definition, FFO does not include real estate-related depreciation and amortization, impairment losses on depreciable real estate or gains or losses associated with disposition activities. There can be no assurance that the Company’s actual results will not differ materially from the estimates set forth below.
As shown below, the Company has updated its projected EPS (diluted) for the full year 2016 to $2.98 - $3.00 per share from $3.04 - $3.11 per share. This is a decrease of approximately $0.09 per share at the mid-point of the Company’s guidance consisting of $0.19 per share of greater than budgeted depreciation expense primarily due to the redevelopment of the low-rise portion of 601 Lexington Avenue that commenced during the third quarter of 2016, partially offset by $0.08 per share from the gain on sale of a land parcel
–more–
during the third quarter of 2016 and $0.03 per share of reduced interest expense resulting from refinancing activity during the third quarter of 2016. In addition, the Company has updated its projected guidance for FFO per share (diluted) for the full year 2016 to $5.97 - $5.99 per share from $5.92 - $5.99 per share. This is an increase of approximately $0.03 per share at the mid-point of the Company’s guidance primarily consisting of $0.03 per share due to higher portfolio performance.
| Fourth Quarter 2016 | Full Year 2016 | |||||||||||||||||||
| Low | High | Low | -High | |||||||||||||||||
| Projected EPS (diluted) |
$ | 0.64 | - | $ | 0.66 | $ | 2.98 | - | $ | 3.00 | ||||||||||
| Add: |
||||||||||||||||||||
| Projected Company Share of Real Estate Depreciation and Amortization |
0.85 | - | 0.85 | 3.46 | - | 3.46 | ||||||||||||||
| Less: |
||||||||||||||||||||
| Projected Company Share of Gains on Sales of Real Estate |
— | - | — | 0.47 | - | 0.47 | ||||||||||||||
|
|
|
|
|
|
|
|
|
|||||||||||||
| Projected FFO per Share (diluted) |
$ | 1.49 | - | $ | 1.51 | $ | 5.97 | - | $ | 5.99 | ||||||||||
|
|
|
|
|
|
|
|
|
|||||||||||||
The Company’s guidance for the full year 2017 for EPS (diluted) and FFO per share (diluted) is set forth and reconciled below. In addition, the estimates for the full year 2017 when compared to the full year 2016 include, among other assumptions, (1) an increase in the Company’s share of Combined Same Property NOI of 2.0% - 3.5% resulting in an incremental $0.23 per share at the mid-point, (2) an incremental contribution of $0.14 per share at the mid-point from the Company’s development deliveries offset by the impact of removing properties from service for redevelopment and a full-year contribution from 2016 acquisitions, (3) interest expense savings of $0.12 per share at the mid-point due to 2016 refinancing activities and (4) an increase in development and management service income of $0.01 per share. These items are offset by (1) a reduction in Gains on Sales of Real Estate of $0.47 per share with no sales assumed in 2017, (2) a decrease in lease termination fees of approximately $0.31 per share and (3) increased general and administrative expenses of $0.03 per share at the mid-point.
| Full Year 2017 | ||||||||||
| Low | High | |||||||||
| Projected EPS (diluted) |
$ | 2.58 | - | $ | 2.76 | |||||
| Add: |
||||||||||
| Projected Company Share of Real Estate Depreciation and Amortization |
3.47 | - | 3.47 | |||||||
| Less: |
||||||||||
| Projected Company Share of Gains on Sales of Real Estate |
— | - | — | |||||||
|
|
|
|
|
|||||||
| Projected FFO per Share (diluted) |
$ | 6.05 | - | $ | 6.23 | |||||
|
|
|
|
|
|||||||
Boston Properties will host a conference call on Wednesday, October 26, 2016 at 10:00 AM Eastern Time, open to the general public, to discuss the third quarter 2016 results, the fourth quarter 2016, full fiscal year 2016 and full fiscal year 2017 projections and related assumptions, and other related matters that may be of interest to investors. The number to call for this interactive teleconference is (877) 706-4503 (Domestic) or (281) 913-8731 (International) and entering the passcode 23629459. A replay of the conference call will be available through November 11, 2016, by dialing (855) 859-2056 (Domestic) or (404) 537-3406 (International) and entering the passcode 23629459. There will also be a live audio webcast of the call which may be accessed on the Company’s website at www.bostonproperties.com in the Investor Relations section. Shortly after the call a replay of the webcast will be available in the Investor Relations section of the Company’s website and archived for up to twelve months following the call.
–more–
Additionally, a copy of Boston Properties’ third quarter 2016 “Supplemental Operating and Financial Data” and this press release are available in the Investor Relations section of the Company’s website at www.bostonproperties.com.
Boston Properties is a fully integrated, self-administered and self-managed real estate investment trust that develops, redevelops, acquires, manages, operates and owns a diverse portfolio of primarily Class A office space, five retail properties, four residential properties (including two properties under construction) and one hotel. The Company is one of the largest owners and developers of Class A office properties in the United States, concentrated in five markets - Boston, Los Angeles, New York, San Francisco and Washington, DC.
This press release contains forward-looking statements within the meaning of the Federal securities laws. You can identify these statements by our use of the words “assumes,” “believes,” “estimates,” “expects,” “guidance,” “intends,” “plans,” “projects” and similar expressions that do not relate to historical matters. You should exercise caution in interpreting and relying on forward-looking statements because they involve known and unknown risks, uncertainties and other factors which are, in some cases, beyond Boston Properties’ control and could materially affect actual results, performance or achievements. These factors include, without limitation, the Company’s ability to enter into new leases or renew leases on favorable terms, dependence on tenants’ financial condition, the uncertainties of real estate development, acquisition and disposition activity, the ability to effectively integrate acquisitions, the uncertainties of investing in new markets, the costs and availability of financing, the effectiveness of our interest rate hedging contracts, the ability of our joint venture partners to satisfy their obligations, the effects of local, national and international economic and market conditions, the effects of acquisitions, dispositions and possible impairment charges on our operating results, the impact of newly adopted accounting principles on the Company’s accounting policies and on period-to-period comparisons of financial results, regulatory changes and other risks and uncertainties detailed from time to time in the Company’s filings with the Securities and Exchange Commission. Boston Properties does not undertake a duty to update or revise any forward-looking statement, including its guidance for the fourth quarter 2016, full fiscal year 2016 and full fiscal year 2017, whether as a result of new information, future events or otherwise.
Financial tables follow.
–more–
BOSTON PROPERTIES, INC.
CONSOLIDATED BALANCE SHEETS
(Unaudited)
| September 30, 2016 | December 31, 2015 | |||||||
| (in thousands, except for share and par value amounts) |
||||||||
| ASSETS | ||||||||
| Real estate, at cost |
$ | 18,704,856 | $ | 18,465,405 | ||||
| Construction in progress |
954,013 | 763,935 | ||||||
| Land held for future development |
243,887 | 252,195 | ||||||
| Less: accumulated depreciation |
(4,113,553 | ) | (3,925,894 | ) | ||||
|
|
|
|
|
|||||
| Total real estate |
15,789,203 | 15,555,641 | ||||||
| Cash and cash equivalents |
419,323 | 723,718 | ||||||
| Cash held in escrows |
63,980 | 73,790 | ||||||
| Investments in securities |
23,022 | 20,380 | ||||||
| Tenant and other receivables, net |
76,258 | 97,865 | ||||||
| Accrued rental income, net |
785,569 | 754,883 | ||||||
| Deferred charges, net |
680,192 | 704,867 | ||||||
| Prepaid expenses and other assets |
176,693 | 185,118 | ||||||
| Investments in unconsolidated joint ventures |
775,659 | 235,224 | ||||||
|
|
|
|
|
|||||
| Total assets |
$ | 18,789,899 | $ | 18,351,486 | ||||
|
|
|
|
|
|||||
| LIABILITIES AND EQUITY | ||||||||
| Liabilities: |
||||||||
| Mortgage notes payable, net |
$ | 2,077,707 | $ | 3,435,242 | ||||
| Unsecured senior notes, net |
7,243,767 | 5,264,819 | ||||||
| Unsecured line of credit |
— | — | ||||||
| Mezzanine notes payable |
307,448 | 308,482 | ||||||
| Outside members’ notes payable |
180,000 | 180,000 | ||||||
| Accounts payable and accrued expenses |
312,979 | 274,709 | ||||||
| Dividends and distributions payable |
113,038 | 327,320 | ||||||
| Accrued interest payable |
234,628 | 190,386 | ||||||
| Other liabilities |
461,079 | 483,601 | ||||||
|
|
|
|
|
|||||
| Total liabilities |
10,930,646 | 10,464,559 | ||||||
|
|
|
|
|
|||||
| Commitments and contingencies |
— | — | ||||||
|
|
|
|
|
|||||
| Equity: |
||||||||
| Stockholders’ equity attributable to Boston Properties, Inc.: |
||||||||
| Excess stock, $0.01 par value, 150,000,000 shares authorized, none issued or outstanding |
— | — | ||||||
| Preferred stock, $0.01 par value, 50,000,000 shares authorized; 5.25% Series B cumulative redeemable preferred stock, $0.01 par value, liquidation preference $2,500 per share, 92,000 shares authorized, 80,000 shares issued and outstanding at September 30, 2016 and December 31, 2015 |
200,000 | 200,000 | ||||||
| Common stock, $0.01 par value, 250,000,000 shares authorized, 153,851,912 and 153,658,866 issued and 153,773,012 and 153,579,966 outstanding at September 30, 2016 and December 31, 2015, respectively |
1,538 | 1,536 | ||||||
| Additional paid-in capital |
6,326,580 | 6,305,687 | ||||||
| Dividends in excess of earnings |
(725,522 | ) | (780,952 | ) | ||||
| Treasury common stock at cost, 78,900 shares at September 30, 2016 and December 31, 2015 |
(2,722 | ) | (2,722 | ) | ||||
| Accumulated other comprehensive loss |
(73,943 | ) | (14,114 | ) | ||||
|
|
|
|
|
|||||
| Total stockholders’ equity attributable to Boston Properties, Inc. |
5,725,931 | 5,709,435 | ||||||
| Noncontrolling interests: |
||||||||
| Common units of the Operating Partnership |
608,280 | 603,092 | ||||||
| Property partnerships |
1,525,042 | 1,574,400 | ||||||
|
|
|
|
|
|||||
| Total equity |
7,859,253 | 7,886,927 | ||||||
|
|
|
|
|
|||||
| Total liabilities and equity |
$ | 18,789,899 | $ | 18,351,486 | ||||
|
|
|
|
|
|||||
–more–
BOSTON PROPERTIES, INC.
CONSOLIDATED STATEMENTS OF OPERATIONS
(Unaudited)
| Three months ended September 30, |
Nine months ended September 30, |
|||||||||||||||
| 2016 | 2015 | 2016 | 2015 | |||||||||||||
| (in thousands, except for per share amounts) | ||||||||||||||||
| Revenue |
||||||||||||||||
| Rental |
||||||||||||||||
| Base rent |
$ | 489,312 | $ | 494,300 | $ | 1,518,826 | $ | 1,471,591 | ||||||||
| Recoveries from tenants |
92,560 | 91,544 | 267,852 | 266,932 | ||||||||||||
| Parking and other |
24,638 | 25,509 | 75,576 | 76,849 | ||||||||||||
|
|
|
|
|
|
|
|
|
|||||||||
| Total rental revenue |
606,510 | 611,353 | 1,862,254 | 1,815,372 | ||||||||||||
| Hotel revenue |
12,354 | 12,619 | 33,919 | 35,107 | ||||||||||||
| Development and management services |
6,364 | 5,912 | 18,586 | 16,102 | ||||||||||||
|
|
|
|
|
|
|
|
|
|||||||||
| Total revenue |
625,228 | 629,884 | 1,914,759 | 1,866,581 | ||||||||||||
|
|
|
|
|
|
|
|
|
|||||||||
| Expenses |
||||||||||||||||
| Operating |
||||||||||||||||
| Rental |
228,560 | 219,796 | 665,670 | 655,610 | ||||||||||||
| Hotel |
8,118 | 8,125 | 23,730 | 24,196 | ||||||||||||
| General and administrative |
25,165 | 20,944 | 79,936 | 72,019 | ||||||||||||
| Transaction costs |
249 | 254 | 1,187 | 789 | ||||||||||||
| Impairment loss |
1,783 | — | 1,783 | — | ||||||||||||
| Depreciation and amortization |
203,748 | 153,015 | 516,371 | 475,082 | ||||||||||||
|
|
|
|
|
|
|
|
|
|||||||||
| Total expenses |
467,623 | 402,134 | 1,288,677 | 1,227,696 | ||||||||||||
|
|
|
|
|
|
|
|
|
|||||||||
| Operating income |
157,605 | 227,750 | 626,082 | 638,885 | ||||||||||||
| Other income (expense) |
||||||||||||||||
| Income from unconsolidated joint ventures |
1,464 | 2,647 | 5,489 | 20,559 | ||||||||||||
| Interest and other income |
3,628 | 3,637 | 6,657 | 6,337 | ||||||||||||
| Gains (losses) from investments in securities |
976 | (1,515 | ) | 1,713 | (1,146 | ) | ||||||||||
| Interest expense |
(104,641 | ) | (108,727 | ) | (314,953 | ) | (326,018 | ) | ||||||||
| Losses from early extinguishments of debt |
(371 | ) | — | (371 | ) | — | ||||||||||
| Losses from interest rate contracts |
(140 | ) | — | (140 | ) | — | ||||||||||
|
|
|
|
|
|
|
|
|
|||||||||
| Income before gains on sales of real estate |
58,521 | 123,792 | 324,477 | 338,617 | ||||||||||||
| Gains on sales of real estate |
12,983 | 199,479 | 80,606 | 294,563 | ||||||||||||
|
|
|
|
|
|
|
|
|
|||||||||
| Net income |
71,504 | 323,271 | 405,083 | 633,180 | ||||||||||||
| Net income attributable to noncontrolling interests |
||||||||||||||||
| Noncontrolling interests in property partnerships |
17,225 | (115,240 | ) | (53 | ) | (139,712 | ) | |||||||||
| Noncontrolling interest—redeemable preferred units of the Operating Partnership |
— | — | — | (6 | ) | |||||||||||
| Noncontrolling interest—common units of the Operating Partnership |
(9,387 | ) | (21,302 | ) | (42,120 | ) | (50,906 | ) | ||||||||
|
|
|
|
|
|
|
|
|
|||||||||
| Net income attributable to Boston Properties, Inc. |
79,342 | 186,729 | 362,910 | 442,556 | ||||||||||||
| Preferred dividends |
(2,589 | ) | (2,647 | ) | (7,796 | ) | (7,854 | ) | ||||||||
|
|
|
|
|
|
|
|
|
|||||||||
| Net income attributable to Boston Properties, Inc. common shareholders |
$ | 76,753 | $ | 184,082 | $ | 355,114 | $ | 434,702 | ||||||||
|
|
|
|
|
|
|
|
|
|||||||||
| Basic earnings per common share attributable to Boston Properties, Inc. common shareholders: |
||||||||||||||||
| Net income |
$ | 0.50 | $ | 1.20 | $ | 2.31 | $ | 2.83 | ||||||||
|
|
|
|
|
|
|
|
|
|||||||||
| Weighted average number of common shares outstanding |
153,754 | 153,595 | 153,681 | 153,426 | ||||||||||||
|
|
|
|
|
|
|
|
|
|||||||||
| Diluted earnings per common share attributable to Boston Properties, Inc. common shareholders: |
||||||||||||||||
| Net income |
$ | 0.50 | $ | 1.20 | $ | 2.31 | $ | 2.82 | ||||||||
|
|
|
|
|
|
|
|
|
|||||||||
| Weighted average number of common and common equivalent shares outstanding |
154,136 | 153,786 | 153,971 | 153,825 | ||||||||||||
|
|
|
|
|
|
|
|
|
|||||||||
–more–
BOSTON PROPERTIES, INC.
FUNDS FROM OPERATIONS (1)
(Unaudited)
| Three months ended September 30, |
Nine months ended September 30, |
|||||||||||||||
| 2016 | 2015 | 2016 | 2015 | |||||||||||||
| (in thousands, except for per share amounts) | ||||||||||||||||
| Net income attributable to Boston Properties, Inc. common shareholders |
$ | 76,753 | $ | 184,082 | $ | 355,114 | $ | 434,702 | ||||||||
| Add: |
||||||||||||||||
| Preferred dividends |
2,589 | 2,647 | 7,796 | 7,854 | ||||||||||||
| Noncontrolling interest - common units of the Operating Partnership |
9,387 | 21,302 | 42,120 | 50,906 | ||||||||||||
| Noncontrolling interest - redeemable preferred units of the Operating Partnership |
— | — | — | 6 | ||||||||||||
| Noncontrolling interests in property partnerships |
(17,225 | ) | 115,240 | 53 | 139,712 | |||||||||||
| Less: |
||||||||||||||||
| Gains on sales of real estate |
12,983 | 199,479 | 80,606 | 294,563 | ||||||||||||
|
|
|
|
|
|
|
|
|
|||||||||
| Income before gains on sales of real estate |
58,521 | 123,792 | 324,477 | 338,617 | ||||||||||||
| Add: |
||||||||||||||||
| Depreciation and amortization |
203,748 | 153,015 | 516,371 | 475,082 | ||||||||||||
| Noncontrolling interests in property partnerships’ share of depreciation and amortization |
(40,907 | ) | (21,405 | ) | (79,831 | ) | (70,147 | ) | ||||||||
| Company’s share of depreciation and amortization from unconsolidated joint ventures |
9,128 | 3,808 | 18,242 | 2,562 | ||||||||||||
| Corporate-related depreciation and amortization |
(393 | ) | (334 | ) | (1,119 | ) | (1,017 | ) | ||||||||
| Less: |
||||||||||||||||
| Noncontrolling interests in property partnerships (2) |
(17,225 | ) | 14,122 | 53 | 38,594 | |||||||||||
| Noncontrolling interest - redeemable preferred units of the Operating Partnership |
— | — | — | 6 | ||||||||||||
| Preferred dividends |
2,589 | 2,647 | 7,796 | 7,854 | ||||||||||||
|
|
|
|
|
|
|
|
|
|||||||||
| Funds from operations (FFO) attributable to the Operating Partnership common unitholders (including Boston Properties, Inc.) |
244,733 | 242,107 | 770,291 | 698,643 | ||||||||||||
| Less: |
||||||||||||||||
| Noncontrolling interest - common units of the Operating Partnership’s share of funds from operations |
25,169 | 24,846 | 79,440 | 72,278 | ||||||||||||
|
|
|
|
|
|
|
|
|
|||||||||
| Funds from operations attributable to Boston Properties, Inc. common shareholders |
$ | 219,564 | $ | 217,261 | $ | 690,851 | $ | 626,365 | ||||||||
|
|
|
|
|
|
|
|
|
|||||||||
| Boston Properties, Inc.’s percentage share of funds from operations - basic |
89.72 | % | 89.74 | % | 89.69 | % | 89.65 | % | ||||||||
|
|
|
|
|
|
|
|
|
|||||||||
| Weighted average shares outstanding - basic |
153,754 | 153,595 | 153,681 | 153,426 | ||||||||||||
|
|
|
|
|
|
|
|
|
|||||||||
| FFO per share basic |
$ | 1.43 | $ | 1.41 | $ | 4.50 | $ | 4.08 | ||||||||
|
|
|
|
|
|
|
|
|
|||||||||
| Weighted average shares outstanding - diluted |
154,136 | 153,786 | 153,971 | 153,825 | ||||||||||||
|
|
|
|
|
|
|
|
|
|||||||||
| FFO per share diluted |
$ | 1.42 | $ | 1.41 | $ | 4.49 | $ | 4.07 | ||||||||
|
|
|
|
|
|
|
|
|
|||||||||
–more–
| (1) | Pursuant to the revised definition of Funds from Operations adopted by the Board of Governors of the National Association of Real Estate Investment Trusts (“NAREIT”), we calculate Funds from Operations, or “FFO,” by adjusting net income (loss) attributable to Boston Properties, Inc. common shareholders (computed in accordance with GAAP) for gains (or losses) from sales of properties, impairment losses on depreciable real estate consolidated on our balance sheet, impairment losses on our investments in unconsolidated joint ventures driven by a measurable decrease in the fair value of depreciable real estate held by the unconsolidated joint ventures, real estate-related depreciation and amortization, and our share of income (loss) from unconsolidated partnerships and joint ventures. FFO is a non-GAAP financial measure, but we believe the presentation of FFO, combined with the presentation of required GAAP financial measures, has improved the understanding of operating results of REITs among the investing public and has helped make comparisons of REIT operating results more meaningful. Management generally considers FFO and FFO per share to be useful measures for understanding and comparing our operating results because, by excluding gains and losses related to sales of previously depreciated operating real estate assets, impairment losses and real estate asset depreciation and amortization (which can differ across owners of similar assets in similar condition based on historical cost accounting and useful life estimates), FFO and FFO per share can help investors compare the operating performance of a company’s real estate across reporting periods and to the operating performance of other companies. |
Our computation of FFO may not be comparable to FFO reported by other REITs or real estate companies that do not define the term in accordance with the current NAREIT definition or that interpret the current NAREIT definition differently.
In order to facilitate a clear understanding of the Company’s operating results, FFO should be examined in conjunction with net income attributable to Boston Properties, Inc. common shareholders as presented in the Company’s consolidated financial statements. FFO should not be considered as a substitute for net income attributable to Boston Properties, Inc. common shareholders (determined in accordance with GAAP) or any other GAAP financial measures and should only be considered together with and as a supplement to the Company’s financial information prepared in accordance with GAAP.
| (2) | For the three and nine months ended September 30, 2015, excludes the noncontrolling interests in property partnerships’ share of a gain on sale of real estate totaling approximately $101.1 million. |
–more–
BOSTON PROPERTIES, INC.
PORTFOLIO LEASING PERCENTAGES
| % Leased by Location | ||||||||
| September 30, 2016 | December 31, 2015 | |||||||
| Boston |
90.0 | % | 90.6 | % | ||||
| New York |
90.1 | % | 91.5 | % | ||||
| San Francisco and Los Angeles |
87.3 | % | 93.8 | % | ||||
| Washington, DC |
90.1 | % | 91.0 | % | ||||
|
|
|
|
|
|||||
| Total Portfolio |
89.6 | % | 91.4 | % | ||||
|
|
|
|
|
|||||
# # #
Serious News for Serious Traders! Try StreetInsider.com Premium Free!
You May Also Be Interested In
- BXP Releases 2023 Sustainability & Impact Report
- Danfoss Selects RISE with SAP and HPE GreenLake to Accelerate Sustainable Cloud Journey
- Bloomberg Announces First Trade of EGB Market-On-Close Spread to BVAL Price
Create E-mail Alert Related Categories
SEC FilingsSign up for StreetInsider Free!
Receive full access to all new and archived articles, unlimited portfolio tracking, e-mail alerts, custom newswires and RSS feeds - and more!
