

Form 8-K BOB EVANS FARMS INC For: Sep 10
 Tweet
Tweet Share
Share
UNITED STATES
SECURITIES AND EXCHANGE COMMISSION
Washington, D.C. 20549
FORM 8-K
CURRENT REPORT
PURSUANT TO SECTION 13 OR 15(D)
OF THE SECURITIES EXCHANGE ACT OF 1934
Date of Report (Date of earliest event reported): September 10, 2015 (September 10, 2015)
Bob Evans Farms, Inc.
(Exact name of registrant as specified in its charter)
| Delaware | 0-1667 | 31-4421866 | ||
| (State or other jurisdiction of incorporation) |
(Commission File No.) |
(I.R.S. Employer Identification No.) |
| 8111 Smith’s Mill Road, New Albany, Ohio | 43054 | |
| (Address of principal executive offices) | (Zip Code) |
Registrant’s telephone number, including area code: (614) 491-2225
Not applicable
(Former name or former address, if changed since last report)
Check the appropriate box below if the Form 8-K filing is intended to simultaneously satisfy the filing obligation of the registrant under any of the following provisions (see General Instruction A.2 below):
| ¨ | Written communications pursuant to Rule 425 under the Securities Act (17 CFR 230.425) |
| ¨ | Soliciting material pursuant to Rule 14a-12 under the Exchange Act (17 CFR 240.14a-12) |
| ¨ | Pre-commencement communications pursuant to Rule 14d-2(b) under the Exchange Act (17 CFR 240.14d-2b) |
| ¨ | Pre-commencement communications pursuant to Rule 13e-4(c) under the Exchange Act (17 CFR 240.13e-4c) |
Item 8.01 Other Events.
On September 10, 2015, Bob Evans Farms, Inc. (the “Company”) issued an investor presentation titled “Investor Presentation, CL King Best Ideas Conference 2015, New York—September 10, 2015” (“Investor Presentation”). The Company’s Investor Presentation is available on its “Investors Relations” website under “Events & Presentations” at http://investors.bobevans.com/events.cfm and is also furnished as Exhibit 99.1 to this Current Report on Form 8-K. The Company’s reports on Forms 10-K, 10-Q and 8-K filed with the U.S. Securities and Exchange Commission (“SEC”), and other publicly available information, should also be consulted for other important information about the Company.
The information included in the Investor Presentation includes financial information determined by methods other than in accordance with accounting principles generally accepted in the United States of America (“GAAP”). The Company’s management uses these non-GAAP measures in its analysis of the Company’s performance. The Company believes that the presentation of certain non-GAAP measures provides useful supplemental information that is essential to a proper understanding of the operating results of the Company’s core businesses as well as its segments. These non-GAAP disclosures should not be viewed as a substitute for operating results determined in accordance with GAAP, nor are they necessarily comparable to non-GAAP performance measures that may be presented by other companies. The reconciliation of the non-GAAP information to GAAP is included in the Investor Presentation furnished as Exhibit 99.1.
Some of the matters discussed in this Current Report on Form 8-K, including Exhibit 99.1, constitute forward-looking statements within the meaning of the “safe-harbor” provisions of the U.S. Private Securities Litigation Reform Act of 1995. These forward-looking statements include statements other than those made solely with respect to historical fact and are based on the intent, belief or current expectations of the Company and/or its management. The Company’s business and operations are subject to a variety of risks and uncertainties that might cause actual results to differ materially from those projected by any forward-looking statements. Factors that could cause such differences include, but are not limited to, the risk factors and other materials set forth in the Company’s filings with the SEC.
Item 9.01 Financial Statements and Exhibits.
| (d) | Exhibits. |
| Exhibit Number |
Description | |
| 99.1 | Bob Evans Farms, Inc. Investor Presentation, CL King Best Ideas Conference 2015, New York—September 10, 2015 | |
SIGNATURE
Pursuant to the requirements of the Securities Exchange Act of 1934, the registrant has duly caused this report to be signed on its behalf by the undersigned, hereunto duly authorized.
Date: September 10, 2015
| BOB EVANS FARMS, INC. | ||
| By: | /s/ Kevin C. O’Neil | |
| Kevin C. O’Neil, Vice President, Assoc. General Counsel and Asst. Secretary | ||
Exhibit 99.1
|
|
Investor Presentation
CL King Best Ideas Conference 2015
New York
September 10, 2015
Mark Hood, Chief Financial Officer
Scott Taggart, VP, Investor Relations
| 1 |
|
|
|

Safe Harbor Statement
Certain statements in this presentation that are not historical facts are forward-looking statements. Forward-looking statements involve various important assumptions, risks and uncertainties. Actual results may differ materially from those predicted by the forward-looking statements because of various factors and possible events, including, without limitation:
Negative publicity or litigation regarding allegations of food-related illness,
Failure to achieve and maintain positive same-store sales,
Changing business conditions, including energy costs,
Overall macroeconomic conditions that may affect consumer spending, either nationwide or in one or more of the Company’s major markets
Competition in the restaurant and food products industries,
Ability to control restaurant operating costs, which are impacted by market changes in the cost or availability of labor and food, minimum wage and other employment laws, health care costs, fuel and utility costs,
Changes in the cost or availability of acceptable new restaurant sites,
Adverse weather conditions in locations where we operate our restaurants,
Consumer acceptance of changes in menu offerings, price, atmosphere and/or service procedures,
Consumer acceptance of our restaurant concepts in new geographic areas, and
Changes in hog and other commodity costs.
We also bear the risk of incorrectly analyzing these risks or developing strategies to address them that prove to be unsuccessful.
Certain risks, uncertainties and assumptions are discussed under the heading “Risk Factors” in Item 1A of our Annual Report on Form 10-K for the fiscal year ended April 24, 2015. We note these factors for investors as contemplated by the Private Securities Litigation Reform Act of 1995. It is impossible to predict or identify all such risk factors. Consequently, you should not consider any such list to be a complete set of all potential risks and uncertainties. Forward-looking statements speak only as of the date on which they are made, and we undertake no obligation to update any forward-looking statement to reflect circumstances or events that occur after the date on which the statement is made to reflect unanticipated events. Any further disclosures in our filings with the Securities and Exchange Commission should also be consulted. All subsequent written and oral forward-looking statements attributable to us or any person acting on behalf of the company are qualified by the cautionary statements in this section.
| 2 |
|
|
|
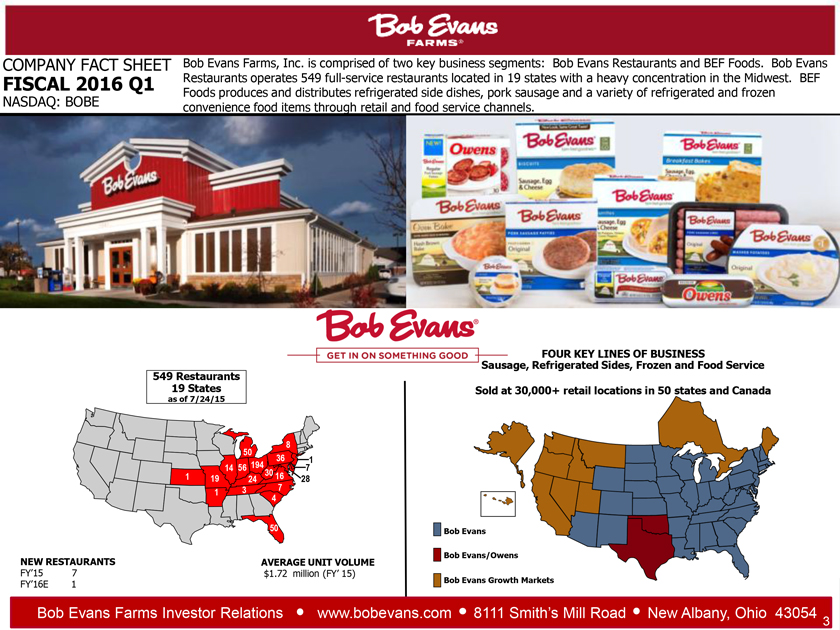
COMPANY FACT SHEET FISCAL 2016 Q1 NASDAQ: BOBE
Bob Evans Farms, Inc. is comprised of two key business segments: Bob Evans Restaurants and BEF Foods. Bob Evans Restaurants operates 549 full-service restaurants located in 19 states with a heavy concentration in the Midwest. BEF Foods produces and distributes refrigerated side dishes, pork sausage and a variety of refrigerated and frozen convenience food items through retail and food service channels.
FOUR KEY LINES OF BUSINESS Sausage, Refrigerated Sides, Frozen and Food Service
Sold at 30,000+ retail locations in 50 states and Canada
549 Restaurants 19 States
as of 7/24/15
NEW RESTAURANTS
FY’15 7
FY’16E 1
AVERAGE UNIT VOLUME
$1.72 million (FY’ 15)
Bob Evans
Bob Evans/Owens
Bob Evans Growth Markets
Bob Evans Farms Investor Relations www.bobevans.com 8111 Smith’s Mill Road New Albany, Ohio 43054
| 3 |
|
|
|
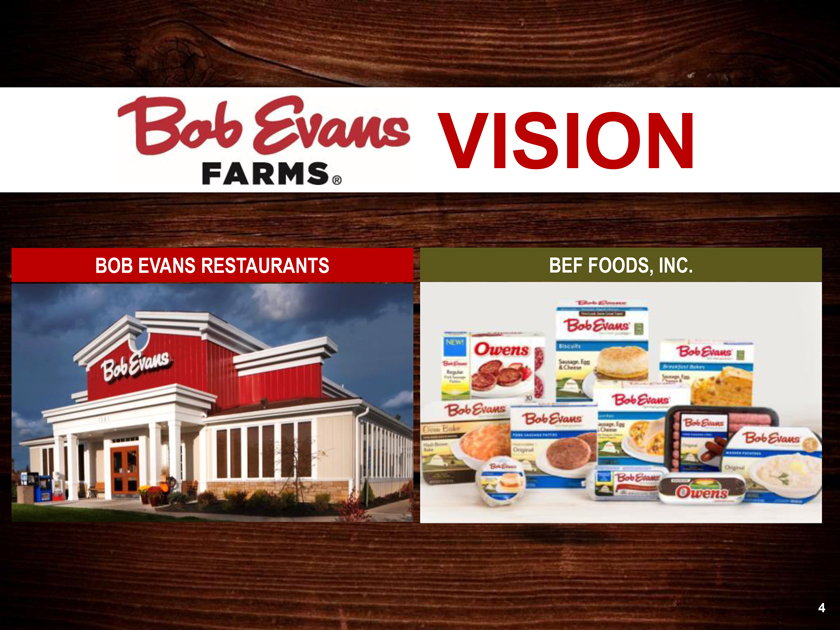
VISION
BOB EVANS RESTAURANTS
BEF FOODS, INC.
| 4 |
|
|
|
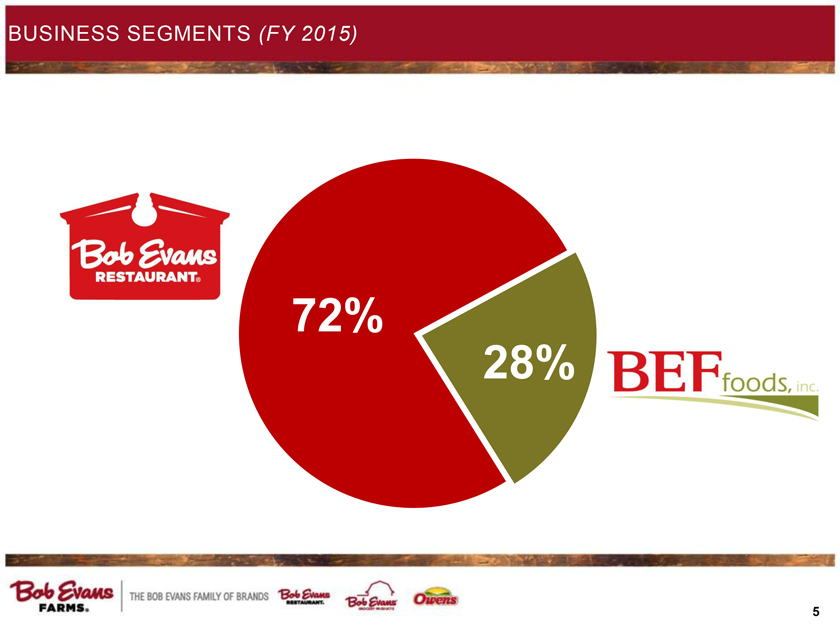
Business Segments (FY 2015)
72%
28%
| 5 |
|
|
|

BOB EVANS’ TURNAROUND PLAN: 4 PRIORITIES
1. Improve the brand experience for our restaurant guests and grocery customers
2. Profitably increase sales in our restaurants, and increase points of distribution of our consumer food products
3. Reduce costs, particularly at the corporate level
4. Allocate capital efficiently
| 6 |
|
|
|
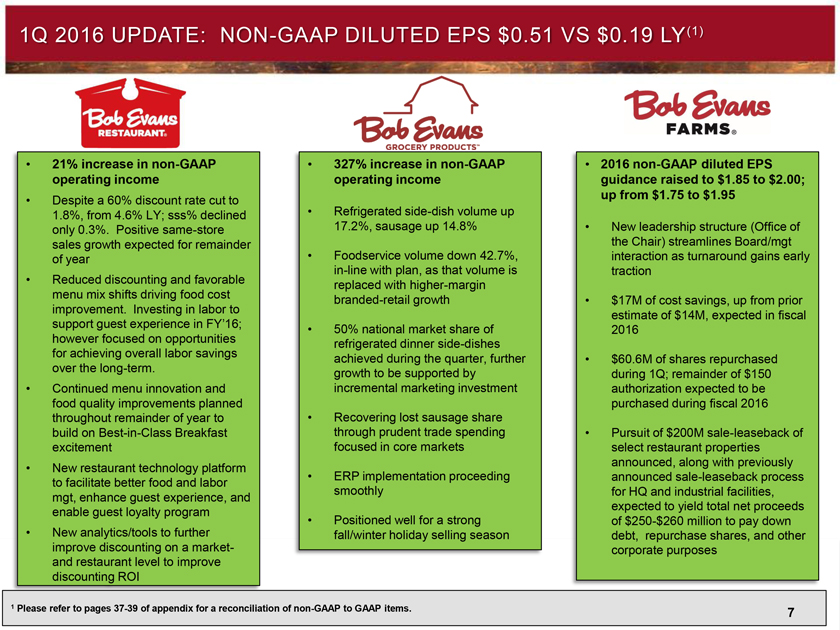
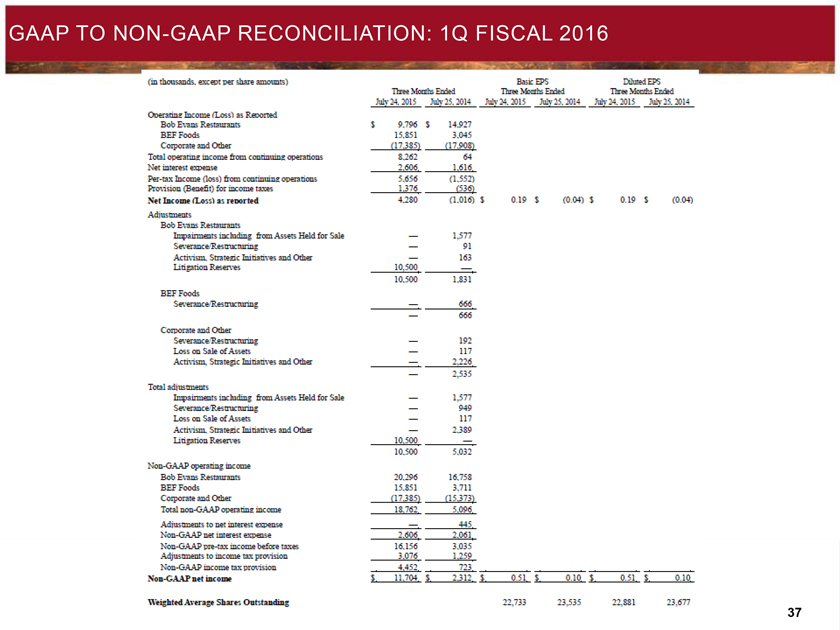
1Q 2016 UPDATE: NON-GAAP DILUTED EPS $0.51 VS $0.19 LY(1)
21% increase in non-GAAP operating income
Despite a 60% discount rate cut to 1.8%, from 4.6% LY; sss% declined only 0.3%. Positive same-store sales growth expected for remainder of year
Reduced discounting and favorable menu mix shifts driving food cost improvement. Investing in labor to support guest experience in FY’16; however focused on opportunities for achieving overall labor savings over the long-term.
Continued menu innovation and food quality improvements planned throughout remainder of year to build on Best-in-Class Breakfast excitement
New restaurant technology platform to facilitate better food and labor mgt, enhance guest experience, and enable guest loyalty program
New analytics/tools to further improve discounting on a market- and restaurant level to improve discounting ROI
327% increase in non-GAAP operating income Refrigerated side-dish volume up 17.2%, sausage up 14.8% Foodservice volume down 42.7%, in-line with plan, as that volume is replaced with higher-margin branded-retail growth 50% national market share of refrigerated dinner side-dishes achieved during the quarter, further growth to be supported by incremental marketing investment Recovering lost sausage share through prudent trade spending focused in core markets ERP implementation proceeding smoothly Positioned well for a strong fall/winter holiday selling season
2016 non-GAAP diluted EPS guidance raised to $1.85 to $2.00; up from $1.75 to $1.95 New leadership structure (Office of the Chair) streamlines Board/mgt interaction as turnaround gains early traction $17M of cost savings, up from prior estimate of $14M, expected in fiscal 2016 $60.6M of shares repurchased during 1Q; remainder of $150 authorization expected to be purchased during fiscal 2016 Pursuit of $200M sale-leaseback of select restaurant properties announced, along with previously announced sale-leaseback process for HQ and industrial facilities, expected to yield total net proceeds of $250-$260 million to pay down debt, repurchase shares, and other corporate purposes
| 1 |
|
Please refer to pages 37-39 of appendix for a reconciliation of non-GAAP to GAAP items. |
| 7 |
|
|
|
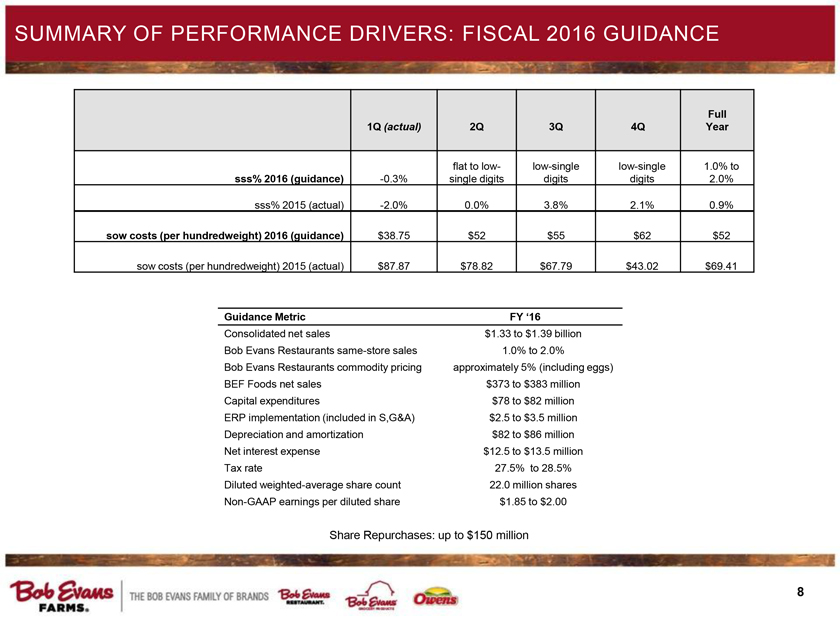
Summary of Performance Drivers: Fiscal 2016 Guidance
1Q (actual)
2Q
3Q
4Q
Full
Year
sss% 2016 (guidance)
-0.3%
flat to low-single digits
low-single digits
low-single digits
1.0% to 2.0%
sss% 2015 (actual)
-2.0%
0.0%
3.8%
2.1%
0.9%
sow costs (per hundredweight) 2016 (guidance)
$38.75
$52
$55
$62
$52
sow costs (per hundredweight) 2015 (actual)
$87.87
$78.82
$67.79
$43.02
$69.41 Guidance Metric
FY ‘16
Consolidated net sales
$1.33 to $1.39 billion
Bob Evans Restaurants same-store sales
1.0% to 2.0%
Bob Evans Restaurants commodity pricing
approximately 5% (including eggs)
BEF Foods net sales
$373 to $383 million
Capital expenditures
$78 to $82 million
ERP implementation (included in S,G&A)
$2.5 to $3.5 million
Depreciation and amortization
$82 to $86 million
Net interest expense
$12.5 to $13.5 million
Tax rate
27.5% to 28.5%
Diluted weighted-average share count
22.0 million shares
Non-GAAP earnings per diluted share
$1.85 to $2.00
Share Repurchases: up to $150 million
| 8 |
|
|
|
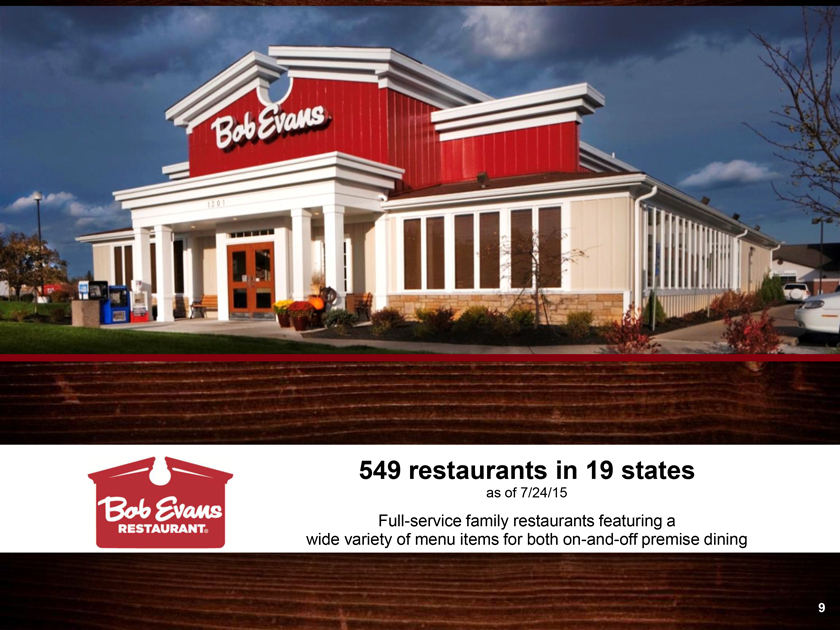
549 restaurants in 19 states as of 7/24/15
Full-service family restaurants featuring a
wide variety of menu items for both on-and-off premise dining
9
|
|
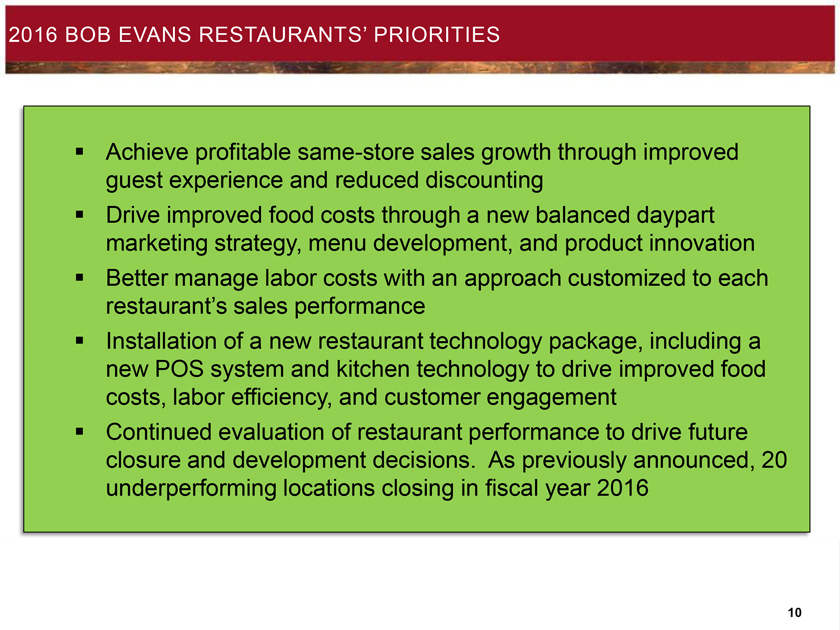
2016 BOB EVANS RESTAURANTS’ PRIORITIES
Achieve profitable same-store sales growth through improved guest experience and reduced discounting
Drive improved food costs through a new balanced daypart marketing strategy, menu development, and product innovation
Better manage labor costs with an approach customized to each restaurant’s sales performance
Installation of a new restaurant technology package, including a new POS system and kitchen technology to drive improved food costs, labor efficiency, and customer engagement
Continued evaluation of restaurant performance to drive future closure and development decisions. As previously announced, 20 underperforming locations closing in fiscal year 2016
10
|
|
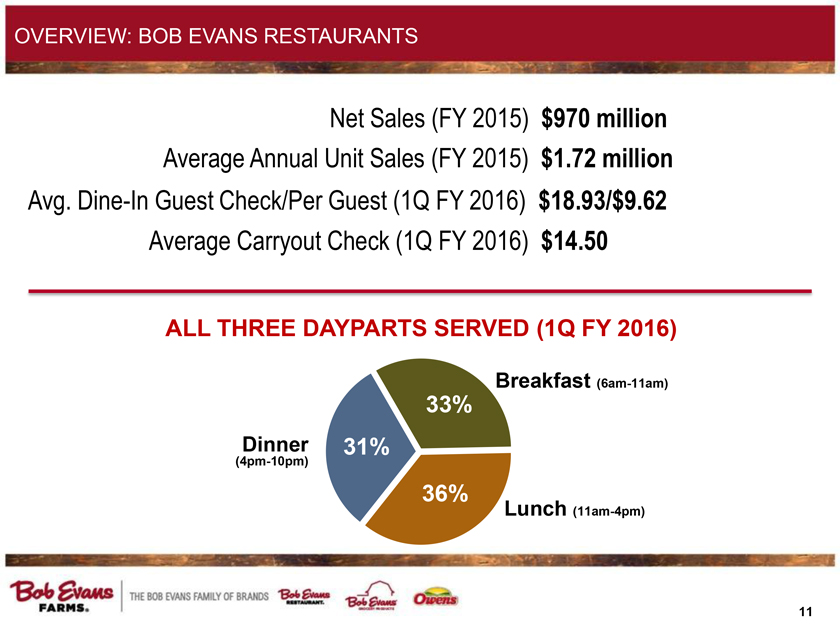
OVERVIEW: BOB EVANS RESTAURANTS
Net Sales (FY 2015) $970 million
Average Annual Unit Sales (FY 2015) $1.72 million
Avg. Dine-In Guest Check/Per Guest (1Q FY 2016) $18.93/$9.62
Average Carryout Check (1Q FY 2016) $14.50
ALL THREE DAYPARTS SERVED (1Q FY 2016)
Dinner
(4pm-10pm)
Breakfast (6am-11am)
Lunch (11am-4pm)
33%
31%
36%
11
|
|
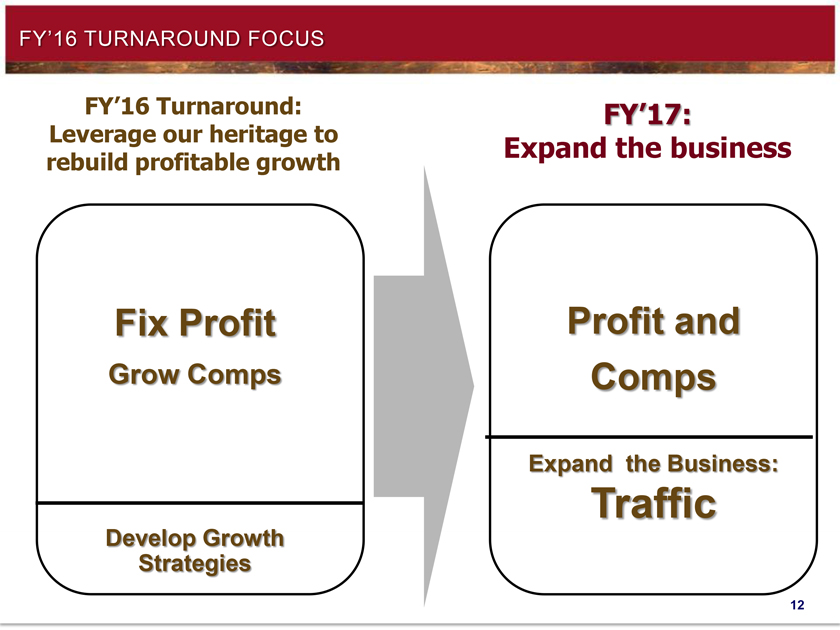
FY’16 TURNAROUND FOCUS
FY’16 Turnaround:
Leverage our heritage to rebuild profitable growth FY’17:
Expand the business Fix Profit
Grow Comps Develop Growth Strategies Profit and
Comps Expand the Business: Traffic
12
|
|
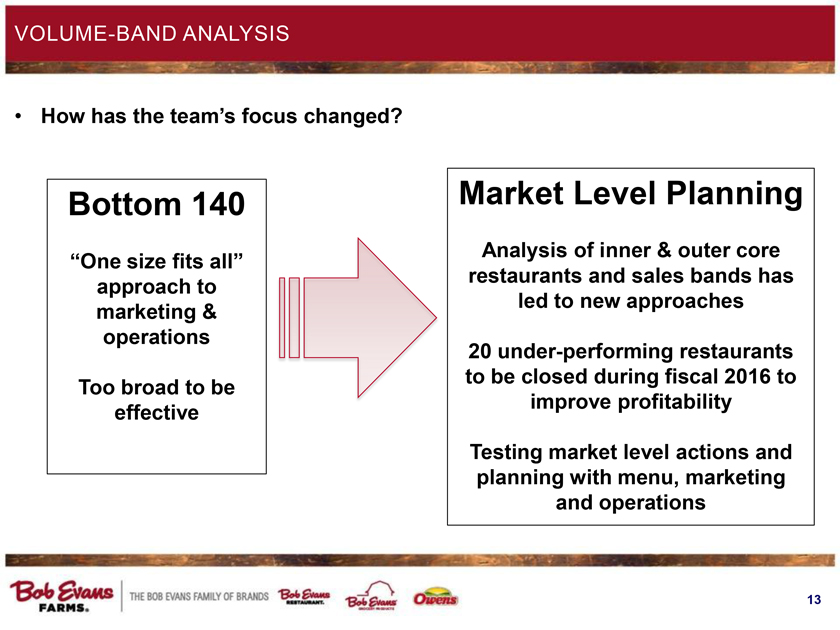
VOLUME-BAND ANALYSIS How has the team’s focus changed?
Bottom 140 “One size fits all” approach to marketing & operations Too broad to be effective
Market Level Planning Analysis of inner & outer core restaurants and sales bands has led to new approaches 20 under-performing restaurants to be closed during fiscal 2016 to improve profitability Testing market level actions and planning with menu, marketing and operations
13
|
|

EVOLVING MENU
Recent menu actions:
“Best-in-Class Breakfast”
“10 under $6” values
Premium Broasted® Chicken meals
$4 appetizers
New beverages
Broasted is a registered trademark of The Broaster Company, LLC.
14
|
|
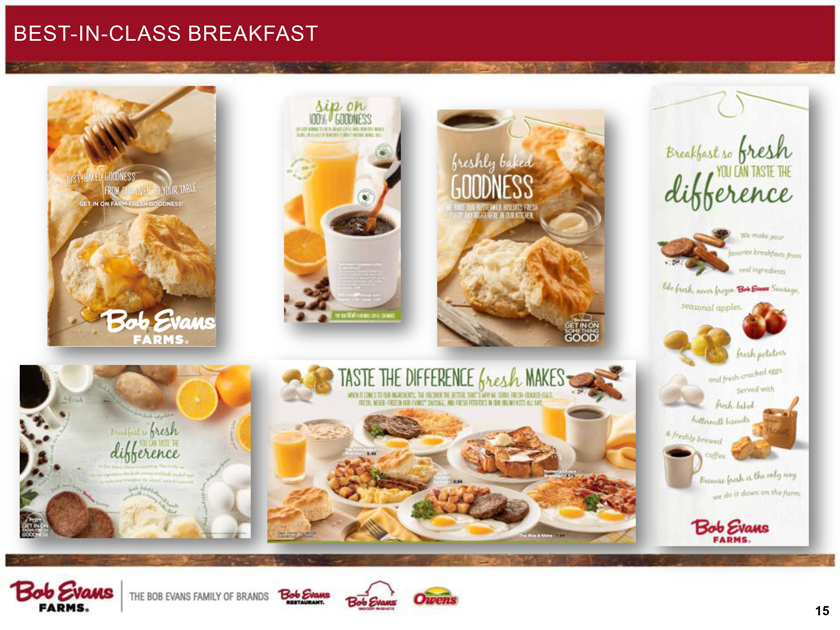
BEST-IN-CLASS BREAKFAST
15
|
|
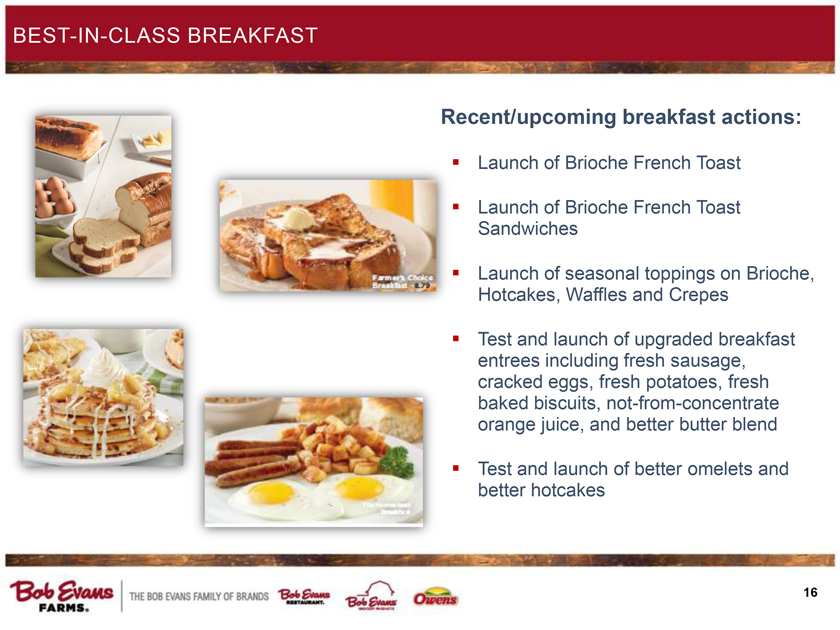
BEST-IN-CLASS BREAKFAST
Recent/upcoming breakfast actions:
Launch of Brioche French Toast
Launch of Brioche French Toast Sandwiches
Launch of seasonal toppings on Brioche, Hotcakes, Waffles and Crepes
Test and launch of upgraded breakfast entrees including fresh sausage, cracked eggs, fresh potatoes, fresh baked biscuits, not-from-concentrate orange juice, and better butter blend
Test and launch of better omelets and better hotcakes
16
|
|
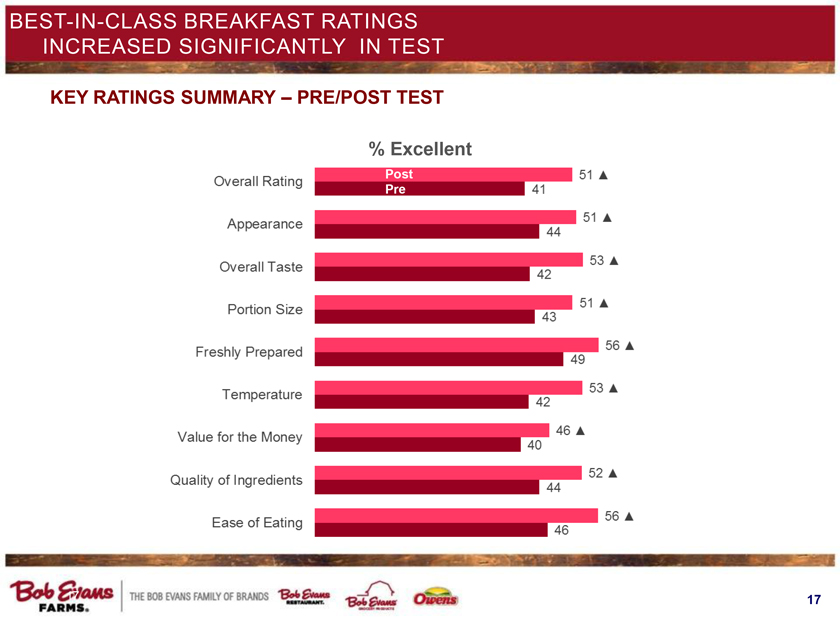
BEST-IN-CLASS BREAKFAST RATINGS INCREASED SIGNIFICANTLY IN TEST
KEY RATINGS SUMMARY – PRE/POST TEST
% Excellent
Overall Rating Post 51 Pre 41
Appearance 51 44
Overall Taste 53 42
Portion Size 51 43
Freshly Prepared 56 49
Temperature 53 42
Value for the Money 46 40
Quality of Ingredients 52 44
Ease of Eating 56 46
17
|
|
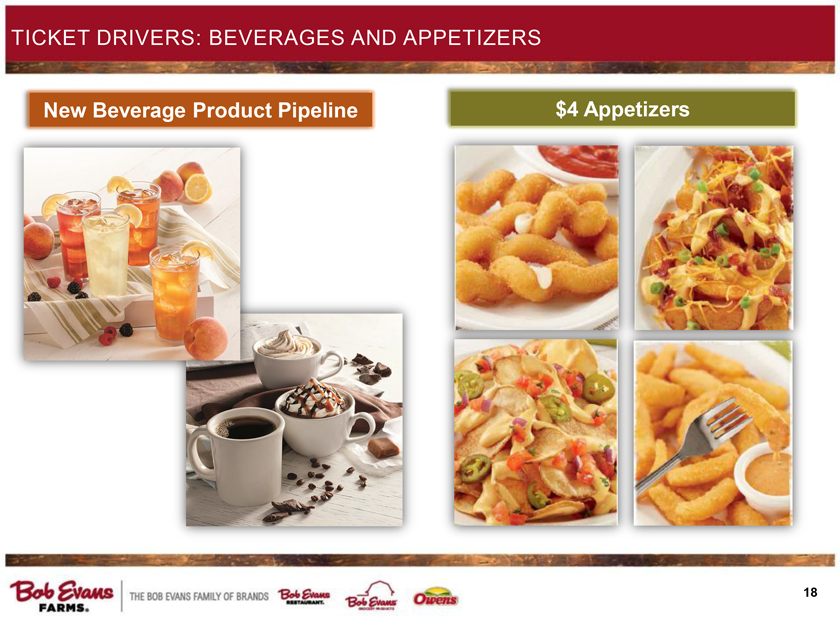
TICKET DRIVERS: BEVERAGES AND APPETIZERS
New Beverage Product Pipeline
$4 Appetizers
18
|
|
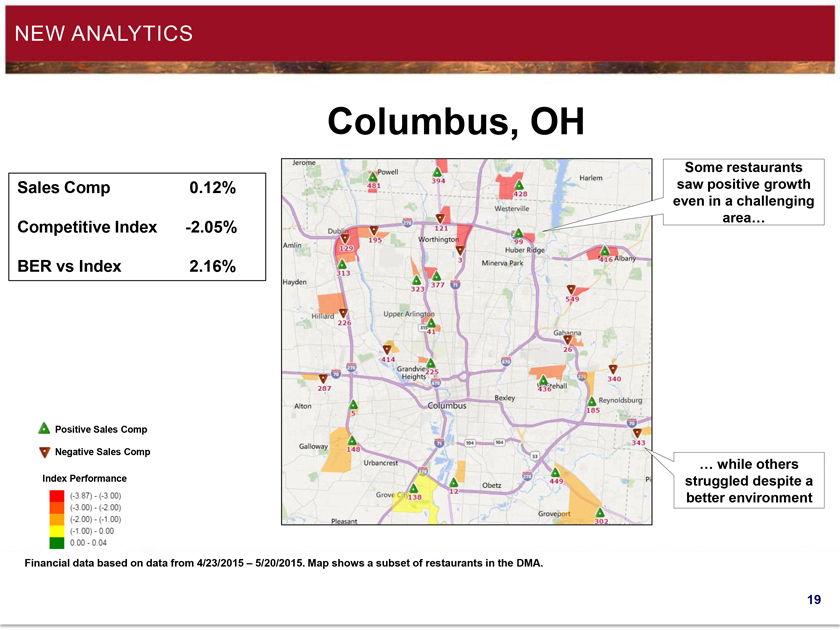
NEW ANALYTICS
Columbus, OH
Sales Comp 0.12%
Competitive Index -2.05%
BER vs Index 2.16%
Some restaurants saw positive growth even in a challenging area…
Positive Sales Comp
Negative Sales Comp
Index Performance
… while others struggled despite a better environment
Financial data based on data from 4/23/2015 – 5/20/2015. Map shows a subset of restaurants in the DMA.
19
|
|
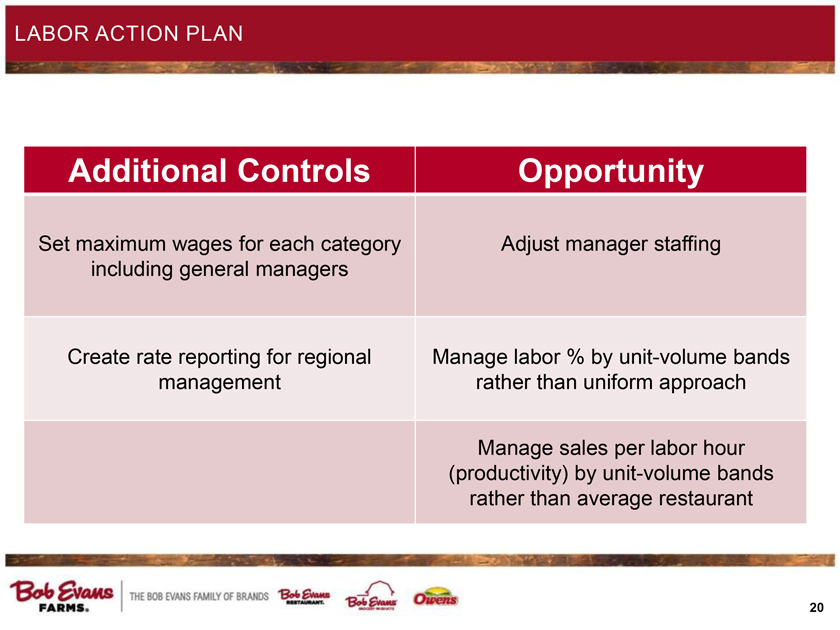
LABOR ACTION PLAN
Additional Controls
Opportunity
Set maximum wages for each category including general managers
Adjust manager staffing
Create rate reporting for regional management
Manage labor % by unit-volume bands rather than uniform approach Manage sales per labor hour (productivity) by unit-volume bands rather than average restaurant
20
|
|
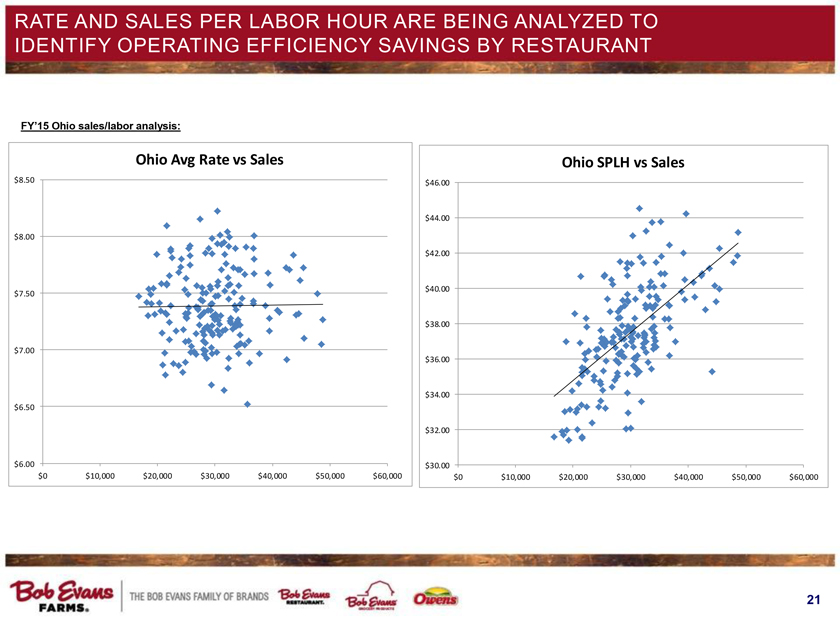
RATE AND SALES PER LABOR HOUR ARE BEING ANALYZED TO IDENTIFY OPERATING EFFICIENCY SAVINGS BY RESTAURANT
FY’15 Ohio sales/labor analysis:
Ohio Avg Rate vs Sales $6.00 $6.50 $7.00 $7.50 $8.00 $8.50 $0 $10,000 $20,000 $30,000 $40,000 $50,000 $60,000
Ohio SPLH vs Sales $30.00 $32.00 $34.00 $36.00 $38.00 $40.00 $42.00 $44.00 $46.00 $0 $10,000 $20,000 $30,000 $40,000 $50,000 $60,000
21
|
|
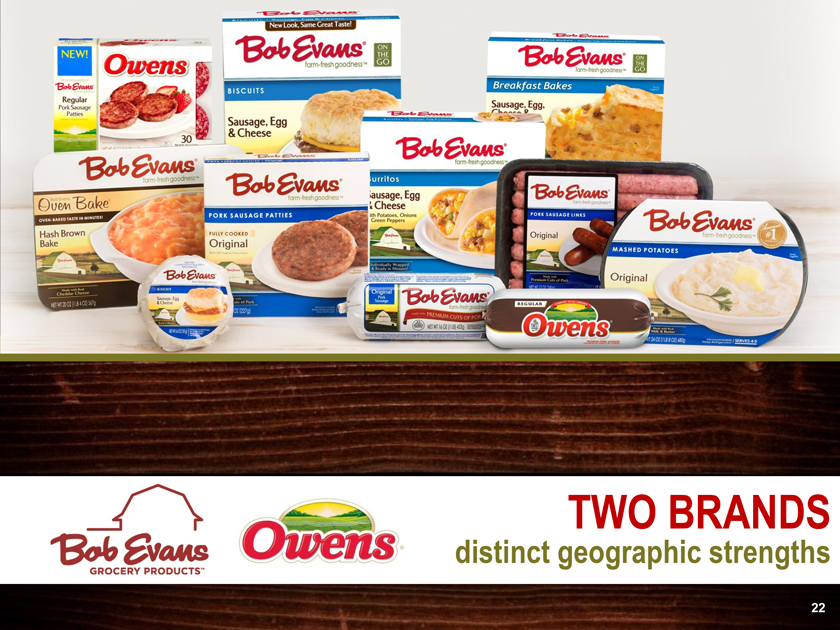
TWO BRANDS distinct geographic strengths
22
|
|
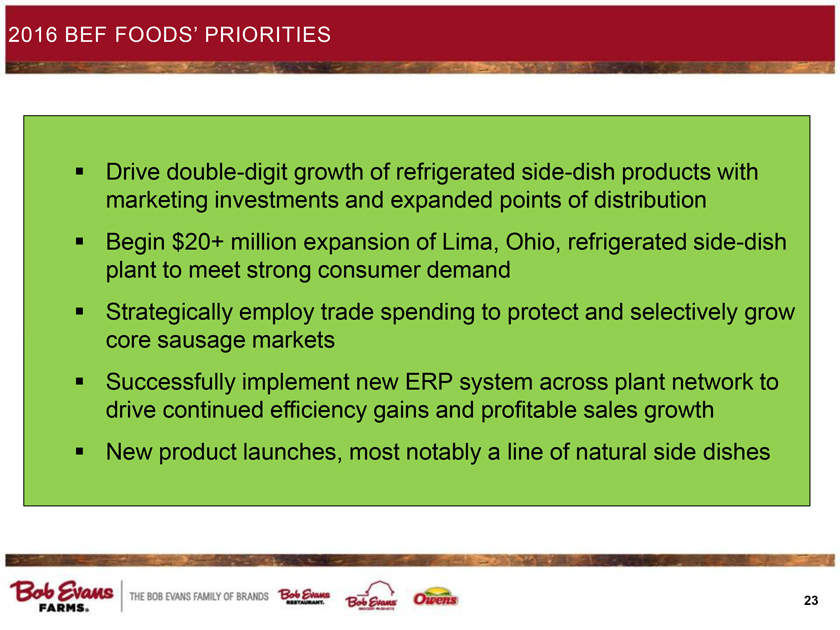
2016 BEF FOODS’ PRIORITIES
Drive double-digit growth of refrigerated side-dish products with marketing investments and expanded points of distribution
Begin $20+ million expansion of Lima, Ohio, refrigerated side-dish plant to meet strong consumer demand
Strategically employ trade spending to protect and selectively grow core sausage markets
Successfully implement new ERP system across plant network to drive continued efficiency gains and profitable sales growth
New product launches, most notably a line of natural side dishes
23
|
|
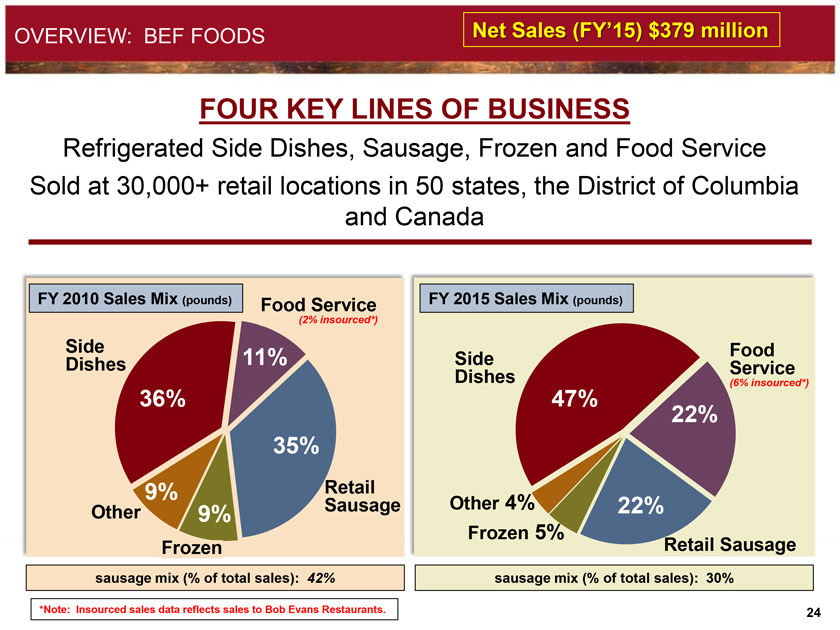
OVERVIEW: BEF FOODS
Net Sales (FY’15) $379 million
FOUR KEY LINES OF BUSINESS
Refrigerated Side Dishes, Sausage, Frozen and Food Service
Sold at 30,000+ retail locations in 50 states, the District of Columbia and Canada
FY 2010 Sales Mix (pounds)
Food Service
(2% insourced*)
Side
Dishes
Other
Frozen
Retail
Sausage
36%
9%
9%
11%
35%
sausage mix (% of total sales): 42%
FY 2015 Sales Mix (pounds)
Side
Dishes
Food
Service
(6% insourced*)
Other 4%
Frozen 5%
Retail Sausage
47%
22%
22%
sausage mix (% of total sales): 30%
*Note: Insourced sales data reflects sales to Bob Evans Restaurants.
24
|
|
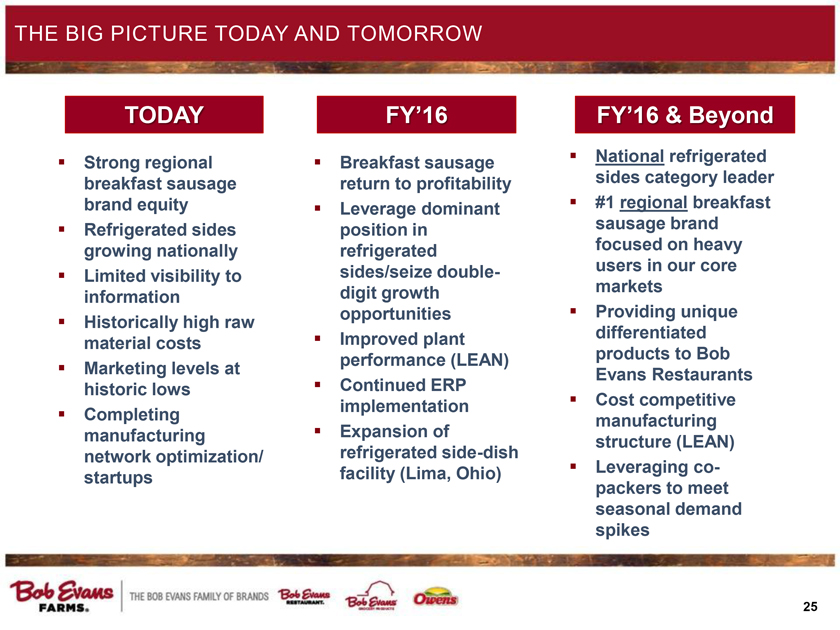
THE BIG PICTURE TODAY AND TOMORROW
TODAY
Strong regional breakfast sausage brand equity
Refrigerated sides growing nationally
Limited visibility to information
Historically high raw material costs
Marketing levels at historic lows
Completing manufacturing network optimization/startups
FY’16
Breakfast sausage return to profitability
Leverage dominant position in refrigerated sides/seize double-digit growth opportunities
Improved plant performance (LEAN)
Continued ERP implementation
Expansion of refrigerated side-dish facility (Lima, Ohio)
FY’16 & Beyond
National refrigerated sides category leader
#1 regional breakfast sausage brand focused on heavy users in our core markets
Providing unique differentiated products to Bob Evans Restaurants
Cost competitive manufacturing structure (LEAN)
Leveraging co-packers to meet seasonal demand spikes
25
|
|
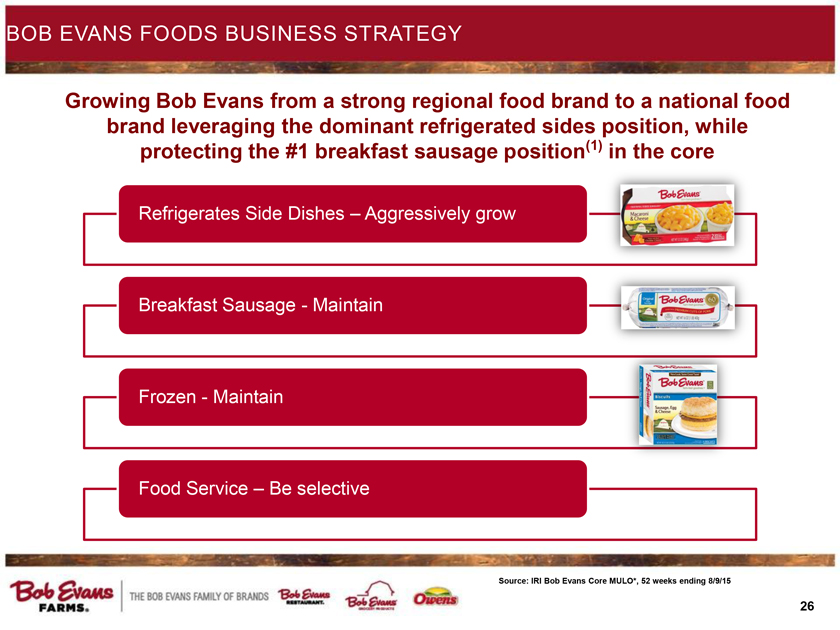
BOB EVANS FOODS BUSINESS STRATEGY
Growing Bob Evans from a strong regional food brand to a national food brand leveraging the dominant refrigerated sides position, while protecting the #1 breakfast sausage position(1) in the core
Refrigerates Side Dishes – Aggressively grow
Breakfast Sausage - Maintain
Frozen - Maintain
Food Service – Be selective
Source: IRI Bob Evans Core MULO*, 52 weeks ending 8/9/15
26
|
|
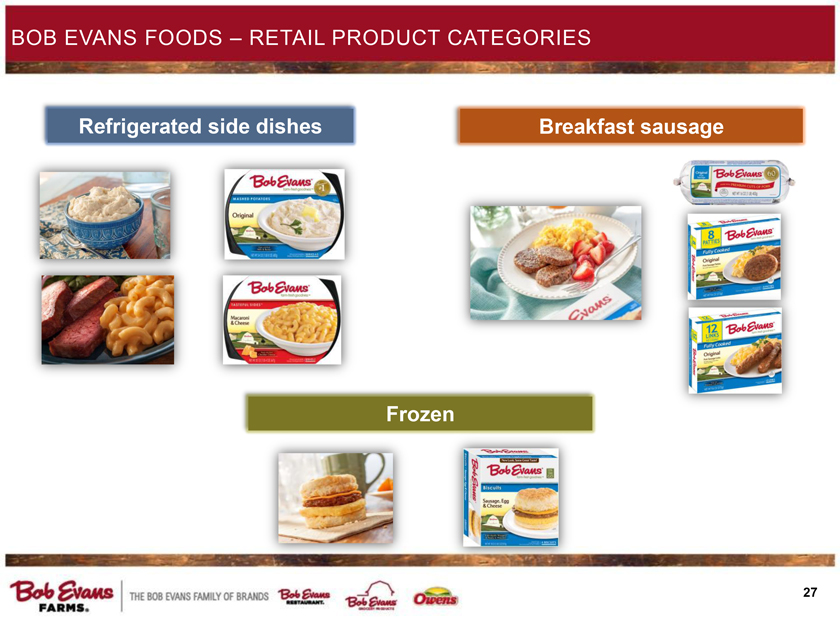
BOB EVANS FOODS – RETAIL PRODUCT CATEGORIES
Refrigerated side dishes
Breakfast sausage
Frozen
27
|
|
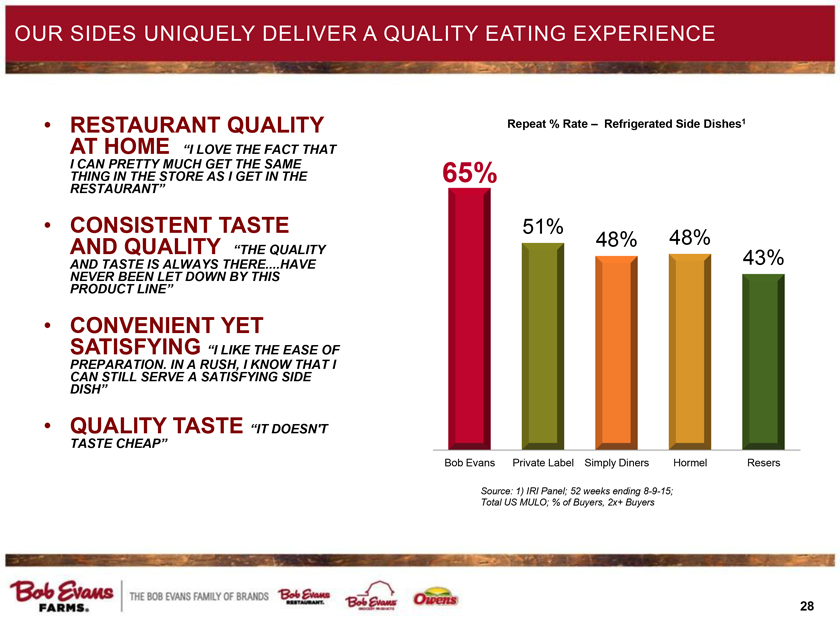
OUR SIDES UNIQUELY DELIVER A QUALITY EATING EXPERIENCE
•RESTAURANT QUALITY AT HOME “I LOVE THE FACT THAT I CAN PRETTY MUCH GET THE SAME THING IN THE STORE AS I GET IN THE RESTAURANT”
•CONSISTENT TASTE AND QUALITY “THE QUALITY AND TASTE IS ALWAYS THERE....HAVE NEVER BEEN LET DOWN BY THIS PRODUCT LINE”
•CONVENIENT YET SATISFYING “I LIKE THE EASE OF PREPARATION. IN A RUSH, I KNOW THAT I CAN STILL SERVE A SATISFYING SIDE DISH”
•QUALITY TASTE “IT DOESN’T TASTE CHEAP”
Repeat % Rate – Refrigerated Side Dishes1
65%
51%
48%
48% 43% Bob Evans
Private Label
Simply Diners Hormel Resers
Source: 1) IRI Panel; 52 weeks ending 8-9-15; Total US MULO; % of Buyers, 2x+ Buyers
28
|
|
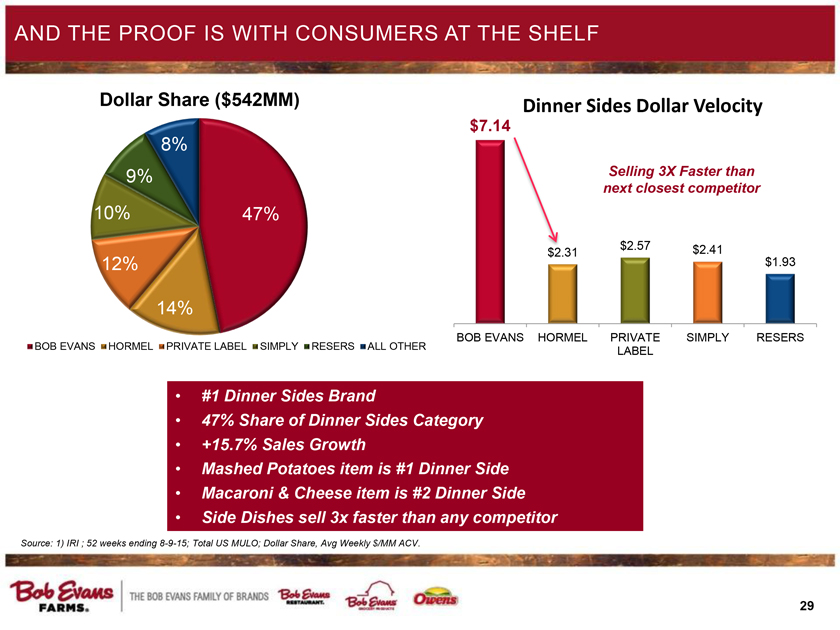
AND THE PROOF IS WITH CONSUMERS AT THE SHELF
Dinner Sides Dollar Velocity 47% 14% 12% 10% 9% 8% BOB EVANS HORMEL PRIVATE LABEL SIMPLY RESERS ALL OTHER Dollar Share ($542MM) • #1 Dinner Sides Brand • 47% Share of Dinner Sides Category • +15.7% Sales Growth • Mashed Potatoes item is #1 Dinner Side • Macaroni & Cheese item is #2 Dinner Side • Side Dishes sell 3x faster than any competitor Source: 1) IRI ; 52 weeks ending 8-9-15; Total US MULO; Dollar Share, Avg Weekly $/MM ACV. $7.14 $2.31 $2.57 $2.41 $1.93 BOB EVANS HORMEL PRIVATE LABEL SIMPLY RESERS Selling 3X Faster than next closest competitor
29
|
|
Appendix
30
|
|
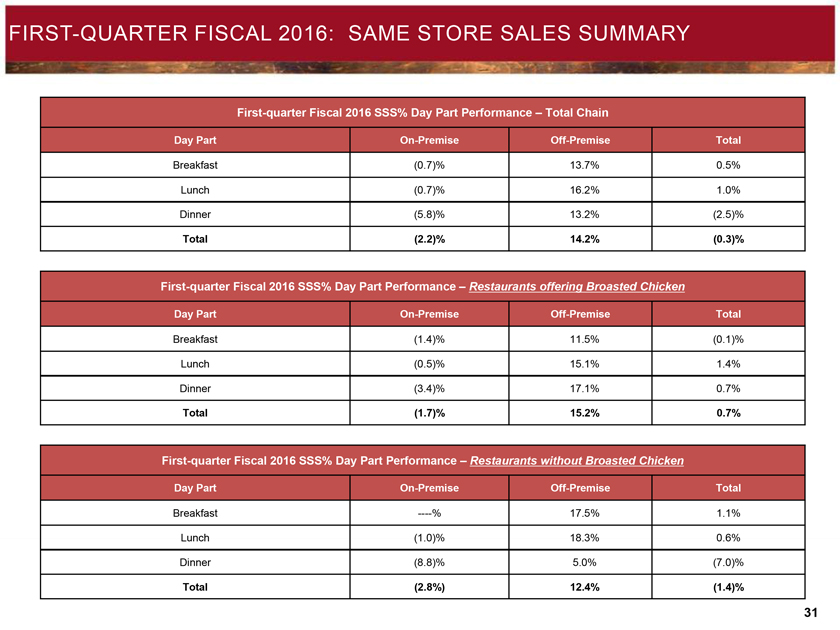
FIRST-QUARTER FISCAL 2016: SAME STORE SALES SUMMARY
First-quarter Fiscal 2016 SSS% Day Part Performance – Total Chain
Day Part
On-Premise
Off-Premise
Total
Breakfast
(0.7)%
13.7%
0.5%
Lunch
(0.7)%
16.2%
1.0%
Dinner
(5.8)%
13.2%
(2.5)%
Total
(2.2)%
14.2%
(0.3)%
First-quarter Fiscal 2016 SSS% Day Part Performance – Restaurants offering Broasted Chicken
Day Part
On-Premise
Off-Premise
Total
Breakfast
(1.4)%
11.5%
(0.1)%
Lunch
(0.5)%
15.1%
1.4%
Dinner
(3.4)%
17.1%
0.7%
Total
(1.7)%
15.2%
0.7%
First-quarter Fiscal 2016 SSS% Day Part Performance – Restaurants without Broasted Chicken
Day Part
On-Premise
Off-Premise
Total
Breakfast
----%
17.5%
1.1%
Lunch
(1.0)%
18.3%
0.6%
Dinner
(8.8)%
5.0%
(7.0)%
Total
(2.8%)
12.4%
(1.4)%
31
|
|
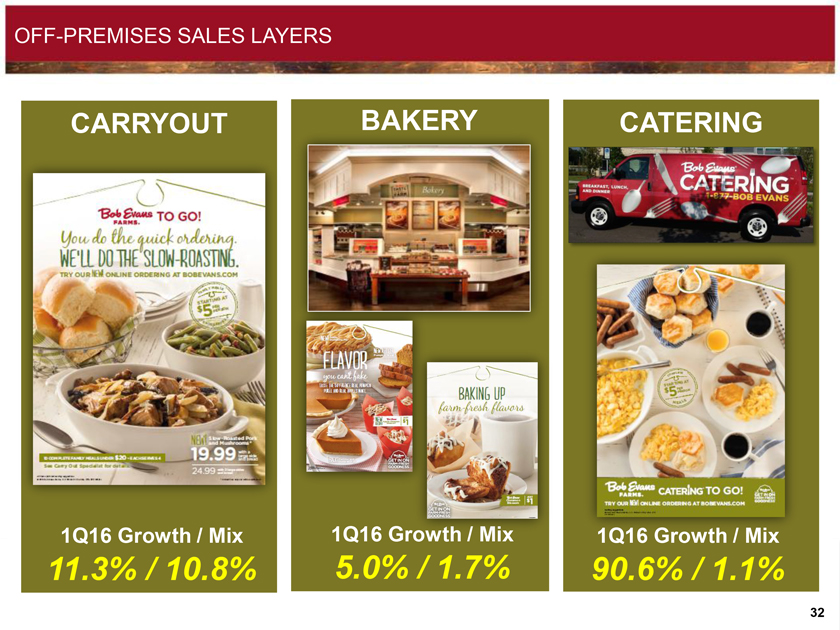
OFF-PREMISES SALES LAYERS
CARRYOUT
BAKERY
CATERING
1Q16 Growth / Mix
11.3% / 10.8%
1Q16 Growth / Mix
5.0% / 1.7%
1Q16 Growth / Mix
90.6% / 1.1%
32
|
|
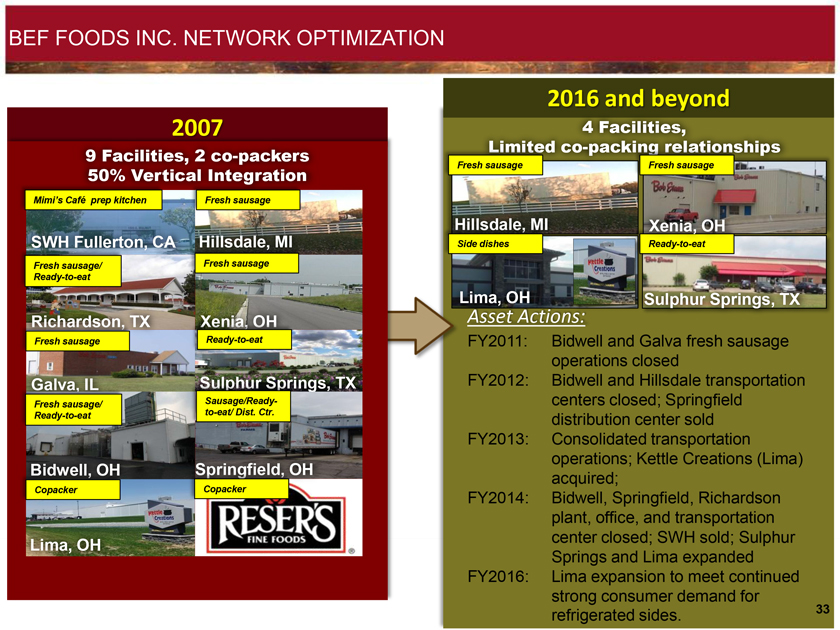
BEF FOODS INC. NETWORK OPTIMIZATION
2007
9 Facilities, 2 co-packers
50% Vertical Integration
2016 and beyond
4 Facilities,
Limited co-packing relationships
Asset Actions:
FY2011: Bidwell and Galva fresh sausage operations closed
FY2012: Bidwell and Hillsdale transportation centers closed; Springfield distribution center sold
FY2013: Consolidated transportation operations; Kettle Creations (Lima) acquired;
FY2014: Bidwell, Springfield, Richardson plant, office, and transportation center closed; SWH sold; Sulphur Springs and Lima expanded
FY2016: Lima expansion to meet continued strong consumer demand for refrigerated sides.
33
|
|
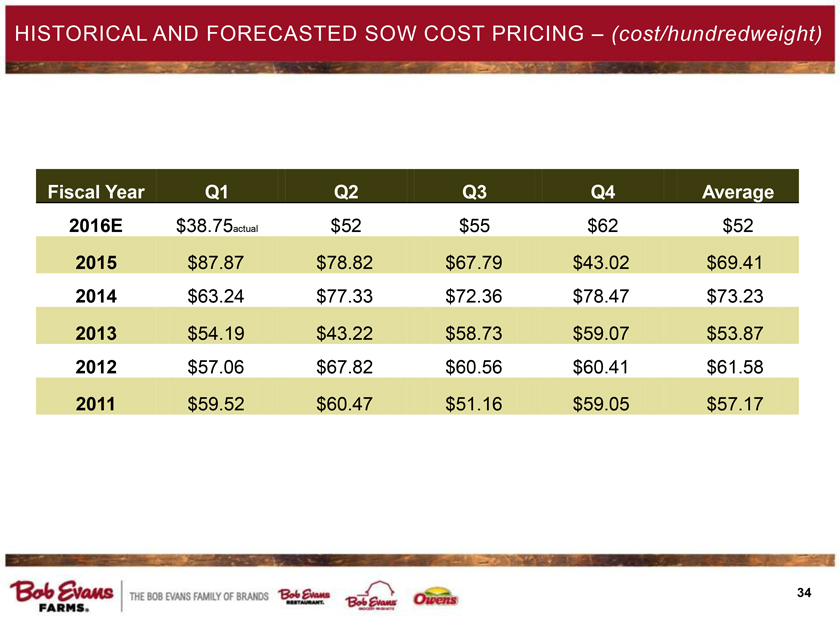
HISTORICAL AND FORECASTED SOW COST PRICING – (cost/hundredweight)
Fiscal Year
Q1
Q2
Q3
Q4
Average
2016E
$38.75actual
$52
$55
$62
$52
2015
$87.87
$78.82
$67.79
$43.02
$69.41
2014
$63.24
$77.33
$72.36
$78.47
$73.23
2013
$54.19
$43.22
$58.73
$59.07
$53.87
2012
$57.06
$67.82
$60.56
$60.41
$61.58
2011
$59.52
$60.47
$51.16
$59.05
$57.17
34
|
|
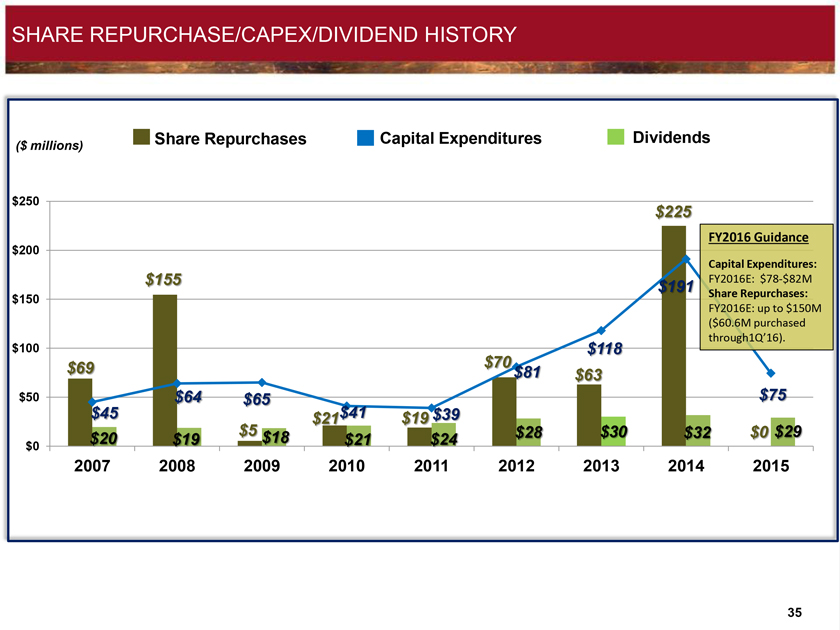
SHARE REPURCHASE/CAPEX/DIVIDEND HISTORY
Share Repurchases Capital Expenditures Dividends
($ millions)
$250
$225
FY2016 Guidance $200
Capital Expenditures: $155 $191 FY2016E: $78-$82M $150 Share Repurchases:
FY2016E: up to $150M
($60.6M purchased $100 through1Q’16).
$118
$69 $70
$81 $63
$50 $64 $65 $75
$45 $41 $19 $39
$5 $18 $28 $30 $32 $0 $29
$20 $19 $21 $24
$0
2007 2008 2009 2010 2011 2012 2013 2014 2015
35
|
|
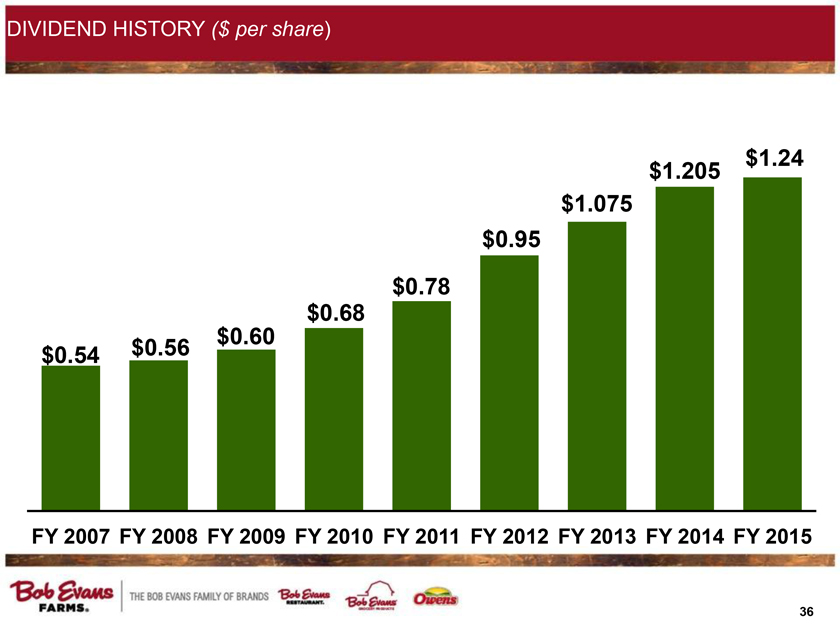
DIVIDEND HISTORY ($ per share)
$1.24
$1.205
$1.075
$0.95
$0.78
$0.68
$0.60
$0.54 $0.56
FY 2007 FY 2008 FY 2009 FY 2010 FY 2011 FY 2012 FY 2013 FY 2014 FY 2015
36
|
|
GAAP TO NON-GAAP RECONCILIATION: 1Q FISCAL 2016
37
|
|
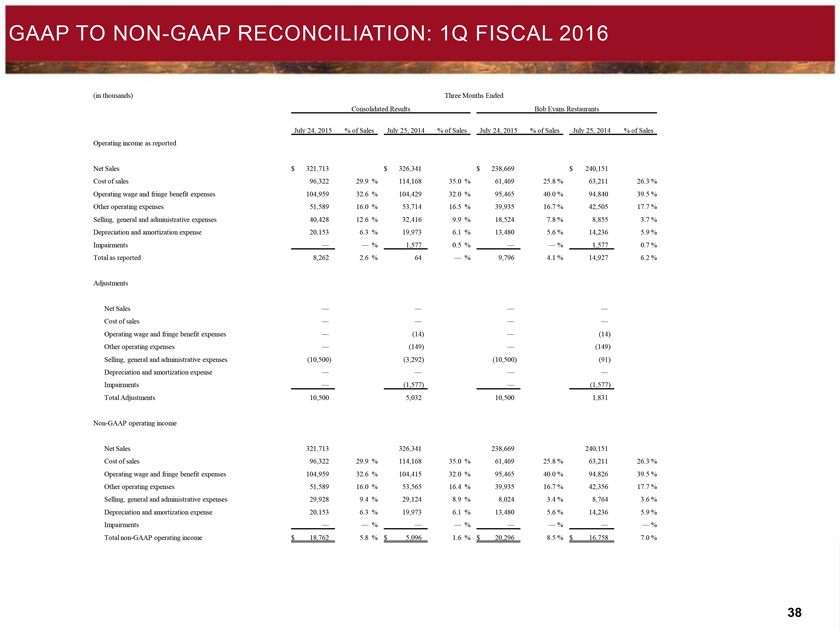
GAAP TO NON-GAAP RECONCILIATION: 1Q FISCAL 2016
(in thousands)
Three Months Ended
Consolidated Results
Bob Evans Restaurants
July 24, 2015
% of Sales
July 25, 2014
% of Sales
July 24, 2015
% of Sales
July 25, 2014
% of Sales
Operating income as reported
Net Sales
$ 321,713
$ 326,341
$ 238,669
$ 240,151
Cost of sales
96,322
29.9
%
114,168
35.0
%
61,469
25.8
%
63,211
26.3
%
Operating wage and fringe benefit expenses
104,959
32.6
%
104,429
32.0
%
95,465
40.0
%
94,840
39.5
%
Other operating expenses
51,589
16.0
%
53,714
16.5
%
39,935
16.7
%
42,505
17.7
%
Selling, general and administrative expenses
40,428
12.6
%
32,416
9.9
%
18,524
7.8
%
8,855
3.7
%
Depreciation and amortization expense
20,153
6.3
%
19,973
6.1
%
13,480
5.6
%
14,236
5.9
%
Impairments
—
—
%
1,577
0.5
%
—
—
%
1,577
0.7
%
Total as reported
8,262
2.6
%
64
—
%
9,796
4.1
%
14,927
6.2
%
Adjustments
Net Sales
—
—
—
—
Cost of sales
—
—
—
—
Operating wage and fringe benefit expenses
—
| (14) |
|
—
| (14) |
|
Other operating expenses
—
(149)
—
(149)
Selling, general and administrative expenses
(10,500)
(3,292)
(10,500)
| (91) |
|
Depreciation and amortization expense
—
—
—
—
Impairments
—
(1,577)
—
(1,577)
Total Adjustments
10,500
5,032
10,500
1,831
Non-GAAP operating income
Net Sales
321,713
326,341
238,669
240,151
Cost of sales
96,322
29.9
%
114,168
35.0
%
61,469
25.8
%
63,211
26.3
%
Operating wage and fringe benefit expenses
104,959
32.6
%
104,415
32.0
%
95,465
40.0
%
94,826
39.5
%
Other operating expenses
51,589
16.0
%
53,565
16.4
%
39,935
16.7
%
42,356
17.7
%
Selling, general and administrative expenses
29,928
9.4
%
29,124
8.9
%
8,024
3.4
%
8,764
3.6
%
Depreciation and amortization expense
20,153
6.3
%
19,973
6.1
%
13,480
5.6
%
14,236
5.9
%
Impairments
—
—
%
—
—
%
—
—
%
—
—
%
Total non-GAAP operating income
$
18,762
5.8
%
$
5,096
1.6
%
$
20,296
8.5
%
$
16,758
7.0%
38
|
|
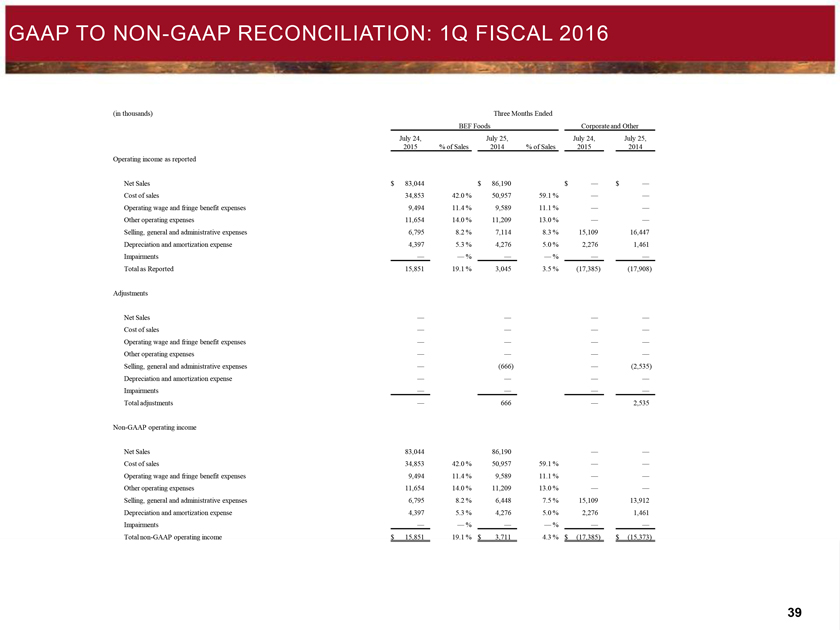
GAAP TO NON-GAAP RECONCILIATION: 1Q FISCAL 2016
(in thousands)
Three Months Ended
BEF Foods
Corporate and Other
July 24, 2015
% of Sales
July 25, 2014
% of Sales
July 24, 2015
July 25, 2014
Operating income as reported
Net Sales
Cost of sales
Operating wage and fringe benefit expenses
Other operating expenses
Selling, general and administrative expenses
Depreciation and amortization expense
Impairments
Total as Reported
Adjustments
Net Sales
Cost of sales
Operating wage and fringe benefit expenses
Other operating expenses
Selling, general and administrative expenses
Depreciation and amortization expense
Impairments
Total adjustments
Non-GAAP operating income
Net Sales
Cost of sales
Operating wage and fringe benefit expenses
Other operating expenses
Selling, general and administrative expenses
Depreciation and amortization expense
Impairments
Total non-GAAP operating income $
83,044
34,853
9,494
11,654
6,795
4,397
—
15,851
—
—
—
—
—
—
—
—
83,044
34,853
9,494
11,654
6,795
4,397
—
$ 15,851
$ 86,190
$ —
$ —
42.0 %
50,957
59.1 %
—
—
11.4 %
9,589
11.1 %
—
—
14.0 %
11,209
13.0 %
—
—
8.2 %
7,114
8.3
%
15,109
16,447
5.3 %
4,276
5.0 %
2,276
1,461
— %
—
— %
—
—
19.1 %
3,045
3.5 %
(17,385)
(17,908)
—
—
—
—
—
—
—
—
—
—
—
—
(666)
—
(2,535)
—
—
—
—
—
—
666
—
2,535
86,190
—
—
42.0 %
50,957
59.1 %
—
—
11.4 %
9,589
11.1 %
—
—
14.0 %
11,209
13.0 %
—
—
8.2 %
6,448
7.5 %
15,109
13,912
5.3 %
4,276
5.0 %
2,276
1,461
— %
—
— %
—
—
19.1 %
$ 3,711
4.3 %
$ (17,385)
$ (15,373)
39
|
|
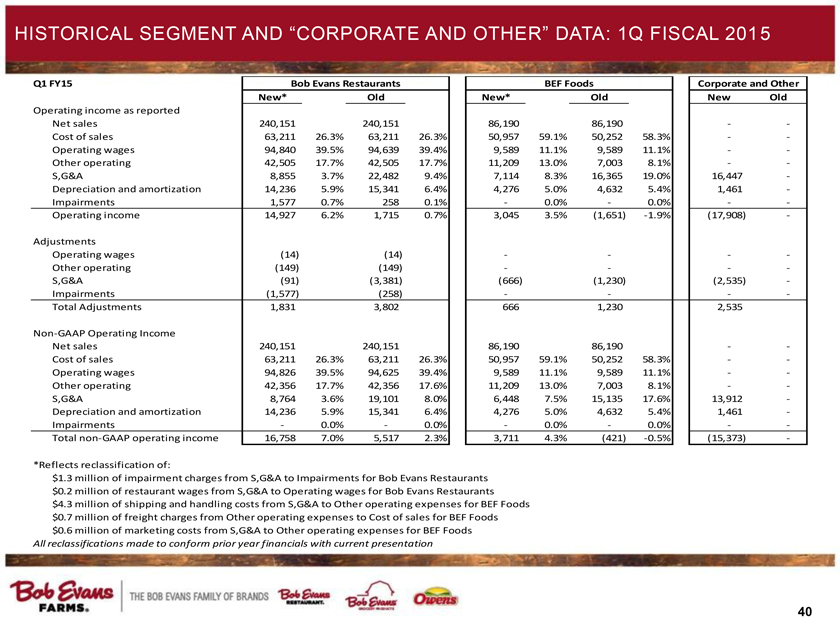
HISTORICAL SEGMENT AND “CORPORATE AND OTHER” DATA: 1Q FISCAL 201 5
Q1 FY15
Bob Evans Restaurants BEF Foods Corporate and Other New* Old New* Old New
Old
Operating income as reported Net sales
240,151 240,151 86,19086,190 -
-
Cost of sales
63,211
26.3%
63,211
26.3%
50,957
59.1%
50,252
58.3%
-
-
Operating wages
94,840
39.5%
94,639
39.4%
9,589
11.1%
9,589
11.1%
-
-
Other operating
42,505
17.7%
42,505
17.7%
11,209
13.0%
7,003
8.1%
-
-
S,G&A
8,855
3.7%
22,482
9.4%
7,114
8.3%
16,365
19.0%
16,447
-
Depreciation and amortization
14,236
5.9%
15,341
6.4%
4,276
5.0%
4,632
5.4%
1,461
-
Impairments
1,577
0.7%
258
0.1%
-
0.0%
-
0.0%
-
-
Operating income
14,927
6.2%
1,715
0.7%
3,045
3.5%
(1,651)
-1.9%
(17,908)
-
Adjustments Operating wages
(14) (14)
- - -
-
Other operating
(149) (149)
- - -
-
S,G&A
(91) (3,381) (666) (1,230) (2,535)
-
Impairments
(1,577) (258)
- - -
-
Total Adjustments
1,831 3,802 666 1,230 2,535 Non-GAAP Operating Income Net sales
240,151 240,151 86,190 86,190 -
-
Cost of sales
63,211
26.3%
63,211
26.3%
50,957
59.1%
50,252
58.3%
-
-
Operating wages
94,826
39.5%
94,625
39.4%
9,589
11.1%
9,589
11.1%
-
-
Other operating
42,356
17.7%
42,356
17.6%
11,209
13.0%
7,003
8.1%
-
-
S,G&A
8,764
3.6%
19,101
8.0%
6,448
7.5%
15,135
17.6%
13,912
-
Depreciation and amortization
14,236
5.9%
15,341
6.4%
4,276
5.0%
4,632
5.4%
1,461
-
Impairments
-
0.0%
-
0.0%
-
0.0%
-
0.0%
-
-
Total non-GAAP operating income
16,758
7.0%
5,517
2.3%
3,711
4.3%
(421)
-0.5%
(15,373)
-
*Reflects reclassification of: $1.3 million of impairment charges from S,G&A to Impairments for Bob Evans Restaurants $0.2 million of restaurant wages from S,G&A to Operating wages for Bob Evans Restaurants $4.3 million of shipping and handling costs from S,G&A to Other operating expenses for BEF Foods $0.7 million of freight charges from Other operating expenses to Cost of sales for BEF Foods $0.6 million of marketing costs from S,G&A to Other operating expenses for BEF Foods
All reclassifications made to conform prior year financials with current presentation
40
|
|
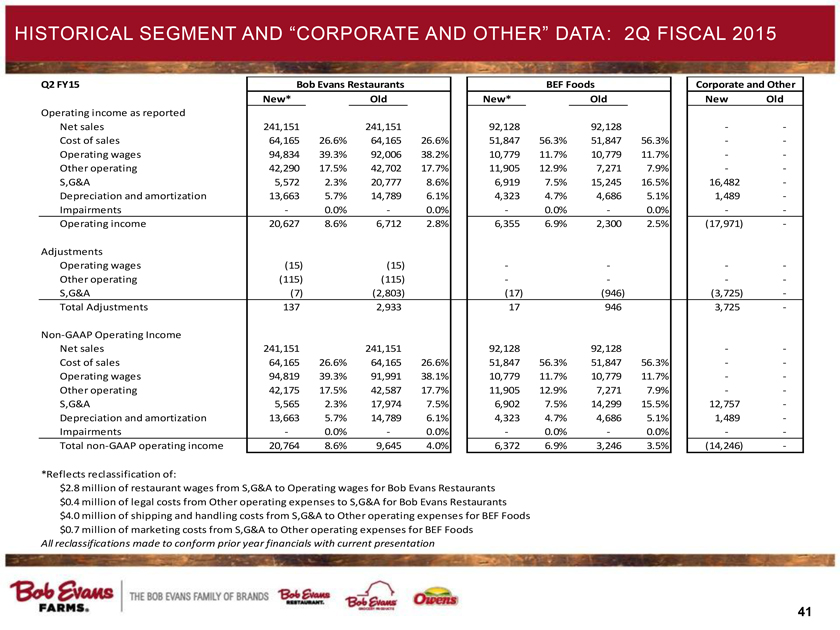
HISTORICAL SEGMENT AND “CORPORATE AND OTHER” DATA: 2Q FISCAL 2015
Q2 FY15
Bob Evans Restaurants BEF Foods Corporate and Other New* Old New* Old New
Old
Operating income as reported Net sales
241,151 241,151 92,128 92,128 -
-
Cost of sales
64,165
26.6%
64,165
26.6%
51,847
56.3%
51,847
56.3%
-
-
Operating wages
94,834
39.3%
92,006
38.2%
10,779
11.7%
10,779
11.7%
-
-
Other operating
42,290
17.5%
42,702
17.7%
11,905
12.9%
7,271
7.9%
-
-
S,G&A
5,572
2.3%
20,777
8.6%
6,919
7.5%
15,245
16.5%
16,482
-
Depreciation and amortization
13,663
5.7%
14,789
6.1%
4,323
4.7%
4,686
5.1%
1,489
-
Impairments
-
0.0%
-
0.0%
-
0.0%
-
0.0%
-
-
Operating income
20,627
8.6%
6,712
2.8%
6,355
6.9%
2,300
2.5%
(17,971)
-
Adjustments Operating wages
(15) (15) - - -
-
Other operating
(115) (115) - - -
-
S,G&A
(7) (2,803) (17) (946) (3,725)
-
Total Adjustments
137 2,933 17 946 3,725
-
Non-GAAP Operating Income Net sales
241,151 241,151 92,128 92,128 -
-
Cost of sales
64,165
26.6%
64,165
26.6%
51,847
56.3%
51,847
56.3%
-
-
Operating wages
94,819
39.3%
91,991
38.1%
10,779
11.7%
10,779
11.7%
-
-
Other operating
42,175
17.5%
42,587
17.7%
11,905
12.9%
7,271
7.9%
-
-
S,G&A
5,565
2.3%
17,974
7.5%
6,902
7.5%
14,299
15.5%
12,757
-
Depreciation and amortization
13,663
5.7%
14,789
6.1%
4,323
4.7%
4,686
5.1%
1,489
-
Impairments
-
0.0%
-
0.0%
-
0.0%
-
0.0%
-
-
Total non-GAAP operating income
20,764
8.6%
9,645
4.0%
6,372
6.9%
3,246
3.5%
(14,246)
- *Reflects reclassification of: $2.8 million of restaurant wages from S,G&A to Operating wages for Bob Evans Restaurants $0.4 million of legal costs from Other operating expenses to S,G&A for Bob Evans Restaurants $4.0 million of shipping and handling costs from S,G&A to Other operating expenses for BEF Foods $0.7 million of marketing costs from S,G&A to Other operating expenses for BEF Foods
All reclassifications made to conform prior year financials with current presentation
41
|
|
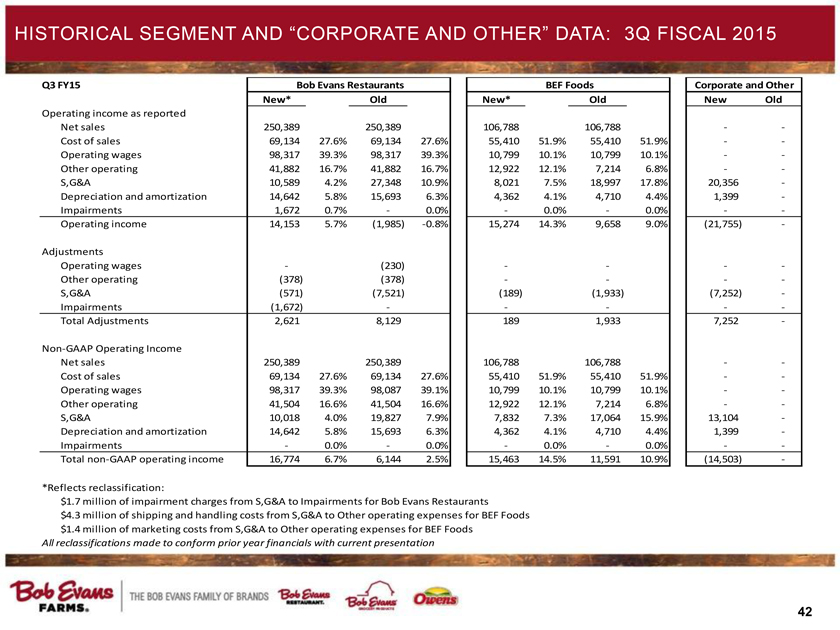
HISTORICAL SEGMENT AND “CORPORATE AND OTHER” DATA: 3Q FISCAL 2015
Q3 FY15
Bob Evans Restaurants BEF Foods Corporate and Other New* Old New* Old New
Old
Operating income as reported Net sales
250,389 250,389 106,788 106,788 -
-
Cost of sales
69,134
27.6%
69,134
27.6%
55,410
51.9%
55,410
51.9%
-
-
Operating wages
98,317
39.3%
98,317
39.3%
10,799
10.1%
10,799
10.1%
-
-
Other operating
41,882
16.7%
41,882
16.7%
12,922
12.1%
7,214
6.8%
-
-
S,G&A
10,589
4.2%
27,348
10.9%
8,021
7.5%
18,997
17.8%
20,356
-
Depreciation and amortization
14,642
5.8%
15,693
6.3%
4,362
4.1%
4,710
4.4%
1,399
-
Impairments
1,672
0.7%
-
0.0%
-
0.0%
-
0.0%
-
-
Operating income
14,153
5.7%
(1,985)
-0.8%
15,274
14.3%
9,658
9.0%
(21,755)
-
Adjustments Operating wages
- (230) - - -
-
Other operating
(378) (378) - - -
-
S,G&A
(571) (7,521) (189) (1,933) (7,252)
-
Impairments
(1,672) - - - -
-
Total Adjustments
2,621 8,129 1891,933 7,252
-
Non-GAAP Operating Income Net sales
250,389 250,389 106,788 106,788 -
-
Cost of sales
69,134
27.6%
69,134
27.6%
55,410
51.9%
55,410
51.9%
-
-
Operating wages
98,317
39.3%
98,087
39.1%
10,799
10.1%
10,799
10.1%
-
-
Other operating
41,504
16.6%
41,504
16.6%
12,922
12.1%
7,214
6.8%
-
-
S,G&A
10,018
4.0%
19,827
7.9%
7,832
7.3%
17,064
15.9%
13,104
-
Depreciation and amortization
14,642
5.8%
15,693
6.3%
4,362
4.1%
4,710
4.4%
1,399
-
Impairments
-
0.0%
-
0.0%
-
0.0%
-
0.0%
-
-
Total non-GAAP operating income
16,774
6.7%
6,144
2.5%
15,463
14.5%
11,591
10.9%
(14,503)
- *Reflects reclassification: $1.7 million of impairment charges from S,G&A to Impairments for Bob Evans Restaurants $4.3 million of shipping and handling costs from S,G&A to Other operating expenses for BEF Foods $1.4 million of marketing costs from S,G&A to Other operating expenses for BEF Foods
All reclassifications made to conform prior year financials with current presentation
42
|
|
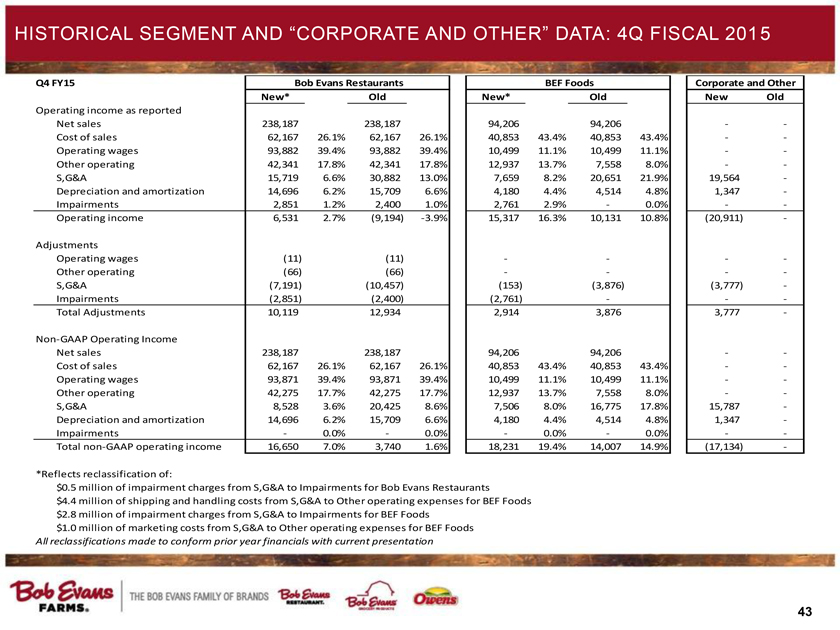
HISTORICAL SEGMENT AND “CORPORATE AND OTHER” DATA: 4Q FISCAL 201 5
Q4 FY15
Bob Evans Restaurants BEF Foods Corporate and Other New* Old New* Old New
Old
Operating income as reported Net sales
238,187 238,187 94,206 94,206 -
-
Cost of sales
62,167
26.1%
62,167
26.1%
40,853
43.4%
40,853
43.4%
-
-
Operating wages
93,882
39.4%
93,882
39.4%
10,499
11.1%
10,499
11.1%
-
-
Other operating
42,341
17.8%
42,341
17.8%
12,937
13.7%
7,558
8.0%
-
-
S,G&A
15,719
6.6%
30,882
13.0%
7,659
8.2%
20,651
21.9%
19,564
-
Depreciation and amortization
14,696
6.2%
15,709
6.6%
4,180
4.4%
4,514
4.8%
1,347
-
Impairments
2,851
1.2%
2,400
1.0%
2,761
2.9%
-
0.0%
-
-
Operating income
6,531
2.7%
(9,194)
-3.9%
15,317
16.3%
10,131
10.8%
(20,911)
-
Adjustments Operating wages
(11) (11)
- - -
-
Other operating
(66) (66)
- - -
-
S,G&A
(7,191)
(10,457)
(153)
(3,876)
(3,777)
-
Impairments
(2,851) (2,400) (2,761)
- -
-
Total Adjustments
10,119 12,934 2,914 3,876 3,777
-
Non-GAAP Operating Income Net sales
238,187 238,187 94,206 94,206 -
-
Cost of sales
62,167
26.1%
62,167
26.1%
40,853
43.4%
40,853
43.4%
-
-
Operating wages
93,871
39.4%
93,871
39.4%
10,499
11.1%
10,499
11.1%
-
-
Other operating
42,275
17.7%
42,275
17.7%
12,937
13.7%
7,558
8.0%
-
-
S,G&A
8,528
3.6%
20,425
8.6%
7,506
8.0%
16,775
17.8%
15,787
-
Depreciation and amortization
14,696
6.2%
15,709
6.6%
4,180
4.4%
4,514
4.8%
1,347
-
Impairments
-
0.0%
-
0.0%
-
0.0%
-
0.0%
-
-
Total non-GAAP operating income
16,650
7.0%
3,740
1.6%
18,231
19.4%
14,007
14.9%
(17,134)
-
*Reflects reclassification of: $0.5 million of impairment charges from S,G&A to Impairments for Bob Evans Restaurants $4.4 million of shipping and handling costs from S,G&A to Other operating expenses for BEF Foods $2.8 million of impairment charges from S,G&A to Impairments for BEF Foods $1.0 million of marketing costs from S,G&A to Other operating expenses for BEF Foods
All reclassifications made to conform prior year financials with current presentation
43
|
|
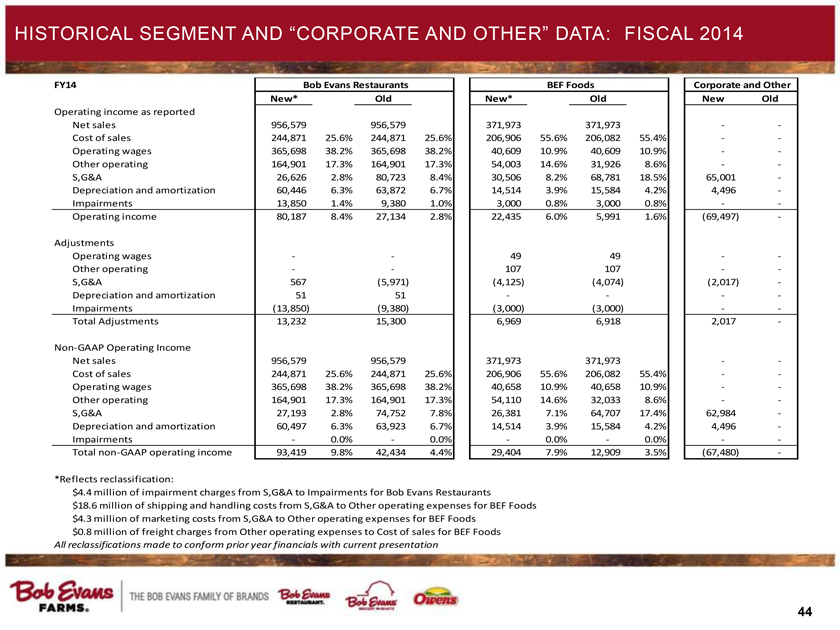
HISTORICAL SEGMENT AND “CORPORATE AND OTHER” DATA: FISCAL 2014
FY14
Bob Evans Restaurants BEF Foods Corporate and Other New* Old New* Old New
Old
Operating income as reported Net sales
956,579 956,579 371,973 371,973 -
-
Cost of sales
244,871
25.6%
244,871
25.6%
206,906
55.6%
206,082
55.4%
-
-
Operating wages
365,698
38.2%
365,698
38.2%
40,609
10.9%
40,609
10.9%
-
-
Other operating
164,901
17.3%
164,901
17.3%
54,003
14.6%
31,926
8.6%
-
-
S,G&A
26,626
2.8%
80,723
8.4%
30,506
8.2%
68,781
18.5%
65,001
-
Depreciation and amortization
60,446
6.3%
63,872
6.7%
14,514
3.9%
15,584
4.2%
4,496
-
Impairments
13,850
1.4%
9,380
1.0%
3,000
0.8%
3,000
0.8%
-
-
Operating income
80,187
8.4%
27,134
2.8%
22,435
6.0%
5,991
1.6%
(69,497)
-
Adjustments Operating wages
- -
4949
-
-
Other operating
--
107
107
-
-
S,G&A
567
(5,971)
(4,125)
(4,074)
(2,017)
-
Depreciation and amortization
5151
- - -
-
Impairments
(13,850)
(9,380)
(3,000)
(3,000)
-
-
Total Adjustments
13,232 15,300 6,969 6,918 2,017
-
Non-GAAP Operating Income Net sales
956,579 956,579 371,973 371,973 -
-
Cost of sales
244,871
25.6%
244,871
25.6%
206,906
55.6%
206,082
55.4%
-
-
Operating wages
365,698
38.2%
365,698
38.2%
40,658
10.9%
40,658
10.9%
-
-
Other operating
164,901
17.3%
164,901
17.3%
54,110
14.6%
32,033
8.6%
-
-
S,G&A
27,193
2.8%
74,752
7.8%
26,381
7.1%
64,707
17.4%
62,984
-
Depreciation and amortization
60,497
6.3%
63,923
6.7%
14,514
3.9%
15,584
4.2%
4,496
-
Impairments
-
0.0%
-
0.0%
-
0.0%
-
0.0%
-
-
Total non-GAAP operating income
93,419
9.8%
42,434
4.4%
29,404
7.9%
12,909
3.5%
(67,480)
-
*Reflects reclassification: $4.4 million of impairment charges from S,G&A to Impairments for Bob Evans Restaurants $18.6 million of shipping and handling costs from S,G&A to Other operating expenses for BEF Foods $4.3 million of marketing costs from S,G&A to Other operating expenses for BEF Foods $0.8 million of freight charges from Other operating expenses to Cost of sales for BEF Foods
All reclassifications made to conform prior year financials with current presentation
44
Serious News for Serious Traders! Try StreetInsider.com Premium Free!
You May Also Be Interested In
- Astellas' XTANDI™ (Enzalutamide) Granted European Commission Approval for Use in Additional Recurrent Early Prostate Cancer Treatment Setting
- Mirasol Resources Closes First Tranche of Private Placement
- Atomic Minerals to Proceed with Debt Settlement Transaction
Create E-mail Alert Related Categories
SEC FilingsSign up for StreetInsider Free!
Receive full access to all new and archived articles, unlimited portfolio tracking, e-mail alerts, custom newswires and RSS feeds - and more!
