

Form 8-K BOB EVANS FARMS INC For: Jun 24
 Tweet
Tweet Share
Share
UNITED STATES
SECURITIES AND EXCHANGE COMMISSION
Washington, D.C. 20549
FORM 8-K
CURRENT REPORT
PURSUANT TO SECTION 13 OR 15(D)
OF THE SECURITIES EXCHANGE ACT OF 1934
Date of Report (Date of earliest event reported): June 24, 2015 (June 24, 2015)
Bob Evans Farms, Inc.
(Exact name of registrant as specified in its charter)
| Delaware | 0-1667 | 31-4421866 | ||
| (State or other jurisdiction of incorporation) |
(Commission File No.) |
(I.R.S. Employer Identification No.) |
| 8111 Smith’s Mill Road, New Albany, Ohio | 43054 | |
| (Address of principal executive offices) | (Zip Code) |
Registrant’s telephone number, including area code: (614) 491-2225
Not applicable
(Former name or former address, if changed since last report)
Check the appropriate box below if the Form 8-K filing is intended to simultaneously satisfy the filing obligation of the registrant under any of the following provisions (see General Instruction A.2 below):
| ¨ | Written communications pursuant to Rule 425 under the Securities Act (17 CFR 230.425) |
| ¨ | Soliciting material pursuant to Rule 14a-12 under the Exchange Act (17 CFR 240.14a-12) |
| ¨ | Pre-commencement communications pursuant to Rule 14d-2(b) under the Exchange Act (17 CFR 240.14d-2b) |
| ¨ | Pre-commencement communications pursuant to Rule 13e-4(c) under the Exchange Act (17 CFR 240.13e-4c) |
| Item 8.01 | Other Events. |
On June 24, 2015, Bob Evans Farms, Inc. (the “Company”) issued an investor presentation (“Investor Presentation”). The Company’s Investor Presentation is available on its website at http://www.bobevans.com/investors/default.aspx and is also furnished as Exhibit 99.1 to this Current Report on Form 8-K. The Company’s reports on Forms 10-K, 10-Q and 8-K filed with the U.S. Securities and Exchange Commission (“SEC”), and other publicly available information, should be consulted for other important information about the Company.
The information included in the Investor Presentation includes financial information determined by methods other than in accordance with accounting principles generally accepted in the United States of America (“GAAP”). The Company’s management uses these non-GAAP measures in its analysis of the Company’s performance. The Company believes that the presentation of certain non-GAAP measures provides useful supplemental information that is essential to a proper understanding of the operating results of the Company’s core businesses. These non-GAAP disclosures should not be viewed as a substitute for operating results determined in accordance with GAAP, nor are they necessarily comparable to non-GAAP performance measures that may be presented by other companies. References as to the reconciliation of the non-GAAP information is included in the Investor Presentation furnished as Exhibit 99.1.
Some of the matters discussed in this Current Report on Form 8-K, including Exhibit 99.1, constitute forward-looking statements within the meaning of the “safe-harbor” provisions of the U.S. Private Securities Litigation Reform Act of 1995. These forward-looking statements include statements other than those made solely with respect to historical fact and are based on the intent, belief or current expectations of the Company and/or its management. The Company’s business and operations are subject to a variety of risks and uncertainties that might cause actual results to differ materially from those projected by any forward-looking statements. Factors that could cause such differences include, but are not limited to, the risk factors set forth in the Company’s filings with the SEC.
| Item 9.01 | Financial Statements and Exhibits. |
| (d) | Exhibits. |
| Exhibit Number |
Description | |
| 99.1 | Bob Evans Farms, Inc. Investor Presentation (6/24/15) | |
SIGNATURE
Pursuant to the requirements of the Securities Exchange Act of 1934, the registrant has duly caused this report to be signed on its behalf by the undersigned, hereunto duly authorized.
Date: June 24, 2015
| BOB EVANS FARMS, INC. | ||
| By: |
/s/ Kevin C. O’Neil | |
| Kevin C. O’Neil, Vice President, Assoc. General Counsel and Asst. Secretary | ||
EXHIBIT INDEX
| Exhibit Number |
Description | |
| 99.1 | Bob Evans Farms, Inc. Investor Presentation (6/24/15) | |
Exhibit 99.1
Investor Presentation
Oppenheimer 15th Annual Consumer Conference Boston, MA
June 24, 2015
Mark Hood, Chief Financial Officer and Co-Interim CEO Scott Taggart, VP, Investor Relations
Bob Evans
1
SAFE HARBOR STATEMENT
Certain statements in this presentation that are not historical facts are forward-looking statements. Forward-looking statements involve various important assumptions, risks and uncertainties. Actual results may differ materially from those predicted by the forward-looking statements because of various factors and possible events, including, without limitation:
Negative publicity or litigation regarding allegations of food-related illness,
Failure to achieve and maintain positive same-store sales,
Changing business conditions, including energy costs,
Overall macroeconomic conditions that may affect consumer spending, either nationwide or in one or more of the Company’s major markets
Competition in the restaurant and food products industries,
Ability to control restaurant operating costs, which are impacted by market changes in the cost or availability of labor and food, minimum wage and other employment laws, health care costs, fuel and utility costs,
Changes in the cost or availability of acceptable new restaurant sites,
Adverse weather conditions in locations where we operate our restaurants,
Consumer acceptance of changes in menu offerings, price, atmosphere and/or service procedures,
Consumer acceptance of our restaurant concepts in new geographic areas, and
Changes in hog and other commodity costs.
We also bear the risk of incorrectly analyzing these risks or developing strategies to address them that prove to be unsuccessful.
Certain risks, uncertainties and assumptions are discussed under the heading “Risk Factors” in Item 1A of our Annual Report on Form 10-K for the fiscal year ended April 24, 2015. We note these factors for investors as contemplated by the Private Securities Litigation Reform Act of 1995. It is impossible to predict or identify all such risk factors. Consequently, you should not consider any such list to be a complete set of all potential risks and uncertainties. Forward-looking statements speak only as of the date on which they are made, and we undertake no obligation to update any forward-looking statement to reflect circumstances or events that occur after the date on which the statement is made to reflect unanticipated events. Any further disclosures in our filings with the Securities and Exchange Commission should also be consulted. All subsequent written and oral forward-looking statements attributable to us or any person acting on behalf of the company are qualified by the cautionary statements in this section.
THE BOB EVANS FAMILY OF BRANDS
BOB EVANS FARMS
2
Bob Evans FARMS
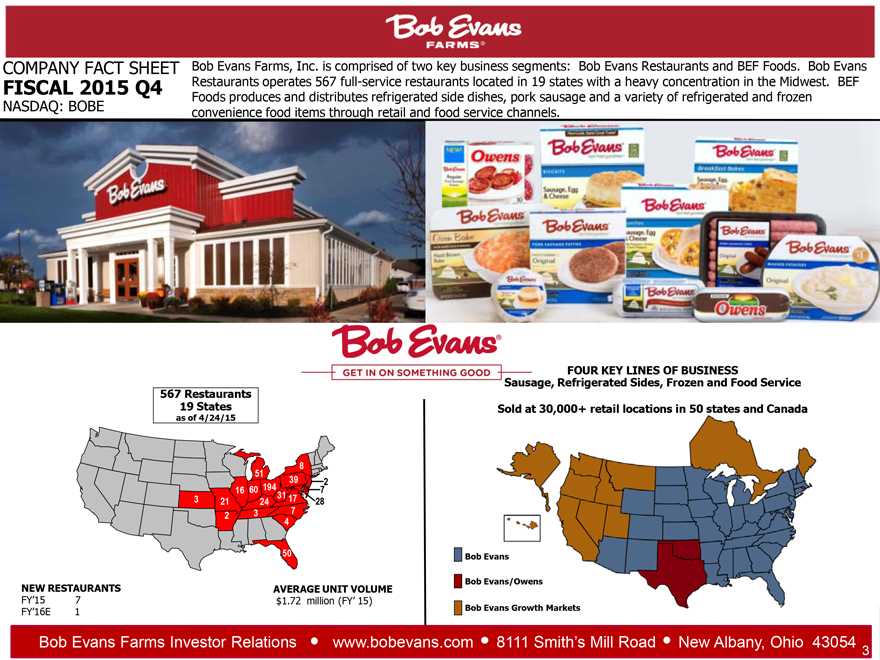
COMPANY FACT SHEET
FISCAL 2015 Q4
NASDAQ: BOBE
Bob Evans Farms, Inc. is comprised of two key business segments: Bob Evans Restaurants and BEF Foods. Bob Evans Restaurants operates 567 full-service restaurants located in 19 states with a heavy concentration in the Midwest. BEF Foods produces and distributes refrigerated side dishes, pork sausage and a variety of refrigerated and frozen convenience food items through retail and food service channels.
Bob Evans
GET IN ON SOMETHING GOOD
567 Restaurants
19 States as of 4/24/15
NEW RESTAURANTS
FY’15 7
FY’16E 1
AVERAGE UNIT VOLUME
$1.72 million (FY’ 15)
FOUR KEY LINES OF BUSINESS
Sausage, Refrigerated Sides, Frozen and Food Service
Sold at 30,000+ retail locations in 50 states and Canada
Bob Evans
Bob Evans/Owens
Bob Evans Growth Markets
Bob Evans Farms Investor Relations
www.bobevans.com
8111 Smith’s Mill Road
New Albany, Ohio 43054
3
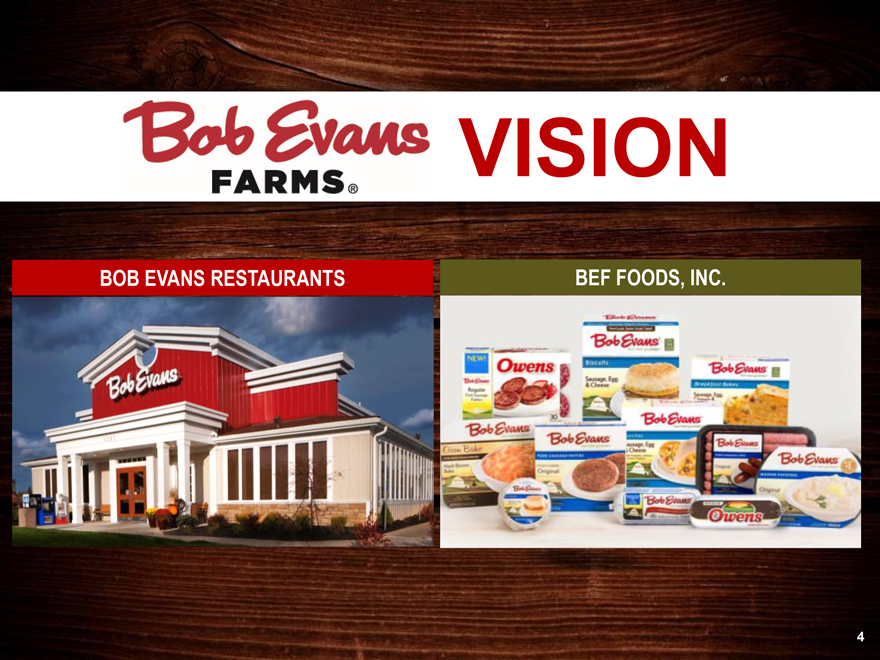
BOB EVANS FARMS
VISION
BOB EVANS RESTAURANTS
BEF FOODS, INC.
4
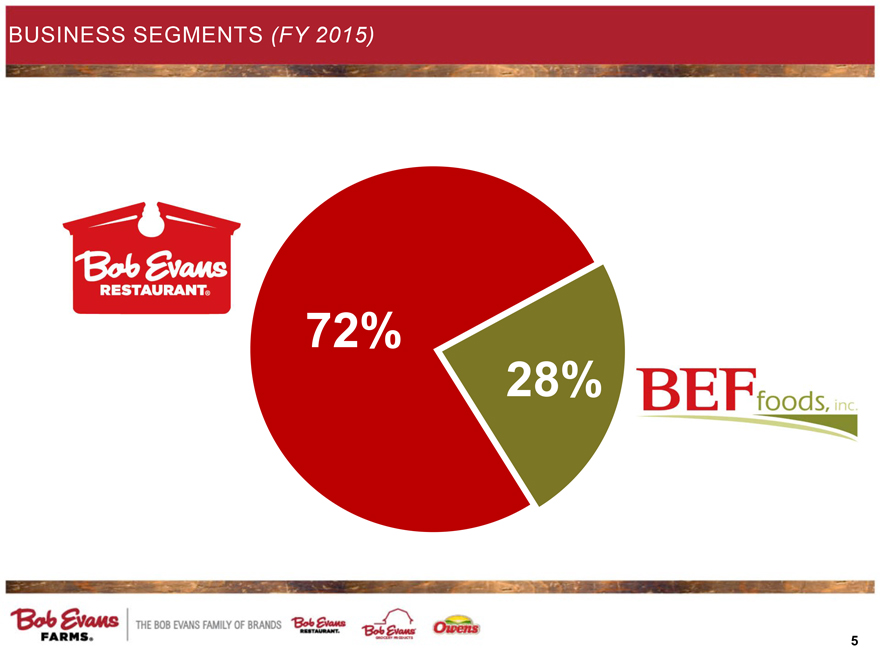
BUSINESS SEGMENTS (FY 2015)
Bob Evans RESTAURANT
72%
28%
BEF foods, inc.
Bob Evans FARMS
THE BOB EVANS FAMILY OF BRANDS
5
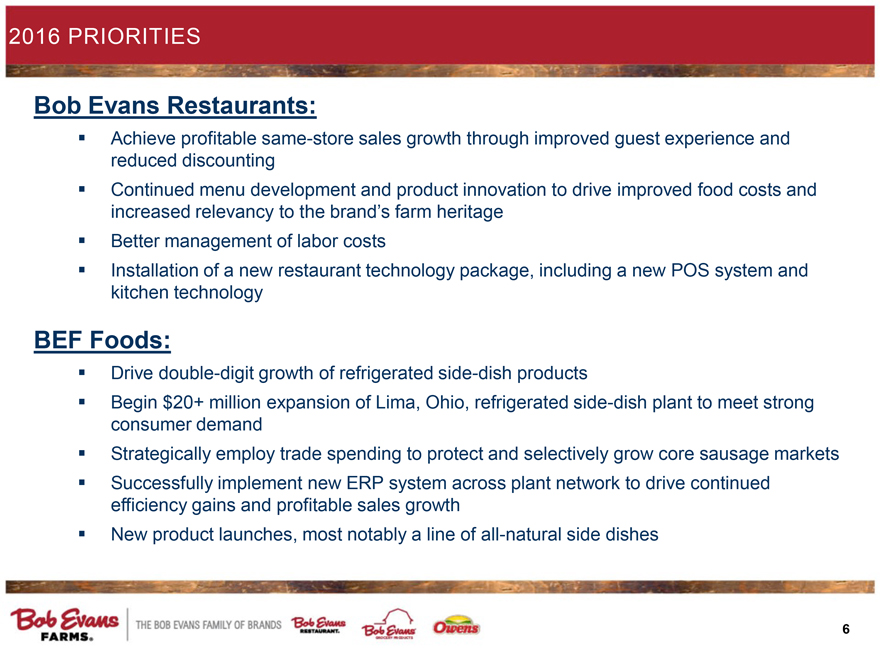
2016 PRIORITIES
Bob Evans Restaurants:
Achieve profitable same-store sales growth through improved guest experience and reduced discounting
Continued menu development and product innovation to drive improved food costs and increased relevancy to the brand’s farm heritage
Better management of labor costs
Installation of a new restaurant technology package, including a new POS system and kitchen technology
BEF Foods:
Drive double-digit growth of refrigerated side-dish products
Begin $20+ million expansion of Lima, Ohio, refrigerated side-dish plant to meet strong consumer demand
Strategically employ trade spending to protect and selectively grow core sausage markets
Successfully implement new ERP system across plant network to drive continued efficiency gains and profitable sales growth
New product launches, most notably a line of all-natural side dishes
Bob Evans FARMS
THE BOB EVANS FAMILY OF BRANDS
6
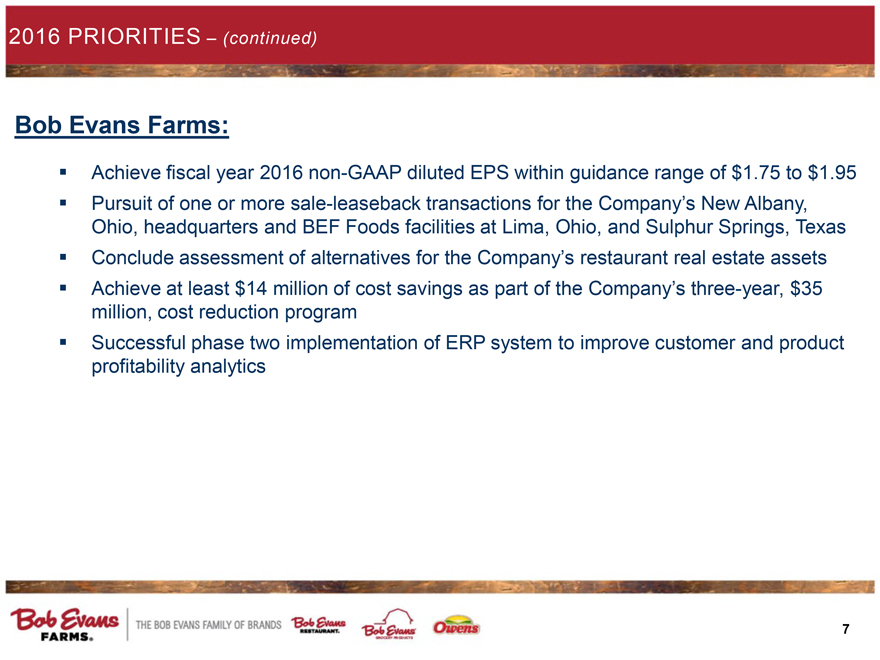
2016 PRIORITIES – (continued)
Bob Evans Farms:
Achieve fiscal year 2016 non-GAAP diluted EPS within guidance range of $1.75 to $1.95
Pursuit of one or more sale-leaseback transactions for the Company’s New Albany, Ohio, headquarters and BEF Foods facilities at Lima, Ohio, and Sulphur Springs, Texas
Conclude assessment of alternatives for the Company’s restaurant real estate assets
Achieve at least $14 million of cost savings as part of the Company’s three-year, $35 million, cost reduction program
Successful phase two implementation of ERP system to improve customer and product profitability analytics
Bob Evans FARMS
THE BOB EVANS FAMILY OF BRANDS
7
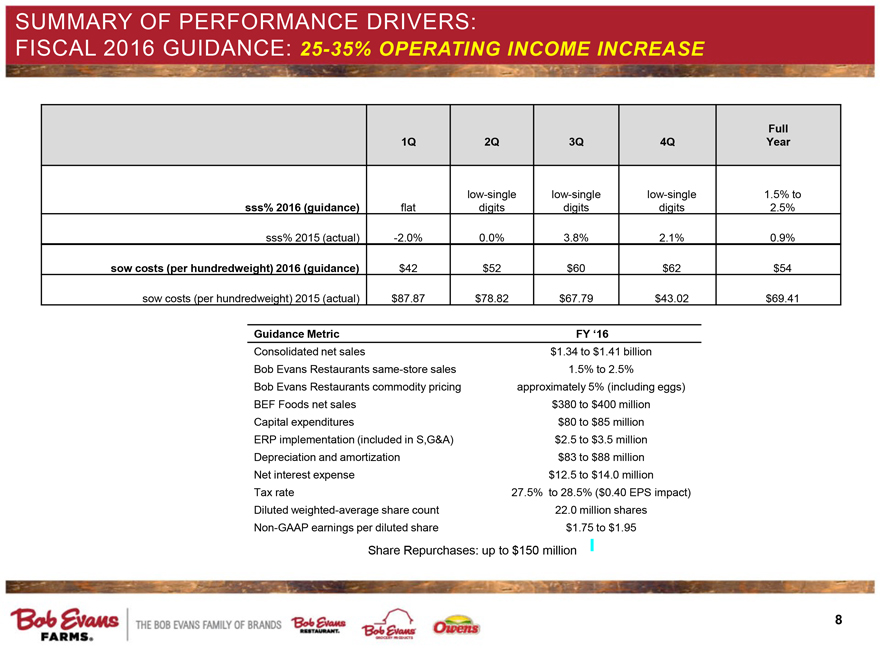
SUMMARY OF PERFORMANCE DRIVERS:
FISCAL 2016 GUIDANCE: 25-35% OPERATING INCOME INCREASE
1Q 2Q 3Q 4Q Full Year
low-single low-single low-single 1.5% to
sss% 2016 (guidance) flat digits digits digits 2.5%
sss% 2015 (actual) -2.0% 0.0% 3.8% 2.1% 0.9%
sow costs (per hundredweight) 2016 (guidance) $42 $52 $60 $62 $54
sow costs (per hundredweight) 2015 (actual) $87.87 $78.82 $67.79 $43.02 $69.41
Guidance Metric FY ‘16
Consolidated net sales $1.34 to $1.41 billion
Bob Evans Restaurants same-store sales 1.5% to 2.5%
Bob Evans Restaurants commodity pricing approximately 5% (including eggs)
BEF Foods net sales $380 to $400 million
Capital expenditures $80 to $85 million
ERP implementation (included in S,G&A) $2.5 to $3.5 million
Depreciation and amortization $83 to $88 million
Net interest expense $12.5 to $14.0 million
Tax rate 27.5% to 28.5% ($0.40 EPS impact)
Diluted weighted-average share count 22.0 million shares
Non-GAAP earnings per diluted share $1.75 to $1.95
Share Repurchases: up to $150 million
Bob Evans FARMS
THE BOB EVANS FAMILY OF BRANDS
8
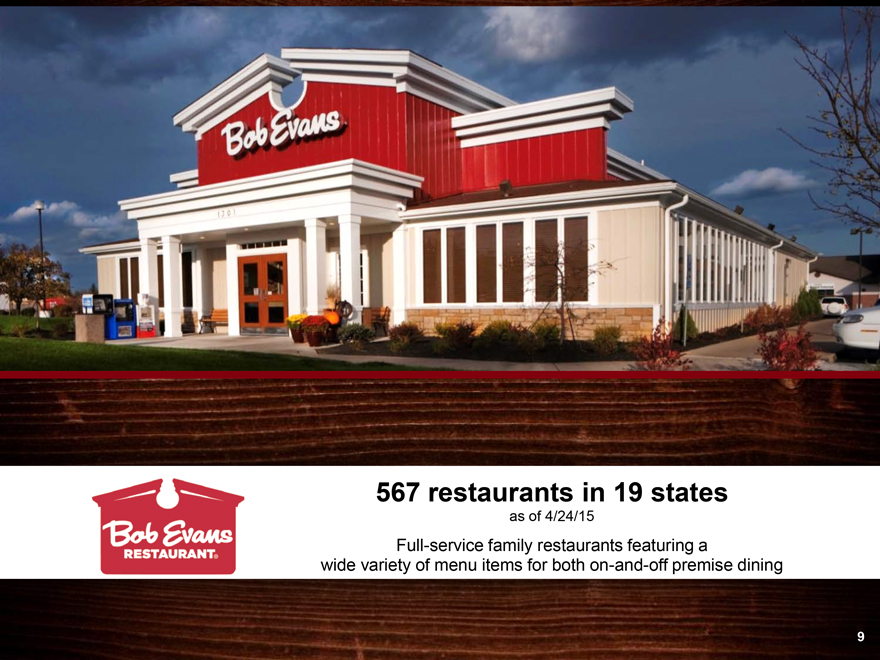
BOB EVANS RESTAURANT
567 restaurants in 19 states
as of 4/24/15
Full-service family restaurants featuring a wide variety of menu items for both on-and-off premise dining
9
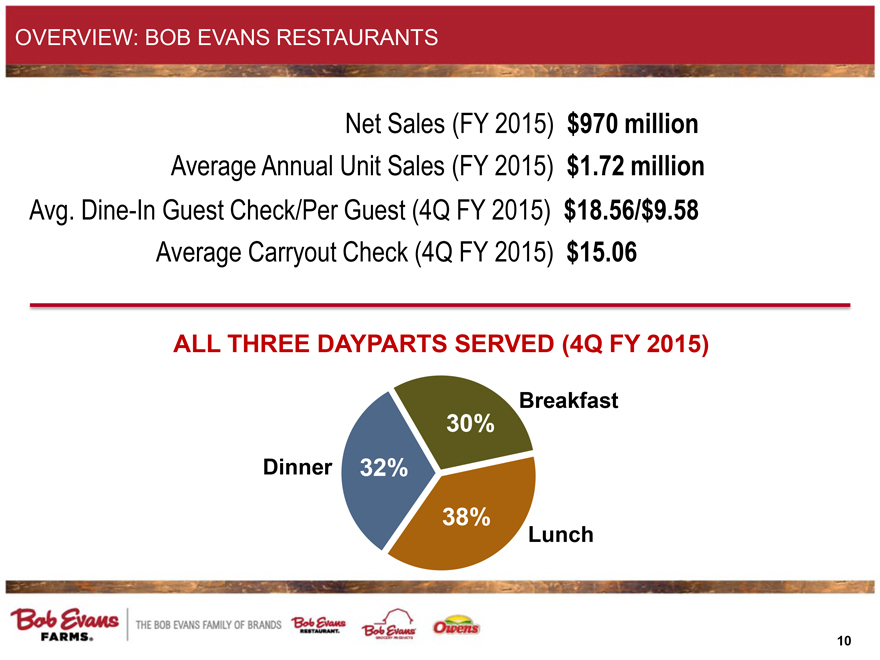
OVERVIEW: BOB EVANS RESTAURANTS
Net Sales (FY 2015) $970 million
Average Annual Unit Sales (FY 2015) $1.72 million
Avg. Dine-In Guest Check/Per Guest (4Q FY 2015) $18.56/$9.58
Average Carryout Check (4Q FY 2015) $15.06
ALL THREE DAYPARTS SERVED (4Q FY 2015)
Dinner
32%
30%
38%
Breakfast
Lunch
Bob Evans FARMS
THE BOB EVANS FAMILY OF BRANDS
10
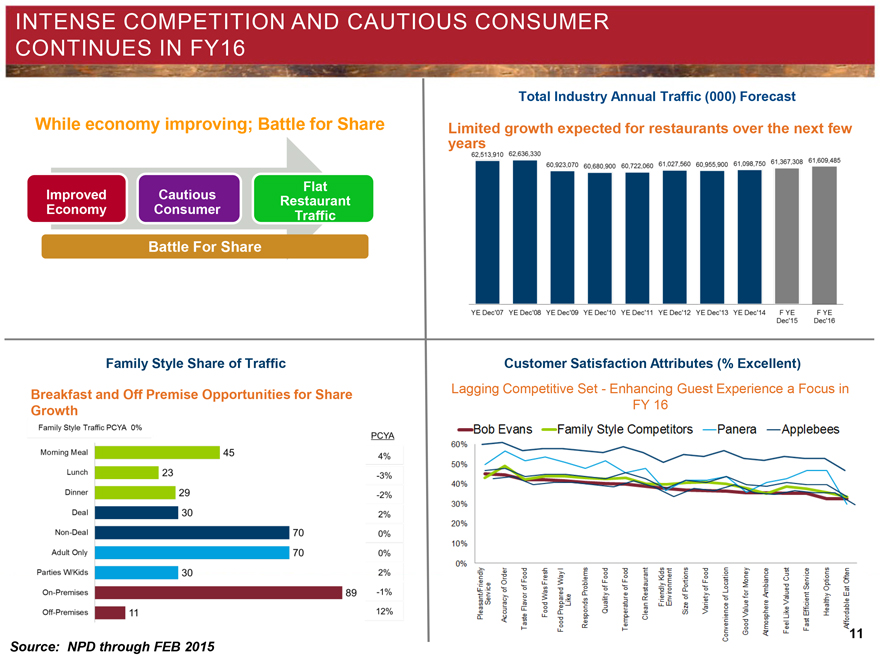
INTENSE COMPETITION AND CAUTIOUS CONSUMER CONTINUES IN FY16
While economy improving; Battle for Share
Improved Economy
Cautious Consumer
Flat Restaurant Traffic
Battle For Share
Family Style Share of Traffic
Breakfast and Off Premise Opportunities for Share Growth
Family Style Traffic PCYA 0%
PCYA
Morning Meal 45 4%
Lunch 23 -3%
Dinner 29 -2%
Deal 30 2%
Non-Deal 70 0%
Adult Only 70 0%
Parties W/Kids 30 2%
On-Premises 89 -1%
Off-Premises 11 12%
Total Industry Annual Traffic (000) Forecast
Limited growth expected for restaurants over the next few years
62,513,910 62,636,330 60,923,070 60,680,900 60,722,060 61,027,560 60,955,900 61,098,750 61,367,308 61,609,485
YE Dec’07 YE Dec’08 YE Dec’09 YE Dec’10 YE Dec’11 YE Dec’12 YE Dec’13 YE Dec’14 F YE Dec’15 F YE Dec’16
Customer Satisfaction Attributes (% Excellent)
Lagging Competitive Set - Enhancing Guest Experience a Focus in FY 16
Bob Evans Family Style Competitors Panera Applebees
60%
50%
40%
30%
20%
10%
0%
Pleasant/Friendly Service Accuracy of Order Taste Flavor of Food Food Was Fresh Food Prepared Way I Like Responds Problems Quality of Food Temperature of Food Clean Restaurant Friendly Kids Environment Size of Portions Variety of Food Convenience of Location Good Value for Money Atmosphere Ambiance Feel Like Valued Cust Fast Efficient Service Healthy Options Affordable Eat Often
Source: NPD through FEB 2015
11
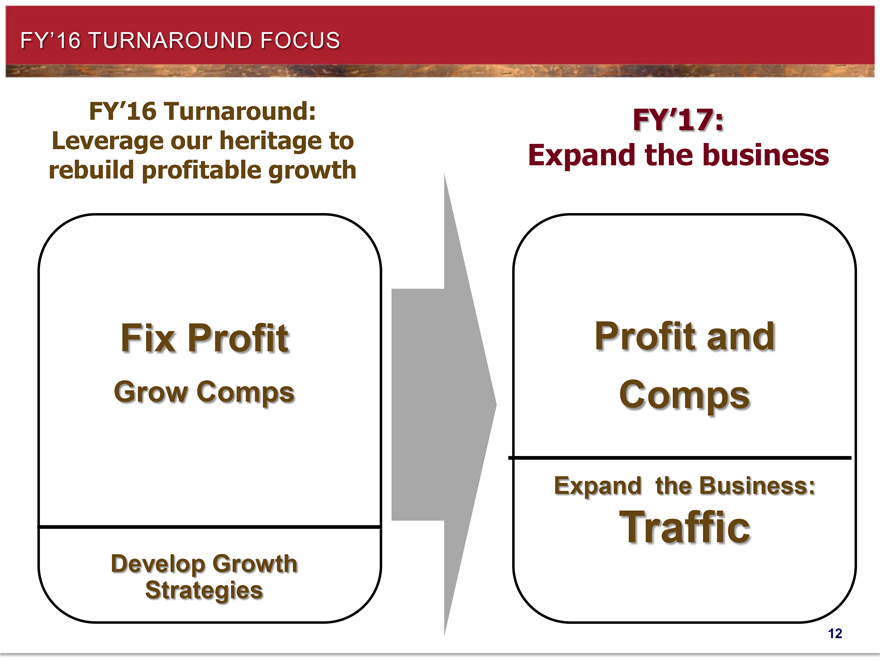
FY’16 TURNAROUND FOCUS
FY’16 Turnaround: Leverage our heritage to rebuild profitable growth
Fix Profit
Grow Comps
Develop Growth Strategies
FY’17: Expand the business
Profit and Comps
Expand the Business:
Traffic
12
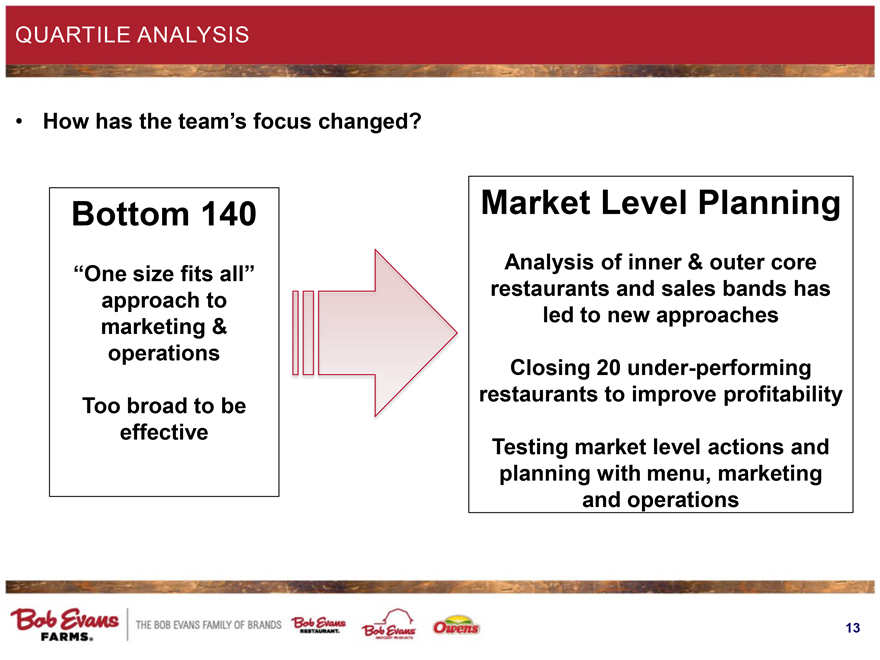
QUARTILE ANALYSIS
How has the team’s focus changed?
Bottom 140
“One size fits all” approach to marketing & operations
Too broad to be effective
Market Level Planning
Analysis of inner & outer core restaurants and sales bands has led to new approaches
Closing 20 under-performing restaurants to improve profitability
Testing market level actions and planning with menu, marketing and operations
Bob Evans FARMS
THE BOB EVANS FAMILY OF BRANDS
13
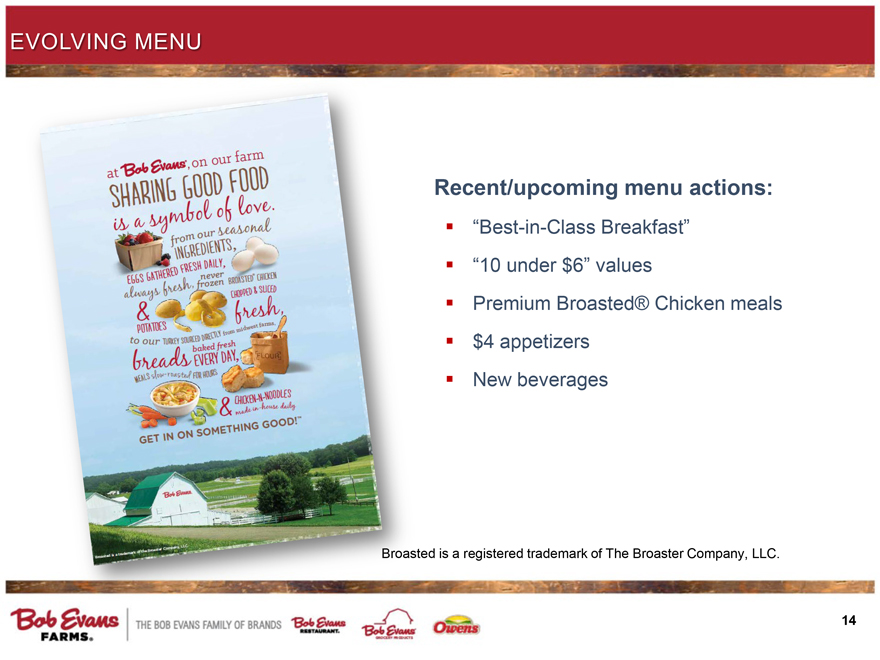
EVOLVING MENU
Recent/upcoming menu actions:
“Best-in-Class Breakfast”
“10 under $6” values
Premium Broasted® Chicken meals
$4 appetizers
New beverages
Broasted is a registered trademark of The Broaster Company, LLC.
Bob Evans FARMS
THE BOB EVANS FAMILY OF BRANDS
14
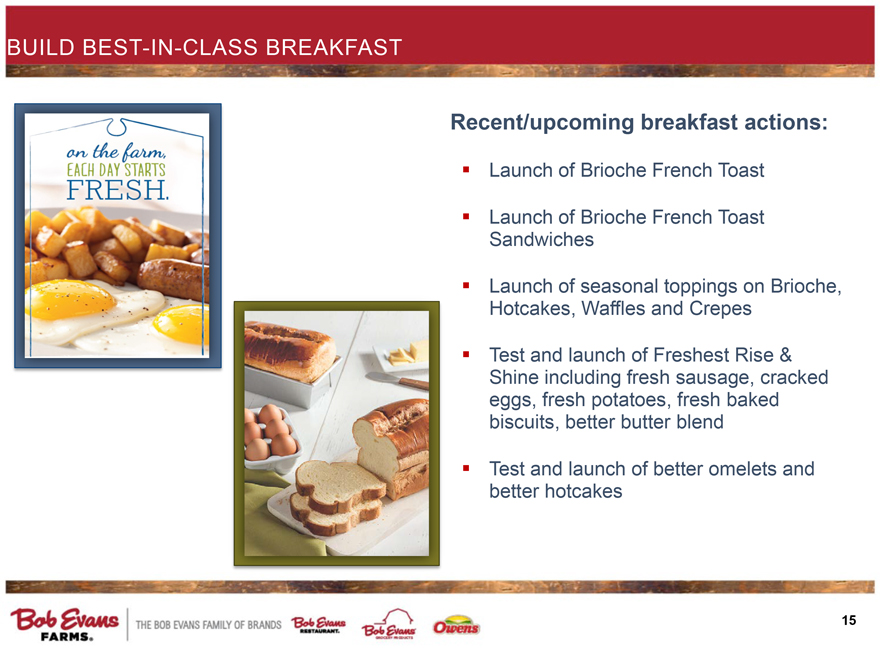
BUILD BEST-IN-CLASS BREAKFAST
Recent/upcoming breakfast actions:
Launch of Brioche French Toast
Launch of Brioche French Toast Sandwiches
Launch of seasonal toppings on Brioche, Hotcakes, Waffles and Crepes
Test and launch of Freshest Rise & Shine including fresh sausage, cracked eggs, fresh potatoes, fresh baked biscuits, better butter blend
Test and launch of better omelets and better hotcakes
Bob Evans FARMS
THE BOB EVANS FAMILY OF BRANDS
15
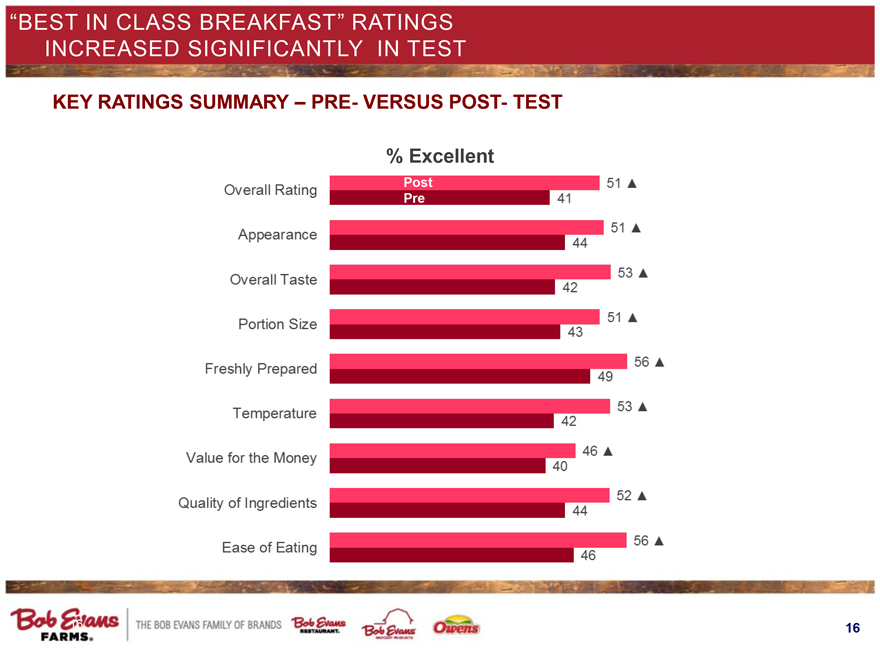
“BEST IN CLASS BREAKFAST” RATINGS
INCREASED SIGNIFICANTLY IN TEST
KEY RATINGS SUMMARY – PRE- VERSUS POST- TEST
% Excellent
Overall Rating Post 51
Pre 41
Appearance 51
44
Overall Taste 53
42
Portion Size 51
43
Freshly Prepared 56
49
Temperature 53
42
Value for the Money 46
40
Quality of Ingredients 52
44
Ease of Eating 56
46
Bob Evans FARMS
THE BOB EVANS FAMILY OF BRANDS
16
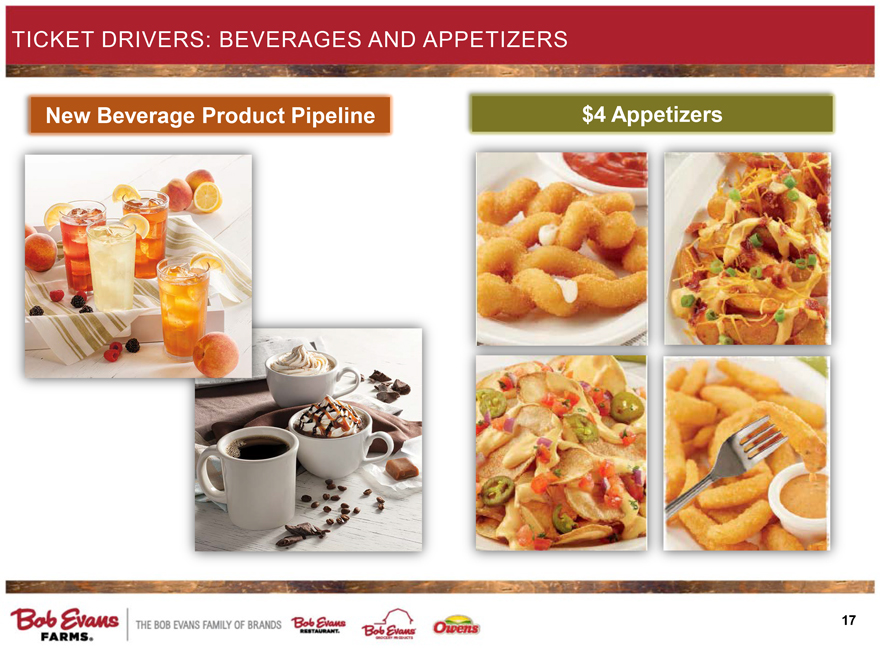
TICKET DRIVERS: BEVERAGES AND APPETIZERS
New Beverage Product Pipeline
$4 Appetizers
Bob Evans FARMS
THE BOB EVANS FAMILY OF BRANDS
17
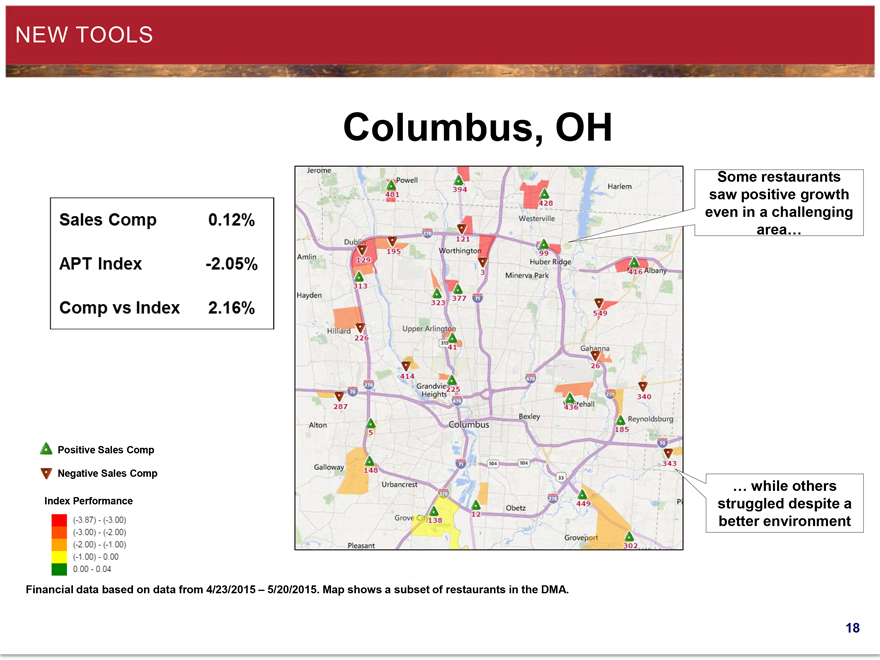
NEW TOOLS
Sales Comp 0.12%
APT Index -2.05%
Comp vs Index 2.16%
Positive Sales Comp
Negative Sales Comp
Index Performance
(-3.87) - (-3.00)
(-3.00) - (-2.00)
(-2.00) - (-1.00)
(-1.00) - 0.00
0.00 - 0.04
Columbus, OH
Some restaurants saw positive growth even in a challenging area…
… while others struggled despite a better environment
Financial data based on data from 4/23/2015 – 5/20/2015. Map shows a subset of restaurants in the DMA.
18
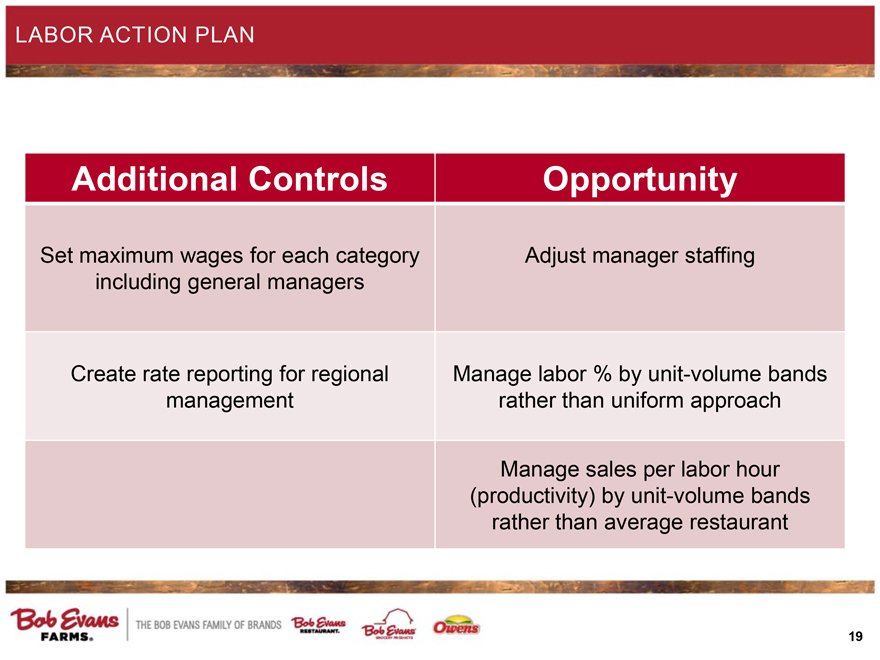
LABOR ACTION PLAN
Additional Controls
Set maximum wages for each category including general managers
Create rate reporting for regional management
Opportunity
Adjust manager staffing
Manage labor % by unit-volume bands rather than uniform approach
Manage sales per labor hour (productivity) by unit-volume bands rather than average restaurant
Bob Evans FARMS
THE BOB EVANS FAMILY OF BRANDS
19
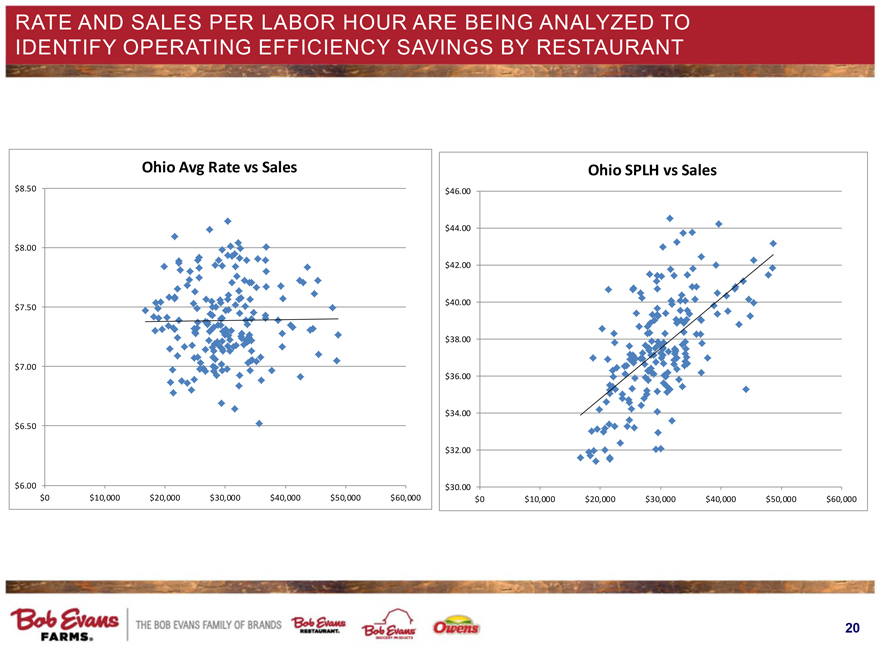
RATE AND SALES PER LABOR HOUR ARE BEING ANALYZED TO IDENTIFY OPERATING EFFICIENCY SAVINGS BY RESTAURANT
Ohio Avg Rate vs Sales
$8.50
$8.00
$7.50
$7.00
$6.50
$6.00
$0 $10,000 $20,000 $30,000 $40,000 $50,000 $60,000
Ohio SPLH vs Sales
$46.00
$44.00
$42.00
$40.00
$38.00
$36.00
$34.00
$32.00
$30.00
$0 $10,000 $20,000 $30,000 $40,000 $50,000 $60,000
Bob Evans FARMS
THE BOB EVANS FAMILY OF BRANDS
20
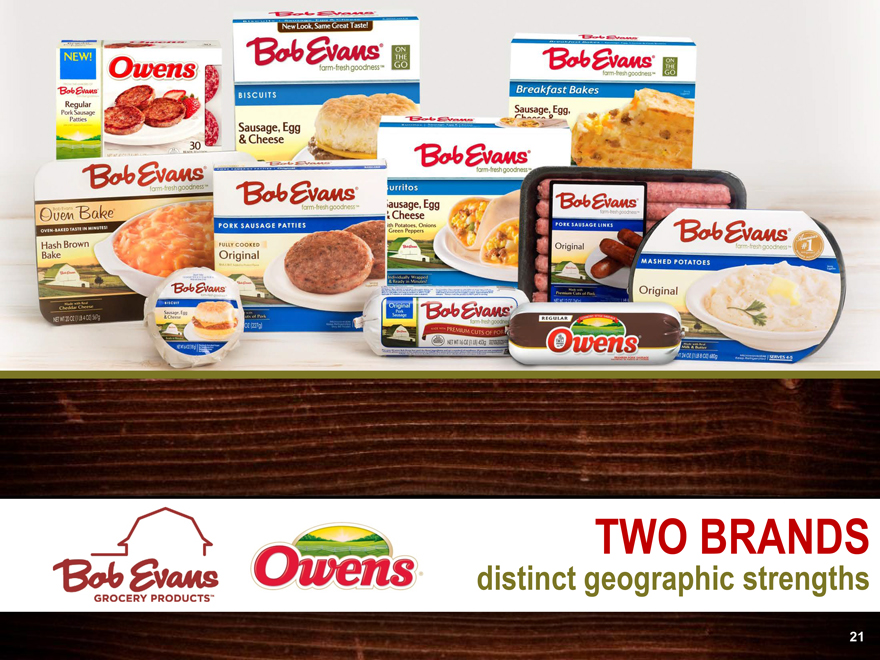
Bob Evans
GROCERY PRODUCTS
Owens
TWO BRANDS
distinct geographic strengths
21
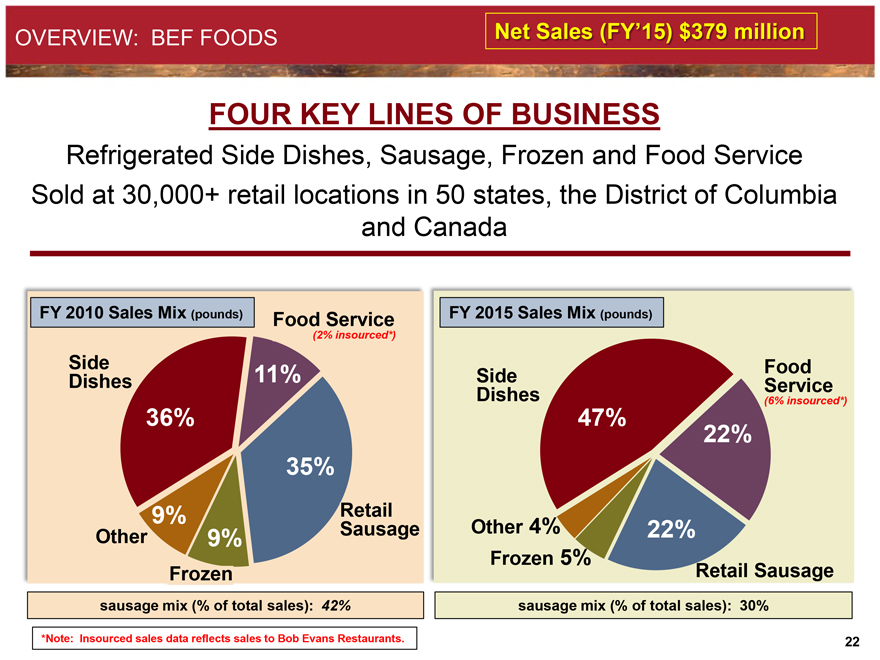
OVERVIEW: BEF FOODS
Net Sales (FY’15) $379 million
FOUR KEY LINES OF BUSINESS
Refrigerated Side Dishes, Sausage, Frozen and Food Service Sold at 30,000+ retail locations in 50 states, the District of Columbia and Canada
FY 2010 Sales Mix (pounds)
Side Dishes
36%
Other
9%
Frozen
9%
Retail Sausage
35%
Food Service
(2% insourced*)
11%
sausage mix (% of total sales): 42%
*Note: Insourced sales data reflects sales to Bob Evans Restaurants.
FY 2015 Sales Mix (pounds)
Side Dishes
47%
Other 4%
Frozen 5%
Retail Sausage
22%
22%
Food Service
(6% insourced*)
sausage mix (% of total sales): 30%
22
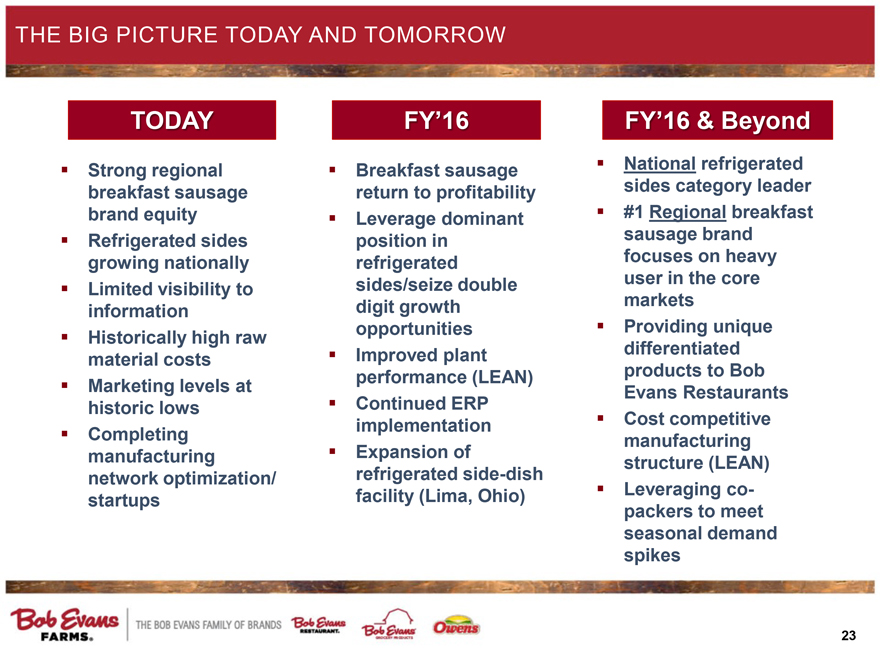
THE BIG PICTURE TODAY AND TOMORROW
TODAY
Strong regional breakfast sausage brand equity
Refrigerated sides growing nationally
Limited visibility to information
Historically high raw material costs
Marketing levels at historic lows
Completing manufacturing network optimization/startups
FY’16
Breakfast sausage return to profitability
Leverage dominant position in refrigerated sides/seize double digit growth opportunities
Improved plant performance (LEAN)
Continued ERP implementation
Expansion of refrigerated side-dish facility (Lima, Ohio)
FY’16 & Beyond
National refrigerated sides category leader
#1 Regional breakfast sausage brand focuses on heavy user in the core markets
Providing unique differentiated products to Bob Evans Restaurants
Cost competitive manufacturing structure (LEAN)
Leveraging co-packers to meet seasonal demand spikes
Bob Evans FARMS
THE BOB EVANS FAMILY OF BRANDS
23
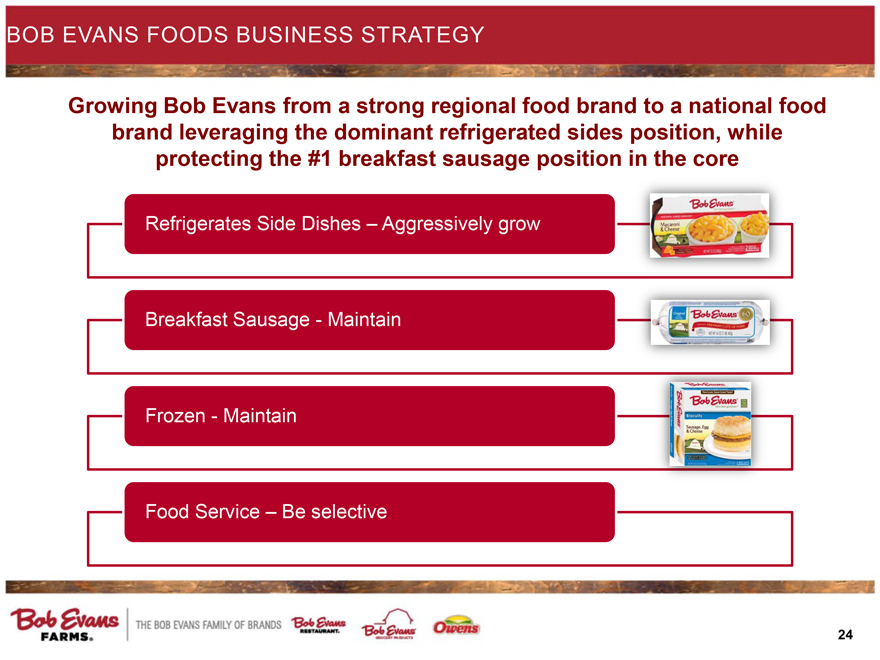
BOB EVANS FOODS BUSINESS STRATEGY
Growing Bob Evans from a strong regional food brand to a national food brand leveraging the dominant refrigerated sides position, while protecting the #1 breakfast sausage position in the core
Refrigerates Side Dishes – Aggressively grow
Breakfast Sausage - Maintain
Frozen - Maintain
Food Service – Be selective
Bob Evans FARMS
THE BOB EVANS FAMILY OF BRANDS
24
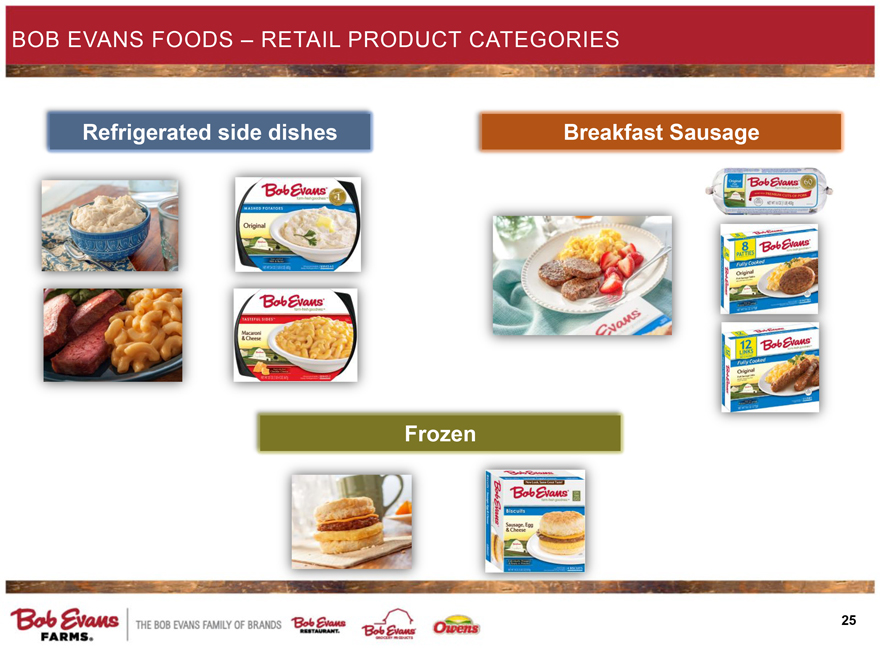
BOB EVANS FOODS – RETAIL PRODUCT CATEGORIES
Refrigerated side dishes
Breakfast Sausage
Frozen
Bob Evans FARMS
THE BOB EVANS FAMILY OF BRANDS
25
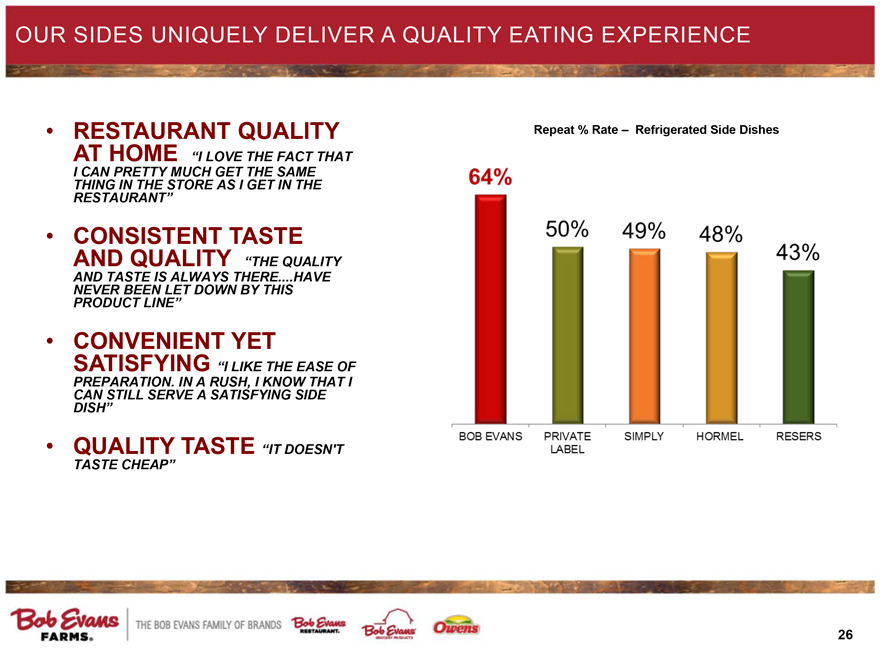
OUR SIDES UNIQUELY DELIVER A QUALITY EATING EXPERIENCE
• RESTAURANT QUALITY AT HOME “I LOVE THE FACT THAT I CAN PRETTY MUCH GET THE SAME THING IN THE STORE AS I GET IN THE RESTAURANT”
• CONSISTENT TASTE AND QUALITY “THE QUALITY AND TASTE IS ALWAYS THERE.…HAVE NEVER BEEN LET DOWN BY THIS PRODUCT LINE”
• CONVENIENT YET SATISFYING “I LIKE THE EASE OF PREPARATION. IN A RUSH, I KNOW THAT I CAN STILL SERVE A SATISFYING SIDE DISH”
• QUALITY TASTE “IT DOESN’T TASTE CHEAP”
Repeat % Rate – Refrigerated Side Dishes
64% 50% 49% 48% 43%
BOB EVANS PRIVATE LABEL SIMPLY HORMEL RESERS
Bob Evans FARMS
THE BOB EVANS FAMILY OF BRANDS
26
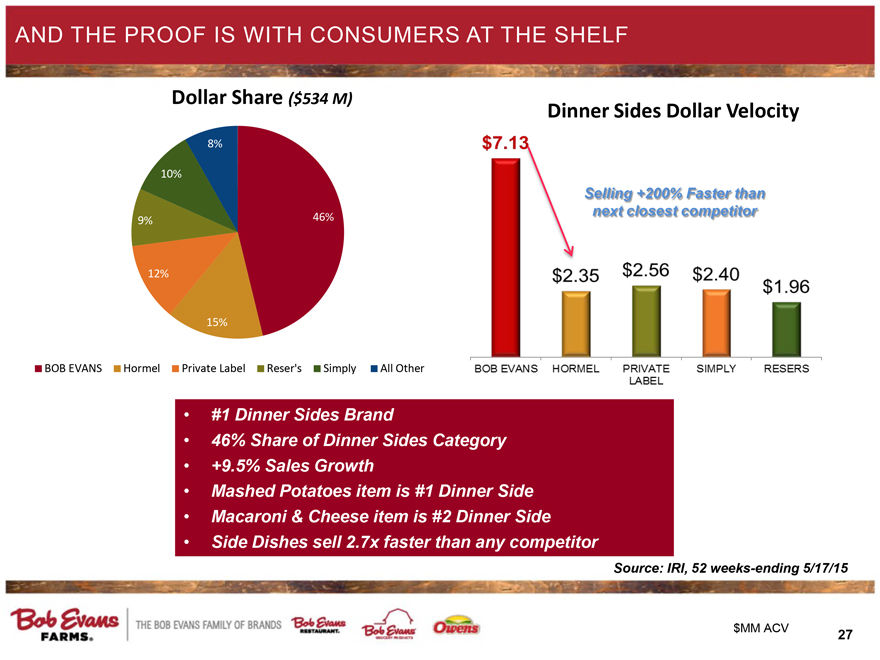
AND THE PROOF IS WITH CONSUMERS AT THE SHELF
Dollar Share ($534 M)
8%
10%
9%
12%
15%
46%
BOB EVANS Hormel Private Label Reser’s Simply All Other
Dinner Sides Dollar Velocity
$7.13 Selling +200% Faster than next closest competitor
$2.35 $2.56 $2.40 $1.96
BOB EVANS HORMEL PRIVATE LABEL SIMPLY RESERS
• #1 Dinner Sides Brand
• 46% Share of Dinner Sides Category
• +9.5% Sales Growth
• Mashed Potatoes item is #1 Dinner Side
• Macaroni & Cheese item is #2 Dinner Side
• Side Dishes sell 2.7x faster than any competitor
Source: IRI, 52 weeks-ending 5/17/15
Bob Evans FARMS
THE BOB EVANS FAMILY OF BRANDS
$MM ACV
27
Appendix
28
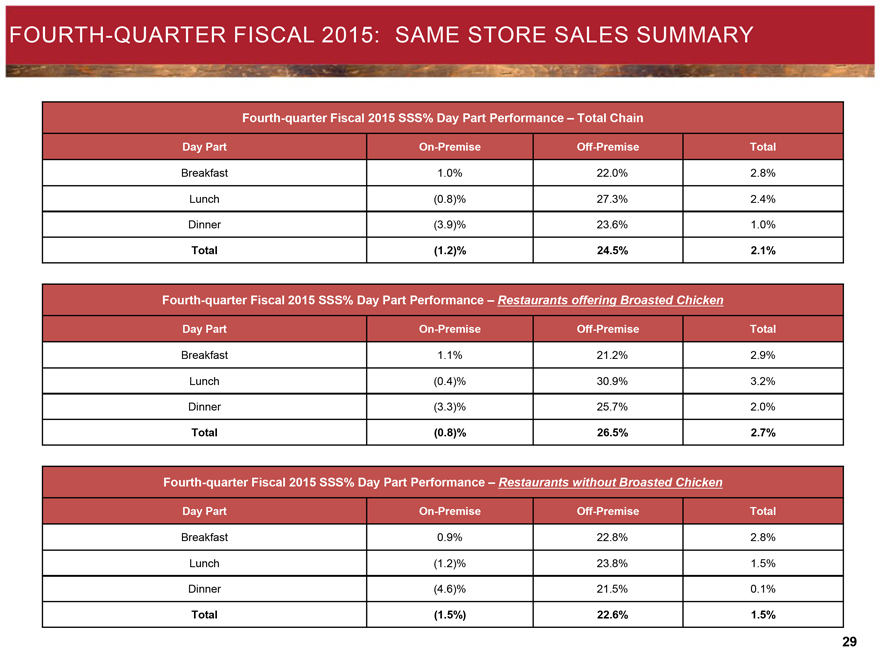
FOURTH-QUARTER FISCAL 2015: SAME STORE SALES SUMMARY
Fourth-quarter Fiscal 2015 SSS% Day Part Performance – Total Chain
Day Part On-Premise Off-Premise Total
Breakfast 1.0% 22.0% 2.8%
Lunch (0.8)% 27.3% 2.4%
Dinner (3.9)% 23.6% 1.0%
Total (1.2)% 24.5% 2.1%
Fourth-quarter Fiscal 2015 SSS% Day Part Performance – Restaurants offering Broasted Chicken
Day Part On-Premise Off-Premise Total
Breakfast 1.1% 21.2% 2.9%
Lunch (0.4)% 30.9% 3.2%
Dinner (3.3)% 25.7% 2.0%
Total (0.8)% 26.5% 2.7%
Fourth-quarter Fiscal 2015 SSS% Day Part Performance – Restaurants without Broasted Chicken
Day Part On-Premise Off-Premise Total
Breakfast 0.9% 22.8% 2.8%
Lunch (1.2)% 23.8% 1.5%
Dinner (4.6)% 21.5% 0.1%
Total (1.5%) 22.6% 1.5%
29
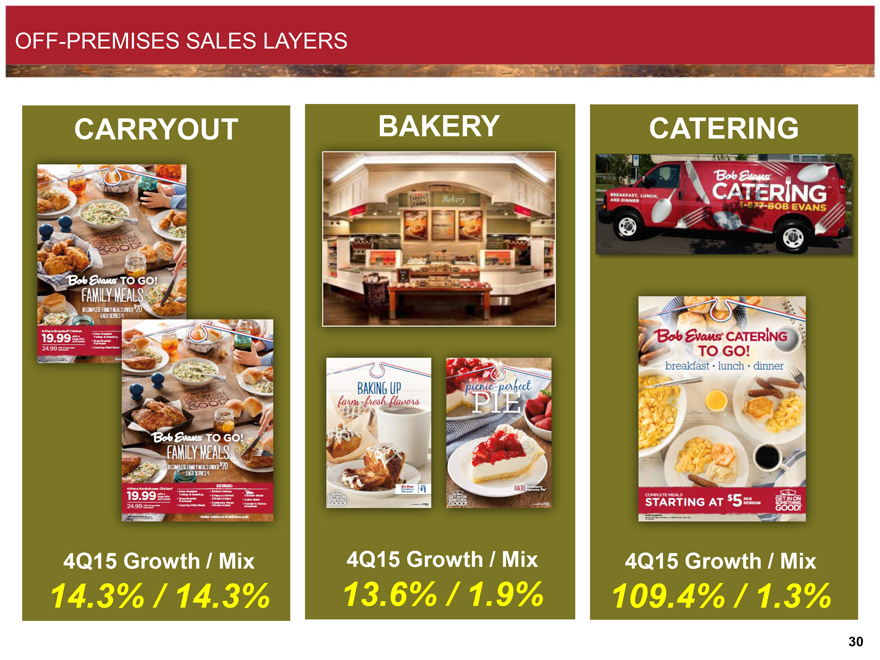
OFF-PREMISES SALES LAYERS
CARRYOUT
4Q15 Growth / Mix
14.3% / 14.3%
BAKERY
4Q15 Growth / Mix
13.6% / 1.9%
CATERING
4Q15 Growth / Mix
109.4% / 1.3%
30
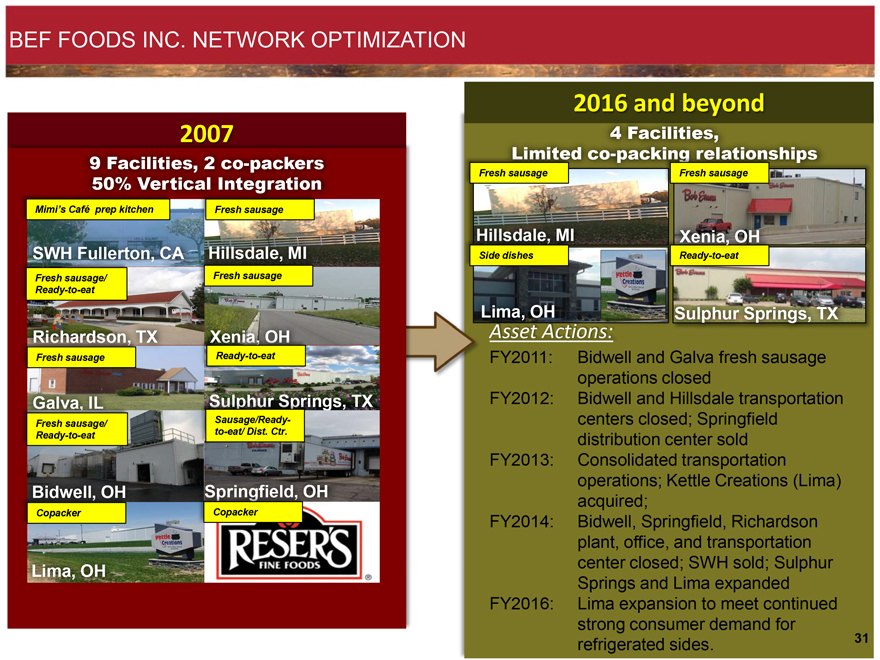
BEF FOODS INC. NETWORK OPTIMIZATION
2007
9 Facilities, 2 co-packers 50% Vertical Integration
Mimi’s Café prep kitchen Fresh sausage
SWH Fullerton, CA Hillsdale, MI
Fresh sausage/Ready-to-eat Fresh sausage
Richardson, TX Xenia, OH
Fresh sausage Ready-to-eat
Galva, IL Sulphur Springs, TX
Fresh sausage/Ready-to-eat Sausage/Ready-to-eat/ Dist. Ctr.
Bidwell, OH Springfield, OH
Copacker Copacker
Lima, OH RESER’S FINE FOODS
2016 and beyond
4 Facilities,
Limited co-packing relationships
Fresh sausage Fresh sausage
Hillsdale, MI Xenia, OH
Side dishes Ready-to-eat
Lima, OH Sulphur Springs, TX
Asset Actions:
FY2011: Bidwell and Galva fresh sausage operations closed
FY2012: Bidwell and Hillsdale transportation centers closed; Springfield distribution center sold
FY2013: Consolidated transportation operations; Kettle Creations (Lima) acquired;
FY2014: Bidwell, Springfield, Richardson plant, office, and transportation center closed; SWH sold; Sulphur Springs and Lima expanded
FY2016: Lima expansion to meet continued strong consumer demand for refrigerated sides.
31
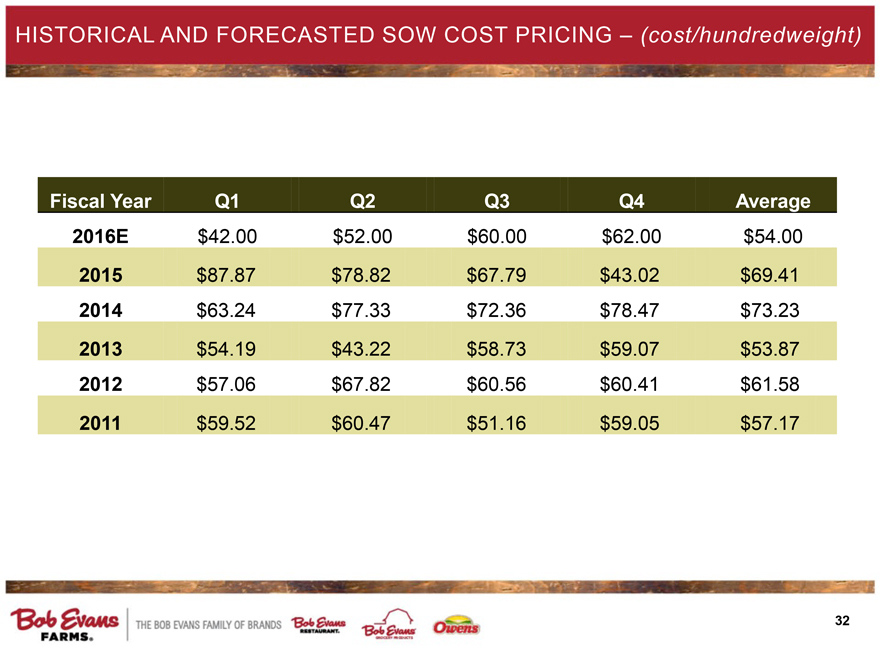
HISTORICAL AND FORECASTED SOW COST PRICING – (cost/hundredweight)
Fiscal Year Q1 Q2 Q3 Q4 Average
2016E $42.00 $52.00 $60.00 $62.00 $54.00
2015 $87.87 $78.82 $67.79 $43.02 $69.41
2014 $63.24 $77.33 $72.36 $78.47 $73.23
2013 $54.19 $43.22 $58.73 $59.07 $53.87
2012 $57.06 $67.82 $60.56 $60.41 $61.58
2011 $59.52 $60.47 $51.16 $59.05 $57.17
Bob Evans FARMS
THE BOB EVANS FAMILY OF BRANDS
32
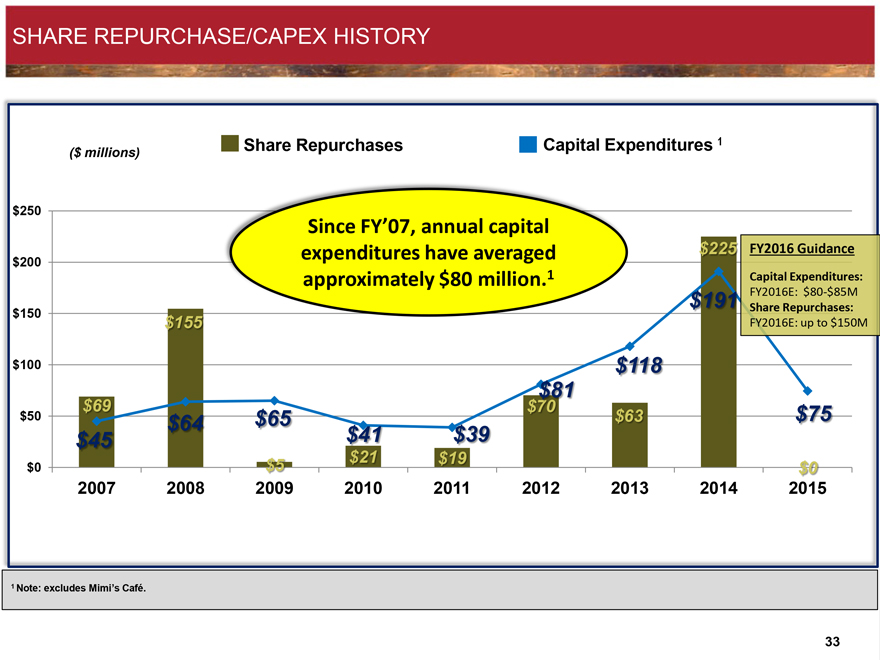
SHARE REPURCHASE/CAPEX HISTORY
($ millions)
Share Repurchases
Capital Expenditures 1
$250 $200 $150 $100 $50 $0
Since FY’07, annual capital expenditures have averaged approximately $80 million.1
$69
$45
$155
$64
$65
$5
$41
$21
$39
$19
$81
$70
$118
$63
$225
$191
$75
$0
2007 2008 2009 2010 2011 2012 2013 2014 2015
FY2016 Guidance
Capital Expenditures:
FY2016E: $80-$85M
Share Repurchases:
FY2016E: up to $150M
1 Note: excludes Mimi’s Café.
33
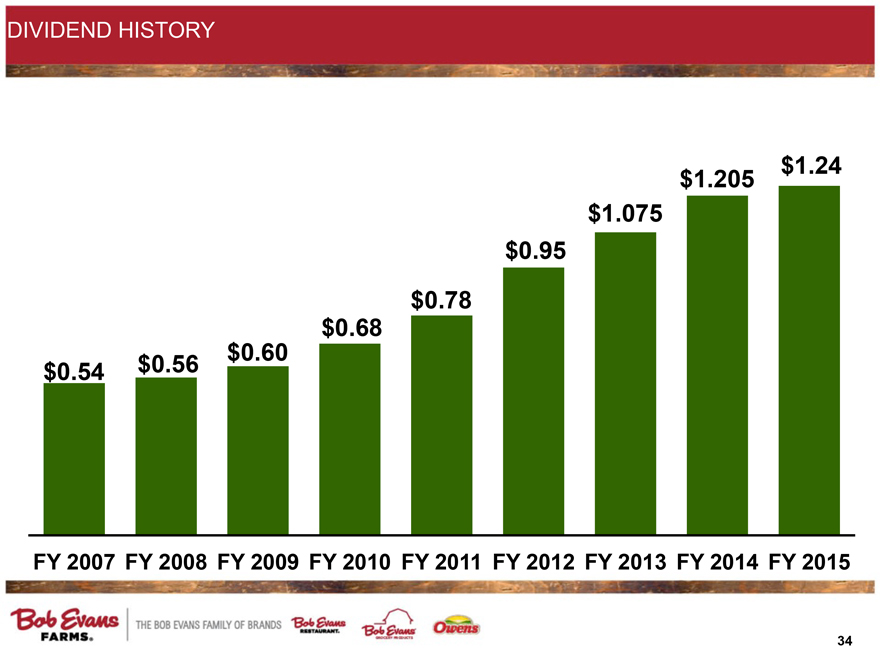
DIVIDEND HISTORY
$1.24 $1.205 $1.075 $0.95 $0.78 $0.68 $0.60 $0.56 $0.54
FY 2007 FY 2008 FY 2009 FY 2010 FY 2011 FY 2012 FY 2013 FY 2014 FY 2015
Bob Evans FARMS
THE BOB EVANS FAMILY OF BRANDS
34
Serious News for Serious Traders! Try StreetInsider.com Premium Free!
You May Also Be Interested In
- InterContinental Hotels Group PLC Announces Transaction in Own Shares - Apr 19
- Form 8.5 (EPT/RI) - Abrdn European Logistics Income Plc
- Form 8.5 (EPT/RI) - Accrol Group Holdings Plc
Create E-mail Alert Related Categories
SEC FilingsSign up for StreetInsider Free!
Receive full access to all new and archived articles, unlimited portfolio tracking, e-mail alerts, custom newswires and RSS feeds - and more!
