Form 8-K BERKSHIRE HILLS BANCORP For: Aug 27
UNITED STATES
SECURITIES AND EXCHANGE COMMISSION
WASHINGTON, D.C. 20549
FORM 8-K
CURRENT REPORT
PURSUANT TO SECTION 13 OR 15(D) OF
THE SECURITIES EXCHANGE ACT OF 1934
Date of Report (Date of earliest event reported): August 27, 2015
BERKSHIRE HILLS BANCORP, INC.
(Exact Name of Registrant as Specified in its Charter)
|
Delaware |
|
001-15781 |
|
04-3510455 |
|
(State or Other Jurisdiction |
|
(Commission File No.) |
|
(I.R.S. Employer |
|
24 North Street, Pittsfield, Massachusetts |
|
01201 |
|
(Address of Principal Executive Offices) |
|
(Zip Code) |
Registrant’s telephone number, including area code: (413) 443-5601
Not Applicable
(Former Name or Former Address, if Changed Since Last Report)
Check the appropriate box below if the Form 8-K filing is intended to simultaneously satisfy the filing obligation of the registrant under any of the following provisions (see General Instruction A.2. below):
o Written communications pursuant to Rule 425 under the Securities Act (17 CFR 230.425)
o Soliciting material pursuant to Rule 14a-12 under the Exchange Act (17 CFR 240.14a-12)
o Pre-commencement communications pursuant to Rule 14d-2(b) under the Exchange Act (17 CFR 240.14d-2(b))
o Pre-commencement communications pursuant to Rule 13e-4(c) under the Exchange Act (17 CFR 240.13e-4(c))
Item 7.01. Regulation FD Disclosure
On August 27, 2015, Berkshire Hills Bancorp, Inc. (the “Company”) made available its slides for an investor presentation. The presentation slides are included in this report as Exhibit 99.1 and are furnished herewith, and shall not be deemed “filed” for any purpose.
Item 9.01. Financial Statements and Exhibits
(a) Financial Statements of Businesses Acquired. Not applicable.
(b) Pro Forma Financial Information. Not applicable.
(c) Shell Company Transactions. Not applicable.
(d) Exhibits.
|
|
Exhibit No. |
|
Description |
|
|
|
|
|
|
|
99.1 |
|
Berkshire Hills Bancorp, Inc. investor presentation slides |
SIGNATURES
Pursuant to the requirements of the Securities Exchange Act of 1934, the registrant has duly caused this report to be signed on its behalf by the undersigned, hereunto duly authorized.
|
|
Berkshire Hills Bancorp, Inc. | |
|
|
| |
|
|
| |
|
DATE: August 27, 2015 |
By: |
/s/ Michael P. Daly |
|
|
|
Michael P. Daly |
|
|
|
President and Chief Executive Officer |
Exhibit 99.1
|
|
Midwest IDEAS Conference August 2015 |
|
|
Forward Looking Statements This document contains forward-looking statements as defined in the Private Securities Litigation Reform Act of 1995. There are several factors that could cause actual results to differ significantly from expectations described in the forward-looking statements. For a discussion of such factors, please see Berkshire’s most recent reports on Forms 10-K and 10-Q filed with the Securities and Exchange Commission and available on the SEC’s website at www.sec.gov. Berkshire does not undertake any obligation to update forward looking statements. NON-GAAP FINANCIAL MEASURES This presentation references non-GAAP financial measures incorporating tangible equity and related measures, and core earnings excluding merger and other non-recurring costs. These measures are commonly used by investors in evaluating business combinations and financial condition. GAAP earnings are lower than core earnings primarily due to non-recurring merger and systems conversion related expenses. Reconciliations are in earnings releases at www.berkshirebank.com and attached in this presentation. 2 |
|
|
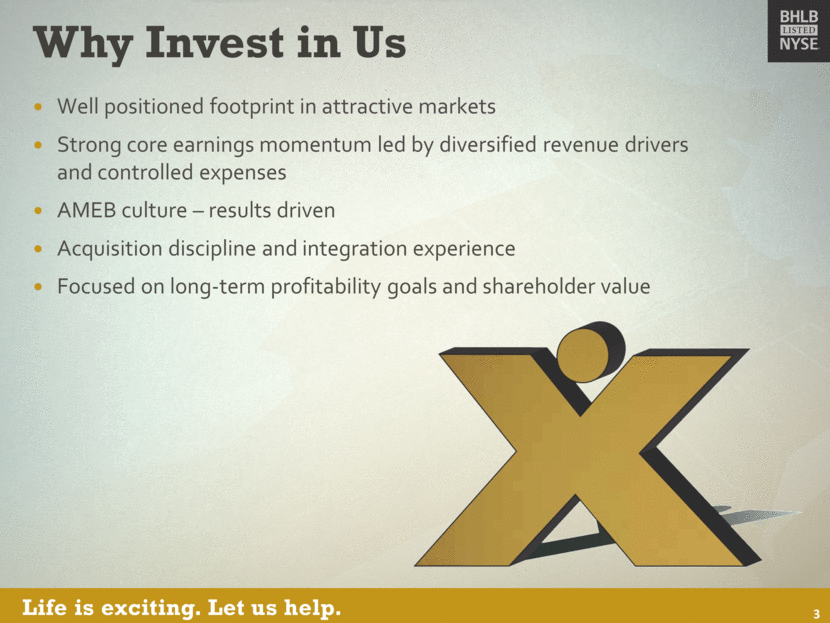
Why Invest in Us Well positioned footprint in attractive markets Strong core earnings momentum led by diversified revenue drivers and controlled expenses AMEB culture – results driven Acquisition discipline and integration experience Focused on long-term profitability goals and shareholder value 3 |
|
|
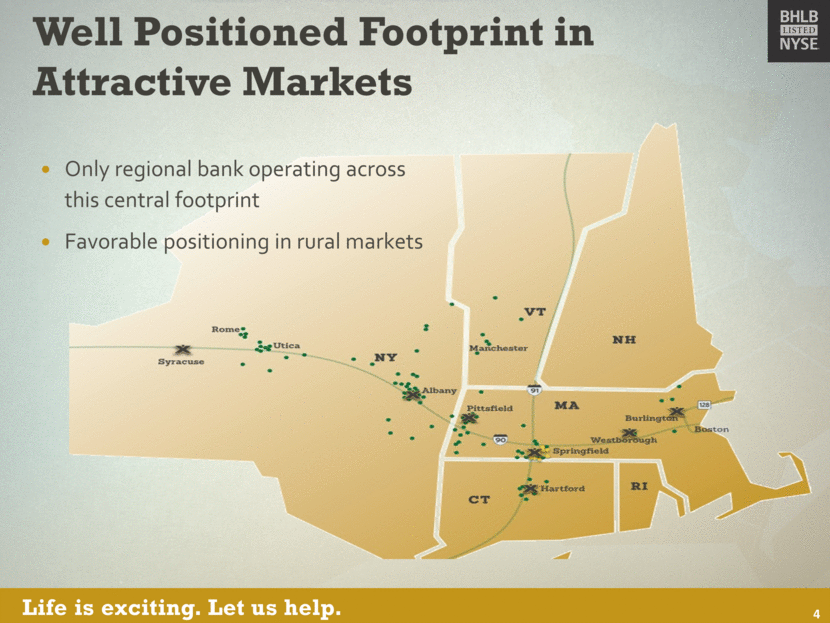
Well Positioned Footprint in Attractive Markets 4 Only regional bank operating across this central footprint Favorable positioning in rural markets |
|
|
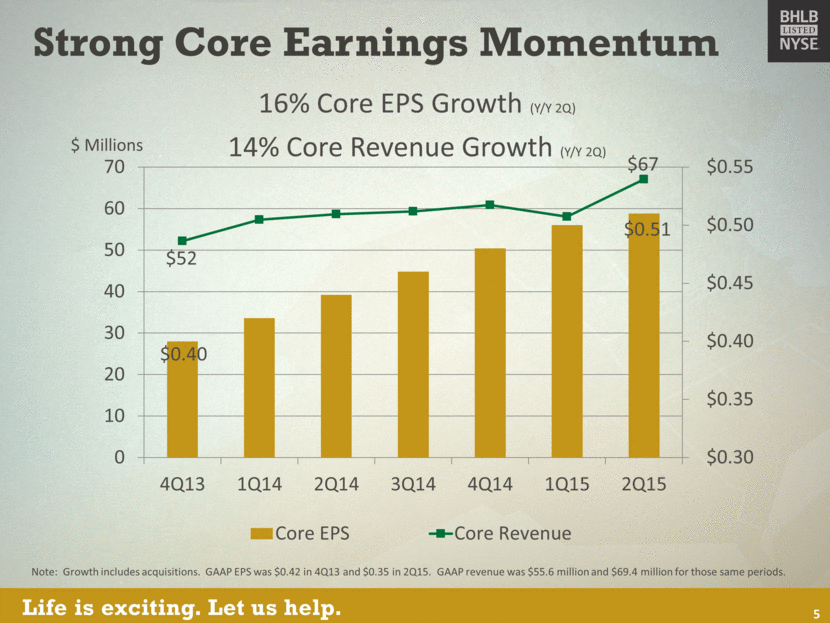
Strong Core Earnings Momentum 5 Note: Growth includes acquisitions. GAAP EPS was $0.42 in 4Q13 and $0.35 in 2Q15. GAAP revenue was $55.6 million and $69.4 million for those same periods. 16% Core EPS Growth (Y/Y 2Q) 14% Core Revenue Growth (Y/Y 2Q) $0.40 $0.51 $52 $67 $0.30 $0.35 $0.40 $0.45 $0.50 $0.55 0 10 20 30 40 50 60 70 4Q13 1Q14 2Q14 3Q14 4Q14 1Q15 2Q15 Core EPS Core Revenue $ Millions |
|
|
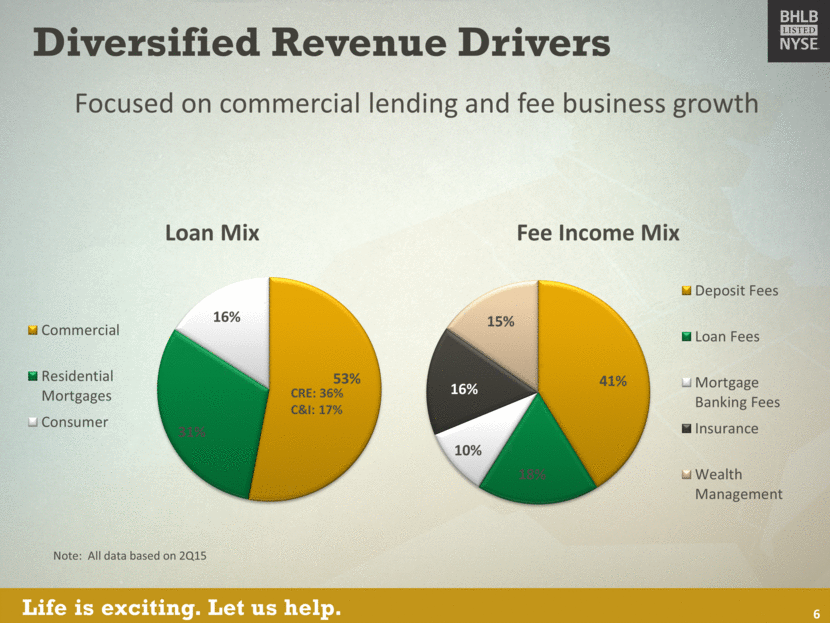
Focused on commercial lending and fee business growth Note: All data based on 2Q15 Diversified Revenue Drivers CRE: 36% C&I: 17% 6 41% 18% 10% 16% 15% Fee Income Mix Deposit Fees Loan Fees Mortgage Banking Fees Insurance Wealth Management 53% 31% 16% Loan Mix Commercial Residential Mortgages Consumer |
|
|
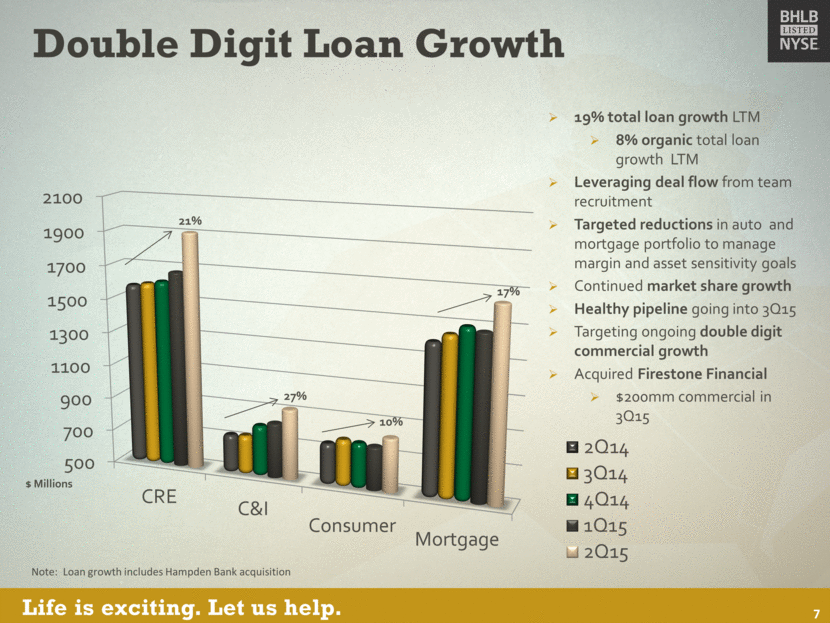
Double Digit Loan Growth $ Millions 17% 10% 27% 21% 19% total loan growth LTM 8% organic total loan growth LTM Leveraging deal flow from team recruitment Targeted reductions in auto and mortgage portfolio to manage margin and asset sensitivity goals Continued market share growth Healthy pipeline going into 3Q15 Targeting ongoing double digit commercial growth Acquired Firestone Financial $200mm commercial in 3Q15 7 Note: Loan growth includes Hampden Bank acquisition 500 700 900 1100 1300 1500 1700 1900 2100 CRE C&I Consumer Mortgage 2Q14 3Q14 4Q14 1Q15 2Q15 |
|
|
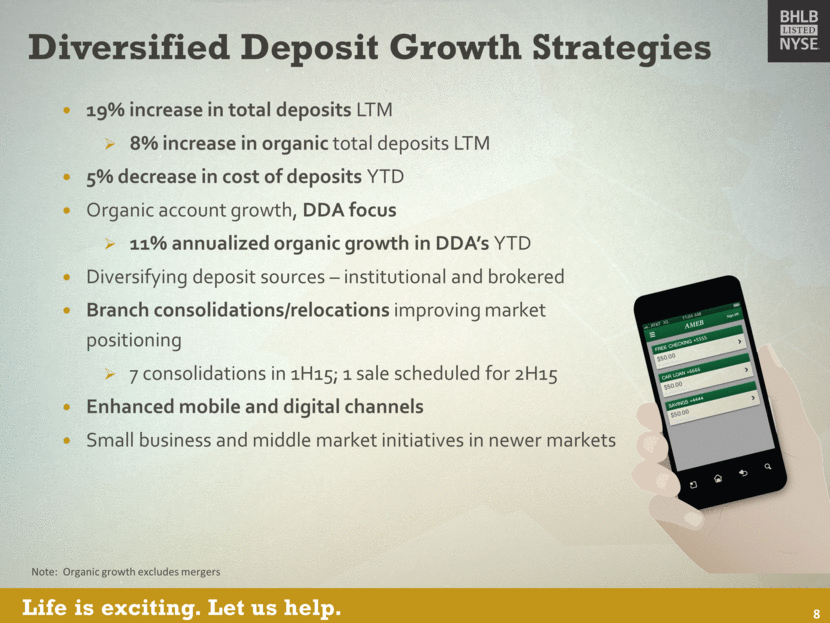
Diversified Deposit Growth Strategies 19% increase in total deposits LTM 8% increase in organic total deposits LTM 5% decrease in cost of deposits YTD Organic account growth, DDA focus 11% annualized organic growth in DDA’s YTD Diversifying deposit sources – institutional and brokered Branch consolidations/relocations improving market positioning 7 consolidations in 1H15; 1 sale scheduled for 2H15 Enhanced mobile and digital channels Small business and middle market initiatives in newer markets 8 Note: Organic growth excludes mergers |
|
|
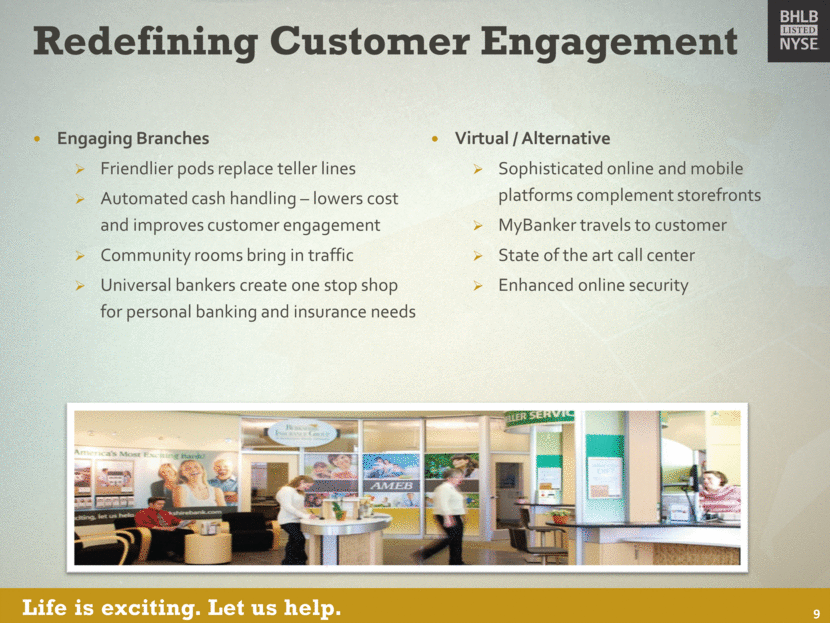
Redefining Customer Engagement Engaging Branches Friendlier pods replace teller lines Automated cash handling – lowers cost and improves customer engagement Community rooms bring in traffic Universal bankers create one stop shop for personal banking and insurance needs Virtual / Alternative Sophisticated online and mobile platforms complement storefronts MyBanker travels to customer State of the art call center Enhanced online security 9 |
|
|
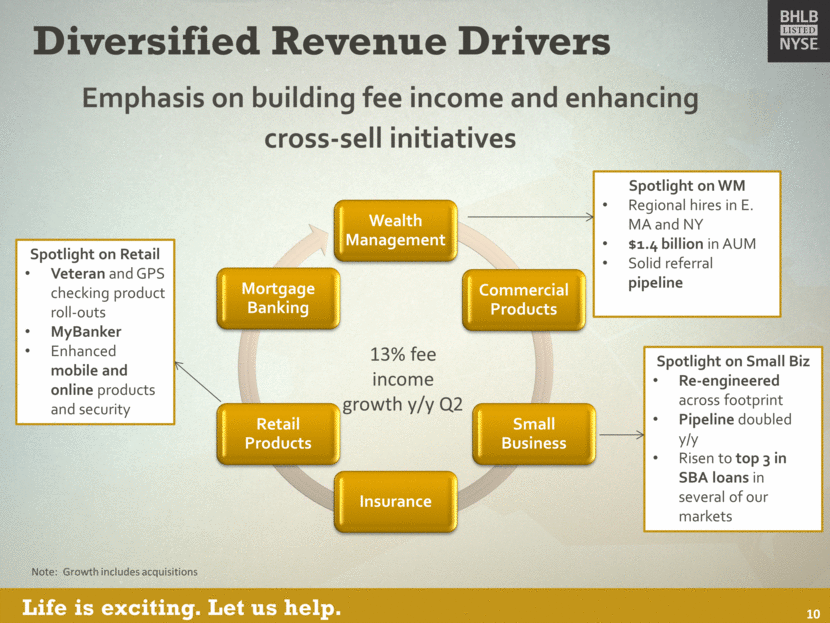
Diversified Revenue Drivers Emphasis on building fee income and enhancing cross-sell initiatives Spotlight on WM Regional hires in E. MA and NY $1.4 billion in AUM Solid referral pipeline Spotlight on Small Biz Re-engineered across footprint Pipeline doubled y/y Risen to top 3 in SBA loans in several of our markets Spotlight on Retail Veteran and GPS checking product roll-outs MyBanker Enhanced mobile and online products and security 10 13% fee income growth y/y Q2 Note: Growth includes acquisitions Wealth Management Small Business Commercial Products Insurance Retail Products Mortgage Banking |
|
|
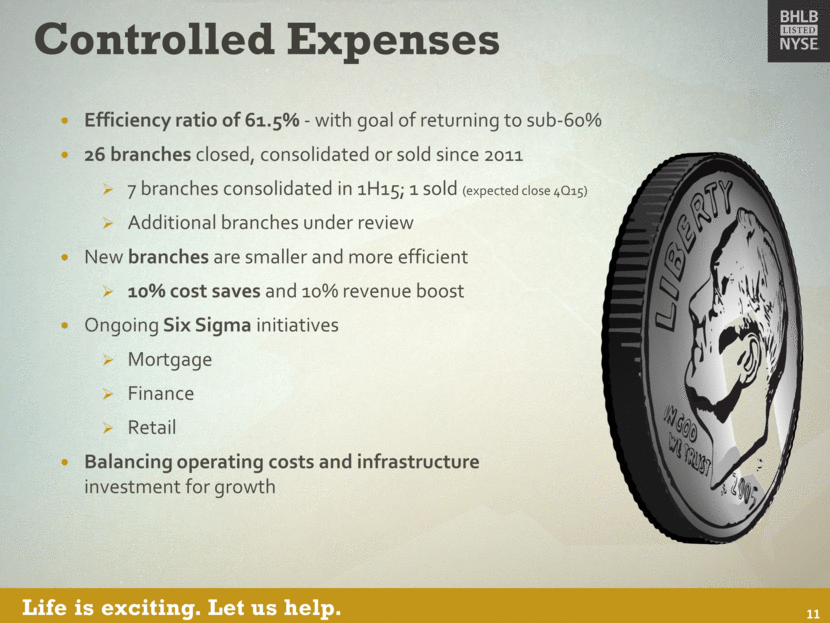
Controlled Expenses Efficiency ratio of 61.5% - with goal of returning to sub-60% 26 branches closed, consolidated or sold since 2011 7 branches consolidated in 1H15; 1 sold (expected close 4Q15) Additional branches under review New branches are smaller and more efficient 10% cost saves and 10% revenue boost Ongoing Six Sigma initiatives Mortgage Finance Retail Balancing operating costs and infrastructure investment for growth 11 |
|
|
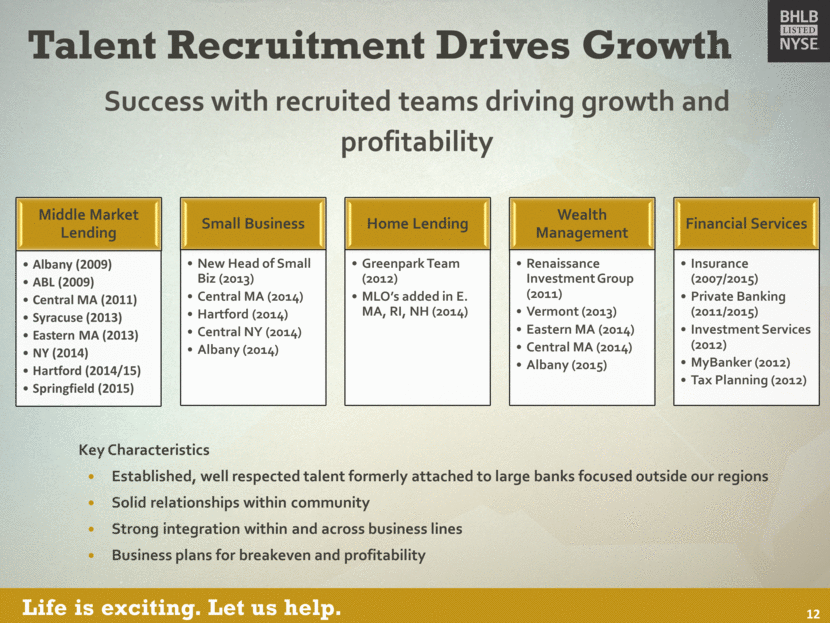
Talent Recruitment Drives Growth Success with recruited teams driving growth and profitability Key Characteristics Established, well respected talent formerly attached to large banks focused outside our regions Solid relationships within community Strong integration within and across business lines Business plans for breakeven and profitability 12 Middle Market Lending Albany (2009) ABL (2009) Central MA (2011) Syracuse (2013) Eastern MA (2013) NY (2014) Hartford (2014/15) Springfield (2015) Small Business New Head of Small Biz (2013) Central MA (2014) Hartford (2014) Central NY (2014) Albany (2014) Home Lending Greenpark Team (2012) MLO’s added in E. MA, RI, NH (2014) Wealth Management Renaissance Investment Group (2011) Vermont (2013) Eastern MA (2014) Central MA (2014) Albany (2015) Financial Services Insurance (2007/2015) Private Banking (2011/2015) Investment Services (2012) MyBanker (2012) Tax Planning (2012) |
|
|
AMEB Culture People, attitude and energy RIGHT core values – Respect, Integrity, Guts, Having Fun and Teamwork Engaging and innovative customer experience Driven to make a difference 13 |
|
|
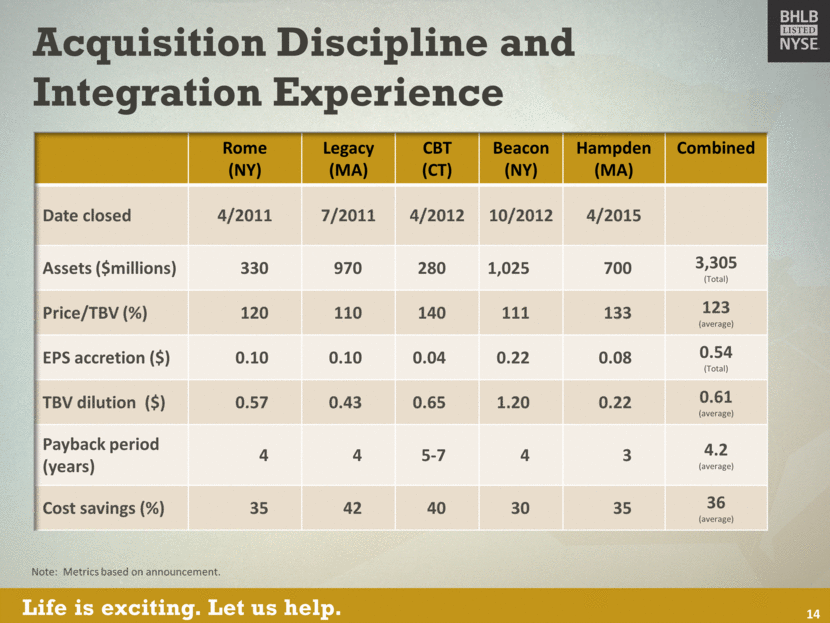
Acquisition Discipline and Integration Experience 14 Rome (NY) Legacy (MA) CBT (CT) Beacon (NY) Hampden (MA) Combined Date closed 4/2011 7/2011 4/2012 10/2012 4/2015 Assets ($millions) 330 970 280 1,025 700 3,305 (Total) Price/TBV (%) 120 110 140 111 133 123 (average) EPS accretion ($) 0.10 0.10 0.04 0.22 0.08 0.54 (Total) TBV dilution ($) 0.57 0.43 0.65 1.20 0.22 0.61 (average) Payback period (years) 4 4 5-7 4 3 4.2 (average) Cost savings (%) 35 42 40 30 35 36 (average) Note: Metrics based on announcement. |
|
|
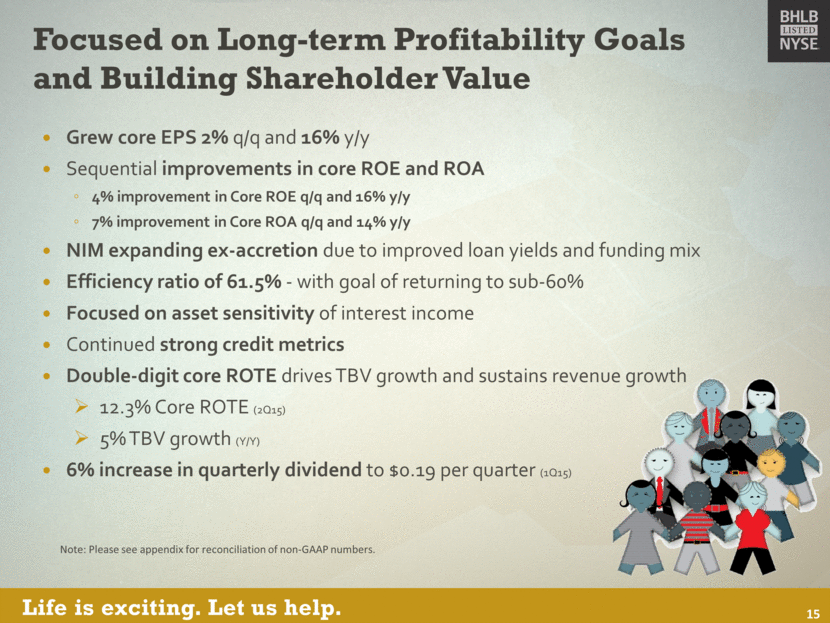
Focused on Long-term Profitability Goals and Building Shareholder Value Grew core EPS 2% q/q and 16% y/y Sequential improvements in core ROE and ROA 4% improvement in Core ROE q/q and 16% y/y 7% improvement in Core ROA q/q and 14% y/y NIM expanding ex-accretion due to improved loan yields and funding mix Efficiency ratio of 61.5% - with goal of returning to sub-60% Focused on asset sensitivity of interest income Continued strong credit metrics Double-digit core ROTE drives TBV growth and sustains revenue growth 12.3% Core ROTE (2Q15) 5% TBV growth (Y/Y) 6% increase in quarterly dividend to $0.19 per quarter (1Q15) Note: Please see appendix for reconciliation of non-GAAP numbers. 15 |
|
|
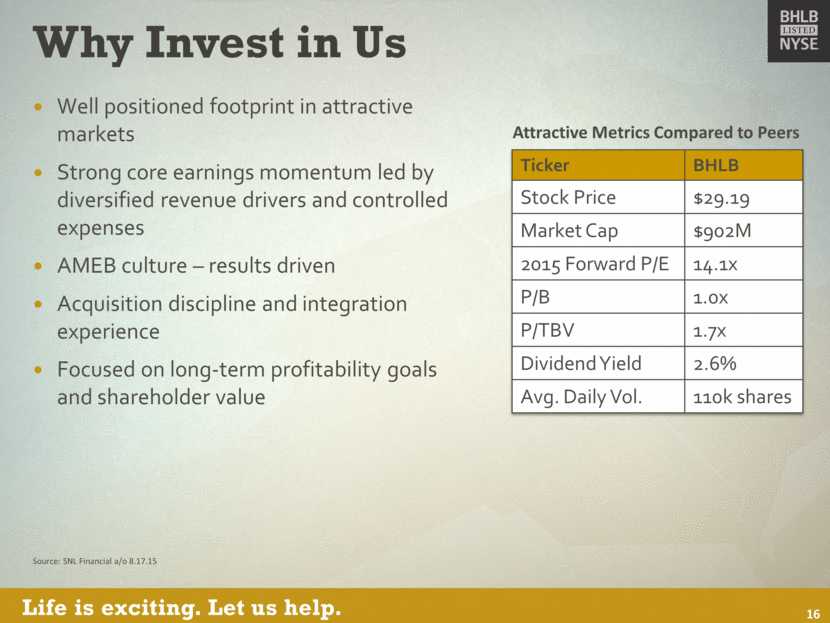
Why Invest in Us Well positioned footprint in attractive markets Strong core earnings momentum led by diversified revenue drivers and controlled expenses AMEB culture – results driven Acquisition discipline and integration experience Focused on long-term profitability goals and shareholder value Ticker BHLB Stock Price $29.19 Market Cap $902M 2015 Forward P/E 14.1x P/B 1.0x P/TBV 1.7x Dividend Yield 2.6% Avg. Daily Vol. 110k shares Source: SNL Financial a/o 8.17.15 Attractive Metrics Compared to Peers 16 |
|
|
Appendix Who We Are 1H15 Strategic Highlights Firestone Financial Acquisition Hampden Bank Acquisition Focus on Building Infrastructure Focus on Asset Liability Management Financial Performance and Goals Non-GAAP Reconciliation 17 |
|
|
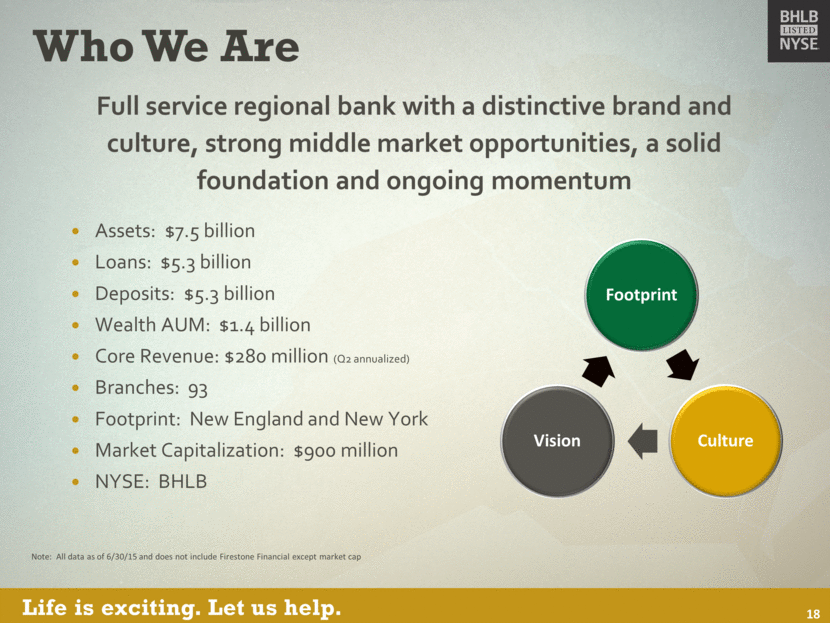
Who We Are Full service regional bank with a distinctive brand and culture, strong middle market opportunities, a solid foundation and ongoing momentum Assets: $7.5 billion Loans: $5.3 billion Deposits: $5.3 billion Wealth AUM: $1.4 billion Core Revenue: $280 million (Q2 annualized) Branches: 93 Footprint: New England and New York Market Capitalization: $900 million NYSE: BHLB 18 Note: All data as of 6/30/15 and does not include Firestone Financial except market cap Footprint Culture Vision |
|
|
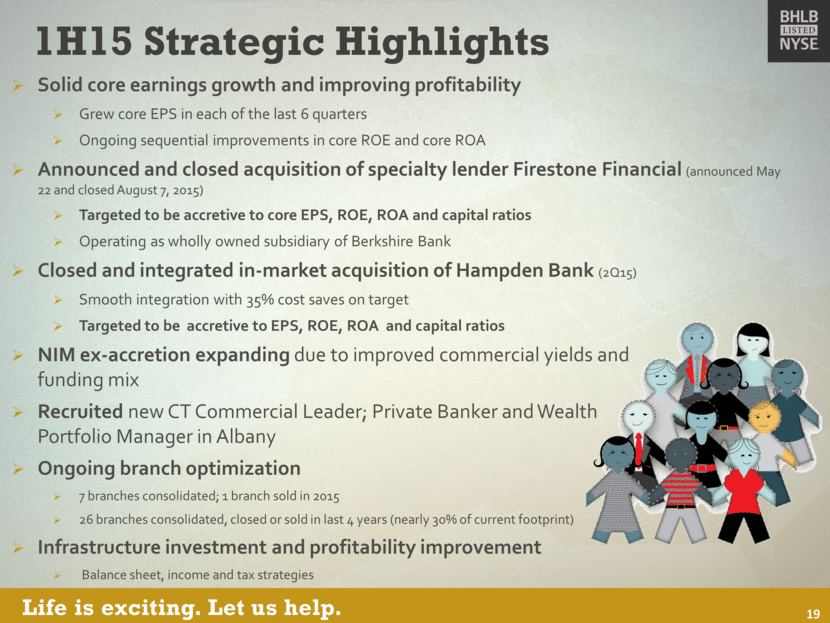
1H15 Strategic Highlights Solid core earnings growth and improving profitability Grew core EPS in each of the last 6 quarters Ongoing sequential improvements in core ROE and core ROA Announced and closed acquisition of specialty lender Firestone Financial (announced May 22 and closed August 7, 2015) Targeted to be accretive to core EPS, ROE, ROA and capital ratios Operating as wholly owned subsidiary of Berkshire Bank Closed and integrated in-market acquisition of Hampden Bank (2Q15) Smooth integration with 35% cost saves on target Targeted to be accretive to EPS, ROE, ROA and capital ratios NIM ex-accretion expanding due to improved commercial yields and funding mix Recruited new CT Commercial Leader; Private Banker and Wealth Portfolio Manager in Albany Ongoing branch optimization 7 branches consolidated; 1 branch sold in 2015 26 branches consolidated, closed or sold in last 4 years (nearly 30% of current footprint) Infrastructure investment and profitability improvement Balance sheet, income and tax strategies 19 |
|
|
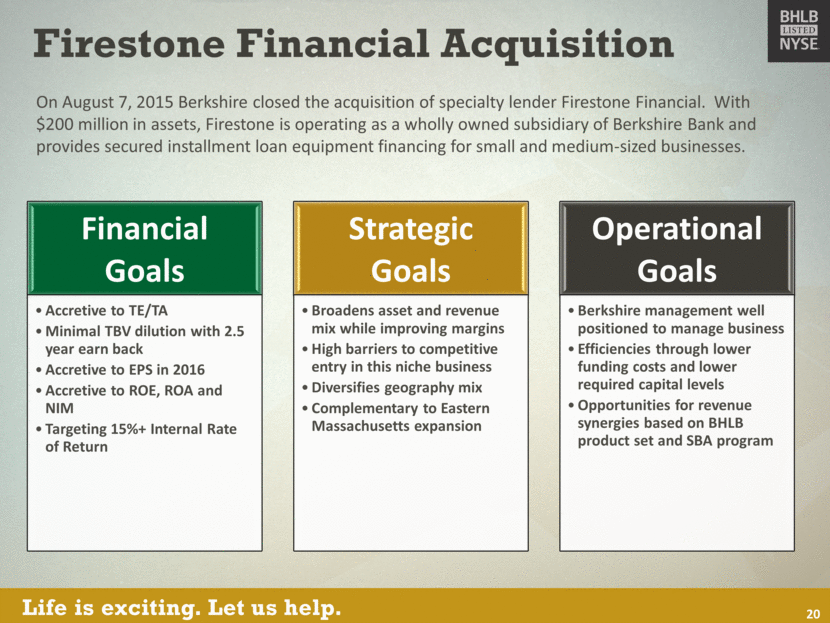
Firestone Financial Acquisition On August 7, 2015 Berkshire closed the acquisition of specialty lender Firestone Financial. With $200 million in assets, Firestone is operating as a wholly owned subsidiary of Berkshire Bank and provides secured installment loan equipment financing for small and medium-sized businesses. 20 Financial Goals Accretive to TE/TA Minimal TBV dilution with 2.5 year earn back Accretive to EPS in 2016 Accretive to ROE, ROA and NIM Targeting 15%+ Internal Rate of Return Strategic Goals Broadens asset and revenue mix while improving margins High barriers to competitive entry in this niche business Diversifies geography mix Complementary to Eastern Massachusetts expansion Operational Goals Berkshire management well positioned to manage business Efficiencies through lower funding costs and lower required capital levels Opportunities for revenue synergies based on BHLB product set and SBA program |
|
|
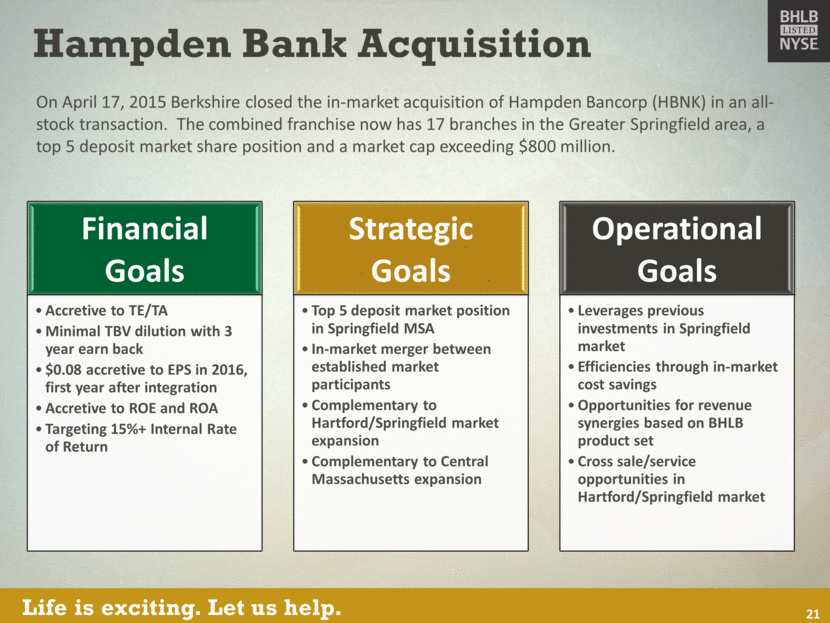
Hampden Bank Acquisition On April 17, 2015 Berkshire closed the in-market acquisition of Hampden Bancorp (HBNK) in an all-stock transaction. The combined franchise now has 17 branches in the Greater Springfield area, a top 5 deposit market share position and a market cap exceeding $800 million. 21 Financial Goals Accretive to TE/TA Minimal TBV dilution with 3 year earn back $0.08 accretive to EPS in 2016, first year after integration Accretive to ROE and ROA Targeting 15%+ Internal Rate of Return Strategic Goals Top 5 deposit market position in Springfield MSA In-market merger between established market participants Complementary to Hartford/Springfield market expansion Complementary to Central Massachusetts expansion Operational Goals Leverages previous investments in Springfield market Efficiencies through in-market cost savings Opportunities for revenue synergies based on BHLB product set Cross sale/service opportunities in Hartford/Springfield market |
|
|
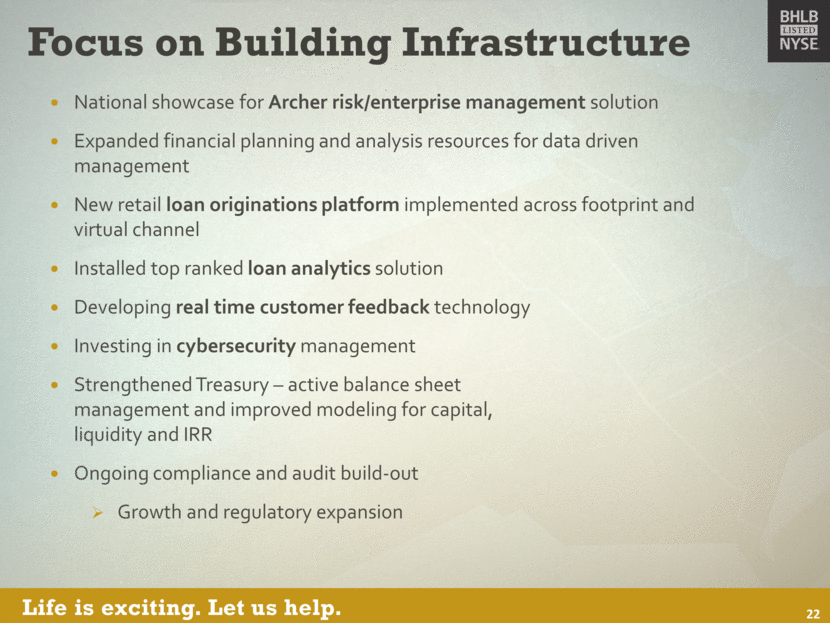
Focus on Building Infrastructure National showcase for Archer risk/enterprise management solution Expanded financial planning and analysis resources for data driven management New retail loan originations platform implemented across footprint and virtual channel Installed top ranked loan analytics solution Developing real time customer feedback technology Investing in cybersecurity management Strengthened Treasury – active balance sheet management and improved modeling for capital, liquidity and IRR Ongoing compliance and audit build-out Growth and regulatory expansion 22 |
|
|
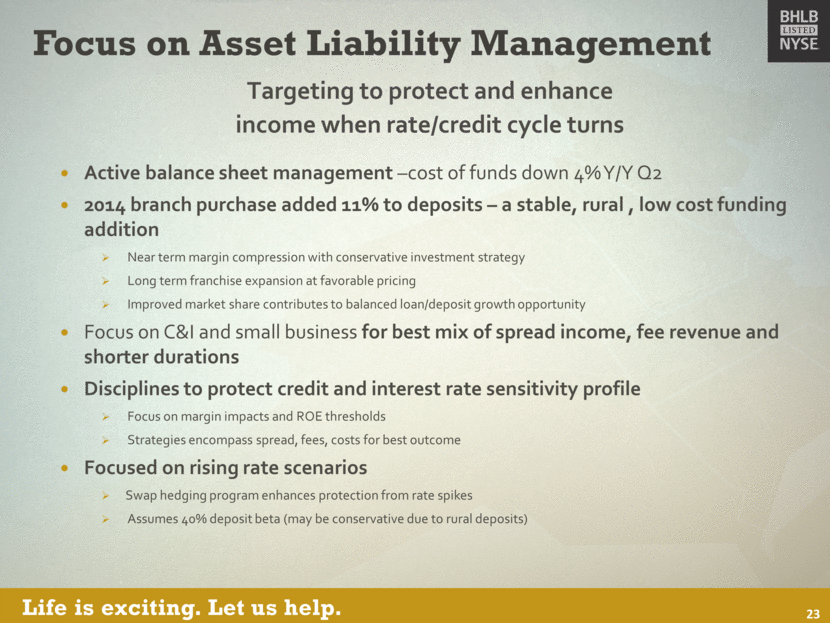
Focus on Asset Liability Management Targeting to protect and enhance income when rate/credit cycle turns Active balance sheet management –cost of funds down 4% Y/Y Q2 2014 branch purchase added 11% to deposits – a stable, rural , low cost funding addition Near term margin compression with conservative investment strategy Long term franchise expansion at favorable pricing Improved market share contributes to balanced loan/deposit growth opportunity Focus on C&I and small business for best mix of spread income, fee revenue and shorter durations Disciplines to protect credit and interest rate sensitivity profile Focus on margin impacts and ROE thresholds Strategies encompass spread, fees, costs for best outcome Focused on rising rate scenarios Swap hedging program enhances protection from rate spikes Assumes 40% deposit beta (may be conservative due to rural deposits) 23 |
|
|
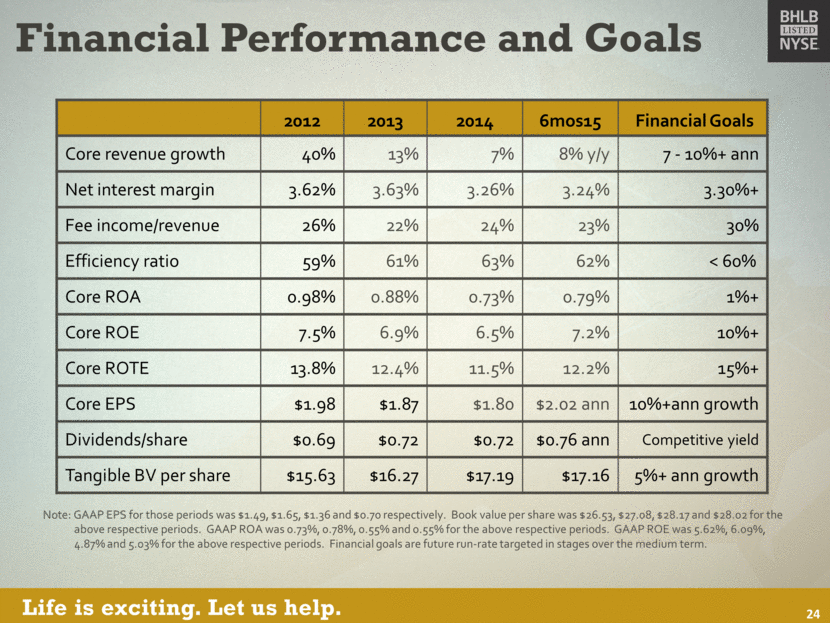
Financial Performance and Goals 2012 2013 2014 6mos15 Financial Goals Core revenue growth 40% 13% 7% 8% y/y 7 - 10%+ ann Net interest margin 3.62% 3.63% 3.26% 3.24% 3.30%+ Fee income/revenue 26% 22% 24% 23% 30% Efficiency ratio 59% 61% 63% 62% < 60% Core ROA 0.98% 0.88% 0.73% 0.79% 1%+ Core ROE 7.5% 6.9% 6.5% 7.2% 10%+ Core ROTE 13.8% 12.4% 11.5% 12.2% 15%+ Core EPS $1.98 $1.87 $1.80 $2.02 ann 10%+ann growth Dividends/share $0.69 $0.72 $0.72 $0.76 ann Competitive yield Tangible BV per share $15.63 $16.27 $17.19 $17.16 5%+ ann growth 24 Note: GAAP EPS for those periods was $1.49, $1.65, $1.36 and $0.70 respectively. Book value per share was $26.53, $27.08, $28.17 and $28.02 for the above respective periods. GAAP ROA was 0.73%, 0.78%, 0.55% and 0.55% for the above respective periods. GAAP ROE was 5.62%, 6.09%, 4.87% and 5.03% for the above respective periods. Financial goals are future run-rate targeted in stages over the medium term. |
|
|
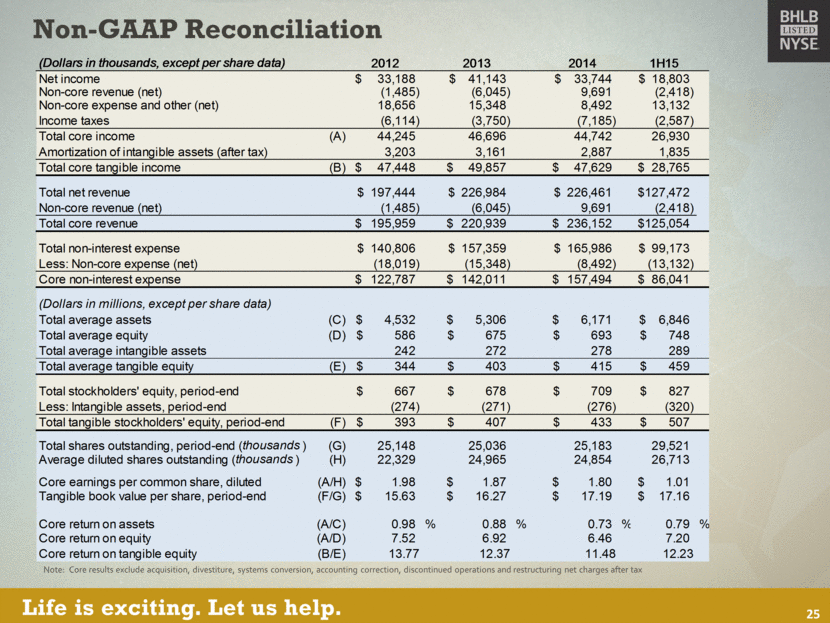
Non-GAAP Reconciliation Note: Core results exclude acquisition, divestiture, systems conversion, accounting correction, discontinued operations and restructuring net charges after tax 25 (Dollars in thousands, except per share data) 2012 2013 2014 1H15 Net income 33,188 $ 41,143 $ 33,744 $ 18,803 $ Non-core revenue (net) (1,485) (6,045) 9,691 (2,418) Non-core expense and other (net) 18,656 15,348 8,492 13,132 Income taxes (6,114) (3,750) (7,185) (2,587) Total core income (A) 44,245 46,696 44,742 26,930 Amortization of intangible assets (after tax) 3,203 3,161 2,887 1,835 Total core tangible income (B) 47,448 $ 49,857 $ 47,629 $ 28,765 $ Total net revenue 197,444 $ 226,984 $ 226,461 $ 127,472 $ Non-core revenue (net) (1,485) (6,045) 9,691 (2,418) Total core revenue 195,959 $ 220,939 $ 236,152 $ 125,054 $ Total non-interest expense 140,806 $ 157,359 $ 165,986 $ 99,173 $ Less: Non-core expense (net) (18,019) (15,348) (8,492) (13,132) Core non-interest expense 122,787 $ 142,011 $ 157,494 $ 86,041 $ (Dollars in millions, except per share data) Total average assets (C) 4,532 $ 5,306 $ 6,171 $ 6,846 $ Total average equity (D) 586 $ 675 $ 693 $ 748 $ Total average intangible assets 242 272 278 289 Total average tangible equity (E) 344 $ 403 $ 415 $ 459 $ Total stockholders' equity, period-end 667 $ 678 $ 709 $ 827 $ Less: Intangible assets, period-end (274) (271) (276) (320) Total tangible stockholders' equity, period-end (F) 393 $ 407 $ 433 $ 507 $ Total shares outstanding, period-end ( thousands ) (G) 25,148 25,036 25,183 29,521 Average diluted shares outstanding ( thousands ) (H) 22,329 24,965 24,854 26,713 Core earnings per common share, diluted (A/H) 1.98 $ 1.87 $ 1.80 $ 1.01 $ Tangible book value per share, period-end (F/G) 15.63 $ 16.27 $ 17.19 $ 17.16 $ Core return on assets (A/C) 0.98 % 0.88 % 0.73 % 0.79 % Core return on equity (A/D) 7.52 6.92 6.46 7.20 Core return on tangible equity (B/E) 13.77 12.37 11.48 12.23 |
|
|
If you have any questions, please contact: Allison O’Rourke 99 North Street Pittsfield, MA 01202 Investor Relations Officer (413) 236-3149 [email protected] |
Serious News for Serious Traders! Try StreetInsider.com Premium Free!
You May Also Be Interested In
- SchoolsFirst Federal Credit Union Sponsors Cal Poly Pomona Partners in Education (PIE) Fellowship Awards
- CDT Environmental Technology Investment Holdings Limited Announces Pricing of Initial Public Offering and Listing on Nasdaq
- ERP Advisors Group Examines ERP Implementation Case Studies for Private Equity Companies
Create E-mail Alert Related Categories
SEC FilingsSign up for StreetInsider Free!
Receive full access to all new and archived articles, unlimited portfolio tracking, e-mail alerts, custom newswires and RSS feeds - and more!


 Tweet
Tweet Share
Share