Form 8-K BERKSHIRE HILLS BANCORP For: Aug 02
UNITED STATES
SECURITIES AND EXCHANGE COMMISSION
WASHINGTON, D.C. 20549
FORM 8-K
CURRENT REPORT
PURSUANT TO SECTION 13 OR 15(D) OF
THE SECURITIES EXCHANGE ACT OF 1934
Date of Report (Date of earliest event reported): August 2, 2016
BERKSHIRE HILLS BANCORP, INC.
(Exact Name of Registrant as Specified in its Charter)
|
Delaware |
|
001-15781 |
|
04-3510455 |
|
(State or Other Jurisdiction |
|
(Commission File No.) |
|
(I.R.S. Employer |
|
24 North Street, Pittsfield, Massachusetts |
|
01201 |
|
(Address of Principal Executive Offices) |
|
(Zip Code) |
Registrant’s telephone number, including area code: (413) 443-5601
Not Applicable
(Former Name or Former Address, if Changed Since Last Report)
Check the appropriate box below if the Form 8-K filing is intended to simultaneously satisfy the filing obligation of the registrant under any of the following provisions (see General Instruction A.2. below):
o Written communications pursuant to Rule 425 under the Securities Act (17 CFR 230.425)
o Soliciting material pursuant to Rule 14a-12 under the Exchange Act (17 CFR 240.14a-12)
o Pre-commencement communications pursuant to Rule 14d-2(b) under the Exchange Act (17 CFR 240.14d-2(b))
o Pre-commencement communications pursuant to Rule 13e-4(c) under the Exchange Act (17 CFR 240.13e-4(c))
Item 7.01. Regulation FD Disclosure
On August 2, 2016, Berkshire Hills Bancorp, Inc. (the “Company”) made available its presentation slides for the KBW Community Bank Investor Conference. The presentation slides are included in this report as Exhibit 99.1 and are furnished herewith, and shall not be deemed “filed” for any purpose.
Item 9.01. Financial Statements and Exhibits
(a) Financial Statements of Businesses Acquired. Not applicable.
(b) Pro Forma Financial Information. Not applicable.
(c) Shell Company Transactions. Not applicable.
(d) Exhibits.
|
Exhibit No. |
|
Description |
|
|
|
|
|
99.1 |
|
Berkshire Hills Bancorp, Inc. presentation slides for the KBW Community Bank Investor Conference |
SIGNATURES
Pursuant to the requirements of the Securities Exchange Act of 1934, the registrant has duly caused this report to be signed on its behalf by the undersigned, hereunto duly authorized.
|
|
Berkshire Hills Bancorp, Inc. | |
|
|
|
|
|
|
|
|
|
DATE: August 2, 2016 |
By: |
/s/ Wm. Gordon Prescott |
|
|
|
Wm. Gordon Prescott |
|
|
|
Senior Vice President and General Counsel |
Exhibit 99.1
Berkshire Hills Bancorp KBW Community Bank Investor Conference August 2, 2016

Who We Are Assets: $8.0 billion Loans: $6.0 billion Deposits: $5.7 billion Wealth AUM: $1.4 billion Revenue: $286 million (LTM) Branches: 93 Footprint: New England and New York Market Capitalization: $839 million NYSE: BHLB Pending agreement to acquire First Choice Bank (NJ, PA), including First Choice Loan Services (Nat’l) Note: All data as of 06/30/16 2 Full service regional bank with a distinctive brand and culture, strong middle market opportunities, a solid foundation and ongoing momentum
Why Berkshire? AMEB culture – results driven Well positioned footprint in attractive markets Strong momentum led by diversified revenue drivers and controlled expenses Acquisition discipline and integration experience Focused on profitability goals and driving shareholder value 3
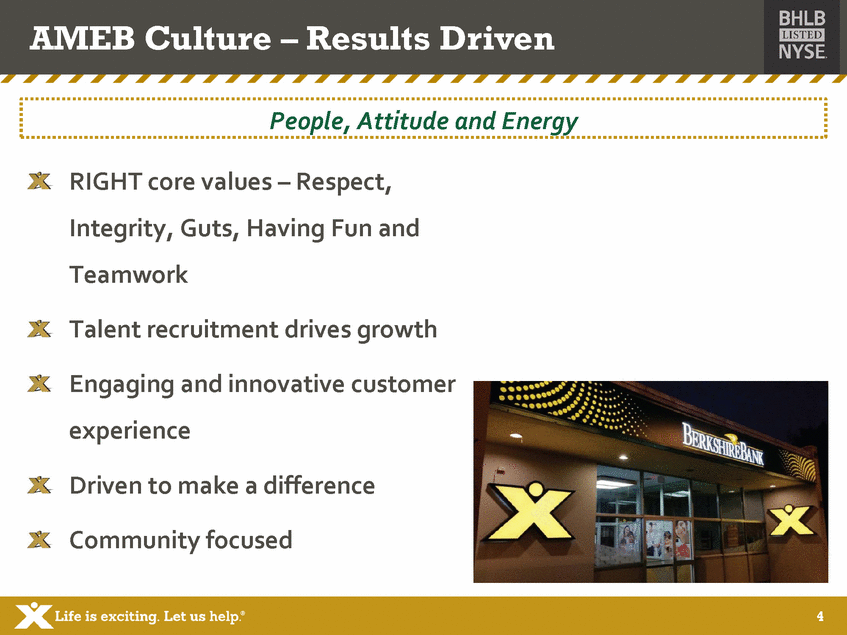
AMEB Culture – Results Driven RIGHT core values – Respect, Integrity, Guts, Having Fun and Teamwork Talent recruitment drives growth Engaging and innovative customer experience Driven to make a difference Community focused 4 People, Attitude and Energy
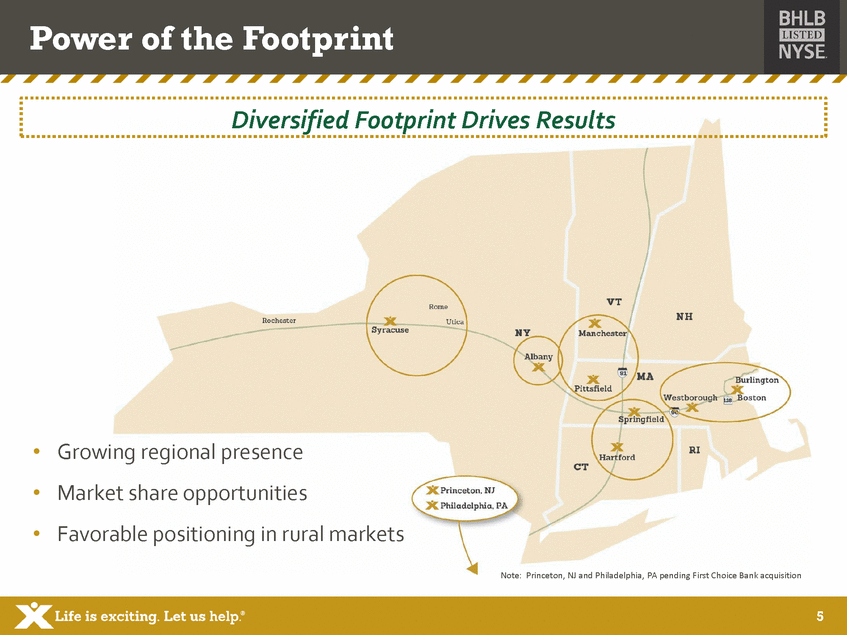
Power of the Footprint • • • Growing regional presence Market share opportunities Favorable positioning in rural markets Note: Princeton, NJ and Philadelphia, PA pending First Choice Bank acquisition 5 Diversified Footprint Drives Results
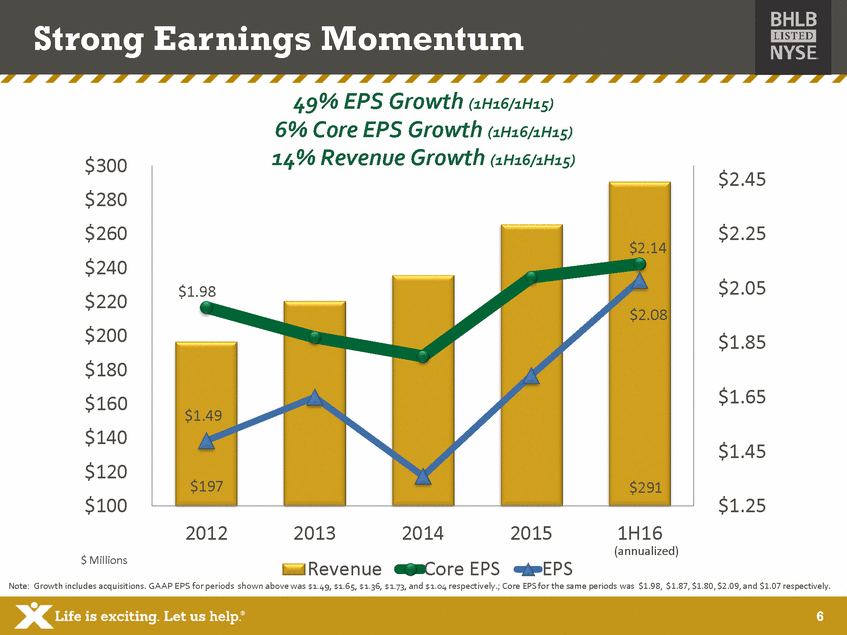
Strong Earnings Momentum 49% EPS Growth (1H16/1H15) 6% Core EPS Growth (1H16/1H15) 14% Revenue Growth (1H16/1H15) $300 $280 $260 $240 $220 $200 $180 $160 $140 $120 $100 $2.45 $2.25 $2.05 $1.85 $1.65 $1.45 $1.25 2012 2013 Revenue 2014 2015 1H16 (annualized) $ Millions Core EPS EPS Note: Growth includes acquisitions. GAAP EPS for periods shown above was $1.49, $1.65, $1.36, $1.73, and $1.04 respectively.; Core EPS for the same periods was $1.98, $1.87, $1.80, $2.09, and $1.07 respectively. 6 $2.14 $1.98 $2.08 $1.49 $197$291
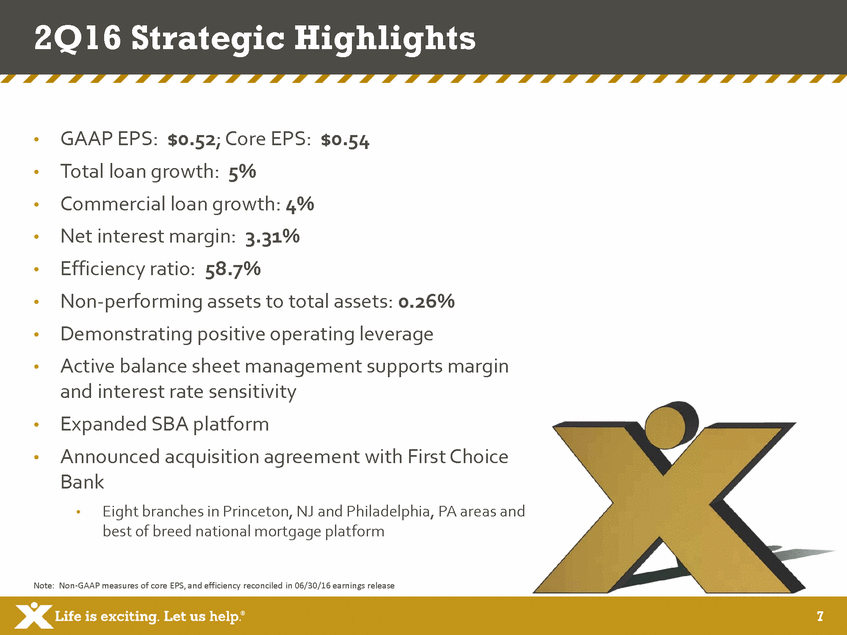
2Q16 Strategic Highlights GAAP EPS: $0.52; Core EPS: $0.54 Total loan growth: 5% Commercial loan growth: 4% Net interest margin: 3.31% Efficiency ratio: 58.7% Non-performing assets to total assets: 0.26% Demonstrating positive operating leverage Active balance sheet management supports margin and interest rate sensitivity Expanded SBA platform Announced acquisition agreement with First Choice Bank • • • • • • • • • • Eight branches in Princeton, NJ and Philadelphia, PA areas and best of breed national mortgage platform • Note: Non-GAAP measures of core EPS, and efficiency reconciled in 06/30/16 earnings release 7
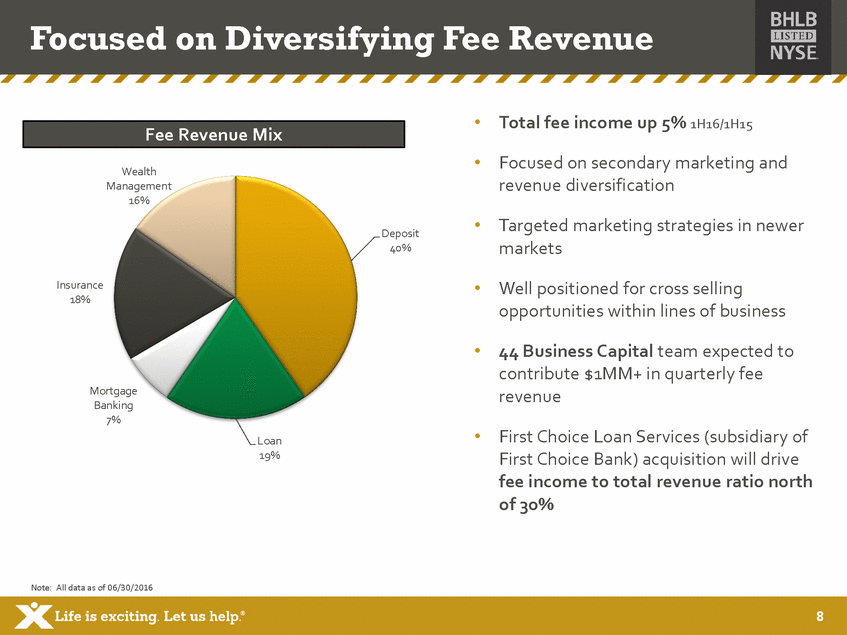
Focused on Diversifying Fee Revenue • Total fee income up 5% 1H16/1H15 • Focused on secondary marketing and revenue diversification Wealth Management 16% • Targeted marketing strategies in newer markets Deposit 40% • Insurance 18% Well positioned for cross selling opportunities within lines of business • 44 Business Capital team expected to contribute $1MM+ in quarterly fee revenue Mortgage Banking 7% • First Choice Loan Services (subsidiary of First Choice Bank) acquisition will drive fee income to total revenue ratio north of 30% Loan 19% Note: All data as of 06/30/2016 8 Fee Revenue Mix
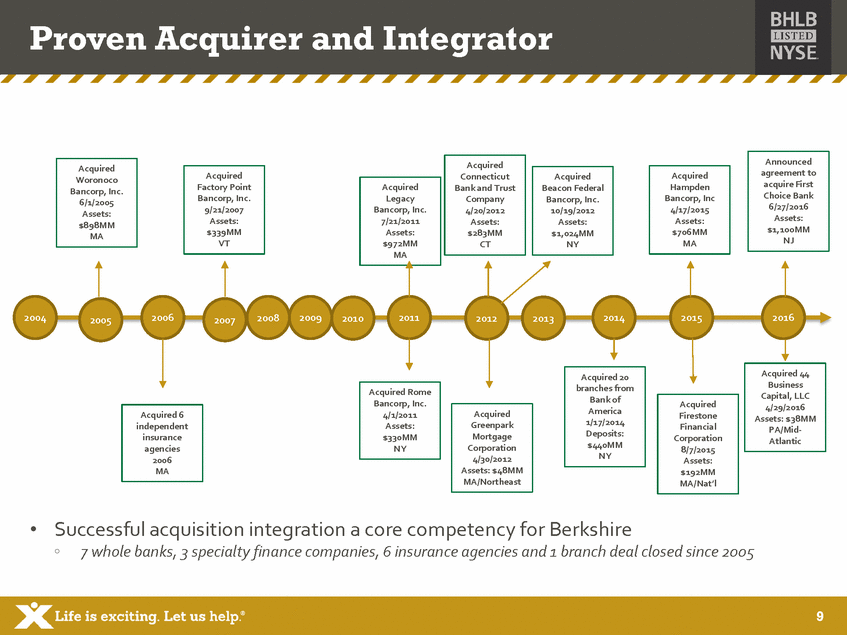
Proven Acquirer and Integrator Legacy 7/21/2011 $972MM 2004 2006 2008 2009 2011 2014 2015 2016 2010 2012 2013 2005 2007 Greenpark Corporation • Successful acquisition integration a core competency for Berkshire 7 whole banks, 3 specialty finance companies, 6 insurance agencies and 1 branch deal closed since 2005 9 Acquired Mortgage 4/30/2012 Assets: $48MM MA/Northeast Acquired 6 independent insurance agencies 2006 MA Acquired Firestone Financial Corporation 8/7/2015 Assets: $192MM MA/Nat’l Acquired Rome Bancorp, Inc. 4/1/2011 Assets: $330MM NY Acquired 20 branches from Bank of America 1/17/2014 Deposits: $440MM NY Acquired 44 Business Capital, LLC 4/29/2016 Assets: $38MM PA/Mid-Atlantic Acquired Bancorp, Inc. Assets: MA Acquired Hampden Bancorp, Inc 4/17/2015 Assets: $706MM MA Acquired Beacon Federal Bancorp, Inc. 10/19/2012 Assets: $1,024MM NY Acquired Factory Point Bancorp, Inc. 9/21/2007 Assets: $339MM VT Acquired Woronoco Bancorp, Inc. 6/1/2005 Assets: $898MM MA Acquired Connecticut Bank and Trust Company 4/20/2012 Assets: $283MM CT Announced agreement to acquire First Choice Bank 6/27/2016 Assets: $1,100MM NJ
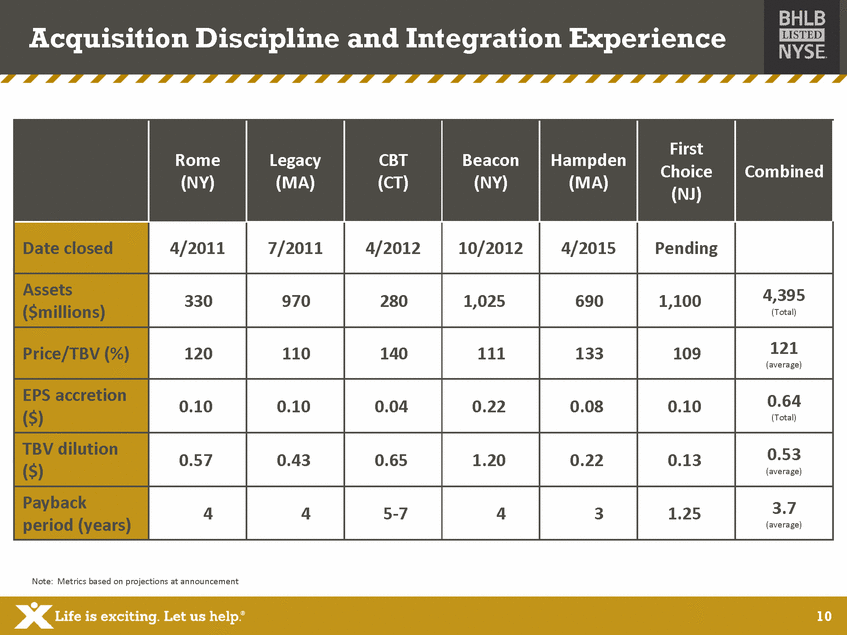
Acquisition Discipline and Integration Experience (Total) (average) (Total) (average) (average) Note: Metrics based on projections at announcement 10 Rome (NY) Legacy (MA) CBT (CT) Beacon (NY) Hampden (MA) First Choice (NJ) Combined Date closed 4/2011 7/2011 4/2012 10/2012 4/2015 Pending Assets ($millions) 330 970 280 1,025 690 1,100 4,395 Price/TBV (%) 120 110 140 111 133 109 121 EPS accretion ($) 0.10 0.10 0.04 0.22 0.08 0.10 0.64 TBV dilution ($) 0.57 0.43 0.65 1.20 0.22 0.13 0.53 Payback period (years) 4 4 5-7 4 3 1.25 3.7
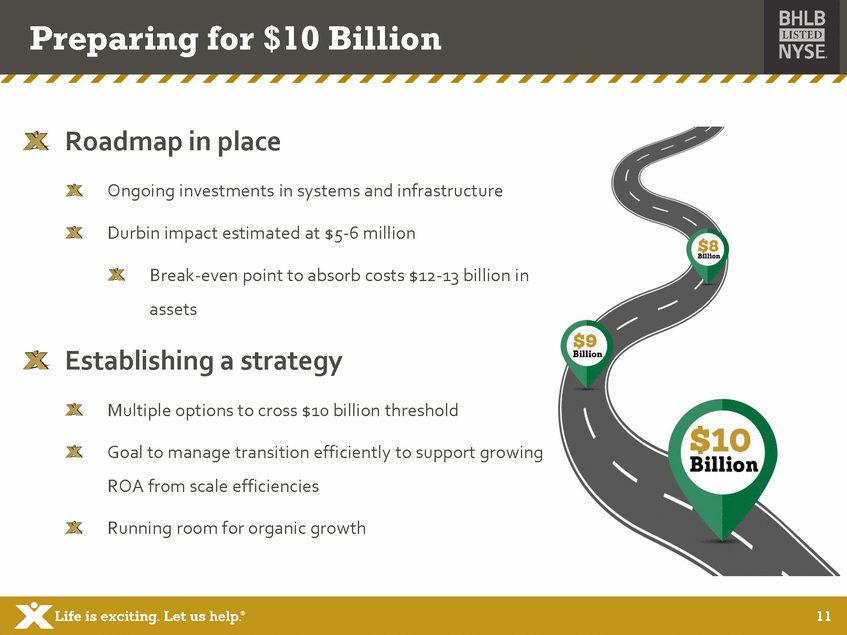
Preparing for $10 Billion Roadmap in place Ongoing investments in systems and infrastructure Durbin impact estimated at $5-6 million Break-even point to absorb costs $12-13 billion in assets Establishing a strategy Multiple options to cross $10 billion threshold Goal to manage transition efficiently to support growing ROA from scale efficiencies Running room for organic growth 11
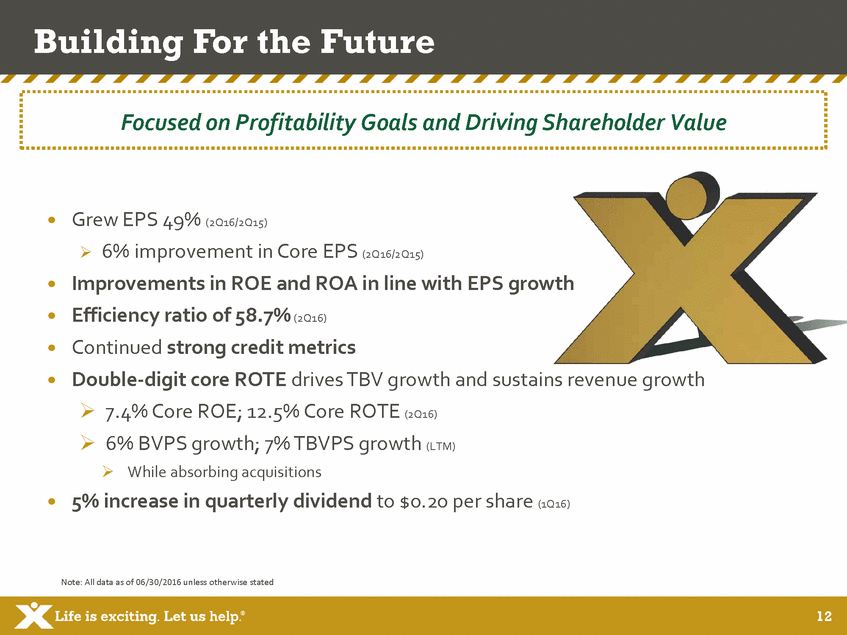
Building For the Future Grew EPS 49% (2Q16/2Q15) 6% improvement in Core EPS (2Q16/2Q15) Improvements in ROE and ROA in line with EPS growth Efficiency ratio of 58.7% (2Q16) Continued strong credit metrics Double-digit core ROTE drives TBV growth and sustains revenue growth 7.4% Core ROE; 12.5% Core ROTE (2Q16) 6% BVPS growth; 7% TBVPS growth (LTM) While absorbing acquisitions 5% increase in quarterly dividend to $0.20 per share (1Q16) Note: All data as of 06/30/2016 unless otherwise stated 12 Focused on Profitability Goals and Driving Shareholder Value
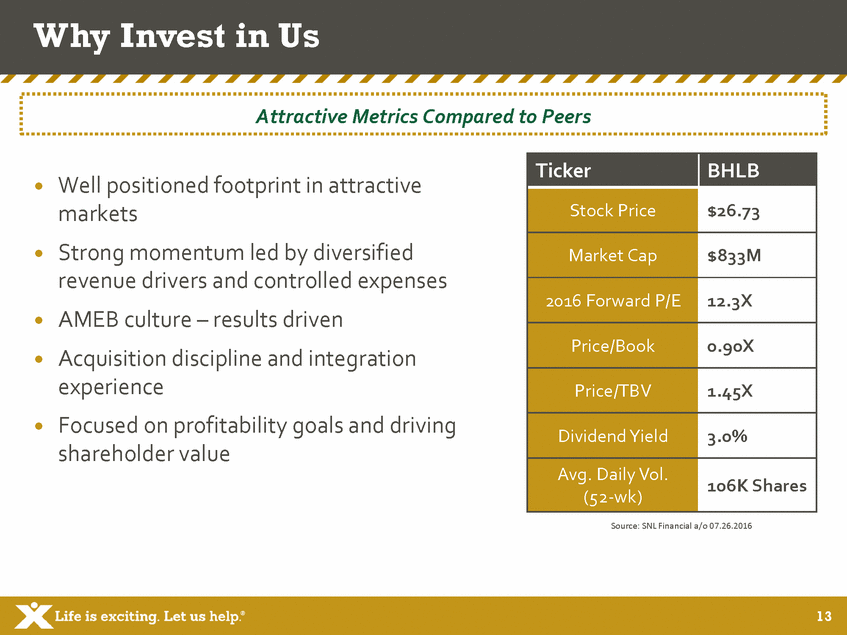
Why Invest in Us Well positioned footprint in attractive markets Strong momentum led by diversified revenue drivers and controlled expenses AMEB culture – results driven Acquisition discipline and integration experience Focused on profitability goals and driving shareholder value Source: SNL Financial a/o 07.26.2016 13 Ticker BHLB Stock Price $26.73 Market Cap $833M 2016 Forward P/E 12.3X Price/Book 0.90X Price/TBV 1.45X Dividend Yield 3.0% Avg. Daily Vol. (52-wk) 106K Shares Attractive Metrics Compared to Peers
Appendix Loan Mix Deposit Mix Credit Quality Expenses Customer Experience Disclosures 14

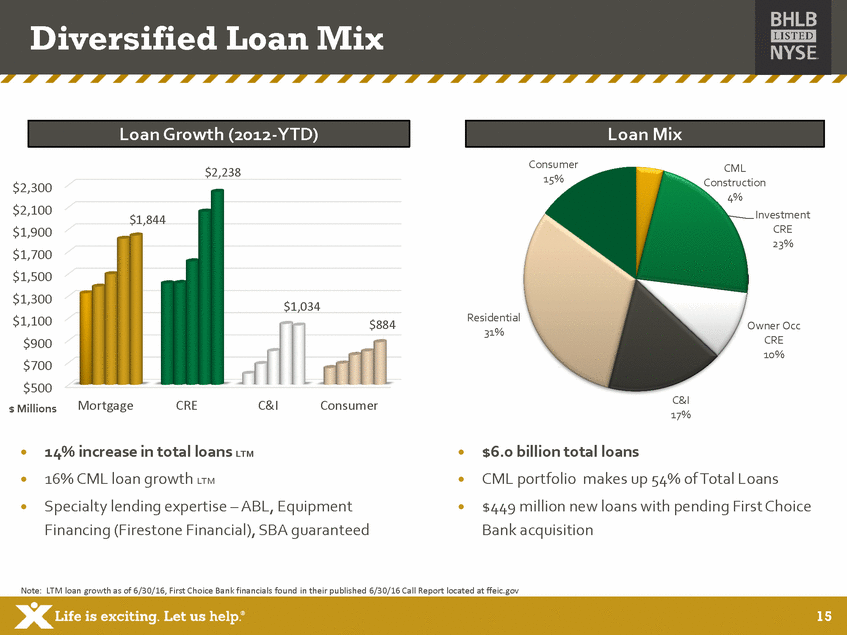
Diversified Loan Mix Consumer 15% CML Construction 4% Investment CRE 23% $2,238 $2,300 $2,100 $1,900 $1,700 $1,500 $1,300 $1,100 $900 $700 $500 $ Millions $1,844 $1,034 Residential 31% $884 Owner Occ CRE 10% C&I 17% Mortgage CRE C&I Consumer 14% increase in total loans LTM 16% CML loan growth LTM Specialty lending expertise – ABL, Equipment Financing (Firestone Financial), SBA guaranteed $6.0 billion total loans CML portfolio makes up 54% of Total Loans $449 million new loans with pending First Choice Bank acquisition Note: LTM loan growth as of 6/30/16, First Choice Bank financials found in their published 6/30/16 Call Report located at ffeic.gov 15 Loan Growth (2012-YTD) Loan Mix
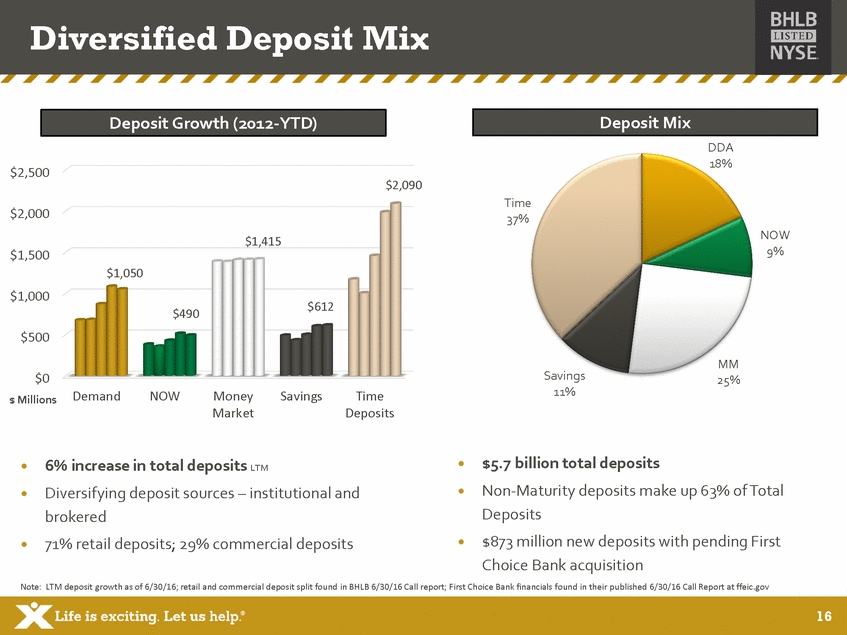
Diversified Deposit Mix DDA 18% $2,500 $2,090 Time 37% $2,000 NOW 9% $1,415 $1,500 $1,050 $1,000 $612 $490 $500 MM 25% Savings 11% $0 $ Millions Demand NOW MoneySavings Market Time Deposits $5.7 billion total deposits Non-Maturity deposits make up 63% of Total Deposits $873 million new deposits with pending First Choice Bank acquisition 6% increase in total deposits LTM Diversifying deposit sources – institutional and brokered 71% retail deposits; 29% commercial deposits Note: LTM deposit growth as of 6/30/16; retail and commercial deposit split found in BHLB 6/30/16 Call report; First Choice Bank financials found in their published 6/30/16 Call Report at ffeic.gov 16 Deposit Growth (2012-YTD) Deposit Mix
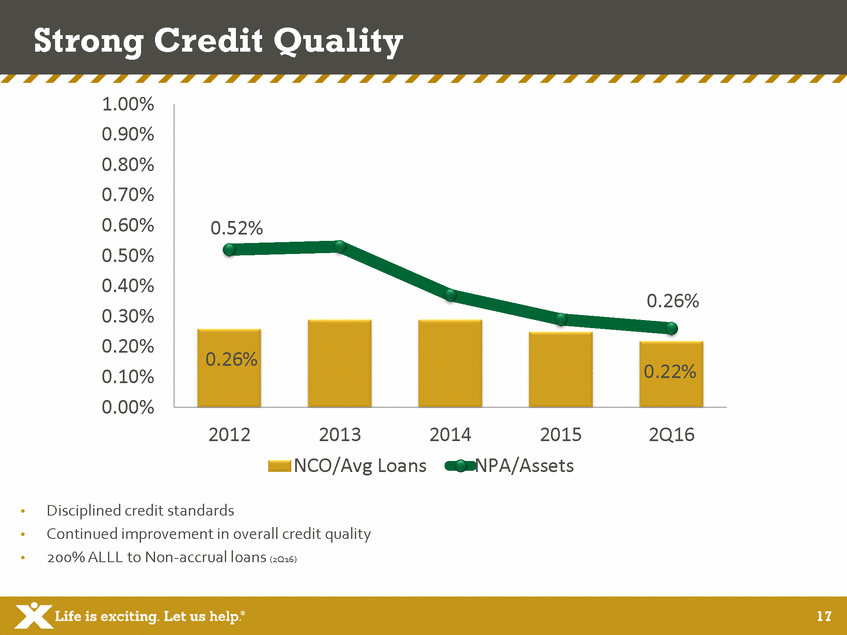
Strong Credit Quality 1.00% 0.90% 0.80% 0.70% 0.60% 0.50% 0.40% 0.30% 0.20% 0.10% 0.00% 2012 2013 NCO/Avg Loans 2014 2015 NPA/Assets 2Q16 Disciplined credit standards Continued improvement in overall credit quality 200% ALLL to Non-accrual loans (2Q16) • • • 17 0.52% 0.26% 0.26%0.22%
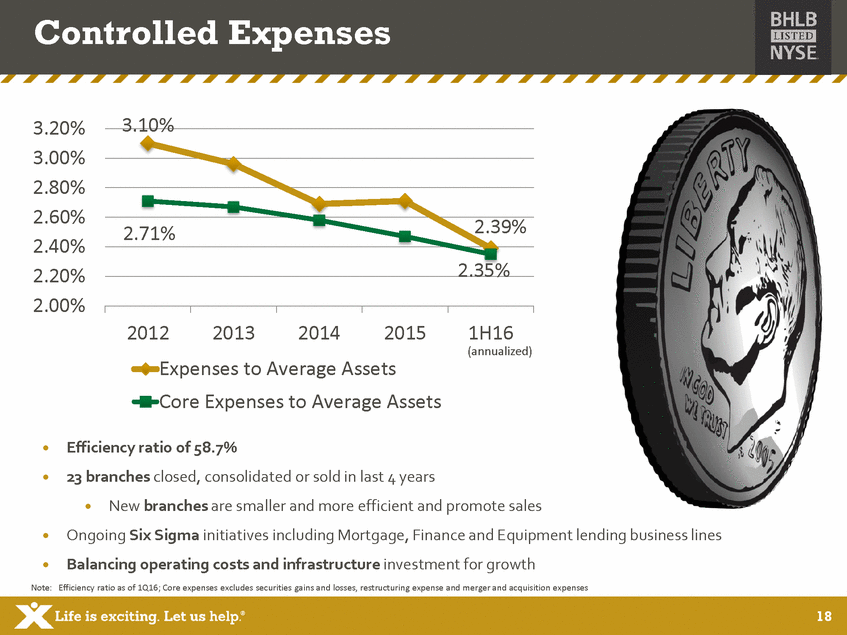
Controlled Expenses 3.10% 3.20% 3.00% 2.80% 2.60% 2.40% 2.20% 2.00% 2.39% 2.71% 2.35% 2012 2013 2014 2015 1H16 (annualized) Expenses to Average Assets Core Expenses to Average Assets Efficiency ratio of 58.7% 23 branches closed, consolidated or sold in last 4 years New branches are smaller and more efficient and promote sales Ongoing Six Sigma initiatives including Mortgage, Finance and Equipment lending business lines Balancing operating costs and infrastructure investment for growth Note: Efficiency ratio as of 1Q16; Core expenses excludes securities gains and losses, restructuring expense and merger and acquisition expenses 18
Redefining Customer Engagement Engaging Branches Virtual / Alternative Friendlier pods replace teller lines Automated cash handling – lowers cost and improves customer engagement Community rooms bring in traffic Universal bankers create one stop shop for personal banking and insurance needs Real time interactive customer feedback tool located in branches Instant issue debit cards available in branches for account holders Sophisticated online and mobile platforms complement storefronts MyBanker travels to customer State of the art call center Enhanced online security Apple Pay® capabilities for deposit customers Customer support via Text AMEB1 o o o o o o o o o o o o 19
FORWARD LOOKING STATEMENTS This document contains forward-looking statements as defined in the Private Securities Litigation Reform Act of 1995. There are several factors that could cause actual results to differ significantly from expectations described in the forward-looking statements. For a discussion of such factors, please see Berkshire’s most recent reports on Forms 10-K and Exchange Commission and available on the SEC’s website at undertake any obligation to update forward-looking statements. 10-Q filed with the Securities and www.sec.gov. Berkshire does not 20
NON-GAAP FINANCIAL MEASURES This document contains certain non-GAAP financial measures in addition to results presented in accordance with Generally Accepted Accounting Principles (“GAAP”). These non-GAAP measures provide supplemental perspectives on operating results, performance trends, and financial condition. They are not a substitute for GAAP measures; they should be read and used in conjunction with the Company’s GAAP financial information. A reconciliation of non-GAAP financial measures to GAAP measures is included on pages F-9 and F-10 in the accompanying financial tables. In all cases, it should be understood that non-GAAP per share measures do not depict amounts that accrue directly to the benefit of shareholders. The Company utilizes the non-GAAP measure of core earnings in evaluating operating trends, including components for core revenue and expense. These measures exclude securities gains/losses, merger costs, restructuring costs, and systems conversion costs. Non-core adjustments are presented net of an adjustment for income tax expense. This adjustment is determined as the difference between the GAAP tax rate and the effective tax rate applicable to core income. The efficiency ratio is adjusted for non-core revenue and expense items and for tax preference items. The Company also calculates measures related to tangible equity, which adjust equity (and assets where applicable) to exclude intangible assets due to the importance of these measures to the investment community. Charges related to merger and acquisition activity consist primarily of severance/benefit related expenses, contract termination costs, systems conversion costs, variable compensation expenses, and professional fees. These charges are related to the following business combinations: First Choice (pending), 44 Business Capital, Hampden Bancorp, and Firestone Financial. Restructuring costs primarily consist of costs and losses associated with the disposition of assets and liabilities and lease terminations, including costs related to branch sales The Company’s disclosures of organic growth of loans and deposits in 2015 exclude balances acquired through the business combinations with Hampden Bancorp and Firestone Financial, and in 2016 are adjusted for the acquisition of the business operations related to 44 Business Capital. 21
ADDITIONAL INFORMATION AND WHERE TO FIND IT In connection with the proposed merger, Berkshire will file with the securities and exchange commission (“sec”) a registration statement on form s-4 that will include a proxy statement of first choice and a prospectus of Berkshire, as well as other relevant documents concerning the proposed merger. This filing is anticipated for the third quarter. Investors and stockholders are urged to read the registration statement and the proxy statement/prospectus regarding the proposed merger when it becomes available and any other relevant documents filed with the SEC, as well as any amendments or supplements to those documents, because they will contain important information. A free copy of the Registration Statement and Proxy Statement/Prospectus, as well as other filings containing information about Berkshire and First Choice, when they become available, may be obtained at the SEC’s Internet site (www.sec.gov). Copies of the Registration Statement and Proxy Statement/Prospectus (when they become available) and the filings that will be incorporated by reference therein may also be obtained, free of charge, from Berkshire’s website at ir.berkshirebank.com or by contacting Berkshire Investor Relations at 413-236-3149 or by contacting Lisa Tuccillo at First Choice at 609-503-4828. PARTICIPANTS IN SOLICITATION Berkshire and First Choice and certain of their respective directors and executive officers may be deemed to be participants in the solicitation of proxies from the stockholders of First Choice in connection with the proposed merger. Information about the directors and executive officers of Berkshire is set forth in the proxy statement for Berkshire’s 2016 annual meeting of stockholders, as filed with the SEC on a Schedule 14A on March 24, 2016. Information about the directors and executive officers of First Choice will be set forth in the Proxy Statement/Prospectus. Additional information regarding the interests of those participants and other persons who may be deemed participants in the transaction and a description of their direct and indirect interests, by security holdings or otherwise, may be obtained by reading the Proxy Statement/Prospectus and other relevant documents regarding the proposed merger to be filed with the SEC (when they become available). Free copies of these documents may be obtained as described in the preceding paragraph. 22
XLife is exciting. Let us help.• 23
If you have any questions, please contact: Allison O’Rourke 99 North Street Pittsfield, MA 01202 Investor Relations Officer (413) 236-3149 [email protected]

Serious News for Serious Traders! Try StreetInsider.com Premium Free!
You May Also Be Interested In
- Berkshire Hills Bancorp (BHLB) PT Lowered to $24 at Keefe, Bruyette & Woods
- I'm Breaking New Ground at CNH - Katie Hoare
- NLS Pharmaceutics Announces Receipt of Staff Delisting Determination from Nasdaq; Intends to Request Hearing
Create E-mail Alert Related Categories
SEC FilingsSign up for StreetInsider Free!
Receive full access to all new and archived articles, unlimited portfolio tracking, e-mail alerts, custom newswires and RSS feeds - and more!


 Tweet
Tweet Share
Share