

Form 8-K BENCHMARK ELECTRONICS For: Feb 09
 Tweet
Tweet Share
Share
UNITED STATES
SECURITIES AND EXCHANGE COMMISSION
Washington, D.C. 20549
FORM 8-K
CURRENT REPORT
Pursuant to Section 13 or 15(d) of
the Securities Exchange Act of 1934
Date of Report (Date of earliest event reported): February 9, 2016
BENCHMARK ELECTRONICS, INC.
(Exact name of registrant as specified in its charter)
|
Texas (State or other jurisdiction of incorporation) |
1-10560 (Commission File Number) |
74-2211011 (I.R.S. Employer Identification No.) |
3000 Technology Drive, Angleton, Texas 77515
(Address of principal executive offices) (Zip code)
Registrant’s telephone number, including area code: (979) 849-6550
Check the appropriate box below if the Form 8-K filing is intended to simultaneously satisfy the filing obligation of the registrant under any of the following provisions (see General Instruction A.2. below):
[ ] Written communications pursuant to Rule 425 under the Securities Act (17 CFR 230.425)
[ ] Soliciting material pursuant to Rule 14a-12 under the Exchange Act (17 CFR 240.14a-12)
[ ] Pre-commencement communications pursuant to Rule 14d-2(b) under the Exchange Act (17 CFR 240.14d-2(b))
[ ] Pre-commencement communications pursuant to Rule 13e-4(c) under the Exchange Act (17 CFR 240.13e-4(c))
Item 2.02. Results of Operations and Financial Condition.
On February 9, 2016, we issued a press release announcing our results of operations for the quarter and year ended December 31, 2015 and held an earnings conference call. Copies of the press release and presentation slides used in connection with the conference call are attached as Exhibit 99.1 and Exhibit 99.2 to this report and are hereby incorporated herein by reference.
Item 9.01. Financial Statements and Exhibits.
(d) Exhibits
Exhibit 99.1 Press release
Exhibit 99.2 Presentation slides
SIGNATURE
Pursuant to the requirements of the Securities Exchange Act of 1934, the registrant has duly caused this report to be signed on its behalf by the undersigned hereunto duly authorized.
|
|
BENCHMARK ELECTRONICS, INC. |
|
Dated: February 10, 2016 |
By: /s/ Gayla J. Delly |
|
|
Gayla J. Delly |
|
|
Chief Executive Officer |
|
|
|
-1-
|
EXHIBIT INDEX |
||
|
|
|
|
|
Exhibit |
|
|
|
Number |
|
Description of Exhibit |
|
|
|
|
|
99.1 |
|
Press release |
|
99.2 |
|
Presentation slides |
Exhibit 99.1
FOR IMMEDIATE RELEASE
BENCHMARK ELECTRONICS REPORTS FOURTH QUARTER AND FY 2015 RESULTS
· Quarterly operating margin (non-GAAP) of 4.5% was the highest since 2007
· Operating margin (non-GAAP) increased 50 basis points year-over-year and 20 basis points quarter-over-quarter
· Increased annual operating cash flow to $147 million
· Repurchased $68 million of common shares in 2015
ANGLETON, TX, February 9, 2016 – Benchmark Electronics, Inc. (NYSE: BHE) today announced financial results for the fourth quarter and year ended December 31, 2015.
|
|
|
|
Three Months Ended |
|
||||||
|
|
|
|
Dec 31, |
|
|
Sep 30, |
|
|
Dec 31, |
|
|
|
|
2015 |
|
|
2015 |
|
|
2014 |
|
|
|
Net sales (in millions) |
|
$626 |
|
|
$630 |
|
|
$710 |
|
|
|
Net income (in millions) |
|
$39 |
|
|
$21 |
|
|
$23 |
|
|
|
Net income – non-GAAP (in millions)* |
|
$23 |
|
|
$21 |
|
|
$23 |
|
|
|
Diluted EPS |
|
$0.77 |
|
|
$0.40 |
|
|
$0.44 |
|
|
|
Diluted EPS – non-GAAP* |
|
$0.45 |
|
|
$0.41 |
|
|
$0.42 |
|
|
|
Operating margin (%) |
|
3.5% |
|
|
4.1% |
|
|
4.0% |
|
|
|
Operating margin – non-GAAP (%) |
|
4.5% |
|
|
4.3% |
|
|
4.0% |
|
|
|
|
|
|
Twelve Months Ended |
|
|||
|
|
|
|
Dec 31, |
|
|
Dec 31, |
|
|
|
|
2015 |
|
|
2014 |
|
|
|
Net sales (in millions) |
|
$2,541 |
|
|
$2,797 |
|
|
|
Net income (in millions) |
|
$95 |
|
|
$81 |
|
|
|
Net income – non-GAAP (in millions)* |
|
$84 |
|
|
$88 |
|
|
|
Diluted EPS |
|
$1.83 |
|
|
$1.50 |
|
|
|
Diluted EPS – non-GAAP* |
|
$1.61 |
|
|
$1.63 |
|
|
|
Operating margin (%) |
|
3.7% |
|
|
3.6% |
|
|
|
Operating margin – non-GAAP (%) |
|
4.2% |
|
|
3.9% |
|
|
* A detailed reconciliation between the GAAP results and results excluding special items (non-GAAP) is included at the end of this press release.
“2015 marked a year of continued progress on Benchmark’s key strategic initiatives. Through focused and consistent execution, we achieved 55% revenue contribution from customers in our Industrial, Medical and Test & Instrumentation sectors,” said Gayla Delly, Benchmark’s President and Chief Executive Officer. “Continued emphasis in these strategic markets, coupled with our focus on operational excellence, is a key driver of our ongoing margin expansion strategy. In the fourth quarter, we delivered a 50 basis point year-over-year and a 20 basis point quarter-over-
quarter improvement in operating margin and achieved our target of exiting 2015 with a 4.5% non-GAAP operating margin.”
“The acquisition of Secure Technology in the fourth quarter of 2015 was another key milestone, although it did not significantly impact our results for the quarter. As expected, the transaction is advancing our business transformation and penetration of targeted higher-value markets. Integration is well underway and progressing according to schedule. In the near term, we are focused on customer care and expanding current relationships. Looking forward, we expect to realize the strategic benefits of the acquisition beginning in 2016.”
Ms. Delly concluded, “During the last 12 months, Benchmark returned $68 million to shareholders through share repurchases, and we plan to continue these repurchases against the $135 million that remains available under our Board authorizations. We will continue our balanced approach to capital allocation through investments in organic initiatives, external growth opportunities and share repurchases as we execute our long-term strategy to drive increasing value for our shareholders and enhanced service for our customers.”
The Company projects new program bookings for the fourth quarter to result in annualized revenue of $115 - 135 million when fully launched within the next 12-18 months. The new program bookings are aligned with Benchmark’s strategic focus in higher-value markets. For the full year, 85% of new bookings came from Benchmark’s targeted growth markets.
Fourth Quarter 2015 Financial Highlights
· Operating margin (non-GAAP) of 4.5%. The GAAP margin was 3.5%.
· Cash flows from operating activities were $28 million.
· Accounts receivable were $479 million at December 31, 2015, and calculated days sales outstanding were 69 days compared to 67 days at September 30, 2015.
· Inventories were $412 million at December 31, 2015; inventory turns were 5.6 times compared to 5.5 times at September 30, 2015.
Don Adam, the Company’s Chief Financial Officer, stated, “The cash conversion cycle increased by two days sequentially due to shipments occurring later than expected in the fourth quarter. Benchmark remains focused on working capital improvement initiatives and is targeting a 15-20% reduction in cash cycle days exiting 2016.”
Fourth Quarter 2015 Industry Sector Update
Revenue by industry sector was as follows.
|
|
|
Dec 31, |
|
Sep 30, |
|
Dec 31, |
|
|
|
Higher-Value Markets |
2015 |
|
2015 |
|
2014 |
|
|
Industrials |
35 |
% |
31 |
% |
32 |
% |
|
|
Medical |
15 |
|
14 |
|
11 |
|
|
|
Test & Instrumentation |
8 |
|
9 |
|
8 |
|
|
|
|
|
58 |
% |
54 |
% |
51 |
% |
|
|
|
|
|
|
|
|
|
|
|
|
|
|
|
|
|
|
|
|
|
Dec 31, |
|
Sep 30, |
|
Dec 31, |
|
|
|
Traditional Markets |
2015 |
|
2015 |
|
2014 |
|
|
Computing |
25 |
% |
22 |
% |
20 |
% |
|
|
Telecommunications |
17 |
|
24 |
|
29 |
|
|
|
|
|
42 |
% |
46 |
% |
49 |
% |
|
|
|
100 |
% |
100 |
% |
100 |
% |
Revenue was consistent with the Company’s fourth quarter expectations. Growth in the higher-value markets – which include our Secure Technology group – was as anticipated. In our traditional markets, seasonal demand was better than expected in Computing, which offset continued Telecommunications softness related to weak capital spending.
Fourth Quarter 2015 Bookings Update
· New program bookings in the fourth quarter were $115 to $135 million.
· 12 engineering awards supporting early engagement opportunities.
· 23 manufacturing wins across all market sectors.
Margin Improvement Initiatives
The Company’s strategic decision to transform its portfolio toward higher-value markets is driving positive results. Further portfolio diversification into higher-margin sectors, increased emphasis on engineering-led solutions and intense focus on operational excellence initiatives are expected to increase operating margins in the future. Benchmark remains committed to achieving a 5.0% operating margin on a non-GAAP basis over the longer term.
Capital Allocation
· Fourth quarter 2015 common share repurchases totaled $16 million or 770,000 shares.
· $135 million remains available under the current share repurchase program.
· Over the past three years, more than 57% of free cash flow has been returned to shareholders through share repurchases.
· Capex totaled $5 million in the fourth quarter and $38 million for the full year.
First Quarter 2016 Outlook
· Revenue between $565-$590 million.
· Diluted earnings per share between $0.29-$0.33 (excluding restructuring charges and integration costs).
Fourth Quarter 2015 Results Conference Call Details
A conference call hosted by Benchmark management will be held today at 10:00 am CT (11:00 am ET) to discuss the Company’s financial results and outlook. This call will be broadcast via the internet and may be accessed by logging on to the Company’s website at www.bench.com.
About Benchmark Electronics, Inc.
Benchmark provides integrated manufacturing, design and engineering services to original equipment manufacturers of industrial equipment (including equipment for the aerospace and defense industries), telecommunication equipment, computers and related products for business enterprises, medical devices, and test and instrumentation products. Benchmark’s global operations include facilities in seven countries, and its common shares trade on the New York Stock Exchange under the symbol BHE.
For More Information, Please Contact:
Lisa K. Weeks, VP of Strategy & Investor Relations
979-849-6550 (ext. 1361) or [email protected]
Non-GAAP Financial Measures
This press release includes financial measures for earnings and earnings per share that exclude certain items and therefore do not follow U.S. generally accepted accounting principles (GAAP). A detailed reconciliation between the GAAP results and results excluding special items (non-GAAP) is included at the end of this press release. Management discloses non-GAAP information to provide investors with additional information to analyze the Company’s performance and underlying trends. Management uses non-GAAP measures of net income and earnings per share that exclude certain items in order to better assess operating performance and help investors compare results with our previous guidance. Our non-GAAP information is not necessarily comparable to non-GAAP information used by other companies. Non-GAAP information should not be viewed as a substitute for, or superior to, net income or other data prepared in accordance with GAAP as measures of our profitability or liquidity. Users of this financial information should consider the types of events and transactions for which adjustments have been made.
Forward-Looking Statements
This press release contains certain forward-looking statements within the scope of the Securities Act of 1933 and the Securities Exchange Act of 1934. The words “expect,” “estimate,” “plan,” “anticipate,” “project,” “predict,” “goals” and similar terms, and the negatives thereof, often identify forward-looking statements, which are not limited to historical facts. Our forward-looking statements include, among other things, projections regarding the benefit of the Secure acquisition, the Company’s ability to continue share repurchases or a balanced capital allocation, the statement “the Company projects new program bookings for the fourth quarter to result in annualized revenue of $115 - $135 million when fully launched within the next 12-18 months ”, projections relating to working capital improvements, increasing operating margins and first quarter 2016 revenues and diluted earnings per share, and other statements, express or implied, concerning: future operating results or the ability to generate sales, income or cash flow; and Benchmark’s business and growth strategies, including expected internal growth and performance goals. Although Benchmark believes these statements are based upon reasonable assumptions, they involve risks and uncertainties relating to our operations, markets and business environment generally. If one or more of these risks or uncertainties materialize, or
underlying assumptions prove incorrect, actual outcomes may vary materially from those indicated.
All forward-looking statements included in this release are based upon information available to Benchmark as of the date hereof, and the Company assumes no obligation to update them. Readers are advised to consult further disclosures on related subjects, particularly in Item 1A, “Risk Factors” of the Company’s Annual Report on Form 10-K for the year ended December 31, 2014, in its other filings with the Securities and Exchange Commission and in its press releases.
###
|
Benchmark Electronics, Inc. and Subsidiaries |
||||||||||||
|
|
|
|
|
|
|
|
|
|
|
|
|
|
|
Reconciliation of GAAP to Non-GAAP Financial Results |
||||||||||||
|
(Amounts in Thousands, Except Per Share Data) |
||||||||||||
|
(UNAUDITED) |
||||||||||||
|
|
|
|
|
|
|
|
|
|
|
|
|
|
|
|
|
|
Three Months Ended |
|
|
Year Ended |
||||||
|
|
|
|
Dec 31, |
|
Sep 30, |
|
Dec 31, |
|
|
December 31, |
||
|
|
|
|
2015 |
|
2015 |
|
2014 |
|
|
2015 |
|
2014 |
|
|
|
|
|
|
|
|
|
|
|
|
|
|
|
Income from operations (GAAP) |
$ |
21,905 |
$ |
26,148 |
$ |
28,653 |
|
$ |
92,969 |
$ |
100,144 |
|
|
Restructuring charges and integration |
|
|
|
|
|
|
|
|
|
|
|
|
|
and acquisition costs |
|
6,308 |
|
1,095 |
|
955 |
|
|
13,861 |
|
7,131 |
|
|
Asset impairment charge and other |
|
- |
|
- |
|
(1,547) |
|
|
- |
|
(1,547) |
|
|
Thailand flood-related items, net of insurance |
|
- |
|
- |
|
- |
|
|
- |
|
(1,571) |
|
|
Customer bankruptcy |
|
- |
|
- |
|
- |
|
|
- |
|
5,029 |
|
|
Non-GAAP income from operations |
$ |
28,213 |
$ |
27,243 |
$ |
28,061 |
|
$ |
106,830 |
$ |
109,186 |
|
|
|
|
|
|
|
|
|
|
|
|
|
|
|
|
|
|
|
|
|
|
|
|
|
|
|
|
|
|
Net income (GAAP) |
$ |
39,421 |
$ |
20,565 |
$ |
23,338 |
|
$ |
95,401 |
$ |
81,241 |
|
|
Restructuring charges and integration |
|
|
|
|
|
|
|
|
|
|
|
|
|
and acquisition costs, net of tax |
|
4,717 |
|
618 |
|
740 |
|
|
9,860 |
|
4,886 |
|
|
Asset impairment charge and other, |
|
|
|
|
|
|
|
|
|
|
|
|
|
net of tax |
|
- |
|
- |
|
(1,547) |
|
|
- |
|
(1,547) |
|
|
Thailand flood-related items, net of insurance |
|
|
|
|
|
|
|
|
|
|
|
|
|
and tax |
|
- |
|
- |
|
- |
|
|
- |
|
(1,263) |
|
|
Customer bankruptcy, net of tax |
|
- |
|
- |
|
- |
|
|
- |
|
4,831 |
|
|
Discrete tax benefits (1) |
|
(21,174) |
|
- |
|
- |
|
|
(21,174) |
|
- |
|
|
Non-GAAP net income |
$ |
22,964 |
$ |
21,183 |
$ |
22,531 |
|
$ |
84,087 |
$ |
88,148 |
|
|
|
|
|
|
|
|
|
|
|
|
|
|
|
|
Earnings per share: (GAAP) |
|
|
|
|
|
|
|
|
|
|
|
|
|
|
Basic |
$ |
0.78 |
$ |
0.40 |
$ |
0.44 |
|
$ |
1.85 |
$ |
1.52 |
|
|
Diluted |
$ |
0.77 |
$ |
0.40 |
$ |
0.44 |
|
$ |
1.83 |
$ |
1.50 |
|
|
|
|
|
|
|
|
|
|
|
|
|
|
|
Earnings per share: (Non-GAAP) |
|
|
|
|
|
|
|
|
|
|
|
|
|
|
Basic |
$ |
0.45 |
$ |
0.41 |
$ |
0.42 |
|
$ |
1.63 |
$ |
1.65 |
|
|
Diluted |
$ |
0.45 |
$ |
0.41 |
$ |
0.42 |
|
$ |
1.61 |
$ |
1.63 |
|
|
|
|
|
|
|
|
|
|
|
|
|
|
|
Weighted-average number of shares used in |
|
|
|
|
|
|
|
|
|
|
||
|
calculating earnings per share: |
|
|
|
|
|
|
|
|
|
|
||
|
|
Basic |
|
50,482 |
|
51,192 |
|
53,020 |
|
|
51,573 |
|
53,538 |
|
|
Diluted |
|
50,914 |
|
51,588 |
|
53,609 |
|
|
52,088 |
|
54,222 |
(1) The benefit results primarily from the release of a valuation allowance for U.S. taxes.
|
Benchmark Electronics, Inc. and Subsidiaries |
|||||||||||
|
|
|
|
|
|
|
|
|
|
|
|
|
|
Consolidated Statements of Income |
|||||||||||
|
(Amounts in Thousands, Except Per Share Data) |
|||||||||||
|
(UNAUDITED) |
|||||||||||
|
|
|||||||||||
|
|
|
|
Three Months Ended |
|
|
Year Ended |
|||||
|
|
|
|
December 31, |
|
|
December 31, |
|||||
|
|
|
2015 |
|
2014 |
|
|
2015 |
|
2014 |
||
|
Sales |
$ |
625,719 |
$ |
709,547 |
|
$ |
2,540,873 |
$ |
2,797,061 |
||
|
Cost of sales |
|
568,924 |
|
653,858 |
|
|
2,322,299 |
|
2,577,204 |
||
|
|
Gross profit |
|
56,795 |
|
55,689 |
|
|
218,574 |
|
219,857 |
|
|
Selling, general and administrative expenses |
|
28,582 |
|
27,628 |
|
|
111,744 |
|
115,700 |
||
|
Restructuring charges and integration and |
|
|
|
|
|
|
|
|
|
||
|
acquisition-related costs |
|
6,308 |
|
955 |
|
|
13,861 |
|
7,131 |
||
|
Asset impairment charge and other |
|
- |
|
(1,547) |
|
|
- |
|
(1,547) |
||
|
Thailand flood-related items, net of insurance |
|
- |
|
- |
|
|
- |
|
(1,571) |
||
|
|
Income from operations |
|
21,905 |
|
28,653 |
|
|
92,969 |
|
100,144 |
|
|
Interest expense |
|
(1,569) |
|
(447) |
|
|
(2,996) |
|
(1,890) |
||
|
Interest income |
|
236 |
|
330 |
|
|
1,207 |
|
2,048 |
||
|
Other income (expense), net (1) |
|
441 |
|
(156) |
|
|
(1,141) |
|
(1,673) |
||
|
|
Income before income taxes (1) |
|
21,013 |
|
28,380 |
|
|
90,039 |
|
98,629 |
|
|
Income tax expense (benefit) (1) |
|
(18,408) |
|
5,042 |
|
|
(5,362) |
|
17,388 |
||
|
|
Net income (1) |
$ |
39,421 |
$ |
23,338 |
|
$ |
95,401 |
$ |
81,241 |
|
|
|
|
|
|
|
|
|
|
|
|
|
|
|
Earnings per share: |
|
|
|
|
|
|
|
|
|
||
|
|
Basic (1) |
$ |
0.78 |
$ |
0.44 |
|
$ |
1.85 |
$ |
1.52 |
|
|
|
Diluted (1) |
$ |
0.77 |
$ |
0.44 |
|
$ |
1.83 |
$ |
1.50 |
|
|
|
|
|
|
|
|
|
|
|
|
|
|
|
Weighted-average number of shares used in calculating |
|
|
|
|
|
|
|
|
|||
|
earnings per share: |
|
|
|
|
|
|
|
|
|||
|
|
Basic |
|
50,482 |
|
53,020 |
|
|
51,573 |
|
53,538 |
|
|
|
Diluted |
|
50,914 |
|
53,609 |
|
|
52,088 |
|
54,222 |
|
(1) Amounts for the three months and year ended December 31, 2014 are as-adjusted due to the correction of an immaterial error.
|
Benchmark Electronics, Inc. and Subsidiaries |
||||||||
|
|
|
|
|
|
|
|
|
|
|
Condensed Consolidated Balance Sheets |
||||||||
|
(in thousands) |
||||||||
|
|
|
|
|
|
|
December 31, |
|
December 31, |
|
|
|
|
|
|
|
2015 |
|
2014 |
|
|
|
|
|
|
|
(unaudited) |
|
|
|
Assets |
|
|
|
|
||||
|
|
Current assets: |
|
|
|
|
|||
|
|
|
Cash and cash equivalents |
$ |
465,995 |
$ |
427,376 |
||
|
|
|
Accounts receivable, net |
|
479,140 |
|
520,389 |
||
|
|
|
Inventories |
|
411,986 |
|
401,261 |
||
|
|
|
Other current assets (1), (2) |
|
31,507 |
|
29,590 |
||
|
|
|
|
|
Total current assets (1), (2) |
|
1,388,628 |
|
1,378,616 |
|
|
Long-term investments |
|
927 |
|
1,008 |
|||
|
|
Property, plant and equipment, net |
|
178,170 |
|
190,180 |
|||
|
|
Goodwill and other, net (2) |
|
326,153 |
|
106,125 |
|||
|
|
|
|
|
Total assets (1), (2) |
$ |
1,893,878 |
$ |
1,675,929 |
|
|
|
|
|
|
|
|
|
|
|
Liabilities and Shareholders’ Equity |
|
|
|
|
||||
|
|
Current liabilities: |
|
|
|
|
|||
|
|
|
Current installments of capital lease obligations and long-term debt |
$ |
12,284 |
$ |
676 |
||
|
|
|
Accounts payable |
|
251,163 |
|
289,786 |
||
|
|
|
Accrued liabilities (1) |
|
69,647 |
|
68,616 |
||
|
|
|
|
|
Total current liabilities (1) |
|
333,094 |
|
359,078 |
|
|
Capital lease obligations and long-term debt, less current installments |
|
222,909 |
|
8,845 |
|||
|
|
Other long-term liabilities (2) |
|
15,971 |
|
18,381 |
|||
|
|
Shareholders’ equity (1) |
|
1,321,904 |
|
1,289,625 |
|||
|
|
|
|
|
Total liabilities and shareholders’ equity (1), (2) |
$ |
1,893,878 |
$ |
1,675,929 |
(1) Amounts as of December 31, 2014 are as-adjusted due to the correction of an immaterial error.
(2) Amounts as of December 31, 2014 have been adjusted to retroactively adopt Financial Accounting Standards Update 2015-17 regarding Balance Sheet Classification of Deferred Taxes.
Exhibit 99.2

design develop deliver advanced technology Q4 - 2015 and Full Year 2015 Earnings Presentation February 9, 2016

design develop deliver advanced technology 1 Forward - Looking Statements This document contains forward - looking statements within the scope of the Securities Act of 1933 and the Securities Exchange Act of 1934. The words “expect,” “estimate,” “anticipate,” “predict” and similar expressions, and the negatives thereof, often identify forward - looking statements, which are not limited to historical facts. Our forward - looking statements include, among other things: guidance for the first quarter of 2016 relating to sales; statements , express or implied, concerning future operating results or margins, the ability to generate sales, income or cash flow; and Benchmark’s business and growth strategies and expected growth and performance. Although Benchmark believes these statements are based upon reasonable assumptions, they involve risks and uncertainties relating to our operations, markets and business environment generally. If one or more of these risks or uncertainties materializes, or underlying assumptions prove incorrect, actual outcomes may vary materially from those indicated. All forward - looking statements included in this document are based upon information available to Benchmark as of the date of this document, and the Company assumes no obligation to update them. Readers are advised to consult further disclosures on related subjects, particularly in Item 1A, “Risk Factors” of the Company’s annual report on Form 10 - K for the year ended December 31, 2014, in its other filings with the Securities and Exchange Commission and in its press releases. Non - GAAP Financial Information This document includes certain financial measures, such as operating margin, that exclude certain items and therefore are not in accordance with generally accepted accounting principles (“GAAP”). A detailed reconciliation between GAAP results and results excluding special items (“non - GAAP”) is included in the Appendix of this document.

design develop deliver advanced technology 2 President and CEO Update

design develop deliver advanced technology 3 Strategic Plan Execution Highlights Priorities ► 55% of revenues from higher - value markets (medical, industrial, and test & instrumentation) ► Historic high for Benchmark 2015 Waypoint Targets Portfolio Shift to Higher - Value Markets Margin Expansion Balanced Capital Deployment >70% from Higher - Value Markets ► Achieved 4.5% operating margin exiting Q4 - 15 (50bps yoy increase) ► Highest levels since 2007 >5% Operating Margin ► Operating Cash Flow of $147M in 2015 ► 63% of Free Cash Flow returned to shareholders ~50% F CF Returned to Shareholders 3 3 FCF defined as CFO less capex

design develop deliver advanced technology 4 Evolving Our Portfolio with Engineering - led Solutions 2015 Target mix 55% 45% 70% 30% $1.2bn $1.4bn $1.1bn $1.4bn Revenue $ 2.5bn Resulting mix = significant upside potential Source: Company filings Revenue >$3.0bn Traditional markets Higher - Value markets 4.2% OI >5% OI ▪ Design Engineering Talent ▪ Advanced Technologies ▪ Acquisitions Engineering Investments

design develop deliver advanced technology 5 Higher - Value Markets 2016 Outlook* Industrials** > 10% Annual Growth Medical Test & Instrumentation Total Revenue Traditional Markets 2016 Outlook* Computing Decline – Macro Related Telecommunication s Total Revenue Benchmark Results and Outlook by Market Segment Growth Expected in Higher - Value Markets * 2016 Outlook represents Year - over - Year ** Includes Secure Technology acquisition

design develop deliver advanced technology 6 Guidance Net Sales (in millions) $565 – $590 Operating Margin – non - GAAP 3.8% – 4.1% Interest Expense $2.3 million Effective Tax Rate 24 - 25% Diluted EPS – non - GAAP $0.29 – $0.33 ▪ Outlook is for the first quarter ending March 31, 2016. First Quarter 2016 Guidance

design develop deliver advanced technology 7 Q4 and 2015 Financial Highlights
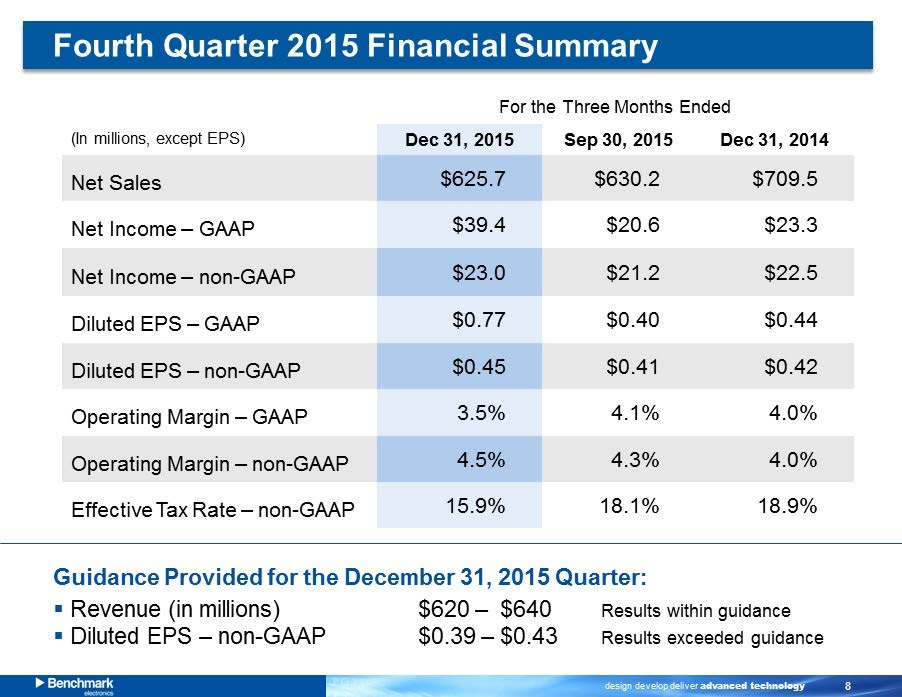
design develop deliver advanced technology 8 (In millions, except EPS) Dec 31 , 2015 Sep 30, 2015 Dec 31 , 2014 Net Sales $625.7 $630.2 $709.5 Net Income – GAAP $39.4 $20.6 $23.3 Net Income – non - GAAP $23.0 $21.2 $22.5 Diluted EPS – GAAP $0.77 $0.40 $0.44 Diluted EPS – non - GAAP $0.45 $0.41 $0.42 Operating Margin – GAAP 3.5% 4.1% 4.0% Operating Margin – non - GAAP 4.5% 4.3% 4.0% Effective Tax Rate – non - GAAP 15.9% 18.1% 18.9% For the Three Months Ended Guidance Provided for the December 31, 2015 Quarter: ▪ Revenue (in millions) $620 – $640 Results within guidance ▪ Diluted EPS – non - GAAP $0.39 – $0.43 Results exceeded g uidance Fourth Quarter 2015 Financial Summary

design develop deliver advanced technology 9 (In millions, except EPS) Dec 31 , 2015 Dec 31 , 2014 Net Sales $2,540.9 $2,797.1 Net Income – GAAP $95.4 $81.2 Net Income – non - GAAP $84.1 $88.1 Diluted EPS – GAAP $1.83 $1.50 Diluted EPS – non - GAAP $1.61 $1.63 Operating Margin – GAAP 3.7% 3.6% Operating Margin – non - GAAP 4.2% 3.9% Effective Tax Rate – non - GAAP 19.1% 18.1% For the Twelve Months Ended Fiscal Year 2015 Financial Summary Non - GAAP Operating Margin Increased 3.9% to 4.2%

design develop deliver advanced technology 10 Trending Operating Income Revenue Diversification and Operational E xcellence D rive H igher M argins

design develop deliver advanced technology 11 Q4 2015 Number of New Business Wins by Segment ▪ Q4 2015: 35 new business bookings, including 12 engineering projects ▪ Estimated annual revenue run rate between $115 - 135 million ▪ Continued new business wins in targeted markets Quarterly Estimated Annual Revenue Run Rate for New Business Wins Fourth Quarter 2015 New Business Wins

design develop deliver advanced technology 12 Higher - Value Markets Sep 30 , 2015 Dec 31 , 2015 Q1 - 16 Outlook (%) Industrials* 31% $198 35% $223 Up Mid Single Digits Medical 14% $87 15% $92 Flat Test & Instrumentation 9% $58 8% $51 Flat Total Revenue $343 $366 Traditional Markets Sep 30 , 2015 Dec 31 , 2015 Q1 - 16 Outlook (%) Computing 22% $140 25% $155 Seasonally Down >30% Telecommunication s 24% $147 17% $105 Down High Single Digits Total Revenue $287 $260 Benchmark Results and Outlook by Market Segment For the Three Months Ended Growth in Higher - Value Markets as Anticipated * Includes Secure Technology acquisition

design develop deliver advanced technology 13 Balance Sheet and Cash Flows (In millions) ) Dec 31 , 2015 Sep 30, 2015 Dec 31, 2014 Cash $466.0* $462.1 $427.4 Debt $235.2 $9.0 $9.5 Cash Flows from Operating Activities $28.1 $77.6 $22.1 Capital Expenditures $5.2 $7.9 $8.8 Depreciation & Amortization $13.2 $12.0 $12.5 Accounts Receivable $479.1 $467.2 $520.4 Days Sales Outstanding 69 67 66 Inventory $412.0 $421.5 $401.3 Inventory Turns 5.6x 5.5x 6.5x Total Cost of Shares Repurchased $16.0 $17.8 $18.8 * Includes $42 million of cash available in the U.S. Financial Statement Highlights

design develop deliver advanced technology 14 Dec 31 , 2015 Sep 30 , 2015 Accounts Receivable Days 69 67 Accounts Payable Days 40 43 Inventory Days 64 66 Cash Conversion Cycle Days 93 90 ▪ Cash Conversion Cycle days greater by three days related to shipments later in the quarter than expected ▪ Ongoing initiatives for working capital improvement o Alignment of customer and supplier payment terms o Demand and inventory optimization o Strategic sourcing initiatives ▪ Majority of improvements from initiatives are outside the U.S. Working Capital Update
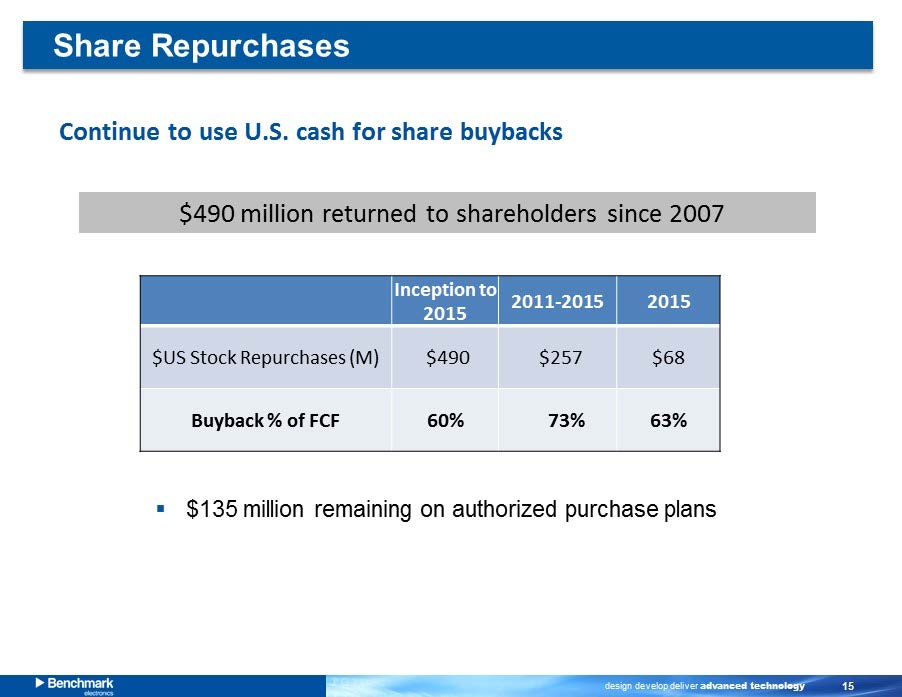
design develop deliver advanced technology 15 Share Repurchases Continue to use U.S. cash for share buybacks $490 million returned to shareholders since 2007 ▪ $135 m illion remaining on authorized purchase plans Inception to 2015 2011 - 2015 2015 $US Stock Repurchases (M ) $490 $257 $68 Buyback % of FCF 60% 73% 63%

design develop deliver advanced technology 16 Appendix

design develop deliver advanced technology 17 Reconciliation of GAAP to non - GAAP Financial Results (Amounts in Thousands, Except Per Share Data) – (UNAUDITED) Dec 31, Sep 30, Dec 31, 2015 2015 2014 2015 2014 21,905$ 26,148$ 28,653$ 92,969$ 100,144$ 6,308 1,095 955 13,861 7,131 - - (1,547) - (1,547) - - - - (1,571) - - - - 5,029 28,213$ 27,243$ 28,061$ 106,830$ 109,186$ 39,421$ 20,565$ 23,338$ 95,401$ 81,241$ 4,717 618 740 9,860 4,886 - - (1,547) - (1,547) - - - - (1,263) - - - - 4,831 (21,174) - - (21,174) - 22,964$ 21,183$ 22,531$ 84,087$ 88,148$ Basic $0.78 $0.40 $0.44 $1.85 $1.52 Diluted $0.77 $0.40 $0.44 $1.83 $1.50 Basic $0.45 $0.41 $0.42 $1.63 $1.65 Diluted $0.45 $0.41 $0.42 $1.61 $1.63 Earnings per share: (GAAP) Earnings per share: (Non-GAAP) Asset impairment charge and other, net of tax Restructuring charges and integration Discrete tax benefits Customer bankruptcy, net of tax and acquisition costs, net of tax Thailand flood-related items, net of insurance and tax Non-GAAP net income Income from operations (GAAP) Net income (GAAP) Year EndedThree Months Ended December 31, Customer bankruptcy Asset impairment charge and other Restructuring charges and integration and acquisition costs Thailand flood-related items, net of insurance Non-GAAP income from operations
Serious News for Serious Traders! Try StreetInsider.com Premium Free!
You May Also Be Interested In
- C2C Metals Announces Chief Executive Officer
- DTE Energy reports first quarter earnings and accomplishments
- Valley National Bancorp Announces First Quarter 2024 Results
Create E-mail Alert Related Categories
SEC FilingsSign up for StreetInsider Free!
Receive full access to all new and archived articles, unlimited portfolio tracking, e-mail alerts, custom newswires and RSS feeds - and more!
