Form 8-K BEASLEY BROADCAST GROUP For: Sep 15
UNITED STATES
SECURITIES AND EXCHANGE COMMISSION
WASHINGTON, D.C. 20549
FORM 8-K
CURRENT REPORT
Pursuant to Section 13 or 15(d)
of the Securities Exchange Act of 1934
Date of Report (Date of Earliest Event Reported): September 15, 2016
BEASLEY BROADCAST GROUP, INC.
(Exact Name of Registrant as Specified in Charter)
| Delaware | 000-29253 | 65-0960915 | ||
| (State or Other Jurisdiction of Incorporation) |
(Commission File Number) |
(IRS Employer Identification No.) |
3033 Riviera Drive, Suite 200, Naples, Florida 34103
(Address of Principal Executive Offices) (Zip Code)
Registrant’s Telephone Number, Including Area Code: (239) 263-5000
(Former Name or Former Address, if Changed Since Last Report)
Check the appropriate box below if the Form 8-K filing is intended to simultaneously satisfy the filing obligation of the registrant under any of the following provisions (see General Instruction A.2. below):
| ¨ | Written communications pursuant to Rule 425 under the Securities Act (17 CFR 230.425) |
| ¨ | Soliciting material pursuant to Rule 14a-12 under the Exchange Act (17 CFR 240.14a-12) |
| ¨ | Pre-commencement communications pursuant to Rule 14d-2(b) under the Exchange Act (17 CFR 240.14d-2(b)) |
| ¨ | Pre-commencement communications pursuant to Rule 13e-4(c) under the Exchange Act (17 CFR 240.13e-4(c)) |
| Item 7.01 | Regulation FD Disclosure. |
On September 15, 2016, Beasley Broadcast Group, Inc. (the “Company”) presented certain information to prospective lenders in the syndication of the Company’s new credit facility, which will be used to fund, in part, the transactions contemplated by the Company’s previously announced merger with Greater Media, Inc. A copy of the lender presentation is furnished as Exhibit 99.1 hereto.
This presentation contains additional information and certain updates to the lender presentation previously furnished as Exhibit 99.1 to the Company’s Current Report on Form 8-K dated September 7, 2016.
The foregoing information in Item 7.01 is being furnished and shall not be deemed “filed” for purposes of Section 18 of the Securities Exchange Act of 1934, as amended, or otherwise subject to the liabilities of that section, nor shall it be deemed incorporated by reference in any filing under the Securities Act of 1933, as amended, except as expressly set forth by specific reference in such filing.
| Item 9.01 | Financial Statements and Exhibits. |
| (d) | Exhibits. |
| Exhibit |
Description | |
| 99.1 | Lender Presentation. | |
SIGNATURES
Pursuant to the requirements of the Securities Exchange Act of 1934, the registrant has duly caused this report to be signed on its behalf by the undersigned hereunto duly authorized.
| Date: September 15, 2016 | BEASLEY BROADCAST GROUP, INC. | |||||
| By: | /s/ Caroline Beasley | |||||
| Name: | Caroline Beasley | |||||
| Title: | Interim Chief Executive Officer, Executive Vice President, Chief Financial Officer, Secretary and Treasurer | |||||
EXHIBIT INDEX
| Exhibit |
Description | |
| 99.1 | Lender Presentation. | |
Lender Presentation September 15th, 2016 PRIVATE AND CONFIDENTIAL Exhibit 99.1

Forward-Looking Statements and Confidentiality Forward-Looking Statements This presentation contains “forward-looking statements” within the meaning of the “safe harbor” provisions of the Private Securities Litigation Reform Act of 1995. These forward-looking statements are based upon current beliefs and expectations of Beasley Broadcast Group, Inc.’s (“Beasley”) management and are subject to known and unknown risks and uncertainties. Words or expressions such as “expects,” “anticipates,” “intends,” “plans,” “believes,” “estimates” “may,” “will,” “plans,” “projects,” “could,” “should,” “would,” “seek,” “forecast,” or other similar expressions help identify forward-looking statements. Factors that could cause actual events to differ include, but are not limited to: the risk that the transaction may not be completed; the ability of Beasley to obtain debt financing for the transaction; the risk that under certain circumstances, Beasley may be required to pay a termination fee to Greater Media; the ability to successfully combine the businesses of Beasley and Greater Media; the ability of Beasley to achieve the expected cost savings, synergies and other benefits from the proposed transaction within the expected time frames or at all; the incurrence of significant transaction and other related fees and costs; the incurrence of unexpected costs, liabilities or delays relating to the transaction; the risk that the public assigns a lower value to Greater Media’s business than the value used in negotiating the terms of the transaction; the effects of the transaction on the interests of Beasley’s current stockholders in the earnings, voting power and market value of the company; the risk that the transaction may not be accretive to Beasley’s current stockholders; the risk that the transaction may prevent Beasley from acting on future opportunities to enhance stockholder value; the impact of the issuance of the Class A common stock in connection with the transaction; the risk that any goodwill or identifiable intangible assets recorded due to the transaction could become impaired; the risk due to business uncertainties and contractual restrictions while the transaction is pending that could disrupt Beasley’s business; the risk that a closing condition to the proposed transaction may not be satisfied; the occurrence of any event, change or other circumstances that could give rise to the termination of the transaction; and other economic, business, competitive, and regulatory factors affecting the businesses of Beasley and Greater Media generally, including those set forth in Beasley’s filings with the SEC, including its annual reports on Form 10-K quarterly reports on Form 10-Q, current reports on Form 8-K, and other SEC filings. Actual results, events and performance may differ materially. Readers are cautioned not to place undue reliance on these forward-looking statements, which speak only as of the date hereof. Beasley undertakes no obligation to release publicly the result of any revisions to these forward-looking statements that may be made to reflect events or circumstances after the date hereof or to reflect the occurrence of unanticipated events. Important Additional Information Beasley will file an Information Statement and other relevant documents concerning the proposed transaction and related matters with the Securities and Exchange Commission (“SEC”). The Information Statement and other materials filed with the SEC will contain important information regarding the transaction and the issuance of Beasley’s Class A common stock in connection with the transaction. SHAREHOLDERS ARE ENCOURAGED TO READ THE INFORMATION STATEMENT AND OTHER MATERIALS THAT THE COMPANY FILES WITH THE SEC WHEN THEY BECOME AVAILABLE BECAUSE THEY WILL CONTAIN IMPORTANT INFORMATION ABOUT THE TRANSACTION, THE ISSUANCE OF THE SHARES OF CLASS A COMMON STOCK IN THE TRANSACTION AND RELATED MATTERS. You will be able to obtain the Information Statement, as well as other filings containing information about the Company, free of charge, at the website maintained by the SEC at www.sec.gov. Copies of the proxy statement and other filings made by the Company with the SEC can also be obtained, free of charge, by directing a request to Beasley Broadcast Group, Inc., 3033 Riviera Drive, Suite 200, Naples, Florida 34103, Attention: Corporate Secretary.
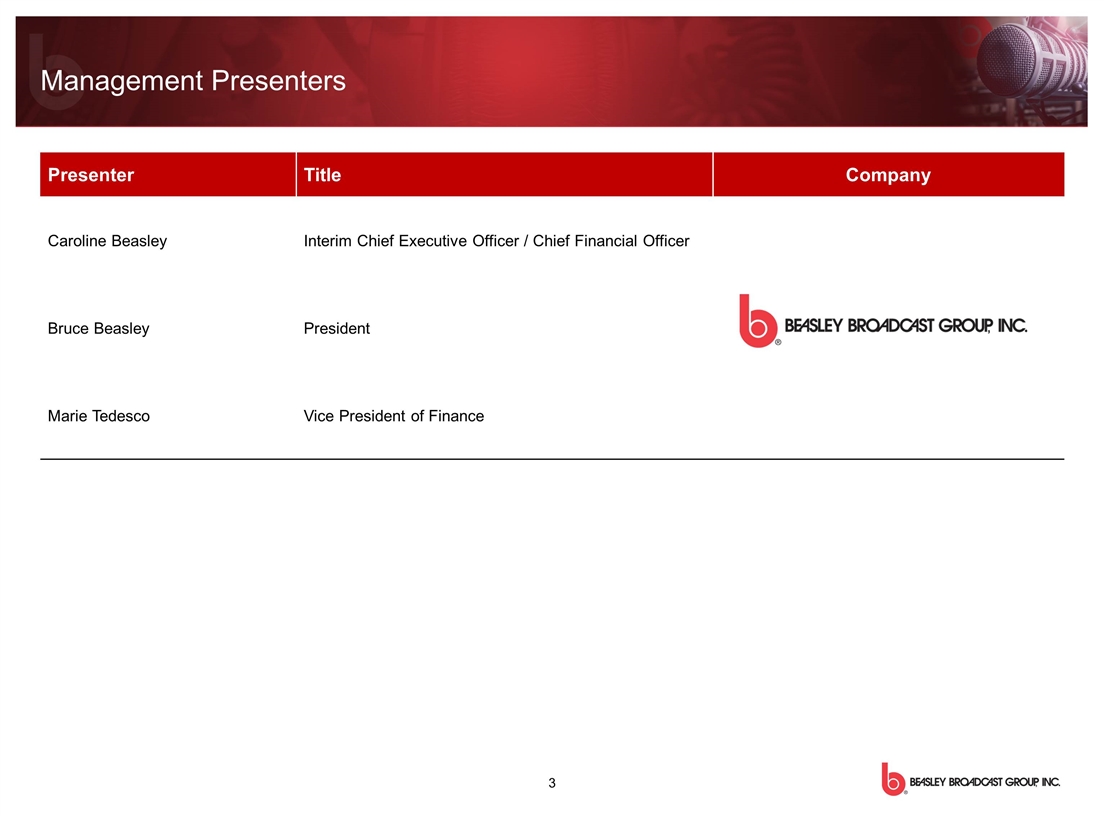
Presenter Title Company Caroline Beasley Interim Chief Executive Officer / Chief Financial Officer Bruce Beasley President Marie Tedesco Vice President of Finance Management Presenters

Transaction Overview Pro Forma Beasley Highlights Station Portfolio Overview Industry Observations Pre-Closing Expense Reductions & Combination Synergies Historical Financial Overview Table of Contents
Transaction Overview SECTION I
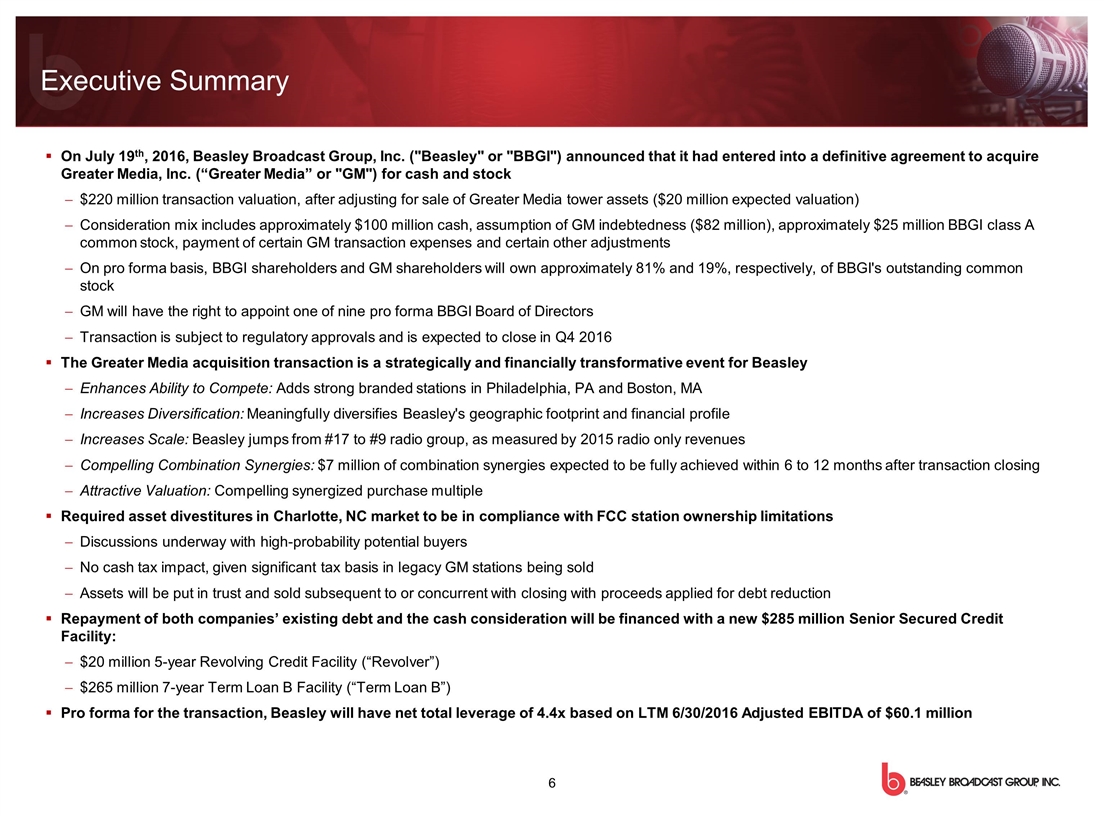
Executive Summary On July 19th, 2016, Beasley Broadcast Group, Inc. ("Beasley" or "BBGI") announced that it had entered into a definitive agreement to acquire Greater Media, Inc. (“Greater Media” or "GM") for cash and stock $220 million transaction valuation, after adjusting for sale of Greater Media tower assets ($20 million expected valuation) Consideration mix includes approximately $100 million cash, assumption of GM indebtedness ($82 million), approximately $25 million BBGI class A common stock, payment of certain GM transaction expenses and certain other adjustments On pro forma basis, BBGI shareholders and GM shareholders will own approximately 81% and 19%, respectively, of BBGI's outstanding common stock GM will have the right to appoint one of nine pro forma BBGI Board of Directors Transaction is subject to regulatory approvals and is expected to close in Q4 2016 The Greater Media acquisition transaction is a strategically and financially transformative event for Beasley Enhances Ability to Compete: Adds strong branded stations in Philadelphia, PA and Boston, MA Increases Diversification: Meaningfully diversifies Beasley's geographic footprint and financial profile Increases Scale: Beasley jumps from #17 to #9 radio group, as measured by 2015 radio only revenues Compelling Combination Synergies: $7 million of combination synergies expected to be fully achieved within 6 to 12 months after transaction closing Attractive Valuation: Compelling synergized purchase multiple Required asset divestitures in Charlotte, NC market to be in compliance with FCC station ownership limitations Discussions underway with high-probability potential buyers No cash tax impact, given significant tax basis in legacy GM stations being sold Assets will be put in trust and sold subsequent to or concurrent with closing with proceeds applied for debt reduction Repayment of both companies’ existing debt and the cash consideration will be financed with a new $285 million Senior Secured Credit Facility: $20 million 5-year Revolving Credit Facility (“Revolver”) $265 million 7-year Term Loan B Facility (“Term Loan B”) Pro forma for the transaction, Beasley will have net total leverage of 4.4x based on LTM 6/30/2016 Adjusted EBITDA of $60.1 million

Note: Financials exclude 6/30/2016 revenue and expenses from trade and barter. 5.4 million shares of Class A Common Stock is based on fixed value of $4.61 per share (current share price of $5.35 as of 9/12/2016). Greater Media 6/30/2016 Adjusted EBITDA includes $7.9 million of Pre-Closing Expense Reductions already initiated by Greater Media that will be completed in full before the transaction closes. Inclusive of Phase I – Corporate Cost Synergies, Phase II – Stations Cost Synergies and Operating Expenses Reinvestment as described in Section III – Pre-Closing Expense Reductions & Combination Synergies; Combination Synergies ramp up to $6.7 million within one year of closing. See Section III – Pre-Closing Expense Reductions & Combination Synergies, Appendix and Adjusted EBITDA reconciliation for detail. Sources & Uses of Funds Pro Forma Capitalization ($ in millions) ($ in millions) Transaction Overview
Pro Forma Beasley Highlights SECTION II
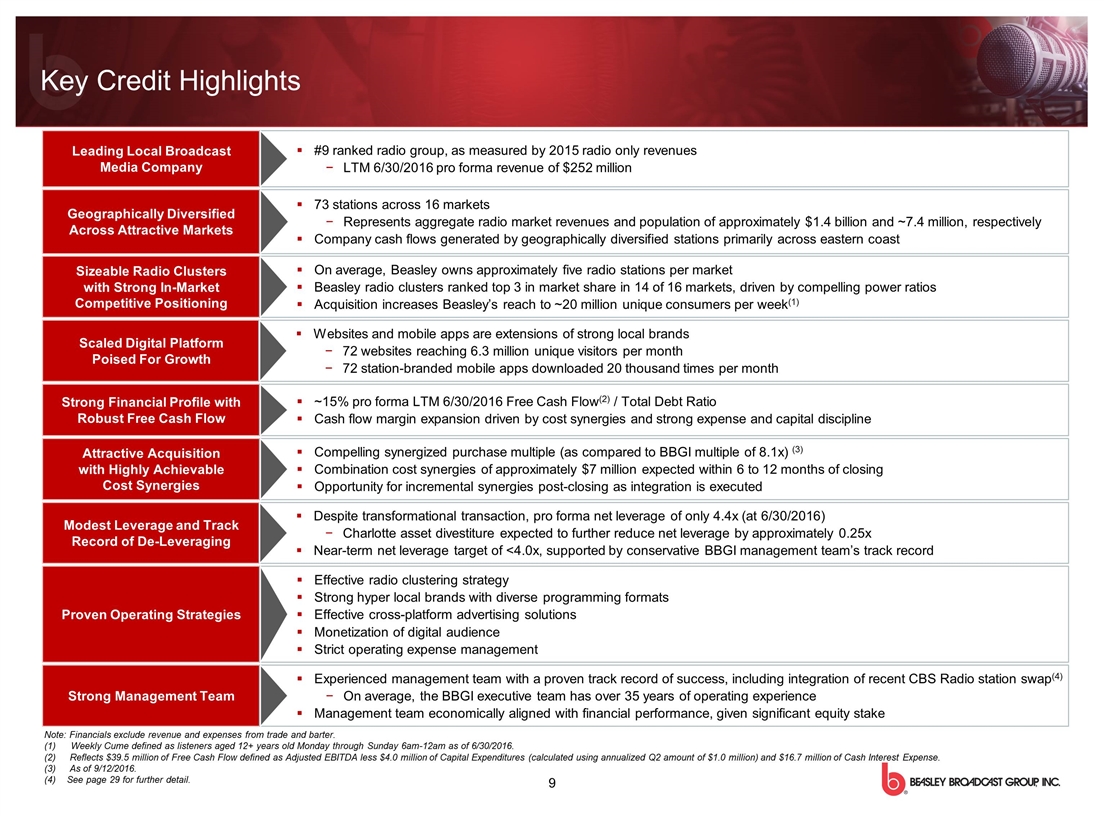
Leading Local Broadcast Media Company #9 ranked radio group, as measured by 2015 radio only revenues LTM 6/30/2016 pro forma revenue of $252 million Geographically Diversified Across Attractive Markets 73 stations across 16 markets Represents aggregate radio market revenues and population of approximately $1.4 billion and ~7.4 million, respectively Company cash flows generated by geographically diversified stations primarily across eastern coast Sizeable Radio Clusters with Strong In-Market Competitive Positioning On average, Beasley owns approximately five radio stations per market Beasley radio clusters ranked top 3 in market share in 14 of 16 markets, driven by compelling power ratios Acquisition increases Beasley’s reach to ~20 million unique consumers per week(1) Scaled Digital Platform Poised For Growth Websites and mobile apps are extensions of strong local brands 72 websites reaching 6.3 million unique visitors per month 72 station-branded mobile apps downloaded 20 thousand times per month Strong Financial Profile with Robust Free Cash Flow ~15% pro forma LTM 6/30/2016 Free Cash Flow(2) / Total Debt Ratio Cash flow margin expansion driven by cost synergies and strong expense and capital discipline Attractive Acquisition with Highly Achievable Cost Synergies Compelling synergized purchase multiple (as compared to BBGI multiple of 8.1x) (3) Combination cost synergies of approximately $7 million expected within 6 to 12 months of closing Opportunity for incremental synergies post-closing as integration is executed Proven Operating Strategies Effective radio clustering strategy Strong hyper local brands with diverse programming formats Effective cross-platform advertising solutions Monetization of digital audience Strict operating expense management Modest Leverage and Track Record of De-Leveraging Despite transformational transaction, pro forma net leverage of only 4.4x (at 6/30/2016) Charlotte asset divestiture expected to further reduce net leverage by approximately 0.25x Near-term net leverage target of <4.0x, supported by conservative BBGI management team’s track record Strong Management Team Experienced management team with a proven track record of success, including integration of recent CBS Radio station swap(4) On average, the BBGI executive team has over 35 years of operating experience Management team economically aligned with financial performance, given significant equity stake Note: Financials exclude revenue and expenses from trade and barter. Weekly Cume defined as listeners aged 12+ years old Monday through Sunday 6am-12am as of 6/30/2016. Reflects $39.5 million of Free Cash Flow defined as Adjusted EBITDA less $4.0 million of Capital Expenditures (calculated using annualized Q2 amount of $1.0 million) and $16.7 million of Cash Interest Expense. As of 9/12/2016. See page 29 for further detail. Key Credit Highlights
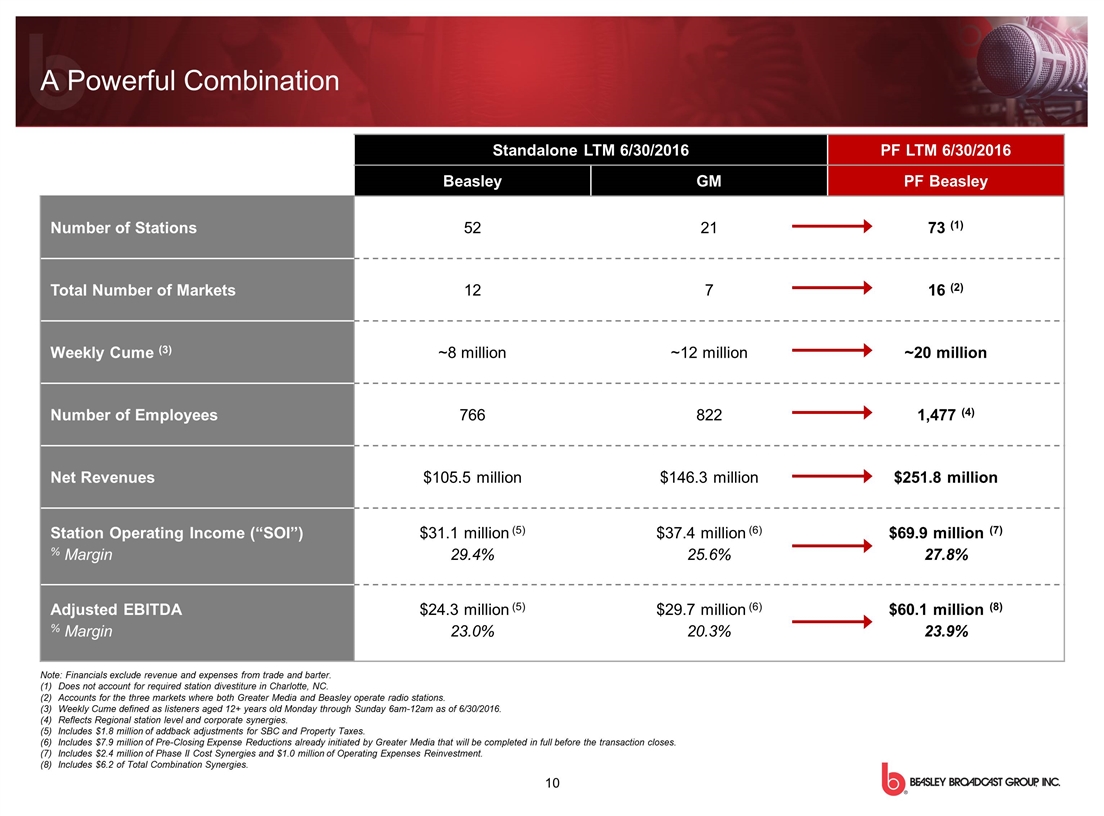
Standalone LTM 6/30/2016 PF LTM 6/30/2016 Beasley GM PF Beasley Number of Stations 52 21 73 (1) Total Number of Markets 12 7 16 (2) Weekly Cume (3) ~8 million ~12 million ~20 million Number of Employees 766 822 1,477 (4) Net Revenues $105.5 million $146.3 million $251.8 million Station Operating Income (“SOI”) % Margin $31.1 million (5) 29.4% $37.4 million (6) 25.6% $69.9 million (7) 27.8% Adjusted EBITDA % Margin $24.3 million (5) 23.0% $29.7 million (6) 20.3% $60.1 million (8) 23.9% Note: Financials exclude revenue and expenses from trade and barter. Does not account for required station divestiture in Charlotte, NC. Accounts for the three markets where both Greater Media and Beasley operate radio stations. Weekly Cume defined as listeners aged 12+ years old Monday through Sunday 6am-12am as of 6/30/2016. Reflects Regional station level and corporate synergies. Includes $1.8 million of addback adjustments for SBC and Property Taxes. Includes $7.9 million of Pre-Closing Expense Reductions already initiated by Greater Media that will be completed in full before the transaction closes. Includes $2.4 million of Phase II Cost Synergies and $1.0 million of Operating Expenses Reinvestment. Includes $6.2 of Total Combination Synergies. A Powerful Combination

Pre-Closing Expense Reductions & Pro Forma Combination Synergies Annualized Expense Reductions and Combination Synergies(1) ($ in millions) Source: Beasley Management. Note: The EBITDA bridge analysis does not include the impact of the Charlotte, NC asset divestiture, which would reduce Pro Forma Synergized LTM Adjusted EBITDA by approximately $2.3 million. Reflects LTM 6/30/2016 synergies totaling $6.2 million, which ramp up to $6.7 million within one year of closing. Greater Media 6/30/2016 Adjusted EBITDA includes $7.9 million of Pre-Closing Expense Reductions already initiated by Greater Media that will be completed in full before the transaction closes. Includes standalone Adjusted EBITDA for Beasley and Greater Media inclusive of $7.9 million of Pre-Closing Expense Reductions initiated by Greater Media that will be completed in full before the transaction closes.
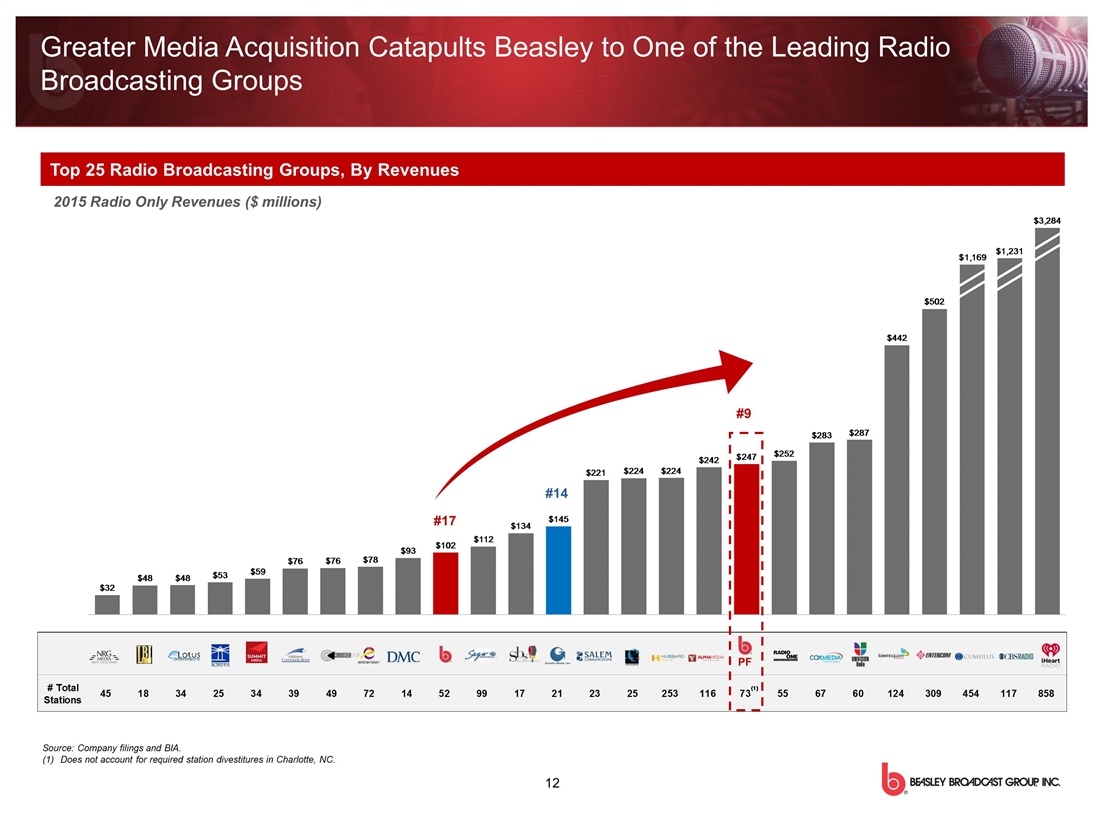
Source: Company filings and BIA. (1)Does not account for required station divestitures in Charlotte, NC. Top 25 Radio Broadcasting Groups, By Revenues 2015 Radio Only Revenues ($ millions) PF #9 #17 #14 Greater Media Acquisition Catapults Beasley to One of the Leading Radio Broadcasting Groups
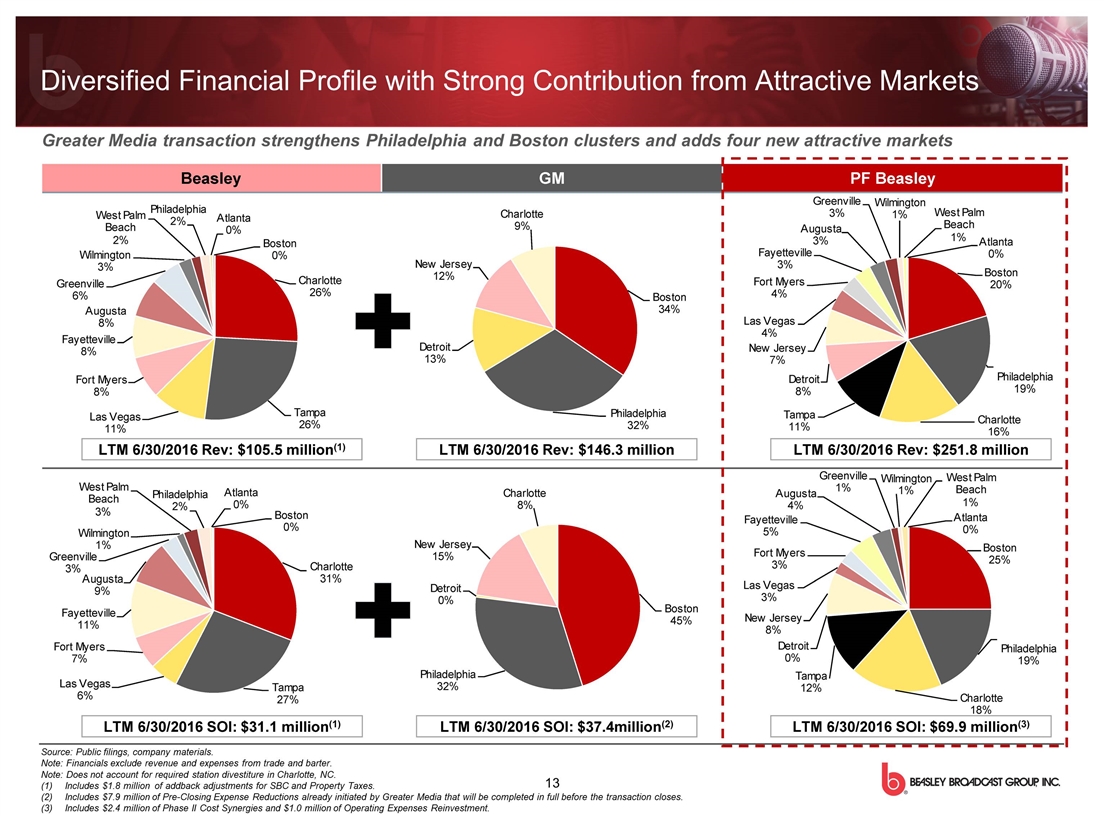
Diversified Financial Profile with Strong Contribution from Attractive Markets Source: Public filings, company materials. Note: Financials exclude revenue and expenses from trade and barter. Note: Does not account for required station divestiture in Charlotte, NC. Includes $1.8 million of addback adjustments for SBC and Property Taxes. Includes $7.9 million of Pre-Closing Expense Reductions already initiated by Greater Media that will be completed in full before the transaction closes. Includes $2.4 million of Phase II Cost Synergies and $1.0 million of Operating Expenses Reinvestment. Greater Media transaction strengthens Philadelphia and Boston clusters and adds four new attractive markets
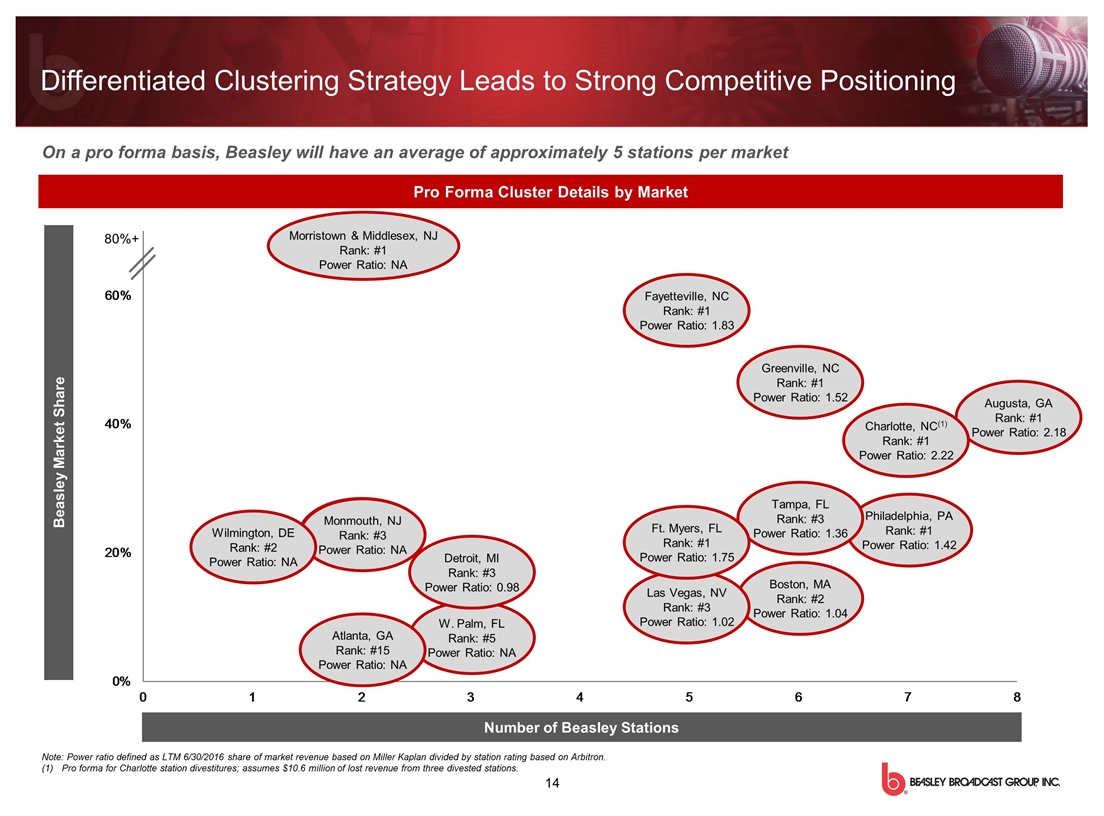
On a pro forma basis, Beasley will have an average of approximately 5 stations per market Pro Forma Cluster Details by Market Number of Beasley Stations Beasley Market Share Morristown & Middlesex, NJ Rank: #1 Power Ratio: NA Monmouth, NJ Rank: #3 Power Ratio: NA W. Palm, FL Rank: #5 Power Ratio: NA Fayetteville, NC Rank: #1 Power Ratio: 1.83 Augusta, GA Rank: #1 Power Ratio: 2.18 Charlotte, NC(1) Rank: #1 Power Ratio: 2.22 Philadelphia, PA Rank: #1 Power Ratio: 1.42 Greenville, NC Rank: #1 Power Ratio: 1.52 Tampa, FL Rank: #3 Power Ratio: 1.36 Boston, MA Rank: #2 Power Ratio: 1.04 Las Vegas, NV Rank: #3 Power Ratio: 1.02 Note: Power ratio defined as LTM 6/30/2016 share of market revenue based on Miller Kaplan divided by station rating based on Arbitron. Pro forma for Charlotte station divestitures; assumes $10.6 million of lost revenue from three divested stations. 80%+ Differentiated Clustering Strategy Leads to Strong Competitive Positioning Monmouth, NJ Rank: #3 Power Ratio: NA Wilmington, DE Rank: #2 Power Ratio: NA Atlanta, GA Rank: #15 Power Ratio: NA Detroit, MI Rank: #3 Power Ratio: 0.98 Ft. Myers, FL Rank: #1 Power Ratio: 1.75
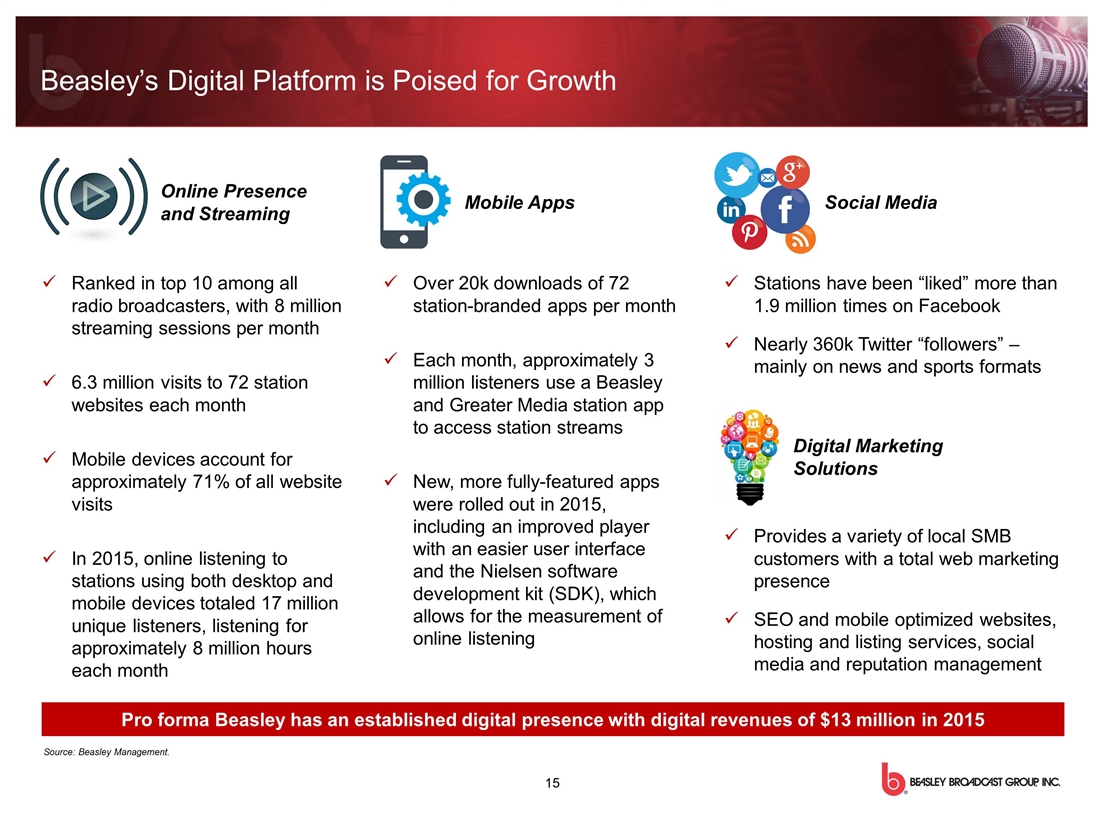
Pro forma Beasley has an established digital presence with digital revenues of $13 million in 2015 Ranked in top 10 among all radio broadcasters, with 8 million streaming sessions per month 6.3 million visits to 72 station websites each month Mobile devices account for approximately 71% of all website visits In 2015, online listening to stations using both desktop and mobile devices totaled 17 million unique listeners, listening for approximately 8 million hours each month Over 20k downloads of 72 station-branded apps per month Each month, approximately 3 million listeners use a Beasley and Greater Media station app to access station streams New, more fully-featured apps were rolled out in 2015, including an improved player with an easier user interface and the Nielsen software development kit (SDK), which allows for the measurement of online listening Stations have been “liked” more than 1.9 million times on Facebook Nearly 360k Twitter “followers” – mainly on news and sports formats Online Presence and Streaming Mobile Apps Social Media Digital Marketing Solutions Provides a variety of local SMB customers with a total web marketing presence SEO and mobile optimized websites, hosting and listing services, social media and reputation management Beasley’s Digital Platform is Poised for Growth Source: Beasley Management.
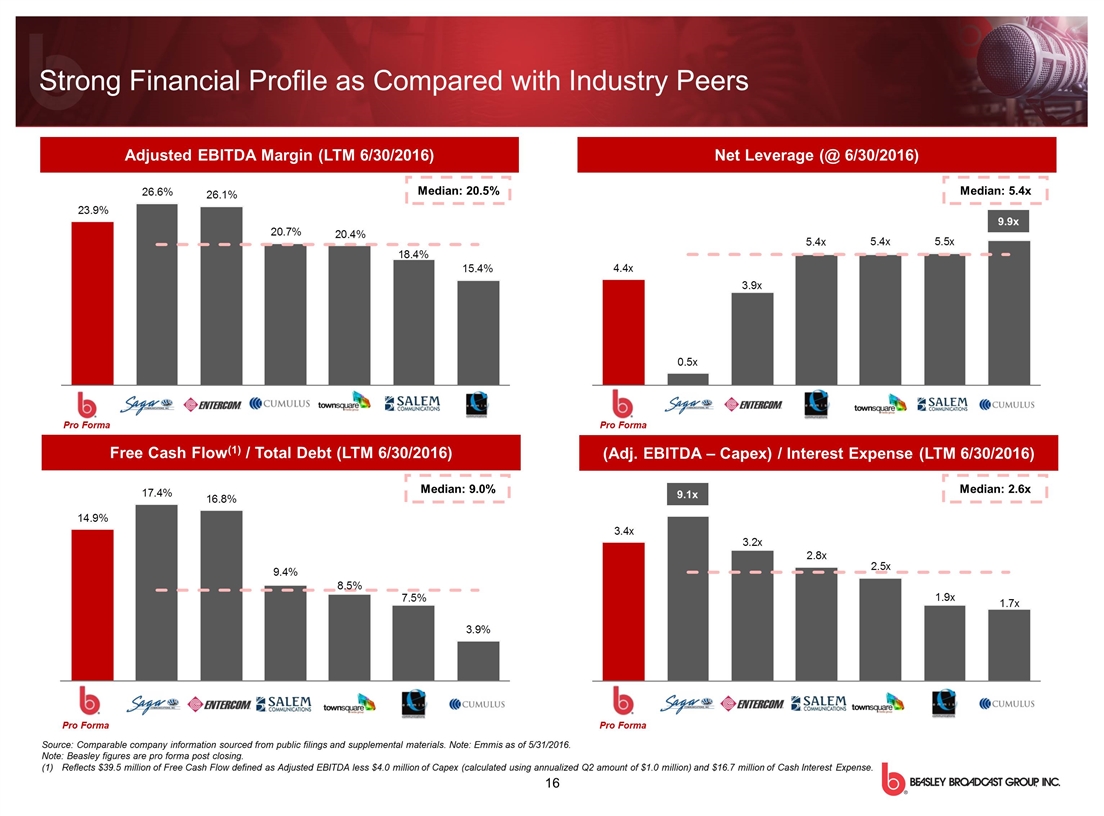
Strong Financial Profile as Compared with Industry Peers Adjusted EBITDA Margin (LTM 6/30/2016) Free Cash Flow(1) / Total Debt (LTM 6/30/2016) Net Debt (Adj. EBITDA – Capex) / Interest Expense (LTM 6/30/2016) Net Leverage (@ 6/30/2016) Source: Comparable company information sourced from public filings and supplemental materials. Note: Emmis as of 5/31/2016. Note: Beasley figures are pro forma post closing. Reflects $39.5 million of Free Cash Flow defined as Adjusted EBITDA less $4.0 million of Capex (calculated using annualized Q2 amount of $1.0 million) and $16.7 million of Cash Interest Expense. Pro Forma Pro Forma Pro Forma Pro Forma Median: 2.6x Median: 20.5% Median: 9.0% Median: 5.4x 9.5x 9.1x 9.9x
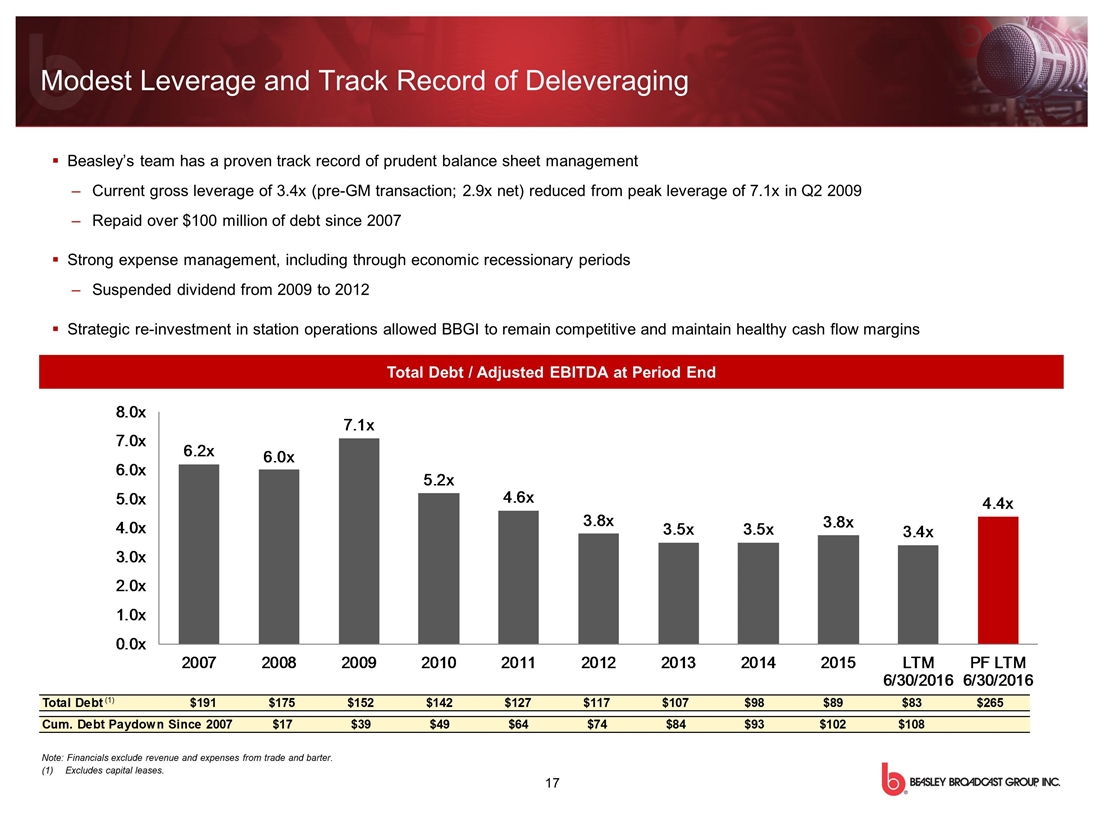
Modest Leverage and Track Record of Deleveraging 2.9x Net Leverage Beasley’s team has a proven track record of prudent balance sheet management Current gross leverage of 3.4x (pre-GM transaction; 2.9x net) reduced from peak leverage of 7.1x in Q2 2009 Repaid over $100 million of debt since 2007 Strong expense management, including through economic recessionary periods Suspended dividend from 2009 to 2012 Strategic re-investment in station operations allowed BBGI to remain competitive and maintain healthy cash flow margins Total Debt / Adjusted EBITDA at Period End Note: Financials exclude revenue and expenses from trade and barter. Excludes capital leases. (1)
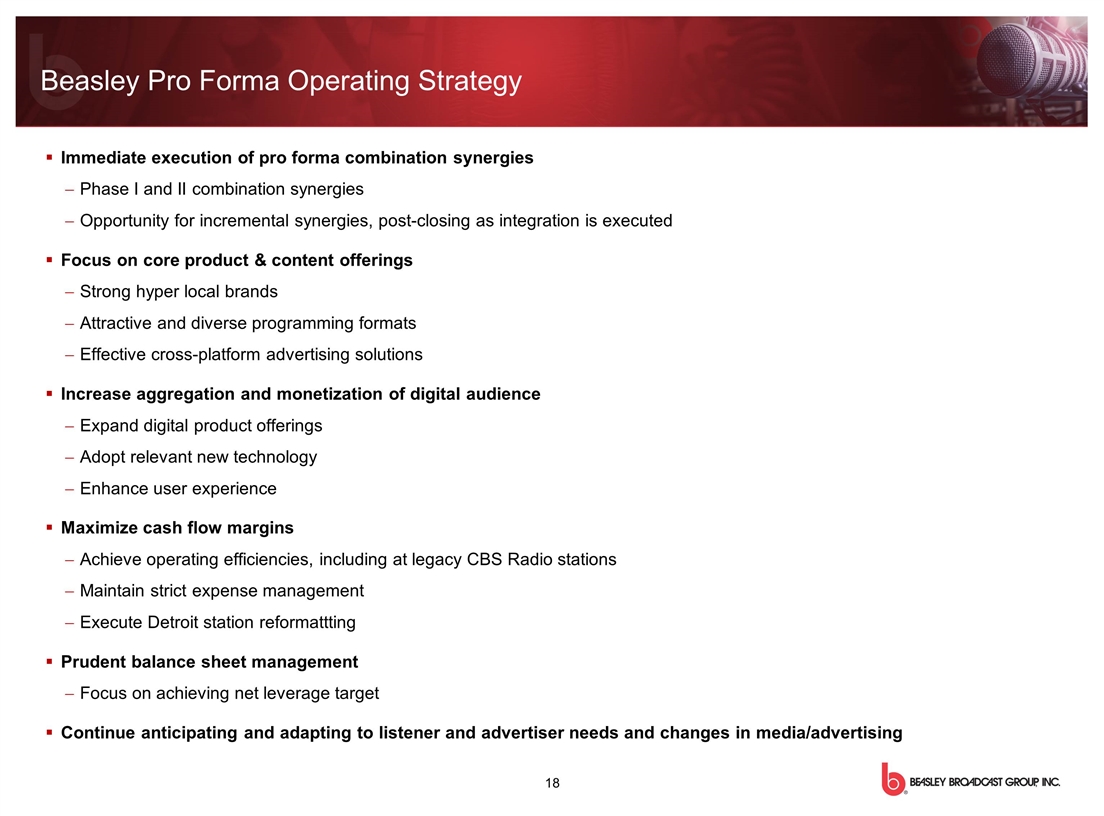
Immediate execution of pro forma combination synergies Phase I and II combination synergies Opportunity for incremental synergies, post-closing as integration is executed Focus on core product & content offerings Strong hyper local brands Attractive and diverse programming formats Effective cross-platform advertising solutions Increase aggregation and monetization of digital audience Expand digital product offerings Adopt relevant new technology Enhance user experience Maximize cash flow margins Achieve operating efficiencies, including at legacy CBS Radio stations Maintain strict expense management Execute Detroit station reformattting Prudent balance sheet management Focus on achieving net leverage target Continue anticipating and adapting to listener and advertiser needs and changes in media/advertising Beasley Pro Forma Operating Strategy
Station Portfolio Overview SECTION III

Strong Radio Portfolio Focused on East Coast Assets to be divested Pro Forma Statistics Markets 16 Owned / Operated Stations 73 FM / AM 52 / 21 Owned and Operated Radio Stations The total radio market revenues across the 16 markets that Pro Forma Beasley will serve is ~$1.4 billion Source: BIA. Markets where both Beasley and Greater Media are present Greater Media markets Beasley current markets 5 3 2 1 6 7 3 1 5 6 5 5 2 2 2 4 3 3 8
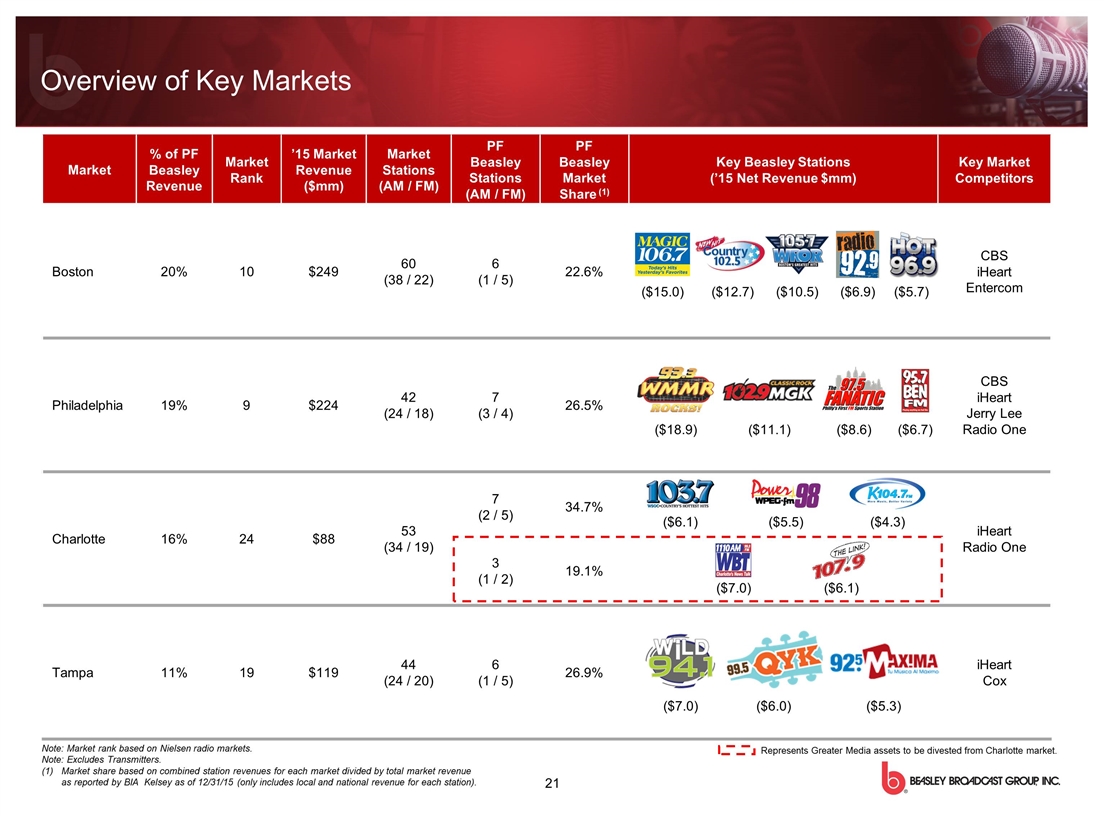
Overview of Key Markets Market % of PF Beasley Revenue Market Rank ’15 Market Revenue ($mm) Market Stations (AM / FM) PF Beasley Stations (AM / FM) PF Beasley Market Share (1) Key Beasley Stations (’15 Net Revenue $mm) Key Market Competitors Boston 20% 10 $249 60 (38 / 22) 6 (1 / 5) 22.6% CBS iHeart Entercom Philadelphia 19% 9 $224 42 (24 / 18) 7 (3 / 4) 26.5% CBS iHeart Jerry Lee Radio One Charlotte 16% 24 $88 53 (34 / 19) 7 (2 / 5) 3 (1 / 2) 34.7% 19.1% iHeart Radio One Tampa 11% 19 $119 44 (24 / 20) 6 (1 / 5) 26.9% iHeart Cox Note: Market rank based on Nielsen radio markets. Note: Excludes Transmitters. Market share based on combined station revenues for each market divided by total market revenue as reported by BIA Kelsey as of 12/31/15 (only includes local and national revenue for each station). ($15.0) ($12.7) ($10.5) ($11.1) ($6.9) ($5.7) ($18.9) ($6.7) ($8.6) ($6.1) ($5.5) ($7.0) ($6.0) ($5.3) ($4.3) 21 ($7.0) ($6.1) Represents Greater Media assets to be divested from Charlotte market.
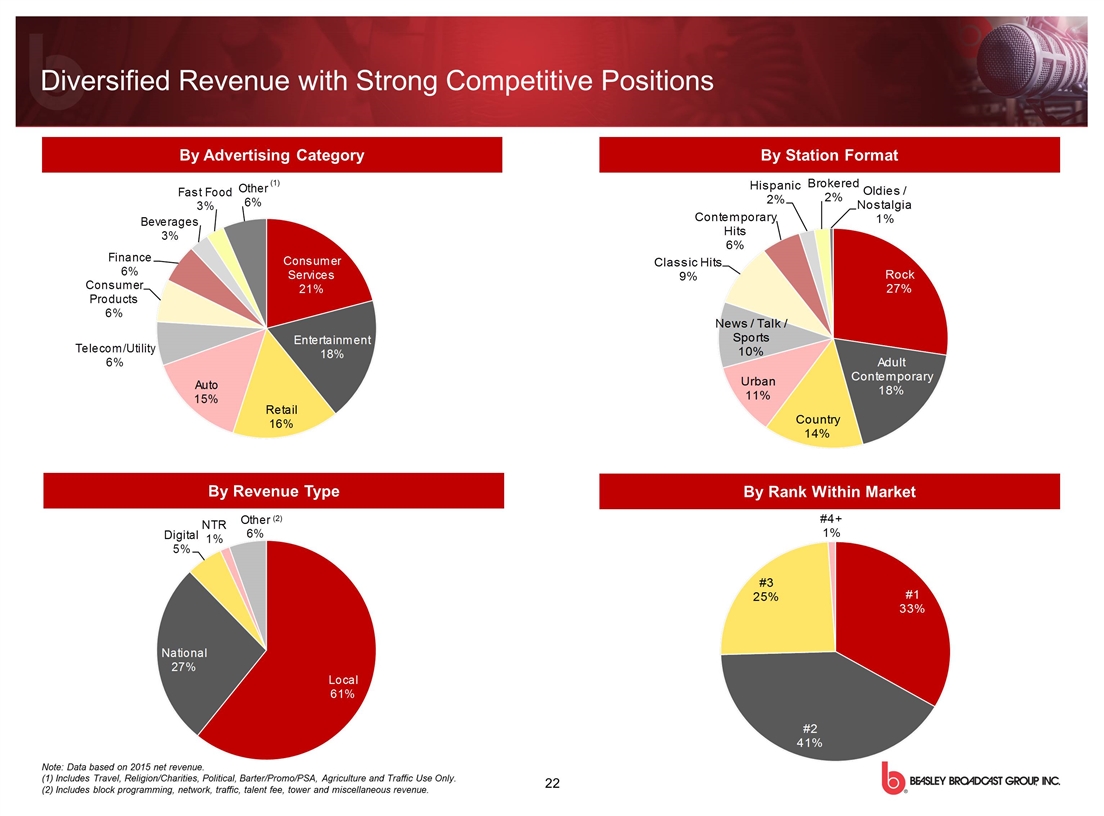
Diversified Revenue with Strong Competitive Positions 22 Note: Data based on 2015 net revenue. (1) Includes Travel, Religion/Charities, Political, Barter/Promo/PSA, Agriculture and Traffic Use Only. (2) Includes block programming, network, traffic, talent fee, tower and miscellaneous revenue. By Advertising Category By Revenue Type By Rank Within Market By Station Format (1) (2)

Industry Observations SECTION IV
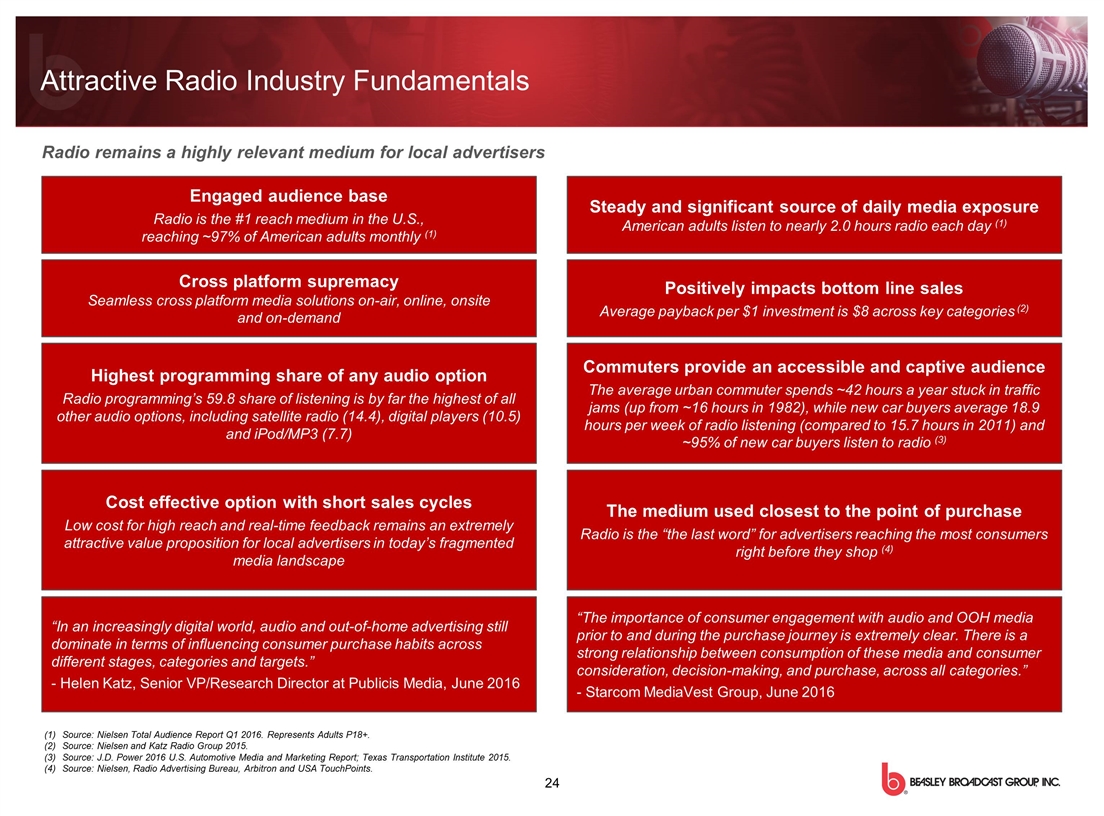
Attractive Radio Industry Fundamentals Engaged audience base Radio is the #1 reach medium in the U.S., reaching ~97% of American adults monthly (1) The medium used closest to the point of purchase Radio is the “the last word” for advertisers reaching the most consumers right before they shop (4) Highest programming share of any audio option Radio programming’s 59.8 share of listening is by far the highest of all other audio options, including satellite radio (14.4), digital players (10.5) and iPod/MP3 (7.7) Commuters provide an accessible and captive audience The average urban commuter spends ~42 hours a year stuck in traffic jams (up from ~16 hours in 1982), while new car buyers average 18.9 hours per week of radio listening (compared to 15.7 hours in 2011) and ~95% of new car buyers listen to radio (3) Source: Nielsen Total Audience Report Q1 2016. Represents Adults P18+. Source: Nielsen and Katz Radio Group 2015. Source: J.D. Power 2016 U.S. Automotive Media and Marketing Report; Texas Transportation Institute 2015. Source: Nielsen, Radio Advertising Bureau, Arbitron and USA TouchPoints. Radio remains a highly relevant medium for local advertisers Cost effective option with short sales cycles Low cost for high reach and real-time feedback remains an extremely attractive value proposition for local advertisers in today’s fragmented media landscape Steady and significant source of daily media exposure American adults listen to nearly 2.0 hours radio each day (1) Cross platform supremacy Seamless cross platform media solutions on-air, online, onsite and on-demand Positively impacts bottom line sales Average payback per $1 investment is $8 across key categories (2) “In an increasingly digital world, audio and out-of-home advertising still dominate in terms of influencing consumer purchase habits across different stages, categories and targets.” - Helen Katz, Senior VP/Research Director at Publicis Media, June 2016 “The importance of consumer engagement with audio and OOH media prior to and during the purchase journey is extremely clear. There is a strong relationship between consumption of these media and consumer consideration, decision-making, and purchase, across all categories.” - Starcom MediaVest Group, June 2016
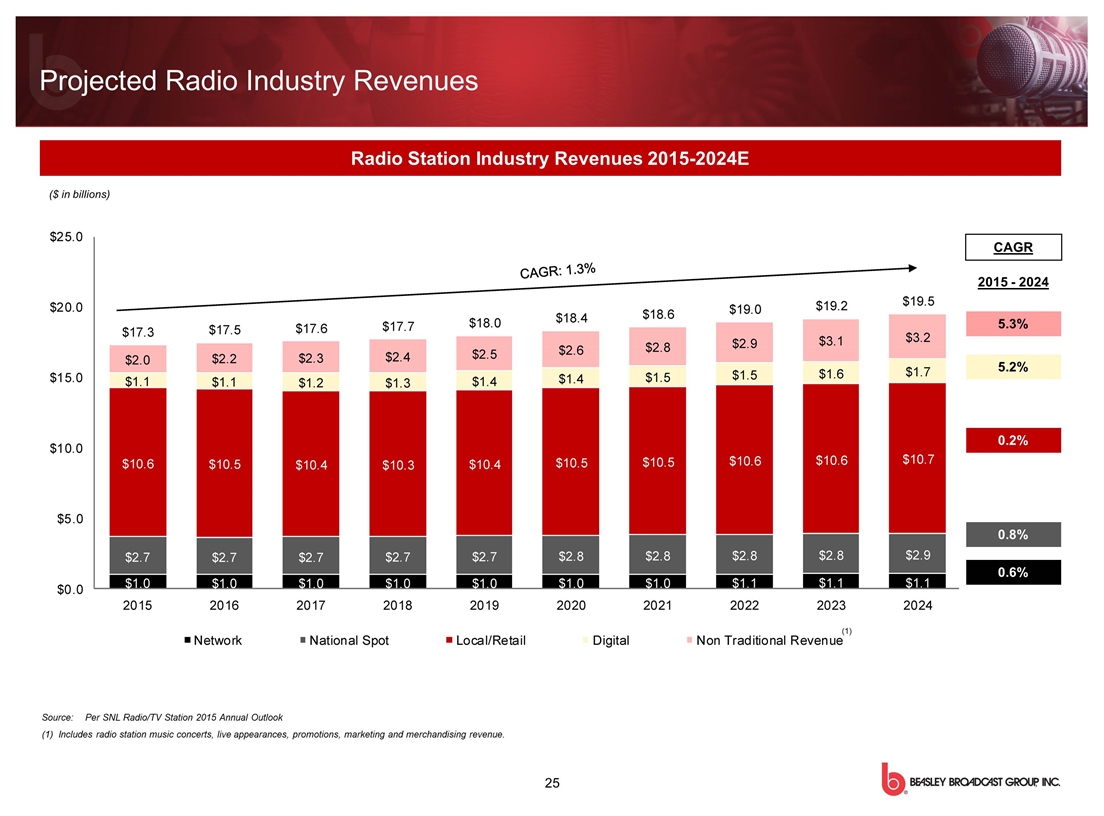
Projected Radio Industry Revenues ($ in billions) Source:Per SNL Radio/TV Station 2015 Annual Outlook (1) Includes radio station music concerts, live appearances, promotions, marketing and merchandising revenue. CAGR 2015 - 2024 5.3% 5.2% 0.2% 0.8% 0.6% Radio Station Industry Revenues 2015-2024E
Pre-Closing Expense Reductions & Combination Synergies SECTION V
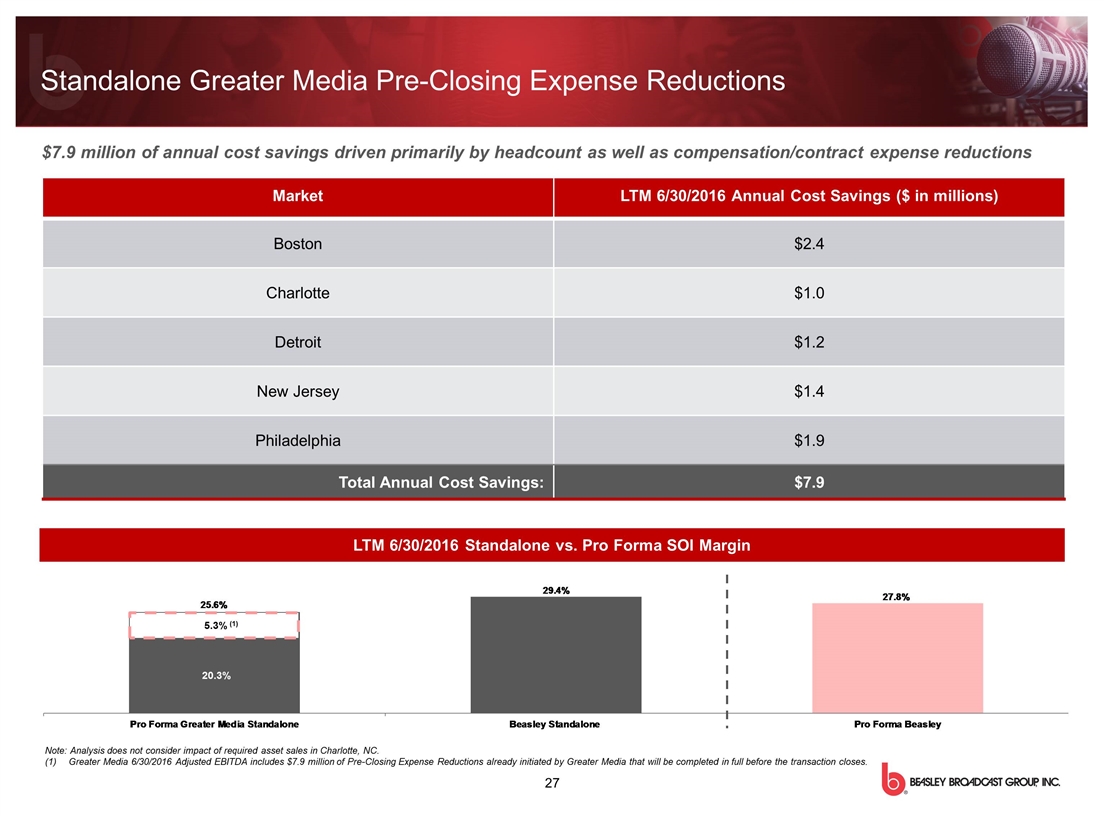
Note: Analysis does not consider impact of required asset sales in Charlotte, NC. Greater Media 6/30/2016 Adjusted EBITDA includes $7.9 million of Pre-Closing Expense Reductions already initiated by Greater Media that will be completed in full before the transaction closes. Standalone Greater Media Pre-Closing Expense Reductions LTM 6/30/2016 Standalone vs. Pro Forma SOI Margin Market LTM 6/30/2016 Annual Cost Savings ($ in millions) Boston $2.4 Charlotte $1.0 Detroit $1.2 New Jersey $1.4 Philadelphia $1.9 Total Annual Cost Savings: $7.9 5.3% (1) 20.3% $7.9 million of annual cost savings driven primarily by headcount as well as compensation/contract expense reductions
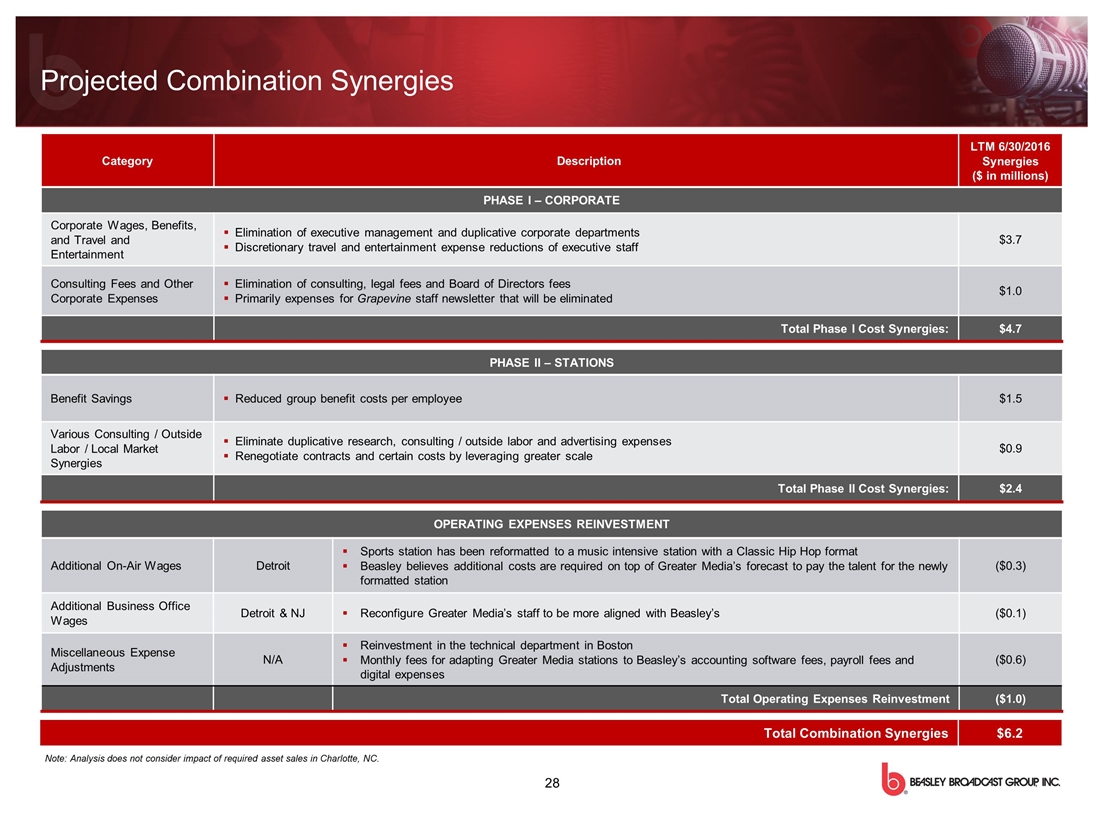
Category Description LTM 6/30/2016 Synergies ($ in millions) PHASE I – CORPORATE Corporate Wages, Benefits, and Travel and Entertainment Elimination of executive management and duplicative corporate departments Discretionary travel and entertainment expense reductions of executive staff $3.7 Consulting Fees and Other Corporate Expenses Elimination of consulting, legal fees and Board of Directors fees Primarily expenses for Grapevine staff newsletter that will be eliminated $1.0 Total Phase I Cost Synergies: $4.7 Projected Combination Synergies PHASE II – STATIONS Benefit Savings Reduced group benefit costs per employee $1.5 Various Consulting / Outside Labor / Local Market Synergies Eliminate duplicative research, consulting / outside labor and advertising expenses Renegotiate contracts and certain costs by leveraging greater scale $0.9 Total Phase II Cost Synergies: $2.4 Total Combination Synergies $6.2 OPERATING EXPENSES REINVESTMENT Additional On-Air Wages Detroit Sports station has been reformatted to a music intensive station with a Classic Hip Hop format Beasley believes additional costs are required on top of Greater Media’s forecast to pay the talent for the newly formatted station ($0.3) Additional Business Office Wages Detroit & NJ Reconfigure Greater Media’s staff to be more aligned with Beasley’s ($0.1) Miscellaneous Expense Adjustments N/A Reinvestment in the technical department in Boston Monthly fees for adapting Greater Media stations to Beasley’s accounting software fees, payroll fees and digital expenses ($0.6) Total Operating Expenses Reinvestment ($1.0) Note: Analysis does not consider impact of required asset sales in Charlotte, NC.
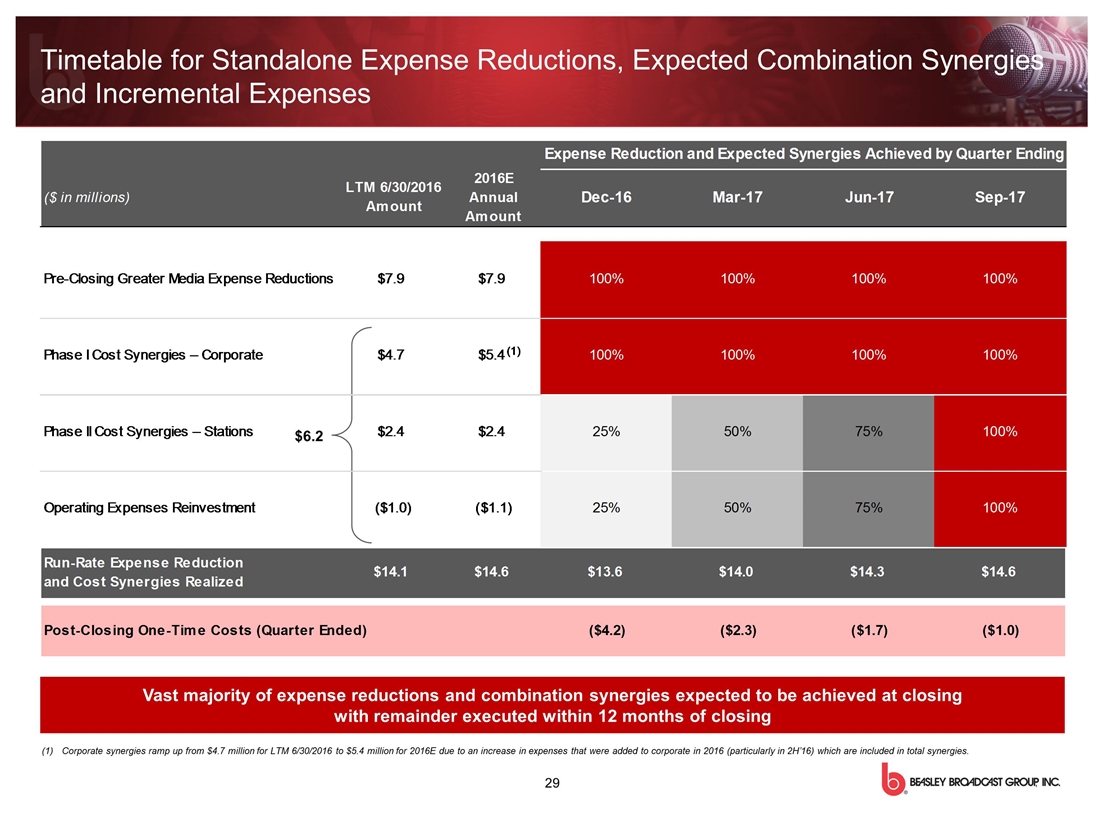
Timetable for Standalone Expense Reductions, Expected Combination Synergies and Incremental Expenses Vast majority of expense reductions and combination synergies expected to be achieved at closing with remainder executed within 12 months of closing $6.2 Corporate synergies ramp up from $4.7 million for LTM 6/30/2016 to $5.4 million for 2016E due to an increase in expenses that were added to corporate in 2016 (particularly in 2H’16) which are included in total synergies.

Historical Financial Overview SECTION VI
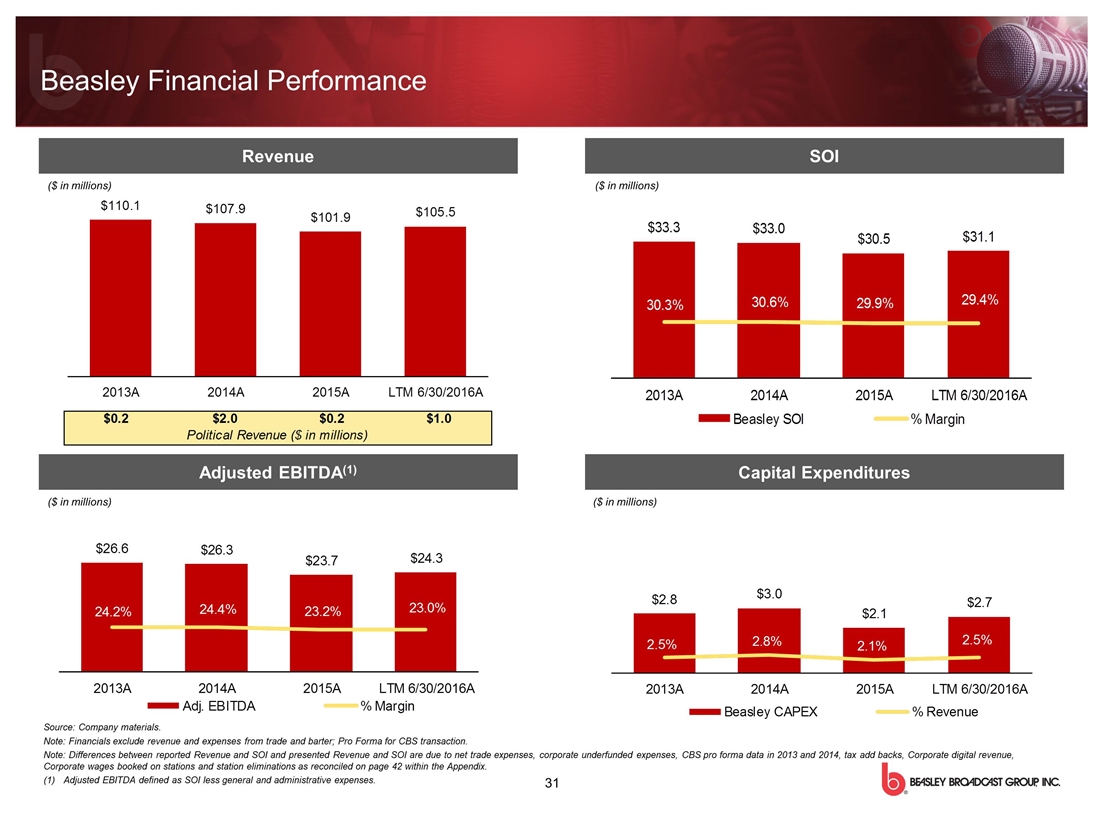
Adjusted EBITDA(1) Capital Expenditures SOI Revenue ($ in millions) ($ in millions) ($ in millions) ($ in millions) Source: Company materials. Note: Financials exclude revenue and expenses from trade and barter; Pro Forma for CBS transaction. Note: Differences between reported Revenue and SOI and presented Revenue and SOI are due to net trade expenses, corporate underfunded expenses, CBS pro forma data in 2013 and 2014, tax add backs, Corporate digital revenue, Corporate wages booked on stations and station eliminations as reconciled on page 42 within the Appendix. Adjusted EBITDA defined as SOI less general and administrative expenses. Beasley Financial Performance
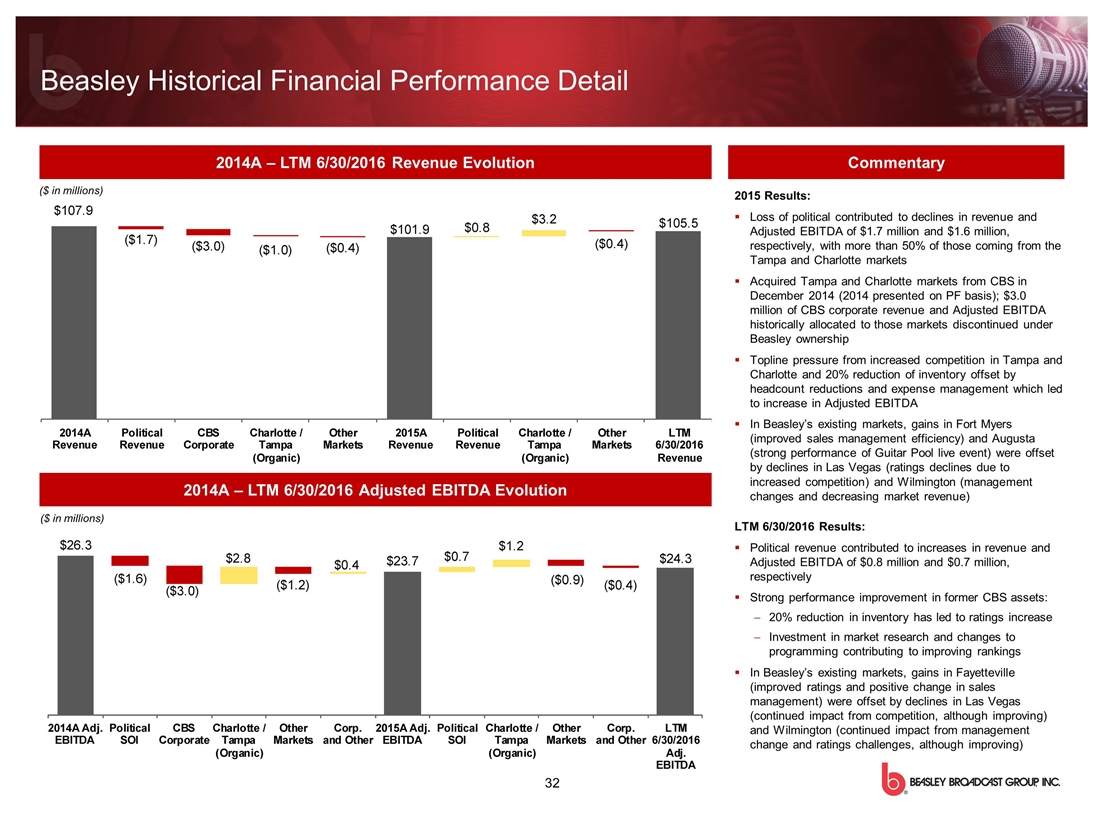
Beasley Historical Financial Performance Detail 2014A – LTM 6/30/2016 Revenue Evolution 2014A – LTM 6/30/2016 Adjusted EBITDA Evolution Commentary ($ in millions) ($ in millions) 2015 Results: Loss of political contributed to declines in revenue and Adjusted EBITDA of $1.7 million and $1.6 million, respectively, with more than 50% of those coming from the Tampa and Charlotte markets Acquired Tampa and Charlotte markets from CBS in December 2014 (2014 presented on PF basis); $3.0 million of CBS corporate revenue and Adjusted EBITDA historically allocated to those markets discontinued under Beasley ownership Topline pressure from increased competition in Tampa and Charlotte and 20% reduction of inventory offset by headcount reductions and expense management which led to increase in Adjusted EBITDA In Beasley’s existing markets, gains in Fort Myers (improved sales management efficiency) and Augusta (strong performance of Guitar Pool live event) were offset by declines in Las Vegas (ratings declines due to increased competition) and Wilmington (management changes and decreasing market revenue) LTM 6/30/2016 Results: Political revenue contributed to increases in revenue and Adjusted EBITDA of $0.8 million and $0.7 million, respectively Strong performance improvement in former CBS assets: 20% reduction in inventory has led to ratings increase Investment in market research and changes to programming contributing to improving rankings In Beasley’s existing markets, gains in Fayetteville (improved ratings and positive change in sales management) were offset by declines in Las Vegas (continued impact from competition, although improving) and Wilmington (continued impact from management change and ratings challenges, although improving)
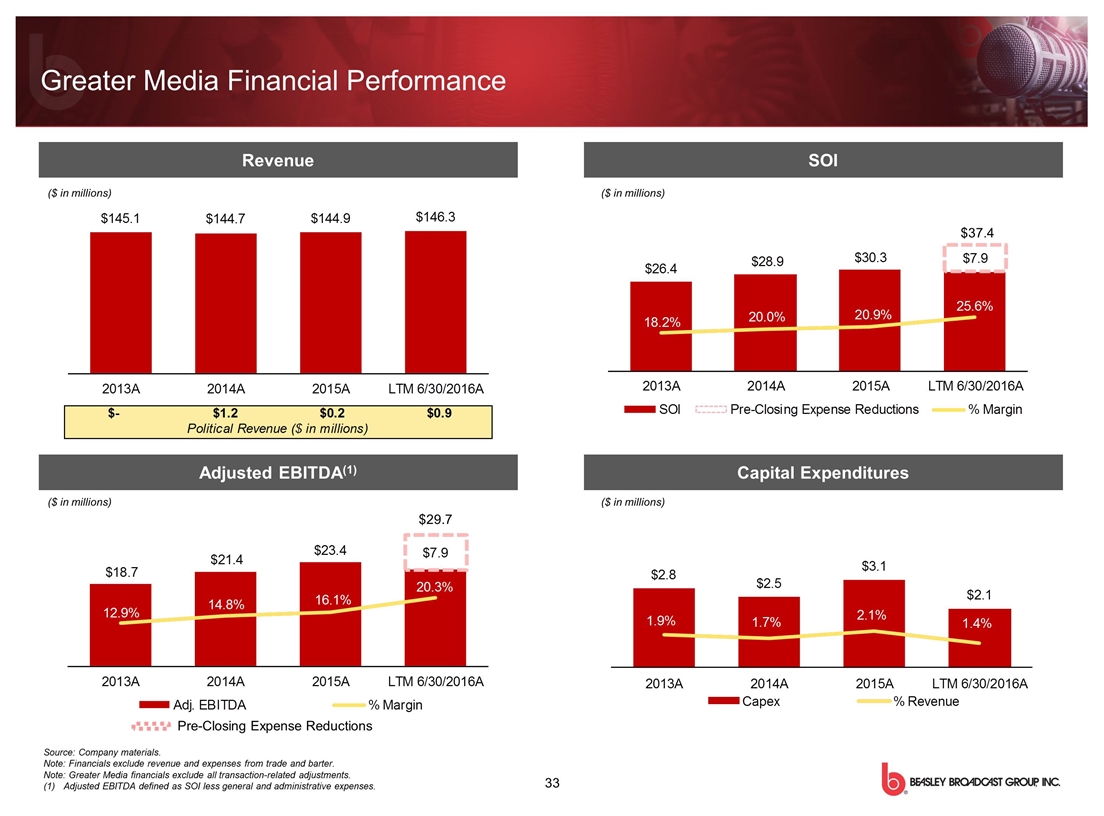
SOI Capital Expenditures Adjusted EBITDA(1) Revenue ($ in millions) ($ in millions) ($ in millions) ($ in millions) Source: Company materials. Note: Financials exclude revenue and expenses from trade and barter. Note: Greater Media financials exclude all transaction-related adjustments. Adjusted EBITDA defined as SOI less general and administrative expenses. Greater Media Financial Performance $29.7 $37.4 Pre-Closing Expense Reductions
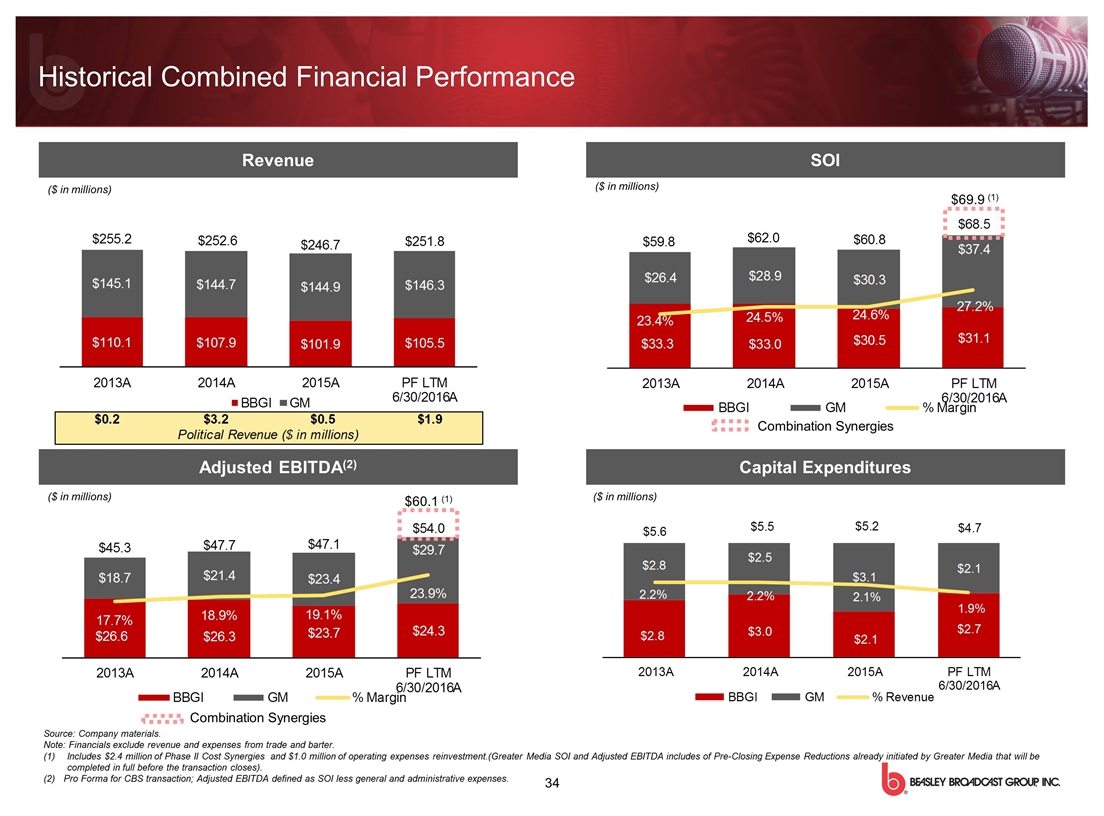
Historical Combined Financial Performance SOI Capital Expenditures Adjusted EBITDA(2) Revenue ($ in millions) ($ in millions) ($ in millions) ($ in millions) Source: Company materials. Note: Financials exclude revenue and expenses from trade and barter. Includes $2.4 million of Phase II Cost Synergies and $1.0 million of operating expenses reinvestment.(Greater Media SOI and Adjusted EBITDA includes of Pre-Closing Expense Reductions already initiated by Greater Media that will be completed in full before the transaction closes). Pro Forma for CBS transaction; Adjusted EBITDA defined as SOI less general and administrative expenses. $69.9 (1) $60.1 (1) Combination Synergies Combination Synergies

Appendix
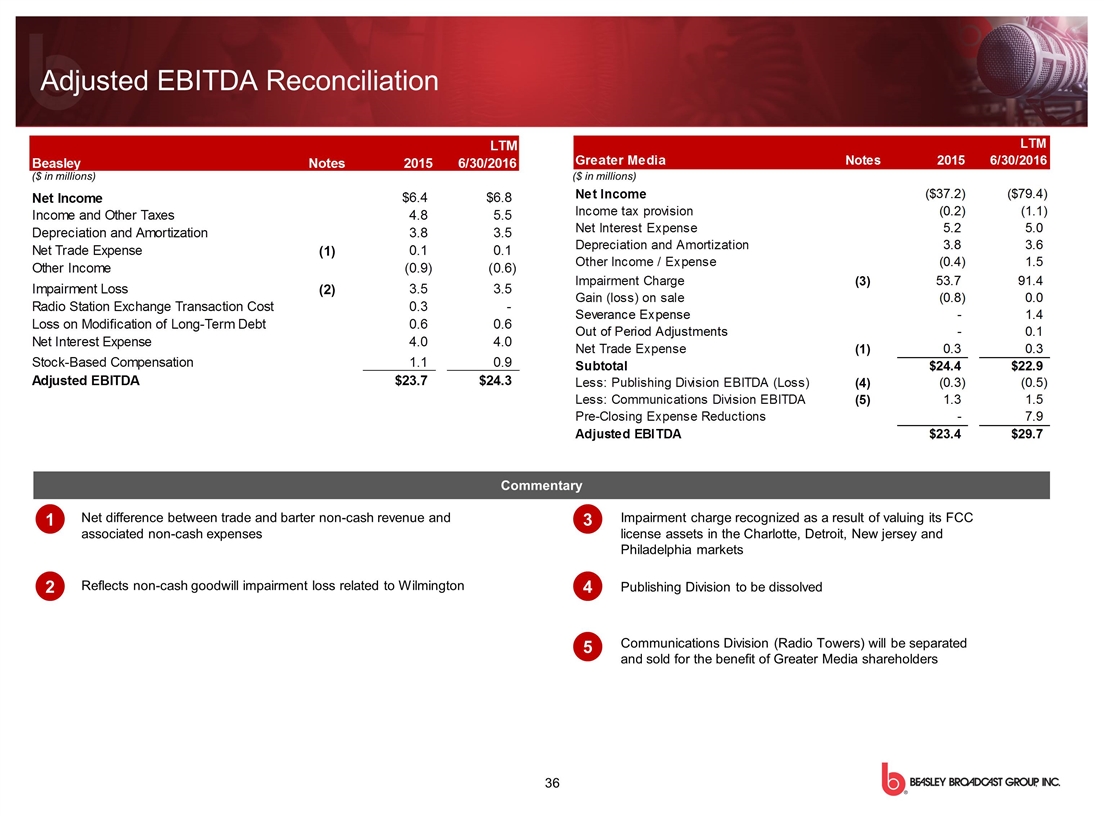
Impairment charge recognized as a result of valuing its FCC license assets in the Charlotte, Detroit, New jersey and Philadelphia markets Publishing Division to be dissolved Communications Division (Radio Towers) will be separated and sold for the benefit of Greater Media shareholders 3 4 Net difference between trade and barter non-cash revenue and associated non-cash expenses Reflects non-cash goodwill impairment loss related to Wilmington 1 2 Commentary 5 Adjusted EBITDA Reconciliation ($ in millions) ($ in millions)
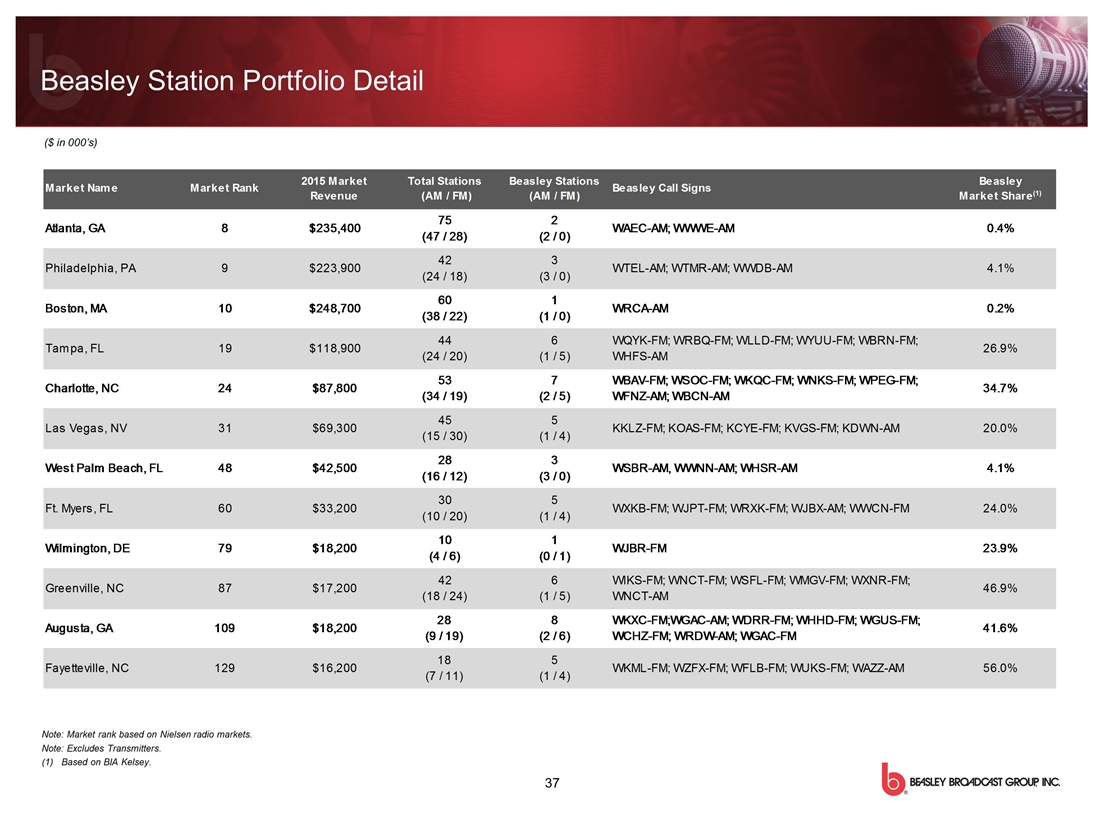
Beasley Station Portfolio Detail Note: Market rank based on Nielsen radio markets. Note: Excludes Transmitters. Based on BIA Kelsey. ($ in 000’s)
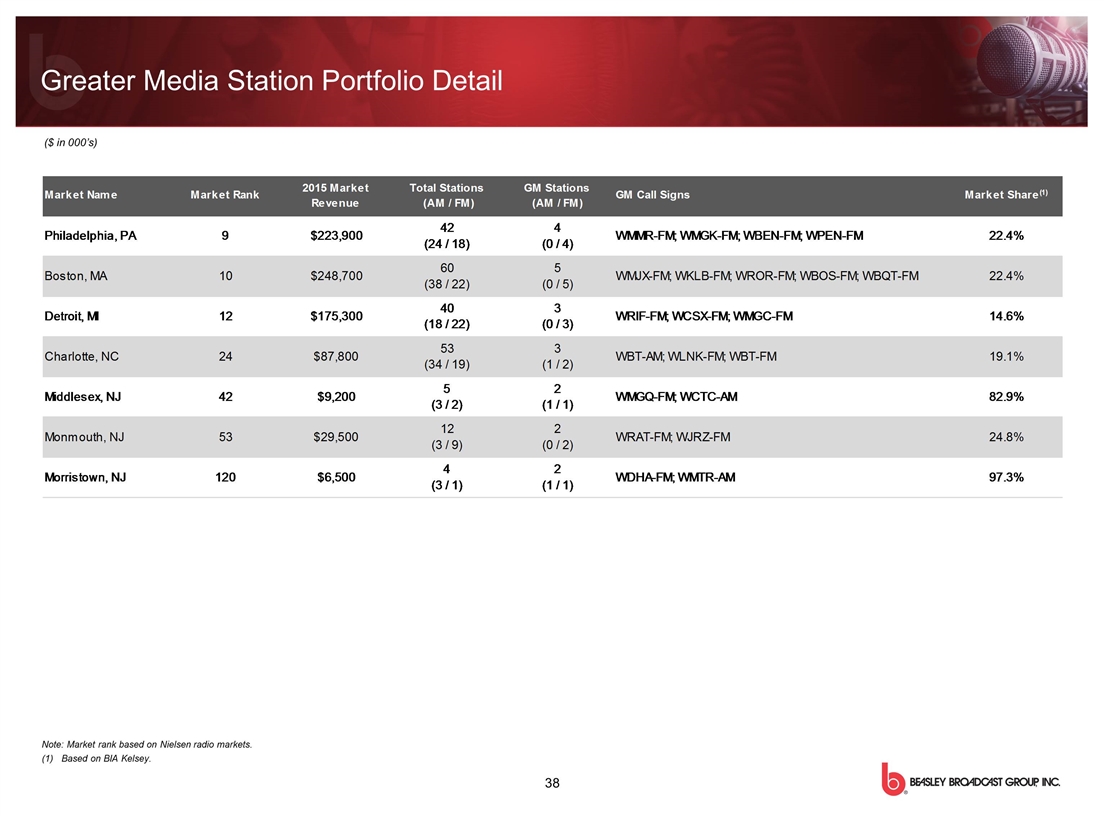
Greater Media Station Portfolio Detail Note: Market rank based on Nielsen radio markets. Based on BIA Kelsey. ($ in 000’s)
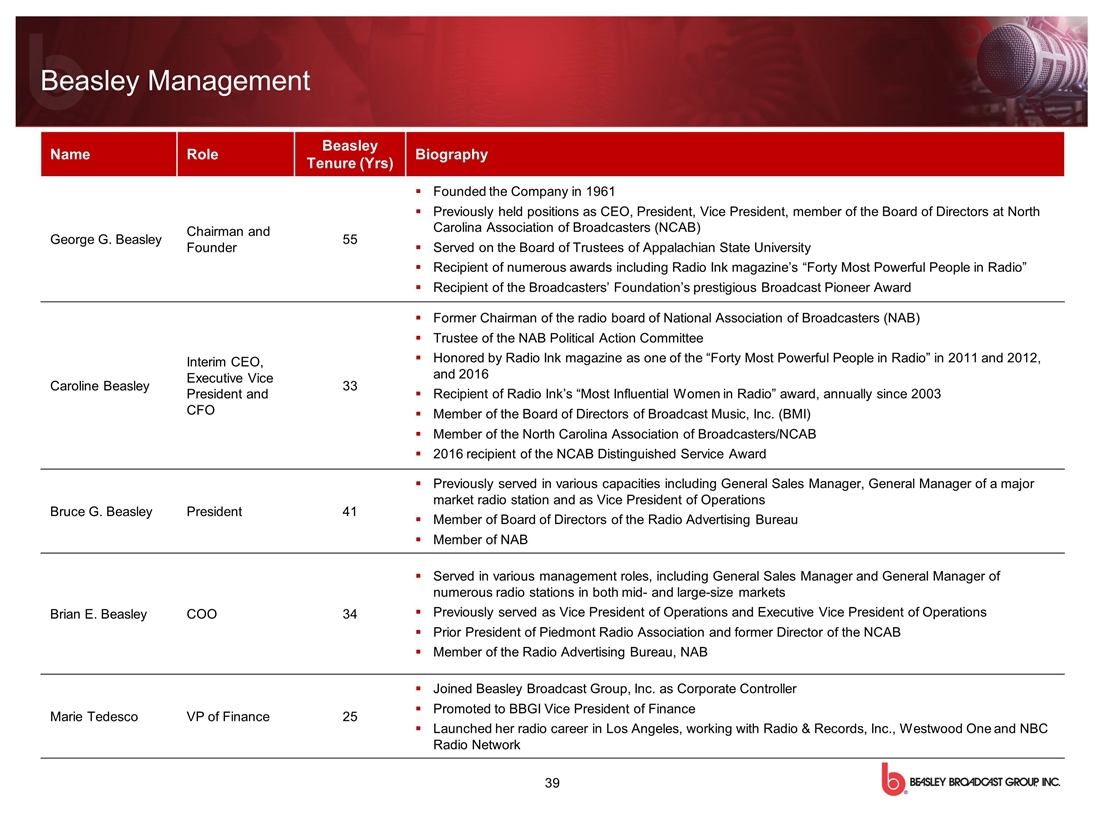
Name Role Beasley Tenure (Yrs) Biography George G. Beasley Chairman and Founder 55 Founded the Company in 1961 Previously held positions as CEO, President, Vice President, member of the Board of Directors at North Carolina Association of Broadcasters (NCAB) Served on the Board of Trustees of Appalachian State University Recipient of numerous awards including Radio Ink magazine’s “Forty Most Powerful People in Radio” Recipient of the Broadcasters’ Foundation’s prestigious Broadcast Pioneer Award Caroline Beasley Interim CEO, Executive Vice President and CFO 33 Former Chairman of the radio board of National Association of Broadcasters (NAB) Trustee of the NAB Political Action Committee Honored by Radio Ink magazine as one of the “Forty Most Powerful People in Radio” in 2011 and 2012, and 2016 Recipient of Radio Ink’s “Most Influential Women in Radio” award, annually since 2003 Member of the Board of Directors of Broadcast Music, Inc. (BMI) Member of the North Carolina Association of Broadcasters/NCAB 2016 recipient of the NCAB Distinguished Service Award Bruce G. Beasley President 41 Previously served in various capacities including General Sales Manager, General Manager of a major market radio station and as Vice President of Operations Member of Board of Directors of the Radio Advertising Bureau Member of NAB Brian E. Beasley COO 34 Served in various management roles, including General Sales Manager and General Manager of numerous radio stations in both mid- and large-size markets Previously served as Vice President of Operations and Executive Vice President of Operations Prior President of Piedmont Radio Association and former Director of the NCAB Member of the Radio Advertising Bureau, NAB Marie Tedesco VP of Finance 25 Joined Beasley Broadcast Group, Inc. as Corporate Controller Promoted to BBGI Vice President of Finance Launched her radio career in Los Angeles, working with Radio & Records, Inc., Westwood One and NBC Radio Network Beasley Management
Non-GAAP Reconciliations
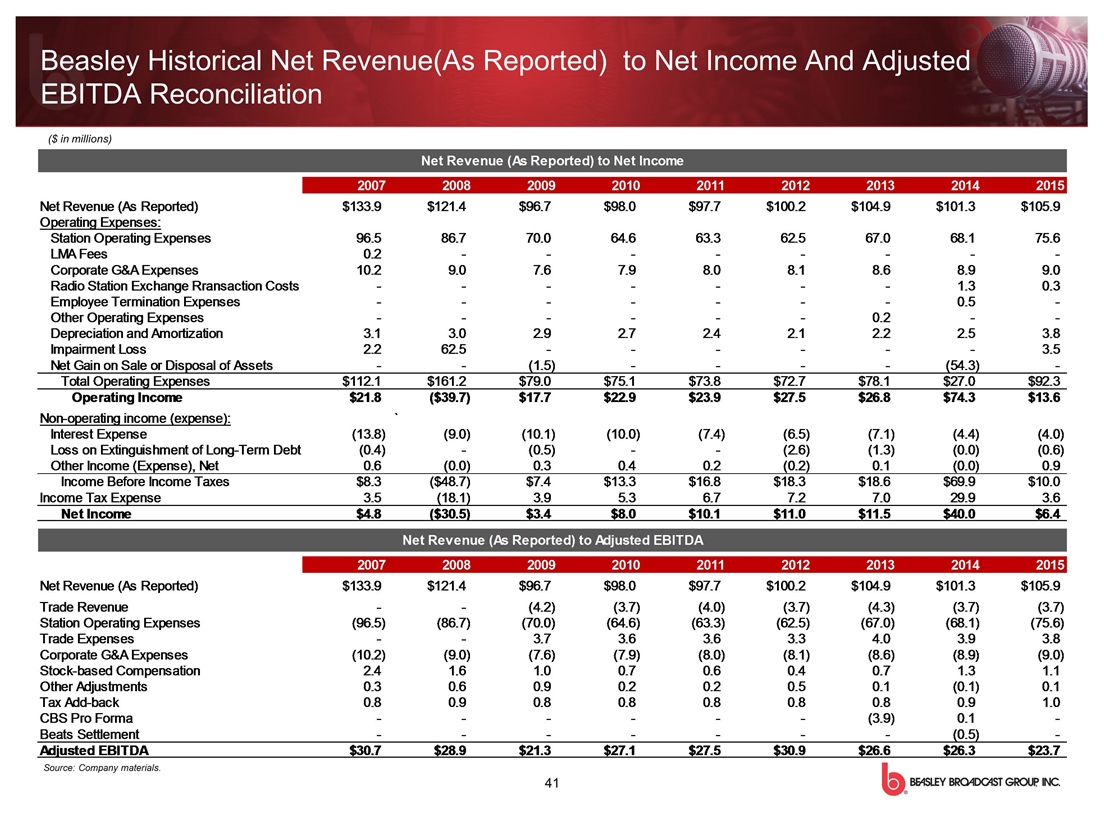
Beasley Historical Net Revenue(As Reported) to Net Income And Adjusted EBITDA Reconciliation ($ in millions) Source: Company materials.
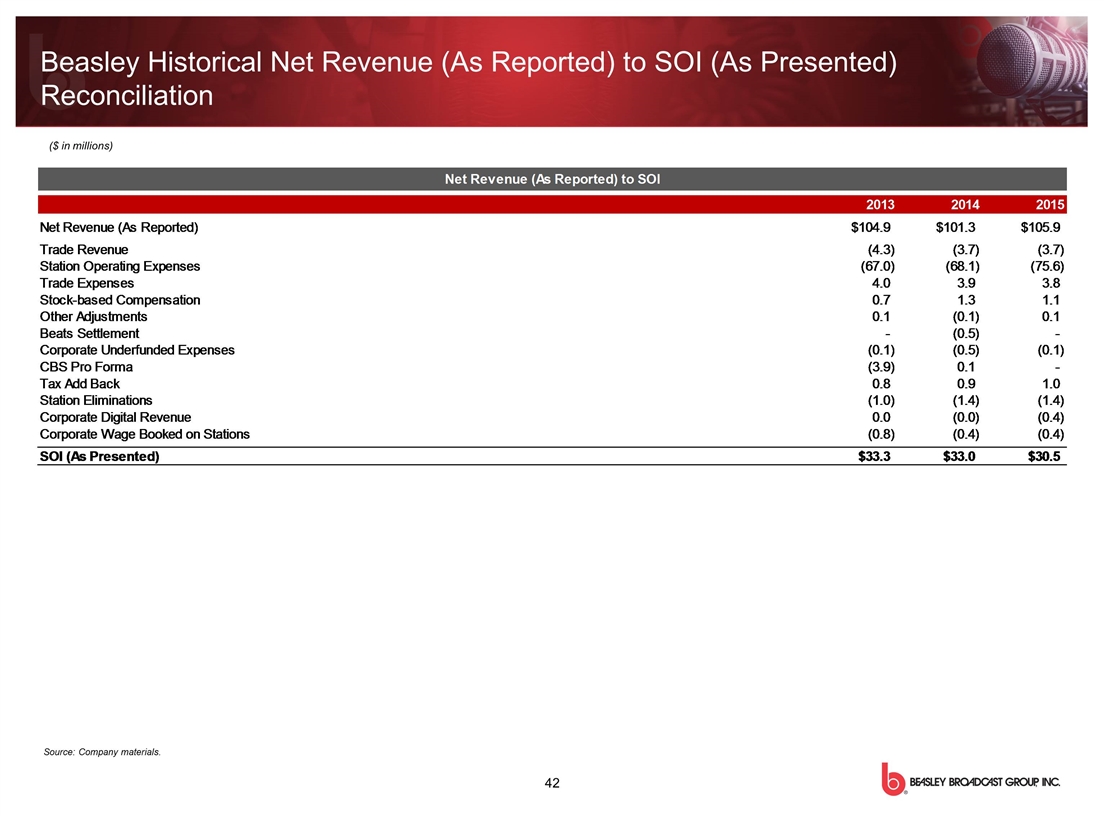
Beasley Historical Net Revenue (As Reported) to SOI (As Presented) Reconciliation ($ in millions) Source: Company materials.
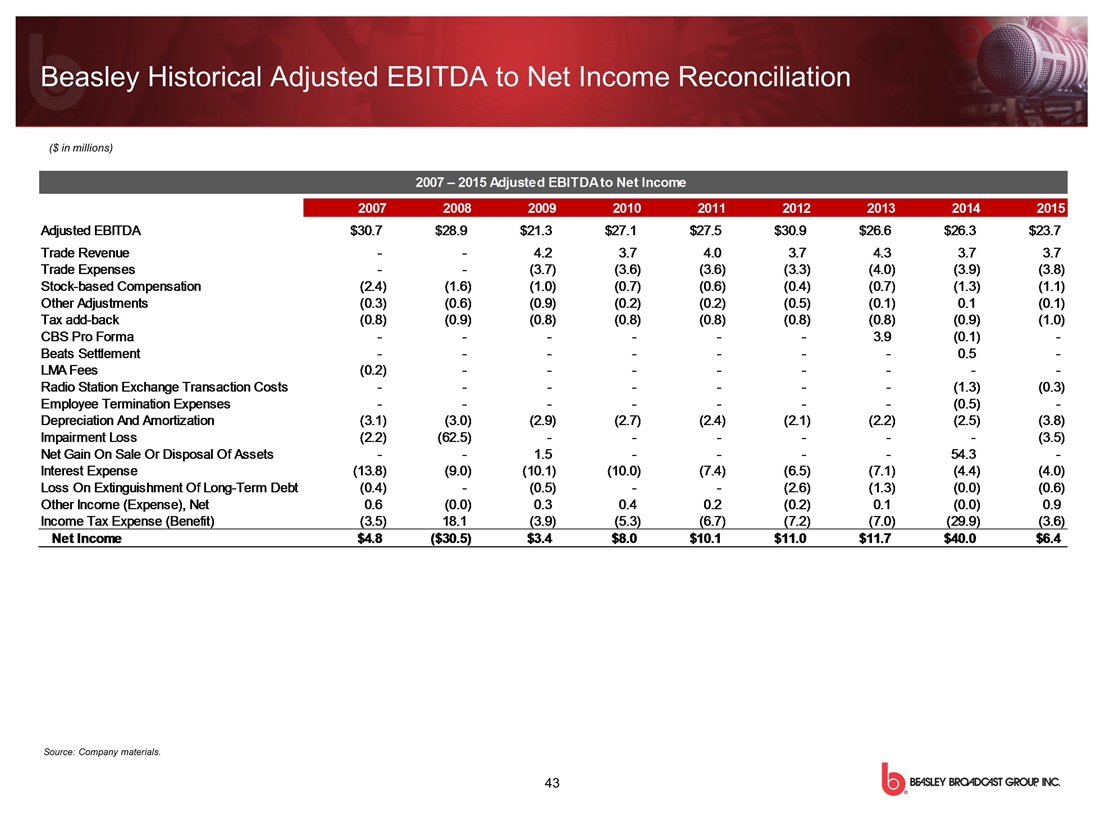
Beasley Historical Adjusted EBITDA to Net Income Reconciliation ($ in millions) Source: Company materials.
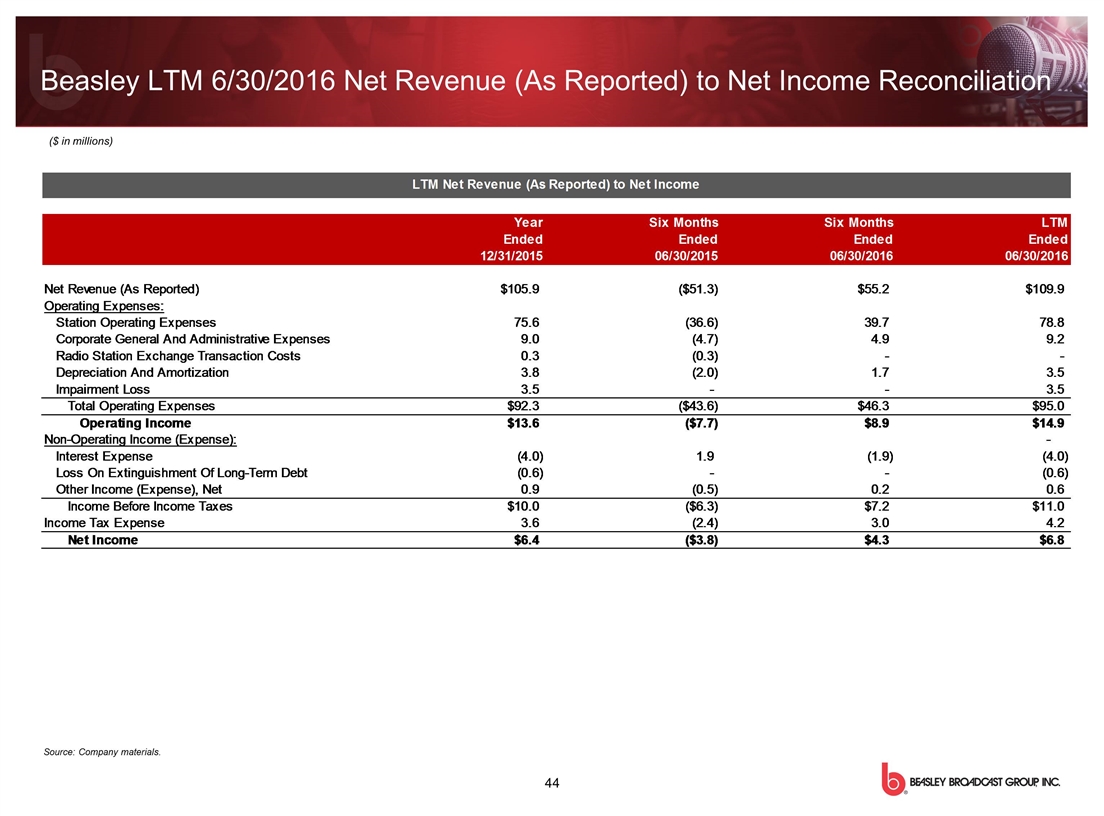
Beasley LTM 6/30/2016 Net Revenue (As Reported) to Net Income Reconciliation Source: Company materials. ($ in millions)
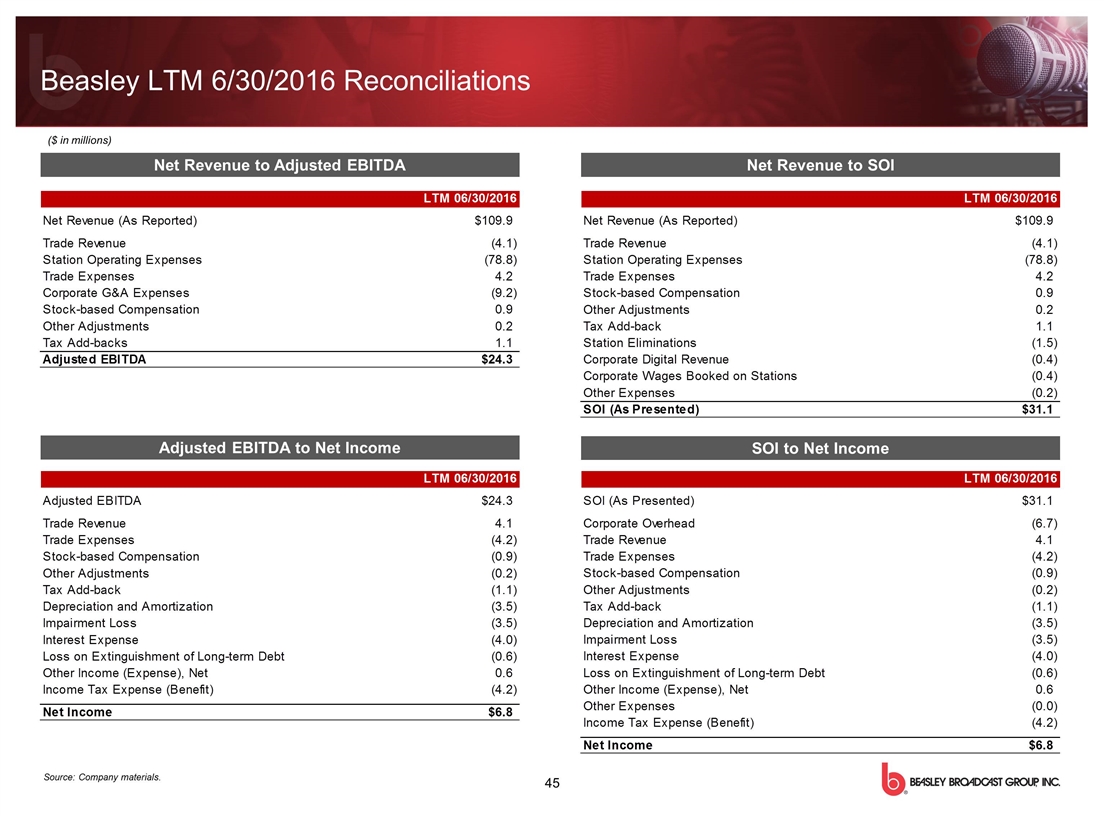
($ in millions) Source: Company materials. Beasley LTM 6/30/2016 Reconciliations Net Revenue to Adjusted EBITDA Adjusted EBITDA to Net Income SOI to Net Income Net Revenue to SOI
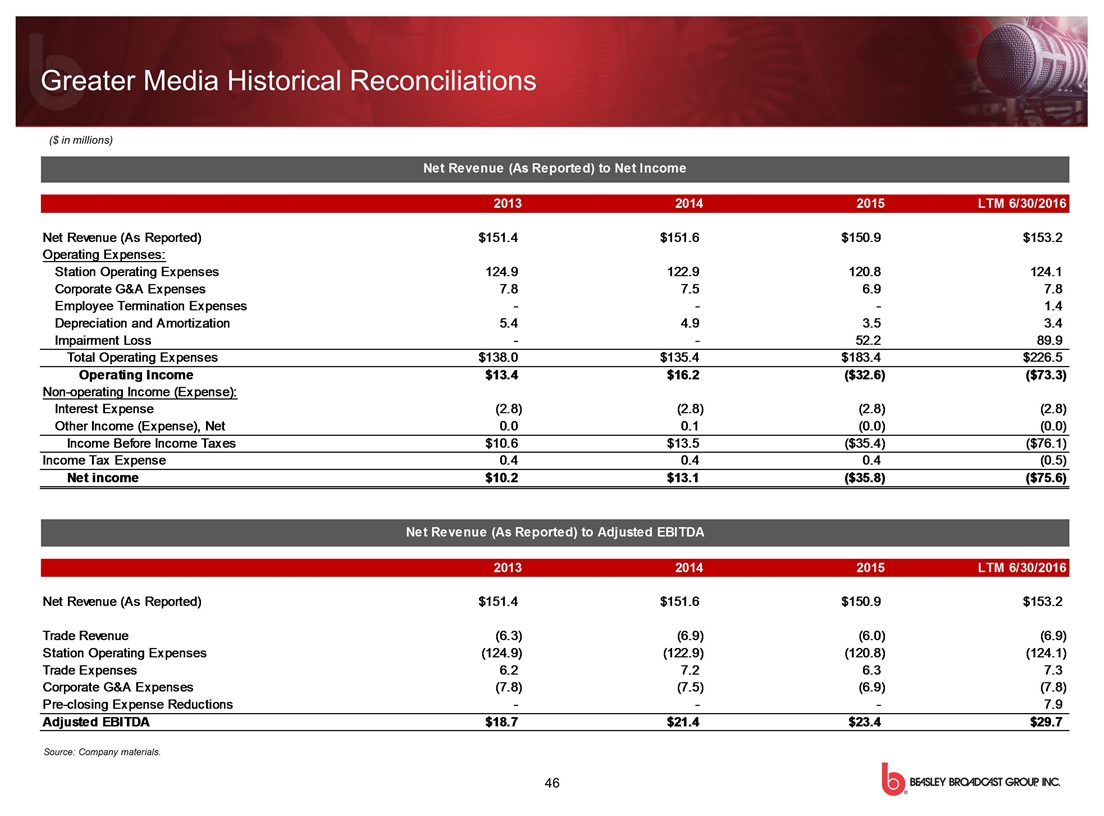
Greater Media Historical Reconciliations ($ in millions) Source: Company materials.
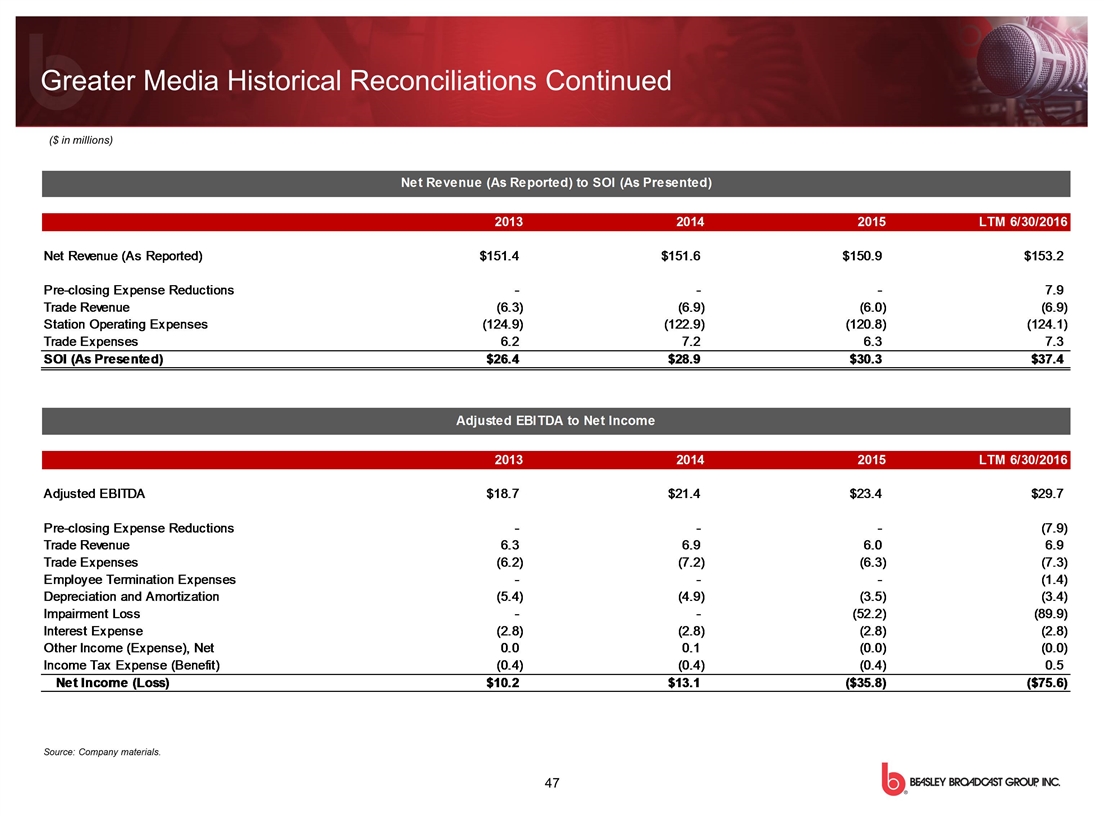
Greater Media Historical Reconciliations Continued Source: Company materials. ($ in millions)
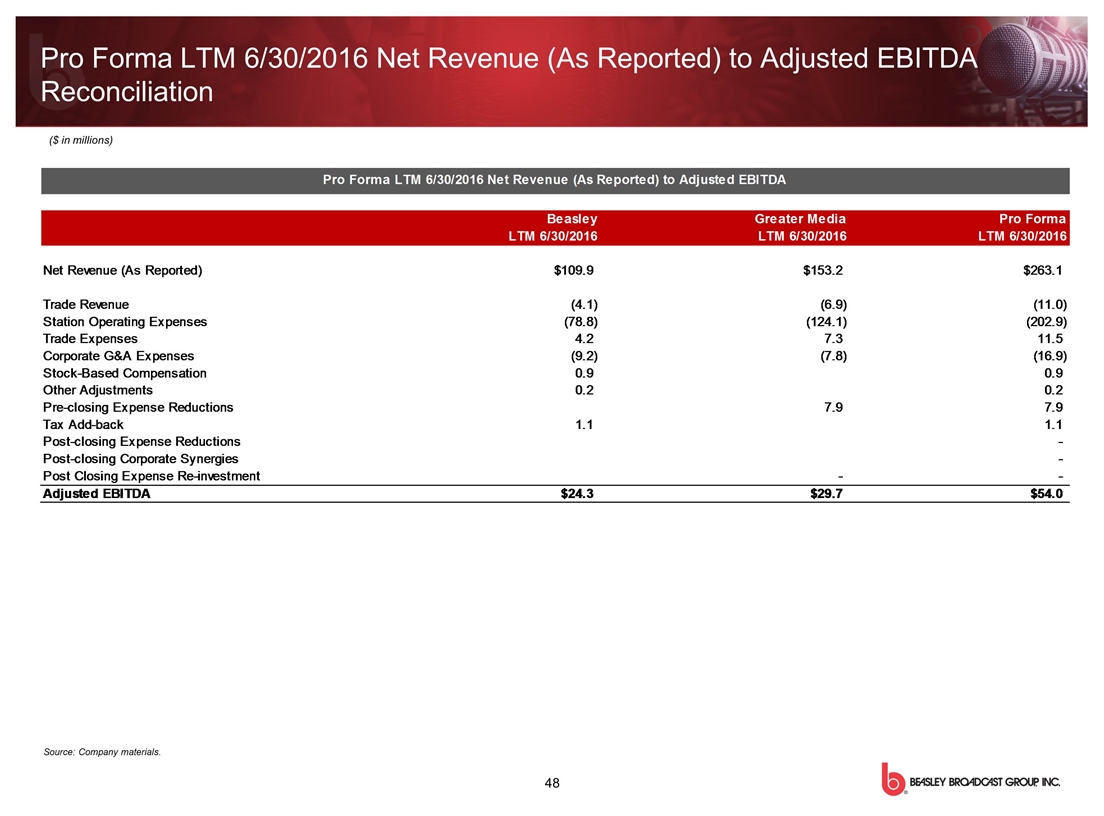
Pro Forma LTM 6/30/2016 Net Revenue (As Reported) to Adjusted EBITDA Reconciliation Source: Company materials. ($ in millions)
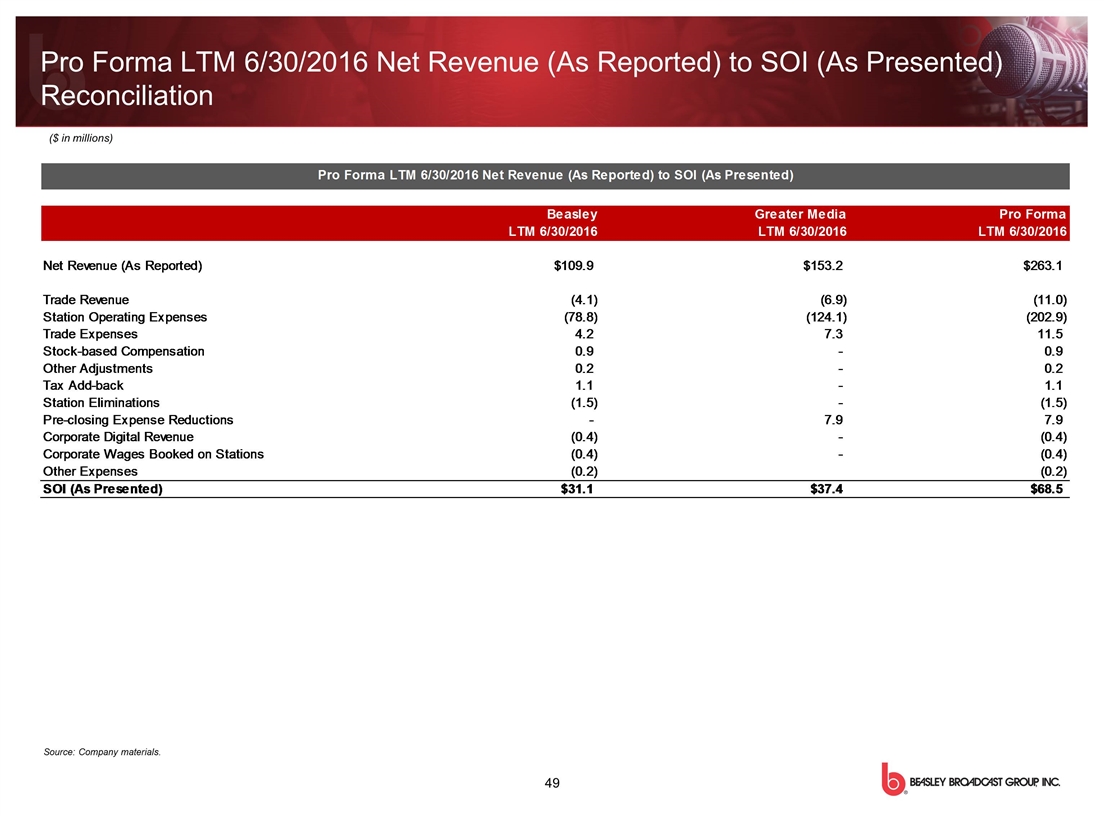
Pro Forma LTM 6/30/2016 Net Revenue (As Reported) to SOI (As Presented) Reconciliation Source: Company materials. ($ in millions)
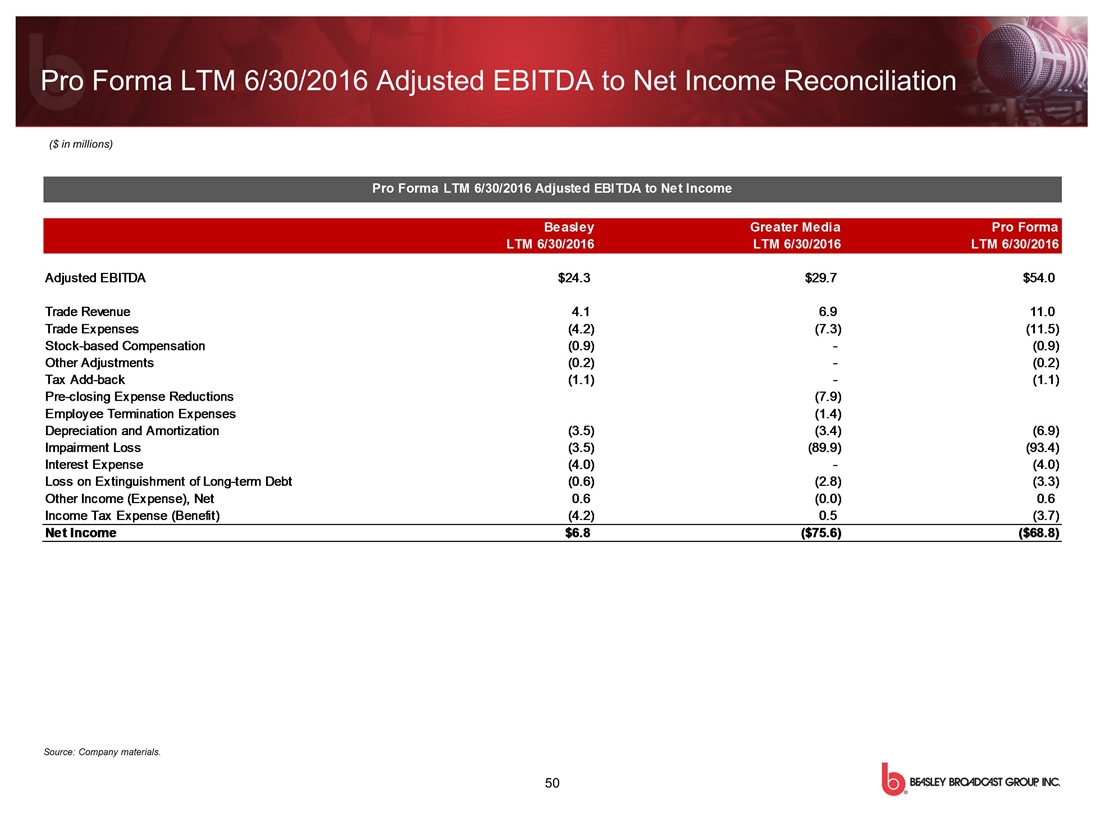
Pro Forma LTM 6/30/2016 Adjusted EBITDA to Net Income Reconciliation Source: Company materials. ($ in millions)
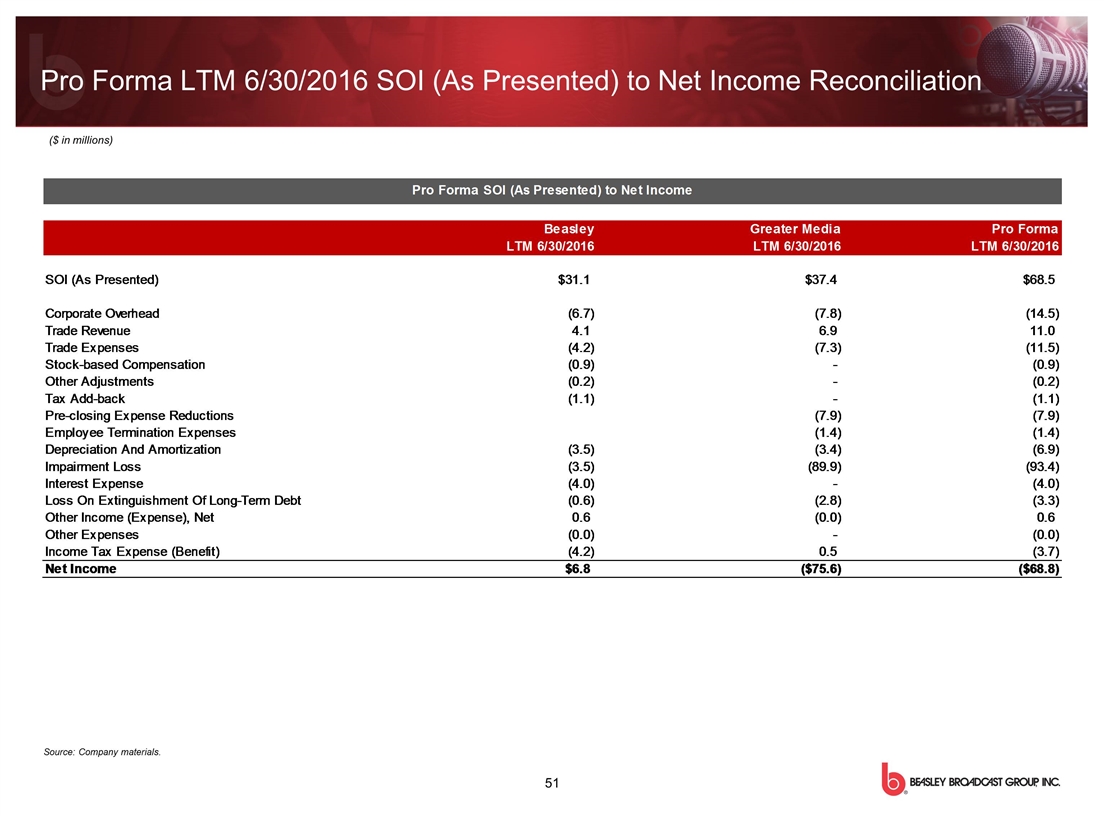
Pro Forma LTM 6/30/2016 SOI (As Presented) to Net Income Reconciliation Source: Company materials. ($ in millions)
Serious News for Serious Traders! Try StreetInsider.com Premium Free!
You May Also Be Interested In
- Gabelli Funds to Host 16th Annual Media & Entertainment Symposium Thursday, June 6, 2024
- Standard Lithium Successfully Commissions First Commercial-Scale DLE Column in North America
- Owens Corning Delivers Net Sales of $2.3 Billion; Generates Net Earnings of $299 Million and Adjusted EBIT of $438 Million
Create E-mail Alert Related Categories
SEC FilingsSign up for StreetInsider Free!
Receive full access to all new and archived articles, unlimited portfolio tracking, e-mail alerts, custom newswires and RSS feeds - and more!


 Tweet
Tweet Share
Share