

Form 8-K BANCORPSOUTH INC For: Jul 20
 Tweet
Tweet Share
Share
UNITED STATES
SECURITIES AND EXCHANGE COMMISSION
WASHINGTON, DC 20549
FORM 8-K
CURRENT REPORT
PURSUANT TO SECTION 13 OR 15(d)
OF THE SECURITIES EXCHANGE ACT OF 1934
Date of Report (Date of earliest event reported): July 21, 2015 (July 20, 2015)
BANCORPSOUTH, INC.
(Exact name of registrant as specified in its charter)
| Mississippi | 1-12991 | 64-0659571 | ||
| (State or other jurisdiction of incorporation) |
(Commission File Number) |
(IRS Employer Identification No.) |
| One Mississippi Plaza 201 South Spring Street Tupelo, Mississippi |
38804 | |
| (Address of principal executive offices) | (Zip Code) |
Registrant’s telephone number, including area code (662) 680-2000
Check the appropriate box below if the Form 8-K filing is intended to simultaneously satisfy the filing obligation of the registrant under any of the following provisions (see General Instruction A.2. below):
| ¨ | Written communications pursuant to Rule 425 under the Securities Act (17 CFR 230.425) |
| ¨ | Soliciting material pursuant to Rule 14a-12 under the Exchange Act (17 CFR 240.14a-12) |
| ¨ | Pre-commencement communications pursuant to Rule 14d-2(b) under the Exchange Act (17 CFR 240.14d-2(b)) |
| ¨ | Pre-commencement communications pursuant to Rule 13e-4(c) under the Exchange Act (17 CFR 240.13e-4(c)) |
Section 2 – Financial Information
| Item 2.02. | Results of Operations and Financial Condition. |
On July 20, 2015, BancorpSouth, Inc. (the “Company”) issued a news release announcing its financial results for the second quarter ended June 30, 2015. A copy of the news release is furnished as Exhibit 99.1 to this Current Report on Form 8-K (this “Report”) and is incorporated herein by reference in its entirety.
Section 7 – Regulation FD
| Item 7.01. | Regulation FD Disclosure. |
The Company will conduct a conference call at 10:00 a.m. (Central Time) on July 21, 2015 to discuss its financial results for the second quarter ended June 30, 2015. A copy of the presentation to be used for the conference call is furnished as Exhibit 99.2 to this Report and is incorporated herein by reference in its entirety.
Section 9 – Financial Statements and Exhibits
| Item 9.01. | Financial Statements and Exhibits. |
| (d) | Exhibits. |
| Exhibit 99.1 | News release issued on July 20, 2015 by BancorpSouth, Inc. | |
| Exhibit 99.2 | Presentation for conference call to be conducted by BancorpSouth, Inc. on July 21, 2015 | |
SIGNATURES
Pursuant to the requirements of the Securities Exchange Act of 1934, the Registrant has duly caused this report to be signed on its behalf by the undersigned hereunto duly authorized.
| BANCORPSOUTH, INC. | ||
| By: | /s/ Cathy S. Freeman | |
| Cathy S. Freeman | ||
| Senior Executive Vice President and Chief Administrative Officer | ||
Date: July 21, 2015
EXHIBIT INDEX
| Exhibit Number |
Description | |
| 99.1 | News release issued on July 20, 2015 by BancorpSouth, Inc. | |
| 99.2 | Presentation for conference call to be conducted by BancorpSouth, Inc. on July 21, 2015 | |
Exhibit 99.1
News Release

| Contact: | ||
| William L. Prater | Will Fisackerly | |
| Senior Executive Vice President and | Senior Vice President and | |
| Chief Financial Officer | Director of Corporate Finance | |
| 662/680-2536 | 662/680-2475 |
BancorpSouth Announces Second Quarter 2015 Financial Results
TUPELO, MS, July 20, 2015/PRNewswire — BancorpSouth, Inc. (NYSE: BXS) today announced financial results for the quarter and six months ended June 30, 2015.
Highlights for the second quarter of 2015 included:
| • | Net income of $39.7 million or $0.41 per diluted share. |
| • | Net operating income of $39.7 million or $0.41 per diluted share. |
| • | Generated net loan growth of $280.6 million, or 11.6 percent on an annualized basis. |
| • | Elevated recoveries of previously charged-off loans, which resulted in net recoveries of $6.7 million, contributed to a negative provision for credit losses of $5.0 million. |
| • | Mortgage lending revenue totaled $14.1 million, including a positive mortgage servicing rights (“MSR”) valuation adjustment of $4.3 million. |
| • | Continued progress toward improving cost structure reflected by decline in efficiency ratio to 69.52 percent. |
The Company reported net income of $39.7 million, or $0.41 per diluted share, for the second quarter of 2015 compared with net income of $30.9 million, or $0.32 per diluted share, for the second quarter of 2014 and net income of $32.3 million, or $0.33 per diluted share, for the first quarter of 2015. Additionally, the Company reported net income of $72.0 million, or $0.74 per diluted share, for the first six months of 2015 compared to $59.3 million, or $0.62 per diluted share, for the first six months of 2014.
The Company reported net operating income (excluding merger related and other non-operating expenses) of $39.7 million, or $0.41 per diluted share, for the second quarter of 2015 compared to $31.5 million, or $0.33 per diluted share, for the second quarter of 2014 and $32.3 million, or $0.33 per diluted share, for the first quarter of 2015.
- MORE -
BXS Announces Second Quarter Results
Page 2
July 20, 2015
“Our second quarter results reflect our Company’s most profitable quarter since 2008,” remarked Dan Rollins, BancorpSouth Chairman and Chief Executive Officer. “Progress in core fundamentals across all areas of our Company continues to drive earnings improvement. Our lenders continue to develop relationships and win new business as evidenced by net loan growth of over $280 million, or approximately 12 percent annualized, for the quarter. Our credit quality remains strong as elevated recoveries of previously charged-off loans contributed to a negative provision for credit losses of $5.0 million. Finally, we continue to challenge expenses and improve our cost structure. While we have more work to do on our expense base, we are pleased to report a decline in our quarterly efficiency ratio to 69.52 percent for the quarter.”
Net Interest Revenue
Net interest revenue was $107.3 million for the second quarter of 2015, an increase of 4.1 percent from $103.1 million for the second quarter of 2014 and an increase of 1.2 percent from $106.1 million for the first quarter of 2015. The fully taxable equivalent net interest margin was 3.54 percent for the second quarter of 2015 compared to 3.59 percent for the second quarter of 2014 and 3.56 percent for the first quarter of 2015. Yields on loans and leases declined to 4.23 percent for the second quarter of 2015 from 4.38 percent for the second quarter of 2014 and declined from 4.31 percent for the first quarter of 2015, while yields on total interest earning assets were 3.78 percent for the second quarter of 2015 compared with 3.88 percent for the second quarter of 2014 and 3.80 percent the first quarter of 2015. The average cost of deposits was 0.23 percent for the second quarter of 2015 compared to 0.28 percent for the second quarter of 2014 and 0.24 percent for the first quarter of 2015.
Asset, Deposit and Loan Activity
Total assets were $13.6 billion at June 30, 2015 compared with $13.0 billion at June 30, 2014. Loans and leases, net of unearned income, were $10.0 billion at June 30, 2015 compared with $9.3 billion at June 30, 2014.
Total deposits were $11.1 billion at June 30, 2015 compared with $10.7 billion at June 30, 2014. A decrease in time deposits of $207.3 million, or 9.7 percent, at June 30, 2015 compared to June 30, 2014 was more than offset by growth in other lower cost deposits. Noninterest bearing demand deposits increased $193.7 million, or 7.1 percent, over the same period. Additionally, savings deposits increased $108.4 million, or 8.3 percent, while interest bearing demand deposits increased $369.7 million, or 8.2 percent, over the same period. At June 30, 2015, $680.3 million of time deposits were scheduled to mature during the following two quarters at a weighted average rate of 0.65 percent.
Provision for Credit Losses and Allowance for Credit Losses
Earnings for the quarter reflect a negative provision for credit losses of $5.0 million, compared to no recorded provision for the second quarter of 2014 and a negative provision of $5.0 million for the first quarter of 2015. Total non-performing assets (“NPAs”) were $103.7 million, or 1.04 percent of net loans and leases, at June 30, 2015 compared with $128.9 million, or 1.38 percent of net loans and leases, at June 30, 2014, and $89.4 million, or 0.92 percent of net loans and leases, at March 31, 2015.
- MORE -
BXS Announces Second Quarter Results
Page 3
July 20, 2015
Net recoveries for the second quarter of 2015 were $6.7 million, compared with net charge-offs of $2.6 million for the second quarter of 2014 and $0.8 million for the first quarter of 2015. Gross charge-offs were $5.0 million for the second quarter of 2015, compared with $5.6 million for the second quarter of 2014 and $4.8 million for the first quarter of 2015. Gross recoveries of previously charged-off loans were $11.7 million for the second quarter of 2015, compared with $3.0 million for the second quarter of 2014 and $4.0 million for the first quarter of 2015. The increase in recoveries for the current quarter was driven primarily by a single recovery of a previously charged-off loan totaling $6.0 million. Annualized net recoveries were 0.27 percent of average loans and leases for the second quarter of 2015, compared with annualized net charge-offs of 0.11 percent for the second quarter of 2014 and 0.03 percent for the first quarter of 2015.
Non-performing loans (“NPLs”) were $79.4 million, or 0.79 percent of net loans and leases, at June 30, 2015, compared with $73.7 million, or 0.79 percent of net loans and leases, at June 30, 2014, and $61.5 million, or 0.63 percent of net loans and leases, at March 31, 2015. The allowance for credit losses was $138.3 million, or 1.38 percent of net loans and leases, at June 30, 2015 compared with $147.1 million, or 1.58 percent of net loans and leases, at June 30, 2014 and $136.7 million, or 1.40 percent of net loans and leases, at March 31, 2015.
NPLs at June 30, 2015 consisted primarily of $67.8 million of nonaccrual loans, compared with $54.4 million of nonaccrual loans at March 31, 2015. The increase in nonaccrual loans during the quarter was driven by three relationships that are not concentrated in any specific geography or loan type. Payments received on nonaccrual loans during the second quarter of 2015 totaled $16.1 million, compared with payments received on such loans of $18.9 million during the first quarter of 2015. NPLs at June 30, 2015 also included $1.6 million of loans 90 days or more past due and still accruing, compared with $1.6 million of such loans at March 31, 2015, and included restructured loans still accruing of $10.1 million at June 30, 2015, compared with $5.4 million of such loans at March 31, 2015. Early stage past due loans, representing loans 30-89 days past due, totaled $23.8 million at June 30, 2015 compared to $29.1 million at March 31, 2015.
Other real estate owned (“OREO”) decreased $3.6 million to $24.3 million during the second quarter of 2015 from $27.9 million at March 31, 2015. This net decrease reflected $1.7 million of OREO added through foreclosure, offset by sales of OREO of $4.3 million. Write-downs in the value of existing properties were $1.0 million for the second quarter of 2015 compared to $2.2 million for the first quarter of 2015. Sales of OREO during the second quarter of 2015 resulted in a net loss of $0.2 million compared to a net gain of $0.8 million for the first quarter of 2015. At June 30, 2015, OREO was carried at 42.6 percent of the aggregate loan balances at the time of foreclosure, compared with 39.0 percent at March 31, 2015.
Noninterest Revenue
Noninterest revenue was $74.3 million for the second quarter of 2015, compared with $69.8 million for the second quarter of 2014 and $73.3 million for the first quarter of 2015. These results included a positive MSR valuation adjustment of $4.3 million for the second quarter of 2015 compared with a negative MSR valuation adjustment of $2.1 million for the second quarter of 2014 and a negative MSR valuation adjustment of $3.0 million for the first quarter of 2015. Valuation adjustments in the MSR asset are driven primarily by fluctuations in interest rates period over period.
- MORE -
BXS Announces Second Quarter Results
Page 4
July 20, 2015
Excluding the MSR valuation adjustments, net mortgage lending revenue was $9.8 million for the second quarter of 2015, compared with $11.2 million for the second quarter of 2014 and $11.6 million for the first quarter of 2015. Mortgage origination volume for the second quarter of 2015 was $417.2 million, compared with $291.0 million for the second quarter of 2014 and $311.1 million for the first quarter of 2015.
Credit and debit card fee revenue was $9.3 million for the second quarter of 2015, compared with $8.6 million for the second quarter of 2014 and $8.5 million for the first quarter of 2015. Deposit service charge revenue was $11.5 million for the second quarter of 2015, compared with $12.4 million for the second quarter of 2014 and $11.3 million for the first quarter of 2015. Insurance commission revenue was $29.3 million for the second quarter of 2015, compared with $28.6 million for the second quarter of 2014 and $33.5 million for the first quarter of 2015. Wealth management revenue was $5.5 million for the second quarter of 2015, compared with $5.8 million for the second quarter of 2014 and $6.2 million for the first quarter of 2015.
Noninterest Expense
Noninterest expense for the second quarter of 2015 was $128.2 million, compared with $128.0 million for the second quarter of 2014 and $136.9 million for the first quarter of 2015. Salaries and employee benefits expense was $79.8 million for the second quarter of 2015 compared to $74.7 million for the second quarter of 2014 and $81.2 million for the first quarter of 2015. Both the first and second quarters of 2015 reflect an increase in pension expense compared with the same quarters from the prior year. Total annual pension expense for 2015 is expected to be approximately $7 million higher than 2014 due to annual revisions to actuarial assumptions, including updates to the Society of Actuaries pension plan mortality tables. Foreclosed property expense was $1.6 million for the second quarter of 2015 compared with $4.2 million for the second quarter of 2014 and $2.0 million for the first quarter of 2015. Deposit insurance assessments were $2.4 million for the second quarter of 2015 compared to $2.0 million for the second quarter of 2014 and $2.3 million for the first quarter of 2015. During the first quarter of 2015, the Company incurred expense of $5.5 million to increase its litigation accrual for probable losses related to certain ongoing legal matters.
Capital Management
The Company’s equity capitalization is comprised entirely of common stock. BancorpSouth’s ratio of shareholders’ equity to assets was 12.32 percent at June 30, 2015, compared with 12.24 percent at June 30, 2014 and 12.07 percent at March 31, 2015. The ratio of tangible shareholders’ equity to tangible assets was 10.26 percent at June 30, 2015, compared with 10.03 percent at June 30, 2014 and 9.99 percent at March 31, 2015.
- MORE -
BXS Announces Second Quarter Results
Page 5
July 20, 2015
Estimated regulatory capital ratios at June 30, 2015 were calculated in accordance with the Basel III capital framework. BancorpSouth is a “well capitalized” financial holding company, as defined by federal regulations, with Tier 1 risk-based capital of 12.81 percent at June 30, 2015 and total risk based capital of 14.04 percent, compared with required minimum levels of 8 percent and 10 percent, respectively, for “well capitalized” classification.
Transaction Closings and Announcements
On January 8, 2014, the Company announced the signing of a definitive merger agreement with Ouachita Bancshares Corp., parent company of Ouachita Independent Bank (collectively referred to as “OIB”), headquartered in Monroe, Louisiana, pursuant to which Ouachita Bancshares Corp. will be merged with and into the Company. OIB operates 11 full-service banking offices along the I-20 corridor and has a loan production office in Madison, Mississippi. As of June 30, 2015, OIB, on a consolidated basis, reported total assets of $654.2 million, total loans of $463.2 million and total deposits of $543.0 million. Under the terms of the definitive agreement, the Company will issue approximately 3,675,000 shares of the Company’s common stock plus $22.875 million in cash for all outstanding shares of Ouachita Bancshares Corp.’s capital stock, subject to certain conditions and potential adjustments. The merger has been unanimously approved by the Board of Directors of each company and was approved by OIB shareholders on April 8, 2014. On February 25, 2015, the Company re-filed the merger application for the merger with Ouachita Bancshares Corp. with the appropriate regulatory agencies. On June 30, 2015, the Company announced the merger agreement was extended through December 31, 2015 to allow for additional time to obtain the necessary regulatory approvals and to satisfy all closing conditions. The terms of the amended agreement provide for a minimum total deal value of $111.1 million but also allow Ouachita Bancshares Corp. to terminate the agreement if the average closing price of the Company’s common stock declines below a certain threshold prior to closing. The transaction is expected to close shortly after receiving all required regulatory approvals, although the Company can provide no assurance that the merger will close timely or at all.
On January 21, 2014, the Company announced the signing of a definitive merger agreement with Central Community Corporation, headquartered in Temple, Texas, pursuant to which Central Community Corporation will be merged with and into the Company. Central Community Corporation is the parent company of First State Bank Central Texas (“First State Bank”), which is headquartered in Austin, Texas. First State Bank operates 31 full-service banking offices in central Texas. As of June 30, 2015, Central Community Corporation, on a consolidated basis, reported total assets of $1.4 billion, total loans of $604.2 million and total deposits of $1.2 billion. Under the terms of the definitive agreement, the Company will issue approximately 7,250,000 shares of the Company’s common stock plus $28.5 million in cash for all outstanding shares of Central Community Corporation’s capital stock, subject to certain conditions and potential adjustments. The merger has been unanimously approved by the Board of Directors of each company and was approved by Central Community Corporation shareholders on April 24, 2014. On February 25, 2015, the Company re-filed the merger application for the merger with Central Community Corporation with the appropriate regulatory agencies. On June 30, 2015, the Company announced the merger agreement was extended through December 31, 2015 to allow for additional time to obtain the necessary regulatory approvals and to satisfy all closing conditions. The terms of the amended agreement provide for a minimum total deal value of
- MORE -
BXS Announces Second Quarter Results
Page 6
July 20, 2015
$202.5 million but also allow Central Community Corporation to terminate the agreement if the average closing price of the Company’s common stock declines below a certain threshold prior to closing. The transaction is expected to close shortly after receiving all required regulatory approvals, although the Company can provide no assurance that the merger will close timely or at all.
For additional information regarding the status of the merger with Ouachita Bancshares Corp. and the status of the merger with Central Community Corporation, please refer to the Current Report on Form 8-K that was previously filed with the Securities and Exchange Commission (the “SEC”) on July 24, 2014, Part II, Item 5 of the Quarterly Report on Form 10-Q that was previously filed with the SEC on August 6, 2014, the Current Report on Form 8-K that was previously filed with the SEC on September 4, 2014, the Annual Report on Form 10-K that was previously filed with the SEC on February 24, 2015, and the Current Report on Form 8-K that was previously filed with the SEC on July 1, 2015.
Summary
Rollins concluded, “I am pleased to see the hard work and commitment of our teammates continue to drive better operating performance. Each quarter, we are seeing different teams step up and produce significant levels of growth. Our lending teams as well as our mortgage, insurance, and wealth management teams have contributed to meaningful revenue growth for our Company over the past several quarters. We’ve been able produce this revenue growth while continuing to challenge expenses and improve our operating efficiency. We are confident this simple approach will allow us to continue to improve performance going forward.”
Conference Call
BancorpSouth will conduct a conference call to discuss its second quarter 2015 results on July 21, 2015, at 10:00 a.m. (Central Time). Investors may listen via the Internet by accessing BancorpSouth’s website at http://www.bancorpsouth.com. A replay of the conference call will be available at BancorpSouth’s website for at least two weeks following the call.
About BancorpSouth, Inc.
BancorpSouth, Inc. is a financial holding company headquartered in Tupelo, Mississippi, with $13.6 billion in assets. BancorpSouth Bank, a wholly-owned subsidiary of BancorpSouth, Inc., operates 284 commercial banking, mortgage, and insurance locations in Alabama, Arkansas, Florida, Louisiana, Mississippi, Missouri, Tennessee and Texas, including an insurance location in Illinois.
Forward-Looking Statements
Certain statements contained in this news release may not be based upon historical facts and are “forward-looking statements” within the meaning of Section 27A of the Securities Act of 1933, as amended, and Section 21E of the Securities Exchange Act of 1934, as amended. These forward-looking statements may be identified by their reference to a future period or periods or by the use of forward-looking terminology such as “anticipate,” “believe,” “could,” “estimate,” “expect,” “foresee,” “hope,” “intend,” “may,” “might,” “plan,” “will,” or “would” or future or conditional verb tenses and variations or negatives of such terms. These forward-looking statements include, without limitation, those relating to the terms, timing and closings of the proposed mergers with Ouachita Bancshares Corp. and Central Community Corporation, the Company’s ability to operate its regulatory compliance programs consistent with federal, state and local laws, including its BSA/AML compliance program,
- MORE -
BXS Announces Second Quarter Results
Page 7
July 20, 2015
the findings and results of the joint investigation by the Consumer Financial Protection Bureau (the “CFPB”) and the United States Department of Justice (“DOJ”) of the Company’s fair lending practices, the acceptance by customers of Ouachita Bancshares Corp. and Central Community Corporation of the Company’s products and services if the proposed mergers close, the outcome of any instituted, pending or threatened material litigation, amortization expense for intangible assets, goodwill impairments, loan impairment, utilization of appraisals and inspections for real estate loans, maturity, renewal or extension of construction, acquisition and development loans, net interest revenue, fair value determinations, the amount of the Company’s non-performing loans and leases, additions to OREO, credit quality, credit losses, liquidity, off-balance sheet commitments and arrangements, valuation of mortgage servicing rights, allowance and provision for credit losses, continued weakness in the economic environment, early identification and resolution of credit issues, utilization of non-GAAP financial measures, the ability of the Company to collect all amounts due according to the contractual terms of loan agreements, the Company’s reserve for losses from representation and warranty obligations, the Company’s foreclosure process related to mortgage loans, the resolution of non-performing loans that are collaterally dependent, real estate values, fully-indexed interest rates, interest rate risk, interest rate sensitivity, calculation of economic value of equity, impaired loan charge-offs, troubled debt restructurings, diversification of the Company’s revenue stream, liquidity needs and strategies, sources of funding, net interest margin, declaration and payment of dividends, cost saving initiatives, improvement in the Company’s efficiencies, operating expense trends, future acquisitions and consideration to be used therefor, the impact of litigation regarding debit card fees and the impact of certain claims and ongoing, pending or threatened litigation, administrative and investigatory matters.
The Company cautions readers not to place undue reliance on the forward-looking statements contained in this news release, in that actual results could differ materially from those indicated in such forward-looking statements as a result of a variety of factors. These factors may include, but are not limited to, the Company’s ability to operate its regulatory compliance programs consistent with federal, state and local laws, including its BSA/AML compliance program, the findings and results of the CFPB and the DOJ in their review of the Company’s fair lending practices, the ability of the Company, Ouachita Bancshares Corp. and Central Community Corporation to obtain regulatory approval of and close the proposed mergers, the potential impact upon the Company of the delay in the closings of these proposed mergers, the impact of any ongoing, pending or threatened litigation, administrative and investigatory matters involving the Company, conditions in the financial markets and economic conditions generally, the adequacy of the Company’s provision and allowance for credit losses to cover actual credit losses, the credit risk associated with real estate construction, acquisition and development loans, losses resulting from the significant amount of the Company’s OREO, limitations on the Company’s ability to declare and pay dividends, the availability of capital on favorable terms if and when needed, liquidity risk, governmental regulation, including the Dodd-Frank Act, and supervision of the Company’s operations, the short-term and long-term impact of changes to banking capital standards on the Company’s regulatory capital and liquidity, the impact of regulations on service charges on the Company’s core deposit accounts, the susceptibility of the Company’s business to local economic and environmental conditions, the soundness of other financial institutions, changes in interest rates, the impact of monetary policies and economic factors on the Company’s ability to attract deposits or make loans, volatility in capital and credit markets, reputational risk, the impact of the loss of any key Company personnel, the impact of hurricanes or other adverse weather events, any requirement that the Company write down goodwill or other intangible assets, diversification in the types of financial services the Company offers, the Company’s ability to adapt its products and services to evolving industry standards and consumer preferences, competition with other financial services companies, risks in connection with completed or potential acquisitions, the Company’s growth strategy, interruptions or breaches in the Company’s information system security, the failure of certain third-party vendors to perform, unfavorable ratings by rating agencies, dilution caused by the Company’s issuance of any additional shares of its common stock to raise capital or acquire other banks, bank holding companies, financial holding companies and insurance agencies, other factors generally understood to affect the assets, business, cash flows, financial condition, liquidity, prospects and/or results of operations of financial services companies and other factors detailed from time to time in the Company’s press and news releases, reports and other filings with the SEC. Forward-looking statements speak only as of the date that they were made, and, except as required by law, the Company does not undertake any obligation to update or revise forward-looking statements to reflect events or circumstances that occur after the date of this news release.
- MORE -
BXS Announces Second Quarter Results
Page 8
July 20, 2015
BancorpSouth, Inc.
Selected Financial Information
(Dollars in thousands, except per share data)
(Unaudited)
| Quarter Ended | Quarter Ended | Quarter Ended | Quarter Ended | Quarter Ended | ||||||||||||||||
| 6/30/2015 | 3/31/2015 | 12/31/2014 | 9/30/2014 | 6/30/2014 | ||||||||||||||||
| Earnings Summary: |
||||||||||||||||||||
| Interest revenue |
$ | 114,630 | $ | 113,497 | $ | 114,237 | $ | 113,922 | $ | 111,499 | ||||||||||
| Interest expense |
7,321 | 7,424 | 7,792 | 8,309 | 8,418 | |||||||||||||||
|
|
|
|
|
|
|
|
|
|
|
|||||||||||
| Net interest revenue |
107,309 | 106,073 | 106,445 | 105,613 | 103,081 | |||||||||||||||
| Provision for credit losses |
(5,000 | ) | (5,000 | ) | — | — | — | |||||||||||||
|
|
|
|
|
|
|
|
|
|
|
|||||||||||
| Net interest revenue, after provision for credit losses |
112,309 | 111,073 | 106,445 | 105,613 | 103,081 | |||||||||||||||
| Noninterest revenue |
74,314 | 73,315 | 63,513 | 69,278 | 69,838 | |||||||||||||||
| Noninterest expense |
128,177 | 136,933 | 130,046 | 133,699 | 127,954 | |||||||||||||||
|
|
|
|
|
|
|
|
|
|
|
|||||||||||
| Income before income taxes |
58,446 | 47,455 | 39,912 | 41,192 | 44,965 | |||||||||||||||
| Income tax expense |
18,733 | 15,189 | 11,252 | 12,414 | 14,097 | |||||||||||||||
|
|
|
|
|
|
|
|
|
|
|
|||||||||||
| Net income |
$ | 39,713 | $ | 32,266 | $ | 28,660 | $ | 28,778 | $ | 30,868 | ||||||||||
|
|
|
|
|
|
|
|
|
|
|
|||||||||||
| Balance Sheet - Period End Balances |
||||||||||||||||||||
| Total assets |
$ | 13,634,931 | $ | 13,630,322 | $ | 13,326,369 | $ | 13,071,557 | $ | 12,985,887 | ||||||||||
| Total earning assets |
12,492,532 | 12,468,322 | 12,163,897 | 11,929,416 | 11,794,445 | |||||||||||||||
| Total securities |
2,251,153 | 2,194,373 | 2,156,927 | 2,211,462 | 2,332,192 | |||||||||||||||
| Loans and leases, net of unearned income |
10,007,571 | 9,726,970 | 9,712,936 | 9,510,542 | 9,311,661 | |||||||||||||||
| Allowance for credit losses |
138,312 | 136,660 | 142,443 | 143,950 | 147,132 | |||||||||||||||
| Total deposits |
11,134,961 | 11,252,654 | 10,972,339 | 10,701,537 | 10,670,414 | |||||||||||||||
| Long-term debt |
73,962 | 76,055 | 78,148 | 81,742 | 83,835 | |||||||||||||||
| Total shareholders’ equity |
1,680,196 | 1,645,208 | 1,606,059 | 1,610,543 | 1,588,850 | |||||||||||||||
| Balance Sheet - Average Balances |
||||||||||||||||||||
| Total assets |
$ | 13,516,546 | $ | 13,457,668 | $ | 13,131,130 | $ | 12,987,103 | $ | 12,933,879 | ||||||||||
| Total earning assets |
12,443,960 | 12,398,058 | 12,038,265 | 11,892,493 | 11,825,994 | |||||||||||||||
| Total securities |
2,211,931 | 2,190,989 | 2,180,000 | 2,272,114 | 2,394,045 | |||||||||||||||
| Loans and leases, net of unearned income |
9,868,318 | 9,670,987 | 9,579,059 | 9,393,709 | 9,232,743 | |||||||||||||||
| Total deposits |
11,148,246 | 11,126,210 | 10,802,194 | 10,662,841 | 10,650,077 | |||||||||||||||
| Long-term debt |
73,962 | 76,078 | 79,387 | 81,742 | 83,967 | |||||||||||||||
| Total shareholders’ equity |
1,659,991 | 1,624,496 | 1,613,239 | 1,600,721 | 1,574,588 | |||||||||||||||
| Nonperforming Assets: |
||||||||||||||||||||
| Non-accrual loans and leases |
$ | 67,766 | $ | 54,418 | $ | 58,052 | $ | 54,612 | $ | 64,533 | ||||||||||
| Loans and leases 90+ days past due, still accruing |
1,568 | 1,615 | 2,763 | 1,925 | 2,406 | |||||||||||||||
| Restructured loans and leases, still accruing |
10,109 | 5,433 | 10,920 | 12,398 | 6,712 | |||||||||||||||
|
|
|
|
|
|
|
|
|
|
|
|||||||||||
| Non-performing loans (NPLs) |
79,443 | 61,466 | 71,735 | 68,935 | 73,651 | |||||||||||||||
|
|
|
|
|
|
|
|
|
|
|
|||||||||||
| Other real estate owned |
24,299 | 27,889 | 33,984 | 42,691 | 55,253 | |||||||||||||||
|
|
|
|
|
|
|
|
|
|
|
|||||||||||
| Non-performing assets (NPAs) |
$ | 103,742 | $ | 89,355 | $ | 105,719 | $ | 111,626 | $ | 128,904 | ||||||||||
|
|
|
|
|
|
|
|
|
|
|
|||||||||||
| Financial Ratios and Other Data: |
||||||||||||||||||||
| Return on average assets |
1.18 | % | 0.97 | % | 0.87 | % | 0.88 | % | 0.96 | % | ||||||||||
| Return on average shareholders’ equity |
9.60 | % | 8.06 | % | 7.05 | % | 7.13 | % | 7.86 | % | ||||||||||
| Return on tangible equity |
11.66 | % | 9.84 | % | 8.81 | % | 8.83 | % | 9.74 | % | ||||||||||
| Pre-tax pre-provision return on average assets |
1.59 | % | 1.29 | % | 1.21 | % | 1.26 | % | 1.39 | % | ||||||||||
| Noninterest income to average assets |
2.21 | % | 2.21 | % | 1.92 | % | 2.12 | % | 2.17 | % | ||||||||||
| Noninterest expense to average assets |
3.80 | % | 4.13 | % | 3.93 | % | 4.08 | % | 3.97 | % | ||||||||||
| Net interest margin-fully taxable equivalent |
3.54 | % | 3.56 | % | 3.60 | % | 3.62 | % | 3.59 | % | ||||||||||
| Net interest rate spread |
3.44 | % | 3.46 | % | 3.49 | % | 3.50 | % | 3.48 | % | ||||||||||
| Efficiency ratio (tax equivalent) |
69.52 | % | 75.17 | % | 75.25 | % | 75.19 | % | 72.76 | % | ||||||||||
| Loan/deposit ratio |
89.88 | % | 86.44 | % | 88.52 | % | 88.87 | % | 87.27 | % | ||||||||||
| Price to earnings mult (avg) |
18.80 | 18.43 | 18.45 | 16.64 | 21.00 | |||||||||||||||
| Market value to book value |
148.34 | % | 136.26 | % | 134.91 | % | 120.13 | % | 148.53 | % | ||||||||||
| Market value to book value (avg) |
142.10 | % | 127.91 | % | 130.16 | % | 129.54 | % | 143.72 | % | ||||||||||
| Market value to tangible book value |
182.42 | % | 168.52 | % | 167.95 | % | 149.58 | % | 185.73 | % | ||||||||||
| Market value to tangible book value (avg) |
174.75 | % | 158.20 | % | 162.04 | % | 161.30 | % | 179.75 | % | ||||||||||
| Headcount FTE |
3,935 | 3,924 | 3,948 | 3,938 | 3,981 | |||||||||||||||
- MORE -
BXS Announces Second Quarter Results
Page 9
July 20, 2015
BancorpSouth, Inc.
Selected Financial Information
(Dollars in thousands, except per share data)
(Unaudited)
| Quarter Ended | Quarter Ended | Quarter Ended | Quarter Ended | Quarter Ended | ||||||||||||||||
| 6/30/2015 | 3/31/2015 | 12/31/2014 | 9/30/2014 | 6/30/2014 | ||||||||||||||||
| Credit Quality Ratios: |
||||||||||||||||||||
| Net (recoveries) charge-offs to average loans and leases (annualized) |
(0.27 | %) | 0.03 | % | 0.06 | % | 0.13 | % | 0.11 | % | ||||||||||
| Provision for credit losses to average loans and leases (annualized) |
(0.20 | %) | (0.21 | %) | 0.00 | % | 0.00 | % | 0.00 | % | ||||||||||
| Allowance for credit losses to net loans and leases |
1.38 | % | 1.40 | % | 1.47 | % | 1.51 | % | 1.58 | % | ||||||||||
| Allowance for credit losses to non-performing loans and leases |
174.10 | % | 222.33 | % | 198.57 | % | 208.82 | % | 199.77 | % | ||||||||||
| Allowance for credit losses to non-performing assets |
133.32 | % | 152.94 | % | 134.74 | % | 128.96 | % | 114.14 | % | ||||||||||
| Non-performing loans and leases to net loans and leases |
0.79 | % | 0.63 | % | 0.74 | % | 0.72 | % | 0.79 | % | ||||||||||
| Non-performing assets to net loans and leases |
1.04 | % | 0.92 | % | 1.09 | % | 1.17 | % | 1.38 | % | ||||||||||
| Equity Ratios: |
||||||||||||||||||||
| Total shareholders’ equity to total assets |
12.32 | % | 12.07 | % | 12.05 | % | 12.32 | % | 12.24 | % | ||||||||||
| Tangible shareholders’ equity to tangible assets |
10.26 | % | 9.99 | % | 9.92 | % | 10.14 | % | 10.03 | % | ||||||||||
| Capital Adequacy: |
||||||||||||||||||||
| Common Equity Tier 1 capital |
12.60 | % | 12.60 | % | N/A | N/A | N/A | |||||||||||||
| Tier 1 capital |
12.81 | % | 12.81 | % | 13.26 | % | 13.18 | % | 13.09 | % | ||||||||||
| Total capital |
14.04 | % | 14.07 | % | 14.52 | % | 14.43 | % | 14.35 | % | ||||||||||
| Tier 1 leverage capital |
10.96 | % | 10.71 | % | 10.55 | % | 10.47 | % | 10.33 | % | ||||||||||
| Estimated for current quarter |
||||||||||||||||||||
| Common Share Data: |
||||||||||||||||||||
| Basic earnings per share |
$ | 0.41 | $ | 0.33 | $ | 0.30 | $ | 0.30 | $ | 0.32 | ||||||||||
| Diluted earnings per share |
0.41 | 0.33 | 0.30 | 0.30 | 0.32 | |||||||||||||||
| Cash dividends per share |
0.08 | 0.08 | 0.08 | 0.08 | 0.05 | |||||||||||||||
| Book value per share |
17.37 | 17.04 | 16.69 | 16.77 | 16.54 | |||||||||||||||
| Tangible book value per share |
14.12 | 13.78 | 13.40 | 13.46 | 13.23 | |||||||||||||||
| Market value per share (last) |
25.76 | 23.22 | 22.51 | 20.14 | 24.57 | |||||||||||||||
| Market value per share (high) |
26.68 | 23.68 | 23.28 | 25.43 | 25.55 | |||||||||||||||
| Market value per share (low) |
22.83 | 19.64 | 19.22 | 20.11 | 22.16 | |||||||||||||||
| Market value per share (avg) |
24.68 | 21.80 | 21.72 | 21.72 | 23.78 | |||||||||||||||
| Dividend payout ratio |
18.25 | % | 22.40 | % | 25.17 | % | 25.03 | % | 15.56 | % | ||||||||||
| Total shares outstanding |
96,755,530 | 96,544,502 | 96,254,903 | 96,065,021 | 96,046,057 | |||||||||||||||
| Average shares outstanding - basic |
96,625,794 | 96,359,885 | 96,173,000 | 96,052,260 | 96,034,475 | |||||||||||||||
| Average shares outstanding - diluted |
96,957,441 | 96,653,401 | 96,506,827 | 96,373,950 | 96,373,121 | |||||||||||||||
| Yield/Rate: |
||||||||||||||||||||
| (Taxable equivalent basis) |
||||||||||||||||||||
| Loans, loans held for sale, and leases net of unearned income |
4.23 | % | 4.31 | % | 4.30 | % | 4.36 | % | 4.38 | % | ||||||||||
| Available-for-sale securities: |
||||||||||||||||||||
| Taxable |
1.40 | % | 1.54 | % | 1.43 | % | 1.42 | % | 1.45 | % | ||||||||||
| Tax-exempt |
5.44 | % | 5.40 | % | 5.30 | % | 5.37 | % | 5.44 | % | ||||||||||
| Short-term investments |
0.24 | % | 0.22 | % | 0.24 | % | 0.22 | % | 0.24 | % | ||||||||||
| Total interest earning assets and revenue |
3.78 | % | 3.80 | % | 3.85 | % | 3.89 | % | 3.88 | % | ||||||||||
| Deposits |
0.23 | % | 0.24 | % | 0.25 | % | 0.28 | % | 0.28 | % | ||||||||||
| Demand - interest bearing |
0.19 | % | 0.18 | % | 0.18 | % | 0.17 | % | 0.17 | % | ||||||||||
| Savings |
0.12 | % | 0.12 | % | 0.12 | % | 0.12 | % | 0.12 | % | ||||||||||
| Other time |
0.79 | % | 0.82 | % | 0.87 | % | 0.96 | % | 0.97 | % | ||||||||||
| Short-term borrowings |
0.11 | % | 0.12 | % | 0.11 | % | 0.10 | % | 0.09 | % | ||||||||||
| Total int bearing dep & s/t borrowings |
0.31 | % | 0.31 | % | 0.33 | % | 0.36 | % | 0.37 | % | ||||||||||
| Junior subordinated debt |
2.86 | % | 2.84 | % | 2.82 | % | 2.81 | % | 2.81 | % | ||||||||||
| Long-term debt |
2.90 | % | 2.88 | % | 2.86 | % | 2.85 | % | 2.84 | % | ||||||||||
| Total interest bearing liabilities and expense |
0.34 | % | 0.34 | % | 0.36 | % | 0.39 | % | 0.40 | % | ||||||||||
| Interest bearing liabilities to interest earning assets |
70.36 | % | 71.13 | % | 70.57 | % | 71.07 | % | 71.98 | % | ||||||||||
| Net interest tax equivalent adjustment |
$ | 2,628 | $ | 2,653 | $ | 2,736 | $ | 2,810 | $ | 2,860 | ||||||||||
- MORE -
BXS Announces Second Quarter Results
Page 10
July 20, 2015
BancorpSouth, Inc.
Consolidated Balance Sheets
(Unaudited)
| Jun-15 | Mar-15 | Dec-14 | Sep-14 | Jun-14 | ||||||||||||||||
| (Dollars in thousands) | ||||||||||||||||||||
| Assets |
||||||||||||||||||||
| Cash and due from banks |
$ | 183,541 | $ | 199,337 | $ | 204,231 | $ | 169,226 | $ | 201,196 | ||||||||||
| Interest bearing deposits with other banks |
34,438 | 360,469 | 153,019 | 70,408 | 44,949 | |||||||||||||||
| Available-for-sale securities, at fair value |
2,251,153 | 2,194,373 | 2,156,927 | 2,211,462 | 2,332,192 | |||||||||||||||
| Loans and leases |
10,041,455 | 9,761,555 | 9,749,540 | 9,546,250 | 9,347,429 | |||||||||||||||
| Less: Unearned income |
33,884 | 34,585 | 36,604 | 35,708 | 35,768 | |||||||||||||||
| Allowance for credit losses |
138,312 | 136,660 | 142,443 | 143,950 | 147,132 | |||||||||||||||
|
|
|
|
|
|
|
|
|
|
|
|||||||||||
| Net loans and leases |
9,869,259 | 9,590,310 | 9,570,493 | 9,366,592 | 9,164,529 | |||||||||||||||
| Loans held for sale |
199,370 | 186,510 | 141,015 | 137,005 | 105,643 | |||||||||||||||
| Premises and equipment, net |
303,837 | 305,335 | 304,943 | 307,497 | 310,515 | |||||||||||||||
| Accrued interest receivable |
41,065 | 42,933 | 41,985 | 42,311 | 40,697 | |||||||||||||||
| Goodwill |
291,498 | 291,498 | 291,498 | 291,498 | 291,498 | |||||||||||||||
| Other identifiable intangibles |
22,415 | 23,476 | 24,508 | 25,619 | 26,745 | |||||||||||||||
| Bank owned life insurance |
247,983 | 246,148 | 247,076 | 243,827 | 241,962 | |||||||||||||||
| Other real estate owned |
24,299 | 27,889 | 33,984 | 42,691 | 55,253 | |||||||||||||||
| Other assets |
166,073 | 162,044 | 156,690 | 163,421 | 170,708 | |||||||||||||||
|
|
|
|
|
|
|
|
|
|
|
|||||||||||
| Total Assets |
$ | 13,634,931 | $ | 13,630,322 | $ | 13,326,369 | $ | 13,071,557 | $ | 12,985,887 | ||||||||||
|
|
|
|
|
|
|
|
|
|
|
|||||||||||
| Liabilities |
||||||||||||||||||||
| Deposits: |
||||||||||||||||||||
| Demand: Noninterest bearing |
$ | 2,911,972 | $ | 2,914,949 | $ | 2,778,686 | $ | 2,811,156 | $ | 2,718,242 | ||||||||||
| Interest bearing |
4,881,469 | 4,979,710 | 4,868,054 | 4,498,275 | 4,511,760 | |||||||||||||||
| Savings |
1,407,616 | 1,395,857 | 1,331,963 | 1,311,874 | 1,299,203 | |||||||||||||||
| Other time |
1,933,904 | 1,962,138 | 1,993,636 | 2,080,232 | 2,141,209 | |||||||||||||||
|
|
|
|
|
|
|
|
|
|
|
|||||||||||
| Total deposits |
11,134,961 | 11,252,654 | 10,972,339 | 10,701,537 | 10,670,414 | |||||||||||||||
| Federal funds purchased and securities sold under agreement to repurchase |
375,980 | 384,829 | 388,166 | 431,428 | 394,446 | |||||||||||||||
| Short-term Federal Home Loan Bank borrowings and other short-term borrowing |
92,500 | 1,500 | 3,500 | 2,000 | 2,000 | |||||||||||||||
| Accrued interest payable |
3,494 | 3,371 | 3,400 | 3,894 | 3,926 | |||||||||||||||
| Junior subordinated debt securities |
23,198 | 23,198 | 23,198 | 23,198 | 23,198 | |||||||||||||||
| Long-term debt |
73,962 | 76,055 | 78,148 | 81,742 | 83,835 | |||||||||||||||
| Other liabilities |
250,640 | 243,507 | 251,559 | 217,215 | 219,218 | |||||||||||||||
|
|
|
|
|
|
|
|
|
|
|
|||||||||||
| Total Liabilities |
11,954,735 | 11,985,114 | 11,720,310 | 11,461,014 | 11,397,037 | |||||||||||||||
| Shareholders’ Equity |
||||||||||||||||||||
| Common stock |
241,889 | 241,361 | 240,637 | 240,165 | 240,118 | |||||||||||||||
| Capital surplus |
337,272 | 331,016 | 324,271 | 322,488 | 321,952 | |||||||||||||||
| Accumulated other comprehensive loss |
(41,288 | ) | (37,033 | ) | (43,686 | ) | (15,513 | ) | (15,040 | ) | ||||||||||
| Retained earnings |
1,142,323 | 1,109,864 | 1,084,837 | 1,063,403 | 1,041,820 | |||||||||||||||
|
|
|
|
|
|
|
|
|
|
|
|||||||||||
| Total Shareholders’ Equity |
1,680,196 | 1,645,208 | 1,606,059 | 1,610,543 | 1,588,850 | |||||||||||||||
|
|
|
|
|
|
|
|
|
|
|
|||||||||||
| Total Liabilities & Shareholders’ Equity |
$ | 13,634,931 | $ | 13,630,322 | $ | 13,326,369 | $ | 13,071,557 | $ | 12,985,887 | ||||||||||
|
|
|
|
|
|
|
|
|
|
|
|||||||||||
- MORE -
BXS Announces Second Quarter Results
Page 11
July 20, 2015
BancorpSouth, Inc.
Consolidated Average Balance Sheets
(Unaudited)
| Jun-15 | Mar-15 | Dec-14 | Sep-14 | Jun-14 | ||||||||||||||||
| (Dollars in thousands) | ||||||||||||||||||||
| Assets |
||||||||||||||||||||
| Cash and due from banks |
$ | 152,792 | $ | 132,734 | $ | 166,941 | $ | 155,876 | $ | 157,813 | ||||||||||
| Interest bearing deposits with other banks |
212,634 | 426,792 | 165,713 | 120,707 | 145,530 | |||||||||||||||
| Available-for-sale securities, at fair value |
2,211,931 | 2,190,989 | 2,180,000 | 2,272,114 | 2,394,045 | |||||||||||||||
| Loans and leases |
9,903,034 | 9,706,941 | 9,615,125 | 9,430,043 | 9,269,469 | |||||||||||||||
| Less: Unearned income |
34,716 | 35,954 | 36,066 | 36,334 | 36,726 | |||||||||||||||
| Allowance for credit losses |
140,483 | 141,299 | 143,842 | 146,592 | 149,676 | |||||||||||||||
|
|
|
|
|
|
|
|
|
|
|
|||||||||||
| Net loans and leases |
9,727,835 | 9,529,688 | 9,435,217 | 9,247,117 | 9,083,067 | |||||||||||||||
| Loans held for sale |
151,077 | 109,291 | 113,493 | 105,964 | 53,676 | |||||||||||||||
| Premises and equipment, net |
305,335 | 305,277 | 306,630 | 309,373 | 313,012 | |||||||||||||||
| Accrued interest receivable |
38,268 | 39,279 | 39,034 | 38,758 | 38,291 | |||||||||||||||
| Goodwill |
291,498 | 291,498 | 291,498 | 291,498 | 293,082 | |||||||||||||||
| Other identifiable intangibles |
22,780 | 23,834 | 24,910 | 26,031 | 25,271 | |||||||||||||||
| Bank owned life insurance |
246,872 | 246,538 | 245,584 | 242,718 | 240,736 | |||||||||||||||
| Other real estate owned |
27,190 | 32,062 | 39,209 | 49,123 | 60,822 | |||||||||||||||
| Other assets |
128,334 | 129,686 | 122,901 | 127,824 | 128,534 | |||||||||||||||
|
|
|
|
|
|
|
|
|
|
|
|||||||||||
| Total Assets |
$ | 13,516,546 | $ | 13,457,668 | $ | 13,131,130 | $ | 12,987,103 | $ | 12,933,879 | ||||||||||
|
|
|
|
|
|
|
|
|
|
|
|||||||||||
| Liabilities |
||||||||||||||||||||
| Deposits: |
||||||||||||||||||||
| Demand: Noninterest bearing |
$ | 2,895,451 | $ | 2,807,816 | $ | 2,837,919 | $ | 2,766,626 | $ | 2,683,939 | ||||||||||
| Interest bearing |
4,899,467 | 4,985,577 | 4,617,998 | 4,480,008 | 4,492,495 | |||||||||||||||
| Savings |
1,404,336 | 1,358,565 | 1,321,000 | 1,308,184 | 1,298,829 | |||||||||||||||
| Other time |
1,948,992 | 1,974,252 | 2,025,277 | 2,108,023 | 2,174,814 | |||||||||||||||
|
|
|
|
|
|
|
|
|
|
|
|||||||||||
| Total deposits |
11,148,246 | 11,126,210 | 10,802,194 | 10,662,841 | 10,650,077 | |||||||||||||||
| Federal funds purchased and securities sold under agreement to repurchase |
399,447 | 398,237 | 426,842 | 444,017 | 435,505 | |||||||||||||||
| Short-term Federal Home Loan Bank borrowings and other short-term borrowing |
6,555 | 3,056 | 2,261 | 6,489 | 3,621 | |||||||||||||||
| Accrued interest payable |
3,457 | 3,338 | 3,630 | 3,940 | 3,926 | |||||||||||||||
| Junior subordinated debt securities |
23,198 | 23,198 | 23,198 | 23,198 | 23,198 | |||||||||||||||
| Long-term debt |
73,962 | 76,078 | 79,387 | 81,742 | 83,967 | |||||||||||||||
| Other liabilities |
201,690 | 203,055 | 180,379 | 164,155 | 158,997 | |||||||||||||||
|
|
|
|
|
|
|
|
|
|
|
|||||||||||
| Total Liabilities |
11,856,555 | 11,833,172 | 11,517,891 | 11,386,382 | 11,359,291 | |||||||||||||||
| Shareholders’ Equity |
||||||||||||||||||||
| Common stock |
241,540 | 240,992 | 240,436 | 240,123 | 240,071 | |||||||||||||||
| Capital surplus |
332,993 | 326,476 | 323,372 | 322,219 | 321,628 | |||||||||||||||
| Accumulated other comprehensive loss |
(38,534 | ) | (39,529 | ) | (22,747 | ) | (14,827 | ) | (16,663 | ) | ||||||||||
| Retained earnings |
1,123,992 | 1,096,557 | 1,072,178 | 1,053,206 | 1,029,552 | |||||||||||||||
|
|
|
|
|
|
|
|
|
|
|
|||||||||||
| Total Shareholders’ Equity |
1,659,991 | 1,624,496 | 1,613,239 | 1,600,721 | 1,574,588 | |||||||||||||||
|
|
|
|
|
|
|
|
|
|
|
|||||||||||
| Total Liabilities & Shareholders’ Equity |
$ | 13,516,546 | $ | 13,457,668 | $ | 13,131,130 | $ | 12,987,103 | $ | 12,933,879 | ||||||||||
|
|
|
|
|
|
|
|
|
|
|
|||||||||||
- MORE -
BXS Announces Second Quarter Results
Page 12
July 20, 2015
BancorpSouth, Inc.
Consolidated Condensed Statements of Income
(Dollars in thousands, except per share data)
(Unaudited)
| Quarter Ended | YTD | |||||||||||||||||||||||||||
| Jun-15 | Mar-15 | Dec-14 | Sep-14 | Jun-14 | Jun-15 | Jun-14 | ||||||||||||||||||||||
| INTEREST REVENUE: |
||||||||||||||||||||||||||||
| Loans and leases |
$ | 103,428 | $ | 102,135 | $ | 103,172 | $ | 102,681 | $ | 99,962 | $ | 205,563 | $ | 198,706 | ||||||||||||||
| Deposits with other banks |
126 | 236 | 101 | 68 | 87 | 362 | 363 | |||||||||||||||||||||
| Available-for-sale securities: |
||||||||||||||||||||||||||||
| Taxable |
6,424 | 6,844 | 6,429 | 6,646 | 7,133 | 13,268 | 14,680 | |||||||||||||||||||||
| Tax-exempt |
3,335 | 3,377 | 3,471 | 3,607 | 3,669 | 6,712 | 7,384 | |||||||||||||||||||||
| Loans held for sale |
1,317 | 905 | 1,064 | 920 | 648 | 2,222 | 965 | |||||||||||||||||||||
|
|
|
|
|
|
|
|
|
|
|
|
|
|
|
|||||||||||||||
| Total interest revenue |
114,630 | 113,497 | 114,237 | 113,922 | 111,499 | 228,127 | 222,098 | |||||||||||||||||||||
|
|
|
|
|
|
|
|
|
|
|
|
|
|
|
|||||||||||||||
| INTEREST EXPENSE: |
||||||||||||||||||||||||||||
| Interest bearing demand |
2,262 | 2,183 | 2,070 | 1,956 | 1,905 | 4,445 | 3,825 | |||||||||||||||||||||
| Savings |
426 | 412 | 411 | 410 | 402 | 838 | 793 | |||||||||||||||||||||
| Other time |
3,827 | 4,008 | 4,453 | 5,083 | 5,249 | 7,835 | 11,139 | |||||||||||||||||||||
| Federal funds purchased and securities sold under agreement to repurchase |
85 | 82 | 89 | 84 | 80 | 167 | 158 | |||||||||||||||||||||
| Long-term debt |
556 | 577 | 603 | 612 | 619 | 1,133 | 1,248 | |||||||||||||||||||||
| Junior subordinated debt |
165 | 163 | 165 | 164 | 162 | 328 | 330 | |||||||||||||||||||||
| Other |
— | (1 | ) | 1 | — | 1 | (1 | ) | 1 | |||||||||||||||||||
|
|
|
|
|
|
|
|
|
|
|
|
|
|
|
|||||||||||||||
| Total interest expense |
7,321 | 7,424 | 7,792 | 8,309 | 8,418 | 14,745 | 17,494 | |||||||||||||||||||||
|
|
|
|
|
|
|
|
|
|
|
|
|
|
|
|||||||||||||||
| Net interest revenue |
107,309 | 106,073 | 106,445 | 105,613 | 103,081 | 213,382 | 204,604 | |||||||||||||||||||||
| Provision for credit losses |
(5,000 | ) | (5,000 | ) | — | — | — | (10,000 | ) | — | ||||||||||||||||||
|
|
|
|
|
|
|
|
|
|
|
|
|
|
|
|||||||||||||||
| Net interest revenue, after provision for credit losses |
112,309 | 111,073 | 106,445 | 105,613 | 103,081 | 223,382 | 204,604 | |||||||||||||||||||||
|
|
|
|
|
|
|
|
|
|
|
|
|
|
|
|||||||||||||||
| NONINTEREST REVENUE: |
||||||||||||||||||||||||||||
| Mortgage lending |
14,102 | 8,567 | 3,250 | 6,938 | 9,089 | 22,669 | 12,483 | |||||||||||||||||||||
| Credit card, debit card and merchant fees |
9,298 | 8,539 | 9,921 | 8,972 | 8,567 | 17,837 | 16,410 | |||||||||||||||||||||
| Deposit service charges |
11,527 | 11,252 | 12,538 | 13,111 | 12,437 | 22,779 | 24,973 | |||||||||||||||||||||
| Security gains (losses), net |
41 | 14 | 18 | 18 | 5 | 55 | 1 | |||||||||||||||||||||
| Insurance commissions |
29,319 | 33,493 | 25,376 | 29,246 | 28,621 | 62,812 | 60,220 | |||||||||||||||||||||
| Wealth Management |
5,508 | 6,210 | 5,826 | 5,961 | 5,828 | 11,718 | 11,951 | |||||||||||||||||||||
| Other |
4,519 | 5,240 | 6,584 | 5,032 | 5,291 | 9,759 | 10,317 | |||||||||||||||||||||
|
|
|
|
|
|
|
|
|
|
|
|
|
|
|
|||||||||||||||
| Total noninterest revenue |
74,314 | 73,315 | 63,513 | 69,278 | 69,838 | 147,629 | 136,355 | |||||||||||||||||||||
|
|
|
|
|
|
|
|
|
|
|
|
|
|
|
|||||||||||||||
| NONINTEREST EXPENSE: |
||||||||||||||||||||||||||||
| Salaries and employee benefits |
79,759 | 81,179 | 76,751 | 77,453 | 74,741 | 160,938 | 153,624 | |||||||||||||||||||||
| Occupancy, net of rental income |
10,419 | 10,194 | 10,500 | 10,313 | 10,245 | 20,613 | 20,532 | |||||||||||||||||||||
| Equipment |
4,024 | 3,974 | 3,996 | 4,205 | 4,169 | 7,998 | 8,668 | |||||||||||||||||||||
| Deposit insurance assessments |
2,377 | 2,311 | 2,430 | 2,125 | 2,035 | 4,688 | 3,635 | |||||||||||||||||||||
| Other |
31,598 | 39,275 | 36,369 | 39,603 | 36,764 | 70,873 | 68,202 | |||||||||||||||||||||
|
|
|
|
|
|
|
|
|
|
|
|
|
|
|
|||||||||||||||
| Total noninterest expenses |
128,177 | 136,933 | 130,046 | 133,699 | 127,954 | 265,110 | 254,661 | |||||||||||||||||||||
|
|
|
|
|
|
|
|
|
|
|
|
|
|
|
|||||||||||||||
| Income before income taxes |
58,446 | 47,455 | 39,912 | 41,192 | 44,965 | 105,901 | 86,298 | |||||||||||||||||||||
| Income tax expense |
18,733 | 15,189 | 11,252 | 12,414 | 14,097 | 33,922 | 26,986 | |||||||||||||||||||||
|
|
|
|
|
|
|
|
|
|
|
|
|
|
|
|||||||||||||||
| Net income |
$ | 39,713 | $ | 32,266 | $ | 28,660 | $ | 28,778 | $ | 30,868 | $ | 71,979 | $ | 59,312 | ||||||||||||||
|
|
|
|
|
|
|
|
|
|
|
|
|
|
|
|||||||||||||||
| Net income per share: Basic |
$ | 0.41 | $ | 0.33 | $ | 0.30 | $ | 0.30 | $ | 0.32 | $ | 0.75 | $ | 0.62 | ||||||||||||||
|
|
|
|
|
|
|
|
|
|
|
|
|
|
|
|||||||||||||||
| Diluted |
$ | 0.41 | $ | 0.33 | $ | 0.30 | $ | 0.30 | $ | 0.32 | $ | 0.74 | $ | 0.62 | ||||||||||||||
|
|
|
|
|
|
|
|
|
|
|
|
|
|
|
|||||||||||||||
- MORE -
BXS Announces Second Quarter Results
Page 13
July 20, 2015
BancorpSouth, Inc.
Selected Loan Data
(Dollars in thousands)
(Unaudited)
| Quarter Ended | ||||||||||||||||||||
| Jun-15 | Mar-15 | Dec-14 | Sep-14 | Jun-14 | ||||||||||||||||
| LOAN AND LEASE PORTFOLIO: |
||||||||||||||||||||
| Commercial and industrial |
$ | 1,730,142 | $ | 1,676,366 | $ | 1,746,486 | $ | 1,714,012 | $ | 1,699,803 | ||||||||||
| Real estate |
||||||||||||||||||||
| Consumer mortgages |
2,374,122 | 2,301,112 | 2,257,726 | 2,191,265 | 2,071,503 | |||||||||||||||
| Home equity |
558,460 | 538,042 | 531,374 | 518,263 | 506,988 | |||||||||||||||
| Agricultural |
239,884 | 236,898 | 239,616 | 242,023 | 238,003 | |||||||||||||||
| Commercial and industrial-owner occupied |
1,596,244 | 1,518,153 | 1,522,536 | 1,508,679 | 1,505,679 | |||||||||||||||
| Construction, acquisition and development |
860,407 | 892,730 | 853,623 | 819,636 | 772,162 | |||||||||||||||
| Commercial real estate |
2,081,394 | 1,993,473 | 1,961,977 | 1,916,577 | 1,901,759 | |||||||||||||||
| Credit cards |
110,552 | 106,287 | 113,426 | 109,464 | 109,186 | |||||||||||||||
| All other |
456,366 | 463,909 | 486,172 | 490,623 | 506,578 | |||||||||||||||
|
|
|
|
|
|
|
|
|
|
|
|||||||||||
| Total loans |
$ | 10,007,571 | $ | 9,726,970 | $ | 9,712,936 | $ | 9,510,542 | $ | 9,311,661 | ||||||||||
|
|
|
|
|
|
|
|
|
|
|
|||||||||||
| ALLOWANCE FOR CREDIT LOSSES: |
||||||||||||||||||||
| Balance, beginning of period |
$ | 136,660 | $ | 142,443 | $ | 143,950 | $ | 147,132 | $ | 149,704 | ||||||||||
| Loans and leases charged-off: |
||||||||||||||||||||
| Commercial and industrial |
(1,436 | ) | (383 | ) | (1,179 | ) | (306 | ) | (860 | ) | ||||||||||
| Real estate |
||||||||||||||||||||
| Consumer mortgages |
(575 | ) | (892 | ) | (900 | ) | (1,510 | ) | (1,682 | ) | ||||||||||
| Home equity |
(245 | ) | (498 | ) | (93 | ) | (510 | ) | (438 | ) | ||||||||||
| Agricultural |
— | (8 | ) | (4 | ) | (47 | ) | (18 | ) | |||||||||||
| Commercial and industrial-owner occupied |
(404 | ) | (394 | ) | (220 | ) | (1,229 | ) | (936 | ) | ||||||||||
| Construction, acquisition and development |
(272 | ) | (343 | ) | (566 | ) | (1,458 | ) | (41 | ) | ||||||||||
| Commercial real estate |
(1,117 | ) | (1,007 | ) | (463 | ) | (70 | ) | (361 | ) | ||||||||||
| Credit cards |
(527 | ) | (676 | ) | (580 | ) | (612 | ) | (608 | ) | ||||||||||
| All other |
(441 | ) | (579 | ) | (847 | ) | (743 | ) | (671 | ) | ||||||||||
|
|
|
|
|
|
|
|
|
|
|
|||||||||||
| Total loans charged-off |
(5,017 | ) | (4,780 | ) | (4,852 | ) | (6,485 | ) | (5,615 | ) | ||||||||||
|
|
|
|
|
|
|
|
|
|
|
|||||||||||
| Recoveries: |
||||||||||||||||||||
| Commercial and industrial |
282 | 502 | 298 | 565 | 359 | |||||||||||||||
| Real estate |
||||||||||||||||||||
| Consumer mortgages |
1,024 | 612 | 821 | 952 | 956 | |||||||||||||||
| Home equity |
185 | 241 | 102 | 157 | 182 | |||||||||||||||
| Agricultural |
36 | 269 | 16 | 45 | 26 | |||||||||||||||
| Commercial and industrial-owner occupied |
146 | 550 | 216 | 460 | 78 | |||||||||||||||
| Construction, acquisition and development |
8,978 | 604 | 897 | 392 | 808 | |||||||||||||||
| Commercial real estate |
600 | 720 | 623 | 286 | 226 | |||||||||||||||
| Credit cards |
183 | 153 | 160 | 116 | 135 | |||||||||||||||
| All other |
235 | 346 | 212 | 330 | 273 | |||||||||||||||
|
|
|
|
|
|
|
|
|
|
|
|||||||||||
| Total recoveries |
11,669 | 3,997 | 3,345 | 3,303 | 3,043 | |||||||||||||||
|
|
|
|
|
|
|
|
|
|
|
|||||||||||
| Net recoveries (charge-offs) |
6,652 | (783 | ) | (1,507 | ) | (3,182 | ) | (2,572 | ) | |||||||||||
| Provision charged to operating expense |
(5,000 | ) | (5,000 | ) | — | — | — | |||||||||||||
|
|
|
|
|
|
|
|
|
|
|
|||||||||||
| Balance, end of period |
$ | 138,312 | $ | 136,660 | $ | 142,443 | $ | 143,950 | $ | 147,132 | ||||||||||
|
|
|
|
|
|
|
|
|
|
|
|||||||||||
| Average loans for period |
$ | 9,868,318 | $ | 9,670,987 | $ | 9,579,059 | $ | 9,393,709 | $ | 9,232,743 | ||||||||||
|
|
|
|
|
|
|
|
|
|
|
|||||||||||
| Ratio: |
||||||||||||||||||||
| Net (recoveries) charge-offs to average loans (annualized) |
(0.27 | %) | 0.03 | % | 0.06 | % | 0.13 | % | 0.11 | % | ||||||||||
|
|
|
|
|
|
|
|
|
|
|
|||||||||||
- MORE -
BXS Announces Second Quarter Results
Page 14
July 20, 2015
BancorpSouth, Inc.
Selected Loan Data
(Dollars in thousands)
(Unaudited)
| Quarter Ended | ||||||||||||||||||||
| Jun-15 | Mar-15 | Dec-14 | Sep-14 | Jun-14 | ||||||||||||||||
| NON-PERFORMING ASSETS |
||||||||||||||||||||
| NON-PERFORMING LOANS AND LEASES: |
||||||||||||||||||||
| Nonaccrual Loans and Leases |
||||||||||||||||||||
| Commercial and industrial |
$ | 9,740 | $ | 3,923 | $ | 3,934 | $ | 2,786 | $ | 2,917 | ||||||||||
| Real estate |
||||||||||||||||||||
| Consumer mortgages |
21,636 | 21,435 | 23,668 | 23,408 | 24,355 | |||||||||||||||
| Home equity |
3,550 | 2,269 | 2,253 | 2,073 | 2,116 | |||||||||||||||
| Agricultural |
259 | 259 | 291 | 638 | 595 | |||||||||||||||
| Commercial and industrial-owner occupied |
14,007 | 9,687 | 11,190 | 7,495 | 11,094 | |||||||||||||||
| Construction, acquisition and development |
5,411 | 5,111 | 4,162 | 6,070 | 9,202 | |||||||||||||||
| Commercial real estate |
12,397 | 11,107 | 11,915 | 11,102 | 13,406 | |||||||||||||||
| Credit cards |
157 | 118 | 133 | 168 | 132 | |||||||||||||||
| All other |
609 | 509 | 506 | 872 | 716 | |||||||||||||||
|
|
|
|
|
|
|
|
|
|
|
|||||||||||
| Total nonaccrual loans and leases |
$ | 67,766 | $ | 54,418 | $ | 58,052 | $ | 54,612 | $ | 64,533 | ||||||||||
|
|
|
|
|
|
|
|
|
|
|
|||||||||||
| Loans and Leases 90+ Days Past Due, Still Accruing: |
||||||||||||||||||||
| Commercial and industrial |
$ | 20 | $ | 30 | $ | 41 | $ | 60 | $ | 302 | ||||||||||
| Real estate |
||||||||||||||||||||
| Consumer mortgages |
1,022 | 1,256 | 1,828 | 1,590 | 1,607 | |||||||||||||||
| Home equity |
141 | — | — | 20 | 116 | |||||||||||||||
| Agricultural |
— | — | — | — | 100 | |||||||||||||||
| Commercial and industrial-owner occupied |
14 | — | 39 | — | — | |||||||||||||||
| Construction, acquisition and development |
— | — | 387 | — | — | |||||||||||||||
| Commercial real estate |
— | — | 137 | — | — | |||||||||||||||
| Credit cards |
342 | 329 | 327 | 255 | 281 | |||||||||||||||
| All other |
29 | — | 4 | — | — | |||||||||||||||
|
|
|
|
|
|
|
|
|
|
|
|||||||||||
| Total loans and leases 90+ days past due, still accruing |
1,568 | 1,615 | 2,763 | 1,925 | 2,406 | |||||||||||||||
|
|
|
|
|
|
|
|
|
|
|
|||||||||||
| Restructured Loans and Leases, Still Accruing |
10,109 | 5,433 | 10,920 | 12,398 | 6,712 | |||||||||||||||
|
|
|
|
|
|
|
|
|
|
|
|||||||||||
| Total non-performing loans and leases |
79,443 | 61,466 | 71,735 | 68,935 | 73,651 | |||||||||||||||
|
|
|
|
|
|
|
|
|
|
|
|||||||||||
| OTHER REAL ESTATE OWNED: |
24,299 | 27,889 | 33,984 | 42,691 | 55,253 | |||||||||||||||
|
|
|
|
|
|
|
|
|
|
|
|||||||||||
| Total Non-performing Assets |
$ | 103,742 | $ | 89,355 | $ | 105,719 | $ | 111,626 | $ | 128,904 | ||||||||||
|
|
|
|
|
|
|
|
|
|
|
|||||||||||
| Additions to Nonaccrual Loans and Leases During the Quarter |
$ | 35,315 | $ | 23,607 | $ | 21,952 | $ | 16,707 | $ | 13,748 | ||||||||||
|
|
|
|
|
|
|
|
|
|
|
|||||||||||
| Loans and Leases 30-89 Days Past Due, Still Accruing: |
||||||||||||||||||||
| Commercial and industrial |
$ | 3,081 | $ | 3,270 | $ | 2,319 | $ | 3,753 | $ | 3,605 | ||||||||||
| Real estate |
||||||||||||||||||||
| Consumer mortgages |
10,622 | 9,955 | 11,412 | 13,013 | 11,448 | |||||||||||||||
| Home equity |
2,527 | 2,594 | 2,047 | 1,315 | 960 | |||||||||||||||
| Agricultural |
116 | 161 | 366 | 190 | 1,122 | |||||||||||||||
| Commercial and industrial-owner occupied |
2,643 | 3,026 | 912 | 2,364 | 6,340 | |||||||||||||||
| Construction, acquisition and development |
1,120 | 5,471 | 4,811 | 1,036 | 1,616 | |||||||||||||||
| Commercial real estate |
1,651 | 3,032 | 1,510 | 926 | 1,658 | |||||||||||||||
| Credit cards |
529 | 581 | 739 | 602 | 556 | |||||||||||||||
| All other |
1,481 | 1,014 | 1,698 | 1,196 | 1,490 | |||||||||||||||
|
|
|
|
|
|
|
|
|
|
|
|||||||||||
| Total Loans and Leases 30-89 days past due, still accruing |
$ | 23,770 | $ | 29,104 | $ | 25,814 | $ | 24,395 | $ | 28,795 | ||||||||||
|
|
|
|
|
|
|
|
|
|
|
|||||||||||
| Credit Quality Ratios: |
||||||||||||||||||||
| Provision for credit losses to average loans and leases (annualized) |
(0.20 | %) | (0.21 | %) | 0.00 | % | 0.00 | % | 0.00 | % | ||||||||||
| Allowance for credit losses to net loans and leases |
1.38 | % | 1.40 | % | 1.47 | % | 1.51 | % | 1.58 | % | ||||||||||
| Allowance for credit losses to non-performing loans and leases |
174.10 | % | 222.33 | % | 198.57 | % | 208.82 | % | 199.77 | % | ||||||||||
| Allowance for credit losses to non-performing assets |
133.32 | % | 152.94 | % | 134.74 | % | 128.96 | % | 114.14 | % | ||||||||||
| Non-performing loans and leases to net loans and leases |
0.79 | % | 0.63 | % | 0.74 | % | 0.72 | % | 0.79 | % | ||||||||||
| Non-performing assets to net loans and leases |
1.04 | % | 0.92 | % | 1.09 | % | 1.17 | % | 1.38 | % | ||||||||||
- MORE -
BXS Announces Second Quarter Results
Page 15
July 20, 2015
BancorpSouth, Inc.
Selected Loan Data
(Dollars in thousands)
(Unaudited)
| June 30, 2015 | ||||||||||||||||||||||||||||
| Pass | Special Mention |
Substandard | Doubtful | Loss | Impaired | Total | ||||||||||||||||||||||
| LOAN PORTFOLIO BY INTERNALLY ASSIGNED GRADE: |
||||||||||||||||||||||||||||
| Commercial and industrial |
$ | 1,688,364 | $ | 695 | $ | 33,809 | $ | 107 | $ | — | $ | 7,167 | $ | 1,730,142 | ||||||||||||||
| Real estate |
||||||||||||||||||||||||||||
| Consumer mortgages |
2,288,980 | — | 81,312 | 226 | — | 3,604 | 2,374,122 | |||||||||||||||||||||
| Home equity |
547,169 | — | 9,480 | — | — | 1,811 | 558,460 | |||||||||||||||||||||
| Agricultural |
232,626 | — | 7,258 | — | — | — | 239,884 | |||||||||||||||||||||
| Commercial and industrial-owner occupied |
1,538,436 | — | 47,991 | 233 | — | 9,584 | 1,596,244 | |||||||||||||||||||||
| Construction, acquisition and development |
826,039 | — | 30,309 | 444 | — | 3,615 | 860,407 | |||||||||||||||||||||
| Commercial real estate |
2,016,614 | — | 55,452 | 295 | — | 9,033 | 2,081,394 | |||||||||||||||||||||
| Credit cards |
110,552 | — | — | — | — | — | 110,552 | |||||||||||||||||||||
| All other |
443,484 | — | 12,583 | — | — | 299 | 456,366 | |||||||||||||||||||||
|
|
|
|
|
|
|
|
|
|
|
|
|
|
|
|||||||||||||||
| Total loans |
$ | 9,692,264 | $ | 695 | $ | 278,194 | $ | 1,305 | $ | — | $ | 35,113 | $ | 10,007,571 | ||||||||||||||
|
|
|
|
|
|
|
|
|
|
|
|
|
|
|
|||||||||||||||
| March 31, 2015 | ||||||||||||||||||||||||||||
| Pass | Special Mention |
Substandard | Doubtful | Loss | Impaired | Total | ||||||||||||||||||||||
| LOAN PORTFOLIO BY INTERNALLY ASSIGNED GRADE: |
||||||||||||||||||||||||||||
| Commercial and industrial |
$ | 1,642,264 | $ | 961 | $ | 31,202 | $ | 99 | $ | — | $ | 1,840 | $ | 1,676,366 | ||||||||||||||
| Real estate |
||||||||||||||||||||||||||||
| Consumer mortgages |
2,218,792 | — | 78,928 | 227 | — | 3,165 | 2,301,112 | |||||||||||||||||||||
| Home equity |
527,726 | — | 9,706 | — | — | 610 | 538,042 | |||||||||||||||||||||
| Agricultural |
225,990 | — | 10,908 | — | — | — | 236,898 | |||||||||||||||||||||
| Commercial and industrial-owner occupied |
1,457,229 | — | 54,801 | 242 | — | 5,881 | 1,518,153 | |||||||||||||||||||||
| Construction, acquisition and development |
851,938 | — | 37,303 | 329 | — | 3,160 | 892,730 | |||||||||||||||||||||
| Commercial real estate |
1,923,659 | — | 59,497 | 300 | — | 10,017 | 1,993,473 | |||||||||||||||||||||
| Credit cards |
106,287 | — | — | — | — | — | 106,287 | |||||||||||||||||||||
| All other |
451,174 | — | 12,571 | — | — | 164 | 463,909 | |||||||||||||||||||||
|
|
|
|
|
|
|
|
|
|
|
|
|
|
|
|||||||||||||||
| Total loans |
$ | 9,405,059 | $ | 961 | $ | 294,916 | $ | 1,197 | $ | — | $ | 24,837 | $ | 9,726,970 | ||||||||||||||
|
|
|
|
|
|
|
|
|
|
|
|
|
|
|
|||||||||||||||
- MORE -
BXS Announces Second Quarter Results
Page 16
July 20, 2015
BancorpSouth, Inc.
Geographical Information
(Dollars in thousands)
(Unaudited)
| June 30, 2015 | ||||||||||||||||||||||||||||||||||||
| Alabama and Florida Panhandle |
Arkansas | Louisiana | Mississippi | Missouri | Tennessee | Texas | Other | Total | ||||||||||||||||||||||||||||
| LOAN AND LEASE PORTFOLIO: |
||||||||||||||||||||||||||||||||||||
| Commercial and industrial |
$ | 204,492 | $ | 242,960 | $ | 223,437 | $ | 558,152 | $ | 81,380 | $ | 132,576 | $ | 261,777 | $ | 25,368 | $ | 1,730,142 | ||||||||||||||||||
| Real estate |
||||||||||||||||||||||||||||||||||||
| Consumer mortgages |
216,904 | 290,517 | 195,055 | 781,620 | 69,791 | 243,264 | 381,966 | 195,005 | 2,374,122 | |||||||||||||||||||||||||||
| Home equity |
76,832 | 40,315 | 58,910 | 216,732 | 21,724 | 134,093 | 8,717 | 1,137 | 558,460 | |||||||||||||||||||||||||||
| Agricultural |
6,177 | 70,084 | 28,903 | 73,413 | 2,942 | 12,269 | 46,030 | 66 | 239,884 | |||||||||||||||||||||||||||
| Commercial and industrial-owner occupied |
178,562 | 192,245 | 187,334 | 596,559 | 58,108 | 163,451 | 209,016 | 10,969 | 1,596,244 | |||||||||||||||||||||||||||
| Construction, acquisition and development |
120,525 | 100,107 | 83,103 | 224,127 | 19,593 | 150,280 | 133,290 | 29,382 | 860,407 | |||||||||||||||||||||||||||
| Commercial real estate |
302,727 | 345,327 | 245,432 | 502,630 | 201,763 | 185,194 | 230,854 | 67,467 | 2,081,394 | |||||||||||||||||||||||||||
| Credit cards |
— | — | — | — | — | — | — | 110,552 | 110,552 | |||||||||||||||||||||||||||
| All other |
29,618 | 36,406 | 25,019 | 198,509 | 2,322 | 32,805 | 36,230 | 95,457 | 456,366 | |||||||||||||||||||||||||||
|
|
|
|
|
|
|
|
|
|
|
|
|
|
|
|
|
|
|
|||||||||||||||||||
| Total loans |
$ | 1,135,837 | $ | 1,317,961 | $ | 1,047,193 | $ | 3,151,742 | $ | 457,623 | $ | 1,053,932 | $ | 1,307,880 | $ | 535,403 | $ | 10,007,571 | ||||||||||||||||||
|
|
|
|
|
|
|
|
|
|
|
|
|
|
|
|
|
|
|
|||||||||||||||||||
| NON-PERFORMING LOANS AND LEASES: |
||||||||||||||||||||||||||||||||||||
| Commercial and industrial |
$ | 1,211 | $ | 4,012 | $ | 472 | $ | 1,959 | $ | 191 | $ | — | $ | 2,903 | $ | 124 | $ | 10,872 | ||||||||||||||||||
| Real estate |
||||||||||||||||||||||||||||||||||||
| Consumer mortgages |
954 | 3,008 | 979 | 8,642 | 1,014 | 1,657 | 1,136 | 6,399 | 23,789 | |||||||||||||||||||||||||||
| Home equity |
805 | 1,251 | 544 | 442 | — | 647 | — | 2 | 3,691 | |||||||||||||||||||||||||||
| Agricultural |
79 | 30 | 14 | 77 | — | 59 | — | — | 259 | |||||||||||||||||||||||||||
| Commercial and industrial-owner occupied |
368 | 5,659 | 983 | 9,829 | 822 | 505 | 288 | 4 | 18,458 | |||||||||||||||||||||||||||
| Construction, acquisition and development |
468 | 733 | — | 1,625 | 1,666 | 2,556 | — | 1 | 7,049 | |||||||||||||||||||||||||||
| Commercial real estate |
1,078 | 882 | 2,774 | 2,596 | 441 | 3,258 | 2,162 | — | 13,191 | |||||||||||||||||||||||||||
| Credit cards |
— | — | — | — | — | — | — | 1,387 | 1,387 | |||||||||||||||||||||||||||
| All other |
— | 201 | 170 | 181 | — | 194 | — | 1 | 747 | |||||||||||||||||||||||||||
|
|
|
|
|
|
|
|
|
|
|
|
|
|
|
|
|
|
|
|||||||||||||||||||
| Total loans |
$ | 4,963 | $ | 15,776 | $ | 5,936 | $ | 25,351 | $ | 4,134 | $ | 8,876 | $ | 6,489 | $ | 7,918 | $ | 79,443 | ||||||||||||||||||
|
|
|
|
|
|
|
|
|
|
|
|
|
|
|
|
|
|
|
|||||||||||||||||||
| NON-PERFORMING LOANS AND LEASES AS A PERCENTAGE OF OUTSTANDING: |
||||||||||||||||||||||||||||||||||||
| Commercial and industrial |
0.59 | % | 1.65 | % | 0.21 | % | 0.35 | % | 0.23 | % | 0.00 | % | 1.11 | % | 0.49 | % | 0.63 | % | ||||||||||||||||||
| Real estate |
||||||||||||||||||||||||||||||||||||
| Consumer mortgages |
0.44 | % | 1.04 | % | 0.50 | % | 1.11 | % | 1.45 | % | 0.68 | % | 0.30 | % | 3.28 | % | 1.00 | % | ||||||||||||||||||
| Home equity |
1.05 | % | 3.10 | % | 0.92 | % | 0.20 | % | 0.00 | % | 0.48 | % | 0.00 | % | 0.18 | % | 0.66 | % | ||||||||||||||||||
| Agricultural |
1.28 | % | 0.04 | % | 0.05 | % | 0.10 | % | 0.00 | % | 0.48 | % | 0.00 | % | 0.00 | % | 0.11 | % | ||||||||||||||||||
| Commercial and industrial-owner occupied |
0.21 | % | 2.94 | % | 0.52 | % | 1.65 | % | 1.41 | % | 0.31 | % | 0.14 | % | 0.04 | % | 1.16 | % | ||||||||||||||||||
| Construction, acquisition and development |
0.39 | % | 0.73 | % | 0.00 | % | 0.73 | % | 8.50 | % | 1.70 | % | 0.00 | % | 0.00 | % | 0.82 | % | ||||||||||||||||||
| Commercial real estate |
0.36 | % | 0.26 | % | 1.13 | % | 0.52 | % | 0.22 | % | 1.76 | % | 0.94 | % | 0.00 | % | 0.63 | % | ||||||||||||||||||
| Credit cards |
0.00 | % | 0.00 | % | 0.00 | % | 0.00 | % | 0.00 | % | 0.00 | % | 0.00 | % | 1.25 | % | 1.25 | % | ||||||||||||||||||
| All other |
0.00 | % | 0.55 | % | 0.68 | % | 0.09 | % | 0.00 | % | 0.59 | % | 0.00 | % | 0.00 | % | 0.16 | % | ||||||||||||||||||
|
|
|
|
|
|
|
|
|
|
|
|
|
|
|
|
|
|
|
|||||||||||||||||||
| Total loans |
0.44 | % | 1.20 | % | 0.57 | % | 0.80 | % | 0.90 | % | 0.84 | % | 0.50 | % | 1.48 | % | 0.79 | % | ||||||||||||||||||
|
|
|
|
|
|
|
|
|
|
|
|
|
|
|
|
|
|
|
|||||||||||||||||||
- MORE -
BXS Announces Second Quarter Results
Page 17
July 20, 2015
BancorpSouth, Inc.
Selected Additional Information
(Dollars in thousands)
(Unaudited)
| June 30, 2015 | ||||||||||||||||||||||||||||||||||||
| Alabama and Florida Panhandle |
Arkansas | Louisiana | Mississippi | Missouri | Tennessee | Texas | Other | Total | ||||||||||||||||||||||||||||
| OTHER REAL ESTATE OWNED: |
||||||||||||||||||||||||||||||||||||
| Commercial and industrial |
$ | 84 | $ | — | $ | — | $ | — | $ | — | $ | — | $ | — | $ | — | $ | 84 | ||||||||||||||||||
| Real estate |
||||||||||||||||||||||||||||||||||||
| Consumer mortgages |
213 | 30 | 25 | 1,599 | — | 71 | 110 | — | 2,048 | |||||||||||||||||||||||||||
| Home equity |
— | — | — | 101 | — | — | — | — | 101 | |||||||||||||||||||||||||||
| Agricultural |
— | — | — | 25 | — | — | — | — | 25 | |||||||||||||||||||||||||||
| Commercial and industrial-owner occupied |
260 | — | — | 587 | — | 307 | 60 | — | 1,214 | |||||||||||||||||||||||||||
| Construction, acquisition and development |
3,887 | 84 | 130 | 13,165 | — | 2,373 | — | — | 19,639 | |||||||||||||||||||||||||||
| Commercial real estate |
170 | — | — | 714 | — | 122 | 63 | — | 1,069 | |||||||||||||||||||||||||||
| All other |
— | 21 | — | 98 | — | — | — | — | 119 | |||||||||||||||||||||||||||
|
|
|
|
|
|
|
|
|
|
|
|
|
|
|
|
|
|
|
|||||||||||||||||||
| Total loans |
$ | 4,614 | $ | 135 | $ | 155 | $ | 16,289 | $ | — | $ | 2,873 | $ | 233 | $ | — | $ | 24,299 | ||||||||||||||||||
|
|
|
|
|
|
|
|
|
|
|
|
|
|
|
|
|
|
|
|||||||||||||||||||
| Quarter Ended | ||||||||||||||||||||
| Jun-15 | Mar-15 | Dec-14 | Sep-14 | Jun-14 | ||||||||||||||||
| OTHER REAL ESTATE OWNED: |
||||||||||||||||||||
| Balance, beginning of period |
$ | 27,889 | $ | 33,984 | $ | 42,691 | $ | 55,253 | $ | 63,595 | ||||||||||
| Additions to foreclosed properties |
||||||||||||||||||||
| New foreclosed property |
1,730 | 2,804 | 2,257 | 3,476 | 4,144 | |||||||||||||||
| Reductions in foreclosed properties |
||||||||||||||||||||
| Sales |
(4,284 | ) | (6,726 | ) | (8,548 | ) | (14,429 | ) | (10,269 | ) | ||||||||||
| Writedowns |
(1,036 | ) | (2,173 | ) | (2,416 | ) | (1,609 | ) | (2,217 | ) | ||||||||||
|
|
|
|
|
|
|
|
|
|
|
|||||||||||
| Balance, end of period |
$ | 24,299 | $ | 27,889 | $ | 33,984 | $ | 42,691 | $ | 55,253 | ||||||||||
|
|
|
|
|
|
|
|
|
|
|
|||||||||||
| FORECLOSED PROPERTY EXPENSE |
||||||||||||||||||||
| (Gain) Loss on sale of other real estate owned |
$ | 204 | $ | (779 | ) | $ | 1,643 | $ | 3,289 | $ | 1,073 | |||||||||
| Writedown of other real estate owned |
1,036 | 2,173 | 2,416 | 1,609 | 2,217 | |||||||||||||||
| Other foreclosed property expense |
385 | 577 | 534 | 823 | 912 | |||||||||||||||
|
|
|
|
|
|
|
|
|
|
|
|||||||||||
| Total foreclosed property expense |
$ | 1,625 | $ | 1,971 | $ | 4,593 | $ | 5,721 | $ | 4,202 | ||||||||||
|
|
|
|
|
|
|
|
|
|
|
|||||||||||
- MORE -
BXS Announces Second Quarter Results
Page 18
July 20, 2015
BancorpSouth, Inc.
Noninterest Revenue and Expense
(Dollars in thousands)
(Unaudited)
| Quarter Ended | ||||||||||||||||||||
| Jun-15 | Mar-15 | Dec-14 | Sep-14 | Jun-14 | ||||||||||||||||
| NONINTEREST REVENUE: |
||||||||||||||||||||
| Mortgage lending |
$ | 14,102 | $ | 8,567 | $ | 3,250 | $ | 6,938 | $ | 9,089 | ||||||||||
| Credit card, debit card and merchant fees |
9,298 | 8,539 | 9,921 | 8,972 | 8,567 | |||||||||||||||
| Deposit service charges |
11,527 | 11,252 | 12,538 | 13,111 | 12,437 | |||||||||||||||
| Securities gains, net |
41 | 14 | 18 | 18 | 5 | |||||||||||||||
| Insurance commissions |
29,319 | 33,493 | 25,376 | 29,246 | 28,621 | |||||||||||||||
| Trust income |
3,543 | 4,036 | 3,791 | 3,537 | 3,624 | |||||||||||||||
| Annuity fees |
470 | 558 | 540 | 461 | 695 | |||||||||||||||
| Brokerage commissions and fees |
1,495 | 1,616 | 1,495 | 1,963 | 1,509 | |||||||||||||||
| Bank-owned life insurance |
1,835 | 1,899 | 3,249 | 1,865 | 1,885 | |||||||||||||||
| Other miscellaneous income |
2,684 | 3,341 | 3,335 | 3,167 | 3,406 | |||||||||||||||
|
|
|
|
|
|
|
|
|
|
|
|||||||||||
| Total noninterest revenue |
$ | 74,314 | $ | 73,315 | $ | 63,513 | $ | 69,278 | $ | 69,838 | ||||||||||
|
|
|
|
|
|
|
|
|
|
|
|||||||||||
| NONINTEREST EXPENSE: |
||||||||||||||||||||
| Salaries and employee benefits |
$ | 79,759 | $ | 81,179 | $ | 76,751 | $ | 77,453 | $ | 74,741 | ||||||||||
| Occupancy, net of rental income |
10,419 | 10,194 | 10,500 | 10,313 | 10,245 | |||||||||||||||
| Equipment |
4,024 | 3,974 | 3,996 | 4,205 | 4,169 | |||||||||||||||
| Deposit insurance assessments |
2,377 | 2,311 | 2,430 | 2,125 | 2,035 | |||||||||||||||
| Amortization of bond issue cost |
12 | 12 | 12 | 12 | 12 | |||||||||||||||
| Advertising |
1,686 | 781 | 1,233 | 1,192 | 1,331 | |||||||||||||||
| Foreclosed property expense |
1,625 | 1,971 | 4,593 | 5,721 | 4,202 | |||||||||||||||
| Telecommunications |
1,897 | 1,922 | 1,960 | 2,254 | 2,258 | |||||||||||||||
| Public relations |
653 | 570 | 770 | 950 | 857 | |||||||||||||||
| Data processing |
5,324 | 5,393 | 4,804 | 5,317 | 5,384 | |||||||||||||||
| Computer software |
2,690 | 2,606 | 2,763 | 2,488 | 2,851 | |||||||||||||||
| Amortization of intangibles |
1,061 | 1,032 | 1,111 | 1,126 | 1,148 | |||||||||||||||
| Legal |
1,998 | 7,681 | 2,322 | 2,620 | 3,002 | |||||||||||||||
| Merger expense |
4 | (2 | ) | 4 | 188 | 1,010 | ||||||||||||||
| Postage and shipping |
1,194 | 1,172 | 1,239 | 1,103 | 1,116 | |||||||||||||||
| Other miscellaneous expense |
13,454 | 16,137 | 15,558 | 16,632 | 13,593 | |||||||||||||||
|
|
|
|
|
|
|
|
|
|
|
|||||||||||
| Total noninterest expense |
$ | 128,177 | $ | 136,933 | $ | 130,046 | $ | 133,699 | $ | 127,954 | ||||||||||
|
|
|
|
|
|
|
|
|
|
|
|||||||||||
| INSURANCE COMMISSIONS: |
||||||||||||||||||||
| Property and casualty commissions |
$ | 21,145 | $ | 20,673 | $ | 19,007 | $ | 22,746 | $ | 21,576 | ||||||||||
| Life and health commissions |
6,202 | 5,412 | 5,521 | 5,128 | 5,549 | |||||||||||||||
| Risk management income |
637 | 666 | 621 | 708 | 617 | |||||||||||||||
| Other |
1,335 | 6,742 | 227 | 664 | 879 | |||||||||||||||
|
|
|
|
|
|
|
|
|
|
|
|||||||||||
| Total insurance commissions |
$ | 29,319 | $ | 33,493 | $ | 25,376 | $ | 29,246 | $ | 28,621 | ||||||||||
|
|
|
|
|
|
|
|
|
|
|
|||||||||||
- MORE -
BXS Announces Second Quarter Results
Page 19
July 20, 2015
BancorpSouth, Inc.
Selected Additional Information
(Dollars in thousands)
(Unaudited)
| Quarter Ended | ||||||||||||||||||||
| Jun-15 | Mar-15 | Dec-14 | Sep-14 | Jun-14 | ||||||||||||||||
| MORTGAGE SERVICING RIGHTS: |
||||||||||||||||||||
| Fair value, beginning of period |
$ | 49,190 | $ | 51,296 | $ | 53,759 | $ | 52,272 | $ | 53,436 | ||||||||||
| Additions to mortgage servicing rights: |
||||||||||||||||||||
| Originations of servicing assets |
4,344 | 2,499 | 2,453 | 2,400 | 2,565 | |||||||||||||||
| Changes in fair value: |
||||||||||||||||||||
| Due to payoffs/paydowns |
(1,930 | ) | (1,564 | ) | (1,480 | ) | (1,559 | ) | (1,616 | ) | ||||||||||
| Due to change in valuation inputs or assumptions used in the valuation model |
4,321 | (3,039 | ) | (3,434 | ) | 648 | (2,111 | ) | ||||||||||||
| Other changes in fair value |
(1 | ) | (2 | ) | (2 | ) | (2 | ) | (2 | ) | ||||||||||
|
|
|
|
|
|
|
|
|
|
|
|||||||||||
| Fair value, end of period |
$ | 55,924 | $ | 49,190 | $ | 51,296 | $ | 53,759 | $ | 52,272 | ||||||||||
|
|
|
|
|
|
|
|
|
|
|
|||||||||||
| Production revenue: |
||||||||||||||||||||
| Origination |
$ | 7,395 | $ | 8,914 | $ | 3,949 | $ | 3,736 | $ | 8,758 | ||||||||||
| Servicing |
4,316 | 4,256 | 4,215 | 4,113 | 4,058 | |||||||||||||||
| Payoffs/Paydowns |
(1,930 | ) | (1,564 | ) | (1,480 | ) | (1,559 | ) | (1,616 | ) | ||||||||||
|
|
|
|
|
|
|
|
|
|
|
|||||||||||
| Total production revenue |
9,781 | 11,606 | 6,684 | 6,290 | 11,200 | |||||||||||||||
| Market value adjustment |
4,321 | (3,039 | ) | (3,434 | ) | 648 | (2,111 | ) | ||||||||||||
|
|
|
|
|
|
|
|
|
|
|
|||||||||||
| Total mortgage lending revenue |
$ | 14,102 | $ | 8,567 | $ | 3,250 | $ | 6,938 | $ | 9,089 | ||||||||||
|
|
|
|
|
|
|
|
|
|
|
|||||||||||
| Mortgage loans serviced |
$ | 5,802,407 | $ | 5,705,638 | $ | 5,686,756 | $ | 5,649,897 | $ | 5,630,192 | ||||||||||
| MSR/mtg loans serviced |
0.96 | % | 0.86 | % | 0.90 | % | 0.95 | % | 0.93 | % | ||||||||||
| AVAILABLE-FOR-SALE SECURITIES, at fair value |
||||||||||||||||||||
| U.S. Government agencies |
$ | 1,336,846 | $ | 1,286,981 | $ | 1,215,054 | $ | 1,238,088 | $ | 1,333,368 | ||||||||||
| Government agency issued residential mortgage-back securities |
217,191 | 200,381 | 209,230 | 218,748 | 229,414 | |||||||||||||||
| Government agency issued commercial mortgage-back securities |
224,450 | 227,409 | 240,568 | 237,325 | 237,321 | |||||||||||||||
| Obligations of states and political subdivisions |
458,322 | 471,539 | 483,864 | 509,304 | 520,897 | |||||||||||||||
| Other |
14,344 | 8,063 | 8,211 | 7,997 | 11,192 | |||||||||||||||
|
|
|
|
|
|
|
|
|
|
|
|||||||||||
| Total available-for-sale securities |
$ | 2,251,153 | $ | 2,194,373 | $ | 2,156,927 | $ | 2,211,462 | $ | 2,332,192 | ||||||||||
|
|
|
|
|
|
|
|
|
|
|
|||||||||||
- MORE -
BXS Announces Second Quarter Results
Page 20
July 20, 2015
BancorpSouth, Inc.
Reconciliation of Non-GAAP Measures
(Dollars in thousands, except per share amounts)
(Unaudited)
Management evaluates the Company’s capital position and operating performance by utilizing certain financial measures not calculated in accordance with U.S. Generally Accepted Accounting Principles (GAAP), including pre-tax, pre-provision earnings, net operating income, tangible shareholders’ equity to tangible assets, return on tangible equity, pre-tax pre-provision return on average assets, tangible book value per share, and operating earnings per share. The Company has included these non-GAAP financial measures in this news release for the applicable periods presented. Management believes that the presentation of these non-GAAP financial measures (i) provides important supplemental information that contributes to a proper understanding of the Company’s operating performance, (ii) enables a more complete understanding of factors and trends affecting the Company’s business and (iii) allows investors to evaluate the Company’s performance in a manner similar to Management, the financial services industry, bank stock analysts and bank regulators. Reconciliations of these non-GAAP financial measures to the most directly comparable GAAP financial measures are presented in the tables below. These non-GAAP financial measures should not be considered as substitutes for GAAP financial measures, and the Company strongly encourages investors to review the GAAP financial measures included in this news release and not to place undue reliance upon any single financial measure. In addition, because non-GAAP financial measures are not standardized, it may not be possible to compare the non-GAAP financial measures presented in this news release with other companies’ non-GAAP financial measures having the same or similar names.
Reconciliation of Pre-tax, Pre-provision Earnings and Net Operating Income to Net Income:
| Quarter ended | ||||||||||||||||||||||
| 6/30/2015 | 3/31/2015 | 12/31/2014 | 9/30/2014 | 6/30/2014 | ||||||||||||||||||
| Net income |
$ | 39,713 | $ | 32,266 | $ | 28,660 | $ | 28,778 | $ | 30,868 | ||||||||||||
| Plus: |
Provision for credit losses | (5,000 | ) | (5,000 | ) | — | — | — | ||||||||||||||
| Income tax expense |
18,733 | 15,189 | 11,252 | 12,414 | 14,097 | |||||||||||||||||
|
|
|
|
|
|
|
|
|
|
|
|||||||||||||
| Pre-tax, pre-provision earnings |
$ | 53,446 | $ | 42,455 | $ | 39,912 | $ | 41,192 | $ | 44,965 | ||||||||||||
|
|
|
|
|
|
|
|
|
|
|
|||||||||||||
| Net income |
$ | 39,713 | $ | 32,266 | $ | 28,660 | $ | 28,778 | $ | 30,868 | ||||||||||||
| Plus: |
Merger expense, net of tax | 3 | (1 | ) | 2 | 117 | 626 | |||||||||||||||
| One time charge for BSA, net of tax |
— | — | — | 1,903 | — | |||||||||||||||||
|
|
|
|
|
|
|
|
|
|
|
|||||||||||||
| Net operating income |
$ | 39,716 | $ | 32,265 | $ | 28,662 | $ | 30,798 | $ | 31,494 | ||||||||||||
|
|
|
|
|
|
|
|
|
|
|
|||||||||||||
- MORE -
BXS Announces Second Quarter Results
Page 21
July 20, 2015
BancorpSouth, Inc.
Reconciliation of Non-GAAP Measures
(Dollars in thousands, except per share amounts)
(Unaudited)
Reconciliation of Tangible Assets and Tangible Shareholders’ Equity to
Total Assets and Total Shareholders’ Equity:
| Quarter ended | ||||||||||||||||||||||
| 6/30/2015 | 3/31/2015 | 12/31/2014 | 9/30/2014 | 6/30/2014 | ||||||||||||||||||
| Tangible assets |
||||||||||||||||||||||
| Total assets |
$ | 13,634,931 | $ | 13,630,322 | $ | 13,326,369 | $ | 13,071,557 | $ | 12,985,887 | ||||||||||||
| Less: |
Goodwill | 291,498 | 291,498 | 291,498 | 291,498 | 291,498 | ||||||||||||||||
| Other identifiable intangible assets | 22,415 | 23,476 | 24,508 | 25,619 | 26,745 | |||||||||||||||||
|
|
|
|
|
|
|
|
|
|
|
|||||||||||||
| Total tangible assets |
$ | 13,321,018 | $ | 13,315,348 | $ | 13,010,363 | $ | 12,754,440 | $ | 12,667,644 | ||||||||||||
| Tangible shareholders’ equity |
||||||||||||||||||||||
| Total shareholders’ equity |
$ | 1,680,196 | $ | 1,645,208 | $ | 1,606,059 | $ | 1,610,543 | $ | 1,588,850 | ||||||||||||
| Less: |
Goodwill | 291,498 | 291,498 | 291,498 | 291,498 | 291,498 | ||||||||||||||||
| Other identifiable intangible assets | 22,415 | 23,476 | 24,508 | 25,619 | 26,745 | |||||||||||||||||
|
|
|
|
|
|
|
|
|
|
|
|||||||||||||
| Total tangible shareholders’ equity |
$ | 1,366,283 | $ | 1,330,234 | $ | 1,290,053 | $ | 1,293,426 | $ | 1,270,607 | ||||||||||||
| Total average assets |
$ | 13,516,546 | $ | 13,457,668 | $ | 13,131,130 | $ | 12,987,103 | $ | 12,933,879 | ||||||||||||
| Total common shares outstanding |
96,755,530 | 96,544,502 | 96,254,903 | 96,065,021 | 96,046,057 | |||||||||||||||||
| Average shares outstanding-diluted |
96,957,441 | 96,653,401 | 96,506,827 | 96,373,950 | 96,373,121 | |||||||||||||||||
| Tangible shareholders’ equity to tangible assets* |
10.26 | % | 9.99 | % | 9.92 | % | 10.14 | % | 10.03 | % | ||||||||||||
| Return on tangible equity ** |
11.66 | % | 9.84 | % | 8.81 | % | 8.83 | % | 9.74 | % | ||||||||||||
| Pre-tax pre-provision return on average assets *** |
1.59 | % | 1.29 | % | 1.21 | % | 1.26 | % | 1.39 | % | ||||||||||||
| Tangible book value per share**** |
$ | 14.12 | $ | 13.78 | $ | 13.40 | $ | 13.46 | $ | 13.23 | ||||||||||||
| Operating earnings per share***** |
$ | 0.41 | $ | 0.33 | $ | 0.30 | $ | 0.32 | $ | 0.33 | ||||||||||||
| * | Tangible shareholders’ equity to tangible assets is defined by the Company as total shareholders’ equity less goodwill and other identifiable intangible assets, divided by the difference of total assets less goodwill and other identifiable intangible assets. | |
| ** | Return on tangible equity is defined by the Company as annualized net income divided by tangible shareholders’ equity. | |
| *** | Pre-tax pre-provision return on average assets is defined by the Company as annualized pre-tax pre-provision earnings divided by total average assets. | |
| **** | Tangible book value per share is defined by the Company as tangible shareholders’ equity divided by total common shares outstanding. | |
| ***** | Operating earnings per share is defined by the Company as net operating income divided by average shares outstanding-diluted. |
- END -
Exhibit 99.2

BancorpSouth, Inc. Financial Information As of and for the three months ended June 30, 2015

Forward Looking Information Certain statements contained in this this presentation and the accompanying slides may not be based upon historical facts and are “forward-looking statements” within the meaning of Section 27A of the Securities Act of 1933, as amended, and Section 21E of the Securities Exchange Act of 1934, as amended. These forward-looking statements may be identified by their reference to a future period or periods or by the use of forward-looking terminology such as “anticipate,” “believe,” “could,” “estimate,” “expect,” “foresee,” “hope,” “intend,” “may,” “might,” “plan,” “will,” or “would” or future or conditional verb tenses and variations or negatives of such terms. These forward-looking statements include, without limitation, those relating to the terms, timing and closings of the proposed mergers with Ouachita Bancshares Corp. and Central Community Corporation, the Company’s ability to operate its regulatory compliance programs consistent with federal, state ,and local laws, including its BSA/AML compliance program, the findings and results of the joint investigation by the Consumer Financial Protection Bureau (the “CFPB”) and the United States Department of Justice (“DOJ”) of the Company’s fair lending practices, the acceptance by customers of Ouachita Bancshares Corp. and Central Community Corporation of the Company’s products and services if the proposed mergers close, the outcome of any instituted, pending or threatened material litigation, amortization expense for intangible assets, goodwill impairments, loan impairment, utilization of appraisals and inspections for real estate loans, maturity, renewal or extension of construction, acquisition and development loans, net interest revenue, fair value determinations, the amount of the Company’s non-performing loans and leases, additions to Other Real Estate Owned (“OREO”), credit quality, credit losses, liquidity, off-balance sheet commitments and arrangements, valuation of mortgage servicing rights, allowance and provision for credit losses, continued weakness in the economic environment, early identification and resolution of credit issues, utilization of non-GAAP financial measures, the ability of the Company to collect all amounts due according to the contractual terms of loan agreements, the Company’s reserve for losses from representation and warranty obligations, the Company’s foreclosure process related to mortgage loans, the resolution of non-performing loans that are collaterally dependent, real estate values, fully-indexed interest rates, interest rate risk, interest rate sensitivity, calculation of economic value of equity, impaired loan charge-offs, troubled debt restructurings, diversification of the Company’s revenue stream, liquidity needs and strategies, sources of funding, net interest margin, declaration and payment of dividends, cost saving initiatives, improvement in the Company’s efficiencies, operating expense trends, future acquisitions and consideration to be used therefor, the impact of litigation regarding debit card fees and the impact of certain claims and ongoing, pending or threatened litigation, administrative and investigatory matters. The Company cautions readers not to place undue reliance on the forward-looking statements contained in this this presentation and the accompanying slides, in that actual results could differ materially from those indicated in such forward-looking statements as a result of a variety of factors. These factors may include, but are not limited to, the Company’s ability to operate its regulatory compliance programs consistent with federal, state ,and local laws, including its BSA/AML compliance program, the findings and results of the CFPB and the DOJ in their review of the Company’s fair lending practices, the ability of the Company, Ouachita Bancshares Corp. and Central Community Corporation to obtain regulatory approval of and close the proposed mergers, the potential impact upon the Company of the delay in the closings of these proposed mergers, the impact of any ongoing, pending or threatened litigation, administrative and investigatory matters involving the Company, conditions in the financial markets and economic conditions generally, the adequacy of the Company’s provision and allowance for credit losses to cover actual credit losses, the credit risk associated with real estate construction, acquisition and development loans, losses resulting from the significant amount of the Company’s OREO, limitations on the Company’s ability to declare and pay dividends, the availability of capital on favorable terms if and when needed, liquidity risk, governmental regulation, including the Dodd-Frank Act, and supervision of the Company’s operations, the short-term and long-term impact of changes to banking capital standards on the Company’s regulatory capital and liquidity, the impact of regulations on service charges on the Company’s core deposit accounts, the susceptibility of the Company’s business to local economic and environmental conditions, the soundness of other financial institutions, changes in interest rates, the impact of monetary policies and economic factors on the Company’s ability to attract deposits or make loans, volatility in capital and credit markets, reputational risk, the impact of the loss of any key Company personnel, the impact of hurricanes or other adverse weather events, any requirement that the Company write down goodwill or other intangible assets, diversification in the types of financial services the Company offers, the Company’s ability to adapt its products and services to evolving industry standards and consumer preferences, competition with other financial services companies, risks in connection with completed or potential acquisitions, the Company’s growth strategy, interruptions or breaches in the Company’s information system security, the failure of certain third-party vendors to perform, unfavorable ratings by rating agencies, dilution caused by the Company’s issuance of any additional shares of its common stock to raise capital or acquire other banks, bank holding companies, financial holding companies and insurance agencies, other factors generally understood to affect the assets, business, cash flows, financial condition, liquidity, prospects and/or results of operations of financial services companies and other factors detailed from time to time in the Company’s press and this presentation and the accompanying slides, reports and other filings with the SEC. Forward-looking statements speak only as of the date that they were made, and, except as required by law, the Company does not undertake any obligation to update or revise forward-looking statements to reflect events or circumstances that occur after the date of this this presentation and the accompanying slides.
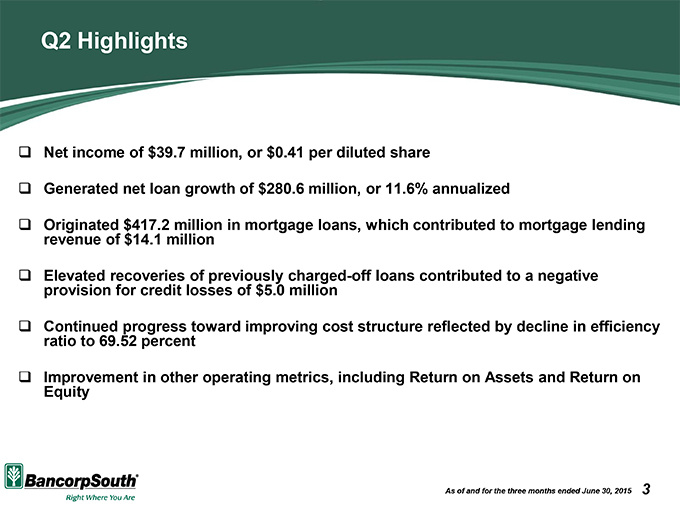
Q2 Highlights Net income of $39.7 million, or $0.41 per diluted share Generated net loan growth of $280.6 million, or 11.6% annualized Originated $417.2 million in mortgage loans, which contributed to mortgage lending revenue of $14.1 million Elevated recoveries of previously charged-off loans contributed to a negative provision for credit losses of $5.0 million Continued progress toward improving cost structure reflected by decline in efficiency ratio to 69.52 percent Improvement in other operating metrics, including Return on Assets and Return on Equity As of and for the three months ended June 30, 2015 3
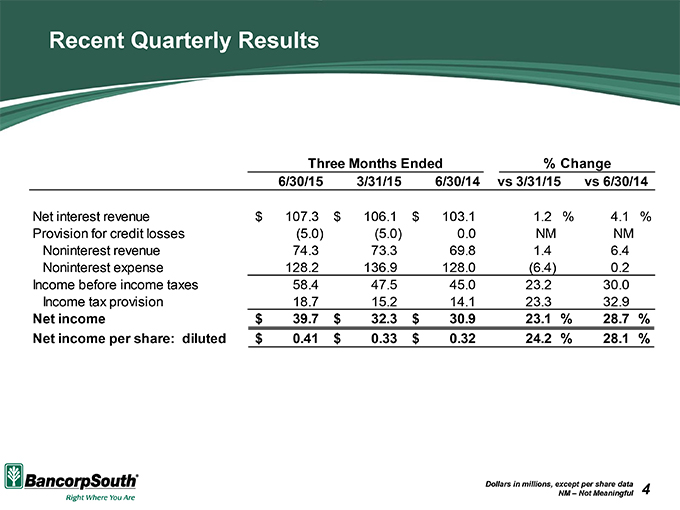
Recent Quarterly Results Three Months Ended % Change 6/30/15 3/31/15 6/30/14 vs 3/31/15 vs 6/30/14 Net interest revenue $ 107.3 $ 106.1 $ 103.1 1.2 % 4.1 % Provision for credit losses (5.0) (5.0) 0.0 NM NM Noninterest revenue 74.3 73.3 69.8 1.4 6.4 Noninterest expense 128.2 136.9 128.0 (6.4) 0.2 Income before income taxes 58.4 47.5 45.0 23.2 30.0 Income tax provision 18.7 15.2 14.1 23.3 32.9 Net income $ 39.7 $ 32.3 $ 30.9 23.1 % 28.7 % Net income per share: diluted $ 0.41 $ 0.33 $ 0.32 24.2 % 28.1 % Dollars in millions, except per share data NM – Not Meaningful 4
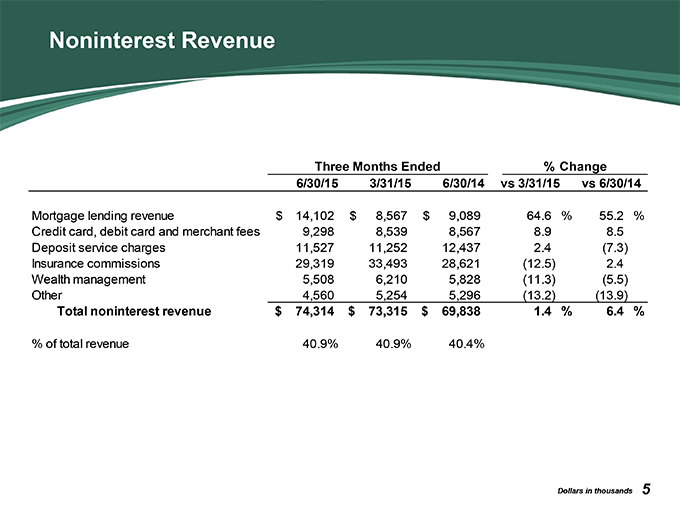
Noninterest Revenue Three Months Ended % Change 6/30/15 3/31/15 6/30/14 vs 3/31/15 vs 6/30/14 Mortgage lending revenue $ 14,102 $ 8,567 $ 9,089 64.6 % 55.2 % Credit card, debit card and merchant fees 9,298 8,539 8,567 8.9 8.5 Deposit service charges 11,527 11,252 12,437 2.4 (7.3) Insurance commissions 29,319 33,493 28,621 (12.5) 2.4 Wealth management 5,508 6,210 5,828 (11.3) (5.5) Other 4,560 5,254 5,296 (13.2) (13.9) Total noninterest revenue $ 74,314 $ 73,315 $ 69,838 1.4 % 6.4 % % of total revenue 40.9% 40.9% 40.4% Dollars in thousands 5
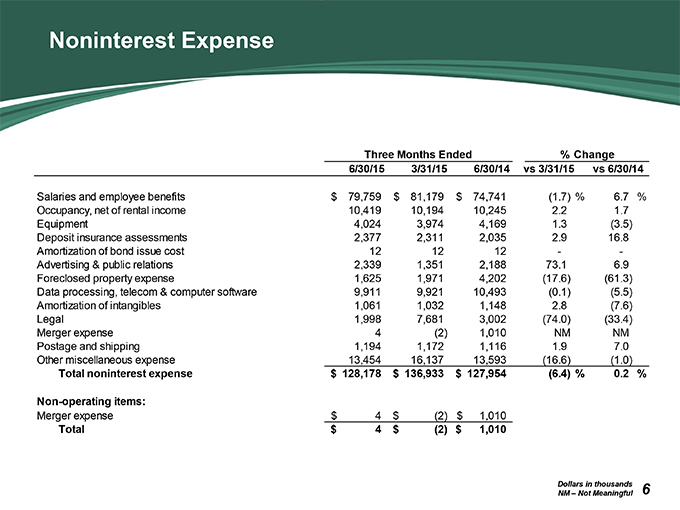
Noninterest Expense Three Months Ended % Change 6/30/15 3/31/15 6/30/14 vs 3/31/15 vs 6/30/14 Salaries and employee benefits $ 79,759 $ 81,179 $ 74,741 (1.7) % 6.7 % Occupancy, net of rental income 10,419 10,194 10,245 2.2 1.7 Equipment 4,024 3,974 4,169 1.3 (3.5) Deposit insurance assessments 2,377 2,311 2,035 2.9 16.8 Amortization of bond issue cost 12 12 12 — Advertising & public relations 2,339 1,351 2,188 73.1 6.9 Foreclosed property expense 1,625 1,971 4,202 (17.6) (61.3) Data processing, telecom & computer software 9,911 9,921 10,493 (0.1) (5.5) Amortization of intangibles 1,061 1,032 1,148 2.8 (7.6) Legal 1,998 7,681 3,002 (74.0) (33.4) Merger expense 4 (2) 1,010 NM NM Postage and shipping 1,194 1,172 1,116 1.9 7.0 Other miscellaneous expense 13,454 16,137 13,593 (16.6) (1.0) Total noninterest expense $ 128,178 $ 136,933 $ 127,954 (6.4) % 0.2 % Non-operating items: Merger expense $ 4 $ (2) $ 1,010 Total $ 4 $ (2) $ 1,010 Dollars in thousands NM – Not Meaningful 6
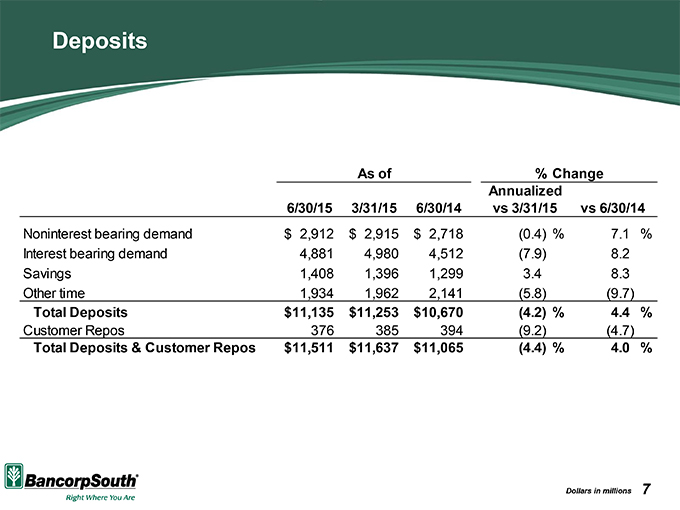
Deposits As of % Change Annualized 6/30/15 3/31/15 6/30/14 vs 3/31/15 vs 6/30/14 Noninterest bearing demand $ 2,912 $ 2,915 $ 2,718 (0.4) % 7.1 % Interest bearing demand 4,881 4,980 4,512 (7.9) 8.2 Savings 1,408 1,396 1,299 3.4 8.3 Other time 1,934 1,962 2,141 (5.8) (9.7) Total Deposits $ 11,135 $ 11,253 $ 10,670 (4.2) % 4.4 % Customer Repos 376 385 394 (9.2) (4.7) Total Deposits & Customer Repos $ 11,511 $ 11,637 $ 11,065 (4.4) % 4.0 % Dollars in millions 7
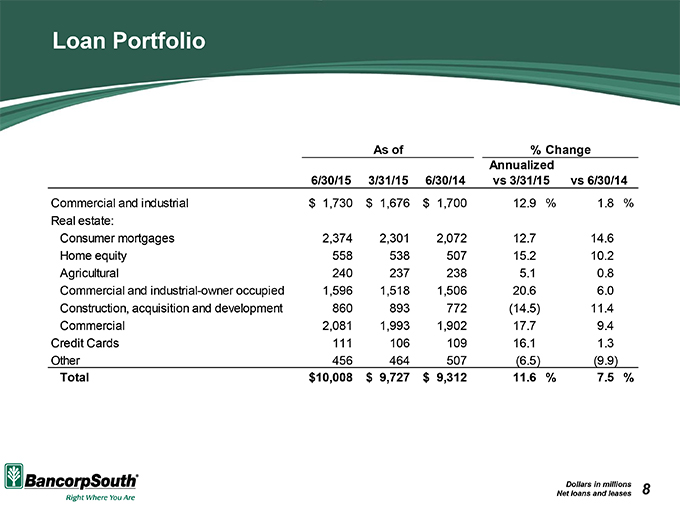
Loan Portfolio As of % Change Annualized 6/30/15 3/31/15 6/30/14 vs 3/31/15 vs 6/30/14 Commercial and industrial $ 1,730 $ 1,676 $ 1,700 12.9 % 1.8 % Real estate: Consumer mortgages 2,374 2,301 2,072 12.7 14.6 Home equity 558 538 507 15.2 10.2 Agricultural 240 237 238 5.1 0.8 Commercial and industrial-owner occupied 1,596 1,518 1,506 20.6 6.0 Construction, acquisition and development 860 893 772 (14.5) 11.4 Commercial 2,081 1,993 1,902 17.7 9.4 Credit Cards 111 106 109 16.1 1.3 Other 456 464 507 (6.5) (9.9) Total $ 10,008 $ 9,727 $ 9,312 11.6 % 7.5 % Dollars in millions Net loans and leases 8
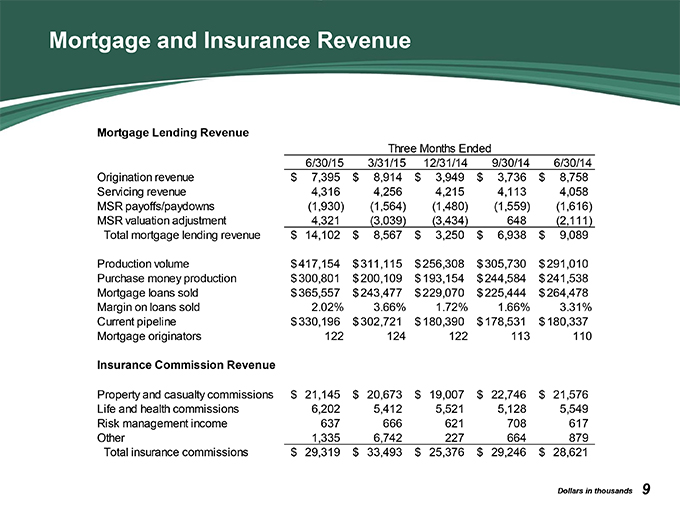
Mortgage and Insurance Revenue Mortgage Lending Revenue Three Months Ended 6/30/15 3/31/15 12/31/14 9/30/14 6/30/14 Origination revenue $ 7,395 $ 8,914 $ 3,949 $ 3,736 $ 8,758 Servicing revenue 4,316 4,256 4,215 4,113 4,058 MSR payoffs/paydowns (1,930) (1,564) (1,480) (1,559) (1,616) MSR valuation adjustment 4,321 (3,039) (3,434) 648 (2,111) Total mortgage lending revenue $ 14,102 $ 8,567 $ 3,250 $ 6,938 $ 9,089 Production volume $ 417,154 $ 311,115 $ 256,308 $ 305,730 $ 291,010 Purchase money production $ 300,801 $ 200,109 $ 193,154 $ 244,584 $ 241,538 Mortgage loans sold $ 365,557 $ 243,477 $ 229,070 $ 225,444 $ 264,478 Margin on loans sold 2.02% 3.66% 1.72% 1.66% 3.31% Current pipeline $ 330,196 $ 302,721 $ 180,390 $ 178,531 $ 180,337 Mortgage originators 122 124 122 113 110 Insurance Commission Revenue Property and casualty commissions $ 21,145 $ 20,673 $ 19,007 $ 22,746 $ 21,576 Life and health commissions 6,202 5,412 5,521 5,128 5,549 Risk management income 637 666 621 708 617 Other 1,335 6,742 227 664 879 Total insurance commissions $ 29,319 $ 33,493 $ 25,376 $ 29,246 $ 28,621 Dollars in thousands 9
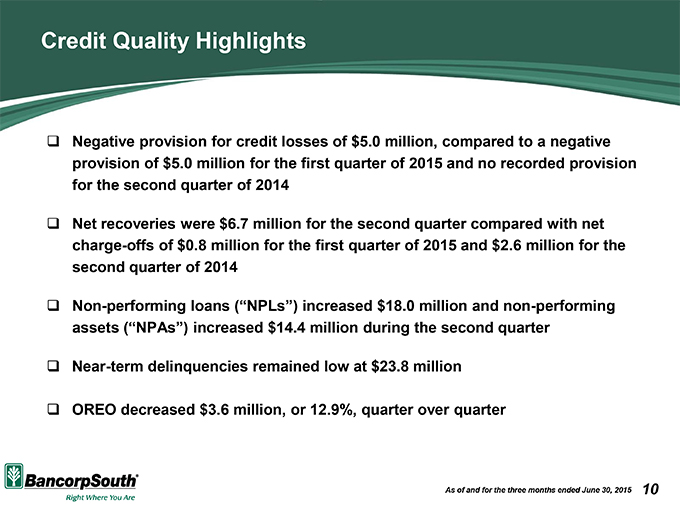
Credit Quality Highlights Negative provision for credit losses of $5.0 million, compared to a negative provision of $5.0 million for the first quarter of 2015 and no recorded provision for the second quarter of 2014 Net recoveries were $6.7 million for the second quarter compared with net charge-offs of $0.8 million for the first quarter of 2015 and $2.6 million for the second quarter of 2014 Non-performing loans (“NPLs”) increased $18.0 million and non-performing assets (“NPAs”) increased $14.4 million during the second quarter Near-term delinquencies remained low at $23.8 million OREO decreased $3.6 million, or 12.9%, quarter over quarter As of and for the three months ended June 30, 2015 10
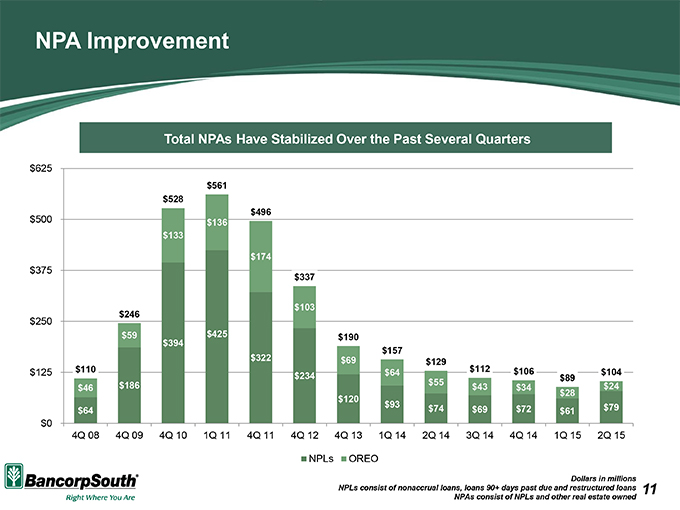
NPA Improvement Total NPAs Have Stabilized Over the Past Several Quarters Dollars in millions NPLs consist of nonaccrual loans, loans 90+ days past due and restructured loans NPAs consist of NPLs and other real estate owned 11
Summary Highlights Continued improvement in profitability Meaningful loan growth Improvement in efficiency Current Focus Continue to grow – loans, deposits, and fee revenue sources Challenge expenses and continue to improve efficiency Q&A 12
Serious News for Serious Traders! Try StreetInsider.com Premium Free!
You May Also Be Interested In
- ContextLogic Completes Sale of Substantially All Operating Assets and Liabilities Associated with Wish to Qoo10
- Armenian Political Prisoner Initiates Hunger Strike in Baku, According to Free Armenian Prisoners
- FluroTech and GS Heli Announce Execution of Definitive Agreement
Create E-mail Alert Related Categories
SEC FilingsSign up for StreetInsider Free!
Receive full access to all new and archived articles, unlimited portfolio tracking, e-mail alerts, custom newswires and RSS feeds - and more!
