Form 8-K Ashford Inc. For: Nov 15
UNITED STATES
SECURITIES AND EXCHANGE COMMISSION
WASHINGTON, D.C. 20549
FORM 8-K
CURRENT REPORT
PURSUANT TO SECTION 13 OR 15(d) OF THE
SECURITIES EXCHANGE ACT OF 1934
Date of Report (date of earliest event reported): November 15, 2016
ASHFORD INC.
(Exact name of registrant as specified in its charter)
MARYLAND | 001-36400 | 46-5292553 | ||
(State or other jurisdiction of incorporation or organization) | (Commission File Number) | (IRS employer identification number) | ||
14185 Dallas Parkway, Suite 1100 | ||||
Dallas, Texas | 75254 | |||
(Address of principal executive offices) | (Zip code) | |||
Registrant’s telephone number, including area code: (972) 490-9600
Check the appropriate box if the Form 8-K filing is intended to simultaneously satisfy the filing obligation of the registrant under any of the following provisions:
¨ | Written communications pursuant to Rule 425 under the Securities Act (17 CFR 230.425) | |
¨ | Soliciting material pursuant to Rule 14a-12 under the Exchange Act (17 CFR 240.14a-12) | |
¨ | Pre-commencement communications pursuant to Rule 14d-2(b) under the Exchange Act (17 CFR 240.14d-2(b)) | |
¨ | Pre-commencement communications pursuant to Rule 13e-4(c) under the Exchange Act (17 CFR 240.13e-4(c)) | |
ITEM 7.01 REGULATION FD DISCLOSURE
Ashford Inc. is presenting a Powerpoint slideshow today to the investment community. The Powerpoint slideshow is attached hereto as Exhibit 99.1.
ITEM 9.01 FINANCIAL STATEMENTS AND EXHIBITS
(d) Exhibits
Exhibit Number | Description |
99.1 | Powerpoint slideshow presentation |
SIGNATURE
Pursuant to the requirements of Section 12 of the Securities Exchange Act of 1934, the registrant has duly caused this report to be signed on its behalf by the undersigned hereunto duly authorized.
Dated: November 15, 2016
ASHFORD INC.
By: /s/ David A. Brooks
David A. Brooks
Chief Operating Officer and General Counsel
Chief Operating Officer and General Counsel

Company Presentation – November 2016

2
In keeping with the SEC's "Safe Harbor" guidelines, certain statements made during this presentation could be
considered forward-looking and subject to certain risks and uncertainties that could cause results to differ
materially from those projected. When we use the words "will likely result," "may," "anticipate," "estimate,"
"should," "expect," "believe," "intend," or similar expressions, we intend to identify forward-looking statements.
Such forward-looking statements include, but are not limited to, our business and investment strategy, our
understanding of our competition, current market trends and opportunities, projected operating results, and
projected capital expenditures.
These forward-looking statements are subject to known and unknown risks and uncertainties, which could cause
actual results to differ materially from those anticipated including, without limitation: general volatility of the
capital markets and the market price of our common stock; changes in our business or investment strategy;
availability, terms and deployment of capital; availability of qualified personnel; changes in our industry and the
market in which we operate, interest rates or the general economy, the degree and nature of our competition,
and the satisfaction of the conditions to the completion of the proposed combination of Ashford Inc. with
Remington Holdings L.P. These and other risk factors are more fully discussed in each company's filings with the
Securities and Exchange Commission.
EBITDA is defined as net income before interest, taxes, depreciation and amortization. EBITDA yield is defined as
trailing twelve month EBITDA divided by the purchase price. A capitalization rate is determined by dividing the
property's net operating income by the purchase price. Net operating income is the property's funds from
operations minus a capital expense reserve of either 4% or 5% of gross revenues. Hotel EBITDA flow-through is the
change in Hotel EBITDA divided by the change in total revenues. EBITDA, FFO, AFFO, CAD and other terms are
non-GAAP measures, reconciliations of which have been provided in prior earnings releases and filings with the
SEC.
This overview is for informational purposes only and is not an offer to sell, or a solicitation of an offer to buy or sell,
any securities of Ashford Hospitality Trust, Inc., Ashford Hospitality Prime, Inc., Ashford Inc., or any of their
respective affiliates, and may not be relied upon in connection with the purchase or sale of any such security.
Safe Harbor
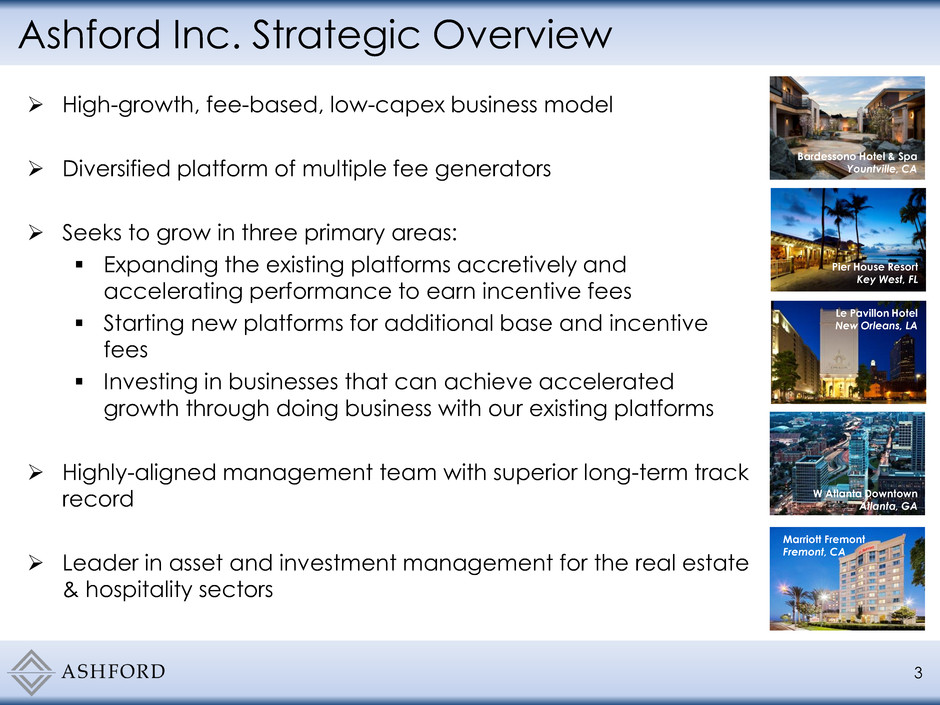
Ashford Inc. Strategic Overview
3
Bardessono Hotel & Spa
Yountville, CA
Pier House Resort
Key West, FL
W Atlanta Downtown
Atlanta, GA
Marriott Fremont
Fremont, CA
Le Pavillon Hotel
New Orleans, LA
High-growth, fee-based, low-capex business model
Diversified platform of multiple fee generators
Seeks to grow in three primary areas:
Expanding the existing platforms accretively and
accelerating performance to earn incentive fees
Starting new platforms for additional base and incentive
fees
Investing in businesses that can achieve accelerated
growth through doing business with our existing platforms
Highly-aligned management team with superior long-term track
record
Leader in asset and investment management for the real estate
& hospitality sectors

Ashford Inc. Overview
4
- Publicly Traded (NYSE:
AHP)
- 11 hotels – 3,467 owned
rooms
- Total Market Cap of $1.2
billion
- High RevPAR portfolio
- Luxury hotels
- Gateway and resort
markets
- Conservative leverage
- Insider ownership: 16%
- Publicly Traded (NYSE:
AHT)
- 123 hotels – 25,986
owned rooms
- Total Market Cap of $4.8
billion
- Targets RevPAR below
Ashford Prime
- Investment across full-
service and upper-
upscale hotels
- Opportunistic leverage
- Insider ownership: 18%
- 89 properties – 17,411
managed rooms
- Assets located in 28
states and Washington,
D.C.
- Managed properties are
either branded by one of
five major franchisors or
operated independently
- Typical term of
agreements (includes
renewals) – 35 years
- Project managed over
$1 billion of
development,
renovations & other
projects
- Experience with every
major brand in
renovating, converting or
repositioning hotels
Real Estate Asset Management Real Estate Services
Property Management Project Management
Proposed Combination Long-Term Agreements
All data as of November 3, 2016

Base Fee/Minimum Fee
Base Fee: 0.70% x Total Market Capitalization
Minimum Fee: Greater of 90% of the Base Fee paid in the same quarter of the
prior year OR the Peer G&A Ratio x Total Market Capitalization
Payable quarterly
Incentive Fee
5% of the TSR outperformance (compared to defined peer set) times Equity
Market Capitalization – fee is subject to a 25% outperformance cap
Incentive Fee Payment
Fee is determined annually and paid over 3 years in equal annual installments
- up to 50% can be paid in stock at AHT/AHP election
Other Payments/Fees Reimbursement for internal audit and other overhead costs
Long-Term Advisory Agreements
5

67%
-29% -28%
100% 91%
15%
59%
36%
111%
30%
73%
401%
237%
20%
42% 39%
-100%
-50%
0%
50%
100%
150%
200%
250%
300%
350%
400%
450%
Inception 10-Yr 9-Yr 8-Yr 7-Yr 6-Yr 5-Yr 4-Yr
Peer Avg AHT
Demonstrated Long-Term Track Record
6
(1) Since IPO on August 26, 2003
Peer average includes: CHSP, CLDT, DRH, FCH, HST, HT, INN, LHO, RLJ, SHO
Returns as of 11/3/16
Source: SNL
Total Shareholder Return
Long-term performance
significantly outperforms
peers
(1)

Ashford Hospitality Prime Overview
Bardessono Hotal & Spa
Yountville, CA

Ashford Hospitality Prime
8
Focused strategy of
investing in luxury
hotels in resort and
gateway markets
Bardessono Hotel & Spa
Yountville, CA
Pier House Resort
Key West, FL
The Ritz-Carlton St. Thomas
St. Thomas, USVI
Grow platform
through accretive
acquisitions of high
quality assets
Highly-aligned
management team
and advisory
structure
Simple and
straightforward
investment profile
Grow organically
through strong
revenue and cost
control initiatives
Targets conservative
leverage levels of Net
Debt/EBITDA of 5.0x or
less

9
Excellent Progress on Strategic Alternatives
Appointed Richard J. Stockton as new
CEO effective November 14, 2016
Added Ken Fearn as an independent
director
Since April 8, 2016 we have bought
back approximately 2.9 million shares
for $39 million
Investment has been redeemed
Increased dividend 20% to $0.12
Courtyard Seattle sold for $84.5 million
at 6.8% TTM NOI cap rate
Increase dividend
WHAT WE SAID WE WOULD DO
Sell up to 4 non-strategic hotels
Liquidate investment fund
$50 million stock repurchase program
Add 2 independent directors
Appoint new CEO
WHAT WE HAVE DONE

High Quality Portfolio
10 Ashford Prime Hotels
Marriott Seattle
Seattle, WA
Hilton Torrey Pines
La Jolla, CA
Bardessono Hotel & Spa
Yountville, CA
Pier House Resort
Key West, FL
Renaissance Tampa
Tampa, FL
Courtyard Philadelphia
Philadelphia, PA
Capital Hilton
Washington D.C.
Courtyard San Francisco
San Francisco, CAz Renaissance Tampa
Tampa, FL
Courtyard Philadelphia
Philadelphia, PA
apital Hilton
ashington . .
Marriott Plano Legacy
Plano, TX
The Ritz-Carlton St. Thomas
St. Thomas, USVI
Sofitel Chicago Magnificent Mile
Chicago, IL
Portfolio Overview
11
(1) As of September 30, 2016
(2) Wells Fargo Securities Research; Lodging: TripAdvisor Rankings (September 14, 2016)
Note: Hotel EBITDA in thousands
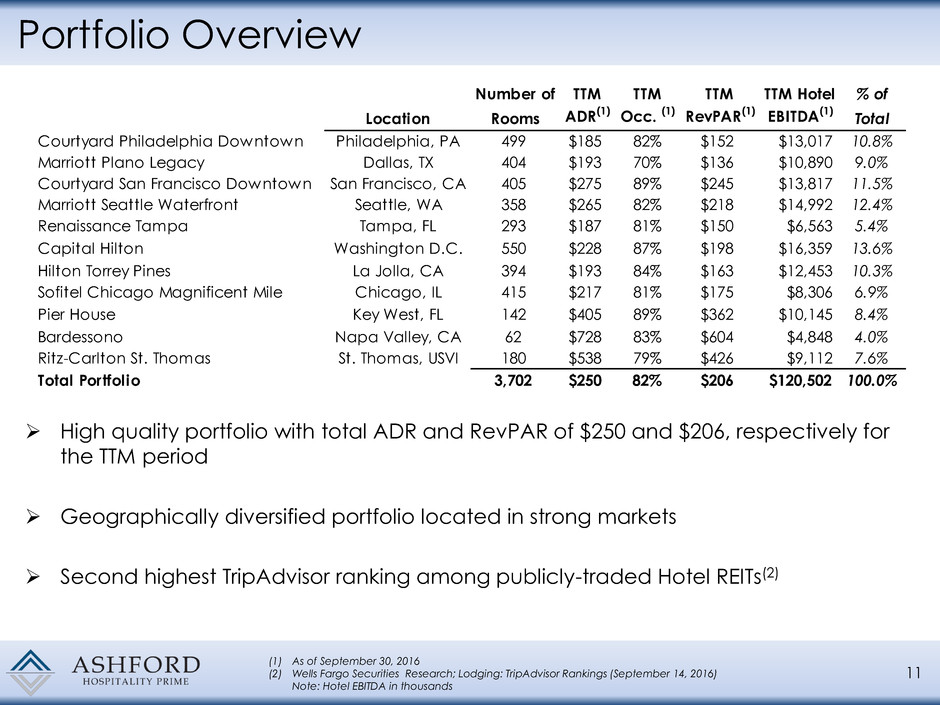
High quality portfolio with total ADR and RevPAR of $250 and $206, respectively for
the TTM period
Geographically diversified portfolio located in strong markets
Second highest TripAdvisor ranking among publicly-traded Hotel REITs(2)
Number of TTM TTM TTM TTM Hotel % of
Location Rooms ADR
(1) Occ. (1) RevPAR(1) EBITDA(1) Total
Courtyard Philadelphia Downtown Philadelphia, PA 499 $185 82% $152 $13,017 10.8%
Marriott Plano Legacy Dallas, TX 404 $193 70% $136 $10,890 9.0%
Courtyard San Francisco Downtown San Francisco, CA 405 $275 89% $245 $13,817 11.5%
Marriott Seattle Waterfront Seattle, WA 358 $265 82% $218 $14,992 12.4%
Renaissance Tampa Tampa, FL 293 $187 81% $150 $6,563 5.4%
Capital Hilton Washington D.C. 550 $228 87% $198 $16,359 13.6%
Hilton Torrey Pines La Jolla, CA 394 $193 84% $163 $12,453 10.3%
Sofitel Chicago Magnificent Mile Chicago, IL 415 $217 81% $175 $8,306 6.9%
Pier House Key West, FL 142 $405 89% $362 $10,145 8.4%
Bardessono Napa Valley, CA 62 $728 83% $604 $4,848 4.0%
Ritz-Carlton St. Thomas St. Thomas, USVI 180 $538 79% $426 $9,112 7.6%
Total Portfolio 3,702 $250 82% $206 $120,502 100.0%

Capital Structure and Net Working Capital
Conservative leverage in line with platform strategy
Targeted Net Debt / EBITDA of 5.0x
All debt is non-recourse, property level mortgage debt
Targeted cash balance of 25% to 30% of market capitalization
Maintain excess cash balance to capitalize on opportunities
Hedge unfavorable economic shocks
Dry powder to execute opportunistic acquisitions
12
Total Enterprise Value Net Working Capital
Figures in millions except per share values
Stock Price (As of November 3, 2016) $12.39
Fully Diluted Shares Outstanding 30.4
Equity Value $376.9
Plus: Convertible Preferred Equity 72.3
Plus: Deb 712.5
Total Market Capitalization $1,161.6
Less: Net Working Capital (145.1)
Total Enterprise Value $1,016.5
Cash & Cash Equivalents $126.0
Restricted Cash 39.3
Accounts Receivable, net 16.1
Prepaid Expenses 4.2
Due From Affiliates, net (2.8)
Due f om Third Party Hotel Managers 5.7
Investment in Ashford Inc. (1) 9.3
Total Current Assets $197.8
Accounts Payable, net & Accrued Expenses $47.8
Dividends Payable 4.9
Total Current Liabilities $52.7
Net Working Capital $145.1
As of September 30, 2016
(1) At market value as of November 3, 2016

Ashford Hospitality Trust Overview
W Atlanta Downtown
Atlanta, GA
Ashford Hospitality Trust
14
ord Hospitality
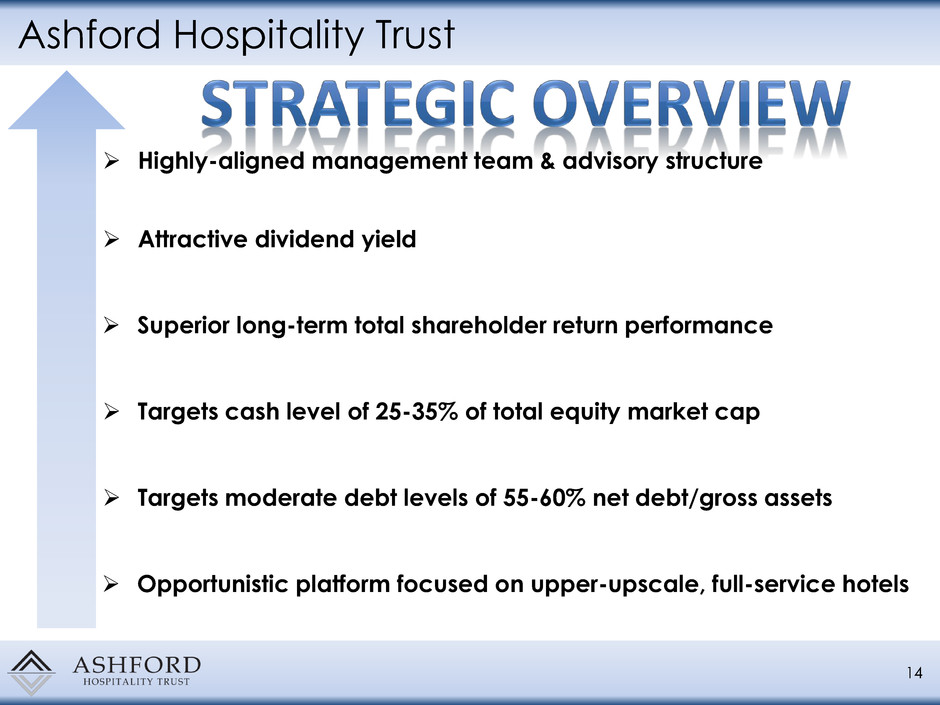
Opportunistic platform focused on upper-upscale, full-service hotels
Attractive dividend yield
Targets moderate debt levels of 55-60% net debt/gross assets
Targets cash level of 25-35% of total equity market cap
Superior long-term total shareholder return performance
Highly-aligned management team & advisory structure

15 Ashford Trust Hotels
High Quality, Geographically Diverse Portfolio
Le Pavillon Hotel
New Orleans, LA
Lakeway Resort & Spa
Austin, TX
Hilton Costa Mesa
Costa Mesa, CA
Marriott Fremont
Fremont, CA
Le Meridien Minneapolis
Minneapolis, MN Chicago Silversmith
Chicago, IL
Hilton Back Bay
Boston, MA
The Churchill
Washington, D.C.
W Atlanta Downtown
Atlanta, GA
Crowne Plaza Key West
Key West, FL
Marriott Sugar Land
Sugar Land, TX
Hilton Santa Fe
Santa Fe, NM
Renaissance Nashville
Nashville, TN
Westin Princeton
Princeton, NJ
Marriott Beverly Hills
Beverly Hills, CA
Embassy Suites Portland
Portland, OR
Marriott Gateway
Arlington, VA
Portfolio Overview
16
Top 25
73%
Top 50
18%
Other
9%
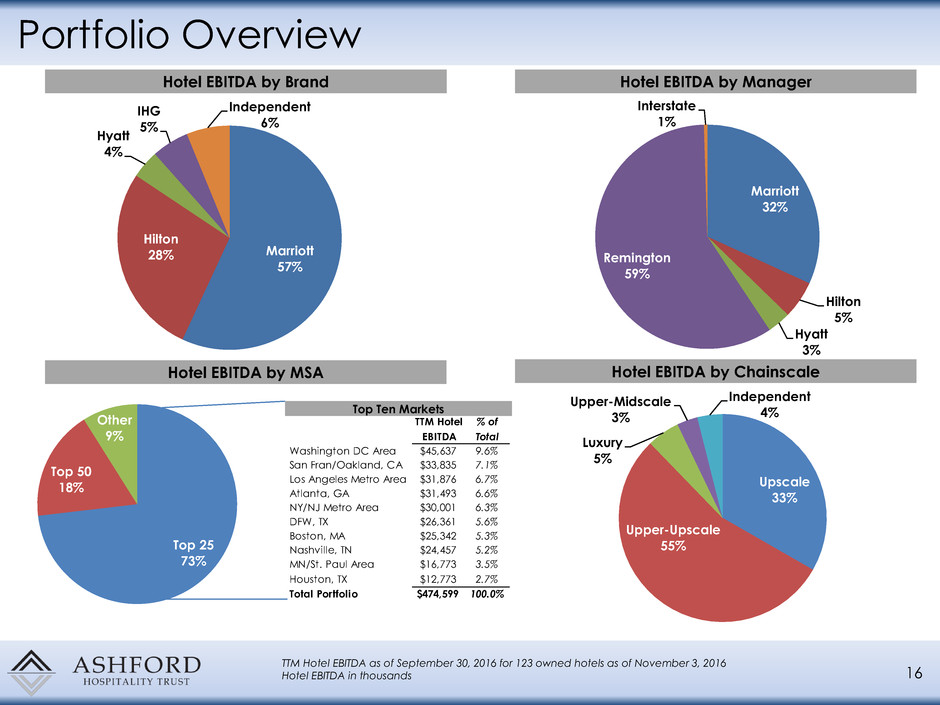
TTM Hotel EBITDA as of September 30, 2016 for 123 owned hotels as of November 3, 2016
Hotel EBITDA in thousands
Hotel EBITDA by Brand Hotel EBITDA by Manager
Hotel EBITDA by MSA Hotel EBITDA by Chainscale
Top Ten Markets
Marriott
57%
Hilton
28%
Hyatt
4%
IHG
5%
Independent
6%
Marriott
32%
Hilton
5%
Hyatt
3%
Remington
59%
Interstate
1%
Upscale
33%
Upper-Upscale
55%
Luxury
5%
Upper-Midscale
3%
Independent
4%
TTM Hotel % of
EBITDA Total
Washington DC Area $45,637 9.6%
San Fran/Oakland, CA $33,835 7.1%
Los Angeles Metro Area $31,876 6.7%
Atlanta, GA $31,493 6.6%
NY/NJ Metro Area $30,001 6.3%
DFW, X $26,361 5.6%
Boston, MA $25,342 5.3%
Nashville, TN $24,457 5.2%
MN/St. Paul Area $16,773 3.5%
Houston, TX $12,773 2.7%
Total Portfolio $474,599 100.0%
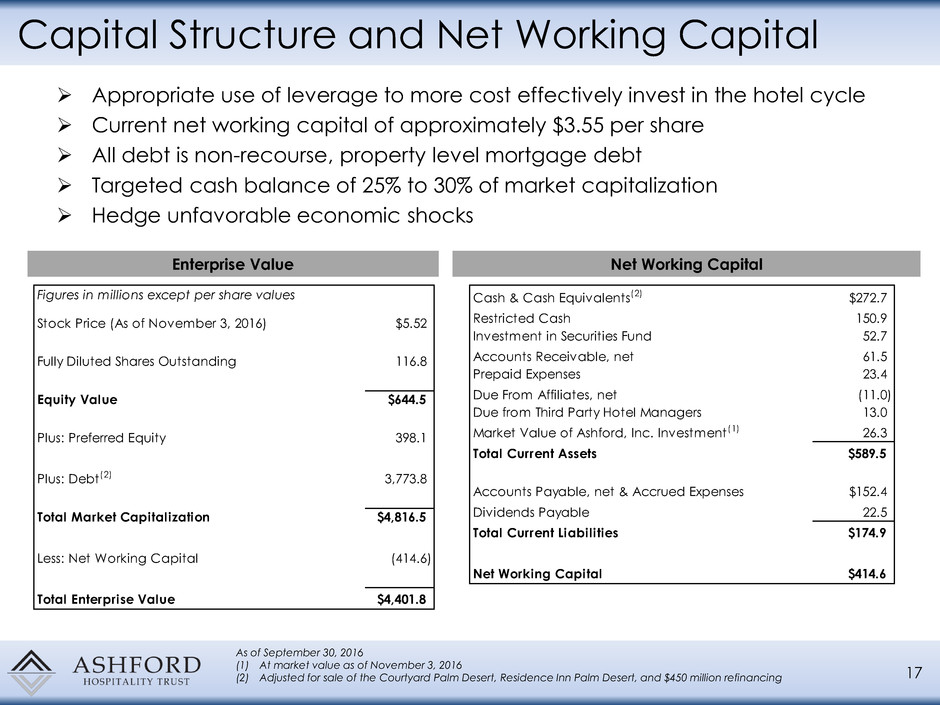
Capital Structure and Net Working Capital
Appropriate use of leverage to more cost effectively invest in the hotel cycle
Current net working capital of approximately $3.55 per share
All debt is non-recourse, property level mortgage debt
Targeted cash balance of 25% to 30% of market capitalization
Hedge unfavorable economic shocks
17
Enterprise Value Net Working Capital
As of September 30, 2016
(1) At market value as of November 3, 2016
(2) Adjusted for sale of the Courtyard Palm Desert, Residence Inn Palm Desert, and $450 million refinancing
Figures in millions except per share values
Stock Price (As of November 3, 2016) $5.52
Fully Diluted Shares Outstanding 116.8
Equity Value $644.5
Plus: Preferred Equity 398.1
Plus: Debt(2) 3,773.8
Total Market Capitalization $4,816.5
Less: Net Working Capital (414.6)
Total Enterprise Value $4,401.8
Cash & Cash Equivalents(2) $272.7
Restricted Cash 150.9
Investment in Securities Fund 52.7
Accounts Receivable, net 61.5
Prepaid Expenses 23.4
Due From Affiliates, net (11.0)
Due from Third Party Hotel Managers 13.0
Market Value of Ashford, Inc. Investment(1) 26.3
Total Current Assets $589.5
Accounts Payable, net & Accrued Expenses $152.4
Dividends Payable 22.5
Total Current Liabilities $174.9
Net Working Capital $414.6

Proposed Remington Combination Overview
AINC has entered into an agreement to combine with Remington(1) for total
transaction value of $299.5 million
916,500 subsidiary nonvoting common shares issued at $100 per share
(current market value of $59.5 million)
$230 million in subsidiary convertible preferred stock
• 6.625% yield
• $120 conversion price (85% premium)(2)
$10 million cash consideration(3)
Remington sellers retain 20% of Remington through limited partner interests
AINC to create new subsidiary (“NewCo”) & contribute all assets to NewCo
Securities issued to sellers will be NewCo securities, but are intended to be
economically equivalent to AINC securities
NewCo stock will be issued to sellers at 54% premium to pre-announcement
market price of AINC stock(2) and 127% premium to current market price(4)
Sellers only taking 3% of the consideration in cash signifying strong belief in
future prospects for AINC & Remington
18
(1) Remington Holdings LP and its affiliates. A 20% interest in Remington Holdings will be retained by the current owners.
(2) Based on closing stock price of AINC as of September 17, 2015
(3) Paid out quarterly over 4 years
(4) Based on closing stock price of AINC as of November 3, 2016

Proposed Remington Combination Overview (cont.)
Attractive valuation relative to the intrinsic
value of the business and recent
comparable transactions
Subsidiary common shares issued at $100
per share, a 54% premium to pre-
announcement market price of AINC(1)
and 127% premium to current market
price(2)
Subsidiary as-converted shares issued at
85% premium to pre-announcement
market price of AINC(1)
Very little cash consideration for large
transformational combination signifying
strong belief by the sellers in the future
growth prospects for AINC and Remington
19
(1) Based on closing stock price of AINC as of September 17, 2015
(2) Based on closing stock price of AINC as of November 3, 2016
Financial Benefits Strategic Benefits
Adds incremental incentive fees which are
tied to property performance, not strictly
shareholder returns, as is currently the case
for AINC
Adds talented executives to help lead
AINC’s growing platform
Enhances strong alignment of sellers
through issuance of non-voting common
equity and convertible preferred equity
Combination creates the only public,
pure-play provider of asset and property
management services to the lodging
industry

OpenKey Update
OpenKey is a universal smartphone app for keyless entry
into hotel guestrooms
Secure interfaces with many global lock manufacturers,
including four of the largest: Assa Abloy, Kaba, Salto, and
Miwa
OpenKey has also begun to work with Hotek, a Bluetooth
lock upgrade company
20
Installed in three of Ashford Trust’s hotels and are in the process of considering more
60,000 hotel rooms in the immediate pipeline outside of Ashford hotels
Contracted 409 rooms, 674 rooms, and 4,328 rooms in the first, second, and third quarters,
respectively
Recently launched a white-label platform allowing hotels and brands to use their own imagery
on top of the OpenKey software
Expected property level cost savings through labor efficiencies, replacement of RFID cards, and
decreased customer acquisition costs

Balance Sheet
21 As of September 30, 2016
Asset light business model
Cash available for investments
Currently no debt
Corporate cash of $26.3 million
Figures in millions
ASSETS
Cash & Cash Equivalents $79.6
Restricted Cash 10.1
Investments in Securities 7.2
Receivables 0.0
Prepaid Expenses and Other 0.9
Due from Ashford Trust OP 6.2
Due from Ashford Prime OP 1.6
Total Current Assets $105.7
Investments in Unconsolidated Affiliates $0.5
Furniture, Fixtures and Equipment, net 10.8
Deferred Tax Assets 5.0
Other Assets 4.0
Total Assets $126.0
LIABILITIES AND EQUITY
Accounts Payable, net & Accrued Expenses $10.2
Due to Affiliates 1.4
Liabilities Associated with Investments 0.0
Other Liabilities 10.1
Total Current Liabilities $21.7
Accrued Expenses $0.3
Deferred Income 3.6
Deferred Compensation Plan 10.0
Total Liabilities $35.6
Re eemable Noncrontrolling Interest $1.4
Equity $88.9
Total Liabilities and Equity $126.0

Key Takeaways
High growth, fee based business model
Asset light with very low capital requirements
Diversified fee generators
Strong management team with a long track record of
creating shareholder value
Highly-aligned platform through high insider
ownership
22

Company Presentation – November 2016
Serious News for Serious Traders! Try StreetInsider.com Premium Free!
You May Also Be Interested In
- The Honest Company to Report First Quarter Financial Results on May 8, 2024
- Arcus Biosciences to Present New Data from Phase 2 Studies of Novel Immuno-Oncology Combinations at the 2024 ASCO Annual Meeting
- Acrivon Therapeutics Reports Initial Positive Clinical Data for ACR-368 and Pipeline Program Progress Today at Corporate R&D Event
Create E-mail Alert Related Categories
SEC FilingsSign up for StreetInsider Free!
Receive full access to all new and archived articles, unlimited portfolio tracking, e-mail alerts, custom newswires and RSS feeds - and more!


 Tweet
Tweet Share
Share