

Form 8-K Alexander & Baldwin, For: Nov 02
 Tweet
Tweet Share
Share
UNITED STATES
SECURITIES AND EXCHANGE COMMISSION
Washington, D. C. 20549
______________
FORM 8-K
______________
CURRENT REPORT
Pursuant to Section 13 or 15(d) of the
Securities Exchange Act of 1934
Date of Report (Date of earliest event reported): November 2, 2016
ALEXANDER & BALDWIN, INC.
(Exact name of registrant as specified in its charter)
| Hawaii | 001-35492 | 45-4849780 |
| (State or other jurisdiction of incorporation) | (Commission File Number) |
(I.R.S. Employer Identification No.) |
822 Bishop Street, P. O. Box 3440
Honolulu, Hawaii 96801
(Address of principal executive office and zip code)
(808) 525-6611
(Registrant’s telephone number, including area code)
Not Applicable
(Former Name or Former Address, if Changed Since Last Report)
Check the appropriate box below if the Form 8-K filing is intended to simultaneously satisfy the filing obligation of the registrant under any of the following provisions (see General Instruction A.2.):
| o | Written communications pursuant to Rule 425 under the Securities Act (17 CFR 230.425) |
| o | Soliciting material pursuant to Rule 14a-12 under the Exchange Act (17 CFR 240.14a-12) |
| o | Pre-commencement communications pursuant to Rule 14d-2(b) under the Exchange Act (17 CFR 240.14d-2(b)) |
| o | Pre-commencement communications pursuant to Rule 13e-4(c) under the Exchange Act (17 CFR 240.13e-4(c)) |
Item 7.01. Regulation FD Disclosure.
On November 2, 2016, Alexander & Baldwin, Inc. (the “Company”) made available on its website its Supplemental Information, which provides certain supplemental operating and financial information for its operating segments for the three and nine months ended September 30, 2016 and 2015. A copy of this Supplemental Information is being furnished as Exhibit 99.1 to this report.
In connection with the previously announced November 2, 2016 presentation for investors hosted by the Company, to discuss its strategic direction, to be webcast at www.alexanderbaldwin.com, the Company will be using the presentation materials attached as Exhibit 99.2 to this report.
Statements in this Form 8-K and the attached exhibits that are not historical facts, including potential benefits, consequences and impact of a potential REIT conversion, are "forward-looking statements" within the meaning of the Private Securities Litigation Reform Act of 1995, that involve a number of risks and uncertainties that could cause actual results to differ materially from those contemplated by the relevant forward-looking statement. These forward-looking statements are not guarantees of future performance. This release should be read in conjunction with pages 17-29 of Alexander & Baldwin, Inc.’s 2015 Form 10-K and other filings with the SEC through the date of this release, which identify important factors that could affect the forward-looking statements in this release. We do not undertake any obligation to update our forward-looking statements.
These forward-looking statements include, but are not limited to, the Company’s plans regarding (i) the possibility of converting to a REIT and the timing thereof, and (ii) the potential advantages, benefits and impact of, and opportunities created by, converting to a REIT. Such forward-looking statements are subject to certain risks, uncertainties and assumptions, including prevailing market conditions and the following:
| • | There are a number of implementation and operational complexities to address before the Company decides whether to pursue a REIT conversion, including possible internal reorganizations. The Company can provide no assurance as to whether it will convert to a REIT. |
| • | REIT qualification involves the application of highly technical and complex provisions of the Internal Revenue Code of 1986, as amended, as well as various factual determinations not entirely within the Company’s control. If the Company determines to convert to a REIT, the Company cannot give assurance that it will so qualify or remain so qualified. |
| • | The Company can give no assurances that its board of directors will approve a conversion to a REIT, even if there are no impediments to such conversion. |
| • | The Company’s exploration of a potential REIT conversion may create a potential diversion in our management's attention from traditional business concerns. |
Item 9.01. Financial Statements and Exhibits.
| (d) | Exhibits |
| 99.1 | Alexander & Baldwin, Inc.’s Supplemental Information, for the three and nine months ended September 30, 2016 and 2015. | ||
| 99.2 | Slides related to presentation, November 2, 2016. | ||
SIGNATURE
Pursuant to the requirements of the Securities Exchange Act of 1934, as amended, the registrant has duly caused this report to be signed on its behalf by the undersigned hereunto duly authorized.
| Date: November 2, 2016 | |
| ALEXANDER & BALDWIN, INC. | |
| /s/ Paul K. Ito | |
| Paul K. Ito | |
| Senior Vice President, | |
| Chief Financial Officer and Treasurer |
Exhibit 99.1
Alexander & Baldwin, Inc.
Table of Contents

| Section | Page |
| Glossary of terms | 4-5 |
| Consolidated Balance Sheets | 6 |
| Consolidated Statements of Operations | 7 |
| Consolidated Condensed Statements of Cash Flows | 8 |
| Notes Payable & Long-Term Debt | 9 |
| Components of NAV | 10-11 |
| Property Report – Hawaii | 12 |
| Property Report - U.S. Mainland | 13 |
| Net Operating Income | 14 |
| Percent Occupancy | 15 |
| Commercial Real Estate Transactional Activity | 16 |
| Top Ten Tenants (In-Service Properties) Based Upon ABR | 17 |
| Lease Expiration Schedule | 18 |
| Commercial Portfolio Repositioning, Redevelopment & Development Summary | 19 |
| Active Development Projects | 20 |
| Landholdings as of September 30, 2016 | 21 |
| Materials & Construction Select Data | 22 |
| Statement on Management’s Use of Non-GAAP Financial Measures | 24 |
| Reconciliation of Net Income (Loss) Available to A&B Shareholders to Funds From Operations | 25 |
| Reconciliation of Consolidated Net Income (Loss) to EBITDA | 26 |
| Reconciliation of Materials & Construction Segment Operating Profit to EBITDA | 27 |
| Reconciliation of Commercial Real Estate Operating Profit to NOI (Non-GAAP) | 28 |
| Reconciliation of Commercial Real Estate Operating Profit to NOI Trailing 12 mos (Non-GAAP) |
29 |
Forward-Looking Statements
Statements in this Supplement that are not historical facts are “forward-looking statements,” within the meaning of the Private Securities Litigation Reform Act of 1995, that involve a number of risks and uncertainties that could cause actual results to differ materially from those contemplated by the relevant forward-looking statement. These forward-looking statements are not guarantees of future performance. This Supplement should be read in conjunction with pages 17-29 of Alexander & Baldwin, Inc.’s 2015 Form 10-K and other filings with the SEC through the date of this Supplement, which identify important factors that could affect the forward-looking statements in this Supplement. We do not undertake any obligation to update our forward-looking statements.
Basis of Presentation
The information contained in this Supplement does not purport to disclose all items required by accounting principles generally accepted in the United States of America (GAAP). The information contained in this Supplement is unaudited and should be read in conjunction with Alexander & Baldwin, Inc.’s 2015 Form 10-K and other filings with the SEC through the date of this Supplement.
| 2 |
Alexander & Baldwin, Inc.
Company Profile
Alexander & Baldwin, Inc. is a 146-year-old Hawaii company focused on creating value from its tremendous real estate assets.
| Assets1 | · | $1.1B portfolio of primarily Hawaii grocery-anchored strip retail commercial properties located in prime neighborhood locations across the state |
| · | Approximately $470M of active developments for sale on several major islands across the state | |
| · | 87,500 acres of land in Hawaii, making A&B the state’s fourth largest landowner | |
| · | Ownership of Hawaii’s largest materials and paving construction company |
| Hawaii-focused Strategy | · | Increase commercial real estate portfolio value and cash flow |
| · | Accelerate monetization of development pipeline | |
| · | Leverage strong Materials & Construction segment positioning | |
| · | Minimize sugar cessation costs and successfully transition HC&S lands to diversified agriculture | |
| · | Continue disciplined and prudent financial management |
| Team | · | Led by Chris Benjamin, A&B president & CEO and Lance Parker, A&B Properties president |
| · | Deep Hawaii market knowledge and network | |
| · | Reputation for integrity, performance and commitment to the community |
COMMERCIAL REAL ESTATE HIGHLIGHTS
| #1 | Strip retail centers owner in Hawaii ABR of $26.60 psf |
| 2.9M | Square feet of GLA in Hawaii |
TRADING HIGHLIGHTS
| ALEX | NYSE listed ticker symbol |
| 1.9B | Market capitalization |
| 129K | 3-month average trading volume |
| Indices | MID, DJUSRE, RTY |
1 Represents book value as of September 30, 2016.
| 3 |
Alexander & Baldwin, Inc.
Glossary of Terms
| Annualized Base Rent (ABR) | The current month's contractual rent multiplied by 12. |
| Backlog | Backlog represents the amount of revenue that Grace Pacific and Maui Paving, LLC, a 50-percent-owned unconsolidated affiliate, expect to realize on contracts awarded or government contracts in which the Grace Pacific has been confirmed to be the lowest bidder and formal communication of the award is perfunctory. |
| Earnings Before Interest, Taxes, Depreciation and Amortization(EBITDA) |
EBITDA is calculated for the Materials & Construction segment by adjusting consolidated segment operating profit (which excludes interest and tax expenses), as applicable, by adding back depreciation and amortization and subtracting income attributable to non-controlling interests. EBITDA is a Non-GAAP measure used by the Company in evaluating the operating performance on a consistent and comparable basis from period to period. The Company provides this information to investors as an additional means of evaluating the performance of the segment's ongoing core operations and should be not be viewed as a substitute for, or superior to, financial measures calculated in accordance with GAAP.
EBITDA is also presented for the Company on a consolidated basis. EBITDA is calculated by adjusting the Company’s consolidated net loss to exclude the impact of interest expense, income taxes, and depreciation and amortization. The Company provides this information to investors as an additional means of evaluating the performance of the Company’s operations and should be not be viewed as a substitute for, or superior to, financial measures calculated in accordance with GAAP. |
| NAREIT Funds From Operations (FFO) |
A supplemental measure of real estate company operating performance. It is computed by adjusting net income (loss) available to A&B shareholders computed in accordance with generally accepted accounting principles (GAAP) to add back depreciation and amortization of real estate assets and exclude extraordinary items and gains and losses on sales of commercial real estate. FFO is a Non-GAAP measure and should not be considered as an alternative to net income as an indication of the Company's performance and is not necessarily indicative of cash flow as a measure of liquidity or ability to pay dividends. It is, however, a meaningful, additional measure of operating performance primarily because it excludes the assumption that the value of real estate assets diminishes predictably over time, and because industry analysts have accepted it as a performance measure. Comparison of the Company's presentation of FFO to similarly titled measures for other real estate companies may not necessarily be meaningful due to possible differences in the calculation of the term.
Many publicly traded real estate industry peers are REITs and report operations using FFO as defined by the National Association of Real Estate Investment Trusts (“NAREIT”). Although we are not a REIT, management believes it is important to publish this measure to allow for easier comparison of our performance to our peers. A major difference between the A&B and its REIT peers is that A&B is a taxable entity and any taxable income generated likely results in payment of federal or state income taxes. REIT peers typically do not pay federal or state income taxes on their qualified REIT investments, but distribute a significant portion of their taxable income to shareholders. |
| GLA | Gross leasable area. |
| GAAP | Generally accepted accounting principles in the United States of America. |
| Occupancy | The percentage of square footage leased to gross leasable space. |
| 4 |
Alexander & Baldwin, Inc.
Glossary of Terms (continued)
| Net Operating Income | Net operating income (NOI) is a Non-GAAP measure derived from commercial real estate revenues (determined in accordance with GAAP, less straight-line rental adjustments) minus property operating expenses (determined in accordance with GAAP). NOI does not have any standardized meaning prescribed by GAAP, and therefore, may differ from definitions of NOI used by other companies. NOI should not be considered as an alternative to net income (determined in accordance with GAAP) as an indicator of the Company’s financial performance, or as an alternative to cash flow from operating activities as a measure of the Company’s liquidity. NOI is commonly used as a measure of operating performance because it is an indicator of the return on property investment, and provides a method of comparing property performance over time. NOI excludes general and administrative expenses, straight-line rental adjustments, interest income, interest expense, depreciation and amortization expense, and gains on sales of interests in real estate. The Company believes that the Leasing segment’s operating profit is the most directly comparable GAAP measurement to NOI. |
| Same-store | Properties that were owned throughout the entire duration of both periods under comparison, including stabilized properties. |
| Stabilized | A commercial property is considered stabilized when it either reaches 80% economic occupancy or 12 months following acquisition or construction completion. |
| Straight-line rent | GAAP requirement to average tenant rents over the life of the lease regardless of actual cash collected. |
| Year built | Year of most recent repositioning/redevelopment or year built if no repositioning/redevelopment has occurred. |
| 5 |
Alexander & Baldwin, Inc.
Consolidated Balance Sheets (Unaudited)
($ in millions)
| ASSETS | September 30, 2016 | December 31, 2015 | ||||||
| Current Assets: | ||||||||
| Cash and cash equivalents | $ | 5.8 | $ | 1.3 | ||||
| Accounts and other notes receivable, net | 38.4 | 38.6 | ||||||
| Contracts retention | 12.4 | 11.5 | ||||||
| Costs and estimated earnings in excess of billings on uncompleted contracts | 16.6 | 16.3 | ||||||
| Inventories | 47.3 | 55.9 | ||||||
| Income tax receivable | 11.5 | 14.0 | ||||||
| Prepaid expenses and other assets | 12.6 | 14.9 | ||||||
| Total current assets | 144.6 | 152.5 | ||||||
| Investments in affiliates | 430.8 | 416.4 | ||||||
| Real estate developments | 192.6 | 183.5 | ||||||
| Property, plant & equiptment – net | 1,256.1 | 1,269.4 | ||||||
| Intangible assets - net | 55.8 | 54.4 | ||||||
| Goodwill | 102.3 | 102.3 | ||||||
| Other assets | 42.0 | 63.8 | ||||||
| Total assets | $ | 2,224.2 | $ | 2,242.3 | ||||
| LIABILITIES AND EQUITY | ||||||||
| Current Liabilities: | ||||||||
| Notes payable and current portion of long-term debt | $ | 82.4 | $ | 90.4 | ||||
| Accounts payable | 30.1 | 35.5 | ||||||
| Billings in excess of costs and estimated earnings on uncompleted contracts | 2.7 | 2.6 | ||||||
| Accrued interest | 3.9 | 5.5 | ||||||
| Indemnity holdback related to Grace acquisition | 9.3 | 9.3 | ||||||
| HC&S cessation related liabilities - current | 16.9 | 6.4 | ||||||
| Accrued and other liabilities | 36.2 | 35.0 | ||||||
| Total current liabilities | 181.5 | 184.7 | ||||||
| Long-term Liabilities: | ||||||||
| Long-term debt | 523.9 | 496.6 | ||||||
| Deferred income taxes | 184.2 | 202.1 | ||||||
| Accrued pension and postretirement benefits | 58.6 | 59.7 | ||||||
| Other non-current liabilities | 49.6 | 60.5 | ||||||
| Total long-term liabilities | 816.3 | 818.9 | ||||||
| Commitments and Contingencies | ||||||||
| Redeemable Noncontrolling Interest | 11.6 | 11.6 | ||||||
| Equity: | ||||||||
| Common stock | 1,156.2 | 1,151.7 | ||||||
| Accumulated other comprehensive loss | (43.8 | ) | (45.3 | ) | ||||
| Retained earnings | 98.7 | 117.2 | ||||||
| Total A&B shareholders' equity | 1,211.1 | 1,223.6 | ||||||
| Noncontrolling interest | 3.7 | 3.5 | ||||||
| Total equity | 1,214.8 | 1,227.1 | ||||||
| Total liabilities and equity | $ | 2,224.2 | $ | 2,242.3 | ||||
| 6 |
Alexander & Baldwin, Inc.
Consolidated Statements of Operations (Unaudited)
($
in millions, except per-share amounts)
| Three Months Ended | Nine Months Ended | |||||||||||||||
| September 30, | September 30, | |||||||||||||||
| 2016 | 2015 | 2016 | 2015 | |||||||||||||
| Operating revenue: | ||||||||||||||||
| Commercial Real Estate | $ | 32.9 | $ | 33.0 | $ | 102.3 | $ | 100.5 | ||||||||
| Real Estate Development and Sales | 12.8 | 19.9 | 13.4 | 87.8 | ||||||||||||
| Materials and Construction | 52.1 | 51.0 | 144.8 | 165.3 | ||||||||||||
| Agribusiness | 40.9 | 40.8 | 89.7 | 95.5 | ||||||||||||
| Total operating revenue | 138.7 | 144.7 | 350.2 | 449.1 | ||||||||||||
| Operating costs and expenses: | ||||||||||||||||
| Cost of Commercial Real Estate | 19.4 | 20.8 | 60.3 | 61.3 | ||||||||||||
| Cost of Real Estate Development and Sales | 3.1 | 6.7 | 3.3 | 47.4 | ||||||||||||
| Cost of Construction contracts and Materials | 41.0 | 40.7 | 114.9 | 134.1 | ||||||||||||
| Cost of Agribusiness revenues | 38.8 | 49.8 | 87.6 | 107.1 | ||||||||||||
| Selling, general and administrative | 14.7 | 12.6 | 42.6 | 41.3 | ||||||||||||
| REIT evaluation costs | 1.9 | - | 3.8 | - | ||||||||||||
| HC&S cessation costs | 17.6 | - | 51.6 | - | ||||||||||||
| Gain on the sale of improved property | - | - | (8.0 | ) | (1.9 | ) | ||||||||||
| Total operating costs and expenses | 136.5 | 130.6 | 356.1 | 389.3 | ||||||||||||
| Operating income (loss) | 2.2 | 14.1 | (5.9 | ) | 59.8 | |||||||||||
| Other income and (expense): | ||||||||||||||||
| Income related to joint ventures | 0.1 | 2.9 | 3.5 | 30.7 | ||||||||||||
| Reductions in solar investments | (0.2 | ) | (0.1 | ) | (9.7 | ) | (1.7 | ) | ||||||||
| Interest income and other | 0.5 | 0.4 | 1.6 | 0.8 | ||||||||||||
| Interest expense | (6.4 | ) | (6.5 | ) | (20.1 | ) | (20.2 | ) | ||||||||
| Income (loss) before income taxes | (3.8 | ) | 10.8 | (30.6 | ) | 69.4 | ||||||||||
| Income tax expense (benefit) | (2.4 | ) | 3.8 | (21.6 | ) | 26.4 | ||||||||||
| Net income (loss) | (1.4 | ) | 7.0 | (9.0 | ) | 43.0 | ||||||||||
| Income attributable to noncontrolling interest | (0.5 | ) | (0.3 | ) | (1.1 | ) | (1.2 | ) | ||||||||
| Net income (loss) attributable to A&B | $ | (1.9 | ) | $ | 6.7 | $ | (10.1 | ) | $ | 41.8 | ||||||
| Earnings (loss) per share: | ||||||||||||||||
| Basic - Net income (loss) available to A&B shareholders | $ | (0.03 | ) | $ | 0.11 | $ | (0.19 | ) | $ | 0.83 | ||||||
| Diluted - Net income (loss) available to A&B shareholders | $ | (0.03 | ) | $ | 0.11 | $ | (0.19 | ) | $ | 0.82 | ||||||
| Weighted average number of shares outstanding: | ||||||||||||||||
| Basic | 49.0 | 48.9 | 49.0 | 48.8 | ||||||||||||
| Diluted | 49.0 | 49.4 | 49.0 | 49.3 | ||||||||||||
| Supplemental information ($ in millions) | ||||||||||||||||
| EBITDA | $ | 31.3 | $ | 31.1 | $ | 73.0 | $ | 131.4 | ||||||||
| Operating profit | $ | 10.2 | $ | 22.2 | $ | 19.0 | $ | 107.0 | ||||||||
Note: See appendix for a statement about management’s use of Non-GAAP financial measures and required reconciliations.
| 7 |
Alexander & Baldwin, Inc.
Condensed Consolidated Statements of Cash Flows (Unaudited)
($ in millions)
| Nine Months Ended | ||||||||
| September 30, | ||||||||
| 2016 | 2015 | |||||||
| Cash flows from operating activities: | $ | 48.4 | $ | 115.3 | ||||
| Cash flows from investing activities: | ||||||||
| Capital expenditures for property, plant and equipment | (105.3 | ) | (34.9 | ) | ||||
| Capital expenditures related to 1031 commercial property transactions | (6.2 | ) | (1.3 | ) | ||||
| Proceeds from disposal of property and other assets | 11.4 | 5.1 | ||||||
| Proceeds from disposals related to 1031 commercial property transactions | 59.3 | 25.2 | ||||||
| Payments for purchases of investments in affiliates and investments | (36.0 | ) | (22.5 | ) | ||||
| Proceeds from investments in affiliates | 6.0 | 37.6 | ||||||
| Change in restricted cash associated with 1031 transactions | 16.2 | (2.7 | ) | |||||
| Net cash provided by (used in) investing activities | (54.6 | ) | 6.5 | |||||
| Cash flows from financing activities: | ||||||||
| Proceeds from issuance of long-term debt | 222.0 | 71.0 | ||||||
| Payments of long-term debt and deferred financing costs | (191.1 | ) | (182.1 | ) | ||||
| Payments under line-of-credit, net | (11.8 | ) | (0.4 | ) | ||||
| Distribution to noncontrolling interests | (0.5 | ) | (1.1 | ) | ||||
| Dividends paid | (8.8 | ) | (7.4 | ) | ||||
| (Tax withholding payments) proceeds from issuance of capital stock and other, net | 0.9 | (0.5 | ) | |||||
| Net cash provided by (used in) financing activities | 10.7 | (120.5 | ) | |||||
| Cash and cash equivalents: | ||||||||
| Net increase (decrease) for the year | 4.5 | 1.3 | ||||||
| Balance, beginning of year | 1.3 | 2.8 | ||||||
| Balance, end of year | $ | 5.8 | $ | 4.1 | ||||
| 8 |
Alexander & Baldwin, Inc.
Notes Payable & Long-Term Debt (Unaudited)
As of September 30, 2016
($ in millions, unaudited)
| Principal payments | ||||||||||||||||||||||||||||||||||||||||||||||||||||
| Debt: | Stated rate % | Weighted average interest rate | Maturity date | Weighted average maturity date (years) | 2016 | 2017 | 2018 | 2019 | 2020 | Thereafter | Total principal | Unamortized deferred financing cost/(discount) premium | Total | |||||||||||||||||||||||||||||||||||||||
| Secured Debt: | ||||||||||||||||||||||||||||||||||||||||||||||||||||
| Pearl Highlands | 4.15 | 4.15 | 2024 | 3.16 | $ | 0.5 | $ | 1.9 | $ | 1.9 | $ | 2.0 | $ | 2.1 | $ | 82.1 | $ | 90.5 | $ | - | $ | 90.5 | ||||||||||||||||||||||||||||||
| Midstate Hayes | 6.38 | 6.38 | 2017 | 0.05 | - | 8.2 | - | - | - | - | 8.2 | - | 8.2 | |||||||||||||||||||||||||||||||||||||||
| KTC III | (a) | 5.95 | 2021 | 0.25 | 0.1 | 0.2 | 0.2 | 0.3 | 0.3 | 9.7 | 10.8 | - | 10.8 | |||||||||||||||||||||||||||||||||||||||
| GLP Asphalt Plant | (b) | 5.95 | 2021 | 0.08 | 0.3 | 1.2 | 1.3 | 1.4 | 1.5 | 0.3 | 6.0 | - | 6.0 | |||||||||||||||||||||||||||||||||||||||
| Manoa Marketplace | (c) | 3.135 | 2029 | 3.27 | - | - | - | 0.7 | 1.6 | 57.7 | 60.0 | 0.3 | 59.7 | |||||||||||||||||||||||||||||||||||||||
| Kahala Avenue Lots | (d) | 3.15 | 2016 | 0.01 | 6.3 | - | - | - | - | - | 6.3 | - | 6.3 | |||||||||||||||||||||||||||||||||||||||
| The Shops at Kukuiula | (e) | 2.83 | 2016 | 0.04 | 35.2 | - | - | - | - | - | 35.2 | - | 35.2 | |||||||||||||||||||||||||||||||||||||||
| Subtotal | 6.86 | $ | 42.4 | $ | 11.5 | $ | 3.4 | $ | 4.4 | $ | 5.5 | $ | 149.8 | $ | 217.0 | $ | 0.3 | $ | 216.7 | |||||||||||||||||||||||||||||||||
| Unsecured Debt: | ||||||||||||||||||||||||||||||||||||||||||||||||||||
| Prudential Series A | 5.53 | 5.53 | 2024 | 0.49 | $ | - | $ | - | $ | - | $ | - | $ | - | $ | 28.5 | $ | 28.5 | $ | - | $ | 28.5 | ||||||||||||||||||||||||||||||
| Prudential Series B | 5.55 | 5.55 | 2026 | 0.96 | - | - | - | - | - | 46.0 | 46.0 | - | 46.0 | |||||||||||||||||||||||||||||||||||||||
| Prudential Series C | 5.56 | 5.56 | 2026 | 0.43 | - | - | 1.0 | 1.0 | 1.0 | 22.0 | 25.0 | - | 25.0 | |||||||||||||||||||||||||||||||||||||||
| Prudential Series D | 6.90 | 6.90 | 2020 | 0.46 | - | 16.3 | 16.3 | 16.2 | 16.2 | - | 65.0 | - | 65.0 | |||||||||||||||||||||||||||||||||||||||
| Prudential Series E | 3.90 | 3.90 | 2024 | 0.82 | 3.4 | 5.6 | 9.8 | 9.8 | 9.0 | 33.9 | 71.5 | - | 71.5 | |||||||||||||||||||||||||||||||||||||||
| Prudential Series F | 4.35 | 4.35 | 2026 | 0.42 | - | - | - | - | 2.4 | 19.6 | 22.0 | - | 22.0 | |||||||||||||||||||||||||||||||||||||||
| Prudential Series G | 3.88 | 3.88 | 2027 | 0.81 | - | - | 7.5 | 7.5 | 5.4 | 29.6 | 50.0 | 0.9 | 49.1 | |||||||||||||||||||||||||||||||||||||||
| Unsecured term note #1 | 3.31 | 3.31 | 2018 | 0.01 | 0.5 | 1.9 | 0.9 | - | - | - | 3.3 | - | 3.3 | |||||||||||||||||||||||||||||||||||||||
| Unsecured term note #2 | 2.00 | 2.00 | 2018 | 0.00 | 0.2 | 0.7 | 0.1 | - | - | - | 1.0 | - | 1.0 | |||||||||||||||||||||||||||||||||||||||
| Unsecured term note #3 | 2.65 | 2.65 | 2016 | - | 0.1 | - | - | - | - | - | 0.1 | - | 0.1 | |||||||||||||||||||||||||||||||||||||||
| Unsecured term note #4 | 5.19 | 5.19 | 2019 | 0.04 | 0.5 | 2.0 | 2.1 | 2.3 | - | - | 6.9 | - | 6.9 | |||||||||||||||||||||||||||||||||||||||
| Unsecured term note #5 | 1.85 | 1.85 | 2017 | 0.01 | 0.7 | 2.5 | - | - | - | - | 3.2 | - | 3.2 | |||||||||||||||||||||||||||||||||||||||
| Revolving credit line | (f) | 2.04 | 2021 | 0.74 | - | - | - | - | 68.0 | - | 68.0 | - | 68.0 | |||||||||||||||||||||||||||||||||||||||
| Subtotal | 5.19 | $ | 5.4 | $ | 29.0 | $ | 37.7 | $ | 36.8 | $ | 102.0 | $ | 179.6 | $ | 390.5 | $ | 0.9 | $ | 389.6 | |||||||||||||||||||||||||||||||||
| Total | 5.79 | $ | 47.8 | $ | 40.5 | $ | 41.1 | $ | 41.2 | $ | 107.5 | $ | 329.4 | $ | 607.5 | $ | 1.2 | $ | 606.3 | |||||||||||||||||||||||||||||||||
| (a) | Loan has a stated interest rate of LIBOR plus 1.5%, but is swapped through maturity to a 5.95% fixed rate. | Liquidity: | |||||
| (b) | Loan has a stated interest rate of LIBOR plus 1.0%, but is swapped through maturity to a 5.98% fixed rate. | Cash and cash equivalents | $ | 5.8 | |||
| (c) | Loan has a stated interest rate of LIBOR plus 1.35%, but is swapped through maturity to a 3.135% fixed rate. | Restricted cash (1031) | $ | 1.2 | |||
| (d) | Loan has an effective interest rate of 3.15% for 2016. | Available under unsecured credit facility | $ | 269.3 | |||
| (e) | Loan has an effective interest rate of 2.83% for 2016. | ||||||
| (f) | LIBOR plus 175 bps, based on pricing grid. | Ratios: | |||||
| Principal debt to total enterprise value | 24.4 | % | |||||
| Principal debt to total assets | 27.3 | % | |||||
| 9 |
Alexander & Baldwin, Inc.
Components of NAV
($ in millions)
| Commercial Real Estate - Company Information | Commercial Real Estate - Hawaii Market Information | |||||||
| Income producing assets | NOI TTM Ended September 30, 2016 | Hawaii market cap rate information Income producing assets | Range of Market Cap Rates | |||||
| Hawaii retail | $ | 44.7 | Hawaii retail | 4.0% - 6.0% | ||||
| Hawaii industrial | $ | 11.1 | Hawaii industrial | 5.0% - 7.0% | ||||
| Hawaii office | $ | 3.7 | Hawaii office | 6.0% - 8.0% | ||||
| Hawaii ground leases | $ | 12.3 | ||||||
| Mainland retail | $ | 2.3 | ||||||
| Mainland industrial | $ | 4.7 | ||||||
| Mainland office | $ | 8.2 | ||||||
| Total | $ | 87.0 | ||||||
| Materials & Construction Company Information | Materials & Construction - Market Information | |||||||||||||||||||||||
| Materials
& Construction historical EBITDA | 1Q | 2Q | 3Q | 4Q | Total | Materials and Construction peers: | Ticker | |||||||||||||||||
| 2016 | $ | 10.4 | $ | 7.8 | $ | 8.0 | $ | 26.2 | Cementos Argos S.A | CMT | ||||||||||||||
| 2015 | $ | 9.5 | $ | 9.7 | $ | 10.2 | $ | 11.7 | $ | 41.1 | CEMEX S.A.B. de C.V | CX | ||||||||||||
| 2014 | $ | 7.2 | $ | 11.4 | $ | 9.0 | $ | 10.4 | $ | 38.0 | CRH plc | CRH | ||||||||||||
| 2013 | (a) | (a) | (a) | $ | 6.8 | $ | 6.8 | HeidelbergCement AG | HDELY | |||||||||||||||
| Martin Marietta Materials, Inc | MLM | |||||||||||||||||||||||
| Monarch Cement Co | MCEM | |||||||||||||||||||||||
| Summit Materials Inc | SUM | |||||||||||||||||||||||
Development Sales - Company Information | Vulcan Materials Company | VMC | ||||||||||||||||||||||
| Book | Specialty Construction Companies: | |||||||||||||||||||||||
| Value as | Colas SA | RE.PA | ||||||||||||||||||||||
| of September | Granite Construction Inc | GVA | ||||||||||||||||||||||
| 30, 2016 | Great Lakes Dredge & Dock Corp | GLDD | ||||||||||||||||||||||
|
Active Development Projects | (b) | Orion Group Holdings, Inc | ORN | |||||||||||||||||||||
| Residential units | $ | 75.5 | Sterling Construction Co. Inc | TPCSTRL | ||||||||||||||||||||
| Lot sales | $ | 392.0 | Tutor Perini Corporation | TPC | ||||||||||||||||||||
| $ | 467.5 | |||||||||||||||||||||||
| (a) | Grace Pacific was acquired on October 1, 2013 |
| (b) | The book value of active development projects includes land stated at it's acquisition value. In the case of development projects on A&B's historical landholdings, such as Kamalani and Maui Business Park, the value of land would be approximately $150 per acre. |
| 10 |
Alexander & Baldwin, Inc.
Components of NAV (Cont.)
($ in millions, except Nominal Sales Data)
| Landholdings - Company Information | ||||||||||||||||||||
| A&B Nominal Sales January 2011-September 2016 | ||||||||||||||||||||
| Landholdings not valued elsewhere | Acres | Acres Sold | Average | High | Low | |||||||||||||||
| Urban | 253 | 70 | $ | 2,002,575 | $ | 4,600,000 | $ | 435,600 | ||||||||||||
| Urban entitlement process | 740 | |||||||||||||||||||
| Agriculture | 55,230 | 1,861 | $ | 28,700 | $ | 151,600 | $ | 13,750 | ||||||||||||
| Conservation (c) | 29,835 | |||||||||||||||||||
| Total | 86,058 | |||||||||||||||||||
| Other Company Information | ||||||||||||||||||||
| Total debt at September 30, 2016 | $ | 606.3 | ||||||||||||||||||
| Shares outstanding at September 30, 2016 (in millions) | 49.0 | |||||||||||||||||||
| (c) | Conservation land is generally utilized in the collection of water, which benefits the agricultural land, and therefore, generally these lands should not be separately valued. |
| 11 |
Alexander & Baldwin, Inc.
Property Report - Hawaii
| Property | City/Island | Year built / renovated | Number of buildings | Gross
leasable area at 09/30/16 (sq. ft.) | Leased % | ABR per leased sq. ft. | 3Q2016 NOI ($ in 000s) | 3Q2016 % NOI to HI portfolio NOI | Total
Principal Debt ($ in 000s) | |||||||||||||||||||||||||
| (a) | (b) | |||||||||||||||||||||||||||||||||
| Retail | ||||||||||||||||||||||||||||||||||
| Pearl Highlands Center | Oahu | 1992-1994 | 1 | 415,200 | 97 | $ | 23.88 | $ | 2,429 | 13.1 | $ | 90,496 | ||||||||||||||||||||||
| Kailua Retail | Oahu | 1947-2014 | 15 | 316,400 | 96 | $ | 29.19 | 2,416 | 13.1 | 10,842 | ||||||||||||||||||||||||
| Waianae Mall | Oahu | 1975 | 1 | 170,300 | 86 | $ | 18.83 | 525 | 2.8 | - | ||||||||||||||||||||||||
| Manoa Marketplace | Oahu | 1977 | 1 | 139,300 | 97 | $ | 34.34 | 1,174 | 6.4 | 60,000 | ||||||||||||||||||||||||
| Kaneohe Bay Shopping Center | (c) | Oahu | 1971/2008 | 1 | 124,800 | 100 | $ | 22.83 | 591 | 3.2 | - | |||||||||||||||||||||||
| Waipio Shopping Center | Oahu | 1986-2004 | 1 | 113,800 | 99 | $ | 26.63 | 838 | 4.5 | - | ||||||||||||||||||||||||
| Aikahi Park Shopping Center | Oahu | 1971 | 1 | 98,000 | 82 | $ | 16.72 | 707 | 3.8 | - | ||||||||||||||||||||||||
| The Shops at Kukui'ula | Kauai | 2009 | 1 | 89,000 | 94 | $ | 45.90 | 990 | 5.4 | 35,168 | ||||||||||||||||||||||||
| Lanihau Marketplace | Hawaii | 1987 | 1 | 88,300 | 99 | $ | 20.74 | 498 | 2.7 | - | ||||||||||||||||||||||||
| Kunia Shopping Center | Oahu | 2004 | 1 | 60,600 | 81 | $ | 37.63 | 459 | 2.5 | - | ||||||||||||||||||||||||
| Lahaina Square | Maui | 1973 | 1 | 50,200 | 77 | $ | 17.38 | 108 | 0.6 | - | ||||||||||||||||||||||||
| Kahului Shopping Center | Maui | 1951 | 1 | 49,900 | 86 | $ | 19.56 | 135 | 0.7 | - | ||||||||||||||||||||||||
| Napili Plaza | Maui | 1991 | 1 | 45,700 | 89 | $ | 26.95 | 271 | 1.5 | - | ||||||||||||||||||||||||
| Gateway at Mililani Mauka | Oahu | 2008, 2011, 2013 | 4 | 34,900 | 91 | $ | 50.90 | 417 | 2.3 | - | ||||||||||||||||||||||||
| Port Allen Marina Center | Kauai | 2002 | 1 | 23,600 | 92 | $ | 22.01 | 93 | 0.5 | - | ||||||||||||||||||||||||
| Subtotal – Retail | 32 | 1,820,000 | 94 | $ | 26.60 | $ | 11,651 | 63.1 | $ | 196,506 | ||||||||||||||||||||||||
| Industrial | ||||||||||||||||||||||||||||||||||
| Komohana Industrial Park | (d) | Oahu | 1990 | 1 | 238,300 | 100 | $ | 11.37 | $ | 1,102 | 5.9 | $ | - | |||||||||||||||||||||
| Kakaako Commerce Center | Oahu | 1971 | 1 | 206,000 | 79 | $ | 12.66 | 458 | 2.5 | - | ||||||||||||||||||||||||
| Waipio Industrial | Oahu | 1988-1989 | 5 | 158,400 | 100 | $ | 14.55 | 581 | 3.1 | - | ||||||||||||||||||||||||
| P&L Building | Maui | 1970 | 1 | 104,100 | 100 | $ | 12.60 | 330 | 1.8 | - | ||||||||||||||||||||||||
| Kailua Industrial/Other | Oahu | 1951-1974 | 6 | 68,800 | 96 | $ | 13.21 | 180 | 1.0 | - | ||||||||||||||||||||||||
| Port Allen | Kauai | 1983 -1993 | 3 | 63,800 | 100 | $ | 11.38 | 162 | 0.9 | - | ||||||||||||||||||||||||
| Subtotal – Industrial | 17 | 839,400 | 95 | $ | 12.59 | $ | 2,813 | 15.2 | $ | - | ||||||||||||||||||||||||
| Office | ||||||||||||||||||||||||||||||||||
| Kahului Office Building | Maui | 1974/1996 | 1 | 59,600 | 86 | $ | 27.61 | $ | 326 | 1.8 | $ | - | ||||||||||||||||||||||
| Gateway at Mililani Mauka South | (e) | Oahu | 1992, 2006, 2008, 2016 | 3 | 37,100 | 93 | $ | 43.24 | 323 | 1.8 | - | |||||||||||||||||||||||
| Kahului Office Center | Maui | 1991 | 1 | 33,400 | 88 | $ | 25.99 | 192 | 1.0 | - | ||||||||||||||||||||||||
| Stangenwald Building | Oahu | 1901/1980 | 1 | 27,100 | 92 | $ | 18.40 | 104 | 0.6 | - | ||||||||||||||||||||||||
| Judd Building | Oahu | 1898/1979 | 1 | 20,200 | 86 | $ | 17.98 | 46 | 0.2 | - | ||||||||||||||||||||||||
| Maui Clinic Building | (f) | Maui | 1958/2010 | 1 | 16,600 | 28 | $ | 25.82 | (14 | ) | (0.1 | ) | - | |||||||||||||||||||||
| Lono Center | Maui | 1973 | 1 | 13,700 | 80 | $ | 26.95 | 33 | 0.2 | - | ||||||||||||||||||||||||
| Subtotal – Office | 9 | 207,700 | 83 | $ | 27.92 | $ | 1,010 | 5.5 | $ | - | ||||||||||||||||||||||||
| Ground Leases | ||||||||||||||||||||||||||||||||||
| Kailua | Oahu | 19 acres | - | - | - | - | $ | 862 | 4.7 | $ | - | |||||||||||||||||||||||
| Other Oahu | Oahu | 22 acres | - | - | - | - | 1,214 | 6.5 | - | |||||||||||||||||||||||||
| Neighbor Islands | (g) | Neighbor Islands | 3143 acres | - | - | - | - | 924 | 5.0 | - | ||||||||||||||||||||||||
| Subtotal - Ground Leases | 3184 acres | - | - | - | - | 3,000 | 16.2 | $ | - | |||||||||||||||||||||||||
| Total Hawaii | 58 | 2,867,100 | 93 | $ | 22.49 | $ | 18,474 | 100.0 | $ | 196,506 | ||||||||||||||||||||||||
| (a) | Represents the average percentage of space leased during the period referenced or A&B's ownership period, whichever is shorter. |
| (b) | See page appendix for a statement about management's use of non-GAAP financial measures and required reconciliations. |
| (c) | A&B owns the leasehold improvements of this center and does not own the fee interest. |
| (d) | Includes ground lease income. |
| (e) | A 18,415-square-foot expansion was completed and added to the commercial portfolio in June 2016. |
| (f) | Negative NOI and low occupancy relates to property repositioning. |
| (g) | Includes 64 ground leased urban acres. |
| 12 |
Alexander & Baldwin, Inc.
Property Report – U.S. Mainland
| Property | City/State | Year built / renovated | Number of buildings | Gross leasable area at 09/30/16 (sq. ft.) | Leased % | Annualized Base Rent (ABR) ($ in 000s) | ABR per leased sq. ft. | 3Q2016 NOI ($ in 000s) | 3Q2016 % NOI to ML portfolio NOI | Total Principal debt ($ in 000s) | ||||||||||||||||||||||||
| (a) | (b) | |||||||||||||||||||||||||||||||||
| Retail: | ||||||||||||||||||||||||||||||||||
| Little Cottonwood Center | Sandy, UT | 1998-2008 | 1 | 141,500 | 94 | $ | 1,445 | $ | 10.76 | $ | 330 | 12.9 | $ | - | ||||||||||||||||||||
| Royal MacArthur Center | Dallas, TX | 2006 | 1 | 44,900 | 90 | 909 | $ | 22.49 | 216 | 8.4 | - | |||||||||||||||||||||||
| Subtotal – Retail | 2 | 186,400 | 93 | $ | 2,354 | $ | 13.47 | $ | 546 | 21.3 | $ | - | ||||||||||||||||||||||
| Industrial: | ||||||||||||||||||||||||||||||||||
| Midstate Hayes | Visalia, CA | 2002-2008 | 4 | 790,200 | 89 | $ | 2,728 | $ | 4.11 | $ | 648 | 25.3 | $ | 8,221 | ||||||||||||||||||||
| Sparks Business Center | Sparks, NV | 1996-1998 | 1 | 396,100 | 95 | 1,845 | $ | 4.96 | 449 | 17.5 | - | |||||||||||||||||||||||
| Subtotal – Industrial | 5 | 1,186,300 | 91 | $ | 4,573 | $ | 4.41 | $ | 1,097 | 42.8 | $ | 8,221 | ||||||||||||||||||||||
| Office: | ||||||||||||||||||||||||||||||||||
| 1800 and 1820 Preston Park | Plano, TX | 1997-1998/2010 | 2 | 198,800 | 87 | $ | 3,206 | $ | 18.53 | $ | 480 | 18.7 | $ | - | ||||||||||||||||||||
| Concorde Commerce Center | Phoenix, AZ | 1998 | 1 | 138,700 | 91 | 2,573 | $ | 20.37 | 330 | 12.8 | - | |||||||||||||||||||||||
| Deer Valley Financial Center | Phoenix, AZ | 2001 | 1 | 126,600 | 82 | 1,603 | $ | 15.70 | 112 | 4.4 | - | |||||||||||||||||||||||
| Subtotal – Office | 4 | 464,100 | 87 | $ | 7,382 | $ | 18.39 | $ | 922 | 35.9 | $ | - | ||||||||||||||||||||||
| Total Mainland | 11 | 1,836,800 | 90 | $ | 14,309 | $ | 8.87 | $ | 2,565 | 100.0 | $ | 8,221 | ||||||||||||||||||||||
| (a) | Represents the average percentage of space leased during the period reference or A&B's ownership period, whichever is shorter. |
| (b) | See page appendix for a statement about management's use of non-GAAP financial measures and required reconciliations. |
| 13 |
Alexander & Baldwin, Inc.
Net Operating Income (NOI)
($ in millions, unaudited)
| 3Q16 | 3Q15 | % Change | ||||||||||||||||||||||||||||||||||||||||||||||||||||||||||||
| Location | Retail | Industrial | Office | Ground | Total | Retail | Industrial | Office | Ground | Total | Retail | Industrial | Office | Ground | Total | |||||||||||||||||||||||||||||||||||||||||||||||
| Hawaii | (a) | $ | 11.7 | $ | 2.8 | $ | 1.0 | $ | 3.0 | $ | 18.5 | $ | 9.9 | $ | 2.7 | $ | 0.9 | $ | 2.9 | $ | 16.4 | 18.2 | 3.7 | 11.1 | 3.4 | 12.8 | ||||||||||||||||||||||||||||||||||||
| Mainland | 0.5 | 1.1 | 1.0 | - | 2.6 | 0.6 | 1.1 | 2.3 | - | 4.0 | (16.7 | ) | - | (56.5 | ) | - | (35.0 | ) | ||||||||||||||||||||||||||||||||||||||||||||
| Total | $ | 12.2 | $ | 3.9 | $ | 2.0 | $ | 3.0 | $ | 21.1 | $ | 10.5 | $ | 3.8 | $ | 3.2 | $ | 2.9 | $ | 20.4 | 16.2 | 2.6 | (37.5 | ) | 3.4 | 3.4 | ||||||||||||||||||||||||||||||||||||
| Nine months ended September 30, 2016 | Nine months ended September 30, 2015 | % Change | ||||||||||||||||||||||||||||||||||||||||||||||||||||||||||||
| Location | Retail | Industrial | Office | Ground | Total | Retail | Industrial | Office | Ground | Total | Retail | Industrial | Office | Ground | Total | |||||||||||||||||||||||||||||||||||||||||||||||
| Hawaii | (a) | $ | 35.2 | $ | 8.4 | $ | 2.8 | $ | 8.9 | $ | 55.3 | $ | 29.2 | $ | 8.1 | $ | 2.8 | $ | 9.6 | $ | 49.7 | 20.5 | 3.7 | - | (7.3 | ) | 11.3 | |||||||||||||||||||||||||||||||||||
| Mainland | 1.7 | 3.5 | 5.3 | - | 10.5 | 1.9 | 3.5 | 7.6 | - | 13.0 | (10.5 | ) | - | (30.3 | ) | - | (19.2 | ) | ||||||||||||||||||||||||||||||||||||||||||||
| Total | $ | 36.9 | $ | 11.9 | $ | 8.1 | $ | 8.9 | $ | 65.8 | $ | 31.1 | $ | 11.6 | $ | 10.4 | $ | 9.6 | $ | 62.7 | 18.6 | 2.6 | (22.1 | ) | (7.3 | ) | 4.9 | |||||||||||||||||||||||||||||||||||
Same Store NOI
($ in millions, unaudited)
| 3Q16 | 3Q15 | % Change | ||||||||||||||||||||||||||||||||||||||||||||||||||||||||||||
| Location | Retail | Industrial | Office | Ground | Total | Retail | Industrial | Office | Ground | Total | Retail | Industrial | Office | Ground | Total | |||||||||||||||||||||||||||||||||||||||||||||||
| Hawaii | (b) | $ | 10.5 | $ | 2.8 | $ | 0.7 | $ | 3.0 | $ | 17.0 | $ | 9.9 | $ | 2.7 | $ | 0.7 | $ | 2.8 | $ | 16.1 | 6.1 | 3.7 | - | 7.1 | 5.6 | ||||||||||||||||||||||||||||||||||||
| Mainland | 0.5 | 1.1 | 0.9 | - | 2.5 | 0.6 | 1.1 | 1.0 | - | 2.7 | (16.7 | ) | - | (10.0 | ) | - | (7.4 | ) | ||||||||||||||||||||||||||||||||||||||||||||
| Total | $ | 11.0 | $ | 3.9 | $ | 1.6 | $ | 3.0 | $ | 19.5 | $ | 10.5 | $ | 3.8 | $ | 1.7 | $ | 2.8 | $ | 18.8 | 4.8 | 2.6 | (5.9 | ) | 7.1 | 3.7 | ||||||||||||||||||||||||||||||||||||
| Nine months ended September 30, 2016 | Nine months ended September 30, 2015 | % Change | ||||||||||||||||||||||||||||||||||||||||||||||||||||||||||||
| Location | Retail | Industrial | Office | Ground | Total | Retail | Industrial | Office | Ground | Total | Retail | Industrial | Office | Ground | Total | |||||||||||||||||||||||||||||||||||||||||||||||
| Hawaii | (c) | $ | 28.6 | $ | 8.4 | $ | 2.1 | $ | 9.8 | $ | 48.9 | $ | 27.1 | $ | 8.1 | $ | 2.3 | $ | 10.0 | $ | 47.5 | 5.5 | 3.7 | (8.7 | ) | (2.0 | ) | 2.9 | ||||||||||||||||||||||||||||||||||
| Mainland | 1.7 | 3.5 | 2.8 | - | 8.0 | 1.9 | 3.4 | 3.0 | - | 8.3 | (10.5 | ) | 2.9 | (6.7 | ) | - | (3.6 | ) | ||||||||||||||||||||||||||||||||||||||||||||
| Total | $ | 30.3 | $ | 11.9 | $ | 4.9 | $ | 9.8 | $ | 56.9 | $ | 29.0 | $ | 11.5 | $ | 5.3 | $ | 10.0 | $ | 55.8 | 4.5 | 3.5 | (7.5 | ) | (2.0 | ) | 2.0 | |||||||||||||||||||||||||||||||||||
| (a) | For purposes of calculating third quarter 2016 NOI and the nine months ended September 30, 2016 NOI from Aikahi Park Shopping Center (APSC), tenant improvements and ground lease NOI were included in Hawaii retail. Ground lease NOI for APSC in the third quarter of 2015 and nine months ended September 30, 2015 was included in Hawaii ground leases to April 2015 and in Hawaii retail as of May 2015. |
| (b) | Ground lease NOI from APSC was included in the calculation of the third quarter 2016 and 2015 same-store NOI in Hawaii retail. |
| (c) | Ground lease NOI from APSC was included in the calculation of the nine months ended September 30, 2016 and 2015 same-store NOI in Hawaii ground leases. |
Note: See page appendix for a statement about management's use of non-GAAP financial measures and required reconciliations.
| 14 |
Alexander & Baldwin, Inc.
Percent Occupancy
| Three months ended September 30, 2016 | Three months ended September 30, 2015 | % point change | ||||||||||||||||||||||||||||||||||||||||||||||
| Location | Retail | Industrial | Office | Total | Retail | Industrial | Office | Total | Retail | Industrial | Office | Total | ||||||||||||||||||||||||||||||||||||
| Hawaii | 94 | 95 | 83 | 93 | 94 | 95 | 84 | 93 | - | - | (1 | ) | - | |||||||||||||||||||||||||||||||||||
| Mainland | 93 | 91 | 87 | 90 | 92 | 99 | 93 | 96 | 1 | (8 | ) | (6 | ) | (6 | ) | |||||||||||||||||||||||||||||||||
| Total | 94 | 93 | 86 | 92 | 94 | 97 | 91 | 95 | - | (4 | ) | (5 | ) | (3 | ) | |||||||||||||||||||||||||||||||||
| Nine months ended September 30, 2016 | Three months ended September 30, 2015 | % point change | ||||||||||||||||||||||||||||||||||||||||||||||
| Location | Retail | Industrial | Office | Total | Retail | Industrial | Office | Total | Retail | Industrial | Office | Total | ||||||||||||||||||||||||||||||||||||
| Hawaii | 94 | 95 | 82 | 93 | 94 | 95 | 83 | 93 | - | - | (1 | ) | - | |||||||||||||||||||||||||||||||||||
| Mainland | 93 | 96 | 89 | 94 | 93 | 99 | 91 | 95 | - | (3 | ) | (2 | ) | (1 | ) | |||||||||||||||||||||||||||||||||
| Total | 94 | 96 | 88 | 93 | 94 | 97 | 90 | 94 | - | (1 | ) | (2 | ) | (1 | ) | |||||||||||||||||||||||||||||||||
Same Store Percent Occupancy
| Three months ended September 30, 2016 | Three months ended September 30, 2015 | % point change | ||||||||||||||||||||||||||||||||||||||||||||||
| Location | Retail | Industrial | Office | Total | Retail | Industrial | Office | Total | Retail | Industrial | Office | Total | ||||||||||||||||||||||||||||||||||||
| Hawaii | 93 | 95 | 81 | 93 | 94 | 95 | 82 | 93 | (1 | ) | - | (1 | ) | - | ||||||||||||||||||||||||||||||||||
| Mainland | 93 | 91 | 87 | 90 | 92 | 99 | 87 | 95 | 1 | (8 | ) | - | (5 | ) | ||||||||||||||||||||||||||||||||||
| Total | 93 | 93 | 85 | 92 | 94 | 97 | 85 | 94 | (1 | ) | (4 | ) | - | (2 | ) | |||||||||||||||||||||||||||||||||
| Nine months ended September 30, 2016 | Nine months ended September 30, 2015 | % point change | ||||||||||||||||||||||||||||||||||||||||||||||
| Location | Retail | Industrial | Office | Total | Retail | Industrial | Office | Total | Retail | Industrial | Office | Total | ||||||||||||||||||||||||||||||||||||
| Hawaii | 94 | 95 | 80 | 93 | 94 | 95 | 81 | 94 | - | - | (1 | ) | (1 | ) | ||||||||||||||||||||||||||||||||||
| Mainland | 93 | 96 | 86 | 93 | 93 | 99 | 87 | 95 | - | (3 | ) | (1 | ) | (2 | ) | |||||||||||||||||||||||||||||||||
| Total | 94 | 96 | 84 | 93 | 94 | 97 | 85 | 94 | - | (1 | ) | (1 | ) | (1 | ) | |||||||||||||||||||||||||||||||||
| 15 |
Alexander & Baldwin, Inc.
Commercial Real Estate Transactional Activity (2015-2016)
($ in millions)
| Property disposed in 2016 | Disposition date (month/year) | Disposition price (in millions) | Gross leasable area (sq. ft.) | Leased % at disposition | ||||||||||
| Ninigret Office Park | 6/16 | $ | 30 | 185,500 | 100 | |||||||||
| Gateway Oaks | 6/16 | $ | 8 | 59,700 | 92 | |||||||||
| Prospect Park | 6/16 | $ | 22 | 163,300 | 100 | |||||||||
| Total | $ | 60 | 408,500 | |||||||||||
| Property acquired in 2016 | Acquisition date (month/year) | Acquisition price (in millions) | Gross leasable area (sq. ft.) | Leased % at acquisition | ||||||||||
| Manoa Marketplace | 1/16 | $ | 82 | 139,300 | 99 | |||||||||
| Property disposed in 2015 | Disposition date (month/year) | Disposition price (in millions) | Gross leasable area (sq. ft.) | Leased % at disposition | ||||||||||
| Union Bank | 12/15 | $ | 10 | 84,000 | 53 | |||||||||
| San Pedro Plaza | 5/15 | $ | 17 | 171,900 | 69 | |||||||||
| Wilshire Shopping Center | 3/15 | $ | 4 | 46,500 | 72 | |||||||||
| Total | $ | 31 | 302,400 | |||||||||||
| Property acquired in 2015 | Acquisition date (month/year) | Acquisition price (in millions) | Gross leasable area (sq. ft.) | Leased % at acquisition | ||||||||||
| Aikahi Park Shopping Center - Improved Property | 5/15 | $ | 2 | 98,000 | 86 | |||||||||
| 16 |
Alexander & Baldwin, Inc.
Top Ten Tenants (In-Service Properties) Based Upon ABR
As of September 30, 2016
| Tenant | Number of leases | Weighted average remaining terms (months) | Annualized Base Rent (ABR) | % of ABR | GLA (sq. ft.) | Percentage of total GLA | ||||||||||||||
| Sam's Club | 1 | 52 | $ | 3,307,920 | 4.5 | 180,908 | 3.8 | |||||||||||||
| CVS Corporation | 6 | 101 | 2,623,459 | 3.5 | 150,411 | 3.2 | ||||||||||||||
| United Healthcare Services, Inc. | 1 | 39 | 2,216,050 | 3.0 | 108,100 | 2.3 | ||||||||||||||
| Foodland Supermarket, Ltd. / Food Pantry Ltd. | 7 | 73 | 1,741,170 | 2.3 | 111,259 | 2.4 | ||||||||||||||
| 24 Hour Fitness USA, Inc. | 1 | 99 | 1,375,000 | 1.9 | 45,870 | 1.0 | ||||||||||||||
| Albertsons Companies, Inc. | 4 | 85 | 1,316,122 | 1.8 | 168,621 | 3.6 | ||||||||||||||
| Whole Foods Market, Inc. | 1 | 184 | 1,120,304 | 1.5 | 31,647 | 0.7 | ||||||||||||||
| Office Depot, Inc. | 1 | 7 | 1,016,719 | 1.4 | 75,824 | 1.6 | ||||||||||||||
| Keystone Automotive Operations, Inc. | 1 | 15 | 1,015,980 | 1.4 | 230,300 | 4.9 | ||||||||||||||
| International Paper | 1 | 22 | 977,709 | 1.3 | 252,040 | 5.4 | ||||||||||||||
| Total | 24 | $ | 16,710,433 | 22.6 | 1,354,980 | 28.9 | ||||||||||||||
| 17 |
Alexander & Baldwin, Inc.
Lease Expiration Schedule
As of September 30, 2016
| Total Portfolio | Ground Lease Expirations | |||||||||||||||||||||||||||||
| Expiration year | Number of leases | Sq. ft. of expiring leases | % of total leased GLA | ABR expiring ($ in millions) | % of total ABR | Expiration year | ABR expiring ($ in millions) | % of portfolio ABR | ||||||||||||||||||||||
| Month-to-month | $ | 0.8 | 6.2 | |||||||||||||||||||||||||||
| 2016 | 54 | 112,990 | 2.7 | $ | 2.8 | 3.7 | 2016 | 0.6 | 4.6 | |||||||||||||||||||||
| 2017 | 184 | 1,093,354 | 26.4 | 15.3 | 20.1 | 2017 | 0.6 | 4.6 | ||||||||||||||||||||||
| 2018 | 139 | 785,042 | 19.0 | 9.1 | 12.0 | 2018 | 0.3 | 2.3 | ||||||||||||||||||||||
| 2019 | 122 | 528,927 | 12.8 | 12.0 | 15.8 | 2019 | 0.3 | 2.3 | ||||||||||||||||||||||
| 2020 | 93 | 386,479 | 9.4 | 8.8 | 11.6 | 2020 | 1.0 | 7.7 | ||||||||||||||||||||||
| 2021 | 76 | 440,241 | 10.7 | 9.4 | 12.4 | 2021 | 0.9 | 6.9 | ||||||||||||||||||||||
| 2022 | 22 | 113,554 | 2.8 | 2.9 | 3.8 | 2022 | 0.3 | 2.3 | ||||||||||||||||||||||
| 2023 | 26 | 163,378 | 4.0 | 2.6 | 3.4 | 2023 | - | - | ||||||||||||||||||||||
| 2024 | 14 | 175,748 | 4.3 | 4.5 | 5.9 | 2024 | - | - | ||||||||||||||||||||||
| 2025 | 21 | 58,481 | 1.4 | 2.5 | 3.3 | 2025 | 0.1 | 0.8 | ||||||||||||||||||||||
| Thereafter | 28 | 268,965 | 6.5 | 6.1 | 8.0 | Thereafter | 8.1 | 62.3 | ||||||||||||||||||||||
| Total | 779 | 4,127,159 | 100.0 | $ | 76.0 | 100.0 | $ | 13.0 | 100.0 | |||||||||||||||||||||
Note: Lease expirations do not include month to month leases.
| 18 |
Alexander & Baldwin, Inc.
Commercial Portfolio Repositioning, Redevelopment & Development Summary
As of September 30, 2016
| Incremental | Stabilized | |||||||||||||||||||||||||||||||
| Capital | Stabilized NOI | Yield on | Leasing Activity | |||||||||||||||||||||||||||||
| Project | Phase | In-service | ($ in Millions) | ($ in Millions) | Cost | Sq. Ft. | % Leased | % LOI | Total | |||||||||||||||||||||||
| Gateway at Mililani South Expansion | Completed | Jun-16 | $ | 6.0 | $ | 0.8 | 13 | % | 18,415 | 85 | 15 | 100 | ||||||||||||||||||||
| Pearl Highlands Center – Food Court Repositioning | Pre-construction | Late 2017 | $ | 3.0 | $ | 0.3 | 10-12 | % | 6,300 | -- | 60 | 60 | ||||||||||||||||||||
| Lau Hala Shops Repositioning | Construction | 2018 | $ | 21.0 | $1.9-$2.4 | 9-11 | % | 48,400 | -- | 87 | 87 | |||||||||||||||||||||
| Total | $ | 30.0 | $3.0-$3.5 | 10-12 | % | 73,115 | ||||||||||||||||||||||||||
| 19 |
Alexander & Baldwin, Inc.
Active Development Projects
As of September 30, 2016
| (Dollars in millions) | Construction timing | Sales Closings Timing | ||||||||||||||||||||||||||||||||||||||||||
| Project | Location | Product type | Est.
economic interest | Planned units, saleable acres or gross leasable square feet | Average
unit (sf) or lot size (acres) | Units/
acres closed through 9/30/16 | Targeted
sales price range per square foot or NOI | Est. project cost | A&B
Projected Capital Commitment (JVs Only) | A&B
Capital Invested | A&B
net investment as of 9/30/16 | Start/Est. start | Est.
substantial completion | Start/Est. start | Est. end | |||||||||||||||||||||||||||||
| (a) | (b) | (c) | (e) | |||||||||||||||||||||||||||||||||||||||||
| Residential units | ||||||||||||||||||||||||||||||||||||||||||||
| Kamalani (Increment 1) | Kihei, Maui | Primary residential | 100% | 170 units | 994 | - | $400 | $ | 64 | N/A | $ | 13 | $ | 13 | 2016 | 2019 | 2017 | 2019 | ||||||||||||||||||||||||||
| Ka Milo at Mauna Lani | Kona, Hawaii | Resort residential | 50% | 137 units | 2,165 sf | 85 units | $530-$800 | 125 | 16 | 16 | 5 | 2005 | 2018 | 2007 | 2018 | |||||||||||||||||||||||||||||
| Keala 'O Wailea (MF-11) | Wailea, Maui | Resort residential | 65%+/-5% | 70 units | 1,385 sf | - | $600-$1,000 | 64 | 9 | 9 | 9 | 2015 | 2018 | 2017 | 2018 | |||||||||||||||||||||||||||||
| The Collection | Honolulu, Oahu | Primary residential/commercial | 90% +/-5% | 465 units (464 saleable) | 904 sf | - | $795 | 279 | 54 | 54 | 49 | 2014 | 2016 | 2016 | 2017 | |||||||||||||||||||||||||||||
| Total | $ | 532 | $ | 79 | $ | 92 | $ | 76 | ||||||||||||||||||||||||||||||||||||
| Lot sales | ||||||||||||||||||||||||||||||||||||||||||||
| Kahala Avenue Portfolio | Honolulu, Oahu | Residential | 100% | 30 lots | 0.5 acres | 22 lots | $150-$385 | $ | 135 | N/A | $ | 134 | $ | 49 | N/A | N/A | 2013 | 2018 | ||||||||||||||||||||||||||
| Maui Business Park II | Kahului, Maui | Light industrial lots | 100% | 136 acres | 0.5 - 11 acres | 30 acres | $38-$60 | 96 | N/A | 78 | 46 | 2011 | 2021 | 2012 | 2028 | |||||||||||||||||||||||||||||
| The Ridge at Wailea (MF-19) | Wailea, Maui | Resort residential | 100% | 9 lots (4.5 acres) | 0.5 acres | 1 lot | $60-$100 | 10 | N/A | 9 | 9 | 2007 | 2009 | 2014 | 2020 | |||||||||||||||||||||||||||||
| Kukui'ula | Poipu, Kauai | Resort residential | 85% +/- 5% | Up to 1,500 units (640 saleable acres) | 0.42 acres | 134 lots | $40-$110 | 854 | 300 | 298 | 288 | 2006 | 2030 | (d) | 2006 | 2030 | ||||||||||||||||||||||||||||
| Total | $ | 1,095 | $ | 300 | $ | 519 | $ | 392 | ||||||||||||||||||||||||||||||||||||
| (a) | Economic interest represents the Company's estimated share of distributions after return of capital contributions based on current forecasts of sales activity. Actual results coud differ materially from projected results due to the timing of expected sales, increases or decreases in estimated sales prices or costs and other factors. As a result, esimate economic interests are subject to change. |
| (b) | Includes land cost at book value and capitalized interest, but excludes sales commissions and closing costs. |
| (c) | Includes land cost at contribution value and total expected A&B capital to be contributed. The estimate includes due diligence costs and capitalized interest, but excludes capital projected to be contribued by equity partners, third-party debt, and amounts expected to be funded from project cash flows and/or buyer deposits. |
| (d) | Estimated substantial construction completion for Kukui'ula represents the estimated completion date for major project infrastructure and amenities. Constuction activities related to parcel development is expected to continue past 2030. |
| (e) | The book value of active development projects includes land stated at it's acquisition value. In the case of development projects on A&B's historical landholdings, like Kamalani and Maui Business Park, the value of land would be approximately $150 per acre. |
| 20 |
Alexander & Baldwin, Inc.
Landholdings as of September 30, 2016
| Maui | Kauai | Oahu | Molokai | Big Island | Hawaii
Total Acres | Mainland Total Acres | Total Acres | |||||||||||||||||||||||||
| Land under commercial properties/ urban ground leases | 97 | 19 | 184 | - | 10 | 310 | 125 | 435 | ||||||||||||||||||||||||
| Land in active development | 237 | - | 5 | - | - | 242 | - | 242 | ||||||||||||||||||||||||
| Land used in other operations | 22 | 20 | - | - | - | 42 | - | 42 | ||||||||||||||||||||||||
| Land management | ||||||||||||||||||||||||||||||||
| Urban | 211 | 42 | - | - | - | 253 | - | 253 | ||||||||||||||||||||||||
| Agriculture | 48,541 | 6,614 | 75 | - | - | 55,230 | - | 55,230 | ||||||||||||||||||||||||
| Urban entitlement process | 480 | 260 | - | - | - | 740 | - | 740 | ||||||||||||||||||||||||
| Conservation & preservation | 15,870 | 13,325 | 640 | - | - | 29,835 | - | 29,835 | ||||||||||||||||||||||||
| Materials & Construction landholdings | - | - | 540 | 265 | - | 805 | - | 805 | ||||||||||||||||||||||||
| Total landholdings | 65,458 | 20,280 | 1,444 | 265 | 10 | 87,457 | 125 | 87,582 | ||||||||||||||||||||||||
A&B Land Sales Data - Maui & Kauai 2011-2016
| Total
Acres Sold | Weighted Average Price Per Acre | High | Low | |||||||||||||||||
| Ag-zoned | ||||||||||||||||||||
| 0-5 acres | 10 | $ | 116,400 | $ | 151,600 | $ | 84,400 | |||||||||||||
| 5-20 acres | 66 | $ | 71,700 | $ | 104,200 | $ | 35,600 | |||||||||||||
| 20-100 acres | 554 | $ | 30,500 | $ | 55,700 | $ | 13,750 | |||||||||||||
| 100+acres | 1,231 | $ | 24,800 | $ | 35,450 | $ | 14,600 | |||||||||||||
| Total/Weighted Average | 1,861 | $ | 28,700 | $ | 151,600 | $ | 13,750 | |||||||||||||
| Urban-zoned | ||||||||||||||||||||
| 0-3 acres | 8 | $ | 2,360,450 | $ | 4,600,000 | $ | 435,600 | |||||||||||||
| 3-25 acres | 62 | $ | 1,644,700 | $ | 2,814,000 | $ | 718,700 | |||||||||||||
| Total/Weighted Average | 70 | $ | 1,726,500 | $ | 4,600,000 | $ | 435,600 | |||||||||||||
| 21 |
Alexander & Baldwin, Inc.
Materials & Construction Select Data
($ in millions, except crew days)
| Historical EBITDA | 1Q | 2Q | 3Q | 4Q | Full Year | |||||||||||||||
| 2016 | 10.4 | 7.8 | 8.0 | 26.2 | ||||||||||||||||
| 2015 | 9.5 | 9.7 | 10.2 | 11.7 | 41.1 | |||||||||||||||
| 2014 | 7.2 | 11.4 | 9.0 | 10.4 | 38.0 | |||||||||||||||
| 2013 | (a) | (a) | (a) | 6.8 | 6.8 | |||||||||||||||
| Aggregate used/sold (tons in thousands) | 1Q | 2Q | 3Q | 4Q | Full Year | |||||||||||||||
| 2016 | 183.2 | 159.5 | 158.1 | 500.8 | ||||||||||||||||
| 2015 | 235.0 | 234.4 | 180.5 | 190.3 | 840.2 | |||||||||||||||
| 2014 | 145.4 | 167.5 | 166.0 | 232.5 | 711.4 | |||||||||||||||
| 2013 | (a) | (a) | (a) | 112.3 | 112.3 | |||||||||||||||
| Asphalt placed (tons in thousands) | 1Q | 2Q | 3Q | 4Q | Full Year | |||||||||||||||
| 2016 | 117.9 | 86.9 | 126.9 | 331.7 | ||||||||||||||||
| 2015 | 116.4 | 115.5 | 106.9 | 127.9 | 466.7 | |||||||||||||||
| 2014 | 108.9 | 149.4 | 98.7 | 113.5 | 470.5 | |||||||||||||||
| 2013 | (a) | (a) | (a) | 114.5 | 114.5 | |||||||||||||||
| Backlog | 31-Mar | 30-Jun | 30-Sep | 31-Dec | |||||||||||||
| 2016 | 225.7 | 264.1 | 242.5 | ||||||||||||||
| 2015 | 205.0 | 249.7 | 242.0 | 225.7 | |||||||||||||
| 2014 | 255.6 | 247.5 | 233.9 | 217.6 | |||||||||||||
| 2013 | (a) | (a) | (a) | 217.1 | |||||||||||||
| Oahu crew days lost to weather | 1Q | 2Q | 3Q | 4Q | Full Year | |||||||||||||||
| 2016 | 28.0 | 52.5 | 78.5 | 159.0 | ||||||||||||||||
| 2015 | 25.0 | 14.0 | 79.0 | 57.5 | 175.5 | |||||||||||||||
| 2014 | 28.0 | 37.0 | 19.5 | 36.0 | 120.5 | |||||||||||||||
| 2013 | (a) | (a) | (a) | 15.0 | 15.0 | |||||||||||||||
| Oahu total available crew days | 1Q | 2Q | 3Q | 4Q | Full Year | |||||||||||||||
| 2016 | 377.0 | 378.0 | 444.0 | 1199.0 | ||||||||||||||||
| 2015 | 354.0 | 364.0 | 384.0 | 387.0 | 1489.0 | |||||||||||||||
| 2014 | 330.0 | 378.0 | 322.0 | 327.0 | 1357.0 | |||||||||||||||
| 2013 | (a) | (a) | (a) | 315.0 | 315.0 | |||||||||||||||
| (a) | Grace was acquired on October 1, 2013. |
See appendix for a statement about management's use on non-GAAP financial measures and a reconciliation of Materials & Construction operating profit to segment EBITDA.
| 22 |
Appendix

| 23 |
Alexander & Baldwin, Inc.
Management’s Use of Non-GAAP Financial Measures
The Company presents the following Non-GAAP financial measures in this Real Estate Supplement:
| · | Consolidated Company FFO (Funds Flow from Operations) |
| · | Consolidated Company EBITDA (Earnings Before Interest, Taxes, Depreciation and Amortization) |
| · | Materials & Construction segment EBITDA |
| · | Commercial Real Estate Segment NOI and same-store NOI |
The calculations of these financial measures are described in the Glossary of Terms on page 4-5 of this Supplement.
The Company uses these Non-GAAP measures when evaluating operating performance because management believes that they provide additional insight into the Company’s and segment’s core operating results, future cash flow generation and/or the underlying business trends affecting performance on a consistent and comparable basis from period to period. These measures generally are provided to investors as an additional means of evaluating the performance of ongoing core operations. The Non-GAAP financial information presented herein should be considered supplemental to, and not as a substitute for, or superior to, financial measures calculated in accordance with GAAP.
Required reconciliations of these Non-GAAP financial measures to the most directly comparable financial measure calculated and presented in accordance with GAAP are set forth in the following pages of this appendix.
| 24 |
Alexander & Baldwin, Inc.
Reconciliation of Net Income (Loss) Available to A&B Shareholders to Funds from Operations
($ in millions)
| Three Months Ended | Nine Months Ended | |||||||||||||||
| September 30, | September 30, | |||||||||||||||
| 2016 | 2015 | 2016 | 2015 | |||||||||||||
| Net Income (Loss) Available to A&B Shareholders | $ | (1.5 | ) | $ | 5.4 | $ | (9.2 | ) | $ | 40.5 | ||||||
| (Gain)/Loss on sale of real estate | - | - | (8.1 | ) | (1.9 | ) | ||||||||||
| Add: Depreciation and amortization on real estate1 | 7.0 | 7.5 | 21.9 | 23.6 | ||||||||||||
| Income tax expense (benefit) adjustment: | ||||||||||||||||
| (Gain)/Loss on sale of real estate | - | - | 3.2 | 0.7 | ||||||||||||
| Depreciation and amortization on real estate | (3.0 | ) | (3.1 | ) | (9.2 | ) | (9.6 | ) | ||||||||
| FFO | $ | 2.5 | $ | 9.8 | $ | (1.4 | ) | $ | 53.3 | |||||||
1 Excludes depreciation and amortization of real estate in Agribusiness and Materials & Construction
| Items included in net income and FFO | ||||||||||||||||
| HC&S sugar cessation costs | $ | 17.6 | $ | - | $ | 51.6 | $ | - | ||||||||
| Commercial Real Estate acqusition costs | - | 0.1 | 1.4 | 0.2 | ||||||||||||
| Income tax expense (benefit) adjustment: | ||||||||||||||||
| HC&S sugar cessation costs | (6.9 | ) | - | (20.1 | ) | - | ||||||||||
| Commercial Real Estate acqusition costs | - | - | (0.6 | ) | (0.1 | ) | ||||||||||
| Total | $ | 10.7 | $ | 0.1 | $ | 32.3 | $ | 0.1 | ||||||||
| 25 |
Alexander & Baldwin, Inc.
Reconciliation of Consolidated Net Income (Loss) to EBITDA
($ in millions)
| Three months ended September 30, | Nine months ended September 30, |
||||||||||||||||||||||||||||||
| 2016 | 2015 | % Change | 2016 | 2015 | % Change | ||||||||||||||||||||||||||
| Net Income (Loss) | $ | (1.4 | ) | $ | 7.0 | (120 | %) | $ | (9.0 | ) | $ | 43.0 | (121 | %) | |||||||||||||||||
| Adjustments: | |||||||||||||||||||||||||||||||
| Depreciation and amortization | 28.7 | 13.8 | 108 | % | 83.5 | 41.8 | 100 | % | |||||||||||||||||||||||
| Interest | 6.4 | 6.5 | (2 | %) | 20.1 | 20.2 | 0 | % | |||||||||||||||||||||||
| Taxes | (2.4 | ) | 3.8 | (163 | %) | (21.6 | ) | 26.4 | (182 | %) | |||||||||||||||||||||
| EBITDA | $ | 31.3 | $ | 31.1 | 1 | % | $ | 73.0 | $ | 131.4 | (44 | %) | |||||||||||||||||||
| 26 |
Alexander & Baldwin, Inc.
Reconciliation of Materials & Construction Segment Operating Profit to EBITDA
($ in millions)
| 1Q16 | 2Q16 | 3Q16 | 4Q16 | 2016 YTD | ||||||||||||||||
| Materials & Construction segment operating profit (excludes interest and taxes) | $ | 8.0 | $ | 4.9 | $ | 5.6 | $ | 18.5 | ||||||||||||
| Adjustments: | ||||||||||||||||||||
| Depreciation and amortization | 2.9 | 3.0 | 2.9 | 8.8 | ||||||||||||||||
| Income attributable to non-controlling interest | (0.5 | ) | (0.1 | ) | (0.5 | ) | (1.1 | ) | ||||||||||||
| Materials & Construction segment EBITDA | $ | 10.4 | $ | 7.8 | $ | 8.0 | $ | 26.2 | ||||||||||||
| 1Q15 | 2Q15 | 3Q15 | 4Q15 | 2015 | ||||||||||||||||
| Materials & Construction segment operating profit (excludes interest and taxes) | $ | 7.2 | $ | 7.0 | $ | 7.5 | $ | 9.2 | $ | 30.9 | ||||||||||
| Adjustments: | ||||||||||||||||||||
| Depreciation and amortization | 2.9 | 3.0 | 3.0 | 2.8 | 11.7 | |||||||||||||||
| Income attributable to non-controlling interest | (0.6 | ) | (0.3 | ) | (0.3 | ) | (0.3 | ) | (1.5 | ) | ||||||||||
| Materials & Construction segment EBITDA | $ | 9.5 | $ | 9.7 | $ | 10.2 | $ | 11.7 | $ | 41.1 | ||||||||||
| 1Q14 | 2Q14 | 3Q14 | 4Q14 | 2014 | ||||||||||||||||
| Materials & Construction segment operating profit (excludes interest and taxes) | $ | 3.4 | $ | 8.0 | $ | 5.9 | $ | 8.6 | $ | 25.9 | ||||||||||
| Adjustments: | ||||||||||||||||||||
| Depreciation and amortization | 4.2 | 4.4 | 3.7 | 2.9 | 15.2 | |||||||||||||||
| Income attributable to non-controlling interest | (0.4 | ) | (1.0 | ) | (0.6 | ) | (1.1 | ) | (3.1 | ) | ||||||||||
| Materials & Construction segment EBITDA | $ | 7.2 | $ | 11.4 | $ | 9.0 | $ | 10.4 | $ | 38.0 | ||||||||||
| 4Q13 | 2013 YTD | |||||||
| (a) | (a) | |||||||
| Materials & Construction segment operating profit (excludes interest and taxes) | $ | 2.9 | $ | 2.9 | ||||
| Adjustments: | ||||||||
| Depreciation and amortization | 4.4 | 4.4 | ||||||
| Income attributable to non-controlling interest | $ | (0.5 | ) | $ | (0.5 | ) | ||
| Materials & Construction segment EBITDA | $ | 6.8 | $ | 6.8 | ||||
| (a) | Segment was formed on October 1, 2013 with the acquisition of Grace Pacific. |
| 27 |
Alexander & Baldwin, Inc.
Reconciliation of Commercial Real Estate Operating Profit to NOI (Non-GAAP)
($ in millions, unaudited)
| Quarter Ended September 30, | ||||||||||||||||||||||||||||
| 2016 | 2015 | |||||||||||||||||||||||||||
| Hawaii | Mainland | Total | Hawaii | Mainland | Total | Change | ||||||||||||||||||||||
| Commercial Real Estate Operating Profit | $ | 12.9 | $ | 0.8 | $ | 13.7 | $ | 11.2 | $ | 1.3 | $ | 12.5 | 9.6 | % | ||||||||||||||
| Adjustments: | ||||||||||||||||||||||||||||
| Depreciation and amortization | 5.4 | 1.6 | 7.0 | 5.0 | 2.4 | 7.4 | (5.4 | )% | ||||||||||||||||||||
| Straight-line lease adjustments | (0.5 | ) | 0.1 | (0.4 | ) | (0.8 | ) | — | (0.8 | ) | (50.0 | )% | ||||||||||||||||
| General and administrative expenses | 0.7 | 0.1 | 0.8 | 1.0 | 0.3 | 1.3 | (38.5 | )% | ||||||||||||||||||||
| Commercial Real Estate NOI | 18.5 | 2.6 | 21.1 | 16.4 | 4.0 | 20.4 | 3.4 | % | ||||||||||||||||||||
| Acquisitions / disposition and other adjustments | (1.5 | ) | (0.1 | ) | (1.6 | ) | (0.3 | ) | (1.3 | ) | (1.6 | ) | 0.0 | % | ||||||||||||||
| Commercial Real Estate Same-Store NOI | $ | 17.0 | $ | 2.5 | $ | 19.5 | $ | 16.1 | $ | 2.7 | $ | 18.8 | 3.7 | % | ||||||||||||||
| Nine Months Ended September 30, | ||||||||||||||||||||||||||||
| 2016 | 2015 | |||||||||||||||||||||||||||
| Hawaii | Mainland | Total | Hawaii | Mainland | Total | Change | ||||||||||||||||||||||
| Commercial Real Estate Operating Profit | $ | 38.7 | $ | 3.9 | $ | 42.6 | $ | 34.8 | $ | 4.8 | $ | 39.6 | 7.6 | % | ||||||||||||||
| Adjustments: | ||||||||||||||||||||||||||||
| Depreciation and amortization | 15.9 | 5.8 | 21.7 | 14.3 | 7.5 | 21.8 | (0.5 | )% | ||||||||||||||||||||
| Straight-line lease adjustments | (1.9 | ) | 0.3 | (1.6 | ) | (2.1 | ) | — | (2.1 | ) | (23.8 | )% | ||||||||||||||||
| General and administrative expenses | 2.6 | 0.5 | 3.1 | 2.4 | 0.7 | 3.1 | — | |||||||||||||||||||||
| Other | — | — | — | 0.3 | — | 0.3 | (100.0 | )% | ||||||||||||||||||||
| Commercial Real Estate NOI | 55.3 | 10.5 | 65.8 | 49.7 | 13.0 | 62.7 | 4.9 | % | ||||||||||||||||||||
| Acquisitions / disposition and other adjustments | (6.4 | ) | (2.5 | ) | (8.9 | ) | (2.2 | ) | (4.7 | ) | (6.9 | ) | 29.0 | % | ||||||||||||||
| Commercial Real Estate Same-Store NOI | $ | 48.9 | $ | 8.0 | $ | 56.9 | $ | 47.5 | $ | 8.3 | $ | 55.8 | 2.0 | % | ||||||||||||||
| 28 |
Alexander & Baldwin, Inc.
Reconciliation of Commercial Real Estate Operating Profit to NOI Trailing 12 months (Non-GAAP)
($ in millions, unaudited)
| Trailing 12 Months Ended September 30, 2016 | ||||||||||||
| Hawaii | Mainland | Total | ||||||||||
| Commercial Real Estate Operating Profit | $ | 50.8 | $ | 5.3 | $ | 56.1 | ||||||
| Adjustments: | ||||||||||||
| Depreciation and amortization | 20.5 | 8.3 | 28.8 | |||||||||
| Straight-line lease adjustments | (2.7 | ) | 0.9 | (1.8 | ) | |||||||
| General and administrative expenses | 3.2 | 0.7 | 3.9 | |||||||||
| Commercial Real Estate NOI | $ | 71.8 | $ | 15.2 | $ | 87.0 | ||||||
| 29 |
Exhibit 99.2

1 Alexander & Baldwin, Inc. PREMIER HAWAII REAL ESTATE COMPANY Investor Day Presentation November 2, 2016

2 Topic Speaker Welcome C. Benjamin Company Overview: Why Hawaii? Why A&B? C. Benjamin Lunch Service – 15 - Minute Break Lunch Presentation – Platform for Value Creation: Knowledge . Creativity. Expertise. J. Pauker Hawaii Commercial Portfolio: High - Performing Assets with Embedded Opportunity L. Parker Development: Advancing & Monetizing a Diverse Pipeline L. Parker Acquisitions: The Landscape for Investing in Hawaii Real Estate J. Pauker Land: Stewardship & Value Creation on our 87,500 Acres G. Morvis Materials & Construction: Generating Solid Cash Flows G. Morvis Financials: Highlights, Capital Structure & Reporting P. Ito Evaluation of the REIT Structure: Structure Follows Strategy P. Ito Closing Remarks and Q&A C. Benjamin Agenda

3 Statements in this call and presentation that are not historical facts, including potential benefits, consequences and impact of a potential REIT conversion, are "forward - looking statements" within the meaning of the Private Securities Litigation Reform Act of 1995 , that involve a number of risks and uncertainties that could cause actual results to differ materially from those contemplated by the relevant forward - looking statement . These forward - looking statements are not guarantees of future performance . This release should be read in conjunction with pages 17 - 29 of Alexander & Baldwin, Inc . ’s 2015 Form 10 - K and other filings with the SEC through the date of this release, which identify important factors that could affect the forward - looking statements in this release . We do not undertake any obligation to update our forward - looking statements . These forward - looking statements include, but are not limited to, the Company’s plans regarding (i) the possibility of converting to a REIT and the timing thereof, and (ii ) the potential advantages, benefits and impact of, and opportunities created by, converting to a REIT . Such forward - looking statements are subject to certain risks, uncertainties and assumptions, including prevailing market conditions and the following : • There are a number of implementation and operational complexities to address before the Company decides whether to pursue a REIT conversion, including possible internal reorganizations . The Company can provide no assurance as to whether it will convert to a REIT . • REIT qualification involves the application of highly technical and complex provisions of the Internal Revenue Code of 1986 , as amended, as well as various factual determinations not entirely within the Company’s control . If the Company determines to convert to a REIT, the Company cannot give assurance that it will so qualify or remain so qualified . • The Company can give no assurances that its board of directors will approve a conversion to a REIT, even if there are no impediments to such conversion . • The Company’s exploration of a potential REIT conversion may create a potential diversion in our management's attention from traditional business concerns . Disclosure
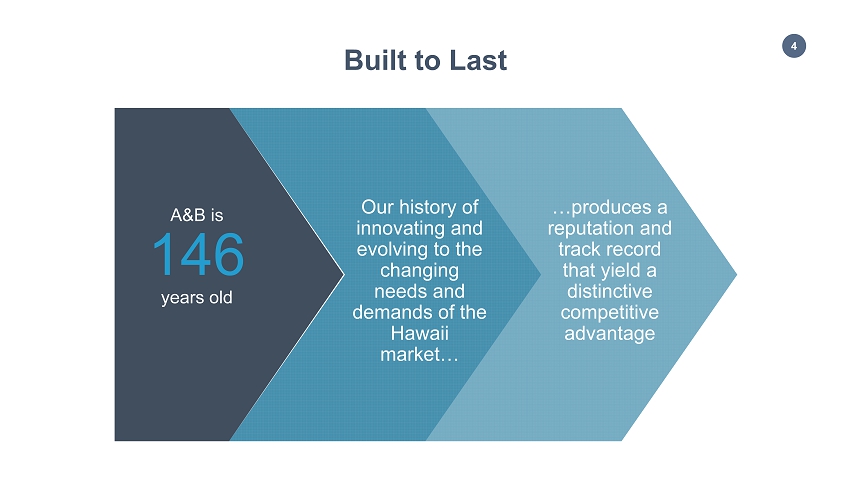
4 Built to Last A&B is 146 years old Our history of innovating and evolving to the changing needs and demands of the Hawaii market… …produces a reputation and track record that yield a distinctive competitive advantage
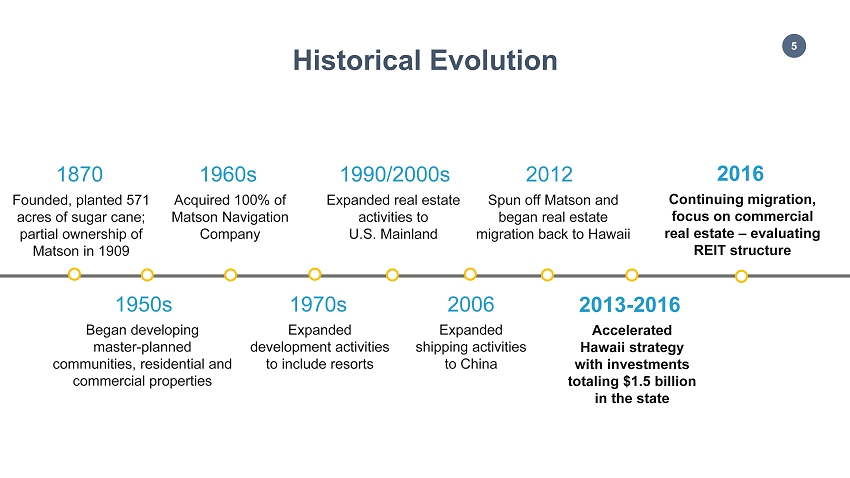
5 Began developing master - planned communities, residential and commercial properties 1950s Acquired 100% of Matson Navigation Company 1960s Expanded real estate activities to U.S . Mainland 1990/2000s Spun off Matson and began real estate migration back to Hawaii 2012 Historical Evolution Continuing migration, focus on commercial real estate – evaluating REIT structure 2016 Accelerated Hawaii strategy with investments totaling $1.5 billion in the state 2013 - 2016 Founded, planted 571 acres of sugar cane; partial ownership of Matson in 1909 1870 Expanded development activities to include resorts 1970s Expanded shipping activities to China 2006

6 Separation 2012 Migrating mainland assets to Hawaii Expanding income from existing portfolio Investing, advancing & monetizing development pipeline Stabilizing or de - risking landholding activities Investing in complementary businesses Strategic Priorities Post Separation 01 02 03 04 05
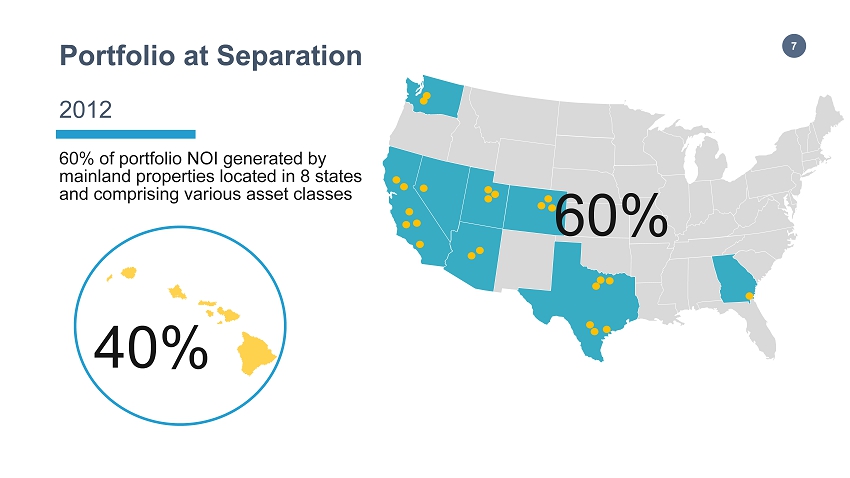
7 Portfolio at Separation 60% of portfolio NOI generated by mainland properties located in 8 states and comprising various asset classes 60% 40% 2012

8 Hawaii Focus Opportunistic migration of mainland portfolio to Hawaii over time 15% 85% Today

9 Expand Commercial Portfolio 0 10 20 30 40 50 60 70 80 90 100 2011 2012 2013 2014 2015 TTM 9/30/16 $87.0 $63.1 $68.8 $77.3 * Includes NOI from ground leases $83.9 Note: See appendix for a statement on management’s use of non - GAAP financial measures and required reconciliations. Net Operating Income* ($ in Millions) $60.8 43% Hawaii Mainland
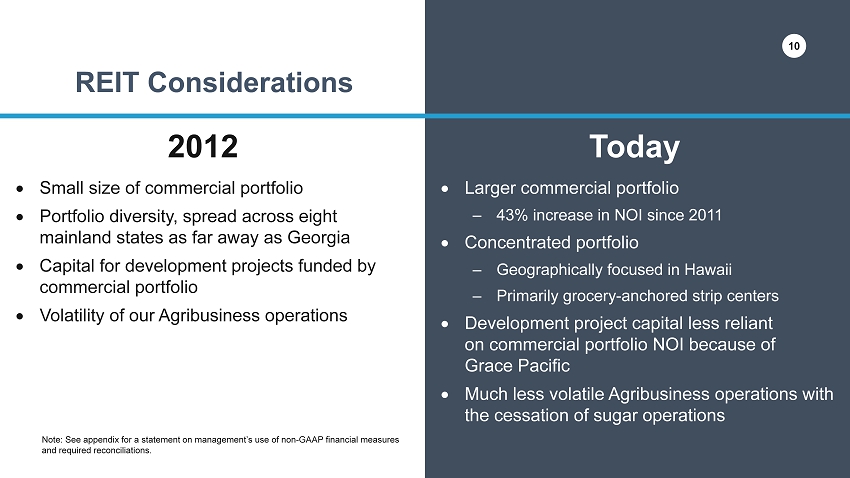
10 S mall size of commercial portfolio P ortfolio diversity, spread across eight mainland states as far away as Georgia Capital for development projects funded by commercial portfolio Volatility of our Agribusiness operations REIT Considerations Today 2012 Larger commercial portfolio – 43% increase in NOI since 2011 Concentrated portfolio – Geographically focused in Hawaii – Primarily grocery - anchored strip centers Development project capital less reliant on commercial portfolio NOI because of Grace Pacific Much less volatile Agribusiness operations with the cessation of sugar operations 10 Note: See appendix for a statement on management’s use of non - GAAP financial measures and required reconciliations.

11 Why A&B? 2 Reasons 01 02 Hawaii is an attractive market A&B is the best public company vehicle to invest in Hawaii real estate
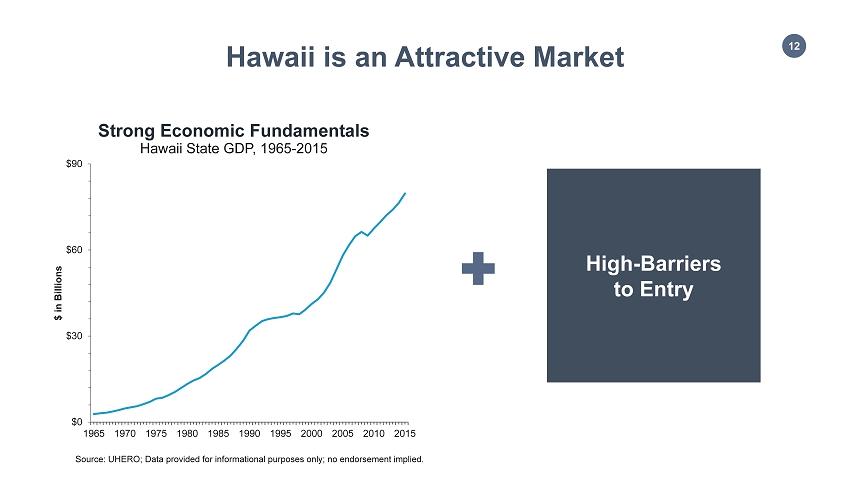
12 Hawaii is an Attractive Market High - Barriers to Entry Hawaii State GDP, 1965 - 2015 Strong Economic Fundamentals Source : UHERO ; Data provided for informational purposes only; no endorsement implied. $0 $30 $60 $90 1965 1970 1975 1980 1985 1990 1995 2000 2005 2010 2015 $ in Billions

13 Sources: Bureau of Economic Analysis, Defense Manpower Data Center, and Chmura Economics & Analytics; U.S. Census Bureau, Population Division & 2014 Annual Survey of State Government Finances; Office of Economic Adjustment ; UHERO; Data provided for informational purposes only; no endorsement implied . $8,720 $5,352 $6,387 $1,312 State Federal Defense Government Spending Per Capita Hawaii U.S. Average #7 #2 Steady Government Spending Government Spending in Hawaii Rank State % of State GDP 1 Virginia 11.8% 2 Hawaii 9.9% 3 Alabama 5.9% 4 District of Columbia 5.8% 5 Alaska 5.7% Military Spending as Share of State GDP $0 $4 $8 $12 $16 $20 '97 '99 '01 '03 '05 '07 '09 '11 '13 '15 $ in Billions

14 Japan Resilient Visitor Industry 0 3 6 9 12 15 18 2000 2001 2002 2003 2004 2005 2006 2007 2008 2009 2010 2011 2012 2013 2014 2015 TTM 9/30/16 $ in Billions Visitor Expenditures 9/11 Great Recession Devaluation of Yen U.S. The longer view of visitor expenditures demonstrates the resiliency of Hawaii’s major economic growth engine. Tohoku Earthquake & Tsunami Other International Source : HTA; Data provided for informational purposes only; no endorsement implied .

15 Source : State of Hawaii Office of Planning Although there are over 4 million acres in Hawaii, only 5% of the island is designated for urban use, creating a much - restricted supply of developable land. State Acreage by Use Agriculture Conservation Urban 1,885,150 (46%) 2,022,322 (49%) 204,441 ( 5 %) Restricted Supply of Urban Land

16 The land entitlement and development process in Hawaii is complex and time consuming heightening the importance of local knowledge and serving as a barrier to entry for outsiders. A Structural Barrier to New Supply Source : Lee Sichter LLC, 2014; Data provided for informational purposes only; no endorsement implied .
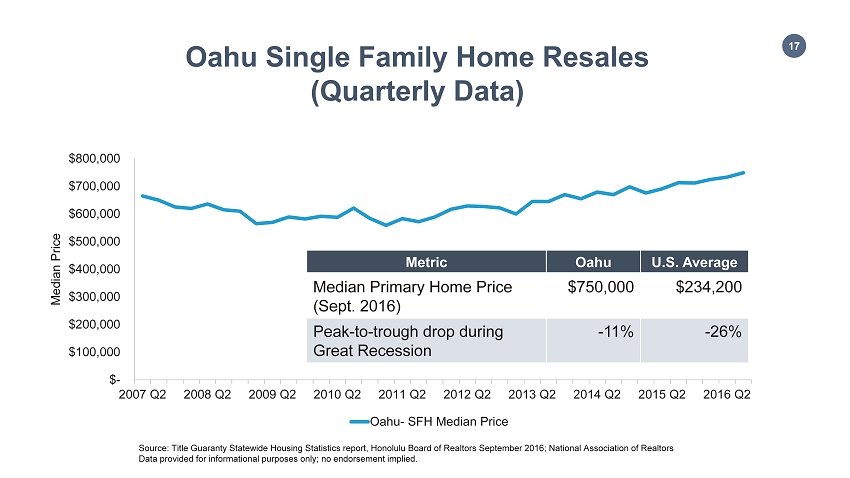
17 Source: Title Guaranty Statewide Housing Statistics report , Honolulu Board of Realtors September 2016; National Association of Realtors Data provided for informational purposes only; no endorsement implied. $- $100,000 $200,000 $300,000 $400,000 $500,000 $600,000 $700,000 $800,000 2007 Q2 2008 Q2 2009 Q2 2010 Q2 2011 Q2 2012 Q2 2013 Q2 2014 Q2 2015 Q2 2016 Q2 Median Price Oahu- SFH Median Price Metric Oahu U.S. Average Median Primary Home Price (Sept. 2016) $750,000 $234,200 Peak - to - trough drop during Great Recession - 11% - 26% Oahu Single Family Home Resales (Quarterly Data)

18 Why Hawaii? 01 02 Hawaii has strong economic fundamentals, anchored by government spending, tourism, and real estate. Hawaii is a high - barrier - to - entry market due to limited urban - zoned land and a lengthy and complex entitlement and permitting process. Kailua Beach

19 Why A&B? People Assets Best public company vehicle to invest in Hawaii real estate Strategy A&B’s asset base within Hawaii includes some of the most iconic, valuable and high - potential land and commercial properties in the state A multi - pronged approach to expanding ALEX’s high - quality CRE portfolio and creating value by leveraging human, financial and real assets The Company’s institutional knowledge and reputation are unparalleled in Hawaii, and its team is respected, capable and knowledgeable

20 Platform for Value Creation KNOWLEDGE. CREATIVITY. EXPERTISE. JEFF PAUKER,A&B PROPERTIES VP INVESTMENTS 20

21 Our strong market awareness gives us first looks at, and unique insights into, prime acquisition opportunities Knowledge We’re not afraid of complexity and can craft creative solutions to enhance value Creativity We can apply our development, asset management and leasing expertise to create best - in - class assets Expertise 21

22 93% of the $960M in commercial real estate and development investments sourced by A&B since separation have been off - market, or “first look”, opportunities. A&B gets unique access to opportunities due to our: D eep and broad relationships in the market Long investment track record, giving counterparties confidence in our discretion, capitalization , and execution Deal Year Size ($M) Manoa Marketplace 2016 $82 Kaka’ako Commerce Center 2015 39 Keauhou Place 2015 35 Kaneohe Ranch 2013 373 Pearl Highlands Center 2013 142 Kahala Ave Portfolio 2013 133 The Collection 2013 54 Waianae Mall 2013 30 Napili Plaza 2013 19 Waihonua 2012 33 One Ala Moana 2012 20 Total $960 Knowledge = Deal Flow

23 • Large Oahu portfolio owned by the Castle family and affiliates since the late 19th century • $17M in NOI, primarily from anchored retail and leased fee assets • 66 % of portfolio NOI from Kailua Town assets, comprising 70% of commercial land and 90% of retail GLA Example: Kaneohe Ranch Portfolio Knowledge = Unique Insights Note: See appendix for a statement on management’s use of non - GAAP financial measures and required reconciliations.

24 Kailua Town Kaneohe 3 - Mile + KMCB + Tourism Population 47,140 +10,000 (est.) +3,000 (est.) Households 15,667 2,576 Average HH Income $120,981 Education 45% Kaneohe Marine Corp Base 3 - mile Ring Source: Colliers, A&B; Education Level = share of 25+ aged population with Bachelor’s degree or higher ; Data provided for informational purposes only; no endorsement implied . 24

25 Retail Square Feet Per Capita Undersupplied Submarket 13 16 20 24 3 - mile Trade A rea Oahu Average Hawaii Average U.S. Average 3rd Lowest retail sf per capita of any Oahu trade area 2nd Lowest retail sf per capita in Oahu high - income submarkets Source: Colliers, Nielsen Note: All information excludes the impact of MCBH and tourists; Data provided for informational purposes only; no endorsement implied.
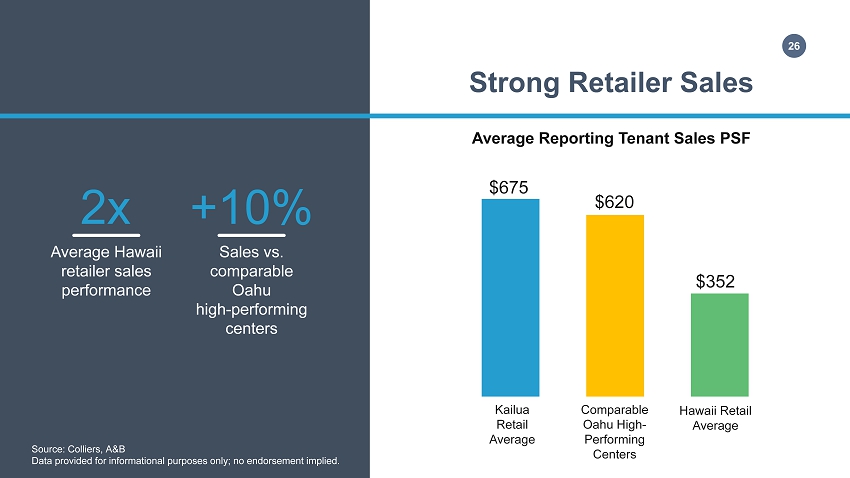
26 Strong Retailer Sales Source: Colliers, A&B Data provided for informational purposes only; no endorsement implied. $675 $352 Kailua Retail Average Hawaii Retail Average Comparable Oahu High - Performing Centers Average Reporting Tenant Sales PSF $620 2x +10% Average Hawaii retailer s ales p erformance Sales vs. comparable Oahu high - performing centers
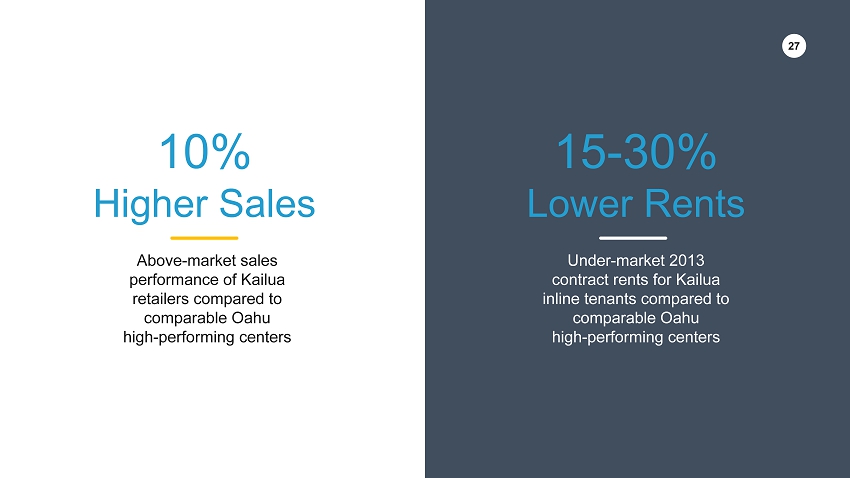
27 15 - 30% Lower Rents Under - market 2013 contract rents for Kailua inline tenants compared to comparable Oahu high - performing centers 10% Higher Sales Above - market sales performance of Kailua retailers compared to comparable Oahu high - performing centers 27

28 In - Place / 2013 2015 Delta Portfolio NOI $17.1M $19.1M +12% Kailua Inline ABR $31.08 $36.96 +19% Kailua Avg. Sales PSF $675 $768 +14% Kailua Occupancy 96% 96% -- Kailua Performance Since Acquisition Note: See appendix for a statement on management’s use of non - GAAP financial measures and required reconciliations.
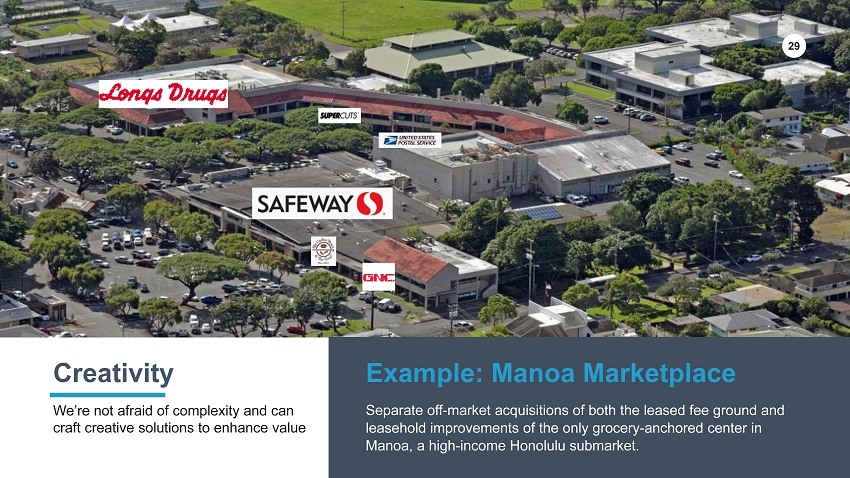
29 Creativity We’re not afraid of complexity and can craft creative solutions to enhance value Example: Manoa Marketplace Separate off - market acquisitions of both the leased fee ground and leasehold improvements of the only grocery - anchored center in Manoa, a high - income Honolulu submarket. 29

30 3 - mile Ring 2015 Demographics 1 - Mile 3 - Mile Population 15,903 206,079 Households 5,575 91,229 Average HH Income $134,004 $86,550 Education 59% 43% Source: Colliers, A&B; Education Level = share of 25+ aged population with Bachelor’s degree or higher; Data provided for informational purposes only; no endorsement implied. 30

31 Leasehold Owner Tenant Fee Owner Leasehold Lender Fee interest owned by kama’aina family for 50 years Leasehold interest owned by mainland owner with only 13 years remaining term Securitized leasehold mortgage with defeasance penalty Leasehold Ownership Puts Asset in Limbo Manoa Marketplace 31

32 1. Identified fulcrum issue: 2019 ground rent reset 2. Pursued leasehold 3. Pursued fee 4. Revisited leasehold 5. Consolidated ownership Creativity = Unlocking Opportunities A Day in the Life of the A&B Investment Team 32

33 $82 $90 $0 $20 $40 $60 $80 $100 A&B Purchase Price (Separate Acquisitions) Market Value (Consolidated Ownership) ~$8 million NAV Increase Based on valuing Manoa Marketplace on a consolidated basis using a 4.8% cap rate, the most recent comp for an Oahu grocery - anchored center Fee Leasehold Manoa Marketplace Value Creation ($ in Millions) Creativity = Unlocking Value Combined 5.3% Cap 4.8% Cap 33
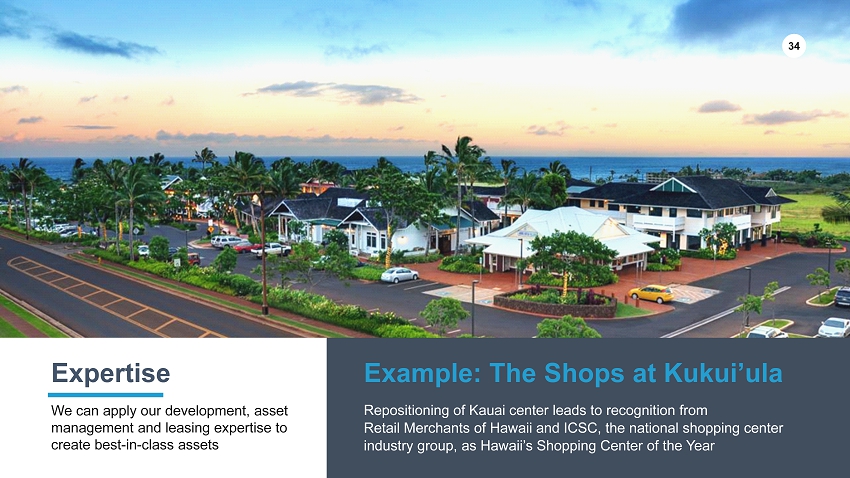
34 Expertise We can apply our development, asset management and leasing expertise to create best - in - class assets Example: The Shops at Kukui’ula Repositioning of Kauai center leads to recognition from Retail Merchants of Hawaii and ICSC, the national shopping center industry group, as Hawaii’s Shopping Center of the Year 34
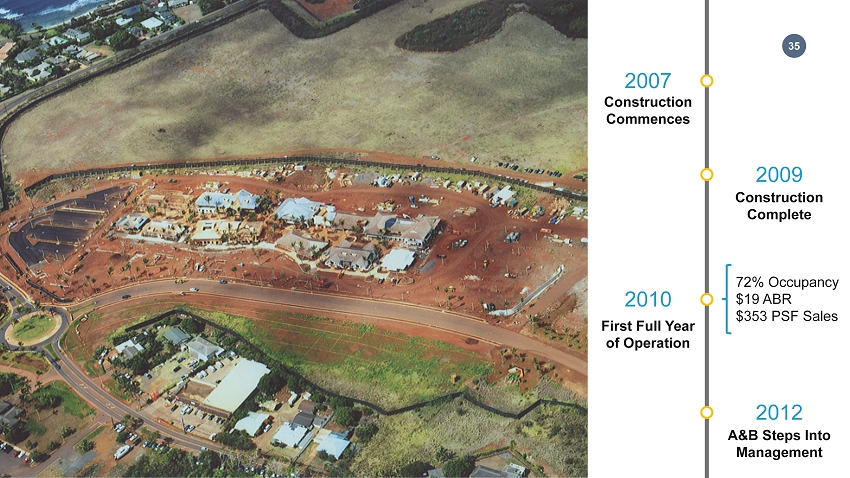
35 Construction Commences 2007 Construction Complete 2009 First Full Year of Operation 2010 A&B Steps Into Management 2012 72% Occupancy $19 ABR $353 PSF Sales

36 Secure Headline Restaurant Convinced star Chef Roy Yamaguchi to close his successful restaurant at direct competitor and open new Eating House 1849 concept at The Shops Attract Top Oahu / Regional Retailers Tori Richard Martin & MacArthur Reyn Spooner Mahina Soha Living Crazy Shirts Grow High Performers Poipu Surf expands 1,500 sf with Poipu Slipper Living Foods expanding 750 sf to include wine bar and sit - down restaurant A&B Asset Management Strategy Attracted Longs / CVS to open a 10,000 - sf store, their only full - line location on Kauai’s south shore Expand Convenience Offering Freed up ~ 5,000 sf of prime ground floor GLA for re - tenanting with high - performing retailers Right - Size Tenancies Based on Performance

37 Retailer Success and Recognition 2016 Hawaii Shopping Center of the Year $353 $678 Avg. Reported Sales PSF 2010 2016 Annualized

38 70% 75% 80% 85% 90% 95% 100% 2010 2011 2012 2013 2014 2015 2016F Occupancy $18 $23 $28 $33 $38 $43 $48 2010 2011 2012 2013 2014 2015 2016F ABR -$1 $0 $1 $2 $3 $4 $5 2010 2011 2012 2013 2014 2015 2016F $in Millions NOI Financial Results Note: 2016 forecast; See appendix for a statement on management’s use of non - GAAP financial measures and required reconciliations.

39 Hawaii Commercial Portfolio HIGH - PERFORMING ASSETS WITH EMBEDDED OPPORTUNITY LANCE PARKER,A&B PROPERTIES PRESIDENT 39

40 Hawaii Portfolio The Company manages a portfolio comprising 4.7 million square feet of leasable space in Hawaii and on the U.S. Mainland. A&B is the largest owner of anchored strip retail centers and is the second largest owner of retail assets in Hawaii. 2.9M sf Total 1.8M sf Retail 839K sf Industrial 207K sf Office Fee Simple Ground Leases 3,184 acres Total 19 acres Kailua 22 acres Other Oahu 3,143 acres Neighbor Island Retail 62% Industrial 16% Office 5% Ground Lease 17% $72M O f Hawaii NOI (TTM 9/30/16) Note: See appendix for a statement on management’s use of non - GAAP financial measures and required reconciliations.

41 Largest Owner of Strip Retail in Hawaii In executing our migration strategy, A&B selected anchored strip retail centers as the asset of choice and targeted several Oahu neighborhoods. 1.8M Square feet 91% Anchored strip retail sf located in key Oahu communities $781 Hawaii grocer average psf $27 Hawaii strip retail average ABR psf
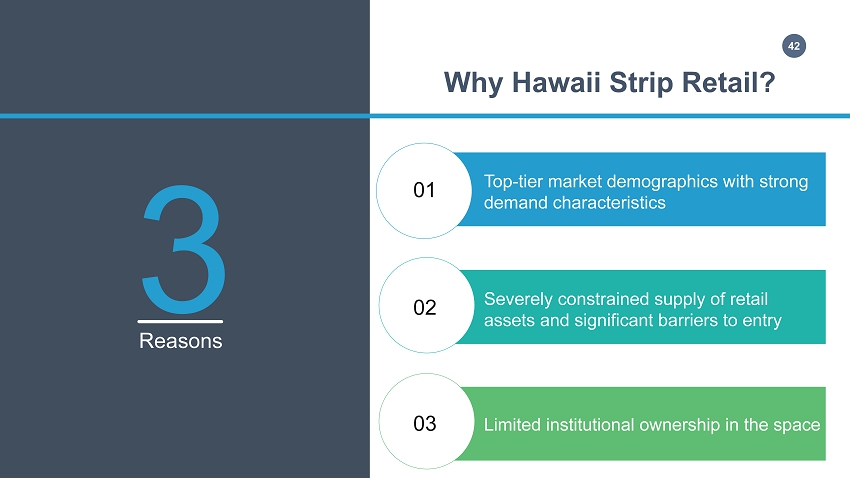
42 Why Hawaii Strip Retail? 01 02 Top - tier market demographics with strong demand characteristics Severely constrained supply of retail assets and significant barriers to entry 03 Limited institutional ownership in the space 3 Reasons

43 Metric Hawaii vs. Green Street Top - 30 Markets Comparable Mainland Market '15 Median Household Income $ 73k Seattle ‘15 Unemployment 3.7% Portland ’15 Visitors per Capita 6.0 San Diego '12 - '15 Income Growth 2.4% Orange County ‘12 - ’15 Employment Growth 1.4% District of Columbia ’12 - ’15 Population Growth 0.9% Orange County Hawaii is a Top Tier Market 7 9 4 29 9 23 Source: Bureau of Labor Statistics (bls.gov); Forbes; deptofnumbers.com; Green Street Advisors Data provided for informational purposes only; no endorsement implied.

44 Hawaii is a High Income Market Source: US Census Bureau, REIS, Green Street Advisors Data provided for informational purposes only; no endorsement implied . +12% +30% Median household i ncome vs. GSA Top - 30 average Median household i ncome vs. U.S. average $73 $65 $56 Hawaii Top-30 Avg U.S. Avg 2015 Median Household Income ($ in thousands)

45 Estimated Tourist Population Permanent Population 214k 2015 Estimated Daily Tourist Population 1 1.2 1.4 1.6 1.8 2007 2008 2009 2010 2011 2012 2013 2014 2015 Hawaii Population: Permanent vs. Tourism Total Population (millions) Permanent Population 1.4 million Hawaii’s strong demographic data does not tell the whole story as the sizeable and affluent tourist population is excluded from most measures. Tourism Adds Layer to Demographic Data Source: HTA Data provided for informational purposes only; no endorsement implied .

46 Source: HTA; Data provided for informational purposes only; no endorsement implied . $0 $2,000 $4,000 $6,000 $8,000 $10,000 $12,000 $14,000 $16,000 Annual Growth in Tourism Dollars Since 2001 10% 9% 4% 3% 0% 4% Other Itnl Canada U.S. West U.S. East Japan Total Tourism Spending is at All - Time Highs Canada U.S. West Other Itnl Japan U.S. East Total Annual Expenditures Broken Out by Region ($ in millions) 46

47 Source: U.S. Census Bureau, US Department of Commerce, NRF. Data provided for informational purposes only; no endorsement implied . $73 $65 $61 $56 $11.4 $9.9 $9.8 $10.1 $8.5 $9.0 $9.5 $10.0 $10.5 $11.0 $11.5 – $10 $20 $30 $40 $50 $60 $70 $80 Hawaii California New York U.S. Avg. 2015 Median Household Income vs. Retail Sales per Capita 2015 Median HH Income (left axis) Retail Sales per Capita (right axis) Income in Thousands Per Capita in Thousands Hawaii’s combination of high - earning residents and affluent tourists leads to outsized retail spending. The Hawaii Economy Benefits From Strong Retail Spending

48 Oahu’s supply constraints restrict its growth, as evidenced by its low annual strip center supply growth over last 10+ years. 95 100 105 110 115 2004 2005 2006 2007 2008 2009 2010 2011 2012 2013 2014 2015 Strip Center Supply Growth Indexed to 100 in 2004 Source : CBRE Econometric Advisors. Data provided for informational purposes only; no endorsement implied . 1.27% 0.86% 0.76% U.S. Avg. Oahu West Coast High-Barrier Avg. Annual Growth (2005 – 2015) A High - Barrier - to - Entry Market U.S. Avg. West Coast High - Barrier Avg. Oahu
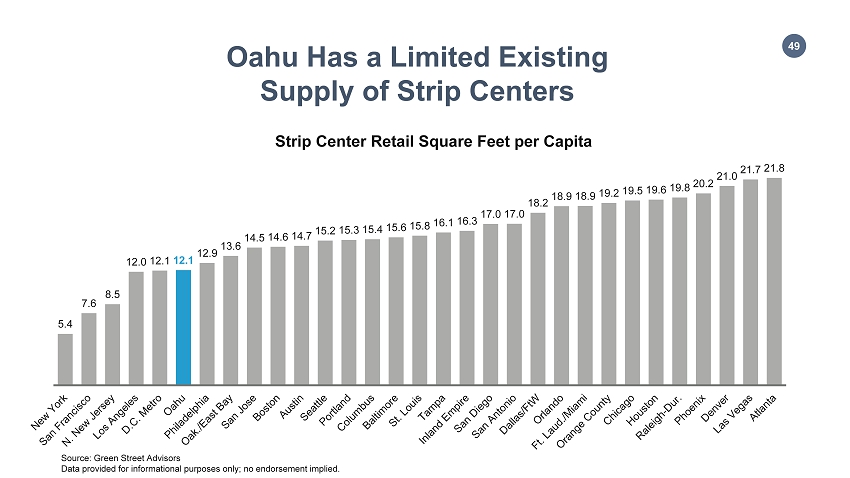
49 5.4 7.6 8.5 12.0 12.1 12.1 12.9 13.6 14.5 14.6 14.7 15.2 15.3 15.4 15.6 15.8 16.1 16.3 17.0 17.0 18.2 18.9 18.9 19.2 19.5 19.6 19.8 20.2 21.0 21.7 21.8 Strip Center Retail Square Feet per Capita Oahu Has a Limited Existing Supply of Strip Centers Source : Green Street Advisors Data provided for informational purposes only; no endorsement implied .
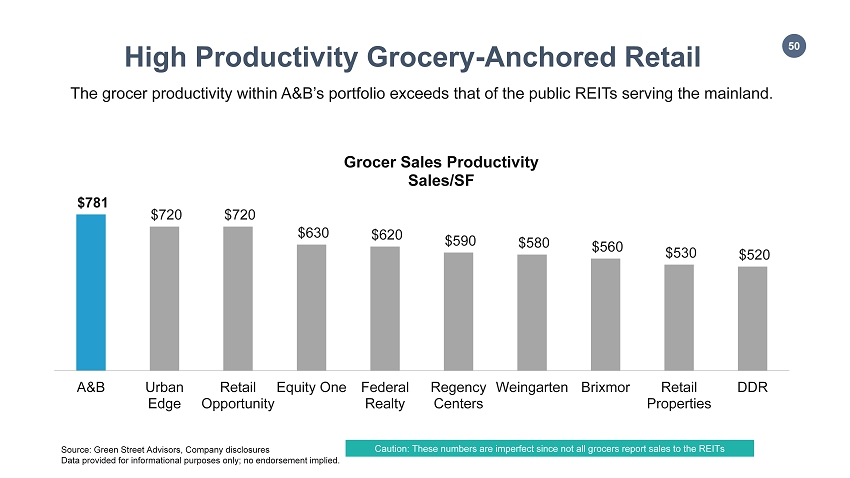
50 Source : Green Street Advisors, Company disclosures Data provided for informational purposes only; no endorsement implied. The grocer productivity within A&B’s portfolio exceeds that of the public REITs serving the mainland. $781 $720 $720 $630 $620 $590 $580 $560 $530 $520 A&B Urban Edge Retail Opportunity Equity One Federal Realty Regency Centers Weingarten Brixmor Retail Properties DDR Grocer Sales Productivity Sales/SF Caution: These numbers are imperfect since not all grocers report sales to the REITs High Productivity Grocery - Anchored Retail

51 An impressive array of national retailers are entering or expanding in Hawaii. Demand for Strip Center Retail Space is Growing

52 Strong Annualized Base Rent A&B’s portfolio ABR exceeds public REIT sector average. $20 $19 $19 $28 $17 $15 $15 $26 $26 $17 $13 $27 $0 $5 $10 $15 $20 $25 $30 Annualized Base Rent (as of 3Q16) Grocer Power Hybrid A&B HI Retail Sector Avg. Source : Green Street Advisors, Company disclosures. Data provided for informational purposes only; no endorsement implied .

53 Opportunities for Growth Traditional A&B Rent Escalations x x Tenant Roll x x Repositioning x x Acquisitions x x Ground Lease Escalations & Reversions x Redevelopment & Build for Hold x

54 Redevelopment of Macy’s will increase NOI from $0.2M to $1.9M - $2.4M with investment of $21M 2016 1 - acre in urban Honolulu with gas & C - store reversion 2018 - 2019 Ground Lease Escalations & Reversions Windward City SC (218,000 sf grocery - anchored center) FMV reset 2023 Pali Palms ( 59,000sf office complex ) FMV reset 2022 $1.6M buyout 9 - year remaining leasehold interest of Aikahi Park Shopping Center at 25% cap rate 2015 Kaimuki SC (86,400 sf grocery - anchored center) FMV reset 2020 Kaiser Permanente FMV reset – 17% NOI increase 2015 3.7 - acre auto dealership reversion 2020 37 % of ground lease ABR expires by 2023. Note: See appendix for a statement on management’s use of non - GAAP financial measures and required reconciliations.

55 Repositioning, Redevelopment & Build for Hold The Company has many repositioning and redevelopment opportunities within its portfolio to increase NOI. In addition, we are exploring ground - up development of assets to hold in our portfolio, including on our historical landholdings.

56 Development ADVANCING & MONETIZING A DIVERSE PIPELINE LANCE PARKER,A&B PROPERTIES PRESIDENT 56

57 • “Stay the course” on active projects to maximize value • De - risk capital through JV structures and selective monetization 57 Reassess portfolio to reduce risks and increase returns Long - Term Focus on opportunistic easy - to - value investments Short - Term Support NOI growth through commercial development Development for Hold Development Strategies • Continue “opportunistic ” development on fully entitled lands • Continue careful assessment of market and prudent structuring of transactions • Expected returns = high teens + IRR • Leverage historic and existing commercial expertise into select redevelopment of existing portfolio and new ground - up opportunities • Expected returns = 150 – 300 bps higher than market cap rates

58 Quick Turn Opportunities & Characteristics years 20% High - rise condominium development – Leverage gained expertise in this segment – Pre - sales and short development/sell out mitigate capital exposure Structured debt investments – Equity - like returns with protective positions in capital stack – Quick capital payback (origination fees & shorter deployment ) – Near - term opportunities given non - traditional debt/equity raises for top - of - cycle deals Average pre - tax IRRs on the 39 real estate developments and investments A&B made outside of its historical landholdings since 2000 Time horizon for projects or investments to return capital or achieve full NAV recognition 3 - 5

59 The Collection Keauhou Place (B Note) Keala O Wailea Kahala Avenue Active Development & Investment – Quick Turn Examples Artist Rendering • Primary Residential – Honolulu, Oahu • 465 units • 454 units binding • Closings begin Nov • $49M book value • Resort Residential – Wailea, Maui • 70 units • 45 units binding • Closings begin Dec 2017 • $9M book value • Primary Residential – Honolulu, Oahu • 423 units • 90% units binding • Closings expected 4Q17 • $35M commitment • Primary Residential – Honolulu, Oahu • 30 lots • 22 lots sold • 1 binding sale • $49M book value Artist Rendering

60 Kukui’ula Kamalani Active Pipeline – Long Term Resort Residential – Poipu, Kauai • 1,500 - unit development • 135 units sold • 7 binding contracts • All amenities (golf course, club house, spa) and major offsite infrastructure complete • $288M book value • Go forward strategy – User lot/home sales – De - risk financial commitment through JV and developer sales Primary Residential – Kihei, Maui • 170 affordable units (Increment 1) • 43 units released • 21 binding contracts • All horizontal infrastructure complete • $13M book value • Go forward strategy – Build vertical for Increment 1 with sufficient pre - sales – Consider de - risking financial commitment for future phases through JV

61 Maui Business Park Wailea Active Pipeline – Long Term Resort Residential – Wailea, Maui • 163 fully entitled acres • All amenities (3 golf courses, resort retail and hotels) and major offsite infrastructure complete • $64M book value • Go forward strategy – Lot inventory sales – For hold development for CRE portfolio – Select “quick - turn” JV residential development Commercial/Industrial B usiness P ark – Kahului, Maui • 135 - acre development • 30 acres sold • 0.5 - acre binding contract • All infrastructure complete • $46M book value • Go forward strategy – Lot inventory sales – For hold development for CRE portfolio

62 Acquisitions THE LANDSCAPE FOR INVESTING IN HAWAII REAL ESTATE JEFF PAUKER, A&B PROPERTIES VP INVESTMENTS 62

63 1.45 2.56 2.58 2.71 2.87 - 0.50 1.00 1.50 2.00 2.50 3.00 3.50 2012 2013 2014 2015 2016 A&B Hawaii GLA by Asset Class Retail Industrial Office GLA (MM SF) Source: Colliers, A&B 91% drug - or grocery - anchored Commercial Portfolio Trajectory Key questions based on our trajectory to date: 1. How much more can A&B grow its anchored retail portfolio before reaching natural constraints? 2. Outside of anchored retail, what other opportunities are there for A&B to grow its commercial portfolio through acquisition? 63
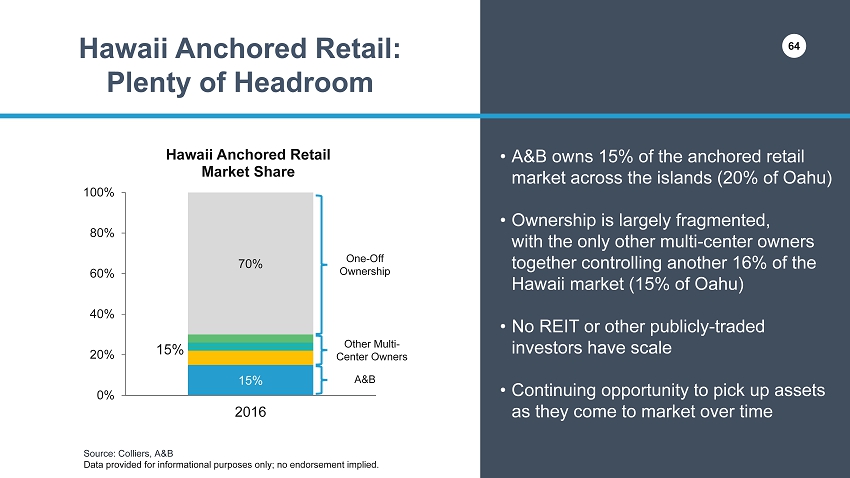
64 Source: Colliers, A&B Data provided for informational purposes only; no endorsement implied . Hawaii Anchored Retail: Plenty of Headroom • A&B owns 15% of the anchored retail market across the islands (20% of Oahu) • Ownership is largely fragmented, with the only other multi - center owners together controlling another 16% of the Hawaii market (15% of Oahu) • No REIT or othe r publicly - traded investors have scale • Continuing opportunity to pick up assets as they come to market over time 15% 70% 0% 20% 40% 60% 80% 100% 2016 Hawaii Anchored Retail Market Share 15% Other Multi - Center Owners A&B One - Off Ownership 64

65 Estimated Oahu Anchored Retail Annual Transaction Volume (2000 - 2015, in 2015 Dollars) ~5% annual market turnover $190M 24% (2000 - 2015) 44% (2012 - 2015) A&B Win Rate $45 - 85M Annual Investment Opportunity in Oahu Anchored Retail; Additional Potential on the Neighbor Islands Commercial Investment Potential Case Study: Oahu Anchored Retail $50M Annual Investment Rate Equates to 150bp Growth in Anchored Retail Market Share / Annum

66 3.8% 4.3% 3.6% - 0.8% 3.7% -1% 0% 1% 2% 3% 4% 5% Anchored Retail Resort Retail Industrial Office Hotel Average Annual Asking Rent Growth, Oahu Asset Classes, 2000 - 2015 96% 92% 97% 89% 79% 70% 75% 80% 85% 90% 95% 100% 105% Anchored Retail Resort Retail Industrial Office Hotel Other CRE Portfolio Expansion Opportunities Note: Resort Retail based on Waikiki submarket only; Hotel rent growth based on change in average ADR as opposed to asking re nt PSF; volatility shown equals one standard deviation Source : Colliers Data provided for informational purposes only; no endorsement implied . Average Occupancy and Volatility in Occupancy, Oahu Asset Classes, 2000 - 2015

67 Source : Green Street Advisors, Company Filings, Alexander & Baldwin Hawaii Industrial Portfolio Data provided for informational purposes only; no endorsement implied . Unlike any mainland market, the extreme lack of industrial space in Hawaii leads to rents more than twice that of mainland REIT portfolios, despite inferior asset quality. $13 $5 $5 $5 $5 $5 $5 $4 31 18 12 17 18 16 21 11 A&B HI Industrial EastGroup Liberty Property Trust DCT Industrial Prologis Avg. Industrial REITs First Industrial Duke Realty Industrial Portfolio Annualized Rent and Average Age Annualized Base Rent Avg. Building Age Industrial Outlier

68 Source : CBRE Econometric Advisors Data provided for informational purposes only; no endorsement implied . The lack of industrial supply and supply growth drives Hawaii’s rents up, with the annual growth rate of Oahu below even that of West Coast high - barrier markets. Low Industrial Supply Growth 189 152 141 90 100 110 120 130 140 150 160 170 180 190 '80 '85 '90 '95 '00 '05 '10 '15 Industrial Supply Growth Indexed in 1980 U.S. West Coast High-Barrier Oahu Annual Supply Growth Rate 1.8% 1.2% 1.0% U.S. West Coast H-B Oahu

69 $0 $564 $0 $39 $82 2012 2013 2014 2015 2016 • Kaneohe Ranch • Pearl Highlands • Waianae Mall • Napili Plaza • Kaka’ako Commerce Center • Manoa Marketplace A&B will continue to create and respond to opportunities as they are identified, implying continuing “lumpiness” in commercial property acquisitions. Opportunistic Approach Will Continue Annual A&B Hawaii CRE Acquisition Volumes ($ in millions)
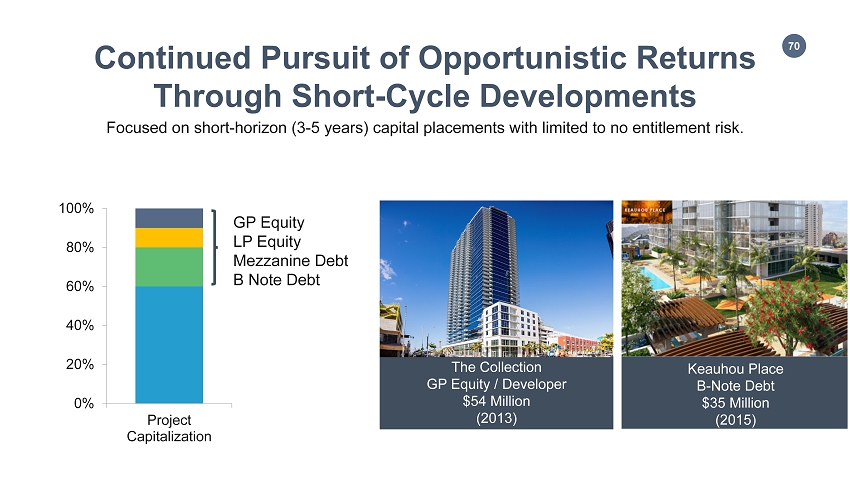
70 Continued Pursuit of Opportunistic Returns Through Short - Cycle Developments Focused on short - horizon (3 - 5 years) capital placements with limited to no entitlement risk. 0% 20% 40% 60% 80% 100% Project Capitalization GP Equity LP Equity Mezzanine Debt B Note Debt The Collection GP Equity / Developer $54 Million (2013) Keauhou Place B - Note Debt $35 Million (2015)
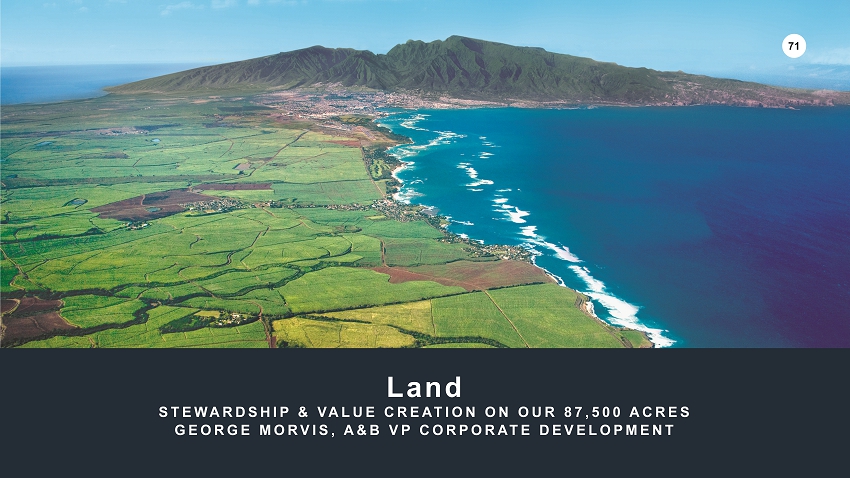
71 Land STEWARDSHIP & VALUE CREATION ON OUR 87,500 ACRES GEORGE MORVIS, A&B VP CORPORATE DEVELOPMENT 71

72 Unlocking Value From Our 87,500 Acres 02 03 04 05 Land Stewardship Parcel Sales Planning & Entitlement Active Development Development sales (lot/unit closings) 01

73 Increasing Focus on Land Management Land Management • Land utilization, stewardship • Long - range planning & entitlement • Infrastructure planning & development • Resource management • Water rights • Water delivery Land Disposition • Subdivisions • Easements • Title • Negotiations (LOIs, PSAs) Ag Operations • Renewable energy • Ag leases • Ranching • Diversified crop farming • Infrastructure maintenance • Erosion control, safety

74 Land Management Philosophy A&B takes an integrated approach to land management, stewarding nearly 87,500 acres of agricultural and conservation lands on Maui and Kauai – 65,000 acres on Maui, over half of which is transitioning from sugar cultivation to an uncertain future – 20,000 acres on Kauai employed in a profitable combination of leasing and renewable energy Primary objectives – Employ lands at their highest and best use – Generate adequate revenues from portfolio of ongoing uses to (1) offset holding costs, (2) over time earn a modest positive cash flow return on land asset value – Selectively monetize or entitle parcels as market, community needs warrant, benefitting from long term land price appreciation Upcoming Maui transition creates opportunities for repurposing Community issues can be expected to arise as lands are transitioned 74

75 Land Management Strategies & Tactics Manage on an integrated basis for long - term value creation – Ongoing planning & dialogue with key stakeholders to ensure appropriate uses, adjacencies, access, etc. across various time horizons – Preservation of resources and infrastructure will preserve agricultural land use values; sustain economic rents over time Land sales & entitlements will be driven by market utility, community needs – Highest and best use of majority of lands will for the foreseeable future with remain in agriculture Most ranching, farming and resource depletion (e.g., forestry, quarrying) operators want to focus on their operations, not land management or infrastructure issues – All else equal, will pay higher economic rents to access lands & resources which allow them to do so Utilize a portfolio approach to mitigate risks

76 Long Range Planning & Entitlement Focus on identifying ag lands suitable for future growth and moving them through Hawaii’s complicated and lengthy entitlement process – Length of process makes it essential to focus on long - term demand – Success not measured solely by speed through process ▪ Nature and cost of exactions is an important factor – A&B’s extensive landholdings on Maui and Kauai enable it to take a measured view of the process ▪ Can take a more flexible approach to exactions ▪ Usually have at least 2 or 3 major projects in the entitlement process Recent entitlement successes include MBP, Phase II and Kamalani Current projects in process include Waiale, Eleele Leverage our entitlement expertise and relationships in our quick turn projects as well (obtaining permits, clearing up issues) Difficulty, length of process and limited supply of urban land result in substantial value uplift from successful negotiation of the entitlement process

77 Land Monetization Utilize a variety of approaches to land monetization Highest value accretion realized by moving lands through entitlement process to urbanization Ag - zoned lands can be monetized through a variety of methods – Parcel sales for ag, gentlemen‘s estate purposes – Ag - lot subdivisions Many factors drive ag land pricing (location, usable acreage, access to irrigation water) A&B’s Ag - zoned land sales from 2011 to 2016 (YTD through 9/30) averaged $28,700 per acre on roughly 310 acres per year sold. Total Acres Sold Weighted Average Price Per Acre High Low Ag - zoned 0 - 5 acres 10 $ 116,400 $ 151,600 $ 84,400 5 - 20 acres 66 $ 71,700 $ 104,200 $ 35,600 20 - 100 acres 554 $ 30,500 $ 55,700 $ 13,750 100+acres 1,231 $ 24,800 $ 35,450 $ 14,600 Total/Weighted Average 1,861 $ 28,700 $ 151,600 $ 13,750

78 Ag Operations Strategies & Tactics Redeploy lands into diversified agricultural using a portfolio approach under a tiered priority framework – Immediate focus on exploring alternatives, accommodating community and market needs, keeping IAL land deployed in ag – Mid - term (three to five year) focus on redeploying/scaling large portions (5,000 acres and higher) in pasture, energy crop, feed crop and orchard uses Utilize agricultural leases and partnerships to mitigate risk, moderate required investment Pursue select operational investments internally Continue modest ongoing investment in infrastructure; infrastructure maintenance Pursue growth in renewable energy activities

79 A Portfolio Approach: The McBryde Example Activity Internal Operations External Partners Infrastructure management Water, Power, Road Systems Renewable Energy Solar, Hydroelectric Cultivation Coffee, Seed Corn, Nursery, Truck Farms Ranching Cattle Depletion Basalt quarrying Ag - aligned uses Coffee Processing, Agricultural Research; Baseyards Redeployed former sugar lands into a variety of uses over an extended period of time Utilize leases, partnerships, vendors in outsourced business model to ensure lands remain deployed at minimal risk with modest overhead. Opportunistically reinvest in growth opportunities (solar farm, hydro expansion) Selectively entitle and sell parcels 79
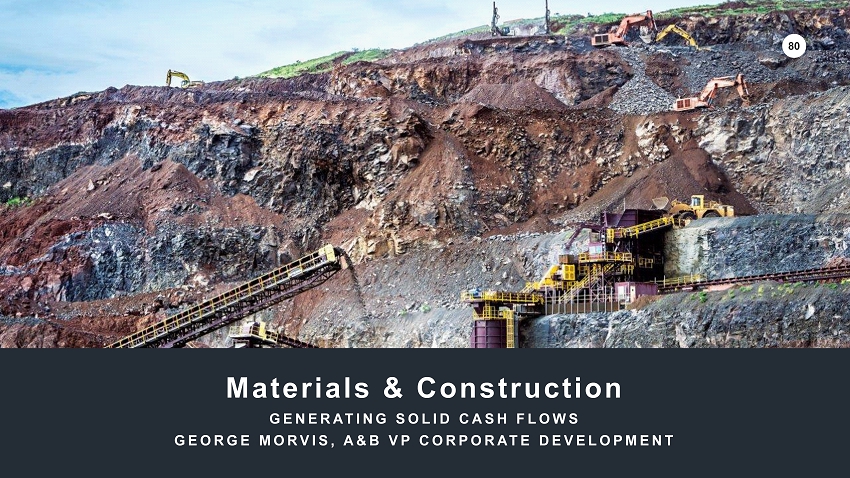
80 Materials & Construction GENERATING SOLID CASH FLOWS GEORGE MORVIS, A&B VP CORPORATE DEVELOPMENT 80

81 Strategic Fit Portfolio Fit Aging Hawaii infrastructure portends elevated level of long - term demand for basalt aggregate, paving Allows A&B to benefit directly from government expenditures Allows A&B to leverage and expand its Hawaii market knowledge, relationships Links to existing businesses Easy to value, depletion based businesses with attractive EBITDA margins, stable cash flows Moderate relative short - to mid - term reinvestment needs Defensive aspect: less volatile than development business, counter - cyclical downside protection provides smoothing impact to non - CRE earnings 81

82 Internal Keys to Success External Keys to Success • Leading market position, knowledge and experience with specific road paving job conditions across the state provide a competitive advantage when bidding • Hawaii’s aging infrastructure provides ample opportunities for high levels of baseline road repaving work; need to continue to win significant share of this competitively bid business • High degree of vertical integration allows for multiple levels of value creation; low unit costs provide potential bidding advantage • Growth on Oahu’s leeward side, home to Grace’s Makakilo quarry, should provide incremental growth opportunities • Relatively new quarry infrastructure provides for higher profitability at higher throughputs • Although Hawaii benefits from year - round paving, wet weather poses significant challenges • Upper management team drawn largely from Boomer cohort, next decade will see significant management succession which recently commenced; Grace must avoid growing pains while undergoing transition • New market entrants can cause havoc given small market size; easy to win bids, but hard to perform work profitably Keys to Success Materials & Construction

83 Materials & Construction 0% 5% 10% 15% 20% 25% 0 5 10 15 20 25 30 35 40 45 2013 (3 Mos.) 2014 2015 2016 (9 Mos) EBITDA MARGIN $ in Millions EBITDA & EBITDA Margin EBITDA EBITDA Margin Note: See appendix for a statement on management’s use of non - GAAP financial measures and required reconciliations.
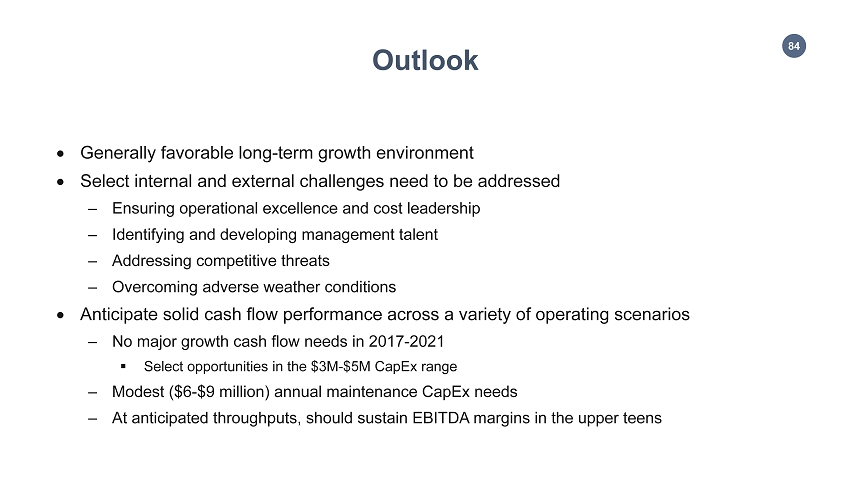
84 Outlook Generally favorable long - term growth environment Select internal and external challenges need to be addressed – Ensuring operational excellence and cost leadership – Identifying and developing management talent – Addressing competitive threats – Overcoming adverse weather conditions Anticipate solid cash flow performance across a variety of operating scenarios – No major growth cash flow needs in 2017 - 2021 ▪ Select opportunities in the $ 3M - $5M CapEx range – Modest ($6 - $9 million) annual maintenance CapEx needs – At anticipated throughputs, should sustain EBITDA margins in the upper teens

85 Financials HIGHLIGHTS, CAPITAL STRUCTURE & REPORTING PAUL ITO, A&B SVP& CFO 85

86 Financial Profile (TTM 9/30/16) 29% 5% 42% 24% Revenue $471.6M 57% 15% 28% Adjusted Operating Profit 54% 26% 16% 4% Total Assets Commercial Real Estate Development Materials & Construction Agribusiness $99.1M Consolidated Adjusted EBITDA $109.1M Market Cap $2.0B $2,224.2M 1 1 Excludes Agribusiness cessation, operating losses and REIT evaluation costs 2 As of October 28, 2016 1 2 Note: See appendix for a statement on management’s use of non - GAAP financial measures and required reconciliations.

87 Low leverage Well - laddered maturity schedule High proportion of fixed rate debt Ample liquidity High proportion of unsecured debt Balance Sheet Philosophy Conservative capital structure to support growth and provide financial flexibility.
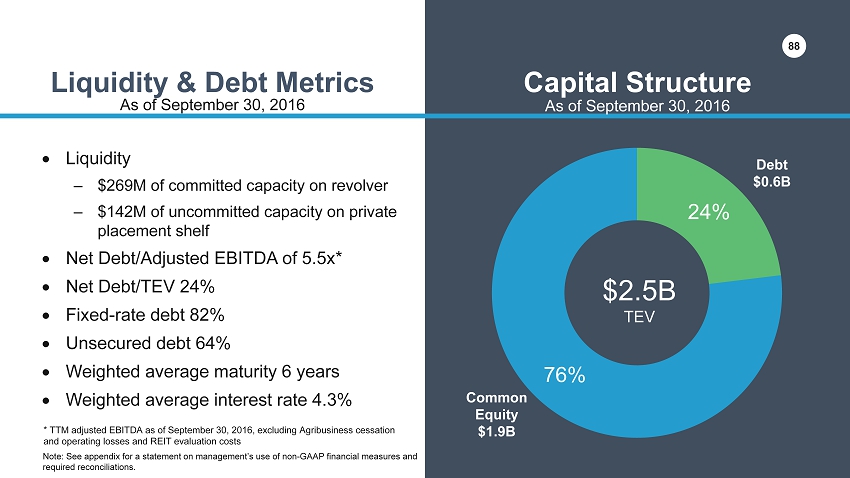
88 24% 76% Liquidity & Debt Metrics Capital Structure Liquidity – $269M of committed capacity on revolver – $142M of uncommitted capacity on private placement shelf Net Debt/Adjusted EBITDA of 5.5x* Net Debt/TEV 24% Fixed - rate debt 82% Unsecured debt 64% Weighted average maturity 6 years Weighted average interest rate 4.3% $2.5B TEV Debt $0.6B Common Equity $1.9B * TTM adjusted EBITDA as of September 30, 2016, excluding Agribusiness cessation and operating losses and REIT evaluation costs As of September 30, 2016 88 Note: See appendix for a statement on management’s use of non - GAAP financial measures and required reconciliations. As of September 30, 2016

89 - 30 60 90 120 150 180 2016 Q4 2017 2018 2019 2020 2021 2022 2023 2024 2025 2026 2027 2028 2029 Unsecured term loans Secured notes payable Unsecured revolving credit Well - Laddered Debt Maturities The Shops at Kukui’ula Revolver ($ in millions) 3.3 Wtd. Avg. Interest Rate 5.6 5.3 5.3 3.3 5.0 4.6 4.7 4.4 3.6 3.1 3.1 4.9 4.4 Pearl Highlands Manoa Marketplace Principal maturities average less than $35M over next 10 years (excluding balloons)

90 Capital Outlook 2017 2018 2019 Low High Low High Low High CRE redevelopment, development, acquisitions $ 75 $ 80 $ 90 $ 110 $ 100 $ 120 CRE maintenance capex 12 12 13 15 13 15 Subtotal 87 92 103 125 113 135 Development - for - sale capital 35 65 25 50 25 70 Material & Construction, Diversified Ag, other 10 15 10 15 10 12 Total budgeted c apital $ 132 $ 172 $ 138 $ 190 $ 148 $ 217 Capital Sources 1031 proceeds - capital recycling $ 50 $ 55 $ 50 $ 75 $ 30 $ 50 Development proceeds 75 100 80 120 25 50 Total $ 125 $ 155 $ 130 $ 195 $ 55 $ 100 (Dollars in Millions)

91 Process Organizational and IT realignment in process to enhance internal management and reporting metrics Disclosures Enhanced investor disclosures • Revised quarterly financial supplement – Itemization of NAV components – New CRE statistics, such as ABR – Statistical info provided for all businesses • Expect further enhancements over time Enhancing Financial Reporting

92 Components of Value Components of Value Amounts as of September 30, 2016 Approach 3Q16 Supplement Pg. Ref. Commercial real estate and ground leases TTM NOI of $87M Apply cap rate to NOI 10 Materials and construction operations TTM EBITDA of $38M Apply blended multiple of materials companies and specialty construction companies 10 Active development projects $468 M of net invested capital DCF; comparable sales; or premium to net invested capital 10, 20 Land not included in above categories 86,058 acres with historical book value of about $150 per acre Comparable sales 11, 21 Note: See appendix for a statement on management’s use of non - GAAP financial measures and required reconciliations.

93 Income producing assets NOI TTM Ended September 30, 2016 Hawaii market cap rate information Income producing assets Range of Market Cap Rates 44.7$ Hawaii retail .............................................................................. 4.0% - 6.0% 11.1$ Hawaii industrial........................................................................ 5.0% - 7.0% 3.7$ Hawaii office............................................................................. 6.0% - 8.0% 12.3$ 2.3$ 4.7$ 8.2$ 87.0$ Hawaii retail ................................................................................................................. Hawaii industrial........................................................................................................... Hawaii office................................................................................................................ Hawaii ground leases................................................................................................. Mainland retail............................................................................................................. Mainland industrial...................................................................................................... Mainland office........................................................................................................... Commercial Real Estate - Hawaii Market InformationCommercial Real Estate - Company Information Components of Value NOI summarized by asset class Hawaii improved market cap rates Note: See appendix for a statement on management’s use of non - GAAP financial measures and required reconciliations. Dollars in Millions

94 Components of Value Peer set consisting of materials and specialty construction companies Development table to be updated quarterly Book Value as of September 30, 2016 Active Development Projects (b) 76.0$ 104.2$ 288.0$ 468.2$ Residential units..................................................................................................................... Lot sales.................................................................................................................................... Multi-product development.............................................................................................. Development Sales - Company Information Note: See appendix for a statement on management’s use of non - GAAP financial measures and required reconciliations. Materials & Construction historical EBITDA 1Q 2Q 3Q 4Q YTD or Full- year Materials and Construction peers: Ticker 2016............................. 10.4$ 7.8$ 8.0$ 26.2$ Cementos Argos S.A.................................................................... CMT 2015............................. 9.5$ 9.7$ 10.2$ 11.7$ 41.1$ CEMEX S.A.B. de C.V.................................................................... CX 2014............................. 7.2$ 11.4$ 9.0$ 10.4$ 38.0$ CRH plc........................................................................................... CRH 2013............................. (a) (a) (a) 6.8$ 6.8$ HeidelbergCement AG............................................................... HDELY Martin Marietta Materials, Inc................................................... MLM Monarch Cement Co.................................................................. MCEM Summit Materials Inc.................................................................... SUM Vulcan Materials Company....................................................... VMC Specialty Construction Companies: Colas SA......................................................................................... RE.PA Granite Construction Inc............................................................ GVA Great Lakes Dredge & Dock Corp........................................... GLDD Orion Group Holdings, Inc.......................................................... ORN Sterling Construction Co. Inc..................................................... STRL Tutor Perini Corporation............................................................... TPC Materials & Construction Company Information Materials & Construction - Market Information Dollars in Millions ( a) Grace Pacific was acquired on October 1, 2013 ( b) The book value of active development projects includes land stated at it's acquisition value. In the case of development project s o n A&B's historical landholdings, such as Kamalani and Maui Business Park, the value of land would be approximately $150 per acre.

95 Components of Value Landholding table provides acreage not valued elsewhere Data on past sales history (c) Conservation land is generally utilized in the collection of water, which benefits the agricultural land, and therefore, generally these lands should not be separately valued. Acres Sold Average High Low Urban..................................................................... 253 70 2,002,575$ 4,600,000$ 435,600$ Urban entitlement process............................. 740 Agriculture............................................................ 55,230 1,861 28,700$ 151,600$ 13,750$ Conservation (c) ........................................... 29,835 Total........................................................................ 86,058 Acres A&B Nominal Sales January 2011-September 2016 Landholdings not valued elsewhere Landholdings - Company Information Dollars in Millions A&B Land Sales Data - Maui & Kauai 2011-2016 Total Acres Sold Weighted Average Price Per Acre High Low Ag-zoned 0-5 acres 10 116,400$ 151,600$ 84,400$ 5-20 acres 66 71,700$ 104,200$ 35,600$ 20-100 acres 554 30,500$ 55,700$ 13,750$ 100+acres 1,231 24,800$ 35,450$ 14,600$ Total/Weighted Average 1,861 28,700$ 151,600$ 13,750$ Urban-zoned 0-3 acres 8 2,360,450$ 4,600,000$ 435,600$ 3-25 acres 62 1,644,700$ 2,814,000$ 718,700$ Total/Weighted Average 70 1,726,500$ 4,600,000$ 435,600$

96 Evaluation of the REIT Structure STRUCTURE FOLLOWS STRATEGY PAUL ITO, A&B SVP & CFO 96

97 Why Convert to a REIT? 01 02 03 Structure aligns with Company’s strategy of growing CRE asset value and allows A&B to compete on a level playing field with out - of - state investors Higher dividends to shareholders Potential expansion of investor base, sell - side coverage and increase in trading liquidity when A&B is added to various REIT indices Management believes that the REIT structure does not limit A&B’s ability to continue to operate its other non - real estate business segments

98 Current C - Corp Structure • Improved property rents • Ground leases • Ag leases A&B Commercial Real Estate Development & Sales Agribusiness Materials & Construction • Commercial property sales • Development sales • Unimproved property sales • Developer fees • JV income • Material sales • Paving construction • Other construction products & services • Sugar sales • Renewable energy & water sales • Agricultural leases • Trucking services Potential REIT Structure REIT Assets • Commercial Real Estate – Improved property rents – Commercial property sales – Ground leases • Land – Ag leases – Land held for investment • Development & Land Management – RE development sales – Diversified ag – Renewable energy • Materials & Construction – Aggregate & other material sales – Paving construction – Other construction products & services Taxable REIT Subsidiary Assets 98

99 Spring 2016 Private Letter Ruling request submitted Aug 1, 2016 Approval from A&B Board of Directors to continue in - depth evaluation of REIT structure Oct 25, 2016 Retained Skadden, Arps - legal advisors Goldman - financial advisors Fall 2015 Today Evaluating a REIT C onversion: Where Are W e ? Retained Green St. Advisors – advisors on disclosure and market acceptance In - depth evaluation underway Summer 2016 Embarked on systems integration and process enhancement projects Mid 2017 Completion of evaluation

100 Required S teps Completion of ongoing evaluations of various conversion - related implementation and operational complexities – Allocation and transfer of assets between REIT and TRS entities and ongoing testing/modeling of compliance with REIT requirements – Finalize accumulated earnings & profits study – Modification of information technology infrastructure and internal accounting processes and roles A&B board approval to convert to a REIT Implementation of shareholder ownership limitations to ensure compliance with REIT ownership limitations (holding company merger requiring shareholder approval) Receipt of favorable private letter ruling from IRS allowing distribution of up to 80% of the aggregate accumulated E&P in stock by providing shareholders with a cash - stock election (submitted Aug 1, 2016) Completion of E&P purge – Currently estimated to be $650M - $700M as of 12/31/16 (to be updated for subsequent E&P earnings) Ability to convert and timing of conversion dependent on successful completion of the above steps
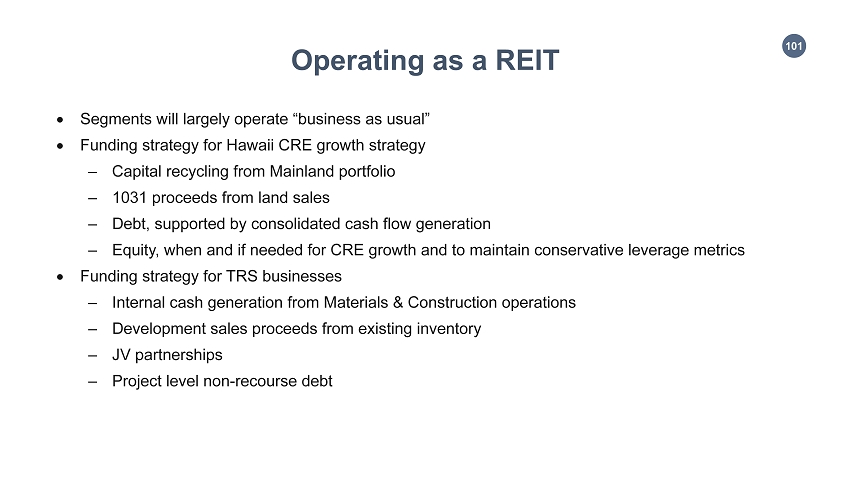
101 Operating as a REIT Segments will largely operate “business as usual” Funding strategy for Hawaii CRE growth strategy – Capital recycling from Mainland portfolio – 1031 proceeds from land sales – Debt, supported by consolidated cash flow generation – Equity, when and if needed for CRE growth and to maintain conservative leverage metrics Funding strategy for TRS businesses – Internal cash generation from Materials & Construction operations – Development sales proceeds from existing inventory – JV partnerships – Project level non - recourse debt

102 Closing Remarks CHRIS BENJAMIN, A&B PRESIDENT & CEO

103 A&B: 2021 HAWAII - FOCUSED 2016 • Large, geographically focused commercial portfolio • Value - enhancing development businesses • Significant landholdings • Begin in - depth evaluation of REIT conversion CONTINUED EVOLUTION 2016 - 2021 • Complete migration strategy • Expand CRE portfolio • Potential REIT conversion • Execute strategies to: – Create shareholder value – Shift from difficult - to - value assets to more recurring income streams PREMIER HAWAII COMMERCIAL REAL ESTATE COMPANY 2021 • 100% Hawaii • A commercial portfolio generating NOI of between $105M - $115M • Easier to value and more transparent • Self - funding related businesses that add upside • Optimal structure
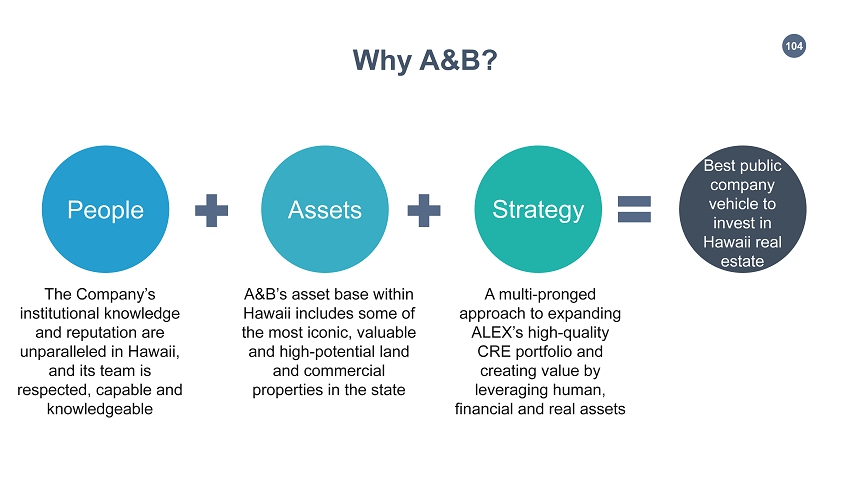
104 Why A&B? People Assets Best public company vehicle to invest in Hawaii real estate Strategy A&B’s asset base within Hawaii includes some of the most iconic, valuable and high - potential land and commercial properties in the state A multi - pronged approach to expanding ALEX’s high - quality CRE portfolio and creating value by leveraging human, financial and real assets The Company’s institutional knowledge and reputation are unparalleled in Hawaii, and its team is respected, capable and knowledgeable

105 Q&A

106 Appendix
107 Use of Non - GAAP Financial Measures The Company calculates NOI as Commercial Real Estate operating profit from continuing operations, and adjusting for general and administrative expenses, straight - line rental adjustments, interest income, interest expense, depreciation and amortization, and gains on sales of interests in real estate . NOI is considered by management to be an important and appropriate supplemental performance metric because management believes it helps both investors and management understand the ongoing core operations of our properties excluding corporate and financing - related costs and noncash depreciation and amortization . NOI is an unlevered operating performance metric of our properties and allows for a useful comparison of the operating performance of individual assets or groups of assets . This measure thereby provides an operating perspective not immediately apparent from GAAP income (loss) from operations or net income (loss) . NOI should not be considered as an alternative to GAAP net income as an indicator of the Company's financial performance, or as an alternative to cash flow from operating activities as a measure of the Company's liquidity . Other real estate companies may use different methodologies for calculating NOI, and accordingly, the Company's presentation of NOI may not be comparable to other real estate companies . The Company believes that the Commercial Real Estate segment's operating profit from continuing operations is the most directly comparable GAAP measurement to NOI . A reconciliation of the Commercial Real Estate segment’s operating profit to NOI is on the following slide .
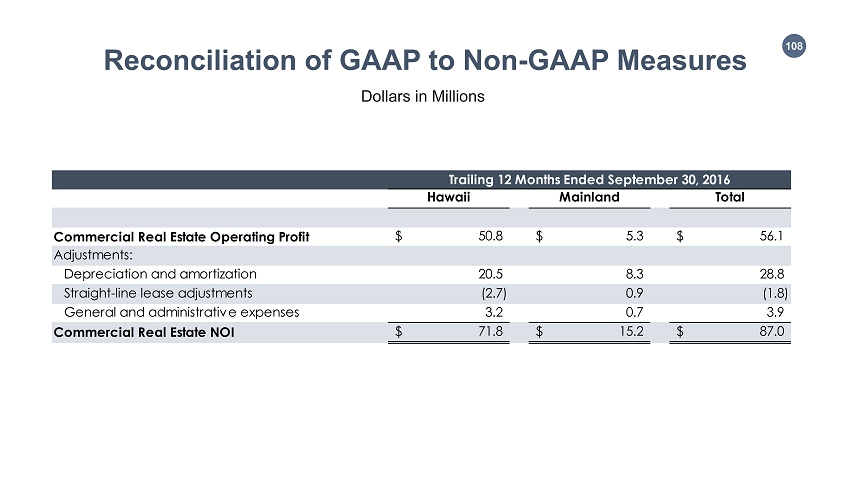
108 Reconciliation of GAAP t o Non - GAAP Measures Dollars in Millions Hawaii Mainland Total Commercial Real Estate Operating Profit 50.8$ 5.3$ 56.1$ Adjustments: Depreciation and amortization 20.5 8.3 28.8 Straight-line lease adjustments (2.7) 0.9 (1.8) General and administrative expenses 3.2 0.7 3.9 Commercial Real Estate NOI 71.8$ 15.2$ 87.0$ Trailing 12 Months Ended September 30, 2016

109 Use of Non - GAAP Financial Measures The Company presents the non - GAAP measure of EBITDA for the Materials & Construction segment . The Company uses this non - GAAP financial measure when evaluating operating performance for the segment because management believes that EBITDA provides insight into the segment’s core operating results, future cash flow generation, and the underlying business trends affecting performance on a consistent and comparable basis from period to period . The Company provides this information to investors as an additional means of evaluating the segment’s ongoing core operations . The non - GAAP financial information presented herein should be considered supplemental to, and not as a substitute for, or superior to, financial measures calculated in accordance with GAAP . The Company believes that Materials & Construction operating profit is the most directly comparable GAAP measurement to the segment's EBITDA . A reconciliation of segment operating profit to EBITDA is on the following slide .

110 1Q16 2Q16 3Q16 YTD Trailing 12 Mos - 3Q16 Materials & Construction segment operating profit (excludes interest and taxes) 8.0$ 4.9$ 5.6$ 18.5$ 27.7$ Adjustments: Depreciation and amortization 2.9 3.0 2.9 8.8 11.6 Income attributable to non-controlling interest (0.5) (0.1) (0.5) (1.1) (1.4) Materials & Construction segment EBITDA 10.4$ 7.8$ 8.0$ 26.2$ 37.9$ 1Q15 2Q15 3Q15 4Q15 2015 Materials & Construction segment operating profit (excludes interest and taxes) 7.2$ 7.0$ 7.5$ 9.2$ 30.9$ Adjustments: Depreciation and amortization 2.9 3.0 3.0 2.8 11.7 Income attributable to non-controlling interest (0.6) (0.3) (0.3) (0.3) (1.5) Materials & Construction segment EBITDA 9.5$ 9.7$ 10.2$ 11.7$ 41.1$ Reconciliation of GAAP t o Non - GAAP Measures Dollars in Millions
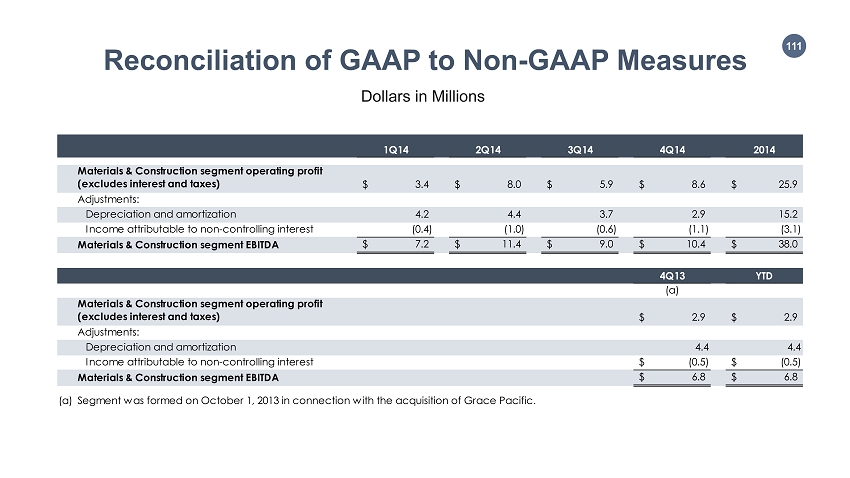
111 1Q14 2Q14 3Q14 4Q14 2014 Materials & Construction segment operating profit (excludes interest and taxes) 3.4$ 8.0$ 5.9$ 8.6$ 25.9$ Adjustments: Depreciation and amortization 4.2 4.4 3.7 2.9 15.2 Income attributable to non-controlling interest (0.4) (1.0) (0.6) (1.1) (3.1) Materials & Construction segment EBITDA 7.2$ 11.4$ 9.0$ 10.4$ 38.0$ 4Q13 YTD (a) Materials & Construction segment operating profit (excludes interest and taxes) 2.9$ 2.9$ Adjustments: Depreciation and amortization 4.4 4.4 Income attributable to non-controlling interest (0.5)$ (0.5)$ Materials & Construction segment EBITDA 6.8$ 6.8$ (a) Segment was formed on October 1, 2013 in connection with the acquisition of Grace Pacific. Reconciliation of GAAP t o Non - GAAP Measures Dollars in Millions

112 Use of Non - GAAP Financial Measures Adjusted EBITDA is presented for the Company on a consolidated basis . Adjusted EBITDA is calculated by adjusting the Company’s consolidated net loss to exclude the impact of the following : interest expense, income taxes, depreciation and amortization, noncontrolling interest, Agribusiness cessation and operating costs (excluding depreciation and amortization), and REIT evaluation costs . The Company provides this information to investors as an additional means of evaluating the performance of the Company’s operations and should be not be viewed as a substitute for, or superior to, financial measures calculated in accordance with GAAP . Adjusted Operating Profit is also presented for the Company on a consolidated basis . Adjusted Operating Profit is calculated from Operating Profit adjusted to exclude Agribusiness cessation and operating costs . Reconciliations of consolidated net loss to Adjusted EBITDA and Operating Profit to Adjusted Operating Profit are on the following slide .
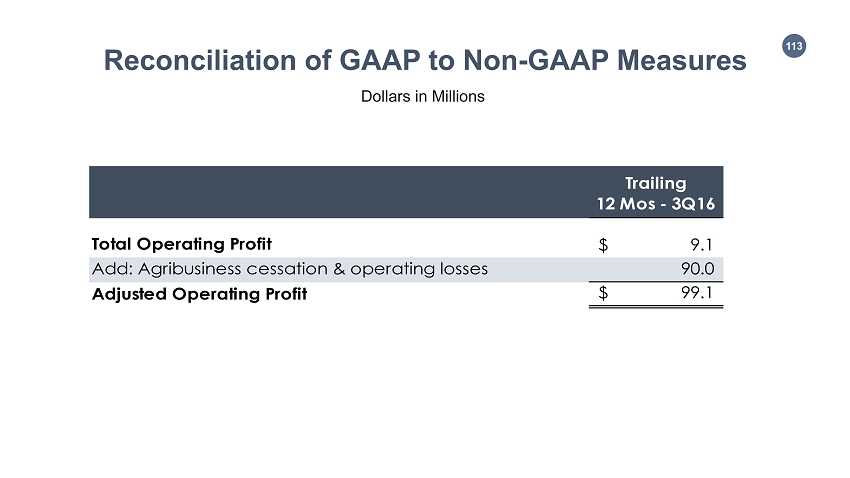
113 Trailing 12 Mos - 3Q16 Total Operating Profit 9.1$ Add: Agribusiness cessation & operating losses 90.0 Adjusted Operating Profit 99.1$ Reconciliation of GAAP t o Non - GAAP Measures Dollars in Millions
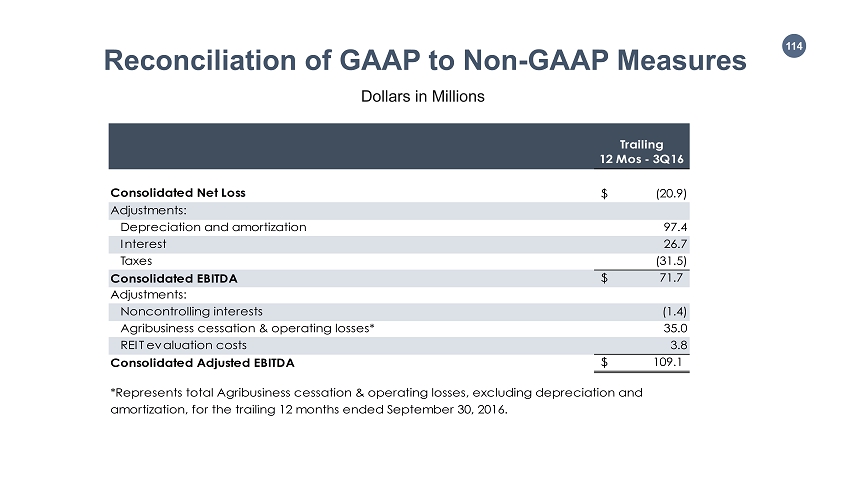
114 Trailing 12 Mos - 3Q16 Consolidated Net Loss (20.9)$ Adjustments: Depreciation and amortization 97.4 Interest 26.7 Taxes (31.5) Consolidated EBITDA 71.7$ Adjustments: Noncontrolling interests (1.4) Agribusiness cessation & operating losses* 35.0 REIT evaluation costs 3.8 Consolidated Adjusted EBITDA 109.1$ *Represents total Agribusiness cessation & operating losses, excluding depreciation and amortization, for the trailing 12 months ended September 30, 2016. Reconciliation of GAAP t o Non - GAAP Measures Dollars in Millions
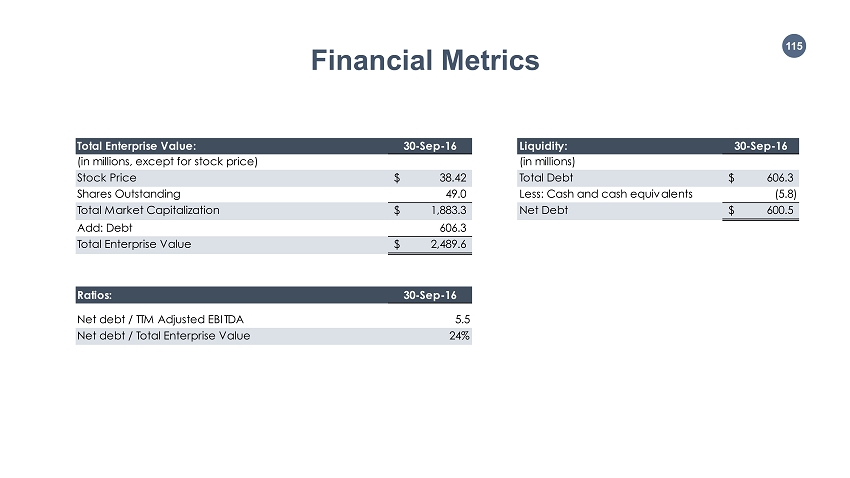
115 Total Enterprise Value: 30-Sep-16 Liquidity: 30-Sep-16 (in millions, except for stock price) (in millions) Stock Price 38.42$ Total Debt 606.3$ Shares Outstanding 49.0 Less: Cash and cash equivalents (5.8) Total Market Capitalization 1,883.3$ Net Debt 600.5$ Add: Debt 606.3 Total Enterprise Value 2,489.6$ Ratios: 30-Sep-16 Net debt / TTM Adjusted EBITDA 5.5 Net debt / Total Enterprise Value 24% Financial Metrics
Serious News for Serious Traders! Try StreetInsider.com Premium Free!
You May Also Be Interested In
- Alexander & Baldwin (ALEX) Declares $0.2225 Quarterly Dividend; 5.5% Yield
- ActivTrak Launches ActivTrak Academy
- Mortgage Rates Continue to Increase
Create E-mail Alert Related Categories
SEC FilingsSign up for StreetInsider Free!
Receive full access to all new and archived articles, unlimited portfolio tracking, e-mail alerts, custom newswires and RSS feeds - and more!
