

Form 8-K ATHENAHEALTH INC For: Oct 20
 Tweet
Tweet Share
ShareUNITED STATES
SECURITIES AND EXCHANGE COMMISSION
SECURITIES AND EXCHANGE COMMISSION
Washington, D.C. 20549
FORM 8-K
CURRENT REPORT
Pursuant to Section 13 OR 15(d) of The Securities Exchange Act of 1934
Date of Report (Date of earliest event reported) October 20, 2016
athenahealth, Inc.
(Exact name of registrant as specified in its charter)
Delaware | 001-33689 | 04-3387530 | ||
(State or other jurisdiction of incorporation) | (Commission File Number) | (IRS Employer Identification No.) | ||
311 Arsenal Street, Watertown, MA | 02472 | |||
(Address of principal executive offices) | (Zip Code) | |||
Registrant’s telephone number, including area code: 617-402-1000
________________________________________________________________________________
(Former name or former address, if changed since last report.)
(Former name or former address, if changed since last report.)
Check the appropriate box below if the Form 8-K filing is intended to simultaneously satisfy the filing obligation of the registrant under any of the following provisions: | ||
[ ] | Written communications pursuant to Rule 425 under the Securities Act (17 CFR 230.425) | |
[ ] | Soliciting material pursuant to Rule 14a-12 under the Exchange Act (17 CFR 240.14a-12) | |
[ ] | Pre-commencement communications pursuant to Rule 14d-2(b) under the Exchange Act (17 CFR 240.14d-2(b)) | |
[ ] | Pre-commencement communications pursuant to Rule 13e-4(c) under the Exchange Act (17 CFR 240.13e-4(c)) | |
Item 2.02 | Results of Operations and Financial Condition. |
On October 20, 2016, athenahealth, Inc. (the "Company") issued a press release regarding its financial and operational results for the quarter ended September 30, 2016. The Company also posted prepared remarks with respect to its third quarter results on the Investors section of its website at www.athenahealth.com. Copies of the press release and prepared remarks are furnished herewith as Exhibit 99.1 and Exhibit 99.2, respectively, and are incorporated herein by reference.
The information included in this Current Report on Form 8-K pursuant to Item 2.02, including Exhibit 99.1 and Exhibit 99.2 attached hereto, is intended to be furnished and shall not be deemed “filed” for purposes of Section 18 of the Securities Exchange Act of 1934 or otherwise subject to the liabilities of that section, nor shall it be deemed incorporated by reference in any filing under the Securities Act of 1933 or the Securities Exchange Act of 1934, except as expressly set forth by specific reference in such filing.
Item 9.01 Financial Statements and Exhibits.
(d) Exhibits.
Exhibit No. | Description | |
99.1 | Press release issued by athenahealth, Inc. on October 20, 2016, furnished herewith. | |
99.2 | Prepared remarks dated as of October 20, 2016, furnished herewith. | |
SIGNATURES
Pursuant to the requirements of the Securities Exchange Act of 1934, the registrant has duly caused this report to be signed on its behalf by the undersigned hereunto duly authorized.
athenahealth, Inc. | ||
(Registrant) | ||
October 20, 2016 | /s/ Karl Stubelis | |
Karl Stubelis | ||
Senior Vice President and Chief Financial Officer | ||
EXHIBIT INDEX
Exhibit No. | Description | |
99.1 | Press release issued by athenahealth, Inc. on October 20, 2016, furnished herewith. | |
99.2 | Prepared remarks dated as of October 20, 2016, furnished herewith. | |

athenahealth, Inc. Reports Third Quarter Fiscal Year 2016 Results
Company Announces Record Provider Additions; Management Reaffirms Fiscal Year 2016 Guidance
Q3 2016 Financial Results
• | 17% Revenue Growth Over Third Quarter of 2015 |
• | GAAP Operating Income of $15.2 million |
• | Non-GAAP Adjusted Operating Income of $41.5 million |
• | GAAP Net Income of $13.9 million, or $0.35 Per Diluted Share |
• | Non-GAAP Adjusted Net Income of $24.1 million, or $0.60 Per Diluted Share |
WATERTOWN, MA – October 20, 2016 - athenahealth, Inc. (NASDAQ: ATHN) (“athenahealth” or “we”), a leading provider of network-enabled services and mobile applications for healthcare providers nationwide, today announced financial and operational results for the third quarter of fiscal year 2016. We will hold a conference call tomorrow, Friday, October 21, 2016, at 8:00 a.m. Eastern Time to discuss these results and management’s outlook for future financial and operational performance.
“As we continue to build our national network - today, having connected over 85,000 providers, 83 million unique patient records, and 140,000 network endpoints - athenahealth is well-positioned to improve healthcare delivery in this country,” said Jonathan Bush, chairman and chief executive officer, athenahealth. “We are also uniquely positioned to leverage our network data for good and are making great strides in furtherance of our mission to unbreak healthcare. To this end, we recently launched athenaInsight, an editorial hub reporting from the heart of the healthcare internet on healthcare’s bright spots, drivers of effective physician leadership and engagement, and trends tied to public health. As we look ahead, our strategic priorities and investments will be focused on further leveraging our unique platform to deliver true client success.”
Q3 2016 and Year-to-Date 2016 Financial Results
• | Total revenue for the three months ended September 30, 2016, was $276.7 million, compared to $236.1 million in the same period last year, an increase of 17%. |
• | Total revenue for the nine months ended September 30, 2016, was $794.8 million, compared to $667.2 million in the same period last year, an increase of 19%. |
• | Net new active physicians added to the network: athenaCollector® (3,829 physicians added), athenaClinicals® (2,090 physicians added), and athenaCommunicator® (3,416 physicians added) for the three months ended September 30, 2016, compared to athenaCollector (3,953 physicians added), athenaClinicals (2,818 physicians added), and athenaCommunicator (3,422 physicians added) in the same period last year. |
• | Net new active providers added to the network: athenaCollector (5,092 providers added), athenaClinicals (2,844 providers added), and athenaCommunicator (4,478 providers added) for the three months ended September 30, 2016, compared to athenaCollector (4,784 providers added), athenaClinicals (3,430 providers added), and athenaCommunicator (4,084 providers added) in the same period last year. |
1
“The athenahealth team continued to make progress against many of our financial and operational goals in the third quarter and are thrilled with another quarterly record number of providers added to our network,” said Karl Stubelis, chief financial officer, athenahealth. “Year-to-date, we have delivered against our internal financial goals, adding over 10,000 providers to our network and growing consolidated revenue by over 19%. We remain positioned to continue to drive meaningful change in healthcare and look forward to providing an update on our strategic priorities at our upcoming investor summit in December.”
• | For the three months ended September 30, 2016, Non-GAAP Adjusted Gross Margin was 65.0%, compared to 62.9% in the same period last year. |
• | For the three months ended September 30, 2016, GAAP Operating Income was $15.2 million, or 5.5% of total revenue, compared to GAAP Operating Income of $3.2 million, or 1.4% of total revenue, in the same period last year. |
• | For the three months ended September 30, 2016, Non-GAAP Adjusted Operating Income was $41.5 million, or 15.0% of total revenue, compared to $25.4 million, or 10.8% of total revenue, in the same period last year. |
• | For the three months ended September 30, 2016, GAAP Net Income was $13.9 million, or $0.35 per diluted share, compared to GAAP Net Income of $5.8 million, or $0.15 per diluted share, in the same period last year. |
• | For the three months ended September 30, 2016, Non-GAAP Adjusted Net Income was $24.1 million, or $0.60 per diluted share, compared to $14.3 million, or $0.36 per diluted share, in the same period last year. |
Fiscal Year 2016 Outlook
We communicated our fiscal year 2016 guidance on December 10, 2015 at our 8th Annual Investor Summit. Our fiscal year 2016 guidance is summarized in the following table:
For the Fiscal Year Ending December 31, 2016 | |
Forward-Looking Guidance1 | |
GAAP Total Revenue | $1,085 - $1,115 million |
Non-GAAP Adjusted Gross Margin | 63.5% - 64.5% |
Non-GAAP Adjusted Operating Income | $120 - $135 million |
Non-GAAP Adjusted Net Income per Diluted Share | $1.65 - $1.85 |
Non-GAAP Tax Rate | 40% |
We are not making any changes to the fiscal year 2016 guidance we communicated on December 10, 2015 at our 8th Annual Investor Summit. However, based on our year-to-date performance that was relatively in line with our internal financial goals and our current expectations for Q4 2016, we are providing additional insight into our fiscal year 2016 guidance as follows:
• | We expect GAAP Total Revenue to be near the mid-point of the $1,085 million to $1,115 million guidance range. |
• | We expect Non-GAAP Adjusted Gross Margin to be near the mid-point of the 63.5% to 64.5% guidance range. |
2
• | We expect Non-GAAP Adjusted Operating Income to be near the mid-point of the $120 million to $135 million guidance range. |
• | Finally, we expect Non-GAAP Adjusted Net Income per Diluted Share to be near the mid-point of the $1.65 to $1.85 guidance range. |
1 We release annual guidance once per year at our annual investor summit. Recently, the U.S. Securities and Exchange Commission staff issued updates to its Compliance and Disclosure Interpretations regarding the use of non-GAAP financial measures. However, we believe that revising this table mid-year during 2016 to present the GAAP equivalent may confuse the investment community. As a result, we plan to present both the non-GAAP financial measure and the applicable GAAP financial measure in this table beginning with the release of our fiscal year 2017 guidance.
Use of Non-GAAP Financial Measures
In our earnings releases, prepared remarks, conference calls, slide presentations, and webcasts, we may use or discuss non-GAAP financial measures, as defined by Regulation G. The GAAP financial measure most directly comparable to each non-GAAP financial measure used or discussed, and a reconciliation of the differences between each non-GAAP financial measure and the comparable GAAP financial measure, are included in this press release after the condensed consolidated financial statements. Our earnings press releases containing such non-GAAP reconciliations can be found in the Investors section of our website at www.athenahealth.com.
Conference Call Information
To participate in our live conference call and webcast, please dial 877-853-5645 (or 408-940-3868 for international calls) using conference code no. 75527226, or visit the Investors section of our website at www.athenahealth.com. A replay will be available for one week following the conference call at 855-859-2056 (and 404-537-3406 for international calls) using conference code no. 75527226. A webcast replay will also be archived on our website.
About athenahealth, Inc.
athenahealth is a leading provider of network-enabled services for electronic health records (EHR), revenue cycle management and medical billing, patient engagement, care coordination, and population health management, as well as Epocrates and other point-of-care mobile apps. We connect care and drive meaningful, measurable results for more than 85,000 healthcare providers nationwide. For a view of network effect in action by exploring data as it flows across athenahealth’s nationwide network, please visit https://insight.athenahealth.com/interactive-a-look-at-interoperability. For more information, please visit www.athenahealth.com.
Forward-Looking Statements
This press release contains forward-looking statements within the meaning of Section 27A of the Securities Act of 1933, as amended, and Section 21E of the Securities Exchange Act of 1934, as amended, including statements regarding management’s expectations for future financial and operational performance and operating expenditures, expected growth, and business outlook, including fiscal 2016 guidance; statements regarding our ability to improve healthcare delivery in the U.S., to leverage our network data for good, to unbreak healthcare, to deliver client success, and to drive meaningful change in healthcare; and statements found under our “Reconciliation of Non-GAAP Financial Measures to Comparable GAAP Measures” and “Reconciliation of Non-GAAP Financial Measures to Comparable
3
GAAP Measures for Fiscal Year 2016 Guidance” sections of this release. Forward-looking statements may be identified with words such as “will,” “may,” “expect,” “plan,” “anticipate,” “upcoming,” “believe,” “estimate” or similar terminology, and the negative of these terms. Forward-looking statements are not promises or guarantees of future performance, and are subject to a variety of risks and uncertainties, many of which are beyond our control, which could cause actual results to differ materially from those contemplated in these forward-looking statements. These risks and uncertainties include: our highly competitive industry and our ability to compete effectively and remain innovative; the development of the market for cloud-based healthcare information technology services; changes in the healthcare industry and their impact on the demand for our services; our ability to maintain consistently high growth rates due to lengthening customer sales cycles; the impact of changes in our business model and structure; our ability to effectively manage our growth; our ability to protect our intellectual property; current and future litigation, including for intellectual property infringement; our dependence on third-party providers; risks and costs associated with our worldwide operations; our ability to attract and retain highly skilled employees; our ability to successfully implement our management transition plans; our fluctuating operating results; our ability to retain our clients and maintain client revenue; our tax liability; our variable sales and implementation cycles; the timing at which we recognize certain revenue and our ability to evaluate our prospects; defects and errors in our software or services, or interruptions or damages to our systems or those of third parties on which we rely; a data security breach; limitations on our use of data; the effect of payer and provider conduct; the failure of our services to provide accurate and timely information; increasing government regulation and the costs and challenges of compliance; the potential for illegal behavior by employees or subcontractors; and the price volatility of our common stock. Forward-looking statements speak only as of the date hereof and, except as required by law, we undertake no obligation to update or revise these forward-looking statements. For additional information regarding these and other risks faced by us, refer to our public filings with the Securities and Exchange Commission (“SEC”), available on the Investors section of our website at www.athenahealth.com and on the SEC’s website at www.sec.gov.
Contact Info:
Dana Quattrochi
athenahealth, Inc. (Investors)
(617) 402-1329
Holly Spring
athenahealth, Inc. (Media)
(617) 402-1631
4
athenahealth, Inc.
CONDENSED CONSOLIDATED BALANCE SHEETS
(Unaudited, in thousands, except per share amounts)
September 30, 2016 | December 31, 2015 | |||||||
Assets | ||||||||
Current assets: | ||||||||
Cash and cash equivalents | $ | 129,994 | $ | 141,927 | ||||
Accounts receivable, net | 151,313 | 148,157 | ||||||
Prepaid expenses and other current assets | 39,210 | 30,176 | ||||||
Total current assets | 320,517 | 320,260 | ||||||
Property and equipment, net | 332,737 | 321,524 | ||||||
Capitalized software costs, net | 127,135 | 107,517 | ||||||
Purchased intangible assets, net | 117,149 | 126,239 | ||||||
Goodwill | 240,662 | 229,157 | ||||||
Investments and other assets | 16,488 | 13,965 | ||||||
Total assets | $ | 1,154,688 | $ | 1,118,662 | ||||
Liabilities & Stockholders’ Equity | ||||||||
Current liabilities: | ||||||||
Accounts payable | $ | 13,903 | $ | 10,768 | ||||
Accrued compensation | 82,929 | 88,122 | ||||||
Accrued expenses | 46,183 | 51,452 | ||||||
Long-term debt | 14,531 | 10,762 | ||||||
Deferred revenue | 30,373 | 32,593 | ||||||
Total current liabilities | 187,919 | 193,697 | ||||||
Deferred rent, net of current portion | 31,209 | 31,118 | ||||||
Long-term debt, net of current portion | 276,452 | 287,353 | ||||||
Deferred revenue, net of current portion | 50,375 | 55,946 | ||||||
Long-term deferred tax liability, net | 4,000 | 1,254 | ||||||
Other long-term liabilities | 4,845 | 5,988 | ||||||
Total liabilities | 554,800 | 575,356 | ||||||
Stockholders’ equity: | ||||||||
Preferred stock, $0.01 par value: 5,000 shares authorized; no shares issued and outstanding at September 30, 2016 and December 31, 2015 | — | — | ||||||
Common stock, $0.01 par value: 125,000 shares authorized; 40,695 shares issued and 39,417 shares outstanding at September 30, 2016; 40,209 shares issued and 38,931 shares outstanding at December 31, 2015 | 407 | 403 | ||||||
Additional paid-in capital | 567,712 | 522,443 | ||||||
Treasury stock, at cost, 1,278 shares | (1,200 | ) | (1,200 | ) | ||||
Accumulated other comprehensive loss | (732 | ) | (848 | ) | ||||
Retained earnings | 33,701 | 22,508 | ||||||
Total stockholders’ equity | 599,888 | 543,306 | ||||||
Total liabilities and stockholders’ equity | $ | 1,154,688 | $ | 1,118,662 | ||||
5
athenahealth, Inc.
CONDENSED CONSOLIDATED STATEMENTS OF INCOME
(Unaudited, in thousands, except per share amounts)
Three Months Ended September 30, | Nine Months Ended September 30, | |||||||||||||||
2016 | 2015 | 2016 | 2015 | |||||||||||||
Revenue: | ||||||||||||||||
Business services | $ | 267,118 | $ | 224,990 | $ | 768,734 | $ | 638,156 | ||||||||
Implementation and other | 9,553 | 11,078 | 26,025 | 29,040 | ||||||||||||
Total revenue | 276,671 | 236,068 | 794,759 | 667,196 | ||||||||||||
Expense: | ||||||||||||||||
Direct operating | 103,238 | 94,850 | 312,518 | 269,306 | ||||||||||||
Selling and marketing | 59,067 | 55,927 | 182,563 | 163,705 | ||||||||||||
Research and development | 24,860 | 22,560 | 73,619 | 70,675 | ||||||||||||
General and administrative | 41,889 | 34,778 | 124,076 | 107,093 | ||||||||||||
Depreciation and amortization | 32,466 | 24,763 | 87,774 | 67,216 | ||||||||||||
Total expense | 261,520 | 232,878 | 780,550 | 677,995 | ||||||||||||
Operating income (loss) | 15,151 | 3,190 | 14,209 | (10,799 | ) | |||||||||||
Other (expense) income: | ||||||||||||||||
Interest expense | (1,335 | ) | (1,620 | ) | (4,803 | ) | (4,192 | ) | ||||||||
Other income | 10 | 7,590 | 57 | 28,715 | ||||||||||||
Total other (expense) income | (1,325 | ) | 5,970 | (4,746 | ) | 24,523 | ||||||||||
Income before income tax benefit (provision) | 13,826 | 9,160 | 9,463 | 13,724 | ||||||||||||
Income tax benefit (provision) | 115 | (3,365 | ) | 1,730 | (7,412 | ) | ||||||||||
Net income | $ | 13,941 | $ | 5,795 | $ | 11,193 | $ | 6,312 | ||||||||
Net income per share – Basic | $ | 0.35 | $ | 0.15 | $ | 0.29 | $ | 0.16 | ||||||||
Net income per share – Diluted | $ | 0.35 | $ | 0.15 | $ | 0.28 | $ | 0.16 | ||||||||
Weighted average shares used in computing net income per share: | ||||||||||||||||
Basic | 39,356 | 38,714 | 39,223 | 38,523 | ||||||||||||
Diluted | 40,000 | 39,536 | 40,024 | 39,476 | ||||||||||||
6
athenahealth, Inc.
CONDENSED CONSOLIDATED STATEMENTS OF CASH FLOWS
(Unaudited, in thousands)
Nine Months Ended September 30, | ||||||||
2016 | 2015 | |||||||
CASH FLOWS FROM OPERATING ACTIVITIES: | ||||||||
Net income | $ | 11,193 | $ | 6,312 | ||||
Adjustments to reconcile net income to net cash provided by operating activities: | ||||||||
Depreciation and amortization | 103,989 | 85,869 | ||||||
Excess tax benefit from stock-based awards | (1,359 | ) | (8,367 | ) | ||||
Deferred income tax | (3,107 | ) | (1,652 | ) | ||||
Stock-based compensation expense | 50,676 | 47,943 | ||||||
Gain on sale of marketable securities | — | (28,656 | ) | |||||
Other reconciling adjustments | (296 | ) | 6 | |||||
Changes in operating assets and liabilities: | ||||||||
Accounts receivable, net | (3,069 | ) | (21,941 | ) | ||||
Prepaid expenses and other current assets | (7,659 | ) | (1,296 | ) | ||||
Other long-term assets | (3,237 | ) | (2,090 | ) | ||||
Accounts payable | 2,179 | 5,611 | ||||||
Accrued expenses and other long-term liabilities | 1,369 | 4,232 | ||||||
Accrued compensation | (7,534 | ) | 4,085 | |||||
Deferred revenue | (7,791 | ) | 6,015 | |||||
Deferred rent | 619 | 6,848 | ||||||
Net cash provided by operating activities | 135,973 | 102,919 | ||||||
CASH FLOWS FROM INVESTING ACTIVITIES: | ||||||||
Capitalized software costs | (68,135 | ) | (77,714 | ) | ||||
Purchases of property and equipment | (52,867 | ) | (65,090 | ) | ||||
Payments on acquisitions, net of cash acquired | (16,852 | ) | (39,890 | ) | ||||
Proceeds from sales of marketable securities | — | 29,756 | ||||||
Other investing activities | 830 | (2,610 | ) | |||||
Net cash used in investing activities | (137,024 | ) | (155,548 | ) | ||||
CASH FLOWS FROM FINANCING ACTIVITIES: | ||||||||
Proceeds from issuance of common stock under stock plans and warrants | 14,089 | 18,046 | ||||||
Taxes paid related to net share settlement of stock awards | (18,707 | ) | (20,664 | ) | ||||
Excess tax benefit from stock-based awards | 1,359 | 8,367 | ||||||
Proceeds from line of credit | — | 60,000 | ||||||
Payments on line of credit | — | (95,000 | ) | |||||
Proceeds from long-term debt | — | 300,000 | ||||||
Payments on long-term debt | (7,500 | ) | (173,750 | ) | ||||
Debt issuance costs | — | (987 | ) | |||||
Other financing activities | (70 | ) | — | |||||
Net cash (used in) provided by financing activities | (10,829 | ) | 96,012 | |||||
Effect of exchange rate changes on cash and cash equivalents | (53 | ) | (458 | ) | ||||
Net decrease in cash and cash equivalents | (11,933 | ) | 42,925 | |||||
Cash and cash equivalents at beginning of period | 141,927 | 73,787 | ||||||
Cash and cash equivalents at end of period | $ | 129,994 | $ | 116,712 | ||||
7
athenahealth, Inc.
STOCK-BASED COMPENSATION
(Unaudited, in thousands)
Set forth below is a breakout of stock-based compensation impacting the Condensed Consolidated Statements of Income for the three and nine months ended September 30, 2016, and 2015:
Three Months Ended September 30, | Nine Months Ended September 30, | ||||||||||||||
2016 | 2015 | 2016 | 2015 | ||||||||||||
Stock-based compensation charged to Condensed Consolidated Statements of Income: | |||||||||||||||
Direct operating | $ | 4,363 | $ | 3,584 | $ | 13,652 | $ | 10,883 | |||||||
Selling and marketing | 5,133 | 4,162 | 14,325 | 13,745 | |||||||||||
Research and development | 3,121 | 2,164 | 9,333 | 6,707 | |||||||||||
General and administrative | 4,514 | 5,070 | 13,366 | 16,608 | |||||||||||
Total stock-based compensation expense | 17,131 | 14,980 | 50,676 | 47,943 | |||||||||||
Amortization of capitalized stock-based compensation related to software development (1) | 1,283 | 1,244 | 3,813 | 3,013 | |||||||||||
Total | $ | 18,414 | $ | 16,224 | $ | 54,489 | $ | 50,956 | |||||||
(1) | In addition, for the three months ended September 30, 2016, and 2015, $0.9 million and $1.8 million, respectively, of stock-based compensation was capitalized in the line item Capitalized software costs, net in the Condensed Consolidated Balance Sheets for which $1.3 million and $1.2 million, respectively, of amortization was included in the line item Depreciation and amortization in the Condensed Consolidated Statements of Income. For the nine months ended September 30, 2016, and 2015, $2.1 million and $5.4 million, respectively, of stock-based compensation was capitalized in the line item Capitalized software costs, net in the Condensed Consolidated Balance Sheets for which $3.8 million and $3.0 million, respectively, of amortization was included in the line item Depreciation and amortization in the Condensed Consolidated Statements of Income. |
athenahealth, Inc.
AMORTIZATION OF PURCHASED INTANGIBLE ASSETS
(Unaudited, in thousands)
Set forth below is a breakout of amortization of purchased intangible assets impacting the Condensed Consolidated Statements of Income for the three and nine months ended September 30, 2016, and 2015:
Three Months Ended September 30, | Nine Months Ended September 30, | ||||||||||||||
Amortization of purchased intangible assets allocated to: | 2016 | 2015 | 2016 | 2015 | |||||||||||
Direct operating | $ | 1,991 | $ | 3,662 | $ | 7,063 | $ | 11,177 | |||||||
Selling and marketing | 2,959 | 2,373 | 8,784 | 7,119 | |||||||||||
Total amortization of purchased intangible assets | $ | 4,950 | $ | 6,035 | $ | 15,847 | $ | 18,296 | |||||||
8
athenahealth, Inc.
RECONCILIATION OF NON-GAAP FINANCIAL MEASURES
TO COMPARABLE GAAP MEASURES
(Unaudited, in thousands, except per share amounts)
The following is a reconciliation of the non-GAAP financial measures used by us to describe our financial results determined in accordance with accounting principles generally accepted in the United States of America (“GAAP”). An explanation of these measures is also included below under the heading “Explanation of Non-GAAP Financial Measures.”
While management believes that these non-GAAP financial measures provide useful supplemental information to investors regarding the underlying performance of our business operations, investors are reminded to consider these non-GAAP measures in addition to, and not as a substitute for, financial performance measures prepared in accordance with GAAP. In addition, it should be noted that these non-GAAP financial measures may be different from non-GAAP measures used by other companies, and management may utilize other measures to illustrate performance in the future. Non-GAAP measures have limitations in that they do not reflect all of the amounts associated with our results of operations as determined in accordance with GAAP.
Please note that these figures may not sum exactly due to rounding.
Non-GAAP Adjusted Gross Margin
Set forth below is a presentation of our “Non-GAAP Adjusted Gross Profit” and “Non-GAAP Adjusted Gross Margin,” which represents Non-GAAP Adjusted Gross Profit as a percentage of total revenue.
(unaudited, in thousands) | Three Months Ended | Nine Months Ended | |||||||||||||
September 30, | September 30, | ||||||||||||||
2016 | 2015 | 2016 | 2015 | ||||||||||||
Total revenue | $ | 276,671 | $ | 236,068 | $ | 794,759 | $ | 667,196 | |||||||
Direct operating expense | 103,238 | 94,850 | 312,518 | 269,306 | |||||||||||
Total revenue less direct operating expense | 173,433 | 141,218 | 482,241 | 397,890 | |||||||||||
Add: Stock-based compensation allocated to direct operating expense | 4,363 | 3,584 | 13,652 | 10,883 | |||||||||||
Add: Amortization of purchased intangible assets allocated to direct operating expense | 1,991 | 3,662 | 7,063 | 11,177 | |||||||||||
Add: Exit costs, including restructuring costs allocated to direct operating expense | 107 | — | 371 | — | |||||||||||
Non-GAAP Adjusted Gross Profit | $ | 179,894 | $ | 148,464 | $ | 503,327 | $ | 419,950 | |||||||
Non-GAAP Adjusted Gross Margin | 65.0 | % | 62.9 | % | 63.3 | % | 62.9 | % | |||||||
9
Non-GAAP Adjusted Operating Income
Set forth below is a reconciliation of our “Non-GAAP Adjusted Operating Income” and “Non-GAAP Adjusted Operating Income Margin,” which represents Non-GAAP Adjusted Operating Income as a percentage of total revenue.
(unaudited, in thousands) | Three Months Ended | Nine Months Ended | |||||||||||||
September 30, | September 30, | ||||||||||||||
2016 | 2015 | 2016 | 2015 | ||||||||||||
Total revenue | $ | 276,671 | $ | 236,068 | $ | 794,759 | $ | 667,196 | |||||||
GAAP net income | 13,941 | 5,795 | 11,193 | 6,312 | |||||||||||
Add: (Benefit from) provision for income taxes | (115 | ) | 3,365 | (1,730 | ) | 7,412 | |||||||||
Add: Total other expense (income) | 1,325 | (5,970 | ) | 4,746 | (24,523 | ) | |||||||||
GAAP operating income (loss) | $ | 15,151 | $ | 3,190 | $ | 14,209 | $ | (10,799 | ) | ||||||
GAAP operating margin (loss) | 5.5 | % | 1.4 | % | 1.8 | % | (1.6 | )% | |||||||
Add: Stock-based compensation expense | 17,131 | 14,980 | 50,676 | 47,943 | |||||||||||
Add: Amortization of capitalized stock-based compensation related to software development | 1,283 | 1,244 | 3,813 | 3,013 | |||||||||||
Add: Amortization of purchased intangible assets | 4,950 | 6,035 | 15,847 | 18,296 | |||||||||||
Add: Integration and transaction costs | 775 | — | 1,125 | 964 | |||||||||||
Add: Exit costs, including restructuring costs | 2,425 | — | 4,358 | 4,446 | |||||||||||
Less: Gain on investments, net | (243 | ) | — | (243 | ) | — | |||||||||
Non-GAAP Adjusted Operating Income | $ | 41,472 | $ | 25,449 | $ | 89,785 | $ | 63,863 | |||||||
Non-GAAP Adjusted Operating Income Margin | 15.0 | % | 10.8 | % | 11.3 | % | 9.6 | % | |||||||
10
Non-GAAP Adjusted Net Income
Set forth below is a reconciliation of our “Non-GAAP Adjusted Net Income” and “Non-GAAP Adjusted Net Income per Diluted Share.”
(unaudited, in thousands) | Three Months Ended | Nine Months Ended | |||||||||||||
September 30, | September 30, | ||||||||||||||
2016 | 2015 | 2,016 | 2,015 | ||||||||||||
GAAP net income | $ | 13,941 | $ | 5,795 | $ | 11,193 | $ | 6,312 | |||||||
Add: Stock-based compensation expense | 17,131 | 14,980 | 50,676 | 47,943 | |||||||||||
Add: Amortization of capitalized stock-based compensation related to software development | 1,283 | 1,244 | 3,813 | 3,013 | |||||||||||
Add: Amortization of purchased intangible assets | 4,950 | 6,035 | 15,847 | 18,296 | |||||||||||
Add: Integration and transaction costs | 775 | — | 1,125 | 964 | |||||||||||
Add: Exit costs, including restructuring costs | 2,425 | — | 4,358 | 4,446 | |||||||||||
Less: Gain on investments, net | (243 | ) | (7,585 | ) | (243 | ) | (28,656 | ) | |||||||
Sub-total of tax deductible items | 26,321 | 14,674 | 75,576 | 46,006 | |||||||||||
Less: Tax impact of tax deductible items (1) | (10,528 | ) | (5,870 | ) | (30,230 | ) | (18,402 | ) | |||||||
Less: Tax impact resulting from applying non-GAAP tax rate (2) | (5,646 | ) | (299 | ) | (5,516 | ) | 1,922 | ||||||||
Non-GAAP Adjusted Net Income | $ | 24,088 | $ | 14,300 | $ | 51,023 | $ | 35,838 | |||||||
Weighted average shares - diluted | 40,000 | 39,536 | 40,024 | 39,476 | |||||||||||
Non-GAAP Adjusted Net Income per Diluted Share | $ | 0.60 | $ | 0.36 | $ | 1.27 | $ | 0.91 | |||||||
(1) | Tax impact calculated using a statutory tax rate of 40%. |
(2) | Represents adjusting the GAAP net income to a non-GAAP tax rate of 40%. We used a non-GAAP tax rate of 40% to normalize the tax impact to our Non-GAAP Adjusted Net Income per Diluted Share based on the fact that a relatively small change in pre-tax GAAP income (loss) in any one period could result in a volatile GAAP effective tax rate. |
11
(unaudited, in thousands) | Three Months Ended | Nine Months Ended | |||||||||||||
September 30, | September 30, | ||||||||||||||
2016 | 2015 | 2016 | 2015 | ||||||||||||
GAAP net income per share - diluted | $ | 0.35 | $ | 0.15 | $ | 0.28 | $ | 0.16 | |||||||
Add: Stock-based compensation expense | 0.43 | 0.38 | 1.27 | 1.21 | |||||||||||
Add: Amortization of capitalized stock-based compensation related to software development | 0.03 | 0.03 | 0.10 | 0.08 | |||||||||||
Add: Amortization of purchased intangible assets | 0.12 | 0.15 | 0.40 | 0.46 | |||||||||||
Add: Integration and transaction costs | 0.02 | — | 0.03 | 0.02 | |||||||||||
Add: Exit costs, including restructuring costs | 0.06 | — | 0.11 | 0.11 | |||||||||||
Less: Gain on investments, net | (0.01 | ) | (0.19 | ) | (0.01 | ) | (0.73 | ) | |||||||
Sub-total of tax deductible items | 0.66 | 0.37 | 1.89 | 1.17 | |||||||||||
Less: Tax impact of tax deductible items (1) | (0.26 | ) | (0.15 | ) | (0.76 | ) | (0.47 | ) | |||||||
Add: Tax impact resulting from applying non-GAAP tax rate (2) | (0.14 | ) | (0.01 | ) | (0.14 | ) | 0.05 | ||||||||
Non-GAAP Adjusted Net Income per Diluted Share | $ | 0.60 | $ | 0.36 | $ | 1.27 | $ | 0.91 | |||||||
Weighted average shares - diluted | 40,000 | 39,536 | 40,024 | 39,476 | |||||||||||
(1) | Tax impact calculated using a statutory tax rate of 40%. |
(2) | Represents adjusting the GAAP net income to a non-GAAP tax rate of 40%. We used a non-GAAP tax rate of 40% to normalize the tax impact to our Non-GAAP Adjusted Net Income per Diluted Share based on the fact that a relatively small change in pre-tax GAAP income (loss) in any one period could result in a volatile GAAP effective tax rate. |
12
athenahealth, Inc.
RECONCILIATION OF NON-GAAP FINANCIAL MEASURES
TO COMPARABLE GAAP MEASURES FOR FISCAL YEAR 2016 GUIDANCE
(Unaudited, in millions, except per share amounts)
Please note that the figures presented below may not sum exactly due to rounding.
Non-GAAP Adjusted Gross Margin Guidance
Set forth below is a presentation of our “Non-GAAP Adjusted Gross Profit” and “Non-GAAP Adjusted Gross Margin” guidance for fiscal year 2016, which represents Non-GAAP Adjusted Gross Profit as a percentage of total revenue.
LOW | HIGH | |||||
Fiscal Year Ending December 31, 2016 | ||||||
Total revenue | $ | 1,085.0 | $ | 1,115.0 | ||
Direct operating expense | 423.4 | 423.2 | ||||
Total revenue less direct operating expense | $ | 661.6 | $ | 691.7 | ||
Add: Stock-based compensation expense | ||||||
allocated to direct operating expense | 19.0 | 19.0 | ||||
Add: Amortization of purchased intangible assets | ||||||
allocated to direct operating expense | 8.4 | 8.4 | ||||
Non-GAAP Adjusted Gross Profit | $ | 689.0 | $ | 719.2 | ||
Non-GAAP Adjusted Gross Margin | 63.5 | % | 64.5 | % | ||
Non-GAAP Adjusted Operating Income Guidance
Set forth below is a reconciliation of our “Non-GAAP Adjusted Operating Income” and “Non-GAAP Adjusted Operating Income Margin” guidance for fiscal year 2016, which represents Non-GAAP Adjusted Operating Income as a percentage of total revenue.
LOW | HIGH | |||||
Fiscal Year Ending December 31, 2016 | ||||||
Total revenue | $ | 1,085.0 | $ | 1,115.0 | ||
GAAP net income | 10.8 | 19.5 | ||||
Add: Provision for income taxes | 7.6 | 12.9 | ||||
Add: Total other expense | 5.3 | 6.4 | ||||
GAAP operating income | $ | 23.7 | $ | 38.8 | ||
GAAP operating income margin | 2.2 | % | 3.5 | % | ||
Add: Stock-based compensation expense | 69.4 | 69.4 | ||||
Add: Amortization of capitalized stock-based compensation related to software development | 6.8 | 6.8 | ||||
Add: Amortization of purchased intangible assets | 20.0 | 20.0 | ||||
Non-GAAP Adjusted Operating Income | $ | 120.0 | $ | 135.0 | ||
Non-GAAP Adjusted Operating Income Margin | 11.1 | % | 12.1 | % | ||
13
Non-GAAP Adjusted Net Income Guidance
Set forth below is a reconciliation of our “Non-GAAP Adjusted Net Income” and “Non-GAAP Adjusted Net Income per Diluted Share” guidance for fiscal year 2016.
LOW | HIGH | |||||
Fiscal Year Ending December 31, 2016 | ||||||
GAAP net income | $ | 10.8 | $ | 19.5 | ||
Add: Stock-based compensation expense | 69.4 | 69.4 | ||||
Add: Amortization of capitalized stock-based compensation related to software development | 6.8 | 6.8 | ||||
Add: Amortization of purchased intangible assets | 20.0 | 20.0 | ||||
Sub-total of tax deductible items | $ | 96.2 | $ | 96.2 | ||
(Less): Tax impact of tax deductible items (1) | (38.5 | ) | (38.5 | ) | ||
Add: Tax impact resulting from applying a normalized non-GAAP tax rate (2) | 0.2 | (0.1 | ) | |||
Non-GAAP Adjusted Net Income | $ | 68.8 | $ | 77.2 | ||
Weighted average shares - diluted | 41.7 | 41.7 | ||||
Non-GAAP Adjusted Net Income per Diluted Share | $ | 1.65 | $ | 1.85 | ||
(1) | Tax impact calculated using a statutory tax rate of 40%. |
(2) | Represents adjusting the GAAP net income to a non-GAAP tax rate of 40%. For 2016, we are using non-GAAP tax rate of 40% to normalize the tax impact to our Non-GAAP Adjusted Net Income per Diluted Share based on the fact that a relatively small change in pre-tax GAAP income (loss) in any one period could result in a volatile GAAP effective tax rate. |
LOW | HIGH | |||||
Fiscal Year Ending December 31, 2016 | ||||||
GAAP net income per share - diluted | $ | 0.26 | $ | 0.47 | ||
Add: Stock-based compensation expense | 1.66 | 1.66 | ||||
Add: Amortization of capitalized stock-based compensation related to software development | 0.16 | 0.16 | ||||
Add: Amortization of purchased intangible assets | 0.48 | 0.48 | ||||
Sub-total of tax deductible items | $ | 2.31 | $ | 2.31 | ||
(Less): Tax impact of tax deductible items (1) | (0.92 | ) | (0.92 | ) | ||
Add: Tax impact resulting from applying a normalized non-GAAP tax rate (2) | 0.01 | — | ||||
Non-GAAP Adjusted Net Income per Diluted Share | $ | 1.65 | $ | 1.85 | ||
Weighted average shares - diluted | 41.7 | 41.7 | ||||
(1) | Tax impact calculated using a statutory tax rate of 40%. |
(2) | Represents adjusting the GAAP net income to a non-GAAP tax rate of 40%. For 2016, we are using a non-GAAP tax rate of 40% to normalize the tax impact to our Non-GAAP Adjusted Net Income per Diluted Share based on the fact that a relatively small change in pre-tax GAAP income (loss) in any one period could result in a volatile GAAP effective tax rate. |
14
Explanation of Non-GAAP Financial Measures
We report our financial results in accordance with accounting principles generally accepted in the United States of America, or GAAP. However, management believes that, in order to properly understand our short-term and long-term financial and operational trends, investors may wish to consider the impact of certain non-cash or non-recurring items, when used as a supplement to financial performance measures in accordance with GAAP. These items result from facts and circumstances that vary in frequency and impact on continuing operations. Management also uses results of operations before such items to evaluate the operating performance of athenahealth and compare it against past periods, make operating decisions, and serve as a basis for strategic planning. These non-GAAP financial measures provide management with additional means to understand and evaluate the operating results and trends in our ongoing business by eliminating certain non-cash expenses and other items that management believes might otherwise make comparisons of our ongoing business with prior periods more difficult, obscure trends in ongoing operations, or reduce management’s ability to make useful forecasts. Management believes that these non-GAAP financial measures provide additional means of evaluating period-over-period operating performance. In addition, management understands that some investors and financial analysts find this information helpful in analyzing our financial and operational performance and comparing this performance to our peers and competitors.
Management defines “Non-GAAP Adjusted Gross Profit” as total revenue, less direct operating expense, plus (1) stock-based compensation expense allocated to direct operating expense, (2) amortization of purchased intangible assets allocated to direct operating expense, and (3) exit costs, including restructuring costs allocated to direct operating expense, and “Non-GAAP Adjusted Gross Margin” as Non-GAAP Adjusted Gross Profit as a percentage of total revenue. Management considers these non-GAAP financial measures to be important indicators of our operational strength and performance of our business and a good measure of our historical operating trends. Moreover, management believes that these measures enable investors and financial analysts to closely monitor and understand changes in our ability to generate income from ongoing business operations.
Management defines “Non-GAAP Adjusted Operating Income” as the sum of GAAP net income before (benefit from) provision for income taxes; total other expense (income); stock-based compensation expense; amortization of capitalized stock-based compensation related to software development; amortization of purchased intangible assets; integration and transaction costs; exit costs, including restructuring costs; and gain or loss on investments; and “Non-GAAP Adjusted Operating Income Margin” as Non-GAAP Adjusted Operating Income as a percentage of total revenue. Management defines “Non-GAAP Adjusted Net Income” as the sum of GAAP net income before stock-based compensation expense; amortization of capitalized stock-based compensation related to software development; amortization of purchased intangible assets; integration and transaction costs; exit costs, including restructuring costs; and gain or loss on investments and any tax impact related to these preceding items; and an adjustment to the tax provision for the non-GAAP tax rate and “Non-GAAP Adjusted Net Income per Diluted Share” as Non-GAAP Adjusted Net Income divided by weighted average diluted shares outstanding. Management considers all of these non-GAAP financial measures to be important indicators of our operational strength and performance of our business and a good measure of our historical operating trends, in particular the extent to which ongoing operations impact our overall financial performance.
Management excludes or adjusts each of the items identified below from the applicable non-GAAP financial measure referenced above for the reasons set forth with respect to that excluded item:
15
• | Stock-based compensation expense and amortization of capitalized stock-based compensation related to software development — excluded because these are non-cash expenditures that management does not consider part of ongoing operating results when assessing the performance of our business, and also because the total amount of the expenditure is partially outside of our control because it is based on factors such as stock price, volatility, and interest rates, which may be unrelated to our performance during the period in which the expenses are incurred. |
• | Amortization of purchased intangible assets — purchased intangible assets are amortized over their estimated useful lives and generally cannot be changed or influenced by management after the acquisition. Accordingly, this item is not considered by management in making operating decisions. Management does not believe such charges accurately reflect the performance of our ongoing operations for the period in which such charges are incurred. |
• | Integration and transaction costs — Integration costs are the severance payments and retention bonuses for certain employees related to specific transactions. Transaction costs are costs related to strategic transactions. Accordingly, management believes that such expenses do not have a direct correlation to future business operations, and therefore, these costs are not considered by management in making operating decisions. Management does not believe such charges accurately reflect the performance of our ongoing operations for the period in which such charges are incurred. |
• | Exit costs, including restructuring costs — represents costs related to workforce reductions and to terminate certain lease or other contract agreements for strategic realignment purposes. Management does not believe such costs accurately reflect the performance of our ongoing operations for the period in which such costs are incurred. |
• | Gain or loss on investments — represents gain on sale of marketable securities, gain on sale of More Disruption Please (“MDP”) Accelerator investments, and loss on impairment of MDP Accelerator investments. Management does not believe such gains or losses accurately reflect the performance of our ongoing operations for the period in which such gains or losses are reported. |
• | Non-GAAP tax rate — We use a non-GAAP tax rate of 40% to normalize the tax impact to our Non-GAAP Adjusted Net Income per Diluted Share based on the fact that a relatively small change in pre-tax GAAP income (loss) in any one period could result in a volatile GAAP effective tax rate. |
16
Third Quarter Fiscal Year 2016
Prepared Remarks October 20, 2016
Jonathan Bush, Chairman & Chief Executive Officer
Karl Stubelis, Senior Vice President, Chief Financial Officer
About These Remarks
The following commentary is provided by management in conjunction with the third quarter fiscal year 2016 earnings press release issued by athenahealth, Inc. (“athenahealth” or “we”). These remarks represent management’s current views on our financial and operational performance and are provided to give investors and analysts more time to analyze and understand our performance in advance of the earnings conference call. These prepared remarks will not be read on the conference call. A complete reconciliation between generally accepted accounting principles (“GAAP”) and non-GAAP results, as well as a summary of supplemental metrics and definitions, is provided in the tables following these prepared remarks.
Earnings Conference Call Information
To participate in our live conference call and webcast, please dial 877-853-5645 (or 408-940-3868 for international calls) using conference code no. 75527226, or visit the Investors section of our website at www.athenahealth.com. A replay will be available for one week following the conference call at 855-859-2056 (and 404-537-3406 for international calls) using conference code no. 75527226. A webcast replay will also be archived on our website.
Safe Harbor and Forward-Looking Statements
These remarks contain forward-looking statements within the meaning of Section 27A of the Securities Act of 1933, as amended, and Section 21E of the Securities Exchange Act of 1934, as amended, including statements regarding management’s expectations for future financial and operational performance and operational expenditures, expected growth, and business outlook, including fiscal 2016 guidance; statements regarding the strength of the drivers of our long-term success; statements regarding our ability to achieve full year Physician Quality Reporting System (“PQRS”) goals; statements regarding improvement of our portal experience and adoption, and patient engagement; statements regarding improving our net promoter score; statements regarding the appropriate future metrics to use in measuring our market share; statements regarding our goals to improve gross margin; statements regarding our major areas of focus in 2017; statements regarding the benefits of and demand for our service offerings, including our newer service offerings and timing of the availability of and transition to these newer offerings, including athenaClinicals Streamlined; statements regarding the potential expansion and value of our network and progress towards building the healthcare information backbone; investments in disruptive innovation and emerging services and the expected long-term value creation from our investments; developments and plans for inpatient service offerings and positioning to serve the hospital and health system market, including the expansion of services by leveraging our More Disruption Please program; the timing and impact of expansion of our client base outside the traditional ambulatory market; the impact of acquisitions; and statements found under our “Reconciliation of Non-GAAP Financial Measures to Comparable GAAP Measures” and “Reconciliation of Non-GAAP Financial Measures to Comparable GAAP Measures for Fiscal Year 2016 Guidance” sections of these remarks. Forward-looking statements may be identified with words such as “will,” “may,” “expect,” “plan,” “anticipate,” “upcoming,” “believe,” “expect,” or similar terminology, and the negative of these terms. Forward-looking statements are not promises or guarantees of future performance, and are subject to a variety of risks and uncertainties, many of which are beyond our control, which could cause actual results to differ materially from those contemplated in these forward-looking statements. These risks and uncertainties
1
include: our highly competitive industry and our ability to compete effectively and remain innovative; the development of the market for cloud-based healthcare information technology services; changes in the healthcare industry and their impact on the demand for our services; our ability to effectively manage our growth; our ability to protect our intellectual property; current and future litigation, including for intellectual property infringement; our dependence on third-party providers; risks and costs associated with our worldwide operations; our ability to attract and retain highly skilled employees; our fluctuating operating results; our ability to retain our clients and maintain client revenue; our tax liability; our variable sales and implementation cycles; the timing at which we recognize certain revenue and our ability to evaluate our prospects; defects and errors in our software or services, or interruptions or damages to our systems or those of third parties on which we rely; a data security breach; limitations on our use of data; the effect of payer and provider conduct; the failure of our services to provide accurate and timely information; increasing government regulation and the costs and challenges of compliance; the potential for illegal behavior by employees or subcontractors; and the price volatility of our common stock. Forward-looking statements speak only as of the date hereof and, except as required by law, we undertake no obligation to update or revise these forward-looking statements. For additional information regarding these and other risks faced by us, refer to our public filings with the Securities and Exchange Commission (“SEC”), available on the Investors section of our website at www.athenahealth.com and on the SEC’s website at www.sec.gov.
Use of Non-GAAP Financial Measures
These remarks contain non-GAAP financial measures, as defined by SEC Regulation G. The GAAP financial measure most directly comparable to each non-GAAP financial measure used or discussed, and a reconciliation of the differences between each non-GAAP financial measure and the comparable GAAP financial measure, are included following these prepared remarks and can be found within our third quarter fiscal year 2016 earnings press release in the Investors section of our website at www.athenahealth.com.
Opening Remarks
athenahealth is helping to “Unbreak Healthcare” in three key ways. First, we let doctors be doctors. Second, we connect and coordinate care across the continuum. And third, we invite all who believe in the power of technology and innovation to join us. Today, our national clinical network connects over 85,000 providers, manages over 140,000 network endpoints, and processes over 600 million electronic transactions per month. We recently launched an interactive view of our nationwide network effect in action on our athenaInsight page. Check out the athenaInsight interactive look at interoperability to explore data as it flows across the healthcare internet.
Highlights from Q3 2016 include the following:
• | Grew consolidated revenue by 17% over Q3 2015 |
• | Delivered Non-GAAP Adjusted Gross Margin of 65.0%, up from 62.9% in Q3 2015 |
• | Delivered GAAP Operating Margin of 5.5%, up from 1.4% in Q3 2015 |
• | Delivered Non-GAAP Adjusted Operating Margin of 15.0%, up from 10.8% in Q3 2015 |
• | Net new active physicians added to the network: athenaCollector® (3,829 physicians added), athenaClinicals® (2,090 physicians added), and athenaCommunicator® (3,416 physicians added) in Q3 2016, compared to athenaCollector (3,953 physicians added), athenaClinicals (2,818 physicians added), and athenaCommunicator (3,422 physicians added) in Q3 2015 |
◦ | Grew athenaCollector physicians by 18%, athenaClinicals physicians by 24%, and athenaCommunicator physicians by 22% over Q3 2015, representing continued strong network growth in 2016 |
2
• | Net new active providers added to the network: athenaCollector (5,092 providers added), athenaClinicals (2,844 providers added), and athenaCommunicator (4,478 providers added) in Q3 2016, compared to athenaCollector (4,784 providers added), athenaClinicals (3,430 providers added), and athenaCommunicator (4,084 providers added) in Q3 2015 |
◦ | Grew athenaCollector providers by 18%, athenaClinicals providers by 26%, and athenaCommunicator providers by 23% over Q3 2015, representing continued strong network growth in 2016 |
• | Continued the implementation waves at NewYork-Presbyterian Medical Groups (athenaOne), Adventist Health (athenaOne), and Dignity Health (Population Health) |
• | Further demonstrated the importance of our More Disruption Please (“MDP”) program with the acquisition of another MDP Accelerator investment, Patient IO |
• | Announced our Merit-Based Incentive Payment System (“MIPS”) Guarantee which aims to shield our clients from downward payment adjustments under the proposed Medicare reimbursement program |
• | Published another athenaCollector for Hospitals & Health Systems case study profiling Lost River Medical Center’s streamlined billing process, stronger cash flow, and improved staff efficiency |
Results Overview
athenahealth’s top line results for the third quarter of fiscal year (“FY”) 2016 reflect solid revenue growth:
• | Total revenue: |
◦ | $276.7 million in Q3 2016, representing 17% growth over $236.1 million in Q3 2015 |
◦ | $794.8 million for the nine months ending September 30, 2016, representing 19% growth over $667.2 million in the same period last year |
Our bottom line results for Q3 2016, consistent with our growth strategy, demonstrate deliberate sales, marketing, and research and development investments, and a focus on operating efficiencies:
• | Non-GAAP Adjusted Gross Profit and Margin: |
◦ | $179.9 million, or 65.0% of total revenue, in Q3 2016, an increase of 21% over $148.5 million, or 62.9% of total revenue, in Q3 2015 |
• | GAAP Selling and Marketing expense: |
◦ | $59.1 million, or 21.3% of total revenue, in Q3 2016, an increase of 6% over $55.9 million, or 23.7% of total revenue, in Q3 2015 |
• | GAAP Research and Development expense: |
◦ | $24.9 million, or 9.0% of total revenue, in Q3 2016, an increase of 10% from $22.6 million, or 9.6% of total revenue, in Q3 2015 |
• | GAAP General and Administrative expense: |
◦ | $41.9 million, or 15.1% of total revenue, in Q3 2016, an increase of 20% from $34.8 million, or 14.7% of total revenue, in Q3 2015 |
3
• | GAAP Operating Income and Margin: |
◦ | $15.2 million, or 5.5% of total revenue, in Q3 2016, compared to $3.2 million, or 1.4% of total revenue, in Q3 2015 |
• | Non-GAAP Adjusted Operating Income and Margin: |
◦ | $41.5 million, or 15.0% of total revenue, in Q3 2016, an increase of 63% from $25.4 million, or 10.8% of total revenue, in Q3 2015 |
• | GAAP Net Income: |
◦ | $13.9 million, or $0.35 per diluted share, in Q3 2016, compared to $5.8 million, or $0.15 per diluted share, in Q3 2015 |
• | Non-GAAP Adjusted Net Income: |
◦ | $24.1 million, or $0.60 per diluted share, in Q3 2016, an increase of 68% from $14.3 million, or $0.36 per diluted share, in Q3 2015 |
We measure our performance based on a balanced scorecard model. We believe that this framework is an excellent report card for our performance for the current year and that it measures the key performance indicators required for long-term success. For 2016, we have developed a more streamlined and more heavily weighted scorecard focused on eight key stability, performance, satisfaction, and financial metrics. The table below shows the scorecard results for Q1 2016, Q2 2016, Q3 2016, and year-to-date Q3 2016. Please reference the last page of this document for definitions of our corporate scorecard metrics.
4
athenahealth 2016 Corporate Scorecard
Q1 2016 Results | Q2 2016 Results | Q3 2016 Results | YTD 2016 Results | |||||||||
Stability (10% weight) | ||||||||||||
Voluntary Turnover | 2.4 | % | 3.8 | % | 3.7 | % | 9.9 | % | ||||
Employee Engagement | (a) | 4.2 | (a) | 4.2 | ||||||||
Stability Results | 113 | % | 61 | % | 67 | % | 80 | % | ||||
Performance (40% weight) | ||||||||||||
athenaCollector Composite | 103.1 | % | 100.7 | % | 96.6 | % | 100.1 | % | ||||
athenaClinicals Composite | 89.1 | % | 98.0 | % | 92.9 | % | 99.0 | % | ||||
athenaCommunicator Composite | 96.8 | % | 96.9 | % | 96.9 | % | 96.9 | % | ||||
athenaCoordinator Composite | 108.0 | % | 109.8 | % | 108.3 | % | 108.7 | % | ||||
Epocrates Composite | 100.7 | % | 102.2 | % | 97.9 | % | 100.3 | % | ||||
Performance Results | 98 | % | 100 | % | 97 | % | 100 | % | ||||
Satisfaction (15% weight) | ||||||||||||
Net Promoter Score | 34.0 | 29.3 | 20.2 | 27.8 | ||||||||
Satisfaction Results | 77 | % | 67 | % | 46 | % | 63 | % | ||||
Financial (35% weight) | ||||||||||||
Bookings (b) | (b) | (b) | (b) | (b) | ||||||||
Non-GAAP Adjusted Operating Income ($M) | $ | 24.2 | $ | 24.1 | $ | 41.5 | $ | 89.8 | ||||
Financial Results | 96 | % | 97 | % | 77 | % | 88 | % | ||||
Total Results | 96 | % | 90 | % | 80 | % | 88 | % | ||||
(a) | Employee Engagement surveys are completed twice per year with results reported in Q2 and Q4 only. |
(b) | Since the bookings metric contains highly sensitive data, we do not disclose all of the specific performance measures and targets, because we believe that such disclosure would result in serious competitive harm. |
We believe that our underlying drivers of long-term success remain relatively strong as supported by our corporate scorecard metrics results. However, Voluntary Turnover and Net Promoter Score again came in below our internal goals in Q3 2016 and remain key areas of focus for the company in Q4 2016 and 2017.
• | Voluntary Turnover of 3.7% in Q3 2016, unfavorable to our goal of 2.8%. Year-to-date, Voluntary Turnover is 9.9% versus our goal of 8.3%. We closely track employee retention metrics and monitor employee engagement via our semi-annual engagement surveys. We continue to focus on programs that attract and develop top talent across all of our locations. |
• | athenaCollector Composite result of 96.6%, driven by strong performance in the Time of Service “TOS” Collection Rate metric, mainly attributable to the introduction of our new TOS workflow in Q4 2015. The TOS Collection Rate performance was slightly offset by higher than planned Days in Accounts Receivable (41.5 days versus goal of 38.9 days). |
• | athenaClinicals Composite result of 92.9%, driven by slightly higher than expected After Hours Physician Documentation Time. We expect to improve the After Hours Physician Documentation Time metric as we continue to transition the entire athenaClinicals client base to the Streamlined experience during 2016 and early 2017. |
5
• | athenaCommunicator Composite result of 96.9%, driven by slightly lower than expected Portal Adoption and Portal Engagement Rate metric results. We remain focused on improving our patient portal and broader patient communication strategies in order to improve portal experience and increase portal adoption and patient engagement over time. |
• | athenaCoordinator Composite result of 108.3%, driven by strong performance in the Coordinated Patient Rate metric, resulting from the growth in the amount of activity associated with chart sharing between athenaNet and third-party vendors. |
• | Epocrates Composite result was 97.9% as the 90 Day Active Doc Engagement rate metric result was mostly in line with our goal. |
• | Net Promoter Score of 20.2 in Q3 2016, versus goal of 44.0. As expected, our Net Promoter Score remained under pressure in the third quarter due to the athenaClinicals Streamlined migration and longer than expected response times to client issues. We have a number of initiatives underway that we believe will improve our net promoter score over the long run. First, we have product leaders focused solely on improving service delivery and performance. Second, we are reducing the number of releases that impact client workflows to three times a year as part of our agile transformation. Finally, we are working on improving our overall service experience, particularly on the customer support side by taking care of client issues in a more timely fashion. All of these initiatives are underway and will be continue to be major areas of focus for us in 2017. |
athenahealth’s client base continues to expand while client adoption of other services in the athenahealth service suite grows. As our client base expands outside the traditional ambulatory market, we believe that total active providers, receiver nodes, and eventually covered lives, total managed lives, and discharge bed days managed by or transacted across our network will become more appropriate metrics to use in measuring our market share. During Q3 2016:
• | 81% of all new athenaCollector deals included athenaClinicals, compared to 87% in Q3 2015 |
• | 79% of all new athenaCollector deals included athenaClinicals, athenaCommunicator and athenaCoordinator, compared to 82% in Q3 2015. |
• | 47% of total athenaCollector physicians have adopted athenaClinicals, up from 45% in Q3 2015 |
• | 76% of total athenaCollector physicians have adopted athenaCommunicator, up from 73% in Q3 2015 |
• | Net new physicians and providers added sequentially to the network were as follows: |
athenaCollector | athenaClinicals | athenaCommunicator | ||||||||||||
Active physicians and providers: | Physicians | Providers | Physicians | Providers | Physicians | Providers | ||||||||
Beginning balance as of 6/30/16 | 58,621 | 80,373 | 27,349 | 36,208 | 43,767 | 57,211 | ||||||||
Net new additions | 3,829 | 5,092 | 2,090 | 2,844 | 3,416 | 4,478 | ||||||||
Ending balance as of 9/30/16 | 62,450 | 85,465 | 29,439 | 39,052 | 47,183 | 61,689 | ||||||||
Sequential growth % | 7 | % | 6 | % | 8 | % | 8 | % | 8 | % | 8 | % | ||
6
• | Net new physicians and providers added to the network since Q3 2015 were as follows: |
athenaCollector | athenaClinicals | athenaCommunicator | ||||||||||||
Active physicians and providers: | Physicians | Providers | Physicians | Providers | Physicians | Providers | ||||||||
Beginning balance as of 9/30/15 | 53,129 | 72,314 | 23,741 | 31,071 | 38,670 | 49,986 | ||||||||
Net new additions | 9,321 | 13,151 | 5,698 | 7,981 | 8,513 | 11,703 | ||||||||
Ending balance as of 9/30/16 | 62,450 | 85,465 | 29,439 | 39,052 | 47,183 | 61,689 | ||||||||
Y/Y growth % | 18 | % | 18 | % | 24 | % | 26 | % | 22 | % | 23 | % | ||
• | Over 8,800 network end points were added to the network in Q3 2016, bringing our total network end points to over 140,000 as of September 30, 2016 |
Revenue Discussion
Q3 2016 revenue was $276.7 million and grew by 17% (or $40.6 million) over Q3 2015. Revenue for the nine months ended September 30, 2016 was $794.8 million and grew by 19% (or $127.6 million) over the same period last year.
Q3 2016 | Q3 2015 | Y/Y Growth% | ||
Business Services | $267.1 | $225.0 | 19 | % |
Implementation and other | $9.6 | $11.1 | (14 | )% |
Consolidated Revenue | $276.7 | $236.1 | 17 | % |
YTD Q3 2016 | YTD Q3 2015 | Y/Y Growth% | ||
Business Services | $768.8 | $638.2 | 20 | % |
Implementation and other | $26.0 | $29.0 | (10 | )% |
Consolidated Revenue | $794.8 | $667.2 | 19 | % |
In terms of trends in our recurring revenue base, same-store analysis of claims created—a proxy for physician office utilization—indicates that physician office activity in Q3 2016 increased slightly over physician office activity during Q3 2015. Our analysis also showed that physician office activity in Q3 2016 increased slightly over physician office activity in Q2 2016.
Non-GAAP Adjusted Gross Margin Discussion
Our Non-GAAP Adjusted Gross Margin was 65.0% for Q3 2016, up approximately 210 basis points from 62.9% in Q3 2015. As planned, we continue to invest in our go-live support, client support center, and emerging services personnel to support the growth of our core and emerging services. One of our goals is to improve gross margin on a service-line basis each year. As previously discussed, the expansion of our newer service offerings, such as athenaOne for Hospitals and Health Systems, is expected to serve as a headwind to total company margin expansion until these newer services become more automated and scalable. Our fiscal year 2016 Non-GAAP Adjusted Gross Margin guidance range remains at 63.5% to 64.5% and we expect to be near the mid-point of this guidance range.
Balance Sheet and Cash Flow Highlights
As of September 30, 2016, we had cash and cash equivalents of $130.0 million and outstanding indebtedness of $292.5 million. Operating cash flow increased by $33.1 million from net cash provided by operating activities of $102.9 million for the nine months ended September 30, 2015, to net cash provided by operating activities of $136.0 million for the nine months ended September 30, 2016.
Fiscal Year 2016 Outlook
We communicated our fiscal year 2016 guidance on December 10, 2015 at our 8th Annual Investor
7
Summit. Our fiscal year 2016 guidance is summarized in the following table:
For the Fiscal Year Ending December 31, 2016 | |
Forward-Looking Guidance1 | |
GAAP Total Revenue | $1,085 - $1,115 million |
Non-GAAP Adjusted Gross Margin | 63.5% - 64.5% |
Non-GAAP Adjusted Operating Income | $120 - $135 million |
Non-GAAP Adjusted Net Income per Diluted Share | $1.65 - $1.85 |
Non-GAAP Tax Rate | 40% |
We are not making any changes to the fiscal year 2016 guidance we communicated on December 10, 2015 at our 8th Annual Investor Summit. However, based on our year-to-date performance that was relatively in line with our internal financial goals and our current expectations for Q4 2016, we are providing additional insight into our fiscal year 2016 guidance as follows:
• | We expect GAAP Total Revenue to be near the mid-point of the $1,085 million to $1,115 million guidance range. |
• | We expect Non-GAAP Adjusted Gross Margin to be near the mid-point of the 63.5% to 64.5% guidance range. |
• | We expect Non-GAAP Adjusted Operating Income to be near the mid-point of the $120 million to $135 million guidance range. |
• | Finally, we expect Non-GAAP Adjusted Net Income per Diluted Share to be near the mid-point of the $1.65 to $1.85 guidance range. |
1 We release annual guidance once per year at our annual investor summit. Recently, the U.S. Securities and Exchange Commission staff issued updates to its Compliance and Disclosure Interpretations regarding the use of non-GAAP financial measures. However, we believe that revising this table mid-year during 2016 to present the GAAP equivalent may confuse the investment community. As a result, we plan to present both the non-GAAP financial measure and the applicable GAAP financial measure in this table beginning with the release of our fiscal year 2017 guidance.
Service Development Discussion
Service development at athenahealth is organized around our mission to be healthcare providers’ most trusted service, helping them do well by doing the right thing. In order to fulfill this mission, we deliver services backed by our network, knowledge, and back-office work. We deliver network-enabled services for revenue cycle and practice management, electronic health records, patient engagement, patient access, care coordination, order transmission, population health management, and clinical decision support.
athenahealth-branded and Epocrates-branded service offerings
The following suite of network-enabled services connects our clients to financial results, clinical outcomes, patients, and the broader care continuum:
8
athenaCollector is our network-enabled revenue cycle and practice management service, which became generally available in 2000. Through this service, athenahealth helps to reduce administrative work and enables clients to improve performance and efficiency under reimbursement models, including Pay-for-Performance. athenaCollector is offered as a stand-alone solution for revenue cycle and practice management and athenaCollector for Hospitals and Health Systems is offered as a stand-alone revenue cycle solution for hospital clients. In addition, our revenue cycle services are also integrated with more comprehensive offerings: athenaOne and athenaOne for Hospitals and Health Systems, respectively.
athenaClinicals is our network-enabled electronic health record (“EHR”) service designed to make the documentation and exchange of health information easier by centering the workflow around the patient visit. athenaClinicals encourages delegation by intelligently surfacing relevant clinical content based on physician behavior across the network, and helps with tedious administrative work associated with managing orders and results. It entered general availability in 2006 and was made available as a stand-alone service in 2010. athenahealth also offers an EHR service to clients who provide care in the acute care setting - athenaClinicals for Hospitals and Health Systems - which transforms the core athenaClinicals services so that they are appropriate for the additional requirements of a non-ambulatory setting. Both athenaClinicals and athenaClinicals for Hospitals and Health Systems are also offered as part of comprehensive solutions: athenaOne and athenaOne for Hospitals and Health Systems, respectively.
athenaCommunicator is our network-enabled patient engagement and communication service. It entered general availability in 2010 and continues to help providers deepen their relationships with their patients. This service offers a unique approach to patient communication by combining web-based automated messaging and patient portal with the ability to speak to live operators for patients who receive specific call types. Clients who also use athenaClinicals can choose to allow their patients to view specific portions of their medical record via the patient portal.
athenahealth Population Health (formerly athenaCommunicator Enterprise) is our network-enabled population health management service. This comprehensive, network-enabled service combines software and analytics to execute, track, and coordinate care across a provider’s network. After clients transfer data from payers, finance systems, laboratories, clinical repositories, and/or EHRs, athenahealth Population Health processes and integrates that data and provides a platform through which clients can glean important insight into and manage the health of their patient population. athenahealth began offering population health management services in 2012 after the acquisition of Healthcare Data Services LLC. Effective 2016, this service has been rebranded as athenahealth Population Health.
athenaCoordinator is our EHR-agnostic, network-enabled order transmission service, which entered general availability in 2012. While most clients who use athenaClinicals are included in the receiver network, athenaCoordinator clients also include stand-alone facilities that receive orders via a “lite” portal to streamline receipt from their senders.
athenaCoordinator Enterprise is our network-enabled care coordination, patient access, and order transmission service. This service was first offered by athenahealth in 2011 after the acquisition of Proxsys, LLC. athenaCoordinator Enterprise is targeted at health systems navigating the difficult and costly work associated with coordinating care among multiple providers and trading partners in order to manage diverse populations of patients. This service enables smooth transitions in care, with direct scheduling across the client’s organization and secure mobile and desktop messaging for provider collaboration.
Epocrates-branded services center around a variety of clinical information and decision support offerings available through healthcare providers’ mobile devices. These services include: drug and disease information, medical calculator and tools, clinical guidelines, and clinical messaging. The Epocrates network of members consists of over one million healthcare professionals, including approximately 50% of U.S. physicians. The features available through our Epocrates application help healthcare professionals
9
make more informed prescribing decisions, improve workflow, and enhance patient safety. athenahealth acquired Epocrates on March 12, 2013.
Connecting to financial results:
Our athenaCollector team remains focused on three major areas in 2016: reducing client work, mastering collections of self-pay balances, and adding capabilities to expand in key markets. As one of the only internet-based companies of any size and scale in healthcare today, we have been proactively leveraging our network to make meaningful progress against each of these important initiatives, particularly as they relate to reducing client work. It is in our DNA to improve our services every year and we now have the resources and insights to focus more specifically on the operating costs of our clients. We are using our network intelligence to expedite claim processing and we are deploying our service teams to complete more work on behalf of clients. For example, we have been able to more precisely identify the root cause of claims processing delays such as mismatches between patients’ ages and CPT codes and missing modifiers to CPT codes when services are rendered by mid-level providers. Instead of sending these claims back to our clients, we are using athenaNet data to automatically fix the errors on their behalf before the claims get submitted. By successfully pairing the data from our network with our knowledge around coding requirements, we are systematically and effectively simplifying the claim submission process and improving the client experience. We will continue to seek out new ways to use the power of our network-enabled services to remove friction from the revenue cycle.
Connecting to clinical outcomes:
Our athenaClinicals service helps providers deliver high quality care by organizing the moment of care for maximum clinical productivity and reimbursement. The launch of the athenaClinicals Streamlined experience enhances our industry-leading, network-driven electronic health record service by radically improving the provider experience. Streamlined centers the encounter around the patient, improves the amount and ease of delegating work away from the physicians, allows the physicians to document as they would communicate, and includes a variety of accelerators to speed documentation of the patient story. As with all of our services, we are focused on improving client performance and delivering results across the entire network. The transition to Streamlined continues to progress well and the results speak for themselves. We exited Q3 2016 with over 50% of our athenaClinicals providers and nearly 90% of our athenaClinicals clients having adopted the Streamlined workflow. We remain on track to transition the entire athenaClinicals client base by the end of 2016 or early 2017. More importantly, our key performance metrics like Same Day Encounter Close Rate and Post-Visit Documentation Rate continue to trend positively. Our existing athenaClinicals providers are on average 7% more efficient at documenting during the encounter and are experiencing an average 21% drop in documentation after the visit, while our net new athenaClinicals providers are enjoying an average 21% improvement in documentation efficiency and are spending an average 31% less time documenting after the patient visit. Finally, our clients’ staffs are also taking on about one third of the work physicians themselves typically spend on burdensome documentation, leading to greater time focused on patients.
We strongly believe that athenaClinicals Streamlined brings our electronic health record service into the age of the internet by delivering an unparalleled provider experience supported by an always learning, always updating network. As a result of our cloud-based architecture, we can release changes to our workflows and technology platform that incorporate client feedback and optimize clinical productivity on a timely basis. Releases over the past several months have included improvements to ordering workflows, improvements to chart searching and browsing capabilities, as well as improvements to how information is loaded and displayed, to name a few. We take client feedback very seriously and will continue to incorporate feedback in upcoming releases.
10
Connecting to patients:
athenaCommunicator is our patient engagement service that helps practices delight patients with the quality of their experience, compels patients to engage fully in their care, and eliminates unnecessary work for our clients. The recent launch of our improved patient self-check-in workflow demonstrates how the athenaCommunicator team is delivering on its promise to reduce client work and create a better patient experience in 2016. This improved workflow presents the patient with an easy, on-line experience to check-in for his or her appointment via a desktop computer or mobile device pre-appointment. More importantly, this improved check-in experience is available to all patients, whether or not they already have a patient portal account, enabling clients to engage with a greater number of patients. The improved self-check-in workflow eliminates unnecessary work for the practice and enables patients to view and confirm appointment details, view and update demographics, pay copay and previous balances, e-sign consent forms, and register for the patient portal. This improved workflow also represents another avenue to drive patient portal registration and engagement. These investments are paying off as illustrated by our record-breaking addition of over 1.4 million registered patients to our athenaCommunicator platform in the third quarter. This brings our total registered patients to nearly 13.5 million and our patient portal adoption rate of 31.3% as of Q3 2016, up from 12 million total registered patients and 30.8% portal adoption rate as of Q2 2016.
We believe that care coordination and patient self-management are the next big areas in which healthcare will compete. Developing a more direct connection with the patient is fundamental to our long-term success, and the acquisition of Patient IO is a key step in our multi-prong strategy to establish a patient-facing presence. Our relationship with Patient IO began back in 2015 when we made an initial investment in the company via our More Disruption Please Accelerator program. We quickly realized that the Patient IO platform could increase patient engagement and ultimately improve how patients experience healthcare. Delivered as a simple and elegant mobile and web-based application, Patient IO turns care plans into actionable daily tasks for patients. Whether managing medications, reviewing educational content, or recording self-reported data, Patient IO empowers patients to play an impactful and ongoing role in their own care. Differentiated by its API-first architecture and omni-channel engagement, Patient IO will form the basis of our patient-facing application, athenaWell. This integrated functionality was already live in the market with select clients prior to the acquisition, and will be made available to new athenahealth Population Health clients as a native component of the service in Q4 2016.
Connecting to the care continuum:
We are committed to building the most connected network in healthcare and to driving meaningful, measurable results for everyone on our network. We connect providers on athenaNet with labs,
pharmacies, hospitals, imaging centers, and public health agencies as well as nearly every insurer in the country. Today, we have over 83 million unique patient records and support the medical operations of over 85,000 providers. In Q3 2016 alone, we exchanged nearly 1.8 billion electronic transactions across over 140,000 network end points, representing 77% growth from the nearly one billion electronic transactions exchanged in Q3 2015. As our connected network grows with our ever-expanding provider and patient bases, so does our ability to leverage the network and create more unique value for our clients. In order to display our growing national network in action, we recently launched the “Interactive: a look at interoperability” page on athenaInsight. We are using this website to show what is happening across our network. This insight includes how healthcare data is flowing on the network, the progression of healthcare going digital, and the growing connections we are making with practices and facilities nationwide. Our efforts to demonstrate a leadership position in this space and promote true interoperability in healthcare have been recognized in the 2016 KLAS Interoperability Report. Findings from the KLAS 2016 Interoperability Report rate athenahealth highest among nine other vendors for our ability to share data with other electronic medical records (“EMR”). athenahealth’s strategic progress in increasing connectivity across all of healthcare is highlighted throughout the report in three ways: 1) interoperability satisfaction; 2) CommonWell and Carequality integration; and 3) EMR-EMR exchange.
11
athenaCoordinator Network Growth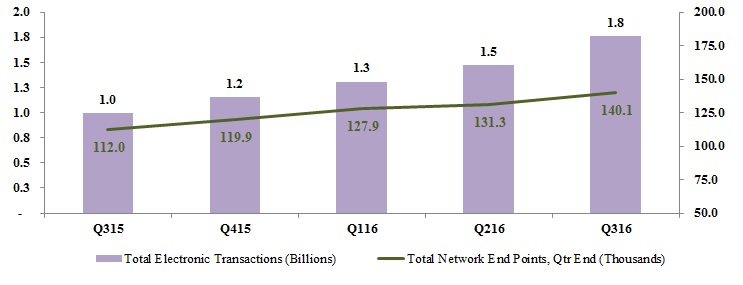
The continuum division continues to make progress in bringing the power of our network-enabled services to the hospital and health system market. Our awareness and momentum in the under 50 bed market expands with each new hospital client added to the network. We continue to sign new clients to our athenaOne for Hospitals and Health Systems service and remain on track to double the number of contracted hospital clients in 2016. We have also migrated the majority of the acquired base over to our athenaOne for Hospitals and Health Systems service and have continued to bring several net new health system clients live onto our network-enabled services. More importantly, we continue to leverage our open platform to drive outcomes and results for the under 50 bed hospital and health system market. Lost Rivers Medical Center, a 14-bed Critical Access Hospital located in Arco, Idaho, represents one of our early success stories in serving the small hospital market. Before going live with athenaCollector for Hospitals and Health Systems, the billing staff at Lost Rivers Medical Center spent a great deal of time submitting and tracking claims across multiple vendors. Today, Lost Rivers Medical Center enjoys a streamlined billing process, faster payments, and much more efficient use of staff time. More specifically, total cash flow at this hospital was 111.9% of baseline after Q1 2016.
Business Development Update
More Disruption Please (“MDP”)
Our MDP program’s mission is to create a true distribution platform that attracts and supports new generations of innovators and entrepreneurs and delivers innovative solutions that help our clients optimize their financial and operational performance. The MDP team remains focused on leveraging all three major components of this program - the network, the marketplace, and the accelerator - to identify opportunities in the market and seamlessly integrate innovative solutions that will benefit athenahealth, our clients, and the healthcare industry as a whole. As of the third quarter, we have grown the MDP Marketplace to 122 partners, 80 of which are generally available across 35 capabilities, and another 42 partners that are currently in pilot phase. As our network of partners grows, so does client interest and demand for the MDP Marketplace services. Client adoption has grown to 1,372 unique clients using an MDP solution, representing growth of 60% since year end. We are also leveraging our MDP Program to add the necessary capabilities to help us expand our reach across the broader continuum of care. As a result of these focused efforts, we are now featuring seven hospital and six telehealth partners on the MDP Marketplace. These hospital partners enable our clients to choose best of breed solutions to optimize their workflows, including telepharmacy services, radiology information systems/picture archiving communication systems (“RIS/PACS”), medical record requests, and more. On the telehealth front, the companies on the Marketplace span multiple use cases from scheduling video appointments to intelligent patient triage and response. In addition to expanding the depth and breadth of our MDP Marketplace, we are also investing in other early stage but innovative solutions through our MDP Accelerator. Since the
12
inception of this program, we have made investments in nine companies and have acquired two of them, Arsenal Health in Q1 2016 and Patient IO in Q3 2016. These acquisitions represent another important milestone for the MDP Accelerator as a mechanism for de-risking potential acquisition opportunities. In addition, they highlight the power of our build, buy, and partner strategy by helping us leverage our open platform and deliver the best value to our clients as quickly as possible. Our work with Patient IO has allowed us to deliver a key component of our growing Population Health services in an expedited fashion, first by partnering and then by bringing the Patient IO platform and expertise in house. To learn more about our MDP program and partnership opportunities and to explore the athenahealth MDP Marketplace, please visit www.athenahealth.com/disruption.
Client Base Discussion
The total number of physicians who have gone live on athenaCollector, our core service offering, is the metric we currently use to define our ambulatory client base and market share. However, as our client base expands outside the traditional ambulatory market, total active providers and eventually covered lives, total managed lives, and discharge bed days will become more appropriate metrics to use to define our network growth, client base, and market share.
During Q3 2016, 81% of all new athenaCollector deals included athenaClinicals, compared to 87% in Q3 2015. 79% of all new athenaCollector deals included athenaClinicals, athenaCommunicator, and athenaCoordinator. The athenaOne rate of 79% in Q3 2016 compares to 82% in Q3 2015. Among “live” (i.e., implemented and active) athenaCollector clients, adoption of athenaClinicals and athenaCommunicator continues to grow and resulted in continued growth to our installed base across all of our service offerings.
athenahealth Service Offering Adoption
(athenaCollector, athenaClinicals, and athenaCommunicator)
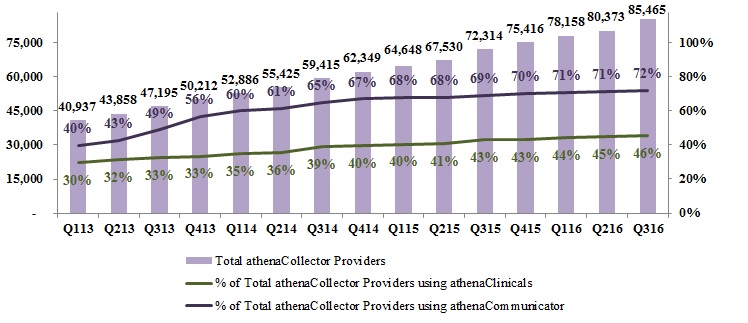
athenaCollector Clients
During Q3 2016, total active physicians on athenaCollector grew by 18% year-over-year, to 62,450. On a sequential basis, we added 3,829 net new active physicians on athenaCollector, versus 3,953 in Q3 2015. Our quarterly net new physician additions may vary widely due to the number and size of clients that go live in a particular quarter. Furthermore, our larger clients can be more complex and take longer to go live, particularly if our clients request a more phased implementation approach. Total active providers on athenaCollector grew by 18% year-over-year, to 85,465. On a sequential basis, we added 5,092 net new active providers on athenaCollector, versus 4,784 in Q3 2015.
13
athenaClinicals Clients
During Q3 2016, total active physicians live on athenaClinicals grew by 24% year-over-year, to 29,439. On a sequential basis, we added 2,090 net new active physicians on athenaClinicals, versus 2,818 in Q3 2015. On a sequential basis, we added 2,844 net new active providers on athenaClinicals, versus 3,430 in Q3 2015. Total active providers on athenaClinicals grew by 26% year-over-year, to 39,052. This equates to an overall adoption rate of 46% of total athenaCollector providers, up from 43% in Q3 2015. We expect the athenaClinicals client base to increase over time due to cross-selling within our existing base and growth in the volume of athenaOne deals.
athenaCommunicator Clients
During Q3 2016, total active physicians live on athenaCommunicator grew by 22% year-over-year, to 47,183. On a sequential basis, we added 3,416 net new active physicians on athenaCommunicator, versus 3,422 in Q3 2015. Total active providers on athenaCommunicator grew by 23% year-over-year, to 61,689. On a sequential basis, we added 4,478 net new providers on athenaCommunicator, versus 4,084 in Q3 2015. This equates to an overall adoption rate of 72% of total athenaCollector providers up from 69% in Q3 2015. We expect the athenaCommunicator client base to increase over time due to cross-selling within our existing base and growth in the volume of athenaOne deals.
Client Implementations
Below are the publicly disclosed clients that went live or partially live during Q3 2016:
• | NewYork-Presbyterian continued the phased rollout of our suite of services, athenaOne, and brought another wave live at NewYork-Presbyterian Medical Groups in Q3 2016. |
• | Adventist Health continued the phased rollout of our suite of services, athenaOne, and brought the second wave live in Q3 2016. |
• | Dignity Health continued the phased rollout of our Population Health service, with implementation of two additional service areas live in Q3 2016. |
Growth Discussion
The athenahealth marketing organization encompasses our growth and sales operations, event and partner marketing, inside sales agents, advertising, corporate communications, and product marketing teams. This organization executes in-market investments in an effort to generate new business opportunities for athenahealth. The athenahealth sales organization includes all quota-carrying sales representatives, as well as our sales team leaders, channel sales team, and sales training and development organization.
Our Access & Awareness team continues to arm our salesforce with service proof points and programs that distinguish our network-enabled services from traditional software. For example, in July 2016, we announced the industry’s first Merit-Based Incentive Payment System (“MIPS”) Guarantee. Our MIPS Guarantee continues a history of industry-leading guarantee programs we have offered for government-mandated quality reporting, including a 97% 2015 Meaningful Use attestation rate and 98.9% avoidance of Physician Quality Reporting System and Value Modifier penalties in 2016. Under our new MIPS Guarantee, new practices using our network-enabled athenaOne services are guaranteed to perform at or above the national performance threshold set by the Centers for Medicare and Medicaid Services and avoid payment penalties to their Medicare Part B fee schedule. This represents just one more example of how we are financially aligned with our clients and get paid by delivering results.
As of September 30, 2016, we have a total of 212 quota-carrying sales representatives, including hospital sales, up 28% from September 30, 2015. Our athenahealth-branded services sales force is currently divided into four groups: enterprise, which is dedicated to serving the largest managed care organizations, as well as those with high growth potential; group, which is dedicated to medical practices with seven to 150 physicians; small group, which is dedicated to medical practices with one to six physicians; and
14
hospital, which is dedicated to hospitals and hospital-owned clinics and medical groups with 50 beds or less.
15
Stock-Based Compensation Expense, Amortization of Purchased Intangible Assets, and Reconciliation of Non-GAAP Financial Measures
athenahealth, Inc.
STOCK-BASED COMPENSATION
(Unaudited, in thousands)
Set forth below is a breakout of stock-based compensation impacting the Condensed Consolidated Statements of Income for the three and nine months ended September 30, 2016, and 2015:
Three Months Ended September 30, | Nine Months Ended September 30, | ||||||||||||||
2016 | 2015 | 2016 | 2015 | ||||||||||||
Stock-based compensation charged to Condensed Consolidated Statements of Income: | |||||||||||||||
Direct operating | $ | 4,363 | $ | 3,584 | $ | 13,652 | $ | 10,883 | |||||||
Selling and marketing | 5,133 | 4,162 | 14,325 | 13,745 | |||||||||||
Research and development | 3,121 | 2,164 | 9,333 | 6,707 | |||||||||||
General and administrative | 4,514 | 5,070 | 13,366 | 16,608 | |||||||||||
Total stock-based compensation expense | 17,131 | 14,980 | 50,676 | 47,943 | |||||||||||
Amortization of capitalized stock-based compensation related to software development (1) | 1,283 | 1,244 | 3,813 | 3,013 | |||||||||||
Total | $ | 18,414 | $ | 16,224 | $ | 54,489 | $ | 50,956 | |||||||
(1) | In addition, for the three months ended September 30, 2016, and 2015, $0.9 million and $1.8 million, respectively, of stock-based compensation was capitalized in the line item Capitalized software costs, net in the Condensed Consolidated Balance Sheets for which $1.3 million and $1.2 million, respectively, of amortization was included in the line item Depreciation and amortization in the Condensed Consolidated Statements of Income. For the nine months ended September 30, 2016, and 2015, $2.1 million and $5.4 million, respectively, of stock-based compensation was capitalized in the line item Capitalized software costs, net in the Condensed Consolidated Balance Sheets for which $3.8 million and $3.0 million, respectively, of amortization was included in the line item Depreciation and amortization in the Condensed Consolidated Statements of Income. |
athenahealth, Inc.
AMORTIZATION OF PURCHASED INTANGIBLE ASSETS
(Unaudited, in thousands)
Set forth below is a breakout of amortization of purchased intangible assets impacting the Condensed Consolidated Statements of Income for the three and nine months ended September 30, 2016, and 2015:
Three Months Ended September 30, | Nine Months Ended September 30, | ||||||||||||||
Amortization of purchased intangible assets allocated to: | 2016 | 2015 | 2016 | 2015 | |||||||||||
Direct operating | $ | 1,991 | $ | 3,662 | $ | 7,063 | $ | 11,177 | |||||||
Selling and marketing | 2,959 | 2,373 | 8,784 | 7,119 | |||||||||||
Total amortization of purchased intangible assets | $ | 4,950 | $ | 6,035 | $ | 15,847 | $ | 18,296 | |||||||
16
athenahealth, Inc.
RECONCILIATION OF NON-GAAP FINANCIAL MEASURES
TO COMPARABLE GAAP MEASURES
(Unaudited, in thousands, except per share amounts)
The following is a reconciliation of the non-GAAP financial measures used by us to describe our financial results determined in accordance with accounting principles generally accepted in the United States of America (“GAAP”). An explanation of these measures is also included below under the heading “Explanation of Non-GAAP Financial Measures.”
While management believes that these non-GAAP financial measures provide useful supplemental information to investors regarding the underlying performance of our business operations, investors are reminded to consider these non-GAAP measures in addition to, and not as a substitute for, financial performance measures prepared in accordance with GAAP. In addition, it should be noted that these non-GAAP financial measures may be different from non-GAAP measures used by other companies, and management may utilize other measures to illustrate performance in the future. Non-GAAP measures have limitations in that they do not reflect all of the amounts associated with our results of operations as determined in accordance with GAAP.
Please note that these figures may not sum exactly due to rounding.
Non-GAAP Adjusted Gross Margin
Set forth below is a presentation of our “Non-GAAP Adjusted Gross Profit” and “Non-GAAP Adjusted Gross Margin,” which represents Non-GAAP Adjusted Gross Profit as a percentage of total revenue.
(unaudited, in thousands) | Three Months Ended | Nine Months Ended | |||||||||||||
September 30, | September 30, | ||||||||||||||
2016 | 2015 | 2016 | 2015 | ||||||||||||
Total revenue | $ | 276,671 | $ | 236,068 | $ | 794,759 | $ | 667,196 | |||||||
Direct operating expense | 103,238 | 94,850 | 312,518 | 269,306 | |||||||||||
Total revenue less direct operating expense | 173,433 | 141,218 | 482,241 | 397,890 | |||||||||||
Add: Stock-based compensation allocated to direct operating expense | 4,363 | 3,584 | 13,652 | 10,883 | |||||||||||
Add: Amortization of purchased intangible assets allocated to direct operating expense | 1,991 | 3,662 | 7,063 | 11,177 | |||||||||||
Add: Exit costs, including restructuring costs allocated to direct operating expense | 107 | — | 371 | — | |||||||||||
Non-GAAP Adjusted Gross Profit | $ | 179,894 | $ | 148,464 | $ | 503,327 | $ | 419,950 | |||||||
Non-GAAP Adjusted Gross Margin | 65.0 | % | 62.9 | % | 63.3 | % | 62.9 | % | |||||||
17
Non-GAAP Adjusted Operating Income
Set forth below is a reconciliation of our “Non-GAAP Adjusted Operating Income” and “Non-GAAP Adjusted Operating Income Margin,” which represents Non-GAAP Adjusted Operating Income as a percentage of total revenue.
(unaudited, in thousands) | Three Months Ended | Nine Months Ended | |||||||||||||
September 30, | September 30, | ||||||||||||||
2016 | 2015 | 2016 | 2015 | ||||||||||||
Total revenue | $ | 276,671 | $ | 236,068 | $ | 794,759 | $ | 667,196 | |||||||
GAAP net income | 13,941 | 5,795 | 11,193 | 6,312 | |||||||||||
Add: (Benefit from) provision for income taxes | (115 | ) | 3,365 | (1,730 | ) | 7,412 | |||||||||
Add: Total other expense (income) | 1,325 | (5,970 | ) | 4,746 | (24,523 | ) | |||||||||
GAAP operating income (loss) | $ | 15,151 | $ | 3,190 | $ | 14,209 | $ | (10,799 | ) | ||||||
GAAP operating margin (loss) | 5.5 | % | 1.4 | % | 1.8 | % | (1.6 | )% | |||||||
Add: Stock-based compensation expense | 17,131 | 14,980 | 50,676 | 47,943 | |||||||||||
Add: Amortization of capitalized stock-based compensation related to software development | 1,283 | 1,244 | 3,813 | 3,013 | |||||||||||
Add: Amortization of purchased intangible assets | 4,950 | 6,035 | 15,847 | 18,296 | |||||||||||
Add: Integration and transaction costs | 775 | — | 1,125 | 964 | |||||||||||
Add: Exit costs, including restructuring costs | 2,425 | — | 4,358 | 4,446 | |||||||||||
Less: Gain on investments, net | (243 | ) | — | (243 | ) | — | |||||||||
Non-GAAP Adjusted Operating Income | $ | 41,472 | $ | 25,449 | $ | 89,785 | $ | 63,863 | |||||||
Non-GAAP Adjusted Operating Income Margin | 15.0 | % | 10.8 | % | 11.3 | % | 9.6 | % | |||||||
18
Non-GAAP Adjusted Net Income
Set forth below is a reconciliation of our “Non-GAAP Adjusted Net Income” and “Non-GAAP Adjusted Net Income per Diluted Share.”
(unaudited, in thousands) | Three Months Ended | Nine Months Ended | |||||||||||||
September 30, | September 30, | ||||||||||||||
2016 | 2015 | 2016 | 2015 | ||||||||||||
GAAP net income | $ | 13,941 | $ | 5,795 | $ | 11,193 | $ | 6,312 | |||||||
Add: Stock-based compensation expense | 17,131 | 14,980 | 50,676 | 47,943 | |||||||||||
Add: Amortization of capitalized stock-based compensation related to software development | 1,283 | 1,244 | 3,813 | 3,013 | |||||||||||
Add: Amortization of purchased intangible assets | 4,950 | 6,035 | 15,847 | 18,296 | |||||||||||
Add: Integration and transaction costs | 775 | — | 1,125 | 964 | |||||||||||
Add: Exit costs, including restructuring costs | 2,425 | — | 4,358 | 4,446 | |||||||||||
Less: Gain on investments, net | (243 | ) | (7,585 | ) | (243 | ) | (28,656 | ) | |||||||
Sub-total of tax deductible items | 26,321 | 14,674 | 75,576 | 46,006 | |||||||||||
Less: Tax impact of tax deductible items (1) | (10,528 | ) | (5,870 | ) | (30,230 | ) | (18,402 | ) | |||||||
Less: Tax impact resulting from applying non-GAAP tax rate (2) | (5,646 | ) | (299 | ) | (5,516 | ) | 1,922 | ||||||||
Non-GAAP Adjusted Net Income | $ | 24,088 | $ | 14,300 | $ | 51,023 | $ | 35,838 | |||||||
Weighted average shares - diluted | 40,000 | 39,536 | 40,024 | 39,476 | |||||||||||
Non-GAAP Adjusted Net Income per Diluted Share | $ | 0.60 | $ | 0.36 | $ | 1.27 | $ | 0.91 | |||||||
(1) | Tax impact calculated using a statutory tax rate of 40%. |
(2) | Represents adjusting the GAAP net income to a non-GAAP tax rate of 40%. We used a non-GAAP tax rate of 40% to normalize the tax impact to our Non-GAAP Adjusted Net Income per Diluted Share based on the fact that a relatively small change in pre-tax GAAP income (loss) in any one period could result in a volatile GAAP effective tax rate. |
19
(unaudited, in thousands) | Three Months Ended | Nine Months Ended | |||||||||||||
September 30, | September 30, | ||||||||||||||
2016 | 2015 | 2016 | 2015 | ||||||||||||
GAAP net income per share - diluted | $ | 0.35 | $ | 0.15 | $ | 0.28 | $ | 0.16 | |||||||
Add: Stock-based compensation expense | 0.43 | 0.38 | 1.27 | 1.21 | |||||||||||
Add: Amortization of capitalized stock-based compensation related to software development | 0.03 | 0.03 | 0.10 | 0.08 | |||||||||||
Add: Amortization of purchased intangible assets | 0.12 | 0.15 | 0.40 | 0.46 | |||||||||||
Add: Integration and transaction costs | 0.02 | — | 0.03 | 0.02 | |||||||||||
Add: Exit costs, including restructuring costs | 0.06 | — | 0.11 | 0.11 | |||||||||||
Less: Gain on investments, net | (0.01 | ) | (0.19 | ) | (0.01 | ) | (0.73 | ) | |||||||
Sub-total of tax deductible items | 0.66 | 0.37 | 1.89 | 1.17 | |||||||||||
Less: Tax impact of tax deductible items (1) | (0.26 | ) | (0.15 | ) | (0.76 | ) | (0.47 | ) | |||||||
Add: Tax impact resulting from applying non-GAAP tax rate (2) | (0.14 | ) | (0.01 | ) | (0.14 | ) | 0.05 | ||||||||
Non-GAAP Adjusted Net Income per Diluted Share | $ | 0.60 | $ | 0.36 | $ | 1.27 | $ | 0.91 | |||||||
Weighted average shares - diluted | 40,000 | 39,536 | 40,024 | 39,476 | |||||||||||
(1) | Tax impact calculated using a statutory tax rate of 40%. |
(2) | Represents adjusting the GAAP net income to a non-GAAP tax rate of 40%. We used a non-GAAP tax rate of 40% to normalize the tax impact to our Non-GAAP Adjusted Net Income per Diluted Share based on the fact that a relatively small change in pre-tax GAAP income (loss) in any one period could result in a volatile GAAP effective tax rate. |
20
athenahealth, Inc.
RECONCILIATION OF NON-GAAP FINANCIAL MEASURES
TO COMPARABLE GAAP MEASURES FOR FISCAL YEAR 2016 GUIDANCE
(Unaudited, in millions, except per share amounts)
Please note that the figures presented below may not sum exactly due to rounding.
Non-GAAP Adjusted Gross Margin Guidance
Set forth below is a presentation of our “Non-GAAP Adjusted Gross Profit” and “Non-GAAP Adjusted Gross Margin” guidance for fiscal year 2016, which represents Non-GAAP Adjusted Gross Profit as a percentage of total revenue.
LOW | HIGH | |||||
Fiscal Year Ending December 31, 2016 | ||||||
Total revenue | $ | 1,085.0 | $ | 1,115.0 | ||
Direct operating expense | 423.4 | 423.2 | ||||
Total revenue less direct operating expense | $ | 661.6 | $ | 691.7 | ||
Add: Stock-based compensation expense | ||||||
allocated to direct operating expense | 19.0 | 19.0 | ||||
Add: Amortization of purchased intangible assets | ||||||
allocated to direct operating expense | 8.4 | 8.4 | ||||
Non-GAAP Adjusted Gross Profit | $ | 689.0 | $ | 719.2 | ||
Non-GAAP Adjusted Gross Margin | 63.5 | % | 64.5 | % | ||
Non-GAAP Adjusted Operating Income Guidance
Set forth below is a reconciliation of our “Non-GAAP Adjusted Operating Income” and “Non-GAAP Adjusted Operating Income Margin” guidance for fiscal year 2016, which represents Non-GAAP Adjusted Operating Income as a percentage of total revenue.
LOW | HIGH | |||||
Fiscal Year Ending December 31, 2016 | ||||||
Total revenue | $ | 1,085.0 | $ | 1,115.0 | ||
GAAP net income | 10.8 | 19.5 | ||||
Add: Provision for income taxes | 7.6 | 12.9 | ||||
Add: Total other expense | 5.3 | 6.4 | ||||
GAAP operating income | $ | 23.7 | $ | 38.8 | ||
GAAP operating income margin | 2.2 | % | 3.5 | % | ||
Add: Stock-based compensation expense | 69.4 | 69.4 | ||||
Add: Amortization of capitalized stock-based compensation related to software development | 6.8 | 6.8 | ||||
Add: Amortization of purchased intangible assets | 20.0 | 20.0 | ||||
Non-GAAP Adjusted Operating Income | $ | 120.0 | $ | 135.0 | ||
Non-GAAP Adjusted Operating Income Margin | 11.1 | % | 12.1 | % | ||
21
Non-GAAP Adjusted Net Income Guidance
Set forth below is a reconciliation of our “Non-GAAP Adjusted Net Income” and “Non-GAAP Adjusted Net Income per Diluted Share” guidance for fiscal year 2016.
LOW | HIGH | |||||
Fiscal Year Ending December 31, 2016 | ||||||
GAAP net income | $ | 10.8 | $ | 19.5 | ||
Add: Stock-based compensation expense | 69.4 | 69.4 | ||||
Add: Amortization of capitalized stock-based compensation related to software development | 6.8 | 6.8 | ||||
Add: Amortization of purchased intangible assets | 20.0 | 20.0 | ||||
Sub-total of tax deductible items | $ | 96.2 | $ | 96.2 | ||
(Less): Tax impact of tax deductible items (1) | (38.5 | ) | (38.5 | ) | ||
Add: Tax impact resulting from applying a normalized non-GAAP tax rate (2) | 0.2 | (0.1 | ) | |||
Non-GAAP Adjusted Net Income | $ | 68.8 | $ | 77.2 | ||
Weighted average shares - diluted | 41.7 | 41.7 | ||||
Non-GAAP Adjusted Net Income per Diluted Share | $ | 1.65 | $ | 1.85 | ||
(1) | Tax impact calculated using a statutory tax rate of 40%. |
(2) | Represents adjusting the GAAP net income to a non-GAAP tax rate of 40%. For 2016, we are using a non-GAAP tax rate of 40% to normalize the tax impact to our Non-GAAP Adjusted Net Income per Diluted Share based on the fact that a relatively small change in pre-tax GAAP income (loss) in any one period could result in a volatile GAAP effective tax rate. |
LOW | HIGH | |||||
Fiscal Year Ending December 31, 2016 | ||||||
GAAP net income per share - diluted | $ | 0.26 | $ | 0.47 | ||
Add: Stock-based compensation expense | 1.66 | 1.66 | ||||
Add: Amortization of capitalized stock-based compensation related to software development | 0.16 | 0.16 | ||||
Add: Amortization of purchased intangible assets | 0.48 | 0.48 | ||||
Sub-total of tax deductible items | $ | 2.31 | $ | 2.31 | ||
(Less): Tax impact of tax deductible items (1) | (0.92 | ) | (0.92 | ) | ||
Add: Tax impact resulting from applying a normalized non-GAAP tax rate (2) | 0.01 | — | ||||
Non-GAAP Adjusted Net Income per Diluted Share | $ | 1.65 | $ | 1.85 | ||
Weighted average shares - diluted | 41.7 | 41.7 | ||||
(1) | Tax impact calculated using a statutory tax rate of 40%. |
(2) | Represents adjusting the GAAP net income to a non-GAAP tax rate of 40%. For 2016, we are using a non-GAAP tax rate of 40% to normalize the tax impact to our Non-GAAP Adjusted Net Income per Diluted Share based on the fact that a relatively small change in pre-tax GAAP income (loss) in any one period could result in a volatile GAAP effective tax rate. |
22
Explanation of Non-GAAP Financial Measures
We report our financial results in accordance with accounting principles generally accepted in the United States of America, or GAAP. However, management believes that, in order to properly understand our short-term and long-term financial and operational trends, investors may wish to consider the impact of certain non-cash or non-recurring items, when used as a supplement to financial performance measures in accordance with GAAP. These items result from facts and circumstances that vary in frequency and impact on continuing operations. Management also uses results of operations before such items to evaluate the operating performance of athenahealth and compare it against past periods, make operating decisions, and serve as a basis for strategic planning. These non-GAAP financial measures provide management with additional means to understand and evaluate the operating results and trends in our ongoing business by eliminating certain non-cash expenses and other items that management believes might otherwise make comparisons of our ongoing business with prior periods more difficult, obscure trends in ongoing operations, or reduce management’s ability to make useful forecasts. Management believes that these non-GAAP financial measures provide additional means of evaluating period-over-period operating performance. In addition, management understands that some investors and financial analysts find this information helpful in analyzing our financial and operational performance and comparing this performance to our peers and competitors.
Management defines “Non-GAAP Adjusted Gross Profit” as total revenue, less direct operating expense, plus (1) stock-based compensation expense allocated to direct operating expense, (2) amortization of purchased intangible assets allocated to direct operating expense, and (3) exit costs, including restructuring costs allocated to direct operating expense, and “Non-GAAP Adjusted Gross Margin” as Non-GAAP Adjusted Gross Profit as a percentage of total revenue. Management considers these non-GAAP financial measures to be important indicators of our operational strength and performance of our business and a good measure of our historical operating trends. Moreover, management believes that these measures enable investors and financial analysts to closely monitor and understand changes in our ability to generate income from ongoing business operations.
Management defines “Non-GAAP Adjusted Operating Income” as the sum of GAAP net income before (benefit from) provision for income taxes; total other expense (income); stock-based compensation expense; amortization of capitalized stock-based compensation related to software development; amortization of purchased intangible assets; integration and transaction costs; exit costs, including restructuring costs; and gain or loss on investments; and “Non-GAAP Adjusted Operating Income Margin” as Non-GAAP Adjusted Operating Income as a percentage of total revenue. Management defines “Non-GAAP Adjusted Net Income” as the sum of GAAP net income before stock-based compensation expense; amortization of capitalized stock-based compensation related to software development; amortization of purchased intangible assets; integration and transaction costs; exit costs, including restructuring costs; and gain or loss on investments and any tax impact related to these preceding items; and an adjustment to the tax provision for the non-GAAP tax rate and “Non-GAAP Adjusted Net Income per Diluted Share” as Non-GAAP Adjusted Net Income divided by weighted average diluted shares outstanding. Management considers all of these non-GAAP financial measures to be important indicators of our operational strength and performance of our business and a good measure of our historical operating trends, in particular the extent to which ongoing operations impact our overall financial performance.
Management excludes or adjusts each of the items identified below from the applicable non-GAAP financial measure referenced above for the reasons set forth with respect to that excluded item:
• | Stock-based compensation expense and amortization of capitalized stock-based compensation related to software development — excluded because these are non-cash expenditures that |
23
management does not consider part of ongoing operating results when assessing the performance of our business, and also because the total amount of the expenditure is partially outside of our control because it is based on factors such as stock price, volatility, and interest rates, which may be unrelated to our performance during the period in which the expenses are incurred.
• | Amortization of purchased intangible assets — purchased intangible assets are amortized over their estimated useful lives and generally cannot be changed or influenced by management after the acquisition. Accordingly, this item is not considered by management in making operating decisions. Management does not believe such charges accurately reflect the performance of our ongoing operations for the period in which such charges are incurred. |
• | Integration and transaction costs — Integration costs are the severance payments and retention bonuses for certain employees related to specific transactions. Transaction costs are costs related to strategic transactions. Accordingly, management believes that such expenses do not have a direct correlation to future business operations, and therefore, these costs are not considered by management in making operating decisions. Management does not believe such charges accurately reflect the performance of our ongoing operations for the period in which such charges are incurred. |
• | Exit costs, including restructuring costs — represents costs related to workforce reductions and to terminate certain lease or other contract agreements for strategic realignment purposes. Management does not believe such costs accurately reflect the performance of our ongoing operations for the period in which such costs are incurred. |
• | Gain or loss on investments — represents gain on sale of marketable securities, gain on sale of More Disruption Please (“MDP”) Accelerator investments, and loss on impairment of MDP Accelerator investments. Management does not believe such gains or losses accurately reflect the performance of our ongoing operations for the period in which such gains or losses are reported. |
• | Non-GAAP tax rate — We use a non-GAAP tax rate of 40% to normalize the tax impact to our Non-GAAP Adjusted Net Income per Diluted Share based on the fact that a relatively small change in pre-tax GAAP income (loss) in any one period could result in a volatile GAAP effective tax rate. |
24
Supplemental Metrics and Definitions
Fiscal Year 2015 | Fiscal Year 2016 | ||||||||||||||||
Q1 | Q2 | Q3 | Q4 | Q1 | Q2 | Q3 | |||||||||||
Client Base | |||||||||||||||||
Total Physicians on athenaCollector | 47,062 | 49,176 | 53,129 | 55,277 | 57,093 | 58,621 | 62,450 | ||||||||||
Total Providers on athenaCollector | 64,648 | 67,530 | 72,314 | 75,416 | 78,158 | 80,373 | 85,465 | ||||||||||
Total Physicians on athenaClinicals | 19,796 | 20,923 | 23,741 | 24,867 | 26,169 | 27,349 | 29,439 | ||||||||||
Total Providers on athenaClinicals | 26,166 | 27,641 | 31,071 | 32,684 | 34,576 | 36,208 | 39,052 | ||||||||||
Total Physicians on athenaCommunicator | 33,578 | 35,248 | 38,670 | 40,635 | 42,278 | 43,767 | 47,183 | ||||||||||
Total Providers on athenaCommunicator | 43,770 | 45,902 | 49,986 | 52,821 | 55,244 | 57,211 | 61,689 | ||||||||||
Client Performance | |||||||||||||||||
Net Promoter Score | 42.3 | 40.5 | 39.9 | 40.3 | 34.0 | 29.3 | 20.2 | ||||||||||
Client Days in Accounts Receivable (“DAR”) | 41.1 | 40.8 | 40.7 | 40.1 | 41.3 | 40.6 | 41.5 | ||||||||||
First Pass Resolution (“FPR”) Rate | 93.7 | % | 94 | % | 93.8 | % | 94 | % | 94.2 | % | 94.7 | % | 94.5 | % | |||
Electronic Remittance Advice (“ERA”) Rate | 83.2 | % | 82.9 | % | 82.3 | % | 84.2 | % | 83.8 | % | 84.9 | % | 84.5 | % | |||
Total Claims Submitted | 32,809,734 | 35,002,061 | 35,826,192 | 40,191,950 | 41,246,696 | 42,261,855 | 42,611,244 | ||||||||||
Total Client Collections ($) | 4,110,989,781 | 4,633,427,941 | 4,803,761,899 | 5,281,307,644 | 5,203,424,281 | 5,563,351,503 | 5,714,549,558 | ||||||||||
Total Working Days | 61 | 64 | 64 | 62 | 62 | 64 | 64 | ||||||||||
Employees | |||||||||||||||||
Direct | 1,914 | 2,123 | 2,285 | 2,296 | 2,310 | 2,481 | 2,653 | ||||||||||
Selling & Marketing | 602 | 649 | 666 | 668 | 652 | 727 | 762 | ||||||||||
Research & Development | 1,010 | 1,172 | 1,262 | 1,280 | 1,355 | 1,336 | 1,406 | ||||||||||
General & Administrative | 351 | 380 | 407 | 424 | 435 | 446 | 446 | ||||||||||
Total Employees | 3,877 | 4,324 | 4,619 | 4,668 | 4,752 | 4,990 | 5,267 | ||||||||||
Quota Carrying Sales Force | |||||||||||||||||
Total Quota Carrying Sales Representatives | 150 | 151 | 161 | 163 | 170 | 204 | 212 | ||||||||||
Supplemental Metrics Definitions | |
Client Base | |
Total Physicians on athenaCollector | The number of physicians that have rendered a service which generated a medical claim that was billed during the last 91 days on the athenaCollector platform. Examples of physicians include Medical Doctors and Doctors of Osteopathic Medicine. |
Total Providers on athenaCollector | The number of providers, including physicians, that have rendered a service which generated a medical claim that was billed during the last 91 days on the athenaCollector platform. Examples of non-physician providers are Nurse Practitioners and Registered Nurses. |
Total Physicians on athenaClinicals | The number of physicians that have rendered a service through the athenaClinicals platform which generated a medical claim that was billed during the last 91 days on the athenaCollector platform. |
Total Providers on athenaClinicals | The number of providers, including physicians, that have rendered a service through the athenaClinicals platform which generated a medical claim that was billed during the last 91 days on the athenaCollector platform. |
Total Physicians on athenaCommunicator | The number of physicians that have rendered a service which generated a medical claim that was billed during the last 91 days on the athenaCollector platform and whose practice is actively using athenaCommunicator. |
Total Providers on athenaCommunicator | The number of providers, including physicians, that have rendered a service which generated a medical claim that was billed during the last 91 days on the athenaCollector platform and whose practice is actively using athenaCommunicator. |
Client Performance | |
Net Promoter Score | The percentage of clients who chose 9 or 10 (defined as promoters) less the percentage of clients who chose 0 through 6 (defined as detractors) on a scale of 1 to 10 when asked if they would recommend athenahealth to a trusted friend or colleague. These responses are generated from a "client listening" survey that the Company conducts for its client base twice per year. |
Client Days in Accounts Receivable (“DAR”) | The average number of days that it takes outstanding balances on claims to be resolved, e.g. paid, for clients on athenaCollector. Clients that have been live less than 90 days are excluded, as well as clients who are terminating services. |
First Pass Resolution (“FPR”) Rate | Approximates the percentage of primary claims that are favorably adjudicated and closed after a single submission during the period. Currently, the FPR rate is calculated on a monthly basis, and certain practices are excluded (e.g. those that have been live for less than 90 days). |
Electronic Remittance Advice (“ERA”) Rate | Remittance refers to the information about payments (a/k/a explanations of benefits) received from insurance companies during the period. The ERA rate reflects the percentage of total charges that were posted using electronic remittance. |
Total Claims Submitted | The number of claims billed through athenaNet during the period. |
Total Client Collections | The dollar value of collections posted on behalf of clients during the period. |
Total Working Days | The total number of days during the quarter minus weekends and U.S. Post Office holidays. |
Employees | |
Direct | The total number of full time equivalent individuals (“FTEs”) employed by athenahealth to support its service operations as of quarter end. This team includes production systems, enrollment services, paper claim submission, claim resolution, clinical operations, professional services, account management, and client services. |
Selling & Marketing | The total number of FTEs employed by athenahealth to support its sales and marketing efforts as of quarter end. This team includes sales representatives, business development staff and the marketing team. |
Research & Development | The total number of FTEs employed by athenahealth to support its research and development efforts as of quarter end. This team includes product development and product management. |
General & Administrative | The total number of FTEs employed by athenahealth to support its general and administrative functions as of quarter end. This team includes finance, human resources, compliance, learning and development, internal audit, corporate technology, recruiting, facilities, and legal. |
Total Employees | The total number of FTEs employed by athenahealth as of quarter end. This number excludes interns and seasonal employees. |
Total Quota Carrying Sales Representatives | The total number of athenahealth-branded services sales representatives who carry quota for net new annual recurring revenue as of quarter end. |
Corporate Scorecard Metrics Definitions | |
Stability | |
Voluntary Turnover | The number of voluntary terminations within a quarter divided by the average of the starting headcount and ending headcount for the quarter. Voluntary turnover excludes employees on action plans or employees on counseling out plans. |
Employee Engagement | Quarterly engagement survey results for employees.. Employee engagement results are reported in Q2 and Q4 only. |
Performance | |
athenaCollector Composite | athenaCollector Composite consists of Days in Accounts Receivable (the average number of days that it takes outstanding balances on claims to be resolved), Client Collection Rate (the percentage of charges that are not written off), and Time of Service Collection Rate (the percentage of patient responsibility collected at the time of service in the office). |
athenaClinicals Composite | athenaClinicals Composite consists of PQRS Success (the percent of providers who avoid the Value Modifier penalty based on PQRS performance), Days Documents Open (days of work in the Clinicals inbox), and After Hours Physician Documentation (the percentage of physician encounter documentation that happens after clinical hours). |
athenaCommunicator Composite | athenaCommunicator Composite consists of Portal Adoption Rate (the percentage of patients who have registered for the portal), Portal Engagement Rate (the percentage of patients who logged into the portal within 30 days before or after their appointments), and Annual Visit Rate (the percentage of patients contacted by a well-visit campaign who ultimately scheduled an appointment with the practice). |
athenaCoordinator Composite | athenaCoordinator Composite consists of Coordinator Exchange Rate (the percentage of document exchanges, both inbound and outbound, sent electronically) and Coordinated Patient Rate (the percentage of time that key patient information, for both inbound and outbound transitions of care, is available at the next point of care). |
Epocrates Composite | Epocrates Composite consists of 90 Day Active Physician Engagement (the percentage Epocrates physicians active on the mobile app or website in 9 of the 12 weeks in each quarter). |
Satisfaction | |
Net Promoter Score | Survey respondents from athenaOne survey (sample includes all clients live, surveyed on a bi-annual basis) are categorized as detractors (0-6 score for "likelihood to recommend"), passives (7-8), and promoters (9-10). The Net Promoter Score is calculated by subtracting the % of detractors from the % of promoters. |
Financial | |
Bookings | The annualized value of deals sold. |
Non-GAAP Adjusted Operating Income | Total non-GAAP adjusted operating income. |
Serious News for Serious Traders! Try StreetInsider.com Premium Free!
You May Also Be Interested In
- ROSEN, A LEADING LAW FIRM, Encourages Barclays PLC Investors to Secure Counsel Before Important Deadline in Securities Class Action – VXX
- Quorum Announces Q4 and Year End 2023 Results
- Invitae Enters into Agreement with Labcorp for Sale of Business
Create E-mail Alert Related Categories
SEC FilingsSign up for StreetInsider Free!
Receive full access to all new and archived articles, unlimited portfolio tracking, e-mail alerts, custom newswires and RSS feeds - and more!
