

Form 8-K ATHENAHEALTH INC For: Feb 04
 Tweet
Tweet Share
ShareUNITED STATES
SECURITIES AND EXCHANGE COMMISSION
SECURITIES AND EXCHANGE COMMISSION
Washington, D.C. 20549
FORM 8-K
CURRENT REPORT
Pursuant to Section 13 OR 15(d) of The Securities Exchange Act of 1934
Date of Report (Date of earliest event reported) February 4, 2016
athenahealth, Inc.
(Exact name of registrant as specified in its charter)
Delaware | 001-33689 | 04-3387530 | ||
(State or other jurisdiction of incorporation) | (Commission File Number) | (IRS Employer Identification No.) | ||
311 Arsenal Street, Watertown, MA | 02472 | |||
(Address of principal executive offices) | (Zip Code) | |||
Registrant’s telephone number, including area code: 617-402-1000
________________________________________________________________________________
(Former name or former address, if changed since last report.)
(Former name or former address, if changed since last report.)
Check the appropriate box below if the Form 8-K filing is intended to simultaneously satisfy the filing obligation of the registrant under any of the following provisions: | ||
[ ] | Written communications pursuant to Rule 425 under the Securities Act (17 CFR 230.425) | |
[ ] | Soliciting material pursuant to Rule 14a-12 under the Exchange Act (17 CFR 240.14a-12) | |
[ ] | Pre-commencement communications pursuant to Rule 14d-2(b) under the Exchange Act (17 CFR 240.14d-2(b)) | |
[ ] | Pre-commencement communications pursuant to Rule 13e-4(c) under the Exchange Act (17 CFR 240.13e-4(c)) | |
Item 2.02 | Results of Operations and Financial Condition. |
On February 4, 2016, athenahealth, Inc. issued a press release regarding its financial and operational results for the fourth quarter of 2015 and fiscal year ended December 31, 2015. athenahealth, Inc. also posted prepared remarks with respect to its fourth quarter and annual results on the Investors section of its website at www.athenahealth.com. Copies of the press release and prepared remarks are furnished herewith as Exhibit 99.1 and Exhibit 99.2, respectively, and are incorporated herein by reference.
The information included in this Current Report on Form 8-K pursuant to Item 2.02, including Exhibit 99.1 and Exhibit 99.2 attached hereto, is intended to be furnished and shall not be deemed “filed” for purposes of Section 18 of the Securities Exchange Act of 1934 or otherwise subject to the liabilities of that section, nor shall it be deemed incorporated by reference in any filing under the Securities Act of 1933 or the Securities Exchange Act of 1934, except as expressly set forth by specific reference in such filing.
Item 9.01 Financial Statements and Exhibits.
(d) Exhibits.
Exhibit No. | Description | |
99.1 | Press release issued by athenahealth, Inc. on February 4, 2016, furnished herewith. | |
99.2 | Prepared remarks dated as of February 4, 2016, furnished herewith. | |
SIGNATURES
Pursuant to the requirements of the Securities Exchange Act of 1934, the registrant has duly caused this report to be signed on its behalf by the undersigned hereunto duly authorized.
athenahealth, Inc. | ||
(Registrant) | ||
February 4, 2016 | /s/ KRISTI A. MATUS | |
Kristi A. Matus | ||
Executive Vice President and Chief Financial & Administrative Officer | ||
EXHIBIT INDEX
Exhibit No. | Description | |
99.1 | Press release issued by athenahealth, Inc. on February 4, 2016, furnished herewith. | |
99.2 | Prepared remarks dated as of February 4, 2016, furnished herewith. | |

athenahealth, Inc. Reports Fourth Quarter and Full Year 2015 Results
Q4 2015 Financial Results
• | 21% Revenue Growth Over Fourth Quarter of 2014 |
• | Non-GAAP Adjusted Operating Income of $31.3 million |
• | GAAP Net Income of $7.7 million, or $0.19 Per Diluted Share |
• | Non-GAAP Adjusted Net Income of $17.8 million, or $0.45 Per Diluted Share |
Full Year 2015 Financial Results
• | 23% Revenue Growth Over Full Year 2014 |
• | Non-GAAP Adjusted Operating Income of $95.1 million |
• | GAAP Net Income of $14.0 million, or $0.35 Per Diluted Share |
• | Non-GAAP Adjusted Net Income of $53.7 million, or $1.35 Per Diluted Share |
WATERTOWN, MA – February 4, 2016 - athenahealth, Inc. (NASDAQ: ATHN) (“athenahealth” or “we”), a leading provider of cloud-based services and mobile applications for medical groups and health systems, today announced financial and operational results for the fourth quarter and full year 2015. We will conduct a conference call tomorrow, Friday, February 5, 2016, at 8:00 a.m. Eastern Time to discuss these results and management’s outlook for future financial and operational performance.
• | Grew net new active physicians on athenaCollector® (2,148 physicians added), athenaClinicals® (1,126 physicians added), and athenaCommunicator® (1,965 physicians added) for the three months ended December 31, 2015, compared to athenaCollector (2,317 physicians added), athenaClinicals (1,353 physicians added), and athenaCommunicator (2,480 physicians added) in the same period last year. |
• | Grew net new active physicians on athenaCollector (9,854 physicians added), athenaClinicals (6,056 physicians added), and athenaCommunicator (8,472 physicians added) for the twelve months ended December 31, 2015, compared to athenaCollector (9,565 physicians added), athenaClinicals (6,423 physicians added), and athenaCommunicator (10,647 physicians added) in the same period last year. |
• | Total revenue for the three months ended December 31, 2015, was $257.5 million, compared to $213.2 million in the same period last year, an increase of 21%. |
◦ | Revenue from athenahealth-branded services was $237.8 million, an increase of 21% over $195.9 million for the three months ended December 31, 2014. |
• | Total revenue for full year 2015 was $924.7 million, compared to full year 2014 revenue of $752.6 million, an increase of 23%. |
◦ | Revenue from athenahealth-branded services was $856.8 million, an increase of 24% over $690.0 million for the twelve months ended December 31, 2014. |
1
“Our network has grown to serve more than 75,000 providers, 38 million patients, and 98,000 information trading partners. Notably, our network has touched over 74 million patients over the years. Its inherent shared knowledge backed by our highly-efficient back-office services helps keep our clients profitable and agile in the face of industry change,” said Jonathan Bush, chairman and chief executive officer of athenahealth. “As our market reach grows to more fully serve the care continuum, so will the intelligence and value of the network for all care organizations who are on it.”
• | For the three months ended December 31, 2015, Non-GAAP Adjusted Gross Margin was 65.0%, compared to 67.1% in the same period last year. |
• | For the three months ended December 31, 2015, Non-GAAP Adjusted Operating Income was $31.3 million, or 12.1% of total revenue, compared to Non-GAAP Adjusted Operating Income of $38.5 million, or 18.0% of total revenue, in the same period last year. |
• | For the three months ended December 31, 2015, GAAP Net Income was $7.7 million, or $0.19 per diluted share, compared to $8.7 million, or $0.22 per diluted share, in the same period last year. |
• | For the three months ended December 31, 2015, Non-GAAP Adjusted Net Income was $17.8 million, or $0.45 per diluted share, compared to $22.5 million, or $0.58 per diluted share, in the same period last year. |
• | For the year ended December 31, 2015, Non-GAAP Adjusted Gross Margin was 63.5%, compared to 63.0% for the year ended December 31, 2014. |
• | For the year ended December 31, 2015, Non-GAAP Adjusted Operating Income was $95.1 million, or 10.3% of total revenue, compared to Non-GAAP Adjusted Operating Income of $87.3 million, or 11.6% of total revenue, for the year ended December 31, 2014. |
• | For the year ended December 31, 2015, GAAP Net Income was $14.0 million, or $0.35 per diluted share, compared to GAAP Net Loss of $3.1 million, or loss of $0.08 per diluted share, for the year ended December 31, 2014. |
• | For the year ended December 31, 2015, Non-GAAP Adjusted Net Income was $53.7 million, or $1.35 per diluted share, compared to $49.5 million, or $1.31 per diluted share, for the year ended December 31, 2014. |
“In 2015, we grew athenahealth-branded bookings by over 30 percent, onboarded a record 13,067 providers onto our network, and improved the efficiency and effectiveness of our service offerings,” said Kristi Matus, chief financial & administrative officer of athenahealth. “We are focused on disrupting the status quo in health care and driving the growth of our network, while maintaining a keen eye on delivering high value to our clients. athenahealth is a constantly invigorated, forward-focused growth company. Our over 4,600 athenistas look forward to delivering great progress in 2016 as we continue to build the information backbone to help health care work as it should.”
Our fiscal year 2016 guidance communicated on December 10, 2015 at our 8th Annual Investor Summit is summarized in the following table below:
2
For the Fiscal Year Ending December 31, 2016 | |
Forward-Looking Guidance | |
GAAP Total Revenue | $1,085 - $1,115 million |
Non-GAAP Adjusted Gross Margin | 63.5% - 64.5% |
Non-GAAP Adjusted Operating Income | $120 - $135 million |
Non-GAAP Adjusted Net Income per Diluted Share | $1.65 - $1.85 |
Non-GAAP Tax Rate | 40% |
Use of Non-GAAP Financial Measures
In our earnings releases, prepared remarks, conference calls, slide presentations, and webcasts, we may use or discuss non-GAAP financial measures, as defined by Regulation G. The GAAP financial measure most directly comparable to each non-GAAP financial measure used or discussed, and a reconciliation of the differences between each non-GAAP financial measure and the comparable GAAP financial measure, are included in this press release after the condensed consolidated financial statements. Our earnings press releases containing such non-GAAP reconciliations can be found in the Investors section of our website at www.athenahealth.com.
Conference Call Information
To participate in our live conference call and webcast, please dial 877-853-5645 (or 408-940-3868 for international calls) using conference code no. 20802771, or visit the Investors section of our website at www.athenahealth.com. A replay will be available for one week following the conference call at 855-859-2056 (and 404-537-3406 for international calls) using conference code no. 20802771. A webcast replay will also be archived on our website.
About athenahealth, Inc.
athenahealth is a leading provider of cloud-based services for electronic health records (EHR), revenue cycle management and medical billing, patient engagement, care coordination, and population health management, as well as Epocrates and other point-of-care mobile apps. We connect care and drive meaningful, measurable results for more than 75,000 health care providers in medical practices and health systems nationwide. For more information, please visit www.athenahealth.com.
Forward-Looking Statements
This press release contains forward-looking statements, which are made pursuant to the safe harbor provisions of the Private Securities Litigation Reform Act of 1995, including statements reflecting management’s expectations for future financial and operational performance and operating expenditures, expected growth, and business outlook, including fiscal year 2016 guidance; statements regarding the growth of our market reach and the value of our service offerings; and statements found under our “Reconciliation of Non-GAAP Financial Measures to Comparable GAAP Measures” and “Reconciliation of Non-GAAP Financial Measures to Comparable GAAP Measures for Fiscal Year 2016 Guidance” sections of this release. The forward-looking statements in this release do not constitute guarantees of future performance. These statements are neither promises nor guarantees, and are subject to a variety of risks and uncertainties, many of which are beyond our control, which could cause actual results to differ materially from those contemplated in these forward-looking statements. In particular, the risks and uncertainties include, among other things: the development of the market for cloud-based services for health care information technology; our ability to innovate and to grow our market share; our ability to
3
manage growth; risks related to international operations; our variable sales and implementation cycles, which may result in fluctuations in our quarterly results; risks associated with the acquisition and integration of companies and new technologies to achieve expected synergies, including those related to our ability to successfully integrate the services, offerings, and technologies of Epocrates, RazorInsights, and webOMR and realize the expected benefits; risks associated with our ability to realize the expected benefits from the purchase of the Arsenal on the Charles campus in Watertown, Massachusetts; risks associated with our expectations regarding our ability to maintain profitability; the impact of increased research and development and sales and marketing expenditures, including whether increased expansion in revenues is attained and whether impact on margins and profitability is longer term than expected; changes in tax rates or exposure to additional tax liabilities; the highly competitive industry in which we operate and the relative immaturity of the market for our service offerings; our reliance on our systems, Internet infrastructure and other third parties’ systems, and the risks of a breach, interruption or failure in those systems; and the evolving and complex governmental and regulatory compliance environment in which we and our clients operate. Forward-looking statements may often be identified with words such as “we expect,” “we anticipate,” “upcoming,” “aim,” or similar indications of future expectations. These statements are neither promises nor guarantees, and are subject to a variety of risks and uncertainties, many of which are beyond our control, which could cause actual results to differ materially from those contemplated in these forward-looking statements. Existing and prospective investors are cautioned not to place undue reliance on these forward-looking statements, which speak only as of the date hereof. Except as required by law, we undertake no obligation to update or revise the information contained in this press release, whether as a result of new information, future events or circumstances, or otherwise. For additional disclosure regarding these and other risks faced by us, please see the disclosures contained in our public filings with the Securities and Exchange Commission (“SEC”), available on the Investors section of our website at www.athenahealth.com and on the SEC’s website at www.sec.gov.
Contact Info:
Dana Quattrochi
athenahealth, Inc. (Investors)
(617) 402-1329
Holly Spring
athenahealth, Inc. (Media)
(617) 402-1631
4
athenahealth, Inc.
CONSOLIDATED BALANCE SHEETS
(Unaudited, in thousands, except per share amounts)
December 31, 2015 | December 31, 2014 | |||||||
Assets | ||||||||
Current assets: | ||||||||
Cash and cash equivalents | $ | 141,927 | $ | 73,787 | ||||
Marketable securities | — | 40,950 | ||||||
Accounts receivable, net | 148,157 | 121,710 | ||||||
Prepaid expenses and other current assets | 30,176 | 22,177 | ||||||
Total current assets | 320,260 | 258,624 | ||||||
Property and equipment, net | 321,524 | 271,552 | ||||||
Capitalized software costs, net | 107,517 | 56,574 | ||||||
Purchased intangible assets, net | 126,239 | 139,422 | ||||||
Goodwill | 229,157 | 198,049 | ||||||
Investments and other assets | 13,965 | 6,399 | ||||||
Total assets | $ | 1,118,662 | $ | 930,620 | ||||
Liabilities & Stockholders’ Equity | ||||||||
Current liabilities: | ||||||||
Accounts payable | $ | 10,768 | $ | 9,410 | ||||
Accrued compensation | 88,122 | 71,768 | ||||||
Accrued expenses | 51,452 | 37,033 | ||||||
Line of credit | — | 35,000 | ||||||
Long-term debt | 10,762 | 14,550 | ||||||
Deferred revenue | 32,593 | 28,949 | ||||||
Deferred tax liability, net | — | 8,449 | ||||||
Total current liabilities | 193,697 | 205,159 | ||||||
Deferred rent, net of current portion | 31,118 | 19,412 | ||||||
Long-term debt, net of current portion | 287,353 | 157,822 | ||||||
Deferred revenue, net of current portion | 55,946 | 54,473 | ||||||
Long-term deferred tax liability, net | 1,254 | 10,417 | ||||||
Other long-term liabilities | 5,988 | 8,214 | ||||||
Total liabilities | 575,356 | 455,497 | ||||||
Stockholders’ equity: | ||||||||
Preferred stock, $0.01 par value: 5,000 shares authorized; no shares issued and outstanding at December 31, 2015 and December 31, 2014, respectively | — | — | ||||||
Common stock, $0.01 par value: 125,000 shares authorized; 40,209 shares issued and 38,931 shares outstanding at December 31, 2015; 39,402 shares issued and 38,124 shares outstanding at December 31, 2014 | 403 | 395 | ||||||
Additional paid-in capital | 522,443 | 443,259 | ||||||
Treasury stock, at cost, 1,278 shares | (1,200 | ) | (1,200 | ) | ||||
Accumulated other comprehensive (loss) income | (848 | ) | 24,188 | |||||
Retained earnings | 22,508 | 8,481 | ||||||
Total stockholders’ equity | 543,306 | 475,123 | ||||||
Total liabilities and stockholders’ equity | $ | 1,118,662 | $ | 930,620 | ||||
5
athenahealth, Inc.
CONSOLIDATED STATEMENTS OF INCOME
(Unaudited, in thousands, except per share amounts)
Three Months Ended December 31, | Twelve Months Ended December 31, | |||||||||||||||
2015 | 2014 | 2015 | 2014 | |||||||||||||
Revenue: | ||||||||||||||||
Business services | $ | 247,919 | $ | 201,072 | $ | 886,075 | $ | 711,234 | ||||||||
Implementation and other | 9,613 | 12,142 | 38,653 | 41,365 | ||||||||||||
Total revenue | 257,532 | 213,214 | 924,728 | 752,599 | ||||||||||||
Expense: | ||||||||||||||||
Direct operating | 97,253 | 76,274 | 366,559 | 302,539 | ||||||||||||
Selling and marketing | 66,196 | 50,533 | 229,901 | 189,688 | ||||||||||||
Research and development | 23,579 | 19,802 | 94,254 | 69,461 | ||||||||||||
General and administrative | 37,484 | 33,592 | 144,577 | 125,192 | ||||||||||||
Depreciation and amortization | 26,277 | 18,071 | 93,493 | 64,764 | ||||||||||||
Total expense | 250,789 | 198,272 | 928,784 | 751,644 | ||||||||||||
Operating (loss) income | 6,743 | 14,942 | (4,056 | ) | 955 | |||||||||||
Other (expense) income: | ||||||||||||||||
Interest expense | (1,604 | ) | (911 | ) | (5,796 | ) | (4,695 | ) | ||||||||
Other (expense) income | 23 | 27 | 28,738 | (124 | ) | |||||||||||
Total other income (expense) | (1,581 | ) | (884 | ) | 22,942 | (4,819 | ) | |||||||||
Income (loss) before income tax (provision) benefit | 5,162 | 14,058 | 18,886 | (3,864 | ) | |||||||||||
Income tax (provision) benefit | 2,553 | (5,329 | ) | (4,859 | ) | 745 | ||||||||||
Net income (loss) | $ | 7,715 | $ | 8,729 | $ | 14,027 | $ | (3,119 | ) | |||||||
Net income (loss) per share – Basic | $ | 0.20 | $ | 0.23 | $ | 0.36 | $ | (0.08 | ) | |||||||
Net income (loss) per share – Diluted | $ | 0.19 | $ | 0.22 | $ | 0.35 | $ | (0.08 | ) | |||||||
Weighted average shares used in computing net income (loss) per share: | ||||||||||||||||
Basic | 38,873 | 38,097 | 38,611 | 37,862 | ||||||||||||
Diluted | 39,809 | 39,040 | 39,625 | 37,862 | ||||||||||||
6
athenahealth, Inc.
CONSOLIDATED STATEMENTS OF CASH FLOWS
(Unaudited, in thousands)
Year Ended December 31, | ||||||||||||
2015 | 2014 | 2013 | ||||||||||
CASH FLOWS FROM OPERATING ACTIVITIES: | ||||||||||||
Net income (loss) | $ | 14,027 | $ | (3,119 | ) | $ | 2,594 | |||||
Adjustments to reconcile net income (loss) to net cash provided by operating activities: | ||||||||||||
Depreciation and amortization | 118,022 | 93,806 | 61,853 | |||||||||
Excess tax benefit from stock-based awards | (12,925 | ) | (10,060 | ) | (6,910 | ) | ||||||
Deferred income tax | (8,542 | ) | (11,670 | ) | (7,044 | ) | ||||||
Stock-based compensation expense | 64,134 | 55,558 | 42,648 | |||||||||
Gain on sale of marketable securities | (28,656 | ) | — | — | ||||||||
Other reconciling adjustments | 129 | (224 | ) | 9 | ||||||||
Changes in operating assets and liabilities: | ||||||||||||
Accounts receivable, net | (25,318 | ) | (34,367 | ) | (3,399 | ) | ||||||
Prepaid expenses and other current assets | 4,236 | 4,285 | 3,283 | |||||||||
Other long-term assets | (2,722 | ) | 596 | (66 | ) | |||||||
Accounts payable | 2,763 | 2,546 | (233 | ) | ||||||||
Accrued expenses and other long-term liabilities | 8,226 | 10,083 | (21 | ) | ||||||||
Accrued compensation | 17,223 | 26,339 | 5,775 | |||||||||
Deferred revenue | 3,181 | 3,248 | (3,090 | ) | ||||||||
Deferred rent | 10,066 | 12,084 | (2,091 | ) | ||||||||
Net cash provided by operating activities | 163,844 | 149,105 | 93,308 | |||||||||
CASH FLOWS FROM INVESTING ACTIVITIES: | ||||||||||||
Capitalized software costs | (97,761 | ) | (53,477 | ) | (29,123 | ) | ||||||
Purchases of property and equipment | (87,214 | ) | (76,092 | ) | (38,260 | ) | ||||||
Proceeds from sales and maturities of investments | 29,756 | — | 56,245 | |||||||||
Payments on acquisitions, net of cash acquired | (39,890 | ) | — | (410,161 | ) | |||||||
Change in restricted cash | — | 3,000 | (1,643 | ) | ||||||||
Other investing activities | (3,960 | ) | (750 | ) | (2,000 | ) | ||||||
Net cash used in investing activities | (199,069 | ) | (127,319 | ) | (424,942 | ) | ||||||
CASH FLOWS FROM FINANCING ACTIVITIES: | ||||||||||||
Proceeds from issuance of common stock under stock plans and warrants | 22,088 | 21,041 | 31,133 | |||||||||
Taxes paid related to net share settlement of stock awards | (21,486 | ) | (28,879 | ) | (12,075 | ) | ||||||
Excess tax benefit from stock-based awards | 12,925 | 10,060 | 6,910 | |||||||||
Proceeds from long-term debt | 300,000 | — | 200,000 | |||||||||
Proceeds from line of credit | 60,000 | — | 155,000 | |||||||||
Payments on line of credit | (95,000 | ) | — | (120,000 | ) | |||||||
Payments on long-term debt | (173,750 | ) | (15,000 | ) | (11,250 | ) | ||||||
Net settlement of acquired company’s board of directors equity shares | — | — | (5,806 | ) | ||||||||
Debt issuance costs | (987 | ) | — | (1,699 | ) | |||||||
Payment of contingent consideration accrued at acquisition date | — | — | (525 | ) | ||||||||
Net cash provided by (used in) financing activities | 103,790 | (12,778 | ) | 241,688 | ||||||||
Effects of exchange rate changes on cash and cash equivalents | (425 | ) | (223 | ) | (40 | ) | ||||||
Net increase (decrease) in cash and cash equivalents | 68,140 | 8,785 | (89,986 | ) | ||||||||
Cash and cash equivalents at beginning of period | 73,787 | 65,002 | 154,988 | |||||||||
Cash and cash equivalents at end of period | $ | 141,927 | $ | 73,787 | $ | 65,002 | ||||||
7
athenahealth, Inc.
STOCK-BASED COMPENSATION
(Unaudited, in thousands)
Set forth below is a breakout of stock-based compensation impacting the Consolidated Statements of Income for the three and twelve months ended December 31, 2015, and 2014:
Three Months Ended December 31, | Twelve Months Ended December 31, | ||||||||||||||
2015 | 2014 | 2015 | 2014 | ||||||||||||
Stock-based compensation charged to Consolidated Statements of Income: | |||||||||||||||
Direct operating | $ | 3,675 | $ | 3,203 | $ | 14,558 | $ | 12,009 | |||||||
Selling and marketing | 4,712 | 3,703 | 18,457 | 14,581 | |||||||||||
Research and development | 2,249 | 1,923 | 8,956 | 7,221 | |||||||||||
General and administrative | 5,555 | 7,743 | 22,163 | 21,747 | |||||||||||
Total stock-based compensation expense | 16,191 | 16,572 | 64,134 | 55,558 | |||||||||||
Amortization of capitalized stock-based compensation related to software development (1) | 1,391 | 743 | 4,404 | 2,258 | |||||||||||
$ | 17,582 | $ | 17,315 | $ | 68,538 | $ | 57,816 | ||||||||
(1) | In addition, for the three months ended December 31, 2015, and 2014, $1.9 million and $1.2 million, respectively, of stock-based compensation was capitalized in the line item Capitalized Software Costs, net in the Consolidated Balance Sheets for which $1.4 million and $0.7 million, respectively, of amortization was included in the line item Depreciation and Amortization in the Consolidated Statements of Income. For the twelve months ended December 31, 2015, and 2014, $7.3 million and $4.7 million, respectively, of stock-based compensation was capitalized in the line item Capitalized Software Costs, net in the Consolidated Balance Sheets for which $4.4 million and $2.3 million, respectively, of amortization was included in the line item Depreciation and Amortization in the Consolidated Statements of Income. |
athenahealth, Inc.
AMORTIZATION OF PURCHASED INTANGIBLE ASSETS
(Unaudited, in thousands)
Set forth below is a breakout of amortization of purchased intangible assets impacting the Consolidated Statements of Income for the three and twelve months ended December 31, 2015, and 2014:
Three Months Ended December 31, | Twelve Months Ended December 31, | ||||||||||||||
Amortization of purchased intangible assets allocated to: | 2015 | 2014 | 2015 | 2014 | |||||||||||
Direct operating | $ | 3,465 | $ | 2,991 | $ | 14,642 | $ | 12,181 | |||||||
Selling and marketing | 2,288 | 3,211 | 9,407 | 16,388 | |||||||||||
Total amortization of purchased intangible assets | $ | 5,753 | $ | 6,202 | $ | 24,049 | $ | 28,569 | |||||||
8
athenahealth, Inc.
RECONCILIATION OF NON-GAAP FINANCIAL MEASURES
TO COMPARABLE GAAP MEASURES
(Unaudited, in thousands, except per share amounts)
The following is a reconciliation of the non-GAAP financial measures used by us to describe our financial results determined in accordance with accounting principles generally accepted in the United States of America (“GAAP”). An explanation of these measures is also included below under the heading “Explanation of Non-GAAP Financial Measures.”
While management believes that these non-GAAP financial measures provide useful supplemental information to investors regarding the underlying performance of our business operations, investors are reminded to consider these non-GAAP measures in addition to, and not as a substitute for, financial performance measures prepared in accordance with GAAP. In addition, it should be noted that these non-GAAP financial measures may be different from non-GAAP measures used by other companies, and management may utilize other measures to illustrate performance in the future. Non-GAAP measures have limitations in that they do not reflect all of the amounts associated with our results of operations as determined in accordance with GAAP.
Please note that these figures may not sum exactly due to rounding.
Non-GAAP Adjusted Gross Margin
Set forth below is a presentation of our “Non-GAAP Adjusted Gross Profit” and “Non-GAAP Adjusted Gross Margin,” which represents Non-GAAP Adjusted Gross Profit as a percentage of total revenue.
(unaudited, in thousands) | Three Months Ended | Twelve Months Ended | |||||||||||||
December 31, | December 31, | ||||||||||||||
2015 | 2014 | 2015 | 2014 | ||||||||||||
Total revenue | $ | 257,532 | $ | 213,214 | $ | 924,728 | $ | 752,599 | |||||||
Direct operating expense | 97,253 | 76,274 | 366,559 | 302,539 | |||||||||||
Total revenue less direct operating expense | 160,279 | 136,940 | 558,169 | 450,060 | |||||||||||
Add: Stock-based compensation allocated to direct operating expense | 3,675 | 3,203 | 14,558 | 12,009 | |||||||||||
Add: Amortization of purchased intangible assets allocated to direct operating expense | 3,465 | 2,991 | 14,642 | 12,181 | |||||||||||
Non-GAAP Adjusted Gross Profit | $ | 167,419 | $ | 143,134 | $ | 587,369 | $ | 474,250 | |||||||
Non-GAAP Adjusted Gross Margin | 65.0 | % | 67.1 | % | 63.5 | % | 63.0 | % | |||||||
9
Non-GAAP Adjusted EBITDA
Set forth below is a reconciliation of our “Non-GAAP Adjusted EBITDA” and “Non-GAAP Adjusted EBITDA Margin,” which represents Non-GAAP Adjusted EBITDA as a percentage of total revenue.
(unaudited, in thousands) | Three Months Ended | Twelve Months Ended | |||||||||||||
December 31, | December 31, | ||||||||||||||
2015 | 2014 | 2015 | 2014 | ||||||||||||
Total Revenue | $ | 257,532 | $ | 213,214 | $ | 924,728 | $ | 752,599 | |||||||
GAAP net income (loss) | 7,715 | 8,729 | 14,027 | (3,119 | ) | ||||||||||
Add: (Benefit) from provision for income taxes | (2,553 | ) | 5,329 | 4,859 | (745 | ) | |||||||||
Add: Total other expense (income) | 1,581 | 884 | (22,942 | ) | 4,819 | ||||||||||
Add: Stock-based compensation expense | 16,191 | 16,572 | 64,134 | 55,558 | |||||||||||
Add: Depreciation and amortization | 26,277 | 18,071 | 93,493 | 64,764 | |||||||||||
Add: Amortization of purchased intangible assets | 5,753 | 6,202 | 24,049 | 28,569 | |||||||||||
Add: Integration and transaction costs | — | — | 964 | — | |||||||||||
Add: Restructuring costs | 1,203 | — | 5,649 | — | |||||||||||
Non-GAAP Adjusted EBITDA | $ | 56,167 | $ | 55,787 | $ | 184,233 | $ | 149,846 | |||||||
Non-GAAP Adjusted EBITDA Margin | 21.8 | % | 26.2 | % | 19.9 | % | 19.9 | % | |||||||
Non-GAAP Adjusted Operating Income
Set forth below is a reconciliation of our “Non-GAAP Adjusted Operating Income” and “Non-GAAP Adjusted Operating Income Margin,” which represents Non-GAAP Adjusted Operating Income as a percentage of total revenue.
(unaudited, in thousands) | Three Months Ended | Twelve Months Ended | |||||||||||||
December 31, | December 31, | ||||||||||||||
2015 | 2014 | 2015 | 2014 | ||||||||||||
Total revenue | $ | 257,532 | $ | 213,214 | $ | 924,728 | $ | 752,599 | |||||||
GAAP net income (loss) | 7,715 | 8,729 | 14,027 | (3,119 | ) | ||||||||||
Add: (Benefit) from provision for income taxes | (2,553 | ) | 5,329 | 4,859 | (745 | ) | |||||||||
Add: Total other expense (income) | 1,581 | 884 | (22,942 | ) | 4,819 | ||||||||||
Add: Stock-based compensation expense | 16,191 | 16,572 | 64,134 | 55,558 | |||||||||||
Add: Amortization of capitalized stock-based compensation related to software development | 1,391 | 743 | 4,404 | 2,258 | |||||||||||
Add: Amortization of purchased intangible assets | 5,753 | 6,202 | 24,049 | 28,569 | |||||||||||
Add: Integration and transaction costs | — | — | 964 | — | |||||||||||
Add: Restructuring costs | 1,203 | — | 5,649 | — | |||||||||||
Non-GAAP Adjusted Operating Income | $ | 31,281 | $ | 38,459 | $ | 95,144 | $ | 87,340 | |||||||
Non-GAAP Adjusted Operating Income Margin | 12.1 | % | 18.0 | % | 10.3 | % | 11.6 | % | |||||||
10
Non-GAAP Adjusted Net Income
Set forth below is a reconciliation of our “Non-GAAP Adjusted Net Income” and “Non-GAAP Adjusted Net Income per Diluted Share.”
(unaudited, in thousands) | Three Months Ended | Twelve Months Ended | |||||||||||||
December 31, | December 31, | ||||||||||||||
2015 | 2014 | 2015 | 2014 | ||||||||||||
GAAP net income (loss) | $ | 7,715 | $ | 8,729 | $ | 14,027 | $ | (3,119 | ) | ||||||
Add: Stock-based compensation expense | 16,191 | 16,572 | 64,134 | 55,558 | |||||||||||
Add: Amortization of capitalized stock-based compensation related to software development | 1,391 | 743 | 4,404 | 2,258 | |||||||||||
Add: Amortization of purchased intangible assets | 5,753 | 6,202 | 24,049 | 28,569 | |||||||||||
Add: Integration and transaction costs | — | — | 964 | — | |||||||||||
Add: Restructuring costs | 1,203 | — | 5,649 | — | |||||||||||
Less: Gain on sale of marketable securities | — | — | (28,656 | ) | — | ||||||||||
Sub-total of tax deductible items | 24,538 | 23,517 | 70,544 | 86,385 | |||||||||||
Less: Tax impact of tax deductible items (1) | (9,815 | ) | (9,407 | ) | (28,218 | ) | (34,554 | ) | |||||||
Add: Tax impact resulting from applying non-GAAP tax rate (2) | (4,618 | ) | (294 | ) | (2,695 | ) | 801 | ||||||||
Non-GAAP Adjusted Net Income | $ | 17,820 | $ | 22,545 | $ | 53,658 | $ | 49,513 | |||||||
Weighted average shares - diluted | 39,809 | 39,040 | 39,625 | 37,862 | |||||||||||
Non-GAAP Adjusted Net Income per Diluted Share | $ | 0.45 | $ | 0.58 | $ | 1.35 | $ | 1.31 | |||||||
(1) | Tax impact calculated using a statutory tax rate of 40%. |
(2) | Represents adjusting the GAAP net loss at a non-GAAP tax rate of 40%. We used a non-GAAP tax rate of 40% to normalize the tax impact to our Non-GAAP Adjusted Net Income per Diluted Share based on the fact that a relatively small change in pre-tax GAAP income (loss) in any one period could result in a volatile GAAP effective tax rate. |
11
(unaudited, in thousands) | Three Months Ended | Twelve Months Ended | |||||||||||||
December 31, | December 31, | ||||||||||||||
2015 | 2014 | 2015 | 2014 | ||||||||||||
GAAP net income (loss) per share - diluted | $ | 0.19 | $ | 0.22 | $ | 0.35 | $ | (0.08 | ) | ||||||
Add: Stock-based compensation expense | 0.41 | 0.42 | 1.62 | 1.47 | |||||||||||
Add: Amortization of capitalized stock-based compensation related to software development | 0.03 | 0.02 | 0.11 | 0.06 | |||||||||||
Add: Amortization of purchased intangible assets | 0.14 | 0.16 | 0.61 | 0.75 | |||||||||||
Add: Integration and transaction costs | — | — | 0.02 | — | |||||||||||
Add: Restructuring costs | 0.03 | — | 0.14 | — | |||||||||||
Less: Gain on sale of marketable securities | — | — | (0.72 | ) | — | ||||||||||
Sub-total of tax deductible items | 0.62 | 0.60 | 1.78 | 2.28 | |||||||||||
Less: Tax impact of tax deductible items (1) | (0.25 | ) | (0.24 | ) | (0.71 | ) | (0.91 | ) | |||||||
Add: Tax impact resulting from applying non-GAAP tax rate (2) | (0.12 | ) | (0.01 | ) | (0.07 | ) | 0.02 | ||||||||
Non-GAAP Adjusted Net Income per Diluted Share | $ | 0.45 | $ | 0.58 | $ | 1.35 | $ | 1.31 | |||||||
Weighted average shares - diluted | 39,809 | 39,040 | 39,625 | 37,862 | |||||||||||
(1) | Tax impact calculated using a statutory tax rate of 40%. |
(2) | Represents adjusting the GAAP net loss at a non-GAAP tax rate of 40%. We used a non-GAAP tax rate of 40% to normalize the tax impact to our Non-GAAP Adjusted Net Income per Diluted Share based on the fact that a relatively small change in pre-tax GAAP income (loss) in any one period could result in a volatile GAAP effective tax rate. |
12
athenahealth, Inc.
RECONCILIATION OF NON-GAAP FINANCIAL MEASURES
TO COMPARABLE GAAP MEASURES FOR FISCAL YEAR 2016 GUIDANCE
(Unaudited, in millions, except per share amounts)
Please note that the figures presented below may not sum exactly due to rounding.
Non-GAAP Adjusted Gross Margin Guidance
Set forth below is a presentation of our “Non-GAAP Adjusted Gross Profit” and “Non-GAAP Adjusted Gross Margin” guidance for fiscal year 2016, which represents Non-GAAP Adjusted Gross Profit as a percentage of total revenue.
LOW | HIGH | |||||
Fiscal Year Ending December 31, 2016 | ||||||
Total revenue | $ | 1,085.0 | $ | 1,115.0 | ||
Direct operating expense | 423.4 | 423.2 | ||||
Total revenue less direct operating expense | $ | 661.6 | $ | 691.7 | ||
Add: Stock-based compensation expense | ||||||
allocated to direct operating expense | 19.0 | 19.0 | ||||
Add: Amortization of purchased intangible assets | ||||||
allocated to direct operating expense | 8.4 | 8.4 | ||||
Non-GAAP Adjusted Gross Profit | $ | 689.0 | $ | 719.2 | ||
Non-GAAP Adjusted Gross Margin | 63.5 | % | 64.5 | % | ||
Non-GAAP Adjusted Operating Income Guidance
Set forth below is a reconciliation of our “Non-GAAP Adjusted Operating Income” and “Non-GAAP Adjusted Operating Income Margin” guidance for fiscal year 2016, which represents Non-GAAP Adjusted Operating Income as a percentage of total revenue.
LOW | HIGH | |||||
Fiscal Year Ending December 31, 2016 | ||||||
Total revenue | $ | 1,085.0 | $ | 1,115.0 | ||
GAAP net income | 10.8 | 19.5 | ||||
Add: Provision for income taxes | 7.6 | 12.9 | ||||
Add: Total other expense | 5.3 | 6.4 | ||||
Add: Stock-based compensation expense | 69.4 | 69.4 | ||||
Add: Amortization of capitalized stock-based compensation related to software development | 6.8 | 6.8 | ||||
Add: Amortization of purchased intangible assets | 20.0 | 20.0 | ||||
Non-GAAP Adjusted Operating Income | $ | 120.0 | $ | 135.0 | ||
Non-GAAP Adjusted Operating Income Margin | 11.1 | % | 12.1 | % | ||
13
Non-GAAP Adjusted Net Income Guidance
Set forth below is a reconciliation of our “Non-GAAP Adjusted Net Income” and “Non-GAAP Adjusted Net Income per Diluted Share” guidance for fiscal year 2016.
LOW | HIGH | |||||
Fiscal Year Ending December 31, 2016 | ||||||
GAAP net income | $ | 10.8 | $ | 19.5 | ||
Add: Stock-based compensation expense | 69.4 | 69.4 | ||||
Add: Amortization of capitalized stock-based compensation related to software development | 6.8 | 6.8 | ||||
Add: Amortization of purchased intangible assets | 20.0 | 20.0 | ||||
Sub-total of tax deductible items | $ | 96.2 | $ | 96.2 | ||
(Less): Tax impact of tax deductible items (1) | (38.5 | ) | (38.5 | ) | ||
Add: Tax impact resulting from applying a normalized non-GAAP tax rate (2) | 0.2 | (0.1 | ) | |||
Non-GAAP Adjusted Net Income | $ | 68.8 | $ | 77.2 | ||
Weighted average shares - diluted | 41.7 | 41.7 | ||||
Non-GAAP Adjusted Net Income per Diluted Share | $ | 1.65 | $ | 1.85 | ||
(1) | Tax impact calculated using a statutory tax rate of 40%. |
(2) | Represents adjusting the GAAP net loss at a non-GAAP tax rate of 40%. For 2016, we will use a non-GAAP tax rate of 40% to normalize the tax impact to our Non-GAAP Adjusted Net Income per Diluted Share based on the fact that a relatively small change in pre-tax GAAP income (loss) in any one period could result in a volatile GAAP effective tax rate. |
LOW | HIGH | |||||
Fiscal Year Ending December 31, 2016 | ||||||
GAAP net income per share - diluted | $ | 0.26 | $ | 0.47 | ||
Add: Stock-based compensation expense | 1.66 | 1.66 | ||||
Add: Amortization of capitalized stock-based compensation related to software development | 0.16 | 0.16 | ||||
Add: Amortization of purchased intangible assets | 0.48 | 0.48 | ||||
Sub-total of tax deductible items | $ | 2.31 | $ | 2.31 | ||
(Less): Tax impact of tax deductible items (1) | (0.92 | ) | (0.92 | ) | ||
Add: Tax impact resulting from applying a normalized non-GAAP tax rate (2) | 0.01 | — | ||||
Non-GAAP Adjusted Net Income per Diluted Share | $ | 1.65 | $ | 1.85 | ||
Weighted average shares - diluted | 41.7 | 41.7 | ||||
(1) | Tax impact calculated using a statutory tax rate of 40%. |
(2) | Represents adjusting the GAAP net loss at a non-GAAP tax rate of 40%. For 2016, we will use a non-GAAP tax rate of 40% to normalize the tax impact to our Non-GAAP Adjusted Net Income per Diluted Share based on the fact that a relatively small change in pre-tax GAAP income (loss) in any one period could result in a volatile GAAP effective tax rate. |
14
Explanation of Non-GAAP Financial Measures
We report our financial results in accordance with accounting principles generally accepted in the United States of America, or GAAP. However, management believes that, in order to properly understand our short-term and long-term financial and operational trends, investors may wish to consider the impact of certain non-cash or non-recurring items, when used as a supplement to financial performance measures in accordance with GAAP. These items result from facts and circumstances that vary in frequency and impact on continuing operations. Management also uses results of operations before such items to evaluate the operating performance of athenahealth and compare it against past periods, make operating decisions, and serve as a basis for strategic planning. These non-GAAP financial measures provide management with additional means to understand and evaluate the operating results and trends in our ongoing business by eliminating certain non-cash expenses and other items that management believes might otherwise make comparisons of our ongoing business with prior periods more difficult, obscure trends in ongoing operations, or reduce management’s ability to make useful forecasts. Management believes that these non-GAAP financial measures provide additional means of evaluating period-over-period operating performance. In addition, management understands that some investors and financial analysts find this information helpful in analyzing our financial and operational performance and comparing this performance to our peers and competitors.
Management defines “Non-GAAP Adjusted Gross Profit” as total revenue, less direct operating expense, plus (1) stock-based compensation expense allocated to direct operating expense and (2) amortization of purchased intangible assets allocated to direct operating expense, and “Non-GAAP Adjusted Gross Margin” as Non-GAAP Adjusted Gross Profit as a percentage of total revenue. Management considers these non-GAAP financial measures to be important indicators of our operational strength and performance of our business and a good measure of our historical operating trends. Moreover, management believes that these measures enable investors and financial analysts to closely monitor and understand changes in our ability to generate income from ongoing business operations.
Management defines “Non-GAAP Adjusted EBITDA” as the sum of GAAP net income (loss) before (benefit) from provision for income taxes, total other expense (income), stock-based compensation expense, depreciation and amortization, amortization of purchased intangible assets, integration and transaction costs, and restructuring costs and “Non-GAAP Adjusted EBITDA Margin” as Non-GAAP Adjusted EBITDA as a percentage of total revenue. Management defines “Non-GAAP Adjusted Operating Income” as the sum of GAAP net income (loss) before (benefit) from provision for income taxes, total other expense (income), stock-based compensation expense, amortization of capitalized stock-based compensation related to software development, amortization of purchased intangible assets, integration and transaction costs, and restructuring costs and “Non-GAAP Adjusted Operating Income Margin” as Non-GAAP Adjusted Operating Income as a percentage of total revenue. Management defines “Non-GAAP Adjusted Net Income” as the sum of GAAP net income (loss) before stock-based compensation expense, amortization of capitalized stock-based compensation related to software development, amortization of purchased intangible assets, integration and transaction costs, restructuring costs, and gain on sale of marketable securities and any tax impact related to these preceding items, and an adjustment to the tax provision for the non-GAAP tax rate and “Non-GAAP Adjusted Net Income per Diluted Share” as Non-GAAP Adjusted Net Income divided by weighted average diluted shares outstanding. Management considers all of these non-GAAP financial measures to be important indicators of our operational strength and performance of our business and a good measure of our historical operating trends, in particular the extent to which ongoing operations impact our overall financial performance.
15
Management excludes or adjusts each of the items identified below from the applicable non-GAAP financial measure referenced above for the reasons set forth with respect to that excluded item:
• | Stock-based compensation expense and amortization of capitalized stock-based compensation related to software development — excluded because these are non-cash expenditures that management does not consider part of ongoing operating results when assessing the performance of our business, and also because the total amount of the expenditure is partially outside of our control because it is based on factors such as stock price, volatility, and interest rates, which may be unrelated to our performance during the period in which the expenses are incurred. |
• | Amortization of purchased intangible assets — purchased intangible assets are amortized over their estimated useful lives and generally cannot be changed or influenced by management after the acquisition. Accordingly, this item is not considered by management in making operating decisions. Management does not believe such charges accurately reflect the performance of our ongoing operations for the period in which such charges are incurred. |
• | Integration and transaction costs — Integration costs are the severance payments and retention bonuses for certain employees relating to the Razor Insights, LLC acquisition. Transaction costs are non-recurring costs related to specific transactions. Accordingly, management believes that such expenses do not have a direct correlation to future business operations, and therefore, these costs are not considered by management in making operating decisions. Management does not believe such charges accurately reflect the performance of our ongoing operations for the period in which such charges are incurred. |
• | Restructuring costs — represents costs related to workforce reductions and to terminate certain lease agreements for strategic realignment purposes. Management does not believe such costs accurately reflect the performance of our ongoing operations for the period in which such costs are incurred. |
• | Gain on sale of marketable securities — represents gain on sale of marketable securities. Management does not believe such gains accurately reflect the performance of our ongoing operations for the period in which such gains are reported. |
• | Non-GAAP tax rate — We use a non-GAAP tax rate of 40% to normalize the tax impact to our Non-GAAP Adjusted Net Income per Diluted Share based on the fact that a relatively small change in pre-tax GAAP income (loss) in any one period could result in a volatile GAAP effective tax rate. |
16
Fourth Quarter and Fiscal Year 2015 
Prepared Remarks February 4, 2016
Jonathan Bush, Chairman & Chief Executive Officer
Kristi Matus, Executive Vice President, Chief Financial & Administrative Officer
About These Remarks
The following commentary is provided by management in conjunction with the fourth quarter and full year 2015 earnings press release issued by athenahealth, Inc. (“athenahealth” or “we”). These remarks represent management’s current views on our financial and operational performance and are provided to give investors and analysts more time to analyze and understand our performance in advance of the earnings conference call. These prepared remarks will not be read on the conference call. A complete reconciliation between generally accepted accounting principles (“GAAP”) and non-GAAP results, as well as a summary of supplemental metrics and definitions, is provided in the tables following these prepared remarks.
Earnings Conference Call Information
We will conduct a conference call tomorrow, Friday, February 5, 2016, at 8:00 a.m. Eastern Time. To participate in our live conference call and webcast, please dial 877-853-5645 (or 408-940-3868 for international calls) using conference code no. 20802771, or visit the Investors section of our web site at www.athenahealth.com. A replay will be available for one week following the conference call at 855-859-2056 (and 404-537-3406 for international calls) using conference code no. 20802771. A webcast replay will also be archived on our website.
Safe Harbor and Forward-Looking Statements
These remarks contain forward-looking statements, which are made pursuant to the safe harbor provisions of the Private Securities Litigation Reform Act of 1995, including statements reflecting management’s expectations for future financial and operational performance and operational expenditures, expected growth, and business outlook, including the fiscal year 2016 guidance; statements regarding our research and development efforts and product offering and upgrade plans and timelines, including the athenaCommunicator patient portal, athenaClinicals® for Hospitals and Health Systems, and the streamlined athenaNet® experience; the sources of growth and opportunity for us and our clients; our focus on key shared utilities and our expectation that these new network services will differentiate and strengthen our service offerings; the further integration of our services and the resulting benefits; our ability to leverage our network; changes in the types of providers and health care entities we serve and the range of tasks we perform for clients; our sales, marketing and partnering activities and plans, including programs to support and serve the hospital and health system market; our market position and awareness among physicians; the potential for cross-sales among service offerings and sales involving multiple services; and statements found under our “Reconciliation of Non-GAAP Financial Measures to Comparable GAAP Measures” and “Reconciliation of Non-GAAP Financial Measures to Comparable GAAP Measures for Fiscal Year 206 Guidance” sections of these remarks. Forward-looking statements may often be identified with words such as “we expect,” “we anticipate,” “upcoming,” “plan,” “aim,”or similar indications of future expectations. These statements are neither promises nor guarantees, and are subject to a variety of risks and uncertainties, many of which are beyond our control, which could cause actual results to differ materially from those contemplated in these forward-looking statements. In particular, the risks and uncertainties include, among other things: the development of the market for cloud-based services for health care information technology; our ability to innovate and grow our market share; our ability to manage growth; risks related to international operations; our variable sales and
1
implementation cycles, which may result in fluctuations in our quarterly results; risks associated with the acquisition and integration of companies and new technologies, including those related to our ability to successfully scale the athenaCoordinator services, those related to our ability to integrate the services, offerings, and technologies of Epocrates, RazorInsights, and webOMR and realize the expected benefits; risks associated with our ability to realize the expected benefits from the purchase of the Arsenal on the Charles campus in Watertown, Massachusetts; risks associated with our expectations regarding our ability to maintain profitability; the impact of increased research and development and sales and marketing expenditures, including whether increased expansion in revenues is attained and whether impact on margins and profitability is longer term than expected; changes in tax rates or exposure to additional tax liabilities; the highly competitive industry in which we operate and the relative immaturity of the market for our service offerings; our reliance on our systems, Internet infrastructure and other third parties’ systems, and the risks of a breach, interruption or failure in those systems; and the evolving and complex governmental and regulatory compliance environment in which we and our clients operate. Existing and prospective investors are cautioned not to place undue reliance on these forward-looking statements, which speak only as of the date hereof. Except as required by law, we undertake no obligation to update or revise the information contained in these remarks, whether as a result of new information, future events or circumstances, or otherwise. For additional disclosure regarding these and other risks faced by us, see the disclosures contained in our public filings with the Securities and Exchange Commission (“SEC”), available on the Investors section of our website at www.athenahealth.com and on the SEC’s website at www.sec.gov.
Use of Non-GAAP Financial Measures
These remarks contain non-GAAP financial measures, as defined by Regulation G. The GAAP financial measure most directly comparable to each non-GAAP financial measure used or discussed, and a reconciliation of the differences between each non-GAAP financial measure and the comparable GAAP financial measure, are included following these prepared remarks or can be found within our fourth quarter and full year 2015 earnings press release in the Investors section of our web site at www.athenahealth.com.
Opening Remarks
2015 has been a year of moving faster. We onboarded 1,667 athenistas, we added a record 13,067 providers on our network, we signed several marquee enterprise clients, and we doubled our addressable market with our entrance into the acute care market. athenahealth has delivered a great 2015 and we have entered 2016 with strong momentum. Our leadership team has been reorganized around our core services so that we can move even faster. We also remain committed to our strategic priorities, which include: 1) fully leveraging the power of our network; 2) configuring our organization to enable greater scaling efficiencies; 3) continuing our expansion across the continuum of care; and 4) equipping providers to win at alternative reimbursement. We remain focused on connecting the disconnect by bringing the power of the internet into the health care industry.
Highlights from Q4 2015 are summarized below:
• | Grew consolidated revenue by 21% and revenue from athenahealth-branded services by 21% over Q4 2014 |
• | Grew net new active physicians on athenaCollector (2,148 physicians added), athenaClinicals (1,126 physicians added), and athenaCommunicator (1,965 physicians added) in Q4 2015, compared to athenaCollector (2,317 physicians added), athenaClinicals (1,353 physicians added), and athenaCommunicator (2,480 physicians added) in Q4 2014 |
2
• | Completed the implementation at Summit Medical Group in Tennessee (population health), brought the first wave live at NewYork-Presbyterian Medical Groups (athenaOne) in Q4 2015, and brought another wave live at Trinity Health (athenaOne) in January 2016 |
• | Closed three new population health management deals in the fourth quarter, including Dignity Health, compared to a total of four new deals signed in all of the first three quarters of 2015 |
• | Expanded our relationship with the University of Toledo to develop our electronic health record with the University of Toledo Medical Center for providers who cross ambulatory and hospital care settings |
• | Launched our More Disruption Please Innovation Challenge to help us build a hospital in the cloud |
• | Expanded our More Disruption Please Accelerator program to include Patient IO, a care coordination and management platform that engages patients outside the clinic, on virtually any device and Archway Health, a company that partners with physicians to design, execute, and finance Medicare and Commercial bundled payment programs |
• | Recognized as a leader in interoperability in the KLAS report, “EMR Interoperability 2015: Are We Lifting Together?” (Note: KLAS is a research firm that independently monitors vendor performance by surveying and interviewing thousands of health care organizations) |
Results Overview
athenahealth’s top line results for the fourth quarter and fiscal year (“FY”) 2015 reflect solid revenue growth:
• | Total revenue: |
◦ | $257.5 million in Q4 2015, representing 21% growth over $213.2 million in Q4 2014 |
▪ | athenahealth-branded revenue was $237.8 million in Q4 2015, representing 21% growth over $195.9 million for Q4 2014 |
◦ | $924.7 million in FY 2015, representing 23% growth over $752.6 million in FY 2014 |
▪ | athenahealth-branded revenue was $856.8 million in FY 2015, representing 24% growth over $690.0 million for FY 2014 |
Our bottom line results for Q4 and FY 2015, consistent with our growth strategy, demonstrate focused sales, marketing, and research and development investments, and a focus on operating efficiencies:
• | Non-GAAP Adjusted Gross Profit: |
◦ | $167.4 million, or 65.0% of total revenue, in Q4 2015, an increase of 17% over $143.1 million, or 67.1% of total revenue, in Q4 2014 |
◦ | $587.4 million, or 63.5% of total revenue, in FY 2015, an increase of 24% over $474.3 million, or 63.0% of total revenue, in FY 2014 |
• | GAAP selling and marketing expense: |
◦ | $66.2 million, or 25.7% of total revenue, in Q4 2015, an increase of 31% over $50.5 million, or 23.7% of total revenue, in Q4 2014 |
◦ | $229.9 million, or 24.9% of total revenue, in FY 2015, an increase of 21% over $189.7 million, or 25.2% of total revenue, in FY 2014 |
• | GAAP research and development expense: |
3
◦ | $23.6 million, or 9.2% of total revenue, in Q4 2015, an increase of 19% over $19.8 million, or 9.3% of total revenue, in Q4 2014 |
◦ | $94.3 million, or 10.2% of total revenue, in FY 2015, an increase of 36% over $69.5 million, or 9.2% of total revenue, in FY 2014 |
• | GAAP general and administrative expense: |
◦ | $37.5 million, or 14.6% of total revenue, in Q4 2015, an increase of 12% over $33.6 million, or 15.8% of total revenue, in Q4 2014 |
◦ | $144.6 million, or 15.6% of total revenue, in FY 2015, an increase of 15% over $125.2 million, or 16.6% of total revenue, in FY 2014 |
• | Non-GAAP Adjusted EBITDA: |
◦ | $56.2 million, or 21.8% of total revenue, in Q4 2015, an increase of 1% from $55.8 million, or 26.2% of total revenue, in Q4 2014 |
◦ | $184.2 million, or 19.9% of total revenue in FY 2015, an increase of 23% over $149.8 million, or 19.9% of total revenue, in FY 2014 |
◦ | Non-GAAP Adjusted Operating Income: |
◦ | $31.3 million, or 12.1% of total revenue, in Q4 2015, a decrease of 19% from $38.5 million, or 18.0% of total revenue, in Q4 2014 |
◦ | $95.1 million, or 10.3% of total revenue in FY 2015, an increase of 9% over $87.3 million, or 11.6% of total revenue, in FY 2014 |
• | Non-GAAP Adjusted Net Income: |
◦ | $17.8 million, or $0.45 per diluted share, in Q4 2015, a decrease of 21% from $22.5 million, or $0.58 per diluted share, in Q4 2014 |
◦ | $53.7 million, or $1.35 per diluted share, in FY 2015, an increase of 8% from $49.5 million, or $1.31 per diluted share, in FY 2014 |
We measure our performance based on a balanced scorecard model. We believe that this framework is an excellent report card of our performance for the current year and that it measures the key performance indicators required for long-term success. For 2015, we have developed an even more streamlined scorecard that is more heavily focused on eight key stability, performance, satisfaction and financial metrics. The table below shows the scorecard results for Q1 2015, Q2 2015, Q3 2015, Q4 2015 and full year 2015. For certain metrics (i.e., Client Days in Accounts Receivable), our goal is to improve our performance by effectively reducing the scorecard metrics results throughout the year. Please reference the last page of this document for definitions of our corporate scorecard metrics.
4
Q1 2015 Results | Q2 2015 Results | Q3 2015 Results | Q4 2015 Results | FY 2015 Results | |||||||||||
Stability (10% weight) | |||||||||||||||
Voluntary Turnover | 2.2 | % | 2.8 | % | 3.4 | % | 2.1 | % | 10.5 | % | |||||
Employee Engagement | (a) | 4.3 | (a) | 4.3 | 4.3 | ||||||||||
Stability Results | 115 | % | 95 | % | 70 | % | 120 | % | 100 | % | |||||
Performance (25% weight) | |||||||||||||||
Client Days in Accounts Receivable (“DAR”) | 41.1 | 40.8 | 40.7 | 40.1 | 40.7 | ||||||||||
Closed-Loop Order Rate | 42.5 | % | 43.5 | % | 44.5 | % | 49.0 | % | 44.9 | % | |||||
Performance Results | 97 | % | 95 | % | 95 | % | 98 | % | 96 | % | |||||
Satisfaction (20% weight) | |||||||||||||||
Net Promoter Score | 42.3 | 40.5 | 39.9 | 40.3 | 40.7 | ||||||||||
Satisfaction Results | 96 | % | 92 | % | 91 | % | 92 | % | 93 | % | |||||
Financial (45% weight) | |||||||||||||||
Bookings (b) | (b) | (b) | (b) | (b) | (b) | ||||||||||
Total Revenue ($M) | $ | 206.4 | $ | 224.7 | $ | 236.1 | $ | 257.5 | $ | 924.7 | |||||
Non-GAAP Adjusted Operating Income ($M) | $ | 16.3 | $ | 22.2 | $ | 25.4 | $ | 31.3 | $ | 95.1 | |||||
Financial Results | 130 | % | 115 | % | 91 | % | 88 | % | 101 | % | |||||
Total Results | 113 | % | 103 | % | 90 | % | 95 | % | 98 | % | |||||
(a) | Employee Engagement survey result are reported in Q2 and Q4 only. |
(b) | Since the bookings metric contains highly sensitive data, we do not disclose all of the specific performance measures and targets, because we believe that such disclosure would result in serious competitive harm. |
We believe that our underlying drivers of long-term success remain strong as supported by the following metric results:
• | Voluntary Turnover of 2.1% in Q4 2015, favorable to our goal of 2.6%. We closely track employee retention metrics and monitor employee engagement via our semi-annual engagement surveys. We continue to focus on programs that attract and develop top talent across all of our locations. |
• | Employee Engagement at 4.3 out of 5.0 in Q4 2015, versus our goal of 4.3 and Q4 2014 actual result of 4.1 |
• | Client Days in Accounts Receivable of 40.1 days in Q4 2015, versus our goal of 37.4 days, and compared to 38.8 days in Q4 2014. Client Days in Accounts Receivable continues to be impacted by credentialing-related activity resulting from strong provider growth within the base as well as new provider growth. |
• | Closed-Loop Order Rate of 49.0% in Q4 2015, favorable to our goal of 46.6%. |
• | Net Promoter Score of 40.3 in Q4 2015, versus goal of 44.0 and 39.9 in Q3 2015. We continue to focus on improving our service around change management, the client on-boarding experience, and issue resolution. |
athenahealth’s client base continues to expand while client adoption of other services in the athenahealth service suite grows. As our client base expands outside the traditional ambulatory market, we believe that
5
total active providers, receiver nodes, and eventually hospitals or hospital beds on our network will become more appropriate metrics to use in measuring our market share. During Q4 2015 and FY 2015:
• | 85% of all new athenaCollector deals included athenaClinicals, compared to 74% in Q4 2014 |
◦ | 84% of all new athenaCollector deals included athenaClinicals in FY 2015, compared to 77% in FY 2014 |
• | 82% of all new athenaCollector deals included athenaClinicals and athenaCommunicator, compared to 68% in Q4 2014. Additionally, 82% of all new athenaOne deals sold during Q4 2015 also included athenaCoordinator, compared to 68% in Q4 2014 |
◦ | 81% of all new athenaCollector deals included athenaClinicals, athenaCommunicator, and athenaCoordinator in FY 2015, compared to 72% in FY 2014 |
• | 45% of total athenaCollector physicians have adopted athenaClinicals, up from 41% in Q4 2014 |
• | 74% of total athenaCollector physicians have adopted athenaCommunicator, up from 71% in Q4 2014 |
• | Net new physicians and providers added sequentially to the network were as follows: |
athenaCollector | athenaClinicals | athenaCommunicator | ||||||||||||
Active physicians and providers: | Physicians | Providers | Physicians | Providers | Physicians | Providers | ||||||||
Beginning balance as of 9/30/15 | 53,129 | 72,314 | 23,741 | 31,071 | 38,670 | 49,986 | ||||||||
Net new additions | 2,148 | 3,102 | 1,126 | 1,613 | 1,965 | 2,835 | ||||||||
Ending balance as of 12/31/15 | 55,277 | 75,416 | 24,867 | 32,684 | 40,635 | 52,821 | ||||||||
Sequential growth % | 4 | % | 4 | % | 5 | % | 5 | % | 5 | % | 6 | % | ||
• | Net new physicians and providers added to the network since Q4 2014 were as follows: |
athenaCollector | athenaClinicals | athenaCommunicator | ||||||||||||
Active physicians and providers: | Physicians | Providers | Physicians | Providers | Physicians | Providers | ||||||||
Beginning balance as of 12/31/14 | 45,423 | 62,349 | 18,811 | 24,804 | 32,163 | 41,777 | ||||||||
Net new additions | 9,854 | 13,067 | 6,056 | 7,880 | 8,472 | 11,044 | ||||||||
Ending balance as of 12/31/15 | 55,277 | 75,416 | 24,867 | 32,684 | 40,635 | 52,821 | ||||||||
Y/Y growth % | 22 | % | 21 | % | 32 | % | 32 | % | 26 | % | 26 | % | ||
• | 1,991 athenaCoordinator receivers were added to the network in Q4 2015, bringing our athenaCoordinator receiver base to 9,047 receivers as of December 31, 2015 |
Revenue Discussion
Q4 2015 revenue reached $257.5 million and grew by 21% (or $44.3 million) over Q4 2014. athenahealth-branded revenue for Q4 2015 was $237.8 million and grew by 21% over prior year. Our total revenue of $924.7 for FY 2015 grew by 23% (or $172.1 million) over FY 2014. athenahealth-branded revenue for FY 2015 grew by 24% over FY 2014.
Q4 2015 | Q4 2014 | Y/Y Growth% | ||
athenahealth-branded | $237.8 | $195.9 | 21 | % |
Epocrates-branded | $16.2 | $12.8 | 27 | % |
Third-party tenant and other non-core | $3.5 | $4.5 | (22 | )% |
Consolidated | $257.5 | $213.2 | 21 | % |
6
FY 2015 | FY 2014 | Y/Y Growth% | ||
athenahealth-branded | $856.8 | $690.0 | 24 | % |
Epocrates-branded | $52.3 | $44.5 | 18 | % |
Third-party tenant and other non-core | $15.6 | $18.1 | (14 | )% |
Consolidated | $924.7 | $752.6 | 23 | % |
In terms of trends in our recurring revenue base, same-store analysis of claims created—a proxy for physician office utilization—indicates that physician office activity in Q4 2015 declined slightly from physician office activity during Q4 2014 mainly due to lower flu claims in Q4 2015. However, as seen in prior years, our analysis showed an increase in physician office activity in Q4 2015 compared to Q3 2015.
Claim activity is typically higher in Q4 due to flu diagnoses. In recent years, flu rates have increased during the month of December, peaking around the start of the New Year. However, analysis by our athenaResearch team in December 2015 showed that the percentage of primary care visits resulting in a diagnosis of influenza like illness from the 2015-2016 flu season has been tracking lower than the 2014-2015 season. While it is too soon to confirm that this year’s flu season will be less severe than prior years, we will continue to monitor and report on the flu activity during Q1 2016 to determine how the 2015-2016 flu patterns continue to track against previous flu seasons.
Fiscal Year 2016 Outlook
Our fiscal year 2016 guidance communicated on December 10, 2015 at our 8th Annual Investor Summit is summarized in the following table below:
For the Fiscal Year Ending December 31, 2016 | |
Forward-Looking Guidance | |
GAAP Total Revenue | $1,085 - $1,115 million |
Non-GAAP Adjusted Gross Margin | 63.5% - 64.5% |
Non-GAAP Adjusted Operating Income | $120 - $135 million |
Non-GAAP Adjusted Net Income per Diluted Share | $1.65 - $1.85 |
Non-GAAP Tax Rate | 40% |
Non-GAAP Adjusted Gross Margin Discussion
Our Non-GAAP Adjusted Gross Margin was 65.0% for Q4 2015, down approximately 210 basis points from 67.1% in Q4 2014. Our Non-GAAP Adjusted Gross Margin was 63.5% for FY 2015, in line with the high end of our fiscal year 2015 guidance, and up 50 basis points from 63.0% in FY 2014. As previously discussed, the expansion of our newer service offerings, such as athenaCoordinator Enterprise and athenaOne for Hospitals and Health Systems, is expected to serve as a headwind to total company margin expansion until these newer services become more automated and scalable.
Balance Sheet and Cash Flow Highlights
As of December 31, 2015, we had cash, cash equivalents and marketable securities of $141.9 million and outstanding indebtedness of $300.0 million. Operating cash flow increased by $14.7 million from net cash provided by operating activities of $149.1 million for the twelve months ended December 31, 2014, to net cash provided by operating activities of $163.8 million for the twelve months ended December 31, 2015.
7
Service Development Discussion
Service development at athenahealth is organized around our mission to be health care providers’ most trusted service, helping them do well by doing the right thing. In order to fulfill this goal, we deliver services backed by our cloud-based network, knowledge, and back-office work. We deliver cloud-based services for revenue cycle and practice management, electronic health records, patient engagement, patient access, care coordination, order transmission, population health management, and clinical decision support.
athenahealth-branded and Epocrates-branded service offerings
The following suite of cloud-based services connects our clients to financial results, clinical outcomes, patients, and the broader care continuum:
athenaCollector is our cloud-based revenue cycle and practice management service, which became generally available in 2000. Through this service, athenahealth helps to reduce administrative work and enables clients to improve performance and efficiency under reimbursement models, including Pay-for-Performance. athenaCollector is offered as a stand-alone solution for revenue cycle and practice management and athenaCollector for Hospitals and Health Systems is offered as a stand-alone revenue cycle solution for hospital clients. In addition, our revenue cycle services are also integrated with more comprehensive offerings: athenaOne and athenaOne for Hospitals and Health Systems, respectively.
athenaClinicals is our cloud-based electronic health record (“EHR”) service designed to make the documentation and exchange of health information easier by centering the workflow around the patient visit. athenaClinicals encourages delegation by intelligently surfacing relevant clinical content based on physician behavior across the network, and helps with tedious administrative work associated with managing orders and results. It entered general availability in 2006 and was made available as a stand-alone service in 2010. athenahealth also offers an EHR service to clients who provide care in the acute care setting - athenaClinicals for Hospitals and Health Systems - which transforms the core athenaClinicals services so that they are appropriate for the additional requirements of a non-ambulatory setting. Both athenaClinicals and athenaClinicals for Hospitals and Health Systems are also offered as part of comprehensive solutions: athenaOne and athenaOne for Hospitals and Health Systems, respectively.
athenaCommunicator is our cloud-based patient engagement and communication service. It entered general availability in 2010 and continues to help providers deepen their relationships with their patients. This service offers a unique approach to patient communication by combining web-based automated messaging and patient portal with the ability to speak to live operators for patients who receive specific call types. Clients who also use athenaClinicals can choose to allow their patients to view specific portions of their medical record via the patient portal.
athenaCommunicator Enterprise is our cloud-based population health management service. This comprehensive, cloud-based service combines software and analytics to execute, track, and coordinate care across a provider’s network. After clients transfer data from payers, finance systems, laboratories, clinical repositories, and/or EHRs, athenaCommunicator Enterprise processes and integrates that data and provides a platform through which clients can glean important insight into and manage the health of their patient population. athenahealth began offering population health management services in 2012 after the acquisition of Healthcare Data Services LLC. Effective 2016, this service has been rebranded as athenahealth Population Health.
athenaCoordinator is our EHR-agnostic, cloud-based order transmission service, which entered general availability in 2012. While most clients who use athenaClinicals are included in the receiver network, athenaCoordinator clients also include stand-alone facilities that receive orders via a “lite” portal to streamline receipt from their senders.
8
athenaCoordinator Enterprise is our cloud-based care coordination, patient access, and order transmission service. This service was first offered by athenahealth in 2011 after the acquisition of Proxsys, LLC. athenaCoordinator Enterprise is targeted at health systems navigating the difficult and costly work associated with coordinating care among multiple providers and trading partners in order to manage diverse populations of patients. This service enables smooth transitions in care, with direct scheduling across the client’s organization and secure mobile and desktop messaging for provider collaboration.
Epocrates-branded services center around a variety of clinical information and decision support offerings available through health care providers’ mobile devices. These services include: drug and disease information, medical calculator and tools, clinical guidelines, clinical messaging, virtual representative services, market research, and formulary hosting. The Epocrates network of members consists of over one million health care professionals, including approximately 50% of U.S. physicians. The features available through our Epocrates application help health care professionals make more informed prescribing decisions, improve workflow, and enhance patient safety. athenahealth acquired Epocrates on March 12, 2013.
Connecting to financial results:
Our athenaCollector service promotes our vision, to build the information backbone to help health care work as it should, and our mission, to be health care providers’ most trusted service by wicking away the administrative complexities of revenue cycle management. This empowers our clients to sustain financial health and focus on the delivery of quality patient care. Our unique combination of network, knowledge, and work enables us to bring this value to our provider clients. Our shared service operations handle the back-office work that cannot yet be automated. We leverage the network by continuously analyzing and learning from the best practices across our client base. We then infuse our insights directly into workflows across our entire platform, allowing all of our clients to benefit from the knowledge of others and realize true network effects.
One new way in which we are demonstrating these differentiated set of capabilities is through the introduction of new Time of Service (“TOS”) workflows. Earlier in 2015, members of our Product Innovation team spent time visiting client practices to observe how they collect money from patients. This onsite research provided us with insight into best practices policies, procedures, and workflows for optimizing TOS collection rates - defined as the percentage of copays and outstanding balance dollars collected for each visit at the time of service. In January 2016, we deployed this knowledge across our entire network via our new TOS workflow, with supporting informational collateral in our Patient Pay Resource Center and a new TOS collections dashboard. The dashboard provides clients with TOS performance visibility at the group, department, and even individual user level, helping them zero in on both collection performance and opportunities for improvement. We are holding ourselves accountable for improvements in our clients’ TOS collection rates by including this metric on our 2016 scorecard Service Performance Index, once again underscoring the aligned incentives we have with the performance of our clients.
Connecting to clinical outcomes:
Our athenaClinicals service aims to drive practice efficiency, improve quality of care, and ultimately, improve patient experience. Today, providers feel burdened by clunky electronic health record software systems that slow them down, distract them from patient care, and fail to deliver on their promises of intelligent decision support and seamless information exchange. Our athenaClinicals service aims to address these concerns and remains focused on letting doctors be doctors by connecting the disconnect in health care. Three years ago, we set out to disrupt ourselves and deliver a radically improved physician experience of the patient encounter. While the athenaClinicals Streamlined experience was born from this disruption, it represents a natural evolution of our single instance cloud-based solution. The athenaClinicals Streamlined experience strives to re-imagine the electronic medical record from the
9
physician's perspective by: 1) improving the delegation of work; 2) centering the encounter around the patient; 3) documenting to communicate; and 4) improving the use of accelerators to speed documentation of the patient story. In early 2015, we sold, onboarded, and trained our first set of new providers on the athenaClinicals Streamlined experience. Starting in 2016, new clients in all specialties and segments will only see demonstrations of the new encounter experience. We expect to make the optimized encounter experience available to all of our existing clients by the end of 2016, regardless of specialty or segment. We learn by leveraging the activity of all providers on our network, so that we may continue to improve our service and client performance. In order to further drive performance, we are tracking and monitoring the following key performance metrics across our entire athenaClinicals provider base: PQRS Success, Days Documents Open, and After Hours Physician Documentation Time. The Physician Quality Reporting System or “PQRS” is a CMS penalty-only program that uses patient data to measure quality outcomes and determine Medicare reimbursement accordingly. All physicians, therapists, and practitioners who bill Medicare must report PQRS. Those who don’t report PQRS in 2015 will face a -2% downward adjustment to their Medicare payments in 2017.
Connecting to patients:
The growth of our network, critical mass of both patients and providers, and ongoing investments enable us to deliver on our promise to drive patient engagement and improve patient access for our clients. Our Peak Performance Initiative, curated by our athenaResearch team, continues to resonate with our client base, especially with the backdrop of a higher mix of quality-linked reimbursements and an emphasis on both care management and patient retention. Our proof points are informed by best practices that are experienced directly on the network - a differentiating component of our value proposition and a result of our single instance, multi-tenant architecture. Our clients are absorbing this information, as demonstrated by the movement in our portal adoption rate from 24.2% in Q4 2014 to 30.1% in Q4 2015. We exited 2015 with 9.6 million patients registered on the portal, representing approximately 100% growth in registered patients in one year. As further testimony to our progress, KLAS recognized the athenaCommunicator patient portal as the best ambulatory portal in their “Patient Portals 2015: Adoption beyond Meaningful Use” report, in addition to rating us highest for overall customer experience, patient adoption, and vendor guidance. Looking to 2016, we expect to expand our breadth of focus and accountability on athenaCommunicator performance through the inclusion of Portal Adoption, Portal Engagement Rate, and Annual Visit Rate in our service performance index metrics for our Corporate Scorecard.
Connecting to the care continuum:
Our network is broad, unique, and highly connected. We connect providers on athenaNet with labs, pharmacies, hospitals, radiology centers, and imaging centers as well as nearly every insurer in the country. We are committed to building the most connected network in health care. This commitment was recognized in the latest KLAS report, “EMR Interoperability 2015: Are We Lifting Together?” According to the KLAS report, “no other vendor is viewed more favorably regarding interoperability” than athenahealth. athenahealth was recognized for the following: 1) ranked as the easiest vendor to connect to; 2) recognized as the best-value connection for improving patient care; 3) noted for easy set-up and limited maintenance due to its unique cloud-based model which integrates the entire health care ecosystem - including practices, hospitals, labs, imaging systems, and public health agencies - onto a single-instance national health information platform; and 4) praised for delivering both simple and complex connections with low integration costs. Industry recognition from KLAS and the market response from forward-looking health care organizations has helped us further grow and strengthen our connected network. We are seeing shifts in the market with hospitals and health systems moving toward a new and better frontier, one where connectivity across the supply chain is a strategic advantage and openness is a source of competitive advantage as more care is delivered outside of the hospital setting. As a result, our network has reached a critical mass of patients and providers. Today, our network has grown
10
to over 75,000 providers, more than 38 million active patients, and is connected to over 98,000 network trading partners. Looking forward, our ability to leverage the power of this connected network will be one of our greatest differentiators and a source of growth and opportunity for both our company and our clients. We will continue to find ways to monetize the network effects inherent in our platform. As discussed during our 8th Annual Investor Summit, we are focused on building and deploying key shared utilities, including network registration, network alerts, longitudinal patient records, secure texting, and network scheduling. We expect that these new network services will further differentiate and strengthen the value of our core athenaOne services.
Our vision from day one has been to build the health care internet. In order to fulfill this vision, we are continuing to expand our services across the continuum of care. This commitment includes taking the next big step into the acute care setting with the acquisitions of Razor Insights, LLC and webOMR in early 2015. We are in the process of converting the technology acquired from these transactions into a comprehensive, cloud-based service within athenaNet for hospitals of all sizes and complexities. Our vision is to build a unified clinical experience that allows providers to cross care settings without having to log into different systems. We aim to present a single clinical and financial record, integrating information for the user from any system on which information resides. We have made rapid progress on our expansion into the hospital and health system market. In less than one year, we have gone from a service concept to a generally available athenaOne service for the under 50-bed hospital market and nearly doubled our client base on our athenaOne for Hospitals and Health Systems service. In addition, by effectively utilizing our domain expertise and the network assets from the two acquisitions, the Emerging Services team extended athenaClinicals to receive inpatient Meaningful Use certification and expanded the capabilities of athenaCollector to process our first inpatient facility claims in less than a year. Following a similar path in the ambulatory market, our product development roadmap includes extending our athenaOne offering beyond the 50-bed hospital market into the larger and more complex health system market. We look to expand our development partnerships with additional hospitals that offer a diverse set of inpatient scenarios such as larger critical access hospitals, over 50-bed surgical hospitals, and large academic medical centers. To this end, we were pleased to announce that we will partner with the University of Toledo Medical Center to accelerate the development of athenaClinicals for Hospitals & Health Systems.
Business Development Update
More Disruption Please (“MDP”)
As discussed at our 8th Annual Investor Summit in December 2015, finalizing athenaNet as a modular, open platform remains a key element of our strategic priorities. Through our MDP program, we will continue to ensure that all of athenaNet is open with application programming interfaces for new generations of innovators and entrepreneurs looking to disrupt the health care industry. Our MDP program consists of three major components: network, marketplace, and accelerator. The MDP Network is comprised of innovative thinkers, entrepreneurs, and startups with a shared mission to improve the state of health care. The MDP Marketplace features technology partners with capabilities that integrate with athenaNet, adding value to our overall service offerings and user experience. During 2015, we launched twelve new capabilities in the MDP Marketplace including telehealth, chronic care management, patient engagement, and patient surveys. As of December 31, 2015, we have contracted with and brought live 54 partners to sell their technology and services to our client base. We are also currently in integration and testing with an additional 53 partners as we continue to rapidly expand our MDP Marketplace offerings. We are pleased to report the number of client activations for MDP Marketplace services has grown 130% in 2015, bringing total client activations to 1,608. Lastly, our MDP Accelerator program provides seed funding, free office space, and ongoing mentorship from our experts, advisors, and partners to early-stage companies. We added Patient IO and Archway Health to our Accelerator program in Q4 2015, expanding our portfolio of investments to eight companies since the start of this program in 2014. Patient IO is a
11
care coordination and management platform that engages patients outside the clinic, on virtually any device. Representing our first Accelerator investment in Austin, Patient IO’s mission is to help health care organizations transition into value-based care by helping them coordinate care between patient visits. Archway Health partners with physicians to design, execute, and finance Medicare and Commercial bundled payment programs and will help athenahealth navigate the bundled payment market. Archway Health’s comprehensive bundled payments solution includes claims and clinical data analytics, care model design, management services, and downside protection and risk-sharing agreements. During 2015, we also launched a co-working component to our MDP Accelerator program in order to build an entrepreneurial health care technology community independent of our portfolio companies. In addition to our eight Accelerator investments, we have built a co-working community of 22 companies across our Watertown, Massachusetts, San Francisco, California, and Austin, Texas offices. As previously discussed last quarter, we expect to leverage our Accelerator program to further support and serve the hospital and health system market. To this end, in early January 2016, we launched the MDP Innovation Challenge to help us build a hospital in the cloud. As part of this program, athenahealth invites health tech innovators across the country to develop solutions that challenge the status quo in hospital IT. This three month virtual hack-a-thon is dedicated to focusing on developing solutions to address major needs in the hospital and health system market. To join the MDP Innovation Challenge, please visit mdpchallenge.devpost.com and to learn more about our MDP program and partnership opportunities and to explore the athenahealth Marketplace, please visit www.athenahealth.com/disruption.
Recent acquisitions
On January 13, 2015, athenahealth acquired Razor Insights, LLC (“RazorInsights”), a leader in cloud-based electronic health record and financial solutions for rural, critical access, and community hospitals. On January 23, 2015, athenahealth signed an agreement to purchase webOMR, the web-based clinical applications and electronic health record platform developed by Beth Israel Deaconess Medical Center in Boston, Massachusetts. Both acquisitions are expected to accelerate athenahealth’s ability to support the full spectrum of the acute care market. We acquired RazorInsights for $39.9 million in cash after net working capital adjustments, and we purchased webOMR from Beth Israel Deaconess Medical Center for $22.0 million in cash. Our purchase price of the webOMR technology asset is included in capitalized software development costs.
Client Base Discussion
The total number of physicians who have gone live on athenaCollector, our core service offering, is the metric we currently use to define our ambulatory client base and market share. However, as our client base expands outside the traditional ambulatory market, total active providers, network receivers, and eventually hospitals or licensed beds will become more appropriate metrics to use to define our client base and market share.
During Q4 2015, 85% of all new athenaCollector deals included athenaClinicals, up from 74% in Q4 2014. 82% of all new athenaCollector deals included athenaCommunicator and athenaClinicals. Additionally, 82% of all new athenaOne deals also included athenaCoordinator. The athenaOne rate of 82% in Q4 2015 compares to 68% in Q4 2014. Among “live” (i.e., implemented and active) athenaCollector clients, adoption of athenaClinicals and athenaCommunicator continues to grow rapidly and resulted in continued growth to our installed base across all of our service offerings.
12
athenahealth Service Offering Adoption
(athenaCollector, athenaClinicals and athenaCommunicator)
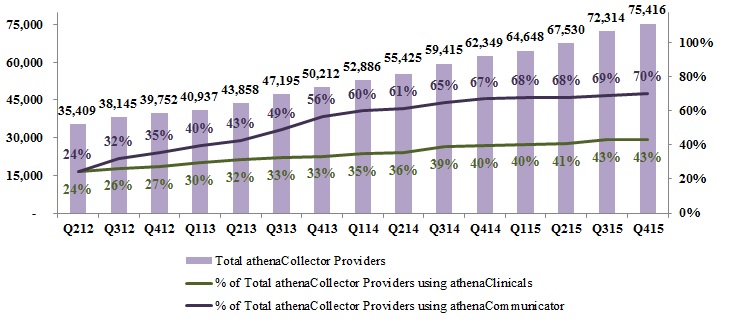
athenaCollector Clients
During Q4 2015, total active physicians on athenaCollector grew by 22% year-over-year, to 55,277. On a sequential basis, we added 2,148 net new active physicians on athenaCollector, versus 2,317 in Q4 2014. Our quarterly net new physician additions may vary widely due to the number and size of clients that go live in a particular quarter. Furthermore, our larger clients can be more complex and take longer to go live, particularly if our clients request a more phased implementation approach. Total active providers on athenaCollector grew by 21% year-over-year, to 75,416. On a sequential basis, we added 3,102 net new active providers on athenaCollector, versus 2,934 in Q4 2014.
athenaClinicals Clients
We continue to experience solid growth in client adoption of athenaClinicals. Total active physicians live on athenaClinicals grew by 32% year-over-year, to 24,867. On a sequential basis, we added 1,126 net new active physicians on athenaClinicals, versus 1,353 in Q4 2014. This equates to an overall adoption rate of 45% of total athenaCollector physicians, up from 41% in Q4 2014. Total active providers on athenaClinicals grew by 32% year-over-year, to 32,684. On a sequential basis, we added 1,613 net new active providers on athenaClinicals, versus 1,751 in Q4 2014. We expect the athenaClinicals client base to increase over time due to cross-selling within our existing base and growth in the volume of athenaOne deals.
athenaCommunicator Clients
We also continue to experience solid growth in client adoption of athenaCommunicator. Total active physicians live on athenaCommunicator grew by 26% year-over-year, to 40,635. On a sequential basis, we added 1,965 net new active physicians on athenaCommunicator, versus 2,480 in Q4 2014. This equates to an overall adoption rate of 74% of total athenaCollector physicians, up from 71% in Q4 2014. Total active providers on athenaCommunicator grew by 26% year-over-year, to 52,821. On a sequential basis, we added 2,835 net new providers on athenaCommunicator, versus 3,078 in Q4 2014. We expect the athenaCommunicator client base to increase over time due to cross-selling within our existing base and growth in the volume of athenaOne deals.
13
athenahealth Service Offering Adoption
(athenaCoordinator)

athenaCoordinator Receivers
Total athenaCoordinator receivers grew 66% year-over-year to 9,047. On a sequential basis, we added 1,991 athenaCoordinator receivers the network, versus 338 in Q4 2014.
New Deals
On November 17, 2015, we announced a partnership with TeamPraxis to connect care and manage population health in Hawaii. TeamPraxis, the premier physician service organization in Hawaii, will offer our suite of athenaOne services as well as our population health service to more than 560 independent physicians in over 250 practices across Hawaii.
On November 24, 2015, we announced that Dignity Health has selected our end-to-end population health service to support and optimize its robust population health initiatives. Dignity Health, one of the nation’s largest health care systems, is a 21-state network of nearly 9,000 physicians, 59,000 employees, and more than 400 care centers, including hospitals, urgent and occupational care, imaging centers, home health, and primary care clinics. Dignity Health will utilize our risk stratification, analytics, and care management capabilities in order to gain better insight into its patient populations, streamline communications, and better coordinate care across locations.
On December 9, 2015, we announced that Adventist Health System has selected our suite of cloud-based services, athenaOne, to support and enhance physician care across its 1,600 provider network. Recognized as a national leader in quality, safety, and patient satisfaction, Adventist Health System is a faith-based organization spanning ten states that supports the full care continuum.
On January 21, 2016, we announced that the University of Toledo Medical Center (“UTMC”) will serve as a development partner for our EHR in the acute care setting. Development at UTMC will focus heavily on creating a seamless physician and nurse user experience for the academic medical center. Research will focus on acute-care workflows to identify areas for operational improvement and then design and build service capabilities to support these workflows. The University of Toledo Physician Group has been an athenahealth client since 2014.
On February 3, 2016, we announced that Privia Health, LLC has selected our population health service as part of its sophisticated technology and team-based care platform. Privia Health will fully integrate our population health service into its already robust framework of athenaOne services for all 1,200 of its multi-specialty providers across five states and Washington, D.C.
Client Implementations
Below are the publicly disclosed clients that went live or partially live during Q4 2015:
14
• | Summit Medical Group in Tennessee went live on our cloud-based population health service in Q4 2015. |
• | NewYork-Presbyterian started the phased rollout of our suite of services, athenaOne, and brought the first wave live at NewYork-Presbyterian Medical Groups in Q4 2015. |
• | Trinity Health continued the phased rollout of our suite of services, athenaOne, in some of its physician network offices and brought another wave live in January 2016. |
Growth Discussion
The athenahealth marketing organization encompasses our growth and sales operations, event and partner marketing, inside sales agents (“ISAs”), advertising, corporate communications, and product marketing teams. This organization executes in-market investments in an effort to generate new business opportunities for athenahealth. The athenahealth sales organization includes all quota-carrying sales representatives, as well as our sales team leaders, channel sales team, and sales training and development organization.
In Q4 2015, we created an emotional connection with the physician community through our “Let Doctors be Doctors” campaign, highlighting the disconnectedness of health care and the lack of interoperability throughout the care continuum. The campaign, in combination with our other in-flight awareness efforts, yielded a 20% lift in branded search over Q3 2015 and an overall 23% lift in branded search over full year 2014. As we beat this drum and continue to address these industry concerns, we have reorganized our growth organization to ensure that we successfully meet the unique needs of each market subsegment. Specifically, we have assigned individuals to be directly responsible for leading the marketing efforts in each of our sales segments. We have also assigned each small group sales executive to a specific specialty or group of specialties for 2016. Both of these efforts could serve to benefit lead and meeting conversion rates in 2016 - gaining us new and deeper access to prospects through these more targeted strategies. Additionally, we will continue to advance opportunities in the enterprise segment through our growing pipeline, while our emerging service capabilities meet the growing needs of the industry. We believe that these tactics and strategies, among others, will fully support our 2016 bookings growth goals.
As of December 31, 2015, we have a total of 163 quota-carrying sales representatives, up 7% from December 31, 2014. Our athenahealth-branded services sales force is currently divided into four groups: enterprise, which is dedicated to serving the largest managed care organizations, as well as those with high growth potential; group, which is dedicated to medical practices with seven to 150 physicians; small group, which is dedicated to medical practices with one to six physicians; and hospital, which is dedicated to hospitals and hospital-owned clinics and medical groups with 50 beds or less.
15
Stock-Based Compensation Expense, Amortization of Purchased Intangible Assets, and Reconciliation of Non-GAAP Financial Measures
athenahealth, Inc.
STOCK-BASED COMPENSATION
(Unaudited, in thousands)
Set forth below is a breakout of stock-based compensation impacting the Consolidated Statements of Income for the three and twelve months ended December 31, 2015, and 2014:
Three Months Ended December 31, | Twelve Months Ended December 31, | ||||||||||||||
2015 | 2014 | 2015 | 2014 | ||||||||||||
Stock-based compensation charged to Consolidated Statements of Income: | |||||||||||||||
Direct operating | $ | 3,675 | $ | 3,203 | $ | 14,558 | $ | 12,009 | |||||||
Selling and marketing | 4,712 | 3,703 | 18,457 | 14,581 | |||||||||||
Research and development | 2,249 | 1,923 | 8,956 | 7,221 | |||||||||||
General and administrative | 5,555 | 7,743 | 22,163 | 21,747 | |||||||||||
Total stock-based compensation expense | 16,191 | 16,572 | 64,134 | 55,558 | |||||||||||
Amortization of capitalized stock-based compensation related to software development (1) | 1,391 | 743 | 4,404 | 2,258 | |||||||||||
$ | 17,582 | $ | 17,315 | $ | 68,538 | $ | 57,816 | ||||||||
(1) | In addition, for the three months ended December 31, 2015, and 2014, $1.9 million and $1.2 million, respectively, of stock-based compensation was capitalized in the line item Capitalized Software Costs, net in the Consolidated Balance Sheets for which $1.4 million and $0.7 million, respectively, of amortization was included in the line item Depreciation and Amortization in the Consolidated Statements of Income. For the twelve months ended December 31, 2015, and 2014, $7.3 million and $4.7 million, respectively, of stock-based compensation was capitalized in the line item Capitalized Software Costs, net in the Consolidated Balance Sheets for which $4.4 million and $2.3 million, respectively, of amortization was included in the line item Depreciation and Amortization in the Consolidated Statements of Income. |
athenahealth, Inc.
AMORTIZATION OF PURCHASED INTANGIBLE ASSETS
(Unaudited, in thousands)
Set forth below is a breakout of amortization of purchased intangible assets impacting the Consolidated Statements of Income for the three and twelve months ended December 31, 2015, and 2014:
Three Months Ended December 31, | Twelve Months Ended December 31, | ||||||||||||||
Amortization of purchased intangible assets allocated to: | 2015 | 2014 | 2015 | 2014 | |||||||||||
Direct operating | $ | 3,465 | $ | 2,991 | $ | 14,642 | $ | 12,181 | |||||||
Selling and marketing | 2,288 | 3,211 | 9,407 | 16,388 | |||||||||||
Total amortization of purchased intangible assets | $ | 5,753 | $ | 6,202 | $ | 24,049 | $ | 28,569 | |||||||
16
athenahealth, Inc.
RECONCILIATION OF NON-GAAP FINANCIAL MEASURES
TO COMPARABLE GAAP MEASURES
(Unaudited, in thousands, except per share amounts)
The following is a reconciliation of the non-GAAP financial measures used by us to describe our financial results determined in accordance with accounting principles generally accepted in the United States of America (“GAAP”). An explanation of these measures is also included below under the heading “Explanation of Non-GAAP Financial Measures.”
While management believes that these non-GAAP financial measures provide useful supplemental information to investors regarding the underlying performance of our business operations, investors are reminded to consider these non-GAAP measures in addition to, and not as a substitute for, financial performance measures prepared in accordance with GAAP. In addition, it should be noted that these non-GAAP financial measures may be different from non-GAAP measures used by other companies, and management may utilize other measures to illustrate performance in the future. Non-GAAP measures have limitations in that they do not reflect all of the amounts associated with our results of operations as determined in accordance with GAAP.
Please note that these figures may not sum exactly due to rounding.
Non-GAAP Adjusted Gross Margin
Set forth below is a presentation of our “Non-GAAP Adjusted Gross Profit” and “Non-GAAP Adjusted Gross Margin,” which represents Non-GAAP Adjusted Gross Profit as a percentage of total revenue.
(unaudited, in thousands) | Three Months Ended | Twelve Months Ended | |||||||||||||
December 31, | December 31, | ||||||||||||||
2015 | 2014 | 2015 | 2014 | ||||||||||||
Total revenue | $ | 257,532 | $ | 213,214 | $ | 924,728 | $ | 752,599 | |||||||
Direct operating expense | 97,253 | 76,274 | 366,559 | 302,539 | |||||||||||
Total revenue less direct operating expense | 160,279 | 136,940 | 558,169 | 450,060 | |||||||||||
Add: Stock-based compensation allocated to direct operating expense | 3,675 | 3,203 | 14,558 | 12,009 | |||||||||||
Add: Amortization of purchased intangible assets allocated to direct operating expense | 3,465 | 2,991 | 14,642 | 12,181 | |||||||||||
Non-GAAP Adjusted Gross Profit | $ | 167,419 | $ | 143,134 | $ | 587,369 | $ | 474,250 | |||||||
Non-GAAP Adjusted Gross Margin | 65.0 | % | 67.1 | % | 63.5 | % | 63.0 | % | |||||||
17
Non-GAAP Adjusted EBITDA
Set forth below is a reconciliation of our “Non-GAAP Adjusted EBITDA” and “Non-GAAP Adjusted EBITDA Margin,” which represents Non-GAAP Adjusted EBITDA as a percentage of total revenue.
(unaudited, in thousands) | Three Months Ended | Twelve Months Ended | |||||||||||||
December 31, | December 31, | ||||||||||||||
2015 | 2014 | 2015 | 2014 | ||||||||||||
Total Revenue | $ | 257,532 | $ | 213,214 | $ | 924,728 | $ | 752,599 | |||||||
GAAP net income (loss) | 7,715 | 8,729 | 14,027 | (3,119 | ) | ||||||||||
Add: (Benefit) from provision for income taxes | (2,553 | ) | 5,329 | 4,859 | (745 | ) | |||||||||
Add: Total other expense (income) | 1,581 | 884 | (22,942 | ) | 4,819 | ||||||||||
Add: Stock-based compensation expense | 16,191 | 16,572 | 64,134 | 55,558 | |||||||||||
Add: Depreciation and amortization | 26,277 | 18,071 | 93,493 | 64,764 | |||||||||||
Add: Amortization of purchased intangible assets | 5,753 | 6,202 | 24,049 | 28,569 | |||||||||||
Add: Integration and transaction costs | — | — | 964 | — | |||||||||||
Add: Restructuring costs | 1,203 | — | 5,649 | — | |||||||||||
Non-GAAP Adjusted EBITDA | $ | 56,167 | $ | 55,787 | $ | 184,233 | $ | 149,846 | |||||||
Non-GAAP Adjusted EBITDA Margin | 21.8 | % | 26.2 | % | 19.9 | % | 19.9 | % | |||||||
Non-GAAP Adjusted Operating Income
Set forth below is a reconciliation of our “Non-GAAP Adjusted Operating Income” and “Non-GAAP Adjusted Operating Income Margin,” which represents Non-GAAP Adjusted Operating Income as a percentage of total revenue.
(unaudited, in thousands) | Three Months Ended | Twelve Months Ended | |||||||||||||
December 31, | December 31, | ||||||||||||||
2015 | 2014 | 2015 | 2014 | ||||||||||||
Total revenue | $ | 257,532 | $ | 213,214 | $ | 924,728 | $ | 752,599 | |||||||
GAAP net income (loss) | 7,715 | 8,729 | 14,027 | (3,119 | ) | ||||||||||
Add: (Benefit) from provision for income taxes | (2,553 | ) | 5,329 | 4,859 | (745 | ) | |||||||||
Add: Total other expense (income) | 1,581 | 884 | (22,942 | ) | 4,819 | ||||||||||
Add: Stock-based compensation expense | 16,191 | 16,572 | 64,134 | 55,558 | |||||||||||
Add: Amortization of capitalized stock-based compensation related to software development | 1,391 | 743 | 4,404 | 2,258 | |||||||||||
Add: Amortization of purchased intangible assets | 5,753 | 6,202 | 24,049 | 28,569 | |||||||||||
Add: Integration and transaction costs | — | — | 964 | — | |||||||||||
Add: Restructuring costs | 1,203 | — | 5,649 | — | |||||||||||
Non-GAAP Adjusted Operating Income | $ | 31,281 | $ | 38,459 | $ | 95,144 | $ | 87,340 | |||||||
Non-GAAP Adjusted Operating Income Margin | 12.1 | % | 18.0 | % | 10.3 | % | 11.6 | % | |||||||
18
Non-GAAP Adjusted Net Income
Set forth below is a reconciliation of our “Non-GAAP Adjusted Net Income” and “Non-GAAP Adjusted Net Income per Diluted Share.”
(unaudited, in thousands) | Three Months Ended | Twelve Months Ended | |||||||||||||
December 31, | December 31, | ||||||||||||||
2015 | 2014 | 2015 | 2014 | ||||||||||||
GAAP net income (loss) | $ | 7,715 | $ | 8,729 | $ | 14,027 | $ | (3,119 | ) | ||||||
Add: Stock-based compensation expense | 16,191 | 16,572 | 64,134 | 55,558 | |||||||||||
Add: Amortization of capitalized stock-based compensation related to software development | 1,391 | 743 | 4,404 | 2,258 | |||||||||||
Add: Amortization of purchased intangible assets | 5,753 | 6,202 | 24,049 | 28,569 | |||||||||||
Add: Integration and transaction costs | — | — | 964 | — | |||||||||||
Add: Restructuring costs | 1,203 | — | 5,649 | — | |||||||||||
Less: Gain on sale of marketable securities | — | — | (28,656 | ) | — | ||||||||||
Sub-total of tax deductible items | 24,538 | 23,517 | 70,544 | 86,385 | |||||||||||
Less: Tax impact of tax deductible items (1) | (9,815 | ) | (9,407 | ) | (28,218 | ) | (34,554 | ) | |||||||
Add: Tax impact resulting from applying non-GAAP tax rate (2) | (4,618 | ) | (294 | ) | (2,695 | ) | 801 | ||||||||
Non-GAAP Adjusted Net Income | $ | 17,820 | $ | 22,545 | $ | 53,658 | $ | 49,513 | |||||||
Weighted average shares - diluted | 39,809 | 39,040 | 39,625 | 37,862 | |||||||||||
Non-GAAP Adjusted Net Income per Diluted Share | $ | 0.45 | $ | 0.58 | $ | 1.35 | $ | 1.31 | |||||||
(1) | Tax impact calculated using a statutory tax rate of 40%. |
(2) | Represents adjusting the GAAP net loss at a non-GAAP tax rate of 40%. We used a non-GAAP tax rate of 40% to normalize the tax impact to our Non-GAAP Adjusted Net Income per Diluted Share based on the fact that a relatively small change in pre-tax GAAP income (loss) in any one period could result in a volatile GAAP effective tax rate. |
19
(unaudited, in thousands) | Three Months Ended | Twelve Months Ended | |||||||||||||
December 31, | December 31, | ||||||||||||||
2015 | 2014 | 2015 | 2014 | ||||||||||||
GAAP net income (loss) per share - diluted | $ | 0.19 | $ | 0.22 | $ | 0.35 | $ | (0.08 | ) | ||||||
Add: Stock-based compensation expense | 0.41 | 0.42 | 1.62 | 1.47 | |||||||||||
Add: Amortization of capitalized stock-based compensation related to software development | 0.03 | 0.02 | 0.11 | 0.06 | |||||||||||
Add: Amortization of purchased intangible assets | 0.14 | 0.16 | 0.61 | 0.75 | |||||||||||
Add: Integration and transaction costs | — | — | 0.02 | — | |||||||||||
Add: Restructuring costs | 0.03 | — | 0.14 | — | |||||||||||
Less: Gain on sale of marketable securities | — | — | (0.72 | ) | — | ||||||||||
Sub-total of tax deductible items | 0.62 | 0.60 | 1.78 | 2.28 | |||||||||||
Less: Tax impact of tax deductible items (1) | (0.25 | ) | (0.24 | ) | (0.71 | ) | (0.91 | ) | |||||||
Add: Tax impact resulting from applying non-GAAP tax rate (2) | (0.12 | ) | (0.01 | ) | (0.07 | ) | 0.02 | ||||||||
Non-GAAP Adjusted Net Income per Diluted Share | $ | 0.45 | $ | 0.58 | $ | 1.35 | $ | 1.31 | |||||||
Weighted average shares - diluted | 39,809 | 39,040 | 39,625 | 37,862 | |||||||||||
(1) | Tax impact calculated using a statutory tax rate of 40%. |
(2) | Represents adjusting the GAAP net loss at a non-GAAP tax rate of 40%. We used a non-GAAP tax rate of 40% to normalize the tax impact to our Non-GAAP Adjusted Net Income per Diluted Share based on the fact that a relatively small change in pre-tax GAAP income (loss) in any one period could result in a volatile GAAP effective tax rate. |
20
athenahealth, Inc.
RECONCILIATION OF NON-GAAP FINANCIAL MEASURES
TO COMPARABLE GAAP MEASURES FOR FISCAL YEAR 2016 GUIDANCE
(Unaudited, in millions, except per share amounts)
Please note that the figures presented below may not sum exactly due to rounding.
Non-GAAP Adjusted Gross Margin Guidance
Set forth below is a presentation of our “Non-GAAP Adjusted Gross Profit” and “Non-GAAP Adjusted Gross Margin” guidance for fiscal year 2016, which represents Non-GAAP Adjusted Gross Profit as a percentage of total revenue.
LOW | HIGH | |||||
Fiscal Year Ending December 31, 2016 | ||||||
Total revenue | $ | 1,085.0 | $ | 1,115.0 | ||
Direct operating expense | 423.4 | 423.2 | ||||
Total revenue less direct operating expense | $ | 661.6 | $ | 691.7 | ||
Add: Stock-based compensation expense | ||||||
allocated to direct operating expense | 19.0 | 19.0 | ||||
Add: Amortization of purchased intangible assets | ||||||
allocated to direct operating expense | 8.4 | 8.4 | ||||
Non-GAAP Adjusted Gross Profit | $ | 689.0 | $ | 719.2 | ||
Non-GAAP Adjusted Gross Margin | 63.5 | % | 64.5 | % | ||
Non-GAAP Adjusted Operating Income Guidance
Set forth below is a reconciliation of our “Non-GAAP Adjusted Operating Income” and “Non-GAAP Adjusted Operating Income Margin” guidance for fiscal year 2016, which represents Non-GAAP Adjusted Operating Income as a percentage of total revenue.
LOW | HIGH | |||||
Fiscal Year Ending December 31, 2016 | ||||||
Total revenue | $ | 1,085.0 | $ | 1,115.0 | ||
GAAP net income | 10.8 | 19.5 | ||||
Add: Provision for income taxes | 7.6 | 12.9 | ||||
Add: Total other expense | 5.3 | 6.4 | ||||
Add: Stock-based compensation expense | 69.4 | 69.4 | ||||
Add: Amortization of capitalized stock-based compensation related to software development | 6.8 | 6.8 | ||||
Add: Amortization of purchased intangible assets | 20.0 | 20.0 | ||||
Non-GAAP Adjusted Operating Income | $ | 120.0 | $ | 135.0 | ||
Non-GAAP Adjusted Operating Income Margin | 11.1 | % | 12.1 | % | ||
21
Non-GAAP Adjusted Net Income Guidance
Set forth below is a reconciliation of our “Non-GAAP Adjusted Net Income” and “Non-GAAP Adjusted Net Income per Diluted Share” guidance for fiscal year 2016.
LOW | HIGH | |||||
Fiscal Year Ending December 31, 2016 | ||||||
GAAP net income | $ | 10.8 | $ | 19.5 | ||
Add: Stock-based compensation expense | 69.4 | 69.4 | ||||
Add: Amortization of capitalized stock-based compensation related to software development | 6.8 | 6.8 | ||||
Add: Amortization of purchased intangible assets | 20.0 | 20.0 | ||||
Sub-total of tax deductible items | $ | 96.2 | $ | 96.2 | ||
(Less): Tax impact of tax deductible items (1) | (38.5 | ) | (38.5 | ) | ||
Add: Tax impact resulting from applying a normalized non-GAAP tax rate (2) | 0.2 | (0.1 | ) | |||
Non-GAAP Adjusted Net Income | $ | 68.8 | $ | 77.2 | ||
Weighted average shares - diluted | 41.7 | 41.7 | ||||
Non-GAAP Adjusted Net Income per Diluted Share | $ | 1.65 | $ | 1.85 | ||
(1) | Tax impact calculated using a statutory tax rate of 40%. |
(2) | Represents adjusting the GAAP net loss at a non-GAAP tax rate of 40%. For 2016, we will use a non-GAAP tax rate of 40% to normalize the tax impact to our Non-GAAP Adjusted Net Income per Diluted Share based on the fact that a relatively small change in pre-tax GAAP income (loss) in any one period could result in a volatile GAAP effective tax rate. |
LOW | HIGH | |||||
Fiscal Year Ending December 31, 2016 | ||||||
GAAP net income per share - diluted | $ | 0.26 | $ | 0.47 | ||
Add: Stock-based compensation expense | 1.66 | 1.66 | ||||
Add: Amortization of capitalized stock-based compensation related to software development | 0.16 | 0.16 | ||||
Add: Amortization of purchased intangible assets | 0.48 | 0.48 | ||||
Sub-total of tax deductible items | $ | 2.31 | $ | 2.31 | ||
(Less): Tax impact of tax deductible items (1) | (0.92 | ) | (0.92 | ) | ||
Add: Tax impact resulting from applying a normalized non-GAAP tax rate (2) | 0.01 | — | ||||
Non-GAAP Adjusted Net Income per Diluted Share | $ | 1.65 | $ | 1.85 | ||
Weighted average shares - diluted | 41.7 | 41.7 | ||||
(1) | Tax impact calculated using a statutory tax rate of 40%. |
(2) | Represents adjusting the GAAP net loss at a non-GAAP tax rate of 40%. For 2016, we will use a non-GAAP tax rate of 40% to normalize the tax impact to our Non-GAAP Adjusted Net Income per Diluted Share based on the fact that a relatively small change in pre-tax GAAP income (loss) in any one period could result in a volatile GAAP effective tax rate. |
22
Explanation of Non-GAAP Financial Measures
We report our financial results in accordance with accounting principles generally accepted in the United States of America, or GAAP. However, management believes that, in order to properly understand our short-term and long-term financial and operational trends, investors may wish to consider the impact of certain non-cash or non-recurring items, when used as a supplement to financial performance measures in accordance with GAAP. These items result from facts and circumstances that vary in frequency and impact on continuing operations. Management also uses results of operations before such items to evaluate the operating performance of athenahealth and compare it against past periods, make operating decisions, and serve as a basis for strategic planning. These non-GAAP financial measures provide management with additional means to understand and evaluate the operating results and trends in our ongoing business by eliminating certain non-cash expenses and other items that management believes might otherwise make comparisons of our ongoing business with prior periods more difficult, obscure trends in ongoing operations, or reduce management’s ability to make useful forecasts. Management believes that these non-GAAP financial measures provide additional means of evaluating period-over-period operating performance. In addition, management understands that some investors and financial analysts find this information helpful in analyzing our financial and operational performance and comparing this performance to our peers and competitors.
Management defines “Non-GAAP Adjusted Gross Profit” as total revenue, less direct operating expense, plus (1) stock-based compensation expense allocated to direct operating expense and (2) amortization of purchased intangible assets allocated to direct operating expense, and “Non-GAAP Adjusted Gross Margin” as Non-GAAP Adjusted Gross Profit as a percentage of total revenue. Management considers these non-GAAP financial measures to be important indicators of our operational strength and performance of our business and a good measure of our historical operating trends. Moreover, management believes that these measures enable investors and financial analysts to closely monitor and understand changes in our ability to generate income from ongoing business operations.
Management defines “Non-GAAP Adjusted EBITDA” as the sum of GAAP net income (loss) before (benefit) from provision for income taxes, total other expense (income), stock-based compensation expense, depreciation and amortization, amortization of purchased intangible assets, integration and transaction costs, and restructuring costs and “Non-GAAP Adjusted EBITDA Margin” as Non-GAAP Adjusted EBITDA as a percentage of total revenue. Management defines “Non-GAAP Adjusted Operating Income” as the sum of GAAP net income (loss) before (benefit) from provision for income taxes, total other expense (income), stock-based compensation expense, amortization of capitalized stock-based compensation related to software development, amortization of purchased intangible assets, integration and transaction costs, and restructuring costs and “Non-GAAP Adjusted Operating Income Margin” as Non-GAAP Adjusted Operating Income as a percentage of total revenue. Management defines “Non-GAAP Adjusted Net Income” as the sum of GAAP net income (loss) before stock-based compensation expense, amortization of capitalized stock-based compensation related to software development, amortization of purchased intangible assets, integration and transaction costs, restructuring costs, and gain on sale of marketable securities and any tax impact related to these preceding items, and an adjustment to the tax provision for the non-GAAP tax rate and “Non-GAAP Adjusted Net Income per Diluted Share” as Non-GAAP Adjusted Net Income divided by weighted average diluted shares outstanding. Management considers all of these non-GAAP financial measures to be important indicators of our operational strength and performance of our business and a good measure of our historical operating trends, in particular the extent to which ongoing operations impact our overall financial performance.
23
Management excludes or adjusts each of the items identified below from the applicable non-GAAP financial measure referenced above for the reasons set forth with respect to that excluded item:
• | Stock-based compensation expense and amortization of capitalized stock-based compensation related to software development — excluded because these are non-cash expenditures that management does not consider part of ongoing operating results when assessing the performance of our business, and also because the total amount of the expenditure is partially outside of our control because it is based on factors such as stock price, volatility, and interest rates, which may be unrelated to our performance during the period in which the expenses are incurred. |
• | Amortization of purchased intangible assets — purchased intangible assets are amortized over their estimated useful lives and generally cannot be changed or influenced by management after the acquisition. Accordingly, this item is not considered by management in making operating decisions. Management does not believe such charges accurately reflect the performance of our ongoing operations for the period in which such charges are incurred. |
• | Integration and transaction costs — Integration costs are the severance payments and retention bonuses for certain employees relating to the Razor Insights, LLC acquisition. Transaction costs are non-recurring costs related to specific transactions. Accordingly, management believes that such expenses do not have a direct correlation to future business operations, and therefore, these costs are not considered by management in making operating decisions. Management does not believe such charges accurately reflect the performance of our ongoing operations for the period in which such charges are incurred. |
• | Restructuring costs — represents costs related to workforce reductions and to terminate certain lease agreements for strategic realignment purposes. Management does not believe such costs accurately reflect the performance of our ongoing operations for the period in which such costs are incurred. |
• | Gain on sale of marketable securities — represents gain on sale of marketable securities. Management does not believe such gains accurately reflect the performance of our ongoing operations for the period in which such gains are reported. |
• | Non-GAAP tax rate — We use a non-GAAP tax rate of 40% to normalize the tax impact to our Non-GAAP Adjusted Net Income per Diluted Share based on the fact that a relatively small change in pre-tax GAAP income (loss) in any one period could result in a volatile GAAP effective tax rate. |
24
Supplemental Metrics and Definitions
Fiscal Year 2014 | Fiscal Year 2015 | ||||||||||||||||||
Q1 | Q2 | Q3 | Q4 | Q1 | Q2 | Q3 | Q4 | ||||||||||||
Client Base | |||||||||||||||||||
Total Physicians on athenaCollector | 37,663 | 39,686 | 43,106 | 45,423 | 47,062 | 49,176 | 53,129 | 55,277 | |||||||||||
Total Providers on athenaCollector | 52,886 | 55,425 | 59,415 | 62,349 | 64,648 | 67,530 | 72,314 | 75,416 | |||||||||||
Total Physicians on athenaClinicals | 13,521 | 14,672 | 17,458 | 18,811 | 19,796 | 20,923 | 23,741 | 24,867 | |||||||||||
Total Providers on athenaClinicals | 18,343 | 19,733 | 23,053 | 24,804 | 26,166 | 27,641 | 31,071 | 32,684 | |||||||||||
Total Physicians on athenaCommunicator | 24,030 | 25,837 | 29,683 | 32,163 | 33,578 | 35,248 | 38,670 | 40,635 | |||||||||||
Total Providers on athenaCommunicator | 31,707 | 33,976 | 38,699 | 41,777 | 43,770 | 45,902 | 49,986 | 52,821 | |||||||||||
Client Performance | |||||||||||||||||||
Net Promoter Score | 44.7 | 41.2 | 47.5 | 42.0 | 42.3 | 40.5 | 39.9 | 40.3 | |||||||||||
Client Days in Accounts Receivable (“DAR”) | 41.1 | 39.0 | 39.2 | 38.8 | 41.1 | 40.8 | 40.7 | 40.1 | |||||||||||
First Pass Resolution (“FPR”) Rate | 93.5 | % | 93.7 | % | 93.7 | % | 94.3 | % | 93.7 | % | 94 | % | 93.8 | % | 94 | % | |||
Electronic Remittance Advice (“ERA”) Rate | 82.3 | % | 82.6 | % | 82.8 | % | 84.6 | % | 83.2 | % | 82.9 | % | 82.3 | % | 84.2 | % | |||
Total Claims Submitted | 25,785,710 | 28,177,665 | 29,169,062 | 32,864,269 | 32,809,734 | 35,002,061 | 35,826,192 | 40,191,950 | |||||||||||
Total Client Collections ($) | 3,172,115,234 | 3,679,375,661 | 3,843,394,756 | 4,263,271,914 | 4,110,989,781 | 4,633,427,941 | 4,803,761,899 | 5,281,307,644 | |||||||||||
Total Working Days | 61 | 64 | 64 | 62 | 61 | 64 | 64 | 62 | |||||||||||
Employees | |||||||||||||||||||
Direct | 1,573 | 1,633 | 1,698 | 1,797 | 1,914 | 2,123 | 2,285 | 2,296 | |||||||||||
Sales & Marketing | 509 | 556 | 569 | 582 | 602 | 649 | 666 | 668 | |||||||||||
Research & Development | 717 | 812 | 918 | 952 | 1,010 | 1,172 | 1,262 | 1,280 | |||||||||||
General & Administrative | 289 | 311 | 340 | 345 | 351 | 380 | 407 | 424 | |||||||||||
Total Employees | 3,088 | 3,312 | 3,525 | 3,677 | 3,877 | 4,324 | 4,619 | 4,668 | |||||||||||
Quota Carrying Sales Force | |||||||||||||||||||
Total Quota Carrying Sales Representatives | 133 | 140 | 142 | 153 | 150 | 151 | 161 | 163 | |||||||||||
Supplemental Metrics Definitions | |
Client Base | |
Total Physicians on athenaCollector | The number of physicians that have rendered a service which generated a medical claim that was billed during the last 91 days on the athenaCollector platform. Examples of physicians include Medical Doctors (“MDs”) and Doctors of Osteopathic Medicine (“DOs”). |
Total Providers on athenaCollector | The number of providers, including physicians, that have rendered a service which generated a medical claim that was billed during the last 91 days on the athenaCollector platform. Examples of non-physician providers are Nurse Practitioners (“NPs”) and Registered Nurses (“RNs”). |
Total Physicians on athenaClinicals | The number of physicians that have rendered a service through the athenaClinicals platform which generated a medical claim that was billed during the last 91 days on the athenaCollector platform. |
Total Providers on athenaClinicals | The number of providers, including physicians, that have rendered a service through the athenaClinicals platform which generated a medical claim that was billed during the last 91 days on the athenaCollector platform. |
Total Physicians on athenaCommunicator | The number of physicians that have rendered a service which generated a medical claim that was billed during the last 91 days on the athenaCollector platform and whose practice is actively using athenaCommunicator. |
Total Providers on athenaCommunicator | The number of providers, including physicians, that have rendered a service which generated a medical claim that was billed during the last 91 days on the athenaCollector platform and whose practice is actively using athenaCommunicator. |
Client Performance | |
Net Promoter Score | The percentage of clients who chose 9 or 10 (defined as promoters) less the percentage of clients who chose 0 through 6 ( defined as detractors) on a scale of 1 to 10 when asked if they would recommend athenahealth to a trusted friend or colleague. These responses are generated from a "client listening" survey that the Company conducts for its client base twice per year. |
Client Days in Accounts Receivable (“DAR”) | The average number of days that it takes outstanding balances on claims to be resolved, e.g. paid, for clients on athenaCollector. Clients that have been live less than 90 days are excluded, as well as clients who are terminating services. |
First Pass Resolution (“FPR”) Rate | Approximates the percentage of primary claims that are favorably adjudicated and closed after a single submission during the period. Currently, the FPR rate is calculated on a monthly basis, and certain practices are excluded (e.g. those that have been live for less than 90 days). |
Electronic Remittance Advice (“ERA”) Rate | Remittance refers to the information about payments (a/k/a explanations of benefits) received from insurance companies during the period. The ERA rate reflects the percentage of total charges that were posted using electronic remittance. |
Total Claims Submitted | The number of claims billed through athenaNet during the period. |
Total Client Collections | The dollar value of collections posted on behalf of clients during the period. |
Total Working Days | The total number of days during the quarter minus weekends and U.S. Post Office holidays. |
Employees | |
Direct | The total number of full time equivalent individuals (“FTEs”) employed by athenahealth to support its service operations as of quarter end. This team includes production systems, enrollment services, paper claim submission, claim resolution, clinical operations, professional services, account management, and client services. |
Selling & Marketing | The total number of FTEs employed by athenahealth to support its sales and marketing efforts as of quarter end. This team includes sales representatives, business development staff and the marketing team. |
Research & Development | The total number of FTEs employed by athenahealth to support its research and development efforts as of quarter end. This team includes product development and product management. |
General & Administrative | The total number of FTEs employed by athenahealth to support its general and administrative functions as of quarter end. This team includes finance, human resources, compliance, learning and development, internal audit, corporate technology, recruiting, facilities, and legal. |
Total Employees | The total number of FTEs employed by athenahealth as of quarter end. This number excludes interns and seasonal employees. |
Total Quota Carrying Sales Representatives | The total number of athenahealth-branded services sales representatives who carry quota for net new annual recurring revenue as of quarter end. |
Corporate Scorecard Metrics Definitions | |
Stability | |
Voluntary Turnover | A quarterly average of the number of voluntary terminations divided by starting headcount. Voluntary turnover excludes employees on action plans or employees on counseling out plans. |
Employee Engagement | Quarterly engagement survey results for employees.. Employee engagement results are reported in Q2 and Q4 only. |
Performance | |
Client Days in Accounts Receivable (“DAR”) | The average number of days that it takes outstanding balances on claims to be resolved, e.g. paid, for clients on athenaCollector. Clients that have been live less than 90 days are excluded, as well as clients who are terminating services. |
Closed-Loop Order Rate | The percent of orders that are tied within 90 days of order submission (Non-Rx) and the percent of Rx orders with notification that the prescription was received by the patient based on claim history or refill requests (Rx). |
Satisfaction | |
Net Promoter Score | Survey respondents from athenaOne survey (sample includes all clients live, surveyed on a bi-annual basis) are categorized as detractors (0-6 score for "likelihood to recommend"), passives (7-8), and promoters (9-10). The Net Promoter Score is calculated by subtracting the % of detractors from the % of promoters. |
Financial | |
Bookings | The annualized value of deals sold. |
Total Revenue | Total consolidated revenue. |
Non-GAAP Adjusted Operating Income | Total non-GAAP adjusted operating income. |
Serious News for Serious Traders! Try StreetInsider.com Premium Free!
You May Also Be Interested In
- TheraVet reports Full-Year 2023 Financial Results and Provides the Preparatory Documents for the General Meeting of June 6th, 2024
- Transaction in Own Shares
- Munters Group AB: Profitable growth and strong cash flow
Create E-mail Alert Related Categories
SEC FilingsSign up for StreetInsider Free!
Receive full access to all new and archived articles, unlimited portfolio tracking, e-mail alerts, custom newswires and RSS feeds - and more!
