

Form 8-K ANNALY CAPITAL MANAGEMEN For: Nov 02
 Tweet
Tweet Share
Share_________________________________________________
UNITED STATES
SECURITIES AND EXCHANGE COMMISSION
Washington, D.C. 20549
FORM 8-K
CURRENT REPORT
PURSUANT TO SECTION 13 OR 15(d) OF THE
SECURITIES EXCHANGE ACT OF 1934
Date of Report (Date of earliest event reported)
November 2, 2016
Annaly Capital Management, Inc.
(Exact Name of Registrant as Specified in its Charter)
|
Maryland
|
1-13447
|
22-3479661
|
|
State or Other Jurisdiction
Of Incorporation)
|
(Commission
File Number)
|
(I.R.S. Employer
Identification No.)
|
|
1211 Avenue of the Americas
New York, New York
|
10036 |
|
|
(Address of Principal
Executive Offices)
|
(Zip Code)
|
Registrant’s telephone number, including area code: (212) 696-0100
(Former Name or Former Address, if Changed Since Last Report)
Check the appropriate box below if the Form 8-K filing is intended to simultaneously satisfy the filing obligation of the registrant under any of the following provisions:
[ ] Written communications pursuant to Rule 425 under the Securities Act (17 CFR 230.425)
[ ] Soliciting material pursuant to Rule 14a-12 under the Exchange Act (17 CFR 240.14a-12)
[ ] Pre-commencement communications pursuant to Rule 14d-2(b) under the Exchange Act (17 CFR 240.14d-2(b))
[ ] Pre-commencement communications pursuant to Rule 13e-4(c) under the Exchange Act (17 CFR 240.13e-4(c))
Item 2.02. Results of Operations and Financial Condition
On November 2, 2016, the registrant issued a press release announcing its financial results for the quarter ended September 30, 2016. A copy of the press release is furnished as Exhibit 99.1 to this report. In addition, the registrant posted a financial summary on the Investors section of its website (www.annaly.com). A copy of the financial summary is furnished as Exhibit 99.2 to this report and incorporated herein by reference.
Item 9.01 Financial Statements and Exhibits
(d) Exhibits
99.1 Press Release, dated November 2, 2016, issued by Annaly Capital Management, Inc.
99.2 Third Quarter 2016 Financial Summary
SIGNATURES
Pursuant to the requirements of the Securities Exchange Act of 1934, the Registrant has duly caused this report to be signed on its behalf by the undersigned hereunto duly authorized.
| ANNALY CAPITAL MANAGEMENT, INC. | |||
|
|
By:
|
/s/ Glenn A. Votek | |
| Name: Glenn A. Votek | |||
| Title: Chief Financial Officer | |||
Dated: November 2, 2016
Exhibit 99.1
ANNALY CAPITAL MANAGEMENT, INC. REPORTS 3rd QUARTER 2016 RESULTS
|
●
|
GAAP net income of $730.9 million, $0.70 per average common share
|
|
●
|
Core earnings of $0.29 per average common share, unchanged from prior quarteri
|
|
●
|
Common stock book value per share of $11.83, up 3% from prior quarter
|
|
●
|
Economic leverage of 6.1:1, unchanged from prior quarter
|
|
●
|
Credit investment portfolio represents 22% of stockholders’ equity
|
|
●
|
Successfully integrated $1.5 billion acquisition of Hatteras Financial Corp.
|
NEW YORK--(BUSINESS WIRE)—November 2, 2016 -- Annaly Capital Management, Inc. (NYSE: NLY) (the “Company” or “Annaly”) today announced its financial results for the quarter ended September 30, 2016.
“Our diversified investment strategy has proven that we can provide stable, durable earnings while protecting and opportunistically growing our book value. We believe Annaly has a platform for predictable results, as evidenced again in this most recent quarter,” commented Kevin Keyes, Chief Executive Officer and President. “In this world of low and negative yields, our broad menu of complementary investment alternatives, coupled with a prudent and rigorous capital allocation process, allow us to provide our shareholders with dependable and attractive returns.”
“As we progress toward year end and 2017,” Mr. Keyes continued, “we believe the investment landscape in our core Agency strategy will remain favorable and our three credit businesses, which have reached efficient scale, are uniquely positioned to take advantage of market inefficiencies and dislocations resulting from the impact of regulation and structural market changes.”
Financial Performance
The following table summarizes certain key performance indicators as of and for the quarters ended September 30, 2016, June 30, 2016, and September 30, 2015:
|
For the quarters ended
|
||||||||||||
|
September 30, 2016
|
June 30, 2016
|
September 30, 2015
|
||||||||||
|
Book value per common share
|
|
$11.83
|
|
$11.50
|
|
$11.99
|
||||||
|
Economic leverage at period-end (1)
|
6.1:1
|
6.1:1
|
5.8:1
|
|||||||||
|
GAAP net income (loss) per common share
|
|
$0.70
|
|
$(0.32)
|
|
|
$(0.68)
|
|
||||
|
Core earnings per common share* (2)
|
|
$0.29
|
|
$0.29
|
|
$0.30
|
||||||
|
Annualized return (loss) on average equity
|
23.55%
|
|
(9.60%)
|
|
(20.18%)
|
|
||||||
|
Annualized core return on average equity*
|
10.09%
|
|
9.73%
|
|
9.67%
|
|
||||||
|
Net interest margin
|
1.40%
|
|
1.15%
|
|
1.27%
|
|
||||||
|
Core net interest margin* (3)
|
1.42%
|
|
1.54%
|
|
1.65%
|
|
||||||
|
Net interest spread
|
1.13%
|
|
0.80%
|
|
0.83%
|
|
||||||
|
Core net interest spread*
|
1.15%
|
|
1.27%
|
|
1.29%
|
|
||||||
|
Average yield on interest earning assets
|
2.70%
|
|
2.48%
|
|
2.48%
|
|
||||||
|
Core average yield on interest earning assets*
|
2.72%
|
|
2.95%
|
|
2.94%
|
|
||||||
|
*
|
Represents a non-GAAP financial measure. Please refer to the ‘Non-GAAP Financial Measures’ section for additional information.
|
|
|
(1)
|
Computed as the sum of recourse debt, TBA derivative notional outstanding and net forward purchases of investments divided by total equity. Recourse debt consists of repurchase agreements, other secured financing and Convertible Senior Notes. Securitized debt, participation sold and mortgages payable are non-recourse to the Company and are excluded from this measure.
|
|
|
(2)
|
Core earnings is defined as net income (loss) excluding gains or losses on disposals of investments and termination of interest rate swaps, unrealized gains or losses on interest rate swaps and investments measured at fair value through earnings, net gains and losses on trading assets, impairment losses, net income (loss) attributable to noncontrolling interest, the premium amortization adjustment resulting from the quarter-over-quarter change in estimated long-term CPR, corporate acquisition related expenses and certain other non-recurring gains or losses, and inclusive of dollar roll income (a component of Net gains (losses) on trading assets) and realized amortization of MSRs (a component of net unrealized gains (losses) on investments measured at fair value through earnings).
|
|
|
(3)
|
Represents the sum of the Company’s annualized economic core net interest income (exclusive of the premium amortization adjustment (referred to herein as “PAA”) and inclusive of interest expense on interest rate swaps used to hedge cost of funds) plus TBA dollar roll income (less interest expense on swaps used to hedge dollar roll transactions) divided by the sum of its average interest earning assets plus average outstanding TBA derivative balances. PAA excludes the component of premium amortization representing the quarter-over-quarter change in estimated long-term constant prepayment rates (“CPR”). Average interest earning assets reflects the average amortized cost of our investments during the period.
|
_______________________________________________________________
i Represents a non-GAAP financial measure. Please refer to the ‘Non-GAAP Financial Measures’ section for additional information.
1
GAAP Earnings
The Company reported GAAP net income for the quarter ended September 30, 2016 of $730.9 million, or $0.70 per average common share, compared to a GAAP net loss of ($278.5) million, or ($0.32) per average common share, for the quarter ended June 30, 2016, and a GAAP net loss of ($627.5) million, or ($0.68) per average common share, for the quarter ended September 30, 2015. The increase in GAAP net income (loss) for the quarter ended September 30, 2016 compared to the quarters ended June 30, 2016 and September 30, 2015 is primarily due to favorable changes in realized and unrealized gains (losses) on interest rate swaps, net gains (losses) on trading assets and net unrealized gains on investments measured at fair value through earnings, as well as incremental net interest income earned on the assets acquired as part of the Company’s acquisition of Hatteras Financial Corp. (“Hatteras”) and the resulting bargain purchase gain, offset by transaction expenses, during the quarter ended September 30, 2016.
Core Earnings
The Company periodically reviews its use of non-GAAP financial measures to ensure only those measures relied upon by the Company’s management in assessing the financial performance of the business are disclosed. This review also considers regulatory interpretations and guidance. The Company believes these non-GAAP financial measures are useful for management, investors, analysts, and other interested parties in evaluating the Company’s performance but should not be viewed in isolation and are not a substitute for financial measurements computed in accordance with GAAP. Please refer to the “Non-GAAP Financial Measures” section for additional information including Non-GAAP reconciliations to GAAP.
Core earnings for the quarter ended September 30, 2016 were $312.9 million, or $0.29 per average common share, compared to $282.2 million, or $0.29 per average common share, for the quarter ended June 30, 2016, and $300.7 million, or $0.30 per average common share, for the quarter ended September 30, 2015. Core earnings increased for the quarter ended September 30, 2016 compared to the quarter ended June 30, 2016 on higher net interest income earned on the assets acquired as part of the Hatteras acquisition and higher TBA dollar roll income, which were offset by higher interest expense on repurchase agreements. Core earnings per average share remained unchanged for the quarter ended September 30, 2016 when compared to the quarter ended June 30, 2016 due to the additional common shares issued in connection with the Hatteras acquisition. Core earnings increased during the quarter ended September 30, 2016 compared to the quarter ended September 30, 2015 due to higher net interest income earned on the assets acquired as part of the Hatteras acquisition and higher interest income from the Company’s commercial investment portfolio, partially offset by a reduction in TBA dollar roll income and higher borrowing costs during the quarter ended September 30, 2016.
Net Interest Margin, Net Interest Spread, and Book Value
Net interest margin for the quarters ended September 30, 2016, June 30, 2016, and September 30, 2015 was 1.40%, 1.15% and 1.27%, respectively. Core net interest margin for the quarters ended September 30, 2016, June 30, 2016, and September 30, 2015 was 1.42%, 1.54% and 1.65%, respectively. For the quarter ended September 30, 2016, the average yield on interest earning assets was 2.70% and the average cost of interest bearing liabilities, including interest expense on interest rate swaps used to hedge cost of funds, was 1.57%, which resulted in a net interest spread of 1.13%. The average yield on interest earning assets for the quarter ended September 30, 2016 increased when compared to the quarters ended June 30, 2016 and September 30, 2015 due to differences in premium amortization expense on Residential Investment Securities resulting from changes in long-term CPR estimates. The decline in our average cost of interest bearing liabilities for the quarter ended September 30, 2016 when compared to the quarters ended June 30, 2016 and September 30, 2015 is primarily attributable to a reduction in interest expense on swaps, partially offset by higher balances on repurchase agreements during the quarter ended September 30, 2016.
For the quarter ended September 30, 2016, the core average yield on interest earning assets was 2.72%, which resulted in a core net interest spread of 1.15%. The core average yield on interest earning assets for the quarter ended September 30, 2016 decreased when compared to the quarters ended June 30, 2016 and September 30, 2015 primarily due to lower weighted average coupons on Residential Investment Securities and higher weighted average premium amortization expense, exclusive of the PAA, on Residential Investment Securities during the quarter ended September 30 2016.
At September 30, 2016, June 30, 2016, and September 30, 2015, the Company had a common stock book value per share of $11.83, $11.50 and $11.99, respectively.
Asset Portfolio
Residential Investment Securities
Residential Investment Securities, which are comprised of Agency mortgage-backed securities, Agency debentures, credit risk transfer securities and Non-Agency mortgage-backed securities, totaled $75.6 billion at September 30, 2016, compared to $66.6 billion at June 30, 2016 and $67.0 billion at September 30, 2015. The Company’s Residential Investment Securities portfolio at September 30, 2016 was comprised of 81% fixed-rate assets with the remainder constituting adjustable or floating-rate investments.
The total net premium balance on Residential Investment Securities at September 30, 2016, June 30, 2016, and September 30, 2015, was $4.9 billion, $4.6 billion, and $4.8 billion, respectively. The weighted average amortized cost basis of the Company’s non interest-only Residential Investment Securities at September 30, 2016, June 30, 2016, and September 30, 2015, was 104.9%, 105.0% and 105.3%, respectively. The weighted average amortized cost basis of the Company’s interest-only Residential Investment Securities at September 30, 2016, June 30, 2016, and September 30, 2015, was 15.9%, 15.8%, and 16.1%, respectively. The weighted average experienced CPR on our Agency mortgage-backed securities for the quarters ended September 30, 2016, June 30, 2016, and September 30, 2015, was 15.9%, 12.7% and 11.5%, respectively. The weighted average projected long-term CPR on our Agency mortgage-backed securities at September 30, 2016, June 30, 2016, and September 30, 2015, was 14.4%, 13.0% and 9.2%, respectively. The net increase in long-term CPRs is a result of the addition to the overall portfolio of ARM securities from the Hatteras acquisition.
2
During the quarter ended September 30, 2016, the Company disposed of $3.8 billion of Residential Investment Securities, resulting in a net realized gain of $14.7 million. During the quarter ended June 30, 2016, the Company disposed of $1.8 billion of Residential Investment Securities, resulting in a net realized gain of $11.9 million. During the quarter ended September 30, 2015, the Company disposed of $3.7 billion of Residential Investment Securities, resulting in a net realized gain of $4.5 million.
Amortization
In accordance with GAAP, the Company amortizes or accretes premiums or discounts into interest income for its Agency mortgage-backed securities, excluding interest-only securities, considering estimates of future principal prepayment in the calculation of the effective yield because they are probable and the timing and amount of prepayments can be reasonably estimated. The Company recalculates the effective yield as differences between anticipated and actual prepayments occur. Using third-party model and market information to project future cash flows and expected remaining lives of securities, the effective interest rate determined for each security is applied as if it had been in place from the date of the security’s acquisition. The amortized cost of the investment is then adjusted to the amount that would have existed had the new effective yield been applied since the acquisition date. The adjustment to amortized cost is offset with a charge or credit to interest income. Changes in interest rates and other market factors will impact prepayment speed projections and the amount of premium amortization recognized in any given period. The Company’s GAAP metrics include the unadjusted impact of amortization and accretion associated with this method. The Company’s non-GAAP metrics exclude the effect of the PAA, which quantifies the component of premium amortization representing the cumulative effect of quarter-over-quarter changes in estimated long-term CPR.
The following table illustrates the impact of quarter-over-quarter adjustments to long-term CPR estimates on premium amortization expense for the quarters ended September 30, 2016, June 30, 2016, and September 30, 2015:
|
For the quarters ended
|
||||||||||||
|
September 30, 2016
|
June 30, 2016
|
September 30, 2015
|
||||||||||
|
(dollars in thousands)
|
||||||||||||
|
Premium amortization expense
|
$
|
213,241
|
$
|
265,475
|
$
|
255,123
|
||||||
|
Less: PAA cost (benefit)
|
3,891
|
85,583
|
83,136
|
|||||||||
|
Premium amortization expense exclusive of PAA
|
$
|
209,350
|
$
|
179,892
|
$
|
171,987
|
||||||
|
September 30, 2016
|
June 30, 2016
|
September 30, 2015
|
||||||||||
|
(per common share)
|
||||||||||||
|
Premium amortization expense
|
$
|
0.21
|
$
|
0.29
|
$
|
0.27
|
||||||
|
Less: PAA cost (benefit)
|
--
|
(1) |
0.10
|
0.09
|
||||||||
|
Premium amortization expense exclusive of PAA
|
$
|
0.21
|
$
|
0.19
|
$
|
0.18
|
||||||
|
(1)
|
Rounds to less than $0.01 per common share.
|
TBA Contracts
At September 30, 2016, the Company had outstanding $16.0 billion in notional balances of TBA derivative positions. Realized and unrealized gains (losses) on TBA derivatives are recorded in Net gains (losses) on trading assets in the Company’s Consolidated Statements of Comprehensive Income (Loss). The following table summarizes certain characteristics of the Company’s TBA derivatives at September 30, 2016:
|
TBA Purchase Contracts
|
Notional
|
Implied Cost Basis
|
Implied Market Value
|
Net Carrying Value
|
||||||||||||
|
(dollars in thousands)
|
||||||||||||||||
|
Purchase contracts
|
$
|
15,950,000
|
$
|
16,671,196
|
$
|
16,730,009
|
$
|
58,813
|
||||||||
Commercial Investments Portfolio
The Company’s commercial investments portfolio consists of commercial real estate debt and equity investments and corporate debt. Commercial real estate debt, which is comprised of preferred equity, AAA-rated commercial mortgage-backed securities, securitized loans of consolidated variable interest entities (“VIEs”) and loans held for sale totaled $5.5 billion at September 30, 2016 compared to $5.7 billion at June 30, 2016. Loans held for sale, net totaled $144.3 million at September 30, 2016, compared to $164.2 million at June 30, 2016. Investments in commercial real estate totaled $500.0 million at September 30, 2016, down slightly from $504.6 million at June 30, 2016. Corporate debt investments totaled $716.8 million as of September 30, 2016, up from $669.6 million at June 30, 2016. The weighted average levered return on commercial real estate debt and preferred equity, including loans held for sale, as of September 30, 2016, June 30, 2016, and September 30, 2015, was 8.26%, 8.25% and 7.36%, respectively. Excluding loans held for sale, the weighted average levered return on commercial real estate debt and preferred equity was 8.99%, 9.09% and 9.38% at September 30, 2016, June 30, 2016, and September 30, 2015, respectively. The weighted average levered returns on investments in commercial real estate equity as of September 30, 2016, June 30, 2016, and September 30, 2015, was 10.63%, 10.63% and 11.36%, respectively. The weighted average levered returns on investments in corporate debt as of September 30, 2016, June 30, 2016 and September 30, 2015, was 8.12%, 7.53% and 7.38% respectively.ii
_______________________________________________________________
ii June 30, 2016 and September 30, 2015 represent unlevered returns.
3
During the third quarter 2016, the Company provided additional funding on pre-existing commercial real estate debt commitments totaling $15.2 million with a weighted average coupon of 8.4%. During the third quarter 2016, the Company received cash from its commercial real estate investments of $167.9 million from loan sales (including loans held for sale), partial pay-downs, prepayments and maturities with a weighted average coupon of 4.23%.
At September 30, 2016, June 30, 2016, and September 30, 2015, residential and commercial and corporate credit assets (including loans held for sale) comprised 22%, 24% and 22% of stockholders’ equity, respectively.
Capital and Funding
Leverage
At September 30, 2016, total stockholders’ equity was $13.3 billion. Leverage at September 30, 2016, June 30, 2016, and September 30, 2015, was 5.3:1, 5.3:1 and 4.8:1, respectively. For purposes of calculating the Company’s leverage ratio, debt consists of repurchase agreements, other secured financing, Convertible Senior Notes, securitized debt, participation sold and mortgages payable. Securitized debt, participation sold and mortgages payable are non-recourse to the Company. Economic leverage, which excludes non-recourse debt and includes other forms of financing such as TBA dollar roll transactions, was 6.1:1 at September 30, 2016, compared to 6.1:1 at June 30, 2016, and 5.8:1 at September 30, 2015.
Capital Ratio and Return on Equity
At September 30, 2016, June 30, 2016, and September 30, 2015, the Company’s capital ratio, which represents the ratio of stockholders’ equity to total assets (inclusive of total market value of TBA derivatives and exclusive of consolidated VIEs associated with B Piece commercial mortgage-backed securities), was 13.3%, 13.2%, and 14.0%, respectively. On a GAAP basis, the Company produced an annualized return (loss) on average equity for the quarters ended September 30, 2016, June 30, 2016, and September 30, 2015, of 23.55%, (9.60%) and (20.18%), respectively. On a core earnings basis, the Company provided an annualized return on average equity for the quarters ended September 30, 2016, June 30, 2016, and September 30, 2015, of 10.09%, 9.73%, and 9.67%, respectively.
Funding
At September 30, 2016, June 30, 2016, and September 30, 2015, the Company had outstanding $61.8 billion, $53.9 billion, and $56.4 billion of repurchase agreements, with weighted average remaining maturities of 128 days, 129 days, and 147 days, and with weighted average borrowing rates of 1.71%, 1.81%, and 1.75%, after giving effect to the Company’s interest rate swaps used to hedge cost of funds, respectively. The weighted average rate on repurchase agreements during the quarters ended September 30, 2016, June 30, 2016, and September 30, 2015, was 0.97%, 1.00%, and 0.73%, respectively. Included in these balances is a $350 million repurchase agreement credit facility for the Commercial Real Estate business. As of September 30, 2016, outstanding borrowings under the facility totaled $295.1 million with a weighted average borrowing rate of 2.87%.
At September 30, 2016 and June 30, 2016, the Company had outstanding $3.6 billion of advances from the Federal Home Loan Bank of Des Moines, with weighted average remaining maturities of 1,552 days and 1,644 days, respectively, and with weighted average borrowing rates of 0.65% and 0.60%, respectively.
The following table presents the principal balance and weighted average rate of repurchase agreements and FHLB advances by maturity at September 30, 2016:
|
Maturity
|
Principal Balance
|
Weighted Average Rate
|
||||||
|
|
(dollars in thousands) | |||||||
|
Within 30 days
|
$
|
26,508,338
|
0.99
|
%
|
||||
|
30 to 59 days
|
5,200,350
|
0.86
|
%
|
|||||
|
60 to 89 days
|
6,173,598
|
0.85
|
%
|
|||||
|
90 to 119 days
|
5,309,103
|
0.79
|
%
|
|||||
|
Over 120 days(1)
|
22,181,058
|
1.27
|
%
|
|||||
|
Total
|
$
|
65,372,447
|
1.04
|
%
|
||||
|
(1)Approximately 16% of the total repurchase agreements and FHLB advances have a remaining maturity over 1 year. The combined weighted average days to maturity for repurchase agreements and FHLB advances was 206 days.
|
The Company has access to a $300 million credit facility for the Middle Market Lending business. As of September 30, 2016, outstanding borrowings under the facility totaled $212.2 million with a weighted average borrowing rate of 3.27%.
4
The following table presents the principal balance, weighted average rate and weighted average days to maturity on outstanding debt at September 30, 2016:
|
Weighted Average
|
||||||||||||
|
Principal Balance
|
Rate (3)
|
Days to Maturity (4)
|
||||||||||
|
(dollars in thousands)
|
||||||||||||
|
Repurchase agreements
|
$
|
61,784,121
|
0.97
|
%
|
128
|
|||||||
|
Other secured financing (1)
|
3,804,742
|
0.83
|
%
|
1,560
|
||||||||
|
Securitized debt of consolidated VIEs (2)
|
3,695,502
|
1.29
|
%
|
2,434
|
||||||||
|
Participation sold (2)
|
12,908
|
4.81
|
%
|
213
|
||||||||
|
Mortgages payable (2)
|
330,946
|
4.42
|
%
|
2,881
|
||||||||
| Total indebtedness | $ |
69,628,219
|
||||||||||
|
(1)
|
Comprised of advances from the Federal Home Loan Bank of Des Moines and other credit facilities.
|
|
(2)
|
Non-recourse to the Company.
|
|
(3)
|
Represents the quarterly average rate.
|
|
(4)
|
Determined based on estimated weighted-average lives of the underlying debt instruments. |
Hedge Portfolio
At September 30, 2016, the Company had outstanding interest rate swaps with a net notional amount of $25.2 billion. Changes in the unrealized gains or losses on the interest rate swaps are reflected in the Company’s Consolidated Statements of Comprehensive Income (Loss). The Company enters into interest rate swaps to mitigate the risk of rising interest rates that affect the Company’s cost of funds or its TBA dollar roll transactions. As of September 30, 2016, the swap portfolio had a weighted average pay rate of 2.25%, a weighted average receive rate of 0.88% and a weighted average maturity of 6.89 years. There were no forward starting swaps at September 30, 2016.
The following table summarizes certain characteristics of the Company’s interest rate swaps at September 30, 2016:
|
Maturity
|
Current Notional (1)
|
Weighted
Average Pay
Rate
|
Weighted
Average Receive
Rate
|
Weighted
Average Years
to Maturity
|
||||||||||||
|
|
(dollars in thousands) | |||||||||||||||
|
0 - 3 years
|
$
|
4,552,383
|
1.74
|
%
|
0.76
|
%
|
2.77
|
|||||||||
|
3 - 6 years
|
9,675,000
|
1.92
|
%
|
0.88
|
%
|
4.14
|
||||||||||
|
6 - 10 years
|
7,363,550
|
2.34
|
%
|
0.98
|
%
|
7.81
|
||||||||||
|
Greater than 10 years
|
3,634,400
|
3.70
|
%
|
0.67
|
%
|
18.62
|
||||||||||
|
Total / Weighted Average
|
$
|
25,225,333
|
2.25
|
%
|
0.88
|
%
|
6.89
|
|||||||||
| (1) |
There were no forward starting swaps.
|
At September 30, 2016, the Company had entered into interest rate swaptions with a net notional amount of $0.8 billion. Changes in the unrealized gains or losses on the interest rate swaptions are reflected in the Company’s Consolidated Statements of Comprehensive Income (Loss). The interest rate swaptions provide the Company with the option to enter into an interest rate swap agreement for a specified notional amount, duration, and pay and receive rates.
The following table summarizes certain characteristics of the Company’s interest rate swaptions at September 30, 2016:
|
Current Underlying Notional
|
Weighted Average Underlying Pay Rate
|
Weighted Average Underlying Receive Rate
|
Weighted Average Underlying Years to Maturity
|
Weighted Average Months to Expiration
|
||||||
|
(dollars in thousands)
|
||||||||||
|
Long
|
$
|
950,000
|
1.08%
|
|
3M LIBOR
|
2.24
|
2.77
|
|||
|
Short
|
$
|
(200,000
|
)
|
3M LIBOR
|
1.54%
|
|
10.25
|
2.77
|
||
5
The Company enters into U.S. Treasury and Eurodollar futures contracts to hedge a portion of its interest rate risk. The following table summarizes outstanding futures positions as of September 30, 2016:
|
Notional - Long Positions
|
Notional - Short Positions
|
Weighted Average Years to Maturity
|
||||||||||
|
(dollars in thousands)
|
||||||||||||
|
2-year swap equivalent Eurodollar contracts
|
$
|
-
|
$
|
(14,991,375
|
)
|
2.00
|
||||||
|
U.S. Treasury futures - 5 year
|
-
|
(1,247,200
|
)
|
4.42
|
||||||||
|
Total
|
$
|
-
|
$
|
(16,238,575
|
)
|
2.19
|
||||||
At September 30, 2016, June 30, 2016, and September 30, 2015, the Company’s hedge ratio was 52%, 49% and 57%, respectively. Our hedge ratio measures total notional balances of interest rate swaps, interest rate swaptions and futures relative to repurchase agreements, other secured financing and TBA notional outstanding.
Dividend Declarations
Common dividends declared for each of the quarters ended September 30, 2016, June 30, 2016, and September 30, 2015, were $0.30 per common share. The annualized dividend yield on the Company’s common stock for the quarter ended September 30, 2016, based on the September 30, 2016 closing price of $10.50, was 11.43%, compared to 10.84% for the quarter ended June 30, 2016, and 12.16% for the quarter ended September 30, 2015.
6
Key Metrics
The following table presents key metrics of the Company’s portfolio, liabilities and hedging positions, and performance as of and for the quarters ended September 30, 2016, June 30, 2016, and September 30, 2015:
|
For the quarters ended
|
||||||||||||
|
September 30, 2016
|
June 30, 2016
|
September 30, 2015
|
||||||||||
|
Portfolio Related Metrics:
|
||||||||||||
|
Fixed-rate Residential Investment Securities as a percentage of total
Residential Investment Securities
|
81%
|
|
92%
|
|
93%
|
|
||||||
|
Adjustable-rate and floating-rate Residential Investment Securities as a
percentage of total Residential Investment Securities
|
19%
|
|
8%
|
|
7%
|
|
||||||
|
Weighted average experienced CPR for the period
|
15.9%
|
|
12.7%
|
|
11.5%
|
|
||||||
|
Weighted average projected long-term CPR at period end
|
14.4%
|
|
13.0%
|
|
9.2%
|
|
||||||
|
Weighted average levered return on commercial real estate debt and preferred
equity at period-end (1)
|
8.26%
|
|
8.25%
|
|
7.36%
|
|
||||||
|
Weighted average levered return on investments in commercial real estate
equity at period-end
|
10.63%
|
|
10.63%
|
|
11.36%
|
|
||||||
|
Liabilities and Hedging Metrics:
|
||||||||||||
|
Weighted average days to maturity on repurchase agreements outstanding at period-end
|
128
|
129
|
147
|
|||||||||
|
Hedge ratio (2)
|
52%
|
|
49%
|
|
57%
|
|
||||||
|
Weighted average pay rate on interest rate swaps at period-end (3)
|
2.25%
|
|
2.28%
|
|
2.26%
|
|
||||||
|
Weighted average receive rate on interest rate swaps at period-end (3)
|
0.88%
|
|
0.74%
|
|
0.42%
|
|
||||||
|
Weighted average net rate on interest rate swaps at period-end (3)
|
1.37%
|
|
1.54%
|
|
1.84%
|
|
||||||
|
Leverage at period-end (4)
|
5.3:1
|
5.3:1
|
4.8:1
|
|||||||||
|
Economic leverage at period-end (5)
|
6.1:1
|
6.1:1
|
5.8:1
|
|||||||||
|
Capital ratio at period-end
|
13.3%
|
|
13.2%
|
|
14.0%
|
|
||||||
|
Performance Related Metrics:
|
||||||||||||
|
Book value per common share
|
|
$11.83
|
|
$11.50
|
|
$11.99
|
||||||
|
GAAP net income (loss) per common share
|
|
$0.70
|
|
$(0.32)
|
|
|
$(0.68)
|
|
||||
|
Core earnings per common share*
|
|
$0.29
|
|
$0.29
|
|
$0.30
|
||||||
|
Annualized return (loss) on average equity
|
23.55%
|
|
(9.60%)
|
|
(20.18%)
|
|
||||||
|
Annualized core return on average equity*
|
10.09%
|
|
9.73%
|
|
9.67%
|
|
||||||
|
Net interest margin
|
1.40%
|
|
1.15%
|
|
1.27%
|
|
||||||
|
Core net interest margin*
|
1.42%
|
|
1.54%
|
|
1.65%
|
|
||||||
|
Average yield on interest earning assets (6)
|
2.70%
|
|
2.48%
|
|
2.48%
|
|
||||||
|
Core average yield on interest earning assets *(6)
|
2.72%
|
|
2.95%
|
|
2.94%
|
|
||||||
|
Average cost of interest bearing liabilities (7)
|
1.57%
|
|
1.68%
|
|
1.65%
|
|
||||||
|
Net interest spread
|
1.13%
|
|
0.80%
|
|
0.83%
|
|
||||||
|
Core net interest spread*
|
1.15%
|
|
1.27%
|
|
1.29%
|
|
||||||
|
*
|
Represents a non-GAAP financial measure. Please refer to the ‘Non-GAAP Financial Measures’ section for additional information.
|
|
(1)
|
Includes loans held for sale. Excluding loans held for sale, the weighted average levered return on commercial real estate debt and preferred equity was 8.99%, 9.09% and 9.38% at September 30, 2016, June 30, 2016, and September 30, 2015, respectively.
|
|
(2)
|
Measures total notional balances of interest rate swaps, interest rate swaptions and futures relative to repurchase agreements, other secured financing and TBA notional outstanding.
|
|
(3)
|
Excludes forward starting swaps.
|
|
(4)
|
Debt consists of repurchase agreements, other secured financing, Convertible Senior Notes, securitized debt, participation sold and mortgages payable. Securitized debt, participation sold and mortgages payable are non-recourse to the Company.
|
|
(5)
|
Computed as the sum of recourse debt, TBA derivative notional outstanding and net forward purchases of investments divided by total equity.
|
|
(6)
|
Average interest earning assets reflects the average amortized cost of our investments during the period.
|
|
(7)
|
Includes interest expense on interest rate swaps used to hedge cost of funds.
|
7
Other Information
This news release and our public documents to which we refer contain or incorporate by reference certain forward-looking statements which are based on various assumptions (some of which are beyond our control) and may be identified by reference to a future period or periods or by the use of forward-looking terminology, such as "may," "will," "believe," "expect," "anticipate," "continue," or similar terms or variations on those terms or the negative of those terms. Actual results could differ materially from those set forth in forward-looking statements due to a variety of factors, including, but not limited to, changes in interest rates; changes in the yield curve; changes in prepayment rates; the availability of mortgage-backed securities and other securities for purchase; the availability of financing and, if available, the terms of any financings; changes in the market value of our assets; changes in business conditions and the general economy; our ability to grow our commercial business; our ability to grow our residential mortgage credit business; credit risks related to our investments in credit risk transfer securities, residential mortgage-backed securities and related residential mortgage credit assets, commercial real estate assets and corporate debt; risks related to investments in mortgage servicing rights and ownership of a servicer; any potential business disruption following the acquisition of Hatteras; our ability to consummate any contemplated investment opportunities; changes in government regulations affecting our business; our ability to maintain our qualification as a REIT; and our ability to maintain our exemption from registration under the Investment Company Act of 1940, as amended. For a discussion of the risks and uncertainties which could cause actual results to differ from those contained in the forward-looking statements, see "Risk Factors" in our most recent Annual Report on Form 10-K and any subsequent Quarterly Reports on Form 10-Q. We do not undertake, and specifically disclaim any obligation, to publicly release the result of any revisions which may be made to any forward-looking statements to reflect the occurrence of anticipated or unanticipated events or circumstances after the date of such statements, except as required by law.
Annaly’s principal business objectives are to generate net income for distribution to its shareholders from its investments and capital preservation. Annaly is a Maryland corporation that has elected to be taxed as a real estate investment trust (“REIT”). Annaly is managed and advised by Annaly Management Company LLC.
The Company prepares a supplemental investor presentation and a financial summary for the benefit of its shareholders. Both the Third Quarter 2016 Investor Presentation and the Third Quarter 2016 Financial Summary can be found at the Company’s website (www.annaly.com) in the Investors section under Investor Presentations.
Conference Call
The Company will hold the third quarter 2016 earnings conference call on November 3, 2016 at 10:00 a.m. Eastern Time. The number to call is 888-317-6003 for domestic calls and 412-317-6061 for international calls. The conference passcode is 2832295. There will also be an audio webcast of the call on www.annaly.com. The replay of the call is available for one week following the conference call. The replay number is 877-344-7529 for domestic calls and 412-317-0088 for international calls and the conference passcode is 10095019. If you would like to be added to the e-mail distribution list, please visit www.annaly.com, click on Investors, then select Email Alerts and complete the email notification form.
8
|
ANNALY CAPITAL MANAGEMENT, INC. AND SUBSIDIARIES
|
||||||||||||||||||||
|
CONSOLIDATED STATEMENTS OF FINANCIAL CONDITION
|
||||||||||||||||||||
|
(dollars in thousands, except per share data)
|
||||||||||||||||||||
|
For the quarters ended
|
||||||||||||||||||||
|
September 30,
|
June 30,
|
March 31,
|
December 31,
|
September 30,
|
||||||||||||||||
|
2016
|
2016
|
2016
|
2015(1)
|
2015
|
||||||||||||||||
|
(Unaudited)
|
(Unaudited)
|
(Unaudited)
|
(Unaudited)
|
|||||||||||||||||
|
ASSETS
|
||||||||||||||||||||
|
Cash and cash equivalents
|
$
|
2,382,188
|
$
|
2,735,250
|
$
|
2,416,136
|
$
|
1,769,258
|
$
|
2,237,423
|
||||||||||
|
Investments, at fair value:
|
||||||||||||||||||||
|
Agency mortgage-backed securities
|
73,476,105
|
64,862,992
|
65,439,824
|
65,718,224
|
65,806,640
|
|||||||||||||||
|
Agency debentures
|
-
|
-
|
157,035
|
152,038
|
413,115
|
|||||||||||||||
|
Credit risk transfer securities
|
669,295
|
520,321
|
501,167
|
456,510
|
330,727
|
|||||||||||||||
|
Non-Agency mortgage-backed securities
|
1,460,261
|
1,197,549
|
1,157,507
|
906,722
|
490,037
|
|||||||||||||||
|
Residential mortgage loans (2)
|
310,148
|
-
|
-
|
-
|
-
|
|||||||||||||||
|
Mortgage servicing rights
|
492,169
|
-
|
-
|
-
|
-
|
|||||||||||||||
|
Commercial real estate debt investments (3)
|
4,319,077
|
4,361,972
|
4,401,725
|
2,911,828
|
2,881,659
|
|||||||||||||||
|
Commercial real estate debt and preferred equity, held for investment (4)
|
1,070,197
|
1,137,971
|
1,177,468
|
1,348,817
|
1,316,595
|
|||||||||||||||
|
Commercial loans held for sale, net
|
144,275
|
164,175
|
278,600
|
278,600
|
476,550
|
|||||||||||||||
|
Investments in commercial real estate
|
500,027
|
504,605
|
527,786
|
535,946
|
301,447
|
|||||||||||||||
|
Corporate debt
|
716,831
|
669,612
|
639,481
|
488,508
|
424,974
|
|||||||||||||||
|
Interest rate swaps, at fair value
|
113,253
|
146,285
|
93,312
|
19,642
|
39,295
|
|||||||||||||||
|
Other derivatives, at fair value
|
87,921
|
137,490
|
77,449
|
22,066
|
87,516
|
|||||||||||||||
|
Receivable for investments sold
|
493,839
|
697,943
|
2,220
|
121,625
|
127,571
|
|||||||||||||||
|
Accrued interest and dividends receivable
|
260,583
|
227,225
|
232,180
|
231,336
|
228,169
|
|||||||||||||||
|
Receivable for investment advisory income
|
-
|
-
|
-
|
-
|
3,992
|
|||||||||||||||
|
Other assets
|
301,419
|
237,959
|
234,407
|
119,422
|
67,738
|
|||||||||||||||
|
Goodwill
|
71,815
|
71,815
|
71,815
|
71,815
|
71,815
|
|||||||||||||||
|
Intangible assets, net
|
39,903
|
43,306
|
35,853
|
38,536
|
33,424
|
|||||||||||||||
|
Total assets
|
$
|
86,909,306
|
$
|
77,716,470
|
$
|
77,443,965
|
$
|
75,190,893
|
$
|
75,338,687
|
||||||||||
|
LIABILITIES AND STOCKHOLDERS’ EQUITY
|
||||||||||||||||||||
|
Liabilities:
|
||||||||||||||||||||
|
Repurchase agreements
|
$
|
61,784,121
|
$
|
53,868,385
|
$
|
54,448,141
|
$
|
56,230,860
|
$
|
56,449,364
|
||||||||||
|
Other secured financing
|
3,804,742
|
3,588,326
|
3,588,326
|
1,845,048
|
359,970
|
|||||||||||||||
|
Securitized debt of consolidated VIEs (5)
|
3,712,821
|
3,748,289
|
3,802,682
|
2,540,711
|
2,553,398
|
|||||||||||||||
|
Participation sold
|
12,976
|
13,079
|
13,182
|
13,286
|
13,389
|
|||||||||||||||
|
Mortgages payable
|
327,632
|
327,643
|
334,765
|
334,707
|
166,697
|
|||||||||||||||
|
Interest rate swaps, at fair value
|
2,919,492
|
3,208,986
|
2,782,961
|
1,677,571
|
2,160,350
|
|||||||||||||||
|
Other derivatives, at fair value
|
73,445
|
154,017
|
69,171
|
49,963
|
113,626
|
|||||||||||||||
|
Dividends payable
|
269,111
|
277,479
|
277,456
|
280,779
|
284,348
|
|||||||||||||||
|
Payable for investments purchased
|
454,237
|
746,090
|
250,612
|
107,115
|
744,378
|
|||||||||||||||
|
Accrued interest payable
|
173,320
|
159,435
|
163,983
|
151,843
|
145,554
|
|||||||||||||||
|
Accounts payable and other liabilities
|
115,606
|
62,868
|
54,679
|
53,088
|
63,280
|
|||||||||||||||
|
Total liabilities
|
73,647,503
|
66,154,597
|
65,785,958
|
63,284,971
|
63,054,354
|
|||||||||||||||
|
Stockholders’ Equity:
|
||||||||||||||||||||
|
7.875% Series A Cumulative Redeemable Preferred Stock:
7,412,500 authorized, issued and outstanding
|
177,088
|
177,088
|
177,088
|
177,088
|
177,088
|
|||||||||||||||
|
7.625% Series C Cumulative Redeemable Preferred Stock
12,650,000 authorized, 12,000,000 issued and outstanding
|
290,514
|
290,514
|
290,514
|
290,514
|
290,514
|
|||||||||||||||
|
7.50% Series D Cumulative Redeemable Preferred Stock:
18,400,000 authorized, issued and outstanding
|
445,457
|
445,457
|
445,457
|
445,457
|
445,457
|
|||||||||||||||
|
7.625% Series E Cumulative Redeemable Preferred Stock:
11,500,000 authorized, issued and outstanding
|
287,500
|
-
|
-
|
-
|
-
|
|||||||||||||||
|
Common stock, par value $0.01 per share, 1,945,437,500, 1,956,937,500, 1,956,937,500, 1,956,937,500 and 1,956,937,500 authorized, 1,018,857,866, 924,929,607, 924,853,133, 935,929,561 and 947,826,176 issued and outstanding, respectively
|
10,189
|
9,249
|
9,249
|
9,359
|
9,478
|
|||||||||||||||
|
Additional paid-in capital
|
15,578,677
|
14,575,426
|
14,573,760
|
14,675,768
|
14,789,320
|
|||||||||||||||
|
Accumulated other comprehensive income (loss)
|
1,119,677
|
1,117,046
|
640,366
|
(377,596
|
)
|
262,855
|
||||||||||||||
|
Accumulated deficit
|
(4,655,440
|
)
|
(5,061,565
|
)
|
(4,487,982
|
)
|
(3,324,616
|
)
|
(3,695,884
|
)
|
||||||||||
|
Total stockholders’ equity
|
13,253,662
|
11,553,215
|
11,648,452
|
11,895,974
|
12,278,828
|
|||||||||||||||
|
Noncontrolling interest
|
8,141
|
8,658
|
9,555
|
9,948
|
5,505
|
|||||||||||||||
|
Total equity
|
13,261,803
|
11,561,873
|
11,658,007
|
11,905,922
|
12,284,333
|
|||||||||||||||
|
Total liabilities and equity
|
$
|
86,909,306
|
$
|
77,716,470
|
$
|
77,443,965
|
$
|
75,190,893
|
$
|
75,338,687
|
||||||||||
|
(1)
|
Derived from the audited consolidated financial statements at December 31, 2015.
|
|
(2)
|
Includes securitized mortgage loans of a consolidated VIE carried at fair value of $176.7 million at September 30, 2016.
|
|
(3)
|
Includes senior securitized commercial mortgage loans of consolidated VIEs with a carrying value of $4.0 billion, $4.0 billion, $4.0 billion, $2.6 billion and $2.6 billion at September 30, 2016, June 30, 2016, March 31, 2016, December 31, 2015 and September 30, 2015, respectively.
|
|
(4)
|
Includes senior securitized commercial mortgage loans of consolidated VIE with a carrying value of $128.9 million, $187.2 million, $211.9 million, $262.7 million and $314.9 million at September 30, 2016, June 30, 2016, March 31, 2016, December 31, 2015 and September 30, 2015, respectively.
|
|
(5)
|
Includes securitized debt of consolidated VIEs carried at fair value of $3.7 billion, $3.7 billion, $3.7 billion, $2.4 billion and $2.4 billion at September 30, 2016, June 30, 2016, March 31, 2016, December 31, 2015 and September 30, 2015, respectively.
|
9
|
ANNALY CAPITAL MANAGEMENT, INC. AND SUBSIDIARIES
|
||||||||||||||||||||
|
CONSOLIDATED STATEMENTS OF COMPREHENSIVE INCOME (LOSS)
|
||||||||||||||||||||
|
(UNAUDITED)
|
||||||||||||||||||||
|
(dollars in thousands, except per share data)
|
||||||||||||||||||||
|
For the quarters ended
|
||||||||||||||||||||
|
September 30,
|
June 30,
|
March 31,
|
December 31,
|
September 30,
|
||||||||||||||||
|
2016
|
2016
|
2016
|
2015
|
2015
|
||||||||||||||||
|
Interest income
|
$
|
558,668
|
$
|
457,118
|
$
|
388,143
|
$
|
576,580
|
$
|
450,726
|
||||||||||
|
Interest expense
|
174,154
|
152,755
|
147,447
|
118,807
|
110,297
|
|||||||||||||||
|
Net interest income
|
384,514
|
304,363
|
240,696
|
457,773
|
340,429
|
|||||||||||||||
|
Realized and unrealized gains (losses):
|
||||||||||||||||||||
|
Realized gains (losses) on interest rate swaps(1)
|
(124,572
|
)
|
(130,762
|
)
|
(147,475
|
)
|
(159,487
|
)
|
(162,304
|
)
|
||||||||||
|
Realized gains (losses) on termination of interest rate swaps
|
1,337
|
(60,064
|
)
|
-
|
-
|
-
|
||||||||||||||
|
Unrealized gains (losses) on interest rate swaps
|
256,462
|
(373,220
|
)
|
(1,031,720
|
)
|
463,126
|
(822,585
|
)
|
||||||||||||
|
Subtotal
|
133,227
|
(564,046
|
)
|
(1,179,195
|
)
|
303,639
|
(984,889
|
)
|
||||||||||||
|
Net gains (losses) on disposal of investments
|
14,447
|
12,535
|
(1,675
|
)
|
(7,259
|
)
|
(7,943
|
)
|
||||||||||||
|
Net gains (losses) on trading assets
|
162,981
|
81,880
|
125,189
|
42,584
|
108,175
|
|||||||||||||||
|
Net unrealized gains (losses) on investments measured at fair value through earnings
|
29,675
|
(54,154
|
)
|
128
|
(62,703
|
)
|
(24,501
|
)
|
||||||||||||
|
Bargain purchase gain
|
72,576
|
-
|
-
|
-
|
-
|
|||||||||||||||
|
Subtotal
|
279,679
|
40,261
|
123,642
|
(27,378
|
)
|
75,731
|
||||||||||||||
|
Total realized and unrealized gains (losses)
|
412,906
|
(523,785
|
)
|
(1,055,553
|
)
|
276,261
|
(909,158
|
)
|
||||||||||||
|
Other income (loss):
|
||||||||||||||||||||
|
Investment advisory income
|
-
|
-
|
-
|
-
|
3,780
|
|||||||||||||||
|
Other income (loss)
|
29,271
|
(9,930
|
)
|
(6,115
|
)
|
(10,447
|
)
|
(13,455
|
)
|
|||||||||||
|
Total other income (loss)
|
29,271
|
(9,930
|
)
|
(6,115
|
)
|
(10,447
|
)
|
(9,675
|
)
|
|||||||||||
|
General and administrative expenses:
|
||||||||||||||||||||
|
Compensation and management fee
|
38,709
|
36,048
|
36,997
|
37,193
|
37,450
|
|||||||||||||||
|
Other general and administrative expenses
|
59,028
|
13,173
|
10,948
|
10,643
|
12,007
|
|||||||||||||||
|
Total general and administrative expenses
|
97,737
|
49,221
|
47,945
|
47,836
|
49,457
|
|||||||||||||||
|
Income (loss) before income taxes
|
728,954
|
(278,573
|
)
|
(868,917
|
)
|
675,751
|
(627,861
|
)
|
||||||||||||
|
Income taxes
|
(1,926
|
)
|
(76
|
)
|
(837
|
)
|
6,085
|
(370
|
)
|
|||||||||||
|
Net income (loss)
|
730,880
|
(278,497
|
)
|
(868,080
|
)
|
669,666
|
(627,491
|
)
|
||||||||||||
|
Net income (loss) attributable to noncontrolling interest
|
(336
|
)
|
(385
|
)
|
(162
|
)
|
(373
|
)
|
(197
|
)
|
||||||||||
|
Net income (loss) attributable to Annaly
|
731,216
|
(278,112
|
)
|
(867,918
|
)
|
670,039
|
(627,294
|
)
|
||||||||||||
|
Dividends on preferred stock
|
22,803
|
17,992
|
17,992
|
17,992
|
17,992
|
|||||||||||||||
|
Net income (loss) available (related) to common stockholders
|
$
|
708,413
|
$
|
(296,104
|
)
|
$
|
(885,910
|
)
|
$
|
652,047
|
$
|
(645,286
|
)
|
|||||||
|
Net income (loss) per share available (related) to common stockholders:
|
||||||||||||||||||||
|
Basic
|
$
|
0.70
|
$
|
(0.32
|
)
|
$
|
(0.96
|
)
|
$
|
0.69
|
$
|
(0.68
|
)
|
|||||||
|
Diluted
|
$
|
0.70
|
$
|
(0.32
|
)
|
$
|
(0.96
|
)
|
$
|
0.69
|
$
|
(0.68
|
)
|
|||||||
|
Weighted average number of common shares outstanding:
|
||||||||||||||||||||
|
Basic
|
1,007,607,893
|
924,887,316
|
926,813,588
|
945,072,058
|
947,795,500
|
|||||||||||||||
|
Diluted
|
1,007,963,406
|
924,887,316
|
926,813,588
|
945,326,098
|
947,795,500
|
|||||||||||||||
|
Net income (loss)
|
$
|
730,880
|
$
|
(278,497
|
)
|
$
|
(868,080
|
)
|
$
|
669,666
|
$
|
(627,491
|
)
|
|||||||
|
Other comprehensive income (loss):
|
||||||||||||||||||||
|
Unrealized gains (losses) on available-for-sale securities
|
18,237
|
483,930
|
1,017,707
|
(648,106
|
)
|
609,725
|
||||||||||||||
|
Reclassification adjustment for net (gains) losses included in net income (loss)
|
(15,606
|
)
|
(7,250
|
)
|
255
|
7,655
|
8,095
|
|||||||||||||
|
Other comprehensive income (loss)
|
2,631
|
476,680
|
1,017,962
|
(640,451
|
)
|
617,820
|
||||||||||||||
|
Comprehensive income (loss)
|
733,511
|
198,183
|
149,882
|
29,215
|
(9,671
|
)
|
||||||||||||||
|
Comprehensive income (loss) attributable to noncontrolling interest
|
(336
|
)
|
(385
|
)
|
(162
|
)
|
(373
|
)
|
(197
|
)
|
||||||||||
|
Comprehensive income (loss) attributable to Annaly
|
$
|
733,847
|
$
|
198,568
|
$
|
150,044
|
$
|
29,588
|
$
|
(9,474
|
)
|
|||||||||
|
(1)
|
Interest expense related to the Company’s interest rate swaps is recorded in Realized gains (losses) on interest rate swaps on the Consolidated Statements of Comprehensive Income.
|
10
|
ANNALY CAPITAL MANAGEMENT, INC. AND SUBSIDIARIES
|
||||||||
|
CONSOLIDATED STATEMENTS OF COMPREHENSIVE INCOME (LOSS)
|
||||||||
|
(UNAUDITED)
|
||||||||
|
(dollars in thousands, except per share data)
|
||||||||
|
For the nine months ended
|
||||||||
|
September 30,
|
September 30,
|
|||||||
|
2016
|
2015
|
|||||||
|
Net interest income:
|
||||||||
|
Interest income
|
$
|
1,403,929
|
$
|
1,594,117
|
||||
|
Interest expense
|
474,356
|
352,789
|
||||||
|
Net interest income
|
929,573
|
1,241,328
|
||||||
|
Realized and unrealized gains (losses):
|
||||||||
|
Realized gains (losses) on interest rate swaps(1)
|
(402,809
|
)
|
(465,008
|
)
|
||||
|
Realized gains (losses) on termination of interest rate swaps
|
(58,727
|
)
|
(226,462
|
)
|
||||
|
Unrealized gains (losses) on interest rate swaps
|
(1,148,478
|
)
|
(587,995
|
)
|
||||
|
Subtotal
|
(1,610,014
|
)
|
(1,279,465
|
)
|
||||
|
Net gains (losses) on disposal of investments
|
25,307
|
58,246
|
||||||
|
Net gains (losses) on trading assets
|
370,050
|
(12,961
|
)
|
|||||
|
Net unrealized gains (losses) on investments measured at fair value through earnings
|
(24,351
|
)
|
(40,466
|
)
|
||||
|
Bargain purchase gain
|
72,576
|
-
|
||||||
|
Impairment of goodwill
|
-
|
(22,966
|
)
|
|||||
|
Subtotal
|
443,582
|
(18,147
|
)
|
|||||
|
Total realized and unrealized gains (losses)
|
(1,166,432
|
)
|
(1,297,612
|
)
|
||||
|
Other income (loss):
|
||||||||
|
Investment advisory income
|
-
|
24,848
|
||||||
|
Dividend income from affiliate
|
-
|
8,636
|
||||||
|
Other income (loss)
|
13,226
|
(36,754
|
)
|
|||||
|
Total other income (loss)
|
13,226
|
(3,270
|
)
|
|||||
|
General and administrative expenses:
|
||||||||
|
Compensation and management fee
|
111,754
|
113,093
|
||||||
|
Other general and administrative expenses
|
83,149
|
39,311
|
||||||
|
Total general and administrative expenses
|
194,903
|
152,404
|
||||||
|
Income (loss) before income taxes
|
(418,536
|
)
|
(211,958
|
)
|
||||
|
Income taxes
|
(2,839
|
)
|
(8,039
|
)
|
||||
|
Net income (loss)
|
(415,697
|
)
|
(203,919
|
)
|
||||
|
Net income (loss) attributable to noncontrolling interest
|
(883
|
)
|
(436
|
)
|
||||
|
Net income (loss) attributable to Annaly
|
(414,814
|
)
|
(203,483
|
)
|
||||
|
Dividends on preferred stock
|
58,787
|
53,976
|
||||||
|
Net income (loss) available (related) to common stockholders
|
$
|
(473,601
|
)
|
$
|
(257,459
|
)
|
||
|
Net income (loss) per share available (related) to common stockholders:
|
||||||||
|
Basic
|
$
|
(0.50
|
)
|
$
|
(0.27
|
)
|
||
|
Diluted
|
$
|
(0.50
|
)
|
$
|
(0.27
|
)
|
||
|
Weighted average number of common shares outstanding:
|
||||||||
|
Basic
|
953,301,855
|
947,732,735
|
||||||
|
Diluted
|
953,301,855
|
947,732,735
|
||||||
|
Net income (loss)
|
$
|
(415,697
|
)
|
$
|
(203,919
|
)
|
||
|
Other comprehensive income (loss):
|
||||||||
|
Unrealized gains (losses) on available-for-sale securities
|
1,519,874
|
116,154
|
||||||
|
Reclassification adjustment for net (gains) losses included in net income (loss)
|
(22,601
|
)
|
(58,182
|
)
|
||||
|
Other comprehensive income (loss)
|
1,497,273
|
57,972
|
||||||
|
Comprehensive income (loss)
|
1,081,576
|
(145,947
|
)
|
|||||
|
Comprehensive income (loss) attributable to noncontrolling interest
|
(883
|
)
|
(436
|
)
|
||||
|
Comprehensive income (loss) attributable to Annaly
|
$
|
1,082,459
|
$
|
(145,511
|
)
|
|||
|
(1)
|
Interest expense related to the Company’s interest rate swaps is recorded in Realized gains (losses) on interest rate swaps on the Consolidated Statements of Comprehensive Income.
|
11
Non-GAAP Financial Measures
To supplement its consolidated financial statements, which are prepared and presented in accordance with U.S. generally accepted accounting principles (“GAAP”), the Company provides the following non-GAAP financial measures. These measures should not be considered a substitute for, or superior to, financial measures computed in accordance with GAAP.
|
●
|
Core earnings
|
● | Economic core net interest income; | ||
|
●
|
Core earnings per common share;
|
● | Core average yield on interest earning assets; | ||
|
●
|
Annualized core return on average equity;
|
● | Core net interest margin; and | ||
|
●
|
Core interest income;
|
● | Core net interest spread | ||
| ● | Economic interest expense; |
These non-GAAP measures provide additional detail to enhance investor understanding of the Company’s period-over-period operating performance and business trends, as well as for assessing the Company’s performance versus that of industry peers.
Additional information pertaining to the Company’s use of these non-GAAP financial measures, including discussion of how each such measure is useful to investors, and reconciliations to their most directly comparable GAAP results are provided below.
Core earnings, core earnings per common share and annualized core return on average equity
One of the Company’s principal business objectives is to generate net income by earning a net interest spread on its investment portfolio, which is a function of the Company’s interest income from its investment portfolio less financing, hedging and operating costs. Core earnings, which is comprised of interest income plus TBA dollar roll income,iii less financing and hedging costsiv and general and administrative expenses, is used by management to measure its progress in achieving this objective. Accordingly, core earnings, includes MSR amortization and excludes gains and losses on disposals of investments and termination of interest rate swaps, unrealized gains and losses on interest rate swaps and investments measured at fair value through earnings, net gains and losses on trading assets, impairment losses, net income (loss) attributable to noncontrolling interest, the premium amortization adjustment and certain non-recurring gains and losses. The Company believes these measures provide management and investors with additional details regarding the Company’s underlying operating results and investment portfolio trends by (i) making adjustments to account for the disparate reporting of changes in fair value where certain instruments are reflected in GAAP net income (loss) while others are reflected in other comprehensive income (loss), and (ii) by excluding certain unrealized, non-cash or episodic components of GAAP net income (loss) in order to provide additional transparency into the operating performance of the Company’s portfolio. Annualized core return on average equity, which is calculated by dividing core earnings over average stockholders’ equity, provides investors with additional detail on the core earnings generated by the Company’s invested equity capital.
The following table presents a reconciliation of GAAP financial results to non-GAAP core earnings for the periods presented.
|
For the quarters ended
|
||||||||||||
|
September 30, 2016
|
June 30, 2016
|
September 30, 2015
|
||||||||||
|
(dollars in thousands)
|
||||||||||||
|
GAAP net income (loss)
|
$
|
730,880
|
$
|
(278,497
|
)
|
$
|
(627,491
|
)
|
||||
|
Less:
|
||||||||||||
|
Realized (gains) losses on termination of interest rate swaps
|
(1,337
|
)
|
60,064
|
-
|
||||||||
|
Unrealized (gains) losses on interest rate swaps
|
(256,462
|
)
|
373,220
|
822,585
|
||||||||
|
Net (gains) losses on disposal of investments
|
(14,447
|
)
|
(12,535
|
)
|
7,943
|
|||||||
|
Net (gains) losses on trading assets
|
(162,981
|
)
|
(81,880
|
)
|
(108,175
|
)
|
||||||
|
Net unrealized (gains) losses on investments measured at fair value through earnings
|
(29,675
|
)
|
54,154
|
24,501
|
||||||||
|
Bargain purchase gain
|
(72,576
|
)
|
-
|
-
|
||||||||
|
Corporate acquisition related expenses (1)
|
46,724
|
2,163
|
-
|
|||||||||
|
Net (income) loss attributable to noncontrolling interest
|
336
|
385
|
197
|
|||||||||
|
Premium amortization adjustment cost (benefit)
|
3,891
|
85,583
|
83,136
|
|||||||||
|
Plus:
|
||||||||||||
|
TBA dollar roll income (2)
|
90,174
|
79,519
|
98,041
|
|||||||||
|
MSR amortization (3)
|
(21,634
|
)
|
-
|
-
|
||||||||
|
Core earnings*
|
$
|
312,893
|
$
|
282,176
|
$
|
300,737
|
||||||
|
GAAP net income (loss) per average common share
|
$
|
0.70
|
$
|
(0.32
|
)
|
$
|
(0.68
|
)
|
||||
|
Core earnings per average common share*
|
$
|
0.29
|
$
|
0.29
|
$
|
0.30
|
||||||
|
*
|
Represents a non-GAAP financial measure.
|
|
(1)
|
Represents non-recurring transaction costs incurred in connection with the Company’s acquisition of Hatteras.
|
|
(2)
|
Represents a component of Net gains (losses) on trading assets.
|
|
(3)
|
Represents the portion of changes in fair value that is attributable to the realization of estimated cash flows on the Company’s MSR portfolio and is reported as a component of Net unrealized gains (losses) on investments measured at fair value.
|
_______________________________________________________________
iii TBA dollar roll transactions are accounted for as derivatives, with gains and losses reflected as a component of Net gains (losses) on trading assets in the Company’s Consolidated Statements of Comprehensive Income (Loss). TBA dollar roll income represents the economic equivalent of interest income on the underlying security less the implied cost of financing.
iv The interest component of hedging costs are reported as realized gains (losses) on interest rate swaps in the Company’s Consolidated Statements of Comprehensive Income (Loss).
12
Core interest income, economic interest expense and economic core net interest income
Core interest income represents interest income excluding the effect of the premium amortization adjustment (“PAA”), and serves as the basis for deriving core average yield on interest bearing assets, core net interest spread and core net interest margin, which are discussed below. The Company believes this measure provides management and investors with additional detail to enhance their understanding of the Company’s operating results and trends by excluding the component of premium amortization expense representing the cumulative effect of quarter-over-quarter changes in estimated long-term prepayment speeds related to the Company’s Agency mortgage-backed securities (other than interest-only securities), which can obscure underlying trends in the performance of the portfolio.
Economic interest expense is comprised of interest expense, as computed in accordance with GAAP, plus interest expense on interest rate swaps used to hedge the cost of funds, which is a component of Realized gains (losses) on interest rate swaps in the Company’s Consolidated Statements of Comprehensive Income (Loss). The Company uses interest rate swaps to manage its exposure to changing interest rates on its repurchase agreements by economically hedging cash flows associated with these borrowings. Accordingly, adding the contractual interest payments on interest rate swaps to interest expense, as computed in accordance with GAAP, reflects the total contractual interest expense and thus, provides investors with additional information about the cost of our financing strategy.
Similarly, economic core net interest income, as computed below, provides investors with additional information to enhance their understanding of the net economics of our primary business operations.
|
For the quarters ended
|
||||||||||||
|
September 30, 2016
|
June 30, 2016
|
September 30, 2015
|
||||||||||
|
Core Interest Income Reconciliation
|
(dollars in thousands)
|
|||||||||||
|
GAAP interest income
|
$
|
558,668
|
$
|
457,118
|
$
|
450,726
|
||||||
|
Premium amortization adjustment
|
3,891
|
85,583
|
83,136
|
|||||||||
|
Core interest income*
|
$
|
562,559
|
$
|
542,701
|
$
|
533,862
|
||||||
|
Economic Interest Expense Reconciliation
|
||||||||||||
|
GAAP interest expense
|
$
|
174,154
|
$
|
152,755
|
$
|
110,297
|
||||||
|
Add:
|
||||||||||||
|
Interest expense on interest rate swaps used to hedge cost of funds
|
103,100
|
108,301
|
137,744
|
|||||||||
|
Economic interest expense*
|
$
|
277,254
|
$
|
261,056
|
$
|
248,041
|
||||||
|
Economic Core Net Interest Income Reconciliation
|
||||||||||||
|
Core interest income*
|
$
|
562,559
|
$
|
542,701
|
$
|
533,862
|
||||||
|
Less:
|
||||||||||||
|
Economic interest expense*
|
277,254
|
261,056
|
248,041
|
|||||||||
|
Economic core net interest income*
|
$
|
285,305
|
$
|
281,645
|
$
|
285,821
|
||||||
|
*
|
Represents a non-GAAP financial measure.
|
Core average yield on interest earnings assets, core net interest margin and core net interest spread
Core net interest spread, which is the difference between the core average yield on interest earning assets and the average cost of interest bearing liabilities, and core net interest margin, which is calculated by dividing the economic core net interest income by average interest earning assets, provide management with additional measures of the Company’s profitability that management relies upon in monitoring the performance of the business.
13
Disclosure of these measures, which are presented below, provides investors with additional detail regarding how management evaluates the Company’s performance.
|
For the quarters ended
|
||||||||||||
|
September 30, 2016
|
June 30, 2016
|
September 30, 2015
|
||||||||||
|
Economic Core Metrics
|
(dollars in thousands)
|
|||||||||||
|
Core interest income*
|
$
|
562,559
|
$
|
542,701
|
$
|
533,862
|
||||||
|
Average interest earning assets
|
$
|
82,695,270
|
$
|
73,587,753
|
$
|
72,633,314
|
||||||
|
Core average yield on interest earning assets*
|
2.72
|
%
|
2.95
|
%
|
2.94
|
%
|
||||||
|
Economic interest expense*
|
$
|
277,254
|
$
|
261,056
|
$
|
248,041
|
||||||
|
Average interest bearing liabilities
|
$
|
70,809,712
|
$
|
62,049,474
|
$
|
59,984,298
|
||||||
|
Average cost of interest bearing liabilities
|
1.57
|
%
|
1.68
|
%
|
1.65
|
%
|
||||||
|
Core net interest spread*
|
1.15
|
%
|
1.27
|
%
|
1.29
|
%
|
||||||
|
Core net interest margin*
|
1.42
|
%
|
1.54
|
%
|
1.65
|
%
|
||||||
|
*
|
Represents a non-GAAP financial measure.
|
14
Exhibit 99.2

November 2, 2016 Third Quarter 2016 Financial Summary

This presentation, other written or oral communications, and our public documents to which we refer contain or incorporate by reference certain forward-looking statements which are based on various assumptions (some of which are beyond our control) and may be identified by reference to a future period or periods or by the use of forward-looking terminology, such as “may,” “will,” “believe,” “expect,” “anticipate,” “continue,” or similar terms or variations on those terms or the negative of those terms. Actual results could differ materially from those set forth in forward-looking statements due to a variety of factors, including, but not limited to, changes in interest rates; changes in the yield curve; changes in prepayment rates; the availability of mortgage-backed securities (“MBS”) and other securities for purchase; the availability of financing and, if available, the terms of any financings; changes in the market value of our assets; changes in business conditions and the general economy; our ability to grow our commercial business; our ability to grow our residential mortgage credit business; credit risks related to our investments in credit risk transfer securities, residential mortgage-backed securities and related residential mortgage credit assets, commercial real estate assets and corporate debt; risks related to investments in mortgage servicing rights and ownership of a servicer; any potential business disruption following the acquisition of Hatteras Financial Corp.; our ability to consummate any contemplated investment opportunities; changes in government regulations affecting our business; our ability to maintain our qualification as a REIT; and our ability to maintain our exemption from registration under the Investment Company Act of 1940, as amended. For a discussion of the risks and uncertainties which could cause actual results to differ from those contained in the forward-looking statements, see “Risk Factors” in our most recent Annual Report on Form 10-K and any subsequent Quarterly Reports on Form 10-Q. We do not undertake, and specifically disclaim any obligation, to publicly release the result of any revisions which may be made to any forward-looking statements to reflect the occurrence of anticipated or unanticipated events or circumstances after the date of such statements, except as required by law.Non-GAAP Financial MeasuresThis presentation includes certain non-GAAP financial measures. The non-GAAP financial measures should not be viewed in isolation and are not a substitute for financial measures computed in accordance with GAAP. Please see the section entitled “Non-GAAP Reconciliations” in the attached Appendix for a reconciliation to the most directly comparable GAAP financial measures. A reconciliation of GAAP net income (loss) to non-GAAP core earnings is provided on page 7 of this financial summary. Safe Harbor Notice

Note: The endnotes for this page appear in the section entitled “Endnotes for Page 2” in the Appendix. Core earnings, core earnings per common share, annualized core return on average equity, core average yield on interest earning assets, core net interest margin and core net interest spread represent non-GAAP measures. This presentation also includes additional non-GAAP measures, including core interest income, economic interest expense and economic core net interest income. See the section entitled “Non-GAAP Reconciliations” in the Appendix for a reconciliation of non-GAAP financial measures to the most directly comparable GAAP financial measures. A reconciliation of GAAP net income (loss) to non-GAAP core earnings is provided on page 7 of this financial summary. 3Q 2016 Financial Snapshot Unaudited, dollars in thousands except per share amounts

Unaudited, dollars in thousands Last Five Quarters Summary Data Includes consolidated variable interest entities (“VIEs”) and loans held for sale.The current quarter change in constant prepayment rate (“CPR”) measures also reflects the change in portfolio mix due to the Company’s acquisition of Hatteras Financial Corp (The “Hatteras Acquisition”). For the quarters ended September 30, June 30, March 31, December 31, September 30, 2016 2016 2016 2015 2015 Portfolio-Related Data: Agency mortgage-backed securities and debentures $73,476,105 $64,862,992 $65,596,859 $65,870,262 $66,219,755 Mortgage servicing rights $492,169 - - - - Residential credit portfolio $2,439,704 $1,717,870 $1,658,674 $1,363,232 $820,764 Commercial real estate investments (1) $6,033,576 $6,168,723 $6,385,579 $5,075,191 $4,976,251 Corporate debt $716,831 $669,612 $639,481 $488,508 $424,974 Total Residential Investment Securities and commercial investment portfolio $83,158,385 $73,419,197 $74,280,593 $72,797,193 $72,441,744 Total assets $86,909,306 $77,716,470 $77,443,965 $75,190,893 $75,338,687 Average TBA position $17,280,237 $14,592,236 $15,110,947 $14,366,749 $14,210,373 Residential investment securities: % Fixed-rate 81% 92% 93% 93% 93% % Adjustable-rate 19% 8% 7% 7% 7% Weighted average experienced CPR, for the period (2) 15.9% 12.7% 8.8% 9.7% 11.5% Weighted average projected long-term CPR, as of period end (2) 14.4% 13.0% 11.8% 8.8% 9.2% Net premium and discount balance in Residential Investment Securities $4,920,750 $4,626,548 $4,741,900 $4,951,252 $4,827,791 Net premium and discount balance as % of stockholders' equity 37.13% 40.05% 40.71% 41.62% 39.32%

Unaudited, dollars in thousands except per share amounts Last Five Quarters Summary Data (cont’d) Consists of common stock, additional paid in capital, accumulated other comprehensive income (loss) and accumulated deficit.Measures total notional balances of interest rate swaps, interest rate swaptions and futures relative to repurchase agreements and to be announced (“TBA”) notional outstanding.Excludes forward starting swaps; weighted average fixed rate on forward starting pay fixed swaps was 1.44% and 2.04% as of December 31, 2015 and September 30, 2015, respectively; weighted average fixed rate on forward starting receive fixed swaps was 1.38% as of June 30, 2016. There were no forward starting swaps as of September 30, 2016 or March 31, 2016. For the quarters ended September 30, June 30, March 31, December 31, September 30, 2016 2016 2016 2015 2015 Liabilities, Capital and Hedging Data: Repurchase agreements $61,784,121 $53,868,385 $54,448,141 $56,230,860 $56,449,364 Other secured financing $3,804,742 $3,588,326 $3,588,326 $1,845,048 $359,970 Securitized debt of consolidated VIEs $3,712,821 $3,748,289 $3,802,682 $2,540,711 $2,553,398 Participation sold $12,976 $13,079 $13,182 $13,286 $13,389 Mortgages payable $327,632 $327,643 $334,765 $334,707 $166,697 Total debt $69,642,292 $61,545,722 $62,187,096 $60,964,612 $59,542,818 Total liabilities $73,647,503 $66,154,597 $65,785,958 $63,284,971 $63,054,354 Cumulative redeemable preferred stock $1,200,559 $913,059 $913,059 $913,059 $913,059 Common equity(1) $12,053,103 $10,640,156 $10,735,393 $10,982,915 $11,365,769 Total Annaly stockholders' equity $13,253,662 $11,553,215 $11,648,452 $11,895,974 $12,278,828 Non-controlling interests $8,141 $8,658 $9,555 $9,948 $5,505 Total equity $13,261,803 $11,561,873 $11,658,007 $11,905,922 $12,284,333 Weighted average days to maturity of repurchase agreements 128 129 136 151 147 Weighted average rate on repurchase agreements, at period end 1.07% 1.02% 0.99% 0.90% 0.78% Weighted average rate on repurchase agreements, average during period 0.97% 1.00% 0.95% 0.78% 0.73% Leverage, at period end 5.3x 5.3x 5.3x 5.1x 4.8x Economic leverage, at period end 6.1x 6.1x 6.2x 6.0x 5.8x Capital ratio 13.3% 13.2% 13.2% 13.7% 14.0% Common stock book value per share $11.83 $11.50 $11.61 $11.73 $11.99 Total common stock shares outstanding 1,018,858 924,930 924,853 935,930 947,826 Interest rate swaps: Hedge ratio(2) 52% 49% 51% 55% 57% Weighted average pay rate on interest rate swaps(3) 2.25% 2.28% 2.26% 2.26% 2.26% Weighted average receive rate on interest rate swaps(3) 0.88% 0.74% 0.69% 0.53% 0.42% Weighted average net rate on interest rate swaps 1.37% 1.54% 1.57% 1.73% 1.84%

Unaudited, dollars in thousands except per share amounts Last Five Quarters Summary Data (cont’d) Includes interest expense on interest rate swaps used to hedge cost of funds. Excludes interest expense on interest rate swaps used to hedge TBA dollar rolls. For the quarters ended September 30, June 30, March 31, December 31, September 30, 2016 2016 2016 2015 2015 Performance-Related Data: Total interest income $558,668 $457,118 $388,143 $576,580 $450,726 Total interest expense $174,154 $152,755 $147,447 $118,807 $110,297 Net interest income $384,514 $304,363 $240,696 $457,773 $340,429 Total core interest income $562,559 $542,701 $556,551 $558,508 $533,862 Total economic interest expense (1) $277,254 $261,056 $270,571 $254,074 $248,041 Economic core net interest income (1) $285,305 $281,645 $285,980 $304,434 $285,821 GAAP net income (loss) $730,880 ($278,497) ($868,080) $669,666 ($627,491) GAAP net income (loss) available (related) to common shareholders $708,413 ($296,104) ($885,910) $652,047 ($645,286) GAAP earnings per common share $0.70 ($0.32) ($0.96) $0.69 ($0.68) Core earnings $312,893 $282,176 $291,757 $311,133 $300,737 Core earnings available to common shareholders $290,090 $264,184 $273,765 $293,141 $282,745 Core earnings per average common share $0.29 $0.29 $0.30 $0.31 $0.30 Dividends declared per common share $0.30 $0.30 $0.30 $0.30 $0.30 Total common and preferred dividends declared $325,091 $295,471 $295,448 $298,771 $302,340 Annualized return on average equity 23.55% (9.60%) (29.47%) 22.15% (20.18%) Annualized return on average equity per unit of economic leverage 3.86% (1.57%) (4.75%) 3.69% (3.48%) Annualized core return on average equity 10.09% 9.73% 9.91% 10.30% 9.67% Annualized core return on average equity per unit of economic leverage 1.65% 1.60% 1.60% 1.72% 1.67% Net interest margin 1.40% 1.15% 0.79% 1.80% 1.27% Core net interest margin 1.42% 1.54% 1.54% 1.71% 1.65% Average yield on interest earning assets 2.70% 2.48% 2.09% 3.15% 2.48% Core average yield on interest earning assets 2.72% 2.95% 3.00% 3.05% 2.94% Average cost of interest bearing liabilities 1.57% 1.68% 1.73% 1.68% 1.65% Net interest spread 1.13% 0.80% 0.36% 1.47% 0.83% Core net interest spread 1.15% 1.27% 1.27% 1.37% 1.29%
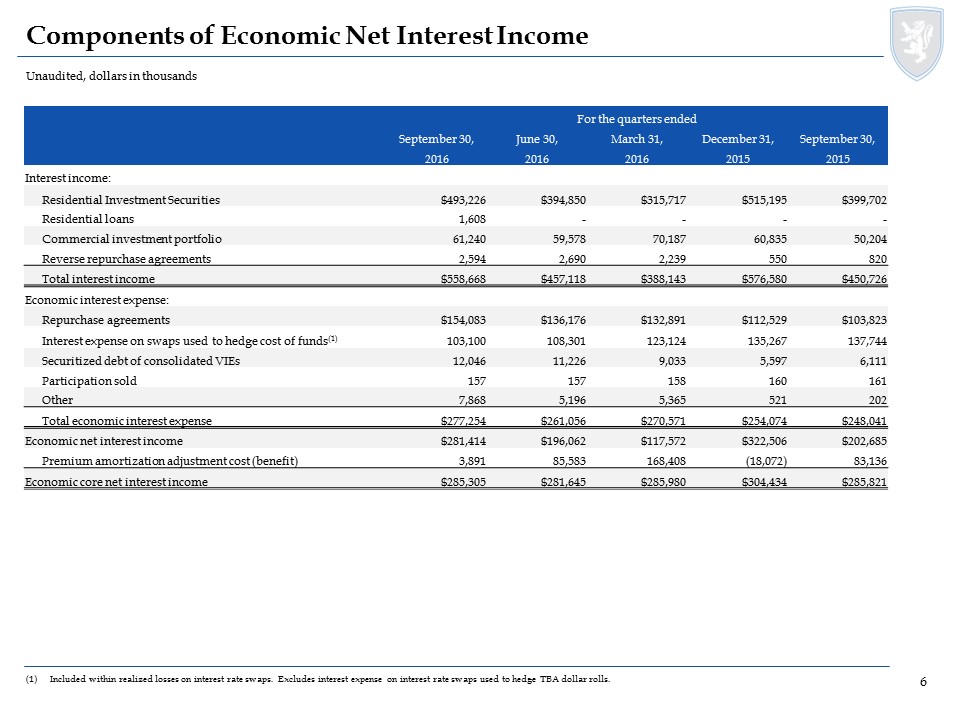
Unaudited, dollars in thousands Components of Economic Net Interest Income Included within realized losses on interest rate swaps. Excludes interest expense on interest rate swaps used to hedge TBA dollar rolls. For the quarters ended September 30, June 30, March 31, December 31, September 30, 2016 2016 2016 2015 2015 Interest income: Residential Investment Securities $493,226 $394,850 $315,717 $515,195 $399,702 Residential loans 1,608 - - - - Commercial investment portfolio 61,240 59,578 70,187 60,835 50,204 Reverse repurchase agreements 2,594 2,690 2,239 550 820 Total interest income $558,668 $457,118 $388,143 $576,580 $450,726 Economic interest expense: Repurchase agreements $154,083 $136,176 $132,891 $112,529 $103,823 Interest expense on swaps used to hedge cost of funds(1) 103,100 108,301 123,124 135,267 137,744 Securitized debt of consolidated VIEs 12,046 11,226 9,033 5,597 6,111 Participation sold 157 157 158 160 161 Other 7,868 5,196 5,365 521 202 Total economic interest expense $277,254 $261,056 $270,571 $254,074 $248,041 Economic net interest income $281,414 $196,062 $117,572 $322,506 $202,685 Premium amortization adjustment cost (benefit) 3,891 85,583 168,408 (18,072) 83,136 Economic core net interest income $285,305 $281,645 $285,980 $304,434 $285,821

Unaudited, dollars in thousands Reconciliations and Changes in Key Metrics Represents transaction costs incurred in connection with the Hatteras Acquisition.Represents a component of Net gains (losses) on trading assets.Represents a component of Net unrealized gains (losses) on investments measured at fair value through earnings. For the quarters ended September 30, June 30, March 31, December 31, September 30, 2016 2016 2016 2015 2015 Core earnings reconciliation GAAP net income $730,880 ($278,497) ($868,080) $669,666 ($627,491) Less: Realized (gains) losses on termination of interest rate swaps (1,337) 60,064 - - - Unrealized (gains) / losses on interest rate swaps (256,462) 373,220 1,031,720 (463,126) 822,585 Net (gains) / losses on disposal of investments (14,447) (12,535) 1,675 7,259 7,943 Net (gains) / losses on trading assets (162,981) (81,880) (125,189) (42,584) (108,175) Net unrealized (gains) losses on investments measured at fair value through earnings (29,675) 54,154 (128) 62,703 24,501 Bargain purchase gain (72,576) - - - - Corporate acquisition related expenses(1) 46,724 2,163 - - - Net (income) loss attributable to noncontrolling interest 336 385 162 373 197 Premium amortization adjustment cost (benefit) 3,891 85,583 168,408 (18,072) 83,136 Plus: TBA Dollar Roll Income(2) 90,174 79,519 83,189 94,914 98,041 MSR amortization(3) (21,634) - - - - Core earnings $312,893 $282,176 $291,757 $311,133 $300,737 Book value per common share rollforward: Book value per common share, beginning of period $11.50 $11.61 $11.73 $11.99 $12.32 Net income (loss) attributable to common stockholders 0.70 (0.32) (0.96) 0.69 (0.68) Other comprehensive income (loss) attributable to common stockholders 0.00 0.51 1.11 (0.68) 0.65 Common dividends declared (0.30) (0.30) (0.30) (0.30) (0.30) Issuance of common stock (0.07) 0.00 0.00 0.00 0.00 Buyback of common stock 0.00 0.00 0.03 0.03 0.00 Book value per common share, end of period $11.83 $11.50 $11.61 $11.73 $11.99

Unaudited Changes in Key Metrics Includes interest expense on interest rate swaps used to hedge cost of funds. For the quarters ended September 30, June 30, March 31, December 31, September 30, 2016 2016 2016 2015 2015 Changes in net interest margin Prior quarter net interest margin 1.15% 0.79% 1.80% 1.27% 2.06% Quarter-over-quarter changes in contribution: Net amortization of premiums 0.34% 0.39% (0.86%) 0.44% (0.76%) Interest expense and related realized gain (loss) on interest rate swaps 0.09% 0.03% (0.05%) (0.01%) (0.11%) TBA dollar roll income 0.00% (0.01%) (0.06%) (0.02%) 0.03% Coupon on average interest-earning assets (0.18%) (0.05%) (0.04%) 0.12% 0.05% Current quarter net interest margin 1.40% 1.15% 0.79% 1.80% 1.27% Changes in core net interest margin Prior quarter core net interest margin 1.54% 1.54% 1.71% 1.65% 1.70% Quarter-over-quarter changes in contribution: Interest expense and related realized gain (loss) on interest rate swaps 0.09% 0.04% (0.05%) (0.02%) (0.11%) TBA dollar roll income 0.00% (0.01%) (0.06%) (0.02%) 0.03% Net amortization of premiums, exclusive of premium amortization adjustment (0.03%) 0.03% (0.02%) (0.02%) (0.02%) Coupon on average interest-earning assets (0.18%) (0.06%) (0.04%) 0.12% 0.05% Current quarter core net interest margin 1.42% 1.54% 1.54% 1.71% 1.65% Changes in net interest spread Prior quarter core net interest spread 0.80% 0.36% 1.47% 0.83% 1.73% Quarter-over-quarter changes in contribution: Net amortization of premiums 0.41% 0.48% (1.04%) 0.53% (0.91%) Average cost of interest bearing liabilities(1) 0.11% 0.05% (0.05%) (0.03%) (0.06%) Coupon on average interest earning assets (0.19%) (0.09%) (0.02%) 0.14% 0.07% Current quarter core net interest spread 1.13% 0.80% 0.36% 1.47% 0.83% Changes in core net interest spread Prior quarter core net interest spread 1.27% 1.27% 1.37% 1.29% 1.31% Quarter-over-quarter changes in contribution: Average cost of interest bearing liabilities(1) 0.11% 0.05% (0.05%) (0.03%) (0.06%) Net amortization of premiums, exclusive of premium amortization adjustment (0.04%) 0.04% (0.03%) (0.03%) (0.03%) Coupon on average interest earning assets (0.19%) (0.09%) (0.02%) 0.14% 0.07% Current quarter core net interest spread 1.15% 1.27% 1.27% 1.37% 1.29%

Unaudited Changes in Key Metrics Includes investment advisory income, other income (loss), general and administrative expenses and income taxes.Includes investment advisory income, other income (loss), mortgage servicing rights (“MSR”) amortization (a component of Net unrealized gains (losses) on financial instruments measured at fair value through earnings), general and administrative expenses (excluding corporate acquisition related expenses) and income taxes. For the quarters ended September 30, June 30, March 31, December 31, September 30, 2016 2016 2016 2015 2015 Changes in GAAP return on average equity Prior quarter GAAP return on average equity (9.60%) (29.47%) 22.15% (20.18%) 28.00% Quarter-over-quarter changes in contribution: Unrealized (gains) / losses on interest rate swaps 21.12% 22.17% (50.34%) 41.77% (48.25%) Realized / unrealized (gains) / losses on investments and trading assets 5.29% (2.81%) 5.10% (3.33%) 5.32% Bargain purchase gain 2.34% 0.00% 0.00% 0.00% 0.00% Net amortization of premiums and accretion of discounts 2.24% 2.94% (6.76%) 2.91% (5.28%) Realized (gains) losses on termination of interest rate swaps 2.11% (2.07%) 0.00% 0.00% 0.00% Interest expense and related realized gain (loss) on interest rate swaps 0.14% 0.24% (0.81%) (0.44%) (0.75%) Coupon income 0.02% (0.37%) 0.87% 1.66% 0.35% Impairment of goodwill 0.00% 0.00% 0.00% 0.00% 0.71% Other(1) (0.11%) (0.23%) 0.32% (0.24%) (0.28%) Current quarter GAAP return on average equity 23.55% (9.60%) (29.47%) 22.15% (20.18%) Changes in core return on average equity Prior quarter core return on average equity 9.73% 9.91% 10.30% 9.67% 10.31% Quarter-over-quarter changes in contribution: Other(2) 0.62% (0.15%) 0.31% (0.23%) (0.28%) TBA dollar roll income 0.17% (0.08%) (0.32%) (0.01%) 0.17% Economic interest expense and other swaps expense 0.14% 0.24% (0.81%) (0.44%) (0.76%) Coupon income 0.02% (0.37%) 0.88% 1.67% 0.36% Net amortization of premiums, exclusive of premium amortization adjustment (0.59%) 0.18% (0.45%) (0.36%) (0.13%) Current quarter core return on average equity 10.09% 9.73% 9.91% 10.30% 9.67%

Unaudited, dollars in thousands Residential Investment Securities and TBA Derivative Overview as of September 30, 2016 Agency Fixed-Rate Securities (Pools) Weighted Avg. Current Weighted Avg. Weighted Avg. Weighted Avg. Weighted Avg. Estimated Years to Maturity Face Value % Coupon Amortized Cost Fair Value 3-Month CPR Fair Value <=15 years $7,588,745 13.6% 3.15% 103.8% 105.7% 12.3% $8,023,809 20 years 5,626,694 10.1% 3.50% 104.3% 106.8% 16.6% 6,007,378 >=30 years 42,497,808 76.3% 3.86% 106.2% 108.0% 14.9% 45,911,382 Total/Weighted Avg. $55,713,247 100.0% 3.73% 105.70% 107.59% 14.7% $59,942,569 TBA Purchase Contracts Weighted Avg. Implied Cost Implied Market Type Notional Value % Coupon Basis Value 15-year $1,890,000 11.8% 2.50% $1,948,871 $1,957,087 30-year 14,060,000 88.2% 3.30% 14,722,325 14,772,922 Total/Weighted Avg. $15,950,000 100.0% 3.21% $16,671,196 $16,730,009 Agency Adjustable-Rate Securities Weighted Avg. Current Weighted Avg. Weighted Avg. Weighted Avg. Weighted Avg. Estimated Months to Reset Face Value % Coupon Amortized Cost Fair Value 3-Month CPR Fair Value 0 - 24 months $4,527,844 38.5% 2.85% 103.8% 105.0% 25.6% $4,754,870 25 - 40 months 4,162,726 35.4% 2.54% 103.3% 103.3% 25.7% 4,298,752 41 - 60 months 1,535,152 13.1% 2.60% 103.1% 103.1% 18.4% 1,582,059 61 - 90 months 612,283 5.2% 2.83% 103.6% 103.8% 6.6% 635,525 >90 months 922,628 7.8% 3.03% 102.7% 103.8% 19.4% 957,421 Total/Weighted Avg. $11,760,633 100.0% 2.72% 103.4% 104.0% 23.2% $12,228,627
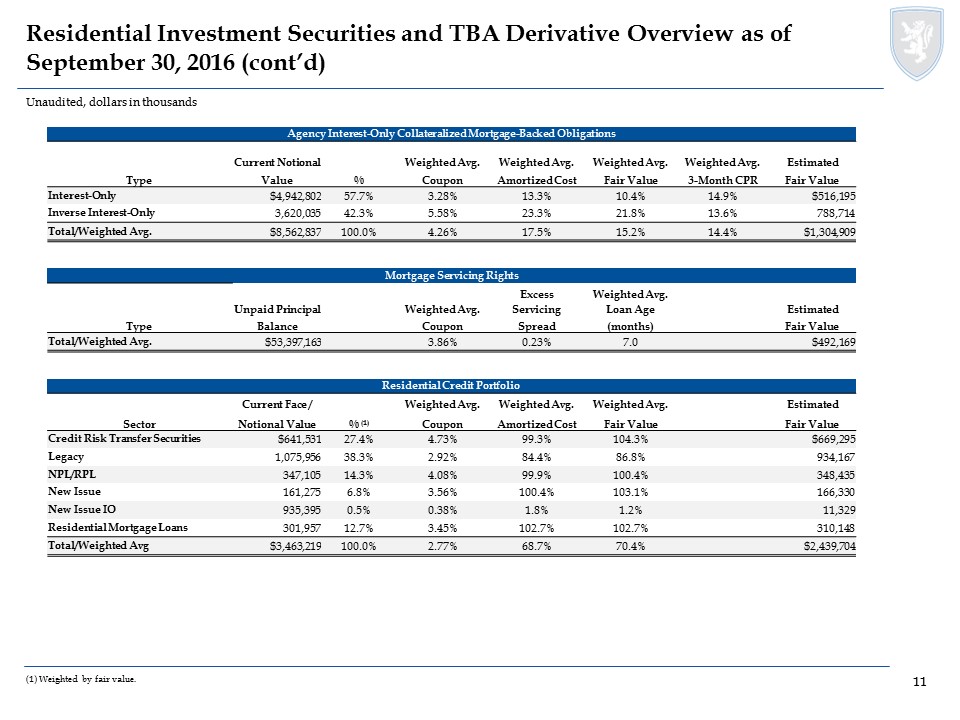
Unaudited, dollars in thousands Residential Investment Securities and TBA Derivative Overview as of September 30, 2016 (cont’d) (1) Weighted by fair value. Agency Interest-Only Collateralized Mortgage-Backed Obligations Current Notional Weighted Avg. Weighted Avg. Weighted Avg. Weighted Avg. Estimated Type Value % Coupon Amortized Cost Fair Value 3-Month CPR Fair Value Interest-Only $4,942,802 57.7% 3.28% 13.3% 10.4% 14.9% $516,195 Inverse Interest-Only 3,620,035 42.3% 5.58% 23.3% 21.8% 13.6% 788,714 Total/Weighted Avg. $8,562,837 100.0% 4.26% 17.5% 15.2% 14.4% $1,304,909 Mortgage Servicing Rights Excess Weighted Avg. Unpaid Principal Weighted Avg. Servicing Loan Age Estimated Type Balance Coupon Spread (months) Fair Value Total/Weighted Avg. $53,397,163 3.86% 0.23% 7.0 $492,169 Residential Credit Portfolio Current Face / Weighted Avg. Weighted Avg. Weighted Avg. Estimated Sector Notional Value % (1) Coupon Amortized Cost Fair Value Fair Value Credit Risk Transfer Securities $641,531 27.4% 4.73% 99.3% 104.3% $669,295 Legacy 1,075,956 38.3% 2.92% 84.4% 86.8% 934,167 NPL/RPL 347,105 14.3% 4.08% 99.9% 100.4% 348,435 New Issue 161,275 6.8% 3.56% 100.4% 103.1% 166,330 New Issue IO 935,395 0.5% 0.38% 1.8% 1.2% 11,329 Residential Mortgage Loans 301,957 12.7% 3.45% 102.7% 102.7% 310,148 Total/Weighted Avg $3,463,219 100.0% 2.77% 68.7% 70.4% $2,439,704

Residential Credit Investments Detail as of September 30, 2016 (1) Excludes Residential Mortgage Loans. Unaudited, dollars in thousands (1) By Sector Product Product Market Value Coupon Credit Enhancement 60+ Delinquencies 3M VPR Alt-A $160,233 4.41% 7.21% 15.07% 5.90% Prime 230,140 4.52% 1.55% 10.45% 2.50% Subprime 549,754 1.91% 23.21% 19.96% 1.85% Prime Jumbo (>=2010 Vintage) 160,370 3.50% 15.59% 0.00% 24.41% Prime Jumbo (>=2010 Vintage) Interest Only 11,329 0.39% 0.00% 0.00% 17.46% Re-Performing Loan Securitizations 80,212 3.86% 45.17% 14.37% 3.34% Agency Credit Risk Transfer 616,761 4.61% 1.02% 0.14% 18.89% Private Label Credit Risk Transfer 52,534 6.06% 7.77% 1.42% 4.00% Non-Performing Loan Securitizations 268,223 4.15% 51.52% 67.23% 1.35% Total $2,129,556 2.70% 11.85% 11.87% 11.07% Market Value By Sector and Payment Structure Product Senior Subordinate Total Alt-A $83,319 $76,914 $160,233 Prime 37,779 192,361 230,140 Subprime 189,236 360,517 549,753 Prime Jumbo (>=2010 Vintage) 149,870 10,500 160,370 Prime Jumbo (>=2010 Vintage) Interest Only 11,329 - 11,329 Re-Performing Loan Securitizations 80,212 - 80,212 Agency Credit Risk Transfer - 616,762 616,762 Private Label Credit Risk Transfer - 52,534 52,534 Non-Performing Loan Securitizations 264,735 3,488 268,223 Total $816,480 $1,313,076 $2,129,556 Market Value By Sector and Bond Coupon Product ARM Fixed Floater Interest Only Total Alt-A $18,628 $99,947 $41,658 $ - $160,233 Prime 107,269 122,871 - - 230,140 Subprime - 60,675 489,078 - 549,753 Prime Jumbo (>=2010 Vintage) - 149,870 10,500 - 160,370 Prime Jumbo (>=2010 Vintage) Interest Only - - - 11,329 11,329 Re-Performing Loan Securitizations - 80,212 - - 80,212 Agency Credit Risk Transfer - - 616,762 - 616,762 Private Label Credit Risk Transfer - - 52,534 - 52,534 Non-Performing Loan Securitizations - 268,223 - - 268,223 Total $125,897 $781,798 $1,210,532 $11,329 $2,129,556

Commercial Real Estate Overview as of September 30, 2016 Book values include unamortized net origination fees.Total weighted based on book value.Based on an internal valuation or the most recent third party appraisal, which may be prior to loan origination/purchase date, and on an “as is” basis at the time of underwriting.Maturity dates assume all of the borrowers' extension options are exercised.Levered Return – Debt Investments, Securitized Whole Loans at Fair Value and commercial mortgage-backed securities (“CMBS”): represents the current coupon plus fees amortized over initial loan term, less any related financing costs. Levered return – Equity Investments: is based on projected year 1 cash-on-cash returns for 2015 acquisitions.Economic interest in securitized whole loans is reflected in B Piece CMBS. Unaudited, dollars in thousands

Middle Market Lending Overview as of September 30, 2016 Industry Dispersion Industry Fixed Rate Floating Rate Total Airports, Flying Fields and Airport Terminal $ - $ 47,184 $ 47,184 Commercial Fishing - 40,590 40,590 Computer Programming & Data Processing - 63,253 63,253 Drugs - 34,247 34,247 Home Health Care Services - 39,339 39,339 Insurance Agents, Brokers & Services 4,380 44,344 48,724 Management & Public Relations Services - 39,116 39,116 Medical & Dental Laboratories - 17,324 17,324 Miscellaneous Business Services 84,448 63,677 148,125 Miscellaneous Health & Allied Services - 38,886 38,886 Miscellaneous Nonmetallic Minerals - 24,682 24,682 Miscellaneous Plastic Products - 27,075 27,075 Motor Vehicles, Parts & Supplies - 12,347 12,347 Offices & Clinics of Doctors of Medicine - 83,582 83,582 Research, Development & Testing Services - 17,739 17,739 Schools & Educational Services - 21,042 21,042 Surgical, Medical & Dental Instruments - 13,576 13,576 Total $ 88,828 $ 628,003 $ 716,831 Loan Size Dispersion Loan Size Amount Percentage $0 - $20 million $ 126,210 17.6% $20 - $40 million 215,270 30.0% $40 - $60 million 229,951 32.1% greater than $60 million 145,400 20.3% Total $ 716,831 100.0% Loan Tenor Dispersion Remaining Term Amount Percentage One year or less $ - 0.0% One to three years - 0.0% Three to five years 438,092 61.1% Greater than five years 278,739 38.9% Total $ 716,831 100.0% Lien Position Amount First lien loans $ 466,099 65.0% Second lien loans 161,904 22.6% Second lien notes 84,448 11.8% Subordinated notes 4,380 0.6% Total $ 716,831 100.0% Unaudited, dollars in thousands

Hedging and Liabilities as of September 30, 2016 Unaudited, dollars in thousands Weighted average years to maturity for futures positions are based off of the Treasury contracts cheapest to deliver.Approximately 16% of the total repurchase agreements and FHLB advances have a remaining maturity over one year. The combined weighted average days to maturity for repurchase agreements and FHLB advances was 206 days.Represents the quarterly average rate.Determined based on estimated weighted-average lives of the underlying debt instruments. Interest Rate Swaps Current Weighted Avg. Weighted Avg. Weighted Avg. Maturity Notional Pay Rate Receive Rate Years to Maturity 0 to <3 years $4,552,383 1.74% 0.76% 2.77 >=3 to <6 years 9,675,000 1.92% 0.88% 4.14 >= 6 to <10 years 7,363,550 2.34% 0.98% 7.81 Greater than 10 years 3,634,400 3.70% 0.67% 18.62 Total / Weighted Avg. $25,225,333 2.25% 0.88% 6.89 Futures Positions Notional Notional Long Short Weighted Avg. Type Positions Positions Years to Maturity(1) 2-year Swap Equivalent Eurodollar Contracts - (14,991,375) 2.00 U.S. Treasury Futures - 5 year - (1,247,200) 4.42 Total - ($16,238,575) 2.19 Interest Rate Swaptions Current Weighted-Avg. Weighted-Avg. Weighted Avg. Weighted Avg. Underlying Underlying Underlying Underlying Months to Type Notional Pay Rate Receive Rate Years to Maturity Expiration Long $950,000 1.08% 3M LIBOR 2.24 2.77 Short ($200,000) 3M LIBOR 1.54% 10.25 2.77 Repurchase Agreements & FHLB Advances Principal Weighted Avg. Maturity Balance Rate Within 30 days $26,508,338 0.99% 30 to 59 days 5,200,350 0.86% 60 to 89 days 6,173,598 0.85% 90 to 119 days 5,309,103 0.79% Over 120 days(2) 22,181,058 1.27% Total / Weighted Avg. $65,372,447 1.04% Principal Weighted Average Balance Rate (3) Days to Maturity(4) Repurchase agreements $61,784,121 0.97% 128 Other secured financing 3,804,742 0.83% 1,560 Securitized debt of consolidated VIEs 3,695,502 1.29% 2,434 Participation sold 12,908 4.81% 213 Mortgages payable 330,946 4.42% 2,881 Total indebtedness $69,628,219

Unaudited Quarter-Over-Quarter Interest Rate and MBS Spread Sensitivity Scenarios include Residential Investment Securities and derivative instruments.Net asset value (“NAV”) represents book value of common equity. Assumptions:The interest rate sensitivity and spread sensitivity are based on the portfolios as of September 30, 2016 and June 30, 2016. The interest rate sensitivity reflects instantaneous parallel shifts in rates.The spread sensitivity shifts mortgage-backed securities spreads instantaneously and reflects exposure to mortgage-backed securities basis risk.All tables assume no active management of the portfolio in response to rate or spread changes. Interest Rate Sensitivity As of September 30, 2016 As of June 30, 2016 Interest Rate Change (bps) Estimated Percentage Change in Portfolio Value(1) Estimated Change as a % of NAV(1)(2) Estimated Percentage Change in Portfolio Value(1) Estimated Change as a % of NAV(1)(2) (75) 0.5% 3.1% 0.3% 1.8% (50) 0.4% 2.3% 0.3% 1.7% (25) 0.2% 1.3% 0.2% 1.0% 25 (0.3%) (1.7%) (0.2%) (1.3%) 50 (0.6%) (3.8%) (0.5%) (3.2%) 75 (1.1%) (6.6%) (0.9%) (5.6%) MBS Spread Sensitivity As of September 30, 2016 As of June 30, 2016 MBS Spread Shock (bps) Estimated Change in Portfolio Market Value Estimated Change as a % of NAV(1)(2) Estimated Change in Portfolio Market Value Estimated Change as a % of NAV(1)(2) (25) 1.3% 8.2% 1.3% 7.8% (15) 0.8% 4.9% 0.8% 4.7% (5) 0.3% 1.6% 0.3% 1.6% 5 (0.3%) (1.6%) (0.3%) (1.5%) 15 (0.8%) (4.8%) (0.8%) (4.6%) 25 (1.3%) (8.0%) (1.3%) (7.7%)

Appendix

Endnotes for Page 2 Core earnings is defined as net income (loss) excluding gains or losses on disposals of investments and termination of interest rate swaps, unrealized gains or losses on interest rate swaps and investments measured at fair value through earnings, net gains and losses on trading assets, impairment losses, net income (loss) attributable to noncontrolling interest, the premium amortization adjustment resulting from the quarter-over-quarter change in estimated long-term CPR, corporate acquisition related expenses and certain other non-recurring gains or losses, and inclusive of dollar roll income (a component of Net gains (losses) on trading assets) and realized amortization of MSRs (a component of Net unrealized gains (losses) on investments measured at fair value through earnings).For purposes of calculating the Company’s leverage ratio, debt consists of repurchase agreements, other secured financing, Convertible Senior Notes, securitized debt, participation sold and mortgages payable. Securitized debt, participation sold and mortgages payable are non-recourse to the Company.Computed as the sum of recourse debt, TBA derivative notional outstanding and net forward purchases of investments divided by total equity. Recourse debt consists of repurchase agreements, other secured financing and Convertible Senior Notes. The ratio of total equity to total assets (inclusive of total market value of TBA derivatives and exclusive of consolidated VIEs associated with B Piece commercial mortgage-backed securities).Comprised of non-Agency mortgage-backed securities, credit risk transfer securities and residential mortgage loans.Includes consolidated VIEs and loans held for sale.Represents the sum of the Company’s annualized economic core net interest income (inclusive of interest expense on interest rate swaps used to hedge cost of funds) plus TBA dollar roll income (less interest expense on swaps used to hedge dollar roll transactions) divided by the sum of its average interest-earning assets plus average outstanding TBA derivative balances.Represents annualized core interest income divided by average interest earning assets. Interest earning assets reflects the average amortized cost of our investments during the period. Excludes transaction costs incurred in connection with the Company’s acquisition of Hatteras Financial Corp.Represents general and administrative expenses divided by core earnings before general and administrative expenses.
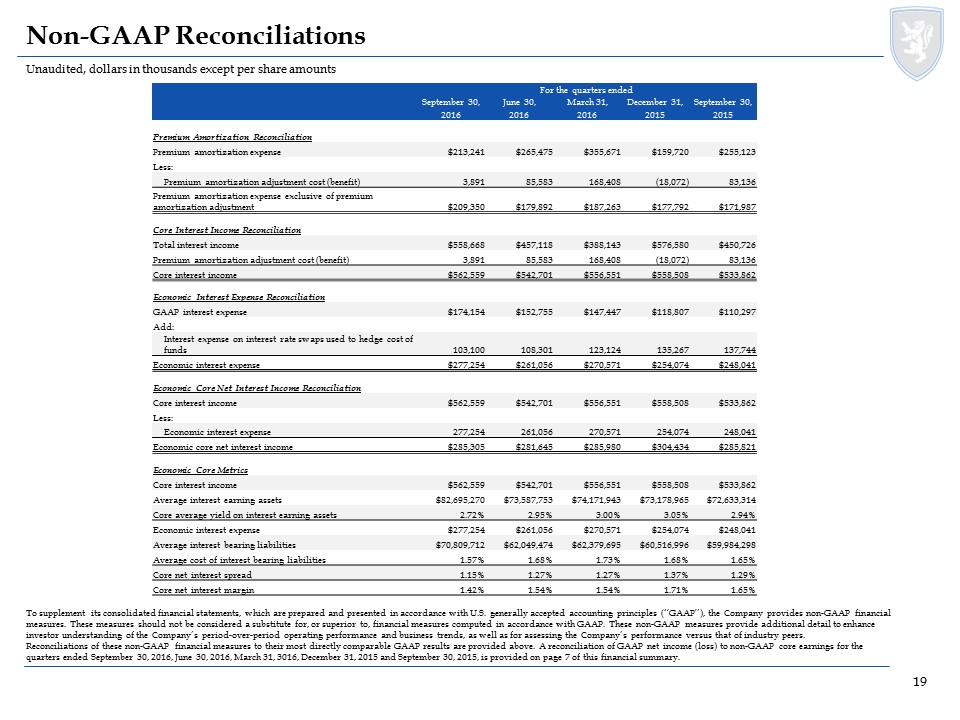
Non-GAAP Reconciliations To supplement its consolidated financial statements, which are prepared and presented in accordance with U.S. generally accepted accounting principles (“GAAP”), the Company provides non-GAAP financial measures. These measures should not be considered a substitute for, or superior to, financial measures computed in accordance with GAAP. These non-GAAP measures provide additional detail to enhance investor understanding of the Company’s period-over-period operating performance and business trends, as well as for assessing the Company’s performance versus that of industry peers.Reconciliations of these non-GAAP financial measures to their most directly comparable GAAP results are provided above. A reconciliation of GAAP net income (loss) to non-GAAP core earnings for the quarters ended September 30, 2016, June 30, 2016, March 31, 3016, December 31, 2015 and September 30, 2015, is provided on page 7 of this financial summary. Unaudited, dollars in thousands except per share amounts For the quarters ended September 30, June 30, March 31, December 31, September 30, 2016 2016 2016 2015 2015 Premium Amortization Reconciliation Premium amortization expense $213,241 $265,475 $355,671 $159,720 $255,123 Less: Premium amortization adjustment cost (benefit) 3,891 85,583 168,408 (18,072) 83,136 Premium amortization expense exclusive of premium amortization adjustment $209,350 $179,892 $187,263 $177,792 $171,987 Core Interest Income Reconciliation Total interest income $558,668 $457,118 $388,143 $576,580 $450,726 Premium amortization adjustment cost (benefit) 3,891 85,583 168,408 (18,072) 83,136 Core interest income $562,559 $542,701 $556,551 $558,508 $533,862 Economic Interest Expense Reconciliation GAAP interest expense $174,154 $152,755 $147,447 $118,807 $110,297 Add: Interest expense on interest rate swaps used to hedge cost of funds 103,100 108,301 123,124 135,267 137,744 Economic interest expense $277,254 $261,056 $270,571 $254,074 $248,041 Economic Core Net Interest Income Reconciliation Core interest income $562,559 $542,701 $556,551 $558,508 $533,862 Less: Economic interest expense 277,254 261,056 270,571 254,074 248,041 Economic core net interest income $285,305 $281,645 $285,980 $304,434 $285,821 Economic Core Metrics Core interest income $562,559 $542,701 $556,551 $558,508 $533,862 Average interest earning assets $82,695,270 $73,587,753 $74,171,943 $73,178,965 $72,633,314 Core average yield on interest earning assets 2.72% 2.95% 3.00% 3.05% 2.94% Economic interest expense $277,254 $261,056 $270,571 $254,074 $248,041 Average interest bearing liabilities $70,809,712 $62,049,474 $62,379,695 $60,516,996 $59,984,298 Average cost of interest bearing liabilities 1.57% 1.68% 1.73% 1.68% 1.65% Core net interest spread 1.15% 1.27% 1.27% 1.37% 1.29% Core net interest margin 1.42% 1.54% 1.54% 1.71% 1.65%
Serious News for Serious Traders! Try StreetInsider.com Premium Free!
You May Also Be Interested In
- Annaly Capital Management (NLY) Tops Q4 EPS by 64c
- Invesco Ltd: Form 8.3 - International Paper Company Public dealing disclosure
- All Y'alls Foods Debuts Charming Mascot Plus New Customer Program to Reward Good Deeds
Create E-mail Alert Related Categories
SEC FilingsSign up for StreetInsider Free!
Receive full access to all new and archived articles, unlimited portfolio tracking, e-mail alerts, custom newswires and RSS feeds - and more!
