

Form 8-K ANNALY CAPITAL MANAGEMEN For: May 06
 Tweet
Tweet Share
Share_________________________________________________
UNITED STATES
SECURITIES AND EXCHANGE COMMISSION
Washington, D.C. 20549
FORM 8-K
CURRENT REPORT
PURSUANT TO SECTION 13 OR 15(d) OF THE
SECURITIES EXCHANGE ACT OF 1934
Date of Report (Date of earliest event reported)
May 6, 2015
| Annaly Capital Management, Inc. |
| (Exact Name of Registrant as Specified in its Charter) |
|
Maryland
|
1-13447
|
22-3479661
|
||
|
State or Other Jurisdiction
Of Incorporation)
|
(Commission
File Number)
|
(I.R.S. Employer
Identification No.)
|
|
1211 Avenue of the Americas
New York, New York
|
10036
|
|||
|
(Address of Principal Executive Offices)
|
(Zip Code)
|
Registrant’s telephone number, including area code: (212) 696-0100
(Former Name or Former Address, if Changed Since Last Report)
Check the appropriate box below if the Form 8-K filing is intended to simultaneously satisfy the filing obligation of the registrant under any of the following provisions:
[ ] Written communications pursuant to Rule 425 under the Securities Act (17 CFR 230.425)
[ ] Soliciting material pursuant to Rule 14a-12 under the Exchange Act (17 CFR 240.14a-12)
[ ] Pre-commencement communications pursuant to Rule 14d-2(b) under the Exchange Act (17 CFR 240.14d-2(b))
[ ] Pre-commencement communications pursuant to Rule 13e-4(c) under the Exchange Act (17 CFR 240.13e-4(c))
Item 2.02. Results of Operations and Financial Condition
On May 6, 2015, the registrant issued a press release announcing its financial results for the quarter ended March 31, 2015. A copy of the press release is furnished as Exhibit 99.1 to this report.
On May 6, 2015, the registrant posted supplemental financial information on the Investor Relations section of its website (www.annaly.com). A copy of the supplemental financial information is furnished as Exhibit 99.2 to this report and incorporated herein by reference.
Item 9.01 Financial Statements and Exhibits
(d) Exhibits
99.1 Press Release, dated May 6, 2015, issued by Annaly Capital Management, Inc.
99.2 Supplemental Financial Information for the quarter ended March 31, 2015
SIGNATURES
Pursuant to the requirements of the Securities Exchange Act of 1934, the Registrant has duly caused this report to be signed on its behalf by the undersigned hereunto duly authorized.
| ANNALY CAPITAL MANAGEMENT, INC. | |||
| By: | /s/ Glenn A. Votek | ||
| Name: | Glenn A. Votek | ||
| Title: | Chief Financial Officer | ||
| Dated: May 6, 2015 | |||
Exhibit 99.1
FOR IMMEDIATE RELEASE
ANNALY CAPITAL MANAGEMENT, INC. REPORTS 1st QUARTER 2015 RESULTS
|
●
|
GAAP net loss of $476.5 million, $0.52 loss per common share
|
|
●
|
Core earnings of $254.1 million, $0.25 earnings per common share
|
|
●
|
Common stock book value of $12.88, leverage of 4.8:1, economic leverage of 5.7:1
|
|
●
|
Diversification strategy advancing – commercial asset growth of 15%, now representing 13% of equity
|
|
●
|
Repositioned Agency portfolio into TBA contracts, shorter maturity securities and initiated investment in GSE Credit Risk Transfer bonds
|
New York, New York–May 6, 2015–Annaly Capital Management, Inc. (NYSE: NLY) today announced its financial results for the quarter ended March 31, 2015.
Financial Performance
The Company reported a GAAP net loss for the quarter ended March 31, 2015 of $476.5 million, or $0.52 loss per average common share, compared to a GAAP net loss of $658.3 million, or $0.71 loss per average common share, for the quarter ended December 31, 2014, and a GAAP net loss of $203.4 million, or $0.23 loss per average common share, for the quarter ended March 31, 2014. The smaller loss for the quarter ended March 31, 2015 compared to the quarter ended December 31, 2014 was due to changes in realized and unrealized losses on our interest rate swaps. The larger loss for the quarter ended March 31, 2015 compared to the quarter ended March 31, 2014 was primarily attributable to realized losses on termination of interest rate swaps in the current quarter.
Core earnings for the quarter ended March 31, 2015 was $254.1 million, or $0.25 per average common share, compared to $298.9 million, or $0.30 per average common share, for the quarter ended December 31, 2014, and $239.7 million, or $0.23 per average common share, for the quarter ended March 31, 2014. Core earnings declined during the quarter ended March 31, 2015 due to higher amortization expense on Investment Securities, a result of lower interest rates and faster model prepayment expectations. Core earnings were also impacted by portfolio actions that included the disposal of $14.9 billion of Investment Securities which resulted in lower coupon income. The sales generated $62.3 million of realized gains which, as noted below, are excluded from core earnings. "Core earnings" represents a non-GAAP measure and is defined as net income (loss) excluding gains or losses on disposals of investments and termination of interest rate swaps, unrealized gains or losses on interest rate swaps and Agency interest-only mortgage-backed securities, net gains and losses on trading assets, impairment losses, net income (loss) attributable to noncontrolling interest, and certain other non-recurring gains or losses, and inclusive of dollar roll income (a component of Net gains (losses) on trading assets).
As part of a series of portfolio actions executed during the quarter, and further described below, the Company entered into to-be-announced (“TBA”) dollar roll transactions that generate dollar roll income. Dollar roll, or “drop”, income is defined as the difference in price between two TBA contracts with the same terms but different settlement dates. Dollar roll income represents the equivalent of interest income on the underlying security less an implied cost of financing.
Net interest margin, inclusive of TBA dollar rolls, for the quarters ended March 31, 2015, December 31, 2014 and March 31, 2014 was 1.26%, 1.56% and 1.32%, respectively. Net interest margin represents the sum of the Company’s annualized economic net interest income, inclusive of interest expense on interest rate swaps, plus TBA dollar roll income divided by the sum of its average interest-earning assets plus average outstanding TBA contract balances. For the quarter ended March 31, 2015, the average yield on interest earning assets was 2.47% and the average cost of interest bearing liabilities, including interest expense on interest rate swaps, was 1.64%, which resulted in a net interest spread of 0.83%. Our average yield on interest earning assets declined for quarter ended March 31, 2015 when compared to the quarters ended December 31, 2014 and March 31, 2014 as a result of higher amortization expense in the current quarter resulting from faster prepayment speeds. Our average cost of interest bearing liabilities decreased for the quarter ended March 31, 2015 when compared to the quarter ended December 31, 2014 due to lower interest rate swap and repo balances. Our average cost of interest bearing liabilities decreased for the quarter ended March 31, 2015 when compared to the quarter ended March 31, 2014 due to significantly lower interest rate swap and swaption notional balances as a percentage of repurchase agreements.
Wellington J. Denahan, Chairman and Chief Executive Officer of Annaly, commented on the Company’s results. “We, along with the rest of the markets, are patiently waiting for the Federal Reserve to adjust policy accommodation sometime this year. We fully expect increases in volatility and look forward to the opportunities it will bring. We are proud of our ability to continue to deliver attractive relative returns in this zero-interest rate bound world.”
Kevin Keyes, President of Annaly, added “We remain prepared to be opportunistic during this time of heightened volatility. Influenced by our history and demonstrated performance over the longer term, our disposition toward risk management and capital allocation is to maintain a consistent, thoughtful approach through market cycles focusing on the production of stable and durable earnings over time.”
1
Asset Portfolio
During the quarter ended March 31, 2015, the Company executed a series of portfolio actions based upon a view of relative value given macro-environmental conditions. The actions included (i) the disposal of Investment Securities, which included the rotation out of certain types of Agency mortgage-backed securities while adding to other shorter maturity Agency mortgage-backed securities, (ii) commencement of purchases of Agency Credit-Risk Transfer (“CRT”) securities and (iii) execution of TBA dollar roll transactions. The Company disposals were comprised primarily of 30 year Agency mortgage-backed securities while adding to its holdings of 15 year Agency mortgage-backed securities. The Company purchased $108.3 million of Agency CRT securities. Investment Securities, which are comprised of Agency mortgage-backed securities, Agency debentures and Agency CRT securities were $70.5 billion at March 31, 2015, compared to $82.9 billion at December 31, 2014 and $77.8 billion at March 31, 2014.
The Company’s Investment Securities portfolio at March 31, 2015 was comprised of 94% fixed-rate assets with the remainder constituting adjustable- or floating-rate investments. During the quarter ended March 31, 2015, the Company disposed of $14.9 billion of Investment Securities, resulting in a realized gain of $62.3 million. During the quarter ended December 31, 2014, the Company disposed of $7.3 billion of Investment Securities, resulting in a realized gain of $3.2 million. During the quarter ended March 31, 2014, the Company disposed of $5.0 billion of Investment Securities, resulting in a realized gain of $80.7 million.
At March 31, 2015 the Company had outstanding $13.8 billion in notional balances of TBA derivative positions. Realized and unrealized losses on TBA derivatives are recorded in Net gains (losses) on trading assets in the Company’s Consolidated Statements of Comprehensive Income (Loss). The following table summarizes certain characteristics of the Company’s TBA derivatives at March 31, 2015:
|
Purchase and sale contracts for
derivative TBAs
|
Notional
|
Implied Cost Basis
|
Implied Market Value
|
Net Carrying Value
|
||||||||||||
|
(dollars in thousands)
|
||||||||||||||||
|
Purchase contracts
|
$ | 13,750,000 | $ | 14,279,766 | $ | 14,392,695 | $ | 112,929 | ||||||||
|
Sale contracts
|
- | - | - | - | ||||||||||||
|
Net TBA derivatives
|
$ | 13,750,000 | $ | 14,279,766 | $ | 14,392,695 | $ | 112,929 | ||||||||
The weighted average experienced constant prepayment rate on our Agency mortgage-backed securities for the quarters ended March 31, 2015, December 31, 2014, and March 31, 2014, was 9%, 8% and 6%, respectively. The Company uses a third-party model to project prepayment speeds for purposes of determining amortization of related premiums and discounts on Investment Securities. Changes to model assumptions, including interest rates and other market data, as well as periodic revisions to the model may cause changes in the results. The net amortization of premiums and accretion of discounts on Investment Securities for the quarters ended March 31, 2015, December 31, 2014, and March 31, 2014, was $284.8 million, $198.0 million, and $119.0 million, respectively. The total net premium balance on Investment Securities at March 31, 2015, December 31, 2014, and March 31, 2014, was $4.7 billion, $5.3 billion, and $5.1 billion, respectively. The weighted average amortized cost basis of the Company’s non-interest-only Investment Securities at March 31, 2015, December 31, 2014, and March 31, 2014, was 105.1%, 105.3%, and 105.3%, respectively. The weighted average amortized cost basis of the Company’s interest-only Investment Securities at March 31, 2015, December 31, 2014, and March 31, 2014, was 15.7%, 15.4%, and 14.7%, respectively.
The Company’s commercial investment portfolio consists of commercial real estate investments and corporate debt. Commercial real estate debt and preferred equity, including securitized loans of consolidated variable interest entities (“VIEs”), as further described below, totaled $3.0 billion and investments in commercial real estate totaled $207.2 million at March 31, 2015. Commercial real estate debt and preferred equity, including securitized loans of consolidated VIEs, totaled $1.5 billion and investments in commercial real estate totaled $210.0 million at December 31, 2014. The commercial investment portfolio, net of financing, represented 13% and 11% of stockholders’ equity at March 31, 2015 and December 31, 2014, respectively. The weighted average yield on commercial real estate debt and preferred equity as of March 31, 2015, December 31, 2014, and March 31, 2014, was 8.75%, 9.00% and 9.13%, respectively. The weighted average levered equity yield on investments in commercial real estate, excluding real estate held-for-sale, as of March 31, 2015, December 31, 2014, and March 31, 2014, was 13.09%, 13.95% and 10.80%, respectively.
During the quarter, the Company acquired the junior most tranche totaling $102 million issued by the Freddie Mac K-Series and the Company was required to consolidate $1.4 billion of assets and $1.3 billion of liabilities of the issuing trust as of March 31, 2015. The Company also acquired AAA rated commercial mortgage-backed securities totaling $145.0 million during the quarter. During the quarter, the Company acquired $63.0 million of corporate debt, increasing the size of its portfolio to $227.8 million at March 31, 2014, compared to $166.4 million at December 31, 2014. At March 31, 2015, the commercial investment portfolio, net of financing, represented 13% of total equity.
Capital and Funding
At March 31, 2015, total stockholders’ equity was $13.1 billion. Leverage at March 31, 2015, December 31, 2014, and March 31, 2014, was 4.8:1, 5.4:1 and 5:2:1, respectively. For purposes of calculating the Company’s leverage ratio, debt consists of repurchase agreements, Convertible Senior Notes, securitized debt, loan participation and mortgages payable. Securitized debt, loan participation and mortgages payable are non-recourse to the Company. Economic leverage, which also considers other forms of financing, was 5.7:1 at March 31, 2015. Economic leverage is computed as the sum of debt, TBA derivative notional outstanding and net forward purchases of Investment Securities divided by total equity. At March 31, 2015, December 31, 2014, and March 31, 2014, the Company’s capital ratio, which represents the ratio of stockholders’ equity to total assets (inclusive of total market value of TBA derivatives), was 14.1%, 15.1%, and 15.2%, respectively. On a GAAP basis, the Company produced an annualized return (loss) on average equity for the quarters ended March 31, 2015, December 31, 2014, and March 31, 2014 of (14.41%), (19.91%), and (6.52%), respectively. On a core earnings basis, the Company provided an annualized return on average equity for the quarters ended March 31, 2015, December 31, 2014, and March 31, 2014, of 7.68%, 9.04%, and 7.68%, respectively.
2
At March 31, 2015, December 31, 2014, and March 31, 2014 the Company had outstanding $60.5 billion, $71.4 billion, and $64.5 billion of repurchase agreements, respectively, with weighted average remaining maturities of 149 days, 141 days, and 187 days, respectively, and with weighted average borrowing rates of 1.74%, 1.62%, and 2.43%, respectively, after giving effect to the Company’s interest rate swaps.
At March 31, 2015, December 31, 2014, and March 31, 2014, the Company had a common stock book value per share of $12.88, $13.10 and $12.30, respectively.
The following table presents the principal balance and weighted average rate of repurchase agreements by maturity at March 31, 2015:
|
Maturity
|
Principal Balance
|
Weighted Average Rate
|
||||||
|
(dollars in thousands)
|
||||||||
|
Within 30 days
|
$ | 23,738,473 | 0.47 | % | ||||
|
30 to 59 days
|
7,326,177 | 0.40 | % | |||||
|
60 to 89 days
|
9,534,614 | 0.40 | % | |||||
|
90 to 119 days
|
4,677,222 | 0.50 | % | |||||
|
Over 120 days(1)
|
15,200,892 | 1.45 | % | |||||
|
Total
|
$ | 60,477,378 | 0.70 | % | ||||
| (1) |
Approximately 18% of the total repurchase agreements have a remaining maturity over 1 year.
|
Hedge Portfolio
At March 31, 2015, the Company had outstanding interest rate swaps with a net notional amount of $28.1 billion and interest rate swaptions with a net notional amount of $1.0 billion, representing 48% of the Company’s repurchase agreements. Interest rate swaps and swaptions represented 47% of the Company’s repurchase agreements at December 31, 2014 and 94% of the Company’s repurchase agreements at March 31, 2014. Changes in the unrealized gains or losses on the interest rate swaps are reflected in the Company’s Consolidated Statements of Comprehensive Income (Loss). The purpose of the interest rate swaps is to mitigate the risk of rising interest rates that affect the Company’s cost of funds. Since the Company generally pays a fixed rate and receives a floating rate on the notional amount of the swaps, the intended effect of the swaps is to lock in a cost of financing. As of March 31, 2015, the swap portfolio, excluding forward starting swaps, had a weighted average pay rate of 2.37%, a weighted average receive rate of 0.35% and weighted average maturity of 8.09 years.
Changes in the unrealized gains or losses on the interest rate swaptions are reflected in the Company’s Consolidated Statements of Comprehensive Income (Loss). The interest rate swaptions provide the Company with the option to enter into an interest rate swap agreement for a specified notional amount, duration, and pay and receive rates. As of March 31, 2015, the long swaption portfolio had a weighted average pay rate of 2.61% and weighted average expiration of 2.15 months. As of March 31, 2015, there were no short swaption positions.
The following table summarizes certain characteristics of the Company’s interest rate swaps at March 31, 2015:
|
Maturity
|
Current Notional (1)
|
Weighted
Average Pay
Rate (2) (3)
|
Weighted
Average Receive
Rate (2)
|
Weighted
Average Years
to Maturity (2)
|
||||||||||||
|
(dollars in thousands)
|
||||||||||||||||
|
0 - 3 years
|
$ | 2,852,488 | 1.78 | % | 0.18 | % | 2.45 | |||||||||
|
3 - 6 years
|
10,463,000 | 1.85 | % | 0.41 | % | 4.99 | ||||||||||
|
6 - 10 years
|
11,110,100 | 2.60 | % | 0.37 | % | 8.64 | ||||||||||
|
Greater than 10 years
|
3,634,400 | 3.70 | % | 0.22 | % | 20.12 | ||||||||||
|
Total / Weighted Average
|
$ | 28,059,988 | 2.37 | % | 0.35 | % | 8.09 | |||||||||
| (1) | Notional amount includes $3.0 billion in forward starting pay fixed swaps. |
| (2) | Excludes forward starting swaps. |
| (3) |
Weighted average fixed rate on forward starting pay fixed swaps was 1.88%.
|
The following table summarizes certain characteristics of the Company’s interest rate swaptions at March 31, 2015:
|
Current Underlying
Notional
|
Weighted Average
Underlying Pay
Rate
|
Weighted Average
Underlying Receive
Rate
|
Weighted Average
Underlying Years to
Maturity
|
Weighted Average
Months to Expiration
|
|||||||||||||
|
(dollars in thousands)
|
|||||||||||||||||
|
Long
|
$ | 1,000,000 | 2.61 | % |
3M LIBOR
|
8.19 | 2.15 | ||||||||||
3
The Company enters into U.S. Treasury and Eurodollar futures contracts to hedge a portion of its interest rate risk. The following table summarizes outstanding futures positions as of March 31, 2015:
|
Notional - Long
Positions
|
Notional - Short
Positions
|
Weighted Average
Years to Maturity
|
||||||||||
|
(dollars in thousands)
|
||||||||||||
|
2-year swap equivalent Eurodollar contracts
|
$ | - | $ | (3,000,000 | ) | 2.00 | ||||||
|
U.S. Treasury futures - 5 year
|
- | (2,000,000 | ) | 4.36 | ||||||||
|
U.S. Treasury futures - 10 year and greater
|
- | (1,800,000 | ) | 7.43 | ||||||||
|
Total
|
$ | - | $ | (6,800,000 | ) | 4.13 | ||||||
4
Key Metrics
The following table presents key metrics of the Company’s portfolio, liabilities and hedging positions, and performance as of and for the quarters ended March 31, 2015, December 31, 2014, and March 31, 2014:
|
March 31, 2015
|
December 31, 2014
|
March 31, 2014
|
|
|
Portfolio Related Metrics:
|
|||
|
Fixed-rate Investment Securities as a percentage of total Investment Securities
|
94%
|
95%
|
93%
|
|
Adjustable-rate and floating-rate Investment Securities as a percentage of total Investment Securities
|
6%
|
5%
|
7%
|
|
Weighted average yield on commercial real estate debt and preferred equity at period-end
|
8.75%
|
9.00%
|
9.13%
|
|
Weighted average net equity yield on investments in commercial real estate at period-end (1)
|
13.09%
|
13.95%
|
10.80%
|
|
Liabilities and Hedging Metrics:
|
|||
|
Weighted average days to maturity on repurchase agreements outstanding at period-end
|
149
|
141
|
187
|
|
Notional amount of interest rate swaps and swaptions as a percentage of repurchase agreements
|
48%
|
47%
|
94%
|
|
Weighted average pay rate on interest rate swaps at period-end (2)
|
2.37%
|
2.49%
|
2.16%
|
|
Weighted average receive rate on interest rate swaps at period-end (2)
|
0.35%
|
0.22%
|
0.19%
|
|
Weighted average net rate on interest rate swaps at period-end (2)
|
2.02%
|
2.27%
|
1.97%
|
|
Leverage at period-end (3)
|
4.8:1
|
5.4:1
|
5.2:1
|
|
Economic leverage at period-end (4)
|
5.7:1
|
5.4:1
|
5.2:1
|
|
Capital ratio at period end
|
14.1%
|
15.1%
|
15.2%
|
|
Performance Related Metrics:
|
|||
|
Net interest margin (5)
|
1.26%
|
1.56%
|
1.32%
|
|
Average yield on interest earning assets (6)
|
2.47%
|
2.98%
|
3.21%
|
|
Average cost of interest bearing liabilities (7)
|
1.64%
|
1.69%
|
2.31%
|
|
Net interest spread
|
0.83%
|
1.29%
|
0.90%
|
|
Annualized return (loss) on average equity
|
(14.41%)
|
(19.91%)
|
(6.52%)
|
|
Annualized Core return on average equity
|
7.68%
|
9.04%
|
7.68%
|
|
Common dividend declared during the quarter
|
$0.30
|
$0.30
|
$0.30
|
|
Book value per common share
|
$12.88
|
$13.10
|
$12.30
|
| (1) |
Excludes real estate held-for-sale.
|
| (2) | Excludes forward starting swaps. |
| (3) | Debt consists of repurchase agreements, Convertible Senior Notes, securitized debt, loan participation and mortgages payable. Securitized debt, loan participation and mortgages payable are non-recourse to the Company. |
| (4) | Computed as the sum of debt, TBA derivative notional outstanding and net forward purchases of Investment Securities divided by total equity. |
| (5) | Represents the sum of the Company’s annualized economic net interest income, inclusive of interest expense on interest rate swaps, plus dollar roll income divided by the sum of its average interest-earning assets plus average outstanding TBA derivative balances. |
| (6) | Average interest earning assets reflects the average amortized cost of our investments during the period. |
| (7) |
Includes interest expense on interest rate swaps.
|
5
The following table presents a reconciliation between GAAP net income and Core earnings for the quarters ended March 31, 2015, December 31, 2014, and March 31, 2014:
|
For the quarters ended
|
||||||||||||
|
March 31, 2015
|
December 31, 2014
|
March 31, 2014
|
||||||||||
|
(dollars in thousands)
|
||||||||||||
|
GAAP net income (loss)
|
$ | (476,499 | ) | $ | (658,272 | ) | $ | (203,351 | ) | |||
|
Less:
|
||||||||||||
|
Realized (gains) losses on termination of interest rate swaps
|
226,462 | - | 6,842 | |||||||||
|
Unrealized (gains) losses on interest rate swaps
|
466,202 | 873,468 | 348,942 | |||||||||
|
Net (gains) losses on disposal of investments
|
(62,356 | ) | (3,420 | ) | (79,710 | ) | ||||||
|
Net (gains) losses on trading assets
|
6,906 | 57,454 | 146,228 | |||||||||
|
Net unrealized (gains) losses on interest-only Agency mortgage-backed securities
|
33,546 | 29,520 | 20,793 | |||||||||
|
GAAP net (income) loss attributable to noncontrolling interest
|
90 | 196 | - | |||||||||
|
Plus:
|
||||||||||||
|
TBA dollar roll income (1)
|
59,731 | - | - | |||||||||
|
Core earnings
|
$ | 254,082 | $ | 298,946 | $ | 239,744 | ||||||
|
GAAP net income (loss) per average common share
|
$ | (0.52 | ) | $ | (0.71 | ) | $ | (0.23 | ) | |||
|
Core earnings per average common share
|
$ | 0.25 | $ | 0.30 | $ | 0.23 | ||||||
| (1) |
Represents a component of Net gains (losses) on trading assets.
|
The following table presents the components of the Company’s interest income and interest expense for the quarters ended March 31, 2015, December 31, 2014, and March 31, 2014:
|
For the quarters ended
|
||||||||||||
|
March 31,
|
December 31,
|
March 31,
|
||||||||||
|
2015
|
2014
|
2014
|
||||||||||
|
(dollars in thousands)
|
||||||||||||
|
Interest income:
|
||||||||||||
|
Investment Securities
|
$ | 478,239 | $ | 606,746 | $ | 614,419 | ||||||
|
Commercial investment portfolio(1)
|
40,336 | 40,913 | 39,486 | |||||||||
|
U.S. Treasury securities
|
- | - | 1,329 | |||||||||
|
Securities loaned
|
- | - | 114 | |||||||||
|
Reverse repurchase agreements
|
539 | 429 | 500 | |||||||||
|
Other
|
58 | 56 | 53 | |||||||||
|
Total interest income
|
519,172 | 648,144 | 655,901 | |||||||||
|
Interest expense:
|
||||||||||||
|
Repurchase agreements
|
102,748 | 107,540 | 103,131 | |||||||||
|
Convertible Senior Notes
|
23,627 | 25,701 | 18,897 | |||||||||
|
U.S. Treasury securities sold, not yet purchased
|
- | - | 1,076 | |||||||||
|
Securities borrowed
|
- | - | 95 | |||||||||
|
Securitized debt of consolidated VIEs
|
2,882 | 1,106 | 1,611 | |||||||||
|
Participation sold
|
159 | 165 | 161 | |||||||||
|
Other
|
4 | - | - | |||||||||
|
Total interest expense
|
129,420 | 134,512 | 124,971 | |||||||||
|
Net interest income
|
$ | 389,752 | $ | 513,632 | $ | 530,930 | ||||||
| (1) |
Consists of commercial real estate debt and preferred equity and corporate debt.
|
Dividend Declarations
Common dividends declared for the quarters ended March 31, 2015, December 31, 2014, and March 31, 2014 were $0.30, $0.30, and $0.30 per common share, respectively. The annualized dividend yield on the Company’s common stock for the quarter ended March 31, 2015, based on the March 31, 2015 closing price of $10.40, was 11.54%, compared to 11.10% for the quarter ended December 31, 2014, and 10.94% for the quarter ended March 31, 2014.
Other Information
Annaly’s principal business objective is to generate net income for distribution to its shareholders from its investments. Annaly is a Maryland corporation that has elected to be taxed as a real estate investment trust (“REIT”). Annaly is managed and advised by Annaly Management Company LLC.
The Company prepares a supplement to provide additional quarterly information for the benefit of its shareholders. The supplement can be found at the Company’s website in the Investor Relations section under “Quarterly Supplemental Information”.
6
Conference Call
The Company will hold the first quarter 2015 earnings conference call on May 7, 2015 at 10:00 a.m. Eastern Time. The number to call is 888-317-6003 for domestic calls and 412-317-6061 for international calls. The conference passcode is 6656065. There will also be an audio webcast of the call on www.annaly.com. The replay of the call is available for one week following the conference call. The replay number is 877-344-7529 for domestic calls and 412-317-0088 for international calls and the conference passcode is 10064724. If you would like to be added to the e-mail distribution list, please visit www.annaly.com, click on Investor Relations, then select Email Alerts and complete the email notification form.
This news release and our public documents to which we refer contain or incorporate by reference certain forward-looking statements which are based on various assumptions (some of which are beyond our control) and may be identified by reference to a future period or periods or by the use of forward-looking terminology, such as "may," "will," "believe," "expect," "anticipate," "continue," or similar terms or variations on those terms or the negative of those terms. Actual results could differ materially from those set forth in forward-looking statements due to a variety of factors, including, but not limited to, changes in interest rates; changes in the yield curve; changes in prepayment rates; the availability of mortgage-backed securities and other securities for purchase; the availability of financing and, if available, the terms of any financings; changes in the market value of our assets; changes in business conditions and the general economy; our ability to grow the commercial mortgage business; credit risks related to our investments in commercial real estate assets and corporate debt; our ability to consummate any contemplated investment opportunities; changes in government regulations affecting our business; our ability to maintain our qualification as a REIT for federal income tax purposes; our ability to maintain our exemption from registration under the Investment Company Act of 1940, as amended; risks associated with the businesses of our subsidiaries, including the investment advisory business of a wholly-owned subsidiary and the broker-dealer business of a wholly-owned subsidiary. For a discussion of the risks and uncertainties which could cause actual results to differ from those contained in the forward-looking statements, see "Risk Factors" in our most recent Annual Report on Form 10-K and any subsequent Quarterly Reports on Form 10-Q. We do not undertake, and specifically disclaim any obligation, to publicly release the result of any revisions which may be made to any forward-looking statements to reflect the occurrence of anticipated or unanticipated events or circumstances after the date of such statements.
7
|
ANNALY CAPITAL MANAGEMENT, INC. AND SUBSIDIARIES
|
||||||||||||||||||||
|
CONSOLIDATED STATEMENTS OF FINANCIAL CONDITION
|
||||||||||||||||||||
|
(dollars in thousands, except per share data)
|
||||||||||||||||||||
|
March 31,
|
December 31,
|
September 30,
|
June 30,
|
March 31,
|
||||||||||||||||
|
2015
|
2014(1)
|
2014
|
2014
|
2014
|
||||||||||||||||
|
(Unaudited)
|
(Unaudited)
|
(Unaudited)
|
(Unaudited)
|
|||||||||||||||||
|
ASSETS
|
||||||||||||||||||||
|
Cash and cash equivalents
|
$ | 1,920,326 | $ | 1,741,244 | $ | 1,178,621 | $ | 1,320,666 | $ | 924,197 | ||||||||||
|
Reverse repurchase agreements
|
100,000 | 100,000 | - | - | 444,375 | |||||||||||||||
|
Securities borrowed
|
- | - | - | - | 513,500 | |||||||||||||||
|
Investments, at fair value:
|
||||||||||||||||||||
|
Agency mortgage-backed securities
|
69,388,001 | 81,565,256 | 81,462,387 | 81,055,337 | 75,350,388 | |||||||||||||||
|
Agency debentures
|
995,408 | 1,368,350 | 1,334,181 | 1,348,727 | 2,408,259 | |||||||||||||||
|
Agency CRT securities
|
108,337 | - | - | - | - | |||||||||||||||
|
Commercial real estate debt investments (2)
|
1,515,903 | - | - | - | - | |||||||||||||||
|
Investment in affiliate
|
141,246 | 143,045 | 136,748 | 143,495 | 137,647 | |||||||||||||||
|
Commercial real estate debt and preferred equity, held for investment (3)
|
1,498,406 | 1,518,165 | 1,554,958 | 1,586,169 | 1,640,206 | |||||||||||||||
|
Investments in commercial real estate
|
207,209 | 210,032 | 73,827 | 74,355 | 40,313 | |||||||||||||||
|
Corporate debt, held for investment
|
227,830 | 166,464 | 144,451 | 151,344 | 145,394 | |||||||||||||||
|
Receivable for investments sold
|
2,009,937 | 1,010,094 | 855,161 | 856,983 | 19,116 | |||||||||||||||
|
Accrued interest and dividends receivable
|
247,801 | 278,489 | 287,231 | 283,423 | 276,007 | |||||||||||||||
|
Receivable for investment advisory income
|
10,268 | 10,402 | 8,369 | 6,380 | 6,498 | |||||||||||||||
|
Goodwill
|
94,781 | 94,781 | 94,781 | 94,781 | 94,781 | |||||||||||||||
|
Interest rate swaps, at fair value
|
25,908 | 75,225 | 198,066 | 170,604 | 340,890 | |||||||||||||||
|
Other derivatives, at fair value
|
113,503 | 5,499 | 19,407 | 7,938 | 40,105 | |||||||||||||||
|
Other assets
|
70,813 | 68,321 | 39,798 | 50,743 | 33,101 | |||||||||||||||
|
Total assets
|
$ | 78,675,677 | $ | 88,355,367 | $ | 87,387,986 | $ | 87,150,945 | $ | 82,414,777 | ||||||||||
|
LIABILITIES AND STOCKHOLDERS’ EQUITY
|
||||||||||||||||||||
|
Liabilities:
|
||||||||||||||||||||
|
Repurchase agreements
|
$ | 60,477,378 | $ | 71,361,926 | $ | 69,610,722 | $ | 70,372,218 | $ | 64,543,949 | ||||||||||
|
Securities loaned
|
- | - | 7 | 7 | 513,510 | |||||||||||||||
|
Payable for investments purchased
|
5,205 | 264,984 | 2,153,789 | 781,227 | 1,898,507 | |||||||||||||||
|
Convertible Senior Notes
|
749,512 | 845,295 | 836,625 | 831,167 | 827,486 | |||||||||||||||
|
Securitized debt of consolidated VIEs (4)
|
1,491,829 | 260,700 | 260,700 | 260,700 | 260,700 | |||||||||||||||
|
Mortgages payable
|
146,470 | 146,553 | 42,635 | 30,316 | 19,317 | |||||||||||||||
|
Participation sold
|
13,589 | 13,693 | 13,768 | 13,866 | 13,963 | |||||||||||||||
|
Accrued interest payable
|
155,072 | 180,501 | 180,345 | 157,782 | 170,644 | |||||||||||||||
|
Dividends payable
|
284,310 | 284,293 | 284,278 | 284,261 | 284,247 | |||||||||||||||
|
Interest rate swaps, at fair value
|
2,025,170 | 1,608,286 | 857,658 | 928,789 | 1,272,616 | |||||||||||||||
|
Other derivatives, at fair value
|
61,778 | 8,027 | - | 6,533 | 6,045 | |||||||||||||||
|
Accounts payable and other liabilities
|
140,774 | 47,328 | 36,511 | 35,160 | 39,081 | |||||||||||||||
|
Total liabilities
|
65,551,087 | 75,021,586 | 74,277,038 | 73,702,026 | 69,850,065 | |||||||||||||||
|
Stockholders’ Equity:
|
||||||||||||||||||||
|
7.875% Series A Cumulative Redeemable Preferred Stock:
7,412,500 authorized, issued and outstanding
|
177,088 | 177,088 | 177,088 | 177,088 | 177,088 | |||||||||||||||
|
7.625% Series C Cumulative Redeemable Preferred Stock
12,650,000 authorized, 12,000,000 issued and outstanding
|
290,514 | 290,514 | 290,514 | 290,514 | 290,514 | |||||||||||||||
|
7.50% Series D Cumulative Redeemable Preferred Stock:
18,400,000 authorized, issued and outstanding
|
445,457 | 445,457 | 445,457 | 445,457 | 445,457 | |||||||||||||||
|
Common stock, par value $0.01 per share, 1,956,937,500 authorized,
947,698,431, 947,643,079, 947,591,766, 947,540,823 and 947,488,945
issued and outstanding, respectively
|
9,477 | 9,476 | 9,476 | 9,475 | 9,475 | |||||||||||||||
|
Additional paid-in capital
|
14,787,117 | 14,786,509 | 14,781,308 | 14,776,302 | 14,770,553 | |||||||||||||||
|
Accumulated other comprehensive income (loss)
|
773,999 | 204,883 | (967,820 | ) | (572,256 | ) | (2,088,479 | ) | ||||||||||||
|
Accumulated deficit
|
(3,364,147 | ) | (2,585,436 | ) | (1,625,075 | ) | (1,677,661 | ) | (1,039,896 | ) | ||||||||||
|
Total stockholders’ equity
|
13,119,505 | 13,328,491 | 13,110,948 | 13,448,919 | 12,564,712 | |||||||||||||||
|
Noncontrolling interest
|
5,085 | 5,290 | - | - | - | |||||||||||||||
|
Total equity
|
13,124,590 | 13,333,781 | 13,110,948 | 13,448,919 | 12,564,712 | |||||||||||||||
|
Total liabilities and equity
|
$ | 78,675,677 | $ | 88,355,367 | $ | 87,387,986 | $ | 87,150,945 | $ | 82,414,777 | ||||||||||
| (1) | Derived from the audited consolidated financial statements at December 31, 2014. |
| (2) | Includes senior securitized commercial mortgage loans of consolidated VIE with a carrying value of $1.4 billion at March 31, 2015. |
| (3) | Includes senior securitized commercial mortgage loans of consolidated VIE with a carrying value of $361.2 million, $398.6 million, $398.4 million, $398.3 million and $398.1 million, respectively. |
| (4) |
Includes securitized debt of a consolidated VIE carried at fair value of $1.3 billion at March 31, 2015.
|
8
|
ANNALY CAPITAL MANAGEMENT, INC. AND SUBSIDIARIES
|
||||||||||||||||||||
|
CONSOLIDATED STATEMENTS OF COMPREHENSIVE INCOME (LOSS)
|
||||||||||||||||||||
|
(UNAUDITED)
|
||||||||||||||||||||
|
(dollars in thousands, except per share data)
|
||||||||||||||||||||
|
For the quarters ended
|
||||||||||||||||||||
|
March 31,
|
December 31,
|
September 30,
|
June 30,
|
March 31,
|
||||||||||||||||
|
2015
|
2014
|
2014
|
2014
|
2014
|
||||||||||||||||
|
Net interest income:
|
||||||||||||||||||||
|
Interest income
|
$ | 519,172 | $ | 648,144 | $ | 644,640 | $ | 683,962 | $ | 655,901 | ||||||||||
|
Interest expense
|
129,420 | 134,512 | 127,069 | 126,107 | 124,971 | |||||||||||||||
|
Net interest income
|
389,752 | 513,632 | 517,571 | 557,855 | 530,930 | |||||||||||||||
|
Other income (loss):
|
||||||||||||||||||||
|
Realized gains (losses) on interest rate swaps(1)
|
(158,239 | ) | (174,908 | ) | (169,083 | ) | (220,934 | ) | (260,435 | ) | ||||||||||
|
Realized gains (losses) on termination of interest rate swaps
|
(226,462 | ) | - | - | (772,491 | ) | (6,842 | ) | ||||||||||||
|
Unrealized gains (losses) on interest rate swaps
|
(466,202 | ) | (873,468 | ) | 98,593 | 175,062 | (348,942 | ) | ||||||||||||
|
Subtotal
|
(850,903 | ) | (1,048,376 | ) | (70,490 | ) | (818,363 | ) | (616,219 | ) | ||||||||||
|
Investment advisory income
|
10,464 | 10,858 | 8,253 | 6,109 | 6,123 | |||||||||||||||
|
Net gains (losses) on disposal of investments
|
62,356 | 3,420 | 4,693 | 5,893 | 79,710 | |||||||||||||||
|
Dividend income from affiliate
|
4,318 | 4,048 | 4,048 | 4,048 | 13,045 | |||||||||||||||
|
Net gains (losses) on trading assets
|
(6,906 | ) | (57,454 | ) | 4,676 | (46,489 | ) | (146,228 | ) | |||||||||||
|
Net unrealized gains (losses) on interest-only Agency mortgage-backed securities
|
(33,546 | ) | (29,520 | ) | (37,944 | ) | 2,085 | (20,793 | ) | |||||||||||
|
Other income (loss)
|
(1,082 | ) | 3,365 | (22,249 | ) | 4,687 | 1,460 | |||||||||||||
|
Subtotal
|
35,604 | (65,283 | ) | (38,523 | ) | (23,667 | ) | (66,683 | ) | |||||||||||
|
Total other income (loss)
|
(815,299 | ) | (1,113,659 | ) | (109,013 | ) | (842,030 | ) | (682,902 | ) | ||||||||||
|
General and administrative expenses:
|
||||||||||||||||||||
|
Compensation and management fee
|
38,629 | 38,734 | 39,028 | 39,277 | 38,521 | |||||||||||||||
|
Other general and administrative expenses
|
12,309 | 19,720 | 12,289 | 12,912 | 8,857 | |||||||||||||||
|
Total general and administrative expenses
|
50,938 | 58,454 | 51,317 | 52,189 | 47,378 | |||||||||||||||
|
Income (loss) before income taxes
|
(476,485 | ) | (658,481 | ) | 357,241 | (336,364 | ) | (199,350 | ) | |||||||||||
|
Income taxes
|
14 | (209 | ) | 2,385 | (852 | ) | 4,001 | |||||||||||||
|
Net income (loss)
|
(476,499 | ) | (658,272 | ) | 354,856 | (335,512 | ) | (203,351 | ) | |||||||||||
|
Net income (loss) attributable to noncontrolling interest
|
(90 | ) | (196 | ) | - | - | - | |||||||||||||
|
Net income (loss) attributable to Annaly
|
(476,409 | ) | (658,076 | ) | 354,856 | (335,512 | ) | (203,351 | ) | |||||||||||
|
Dividends on preferred stock
|
17,992 | 17,992 | 17,992 | 17,992 | 17,992 | |||||||||||||||
|
Net income (loss) available (related) to common stockholders
|
$ | (494,401 | ) | $ | (676,068 | ) | $ | 336,864 | $ | (353,504 | ) | $ | (221,343 | ) | ||||||
|
Net income (loss) per share available (related) to common stockholders:
|
||||||||||||||||||||
|
Basic
|
$ | (0.52 | ) | $ | (0.71 | ) | $ | 0.36 | $ | (0.37 | ) | $ | (0.23 | ) | ||||||
|
Diluted
|
$ | (0.52 | ) | $ | (0.71 | ) | $ | 0.35 | $ | (0.37 | ) | $ | (0.23 | ) | ||||||
|
Weighted average number of common shares outstanding:
|
||||||||||||||||||||
|
Basic
|
947,669,831 | 947,615,793 | 947,565,432 | 947,515,127 | 947,458,813 | |||||||||||||||
|
Diluted
|
947,669,831 | 947,615,793 | 987,315,527 | 947,515,127 | 947,458,813 | |||||||||||||||
|
Net income (loss)
|
$ | (476,499 | ) | $ | (658,272 | ) | $ | 354,856 | $ | (335,512 | ) | $ | (203,351 | ) | ||||||
|
Other comprehensive income (loss):
|
||||||||||||||||||||
|
Unrealized gains (losses) on available-for-sale securities
|
631,472 | 1,175,864 | (390,871 | ) | 1,522,126 | 741,172 | ||||||||||||||
|
Reclassification adjustment for net (gains) losses included in net income (loss)
|
(62,356 | ) | (3,161 | ) | (4,693 | ) | (5,903 | ) | (80,718 | ) | ||||||||||
|
Other comprehensive income (loss)
|
569,116 | 1,172,703 | (395,564 | ) | 1,516,223 | 660,454 | ||||||||||||||
|
Comprehensive income (loss)
|
92,617 | 514,431 | (40,708 | ) | 1,180,711 | 457,103 | ||||||||||||||
|
Comprehensive income (loss) attributable to noncontrolling interest
|
(90 | ) | (196 | ) | - | - | - | |||||||||||||
|
Comprehensive income (loss) attributable to Annaly
|
$ | 92,707 | $ | 514,627 | $ | (40,708 | ) | $ | 1,180,711 | $ | 457,103 | |||||||||
| (1) |
Interest expense related to the Company’s interest rate swaps is recorded in Realized gains (losses) on interest rate swaps on the Consolidated Statements of Comprehensive Income (Loss).
|
9
Exhibit 99.2

1Q 2015 Stockholder Supplement May 6, 2015
Safe Harbor Notice This news release and our public documents to which we refer contain or incorporate by reference certain forward-looking statements which are based on various assumptions (some of which are beyond our control) and may be identified by reference to a future period or periods or by the use of forward-looking terminology, such as "may," "will," "believe," "expect," "anticipate," "continue," or similar terms or variations on those terms or the negative of those terms. Actual results could differ materially from those set forth in forward-looking statements due to a variety of factors, including, but not limited to, changes in interest rates; changes in the yield curve; changes in prepayment rates; the availability of mortgage-backed securities and other securities for purchase; the availability of financing and, if available, the terms of any financings; changes in the market value of our assets; changes in business conditions and the general economy; our ability to grow the commercial mortgage business; credit risks related to our investments in commercial real estate assets and corporate debt; our ability to consummate any contemplated investment opportunities; changes in government regulations affecting our business; our ability to maintain our qualification as a REIT for federal income tax purposes; our ability to maintain our exemption from registration under the Investment Company Act of 1940, as amended; risks associated with the businesses of our subsidiaries, including the investment advisory business of a wholly-owned subsidiary and the broker-dealer business of a wholly-owned subsidiary. For a discussion of the risks and uncertainties which could cause actual results to differ from those contained in the forward-looking statements, see "Risk Factors" in our most recent Annual Report on Form 10-K and any subsequent Quarterly Reports on Form 10-Q. We do not undertake, and specifically disclaim any obligation, to publicly release the result of any revisions which may be made to any forward-looking statements to reflect the occurrence of anticipated or unanticipated events or circumstances after the date of such statements. 1
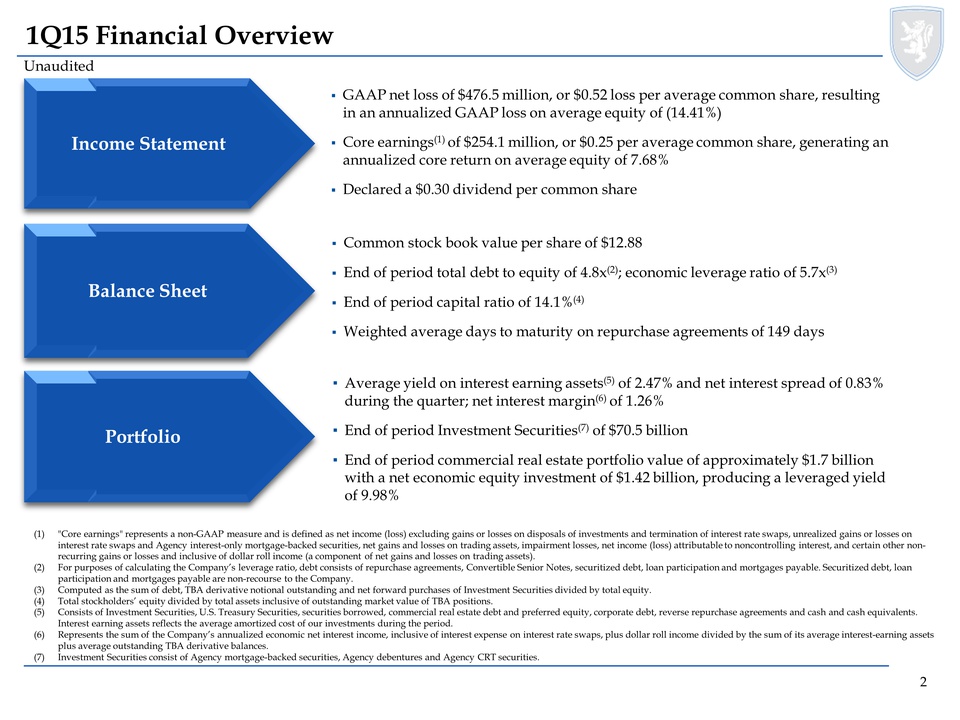
1Q15 Financial Overview Unaudited GAAP net loss of $476.5 million, or $0.52 loss per average common share, resulting in an annualized GAAP loss on average equity of (14.41%) Core earnings(1) of $254.1 million, or $0.25 per average common share, generating an annualized core return on average equity of 7.68% Declared a $0.30 dividend per common share Common stock book value per share of $12.88 End of period total debt to equity of 4.8x(2); economic leverage ratio of 5.7x(3) End of period capital ratio of 14.1%(4) Weighted average days to maturity on repurchase agreements of 149 days Average yield on interest earning assets(5) of 2.47% and net interest spread of 0.83% during the quarter; net interest margin(6) of 1.26% End of period Investment Securities(7) of $70.5 billion End of period commercial real estate portfolio value of approximately $1.7 billion with a net economic equity investment of $1.42 billion, producing a leveraged yield of 9.98% Income Statement Balance Sheet Portfolio (1) "Core earnings" represents a non-GAAP measure and is defined as net income (loss) excluding gains or losses on disposals of investments and termination of interest rate swaps, unrealized gains or losses on interest rate swaps and Agency interest-only mortgage-backed securities, net gains and losses on trading assets, impairment losses, net income (loss) attributable to noncontrolling interest, and certain other nonrecurring gains or losses and inclusive of dollar roll income (a component of net gains and losses on trading assets). (2) For purposes of calculating the Company’s leverage ratio, debt consists of repurchase agreements, Convertible Senior Notes, securitized debt, loan participation and mortgages payable. Securitized debt, loan participation and mortgages payable are non-recourse to the Company. (3) Computed as the sum of debt, TBA derivative notional outstanding and net forward purchases of Investment Securities divided by total equity. (4) Total stockholders’ equity divided by total assets inclusive of outstanding market value of TBA positions. (5) Consists of Investment Securities, U.S. Treasury Securities, securities borrowed, commercial real estate debt and preferred equity, corporate debt, reverse repurchase agreements and cash and cash equivalents. Interest earning assets reflects the average amortized cost of our investments during the period. (6) Represents the sum of the Company’s annualized economic net interest income, inclusive of interest expense on interest rate swaps, plus dollar roll income divided by the sum of its average interest-earning assets plus average outstanding TBA derivative balances. (7) Investment Securities consist of Agency mortgage-backed securities, Agency debentures and Agency CRT securities. 2
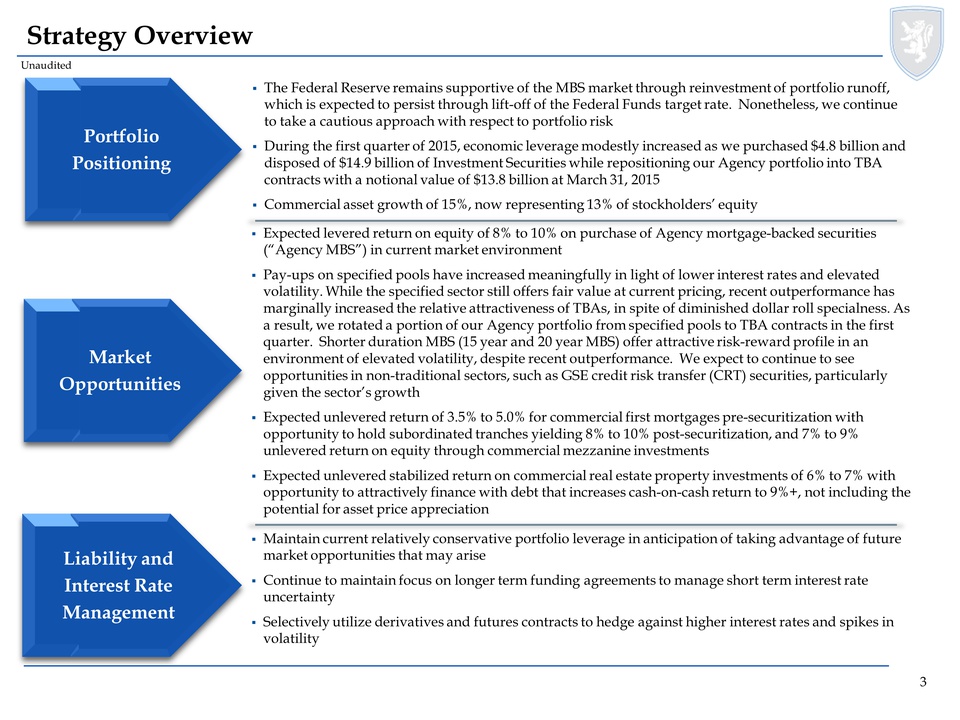
Strategy Overview Unaudited Portfolio Positioning Market Opportunities Liability and Interest Rate Management The Federal Reserve remains supportive of the MBS market through reinvestment of portfolio runoff, which is expected to persist through lift-off of the Federal Funds target rate. Nonetheless, we continue to take a cautious approach with respect to portfolio risk During the first quarter of 2015, economic leverage modestly increased as we purchased $4.8 billion and disposed of $14.9 billion of Investment Securities while repositioning our Agency portfolio into TBA contracts with a notional value of $13.8 billion at March 31, 2015 Commercial asset growth of 15%, now representing 13% of stockholders’ equity Expected levered return on equity of 8% to 10% on purchase of Agency mortgage-backed securities (“Agency MBS”) in current market environment Pay-ups on specified pools have increased meaningfully in light of lower interest rates and elevated volatility. While the specified sector still offers fair value at current pricing, recent outperformance has marginally increased the relative attractiveness of TBAs, in spite of diminished dollar roll specialness. As a result, we rotated a portion of our Agency portfolio from specified pools to TBA contracts in the first quarter. Shorter duration MBS (15 year and 20 year MBS) offer attractive risk-reward profile in an environment of elevated volatility, despite recent outperformance. We expect to continue to see opportunities in non-traditional sectors, such as GSE credit risk transfer (CRT) securities, particularly given the sector’s growth Expected unlevered return of 3.5% to 5.0% for commercial first mortgages pre-securitization with opportunity to hold subordinated tranches yielding 8% to 10% post-securitization, and 7% to 9% unlevered return on equity through commercial mezzanine investments Expected unlevered stabilized return on commercial real estate property investments of 6% to 7% with opportunity to attractively finance with debt that increases cash-on-cash return to 9%+, not including the potential for asset price appreciation Maintain current relatively conservative portfolio leverage in anticipation of taking advantage of future market opportunities that may arise Continue to maintain focus on longer term funding agreements to manage short term interest rate uncertainty Selectively utilize derivatives and futures contracts to hedge against higher interest rates and spikes in volatility 3
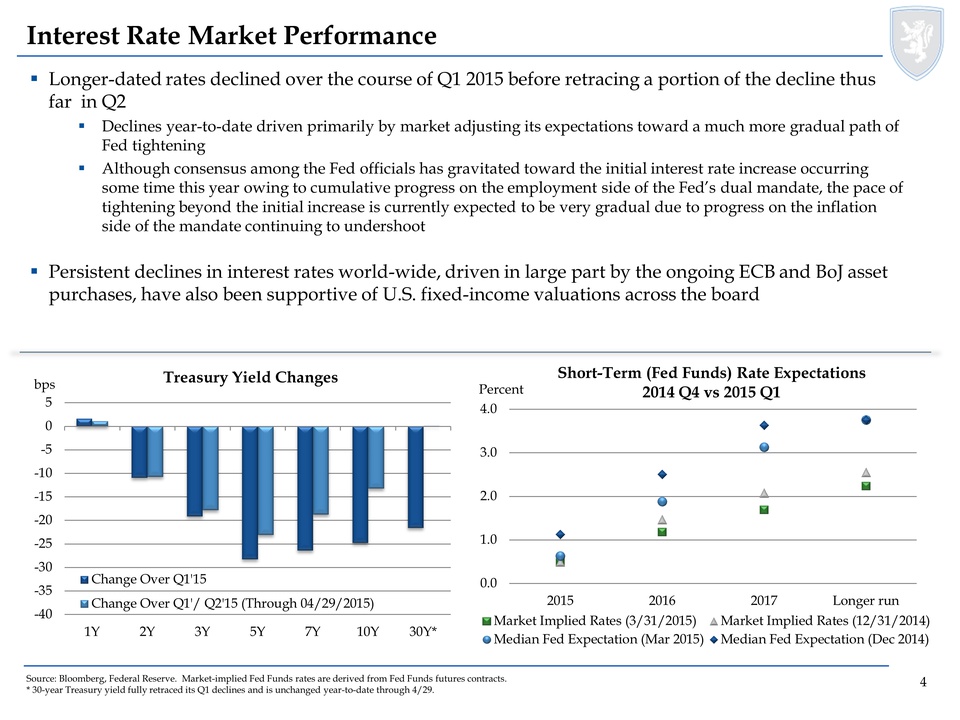
Interest Rate Market Performance Longer-dated rates declined over the course of Q1 2015 before retracing a portion of the decline thus far in Q2 Declines year-to-date driven primarily by market adjusting its expectations toward a much more gradual path of Fed tightening Although consensus among the Fed officials has gravitated toward the initial interest rate increase occurring some time this year owing to cumulative progress on the employment side of the Fed’s dual mandate, the pace of tightening beyond the initial increase is currently expected to be very gradual due to progress on the inflation side of the mandate continuing to undershoot Persistent declines in interest rates world-wide, driven in large part by the ongoing ECB and BoJ asset purchases, have also been supportive of U.S. fixed-income valuations across the board Treasury Yield Changes Short-Term (Fed Funds) Rate Expectations 2014 Q4 vs 2015 Q1 Source: Bloomberg, Federal Reserve. Market-implied Fed Funds rates are derived from Fed Funds futures contracts. * 30-year Treasury yield fully retraced its Q1 declines and is unchanged year-to-date through 4/29. 4
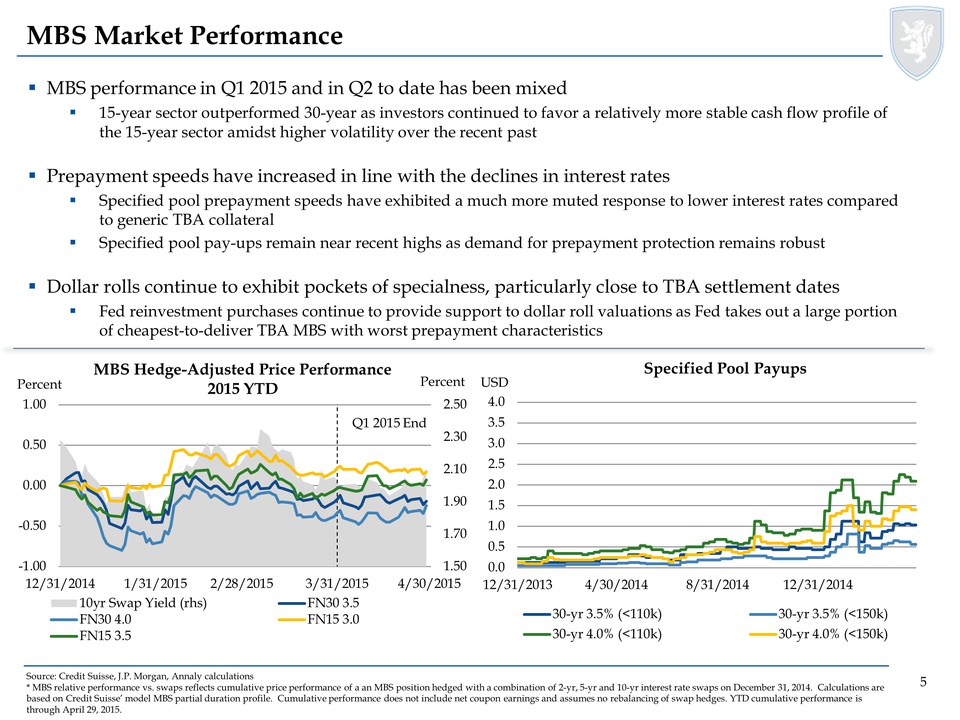
MBS Market Performance MBS performance in Q1 2015 and in Q2 to date has been mixed 15-year sector outperformed 30-year as investors continued to favor a relatively more stable cash flow profile of the 15-year sector amidst higher volatility over the recent past Prepayment speeds have increased in line with the declines in interest rates Specified pool prepayment speeds have exhibited a much more muted response to lower interest rates compared to generic TBA collateral Specified pool pay-ups remain near recent highs as demand for prepayment protection remains robust Dollar rolls continue to exhibit pockets of specialness, particularly close to TBA settlement dates Fed reinvestment purchases continue to provide support to dollar roll valuations as Fed takes out a large portion of cheapest-to-deliver TBA MBS with worst prepayment characteristics MBS Hedge-Adjusted Price Performance 2015 YTD Specified Pool Payups Source: Credit Suisse, J.P. Morgan, Annaly calculations * MBS relative performance vs. swaps reflects cumulative price performance of a an MBS position hedged with a combination of 2-yr, 5-yr and 10-yr interest rate swaps on December 31, 2014. Calculations are based on Credit Suisse’ model MBS partial duration profile. Cumulative performance does not include net coupon earnings and assumes no rebalancing of swap hedges. YTD cumulative performance is through April 29, 2015. 5
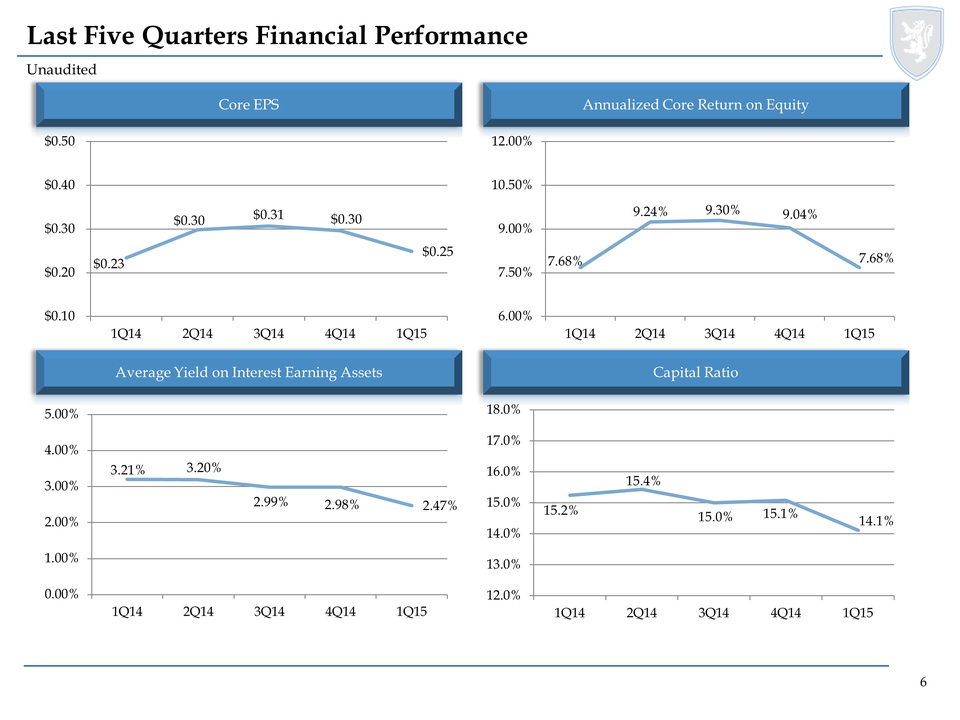
Last Five Quarters Financial Performance Unaudited Core EPS Annualized Core Return on Equity Average Yield on Interest Earning Assets Capital Ratio 6
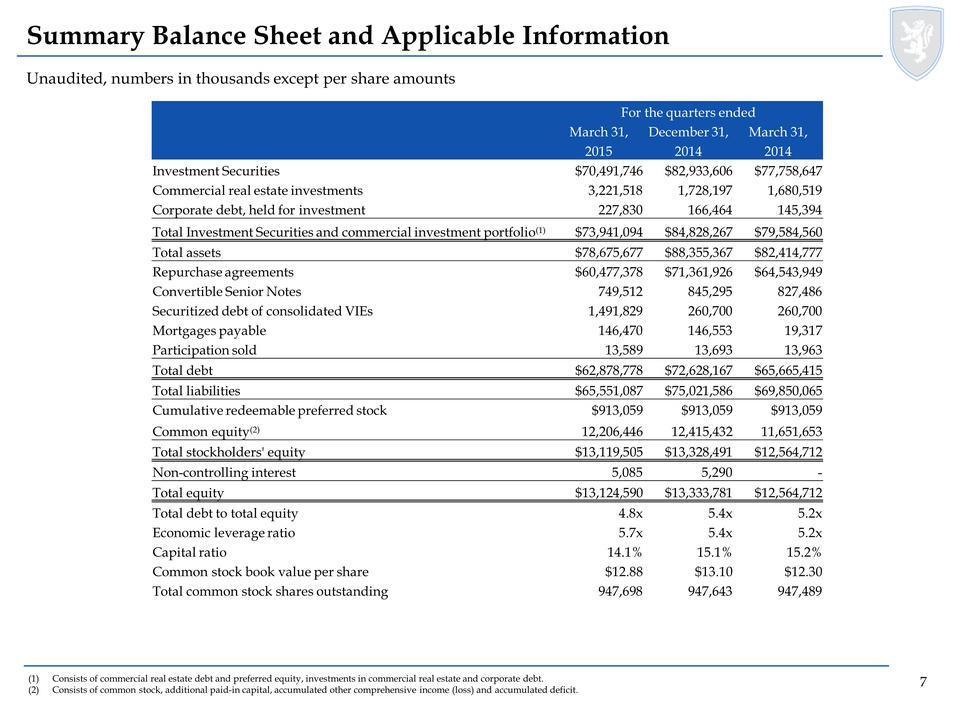
Summary Balance Sheet and Applicable Information Unaudited, numbers in thousands except per share amounts For the quarters ended March 31, December 31, March 31, 2015 2014 2014 Investment Securities $70,491,746 $82,933,606 $77,758,647 Commercial real estate investments 3,221,518 1,728,197 1,680,519 Corporate debt, held for investment 227,830 166,464 145,394 Total Investment Securities and commercial investment portfolio(1) $73,941,094 $84,828,267 $79,584,560 Total assets $78,675,677 $88,355,367 $82,414,777 Repurchase agreements $60,477,378 $71,361,926 $64,543,949 Convertible Senior Notes 749,512 845,295 827,486 Securitized debt of consolidated VIEs 1,491,829 260,700 260,700 Mortgages payable 146,470 146,553 19,317 Participation sold 13,589 13,693 13,963 Total debt $62,878,778 $72,628,167 $65,665,415 Total liabilities $65,551,087 $75,021,586 $69,850,065 Cumulative redeemable preferred stock $913,059 $913,059 $913,059 Common equity(2) 12,206,446 12,415,432 11,651,653 Total stockholders' equity $13,119,505 $13,328,491 $12,564,712 Non-controlling interest 5,085 5,290 - Total equity $13,124,590 $13,333,781 $12,564,712 Total debt to total equity 4.8x 5.4x 5.2x Economic leverage ratio 5.7x 5.4x 5.2x Capital ratio 14.1% 15.1% 15.2% Common stock book value per share $12.88 $13.10 $12.30 Total common stock shares outstanding 947,698 947,643 947,489 (1) Consists of commercial real estate debt and preferred equity, investments in commercial real estate and corporate debt. (2) Consists of common stock, additional paid-in capital, accumulated other comprehensive income (loss) and accumulated deficit. 7
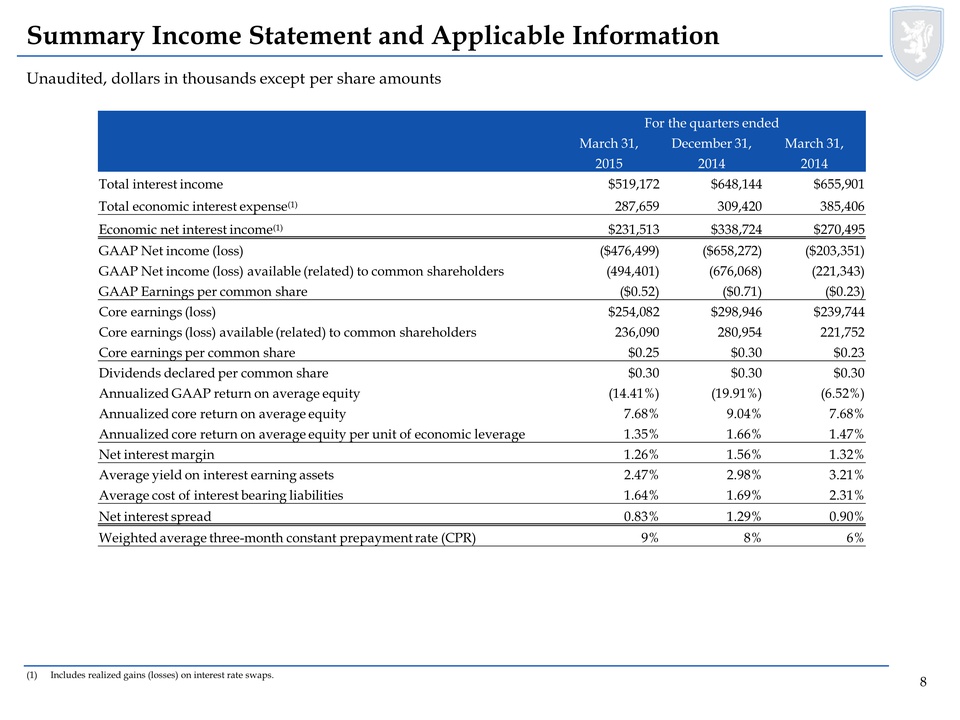
Summary Income Statement and Applicable Information Unaudited, dollars in thousands except per share amounts For the quarters ended March 31, December 31, March 31, 2015 2014 2014 Total interest income $519,172 $648,144 $655,901 Total economic interest expense(1) 287,659 309,420 385,406 Economic net interest income(1) $231,513 $338,724 $270,495 GAAP Net income (loss) ($476,499) ($658,272) ($203,351) GAAP Net income (loss) available (related) to common shareholders (494,401) (676,068) (221,343) GAAP Earnings per common share ($0.52) ($0.71) ($0.23) Core earnings (loss) $254,082 $298,946 $239,744 Core earnings (loss) available (related) to common shareholders 236,090 280,954 221,752 Core earnings per common share $0.25 $0.30 $0.23 Dividends declared per common share $0.30 $0.30 $0.30 Annualized GAAP return on average equity (14.41%) (19.91%) (6.52%) Annualized core return on average equity 7.68% 9.04% 7.68% Annualized core return on average equity per unit of economic leverage 1.35% 1.66% 1.47% Net interest margin 1.26% 1.56% 1.32% Average yield on interest earning assets 2.47% 2.98% 3.21% Average cost of interest bearing liabilities 1.64% 1.69% 2.31% Net interest spread 0.83% 1.29% 0.90% Weighted average three-month constant prepayment rate (CPR) 9% 8% 6% (1) Includes realized gains (losses) on interest rate swaps. 8
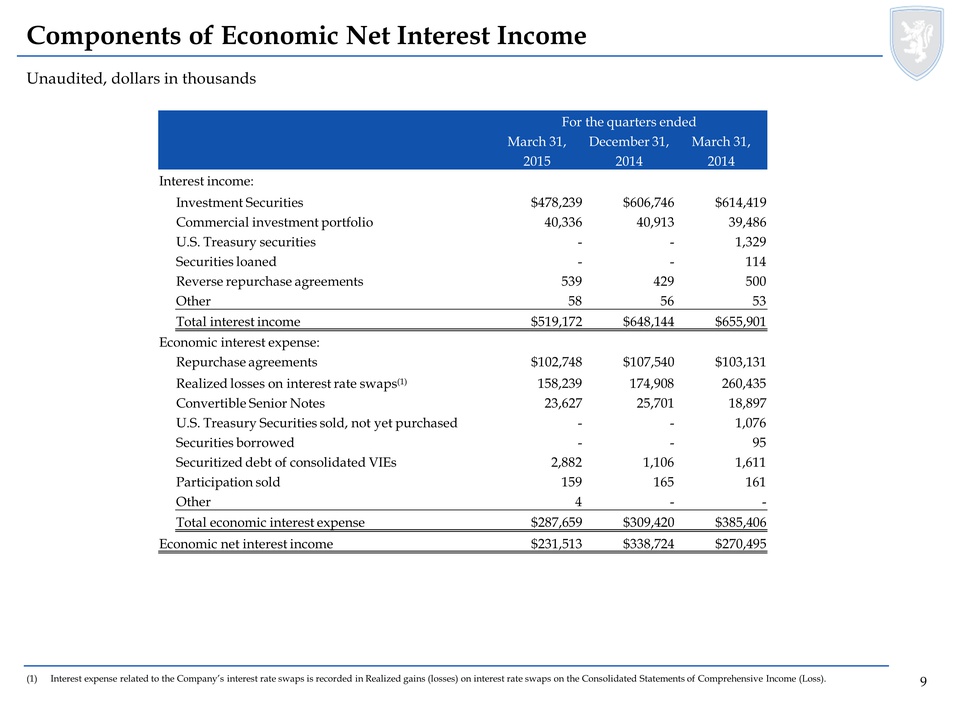
Components of Economic Net Interest Income Unaudited, dollars in thousands For the quarters ended March 31, December 31, March 31, 2015 2014 2014 Interest income: Investment Securities $478,239 $606,746 $614,419 Commercial investment portfolio 40,336 40,913 39,486 U.S. Treasury securities - - 1,329 Securities loaned - - 114 Reverse repurchase agreements 539 429 500 Other 58 56 53 Total interest income $519,172 $648,144 $655,901 Economic interest expense: Repurchase agreements $102,748 $107,540 $103,131 Realized losses on interest rate swaps(1) 158,239 174,908 260,435 Convertible Senior Notes 23,627 25,701 18,897 U.S. Treasury Securities sold, not yet purchased - - 1,076 Securities borrowed - - 95 Securitized debt of consolidated VIEs 2,882 1,106 1,611 Participation sold 159 165 161 Other 4 - - Total economic interest expense $287,659 $309,420 $385,406 Economic net interest income $231,513 $338,724 $270,495 (1) Interest expense related to the Company’s interest rate swaps is recorded in Realized gains (losses) on interest rate swaps on the Consolidated Statements of Comprehensive Income (Loss). 9
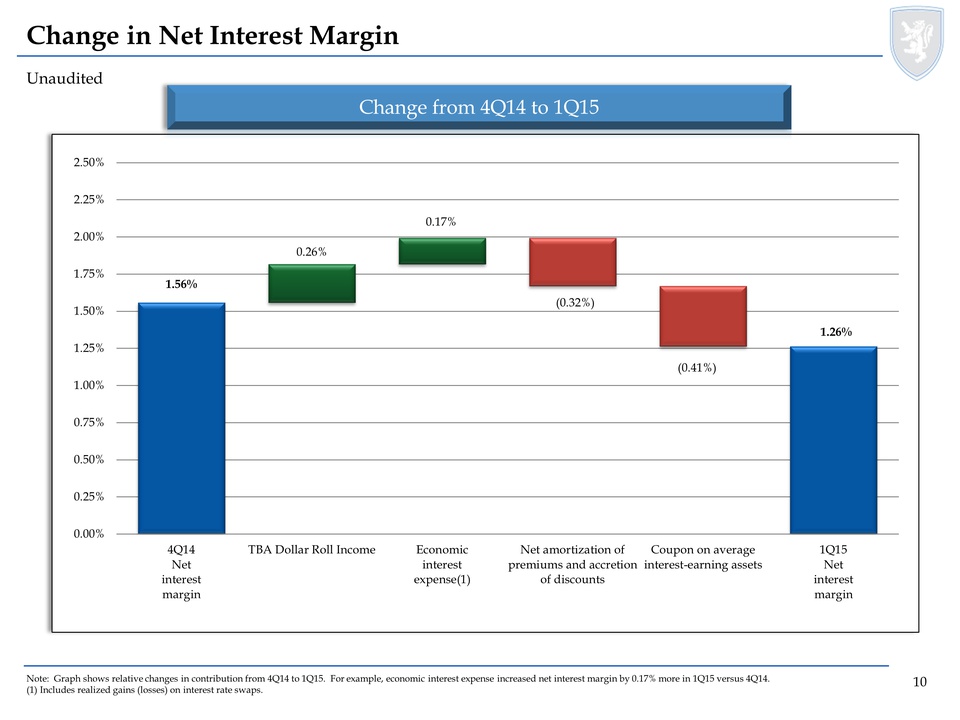
Change in Net Interest Margin Unaudited Change from 4Q14 to 1Q15 1.26% 1.56% 4Q14 Net interest margin TBA Dollar Roll Income Economic interest expense(1) Net amortization of premiums and accretion of discounts Coupon on average interest-earning assets 1Q15 Net interest margin (0.32%) (0.41%) 0.17% 0.26% Note: Graph shows relative changes in contribution from 4Q14 to 1Q15. For example, economic interest expense increased net interest margin by 0.17% more in 1Q15 versus 4Q14. (1) Includes realized gains (losses) on interest rate swaps. 10
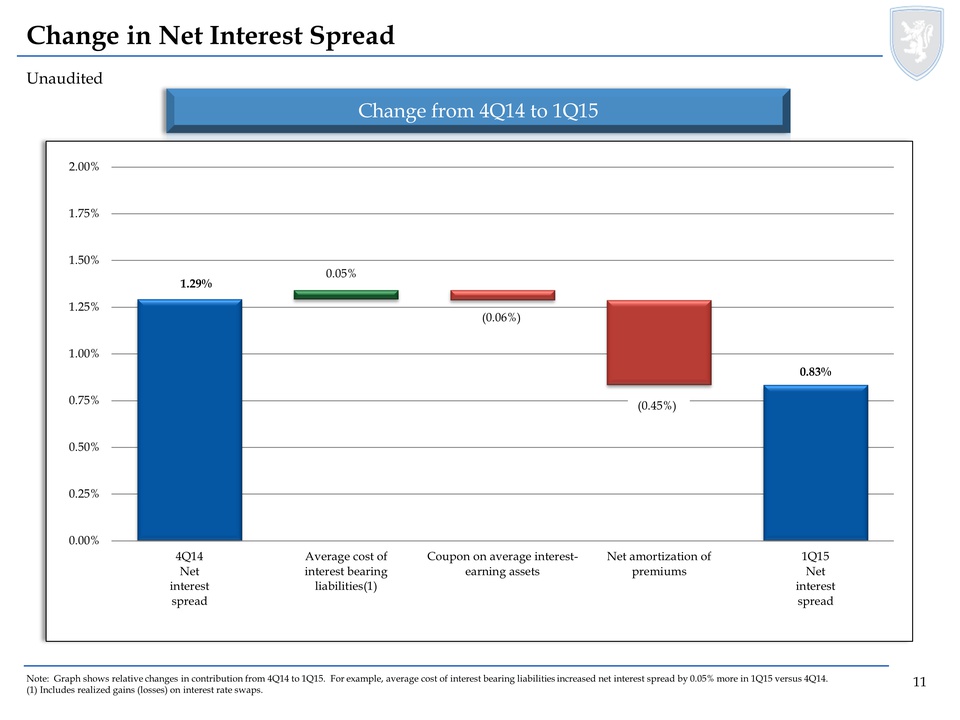
Change in Net Interest Spread Unaudited Change from 4Q14 to 1Q15 0.83% 1.29% 4Q14 Net interest spread Average cost of interest bearing liabilities(1) Coupon on average interest-earning assets Net amortization of premiums 1Q15 Net interest spread 0.05% (0.06%) (0.45%) Note: Graph shows relative changes in contribution from 4Q14 to 1Q15. For example, average cost of interest bearing liabilities increased net interest spread by 0.05% more in 1Q15 versus 4Q14. (1) Includes realized gains (losses) on interest rate swaps. 11
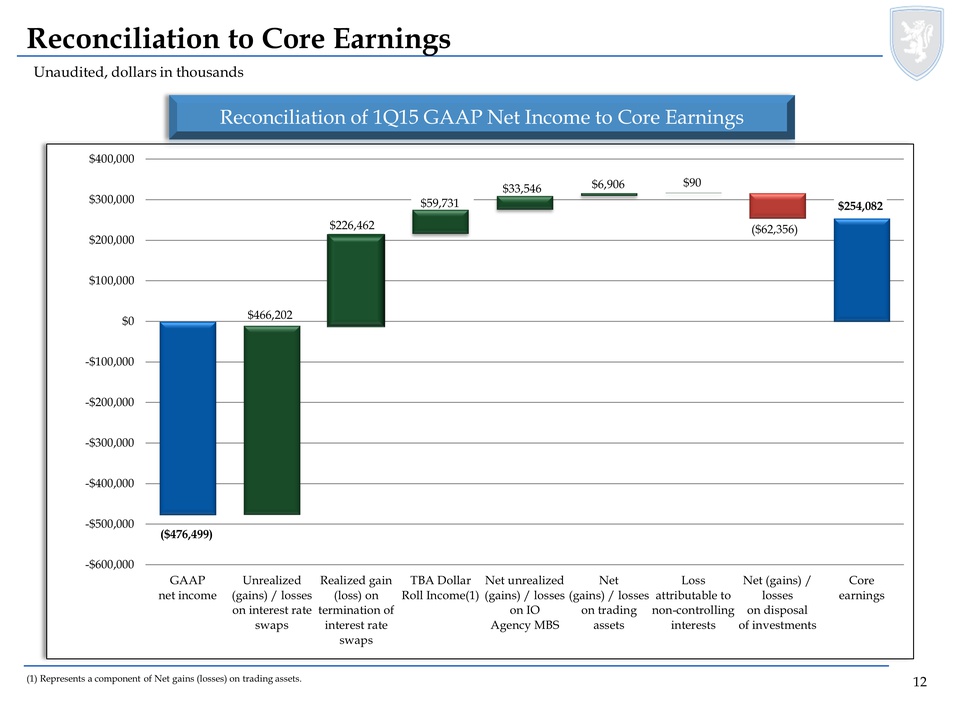
Reconciliation to Core Earnings Unaudited, dollars in thousands Reconciliation of 1Q15 GAAP Net Income to Core Earnings $254,082 ($476,499) GAAP net income Unrealized (gains) / losses on interest rate swaps Realized gain (loss) on termination of interest rate swaps TBA Dollar Roll Income(1) Net unrealized (gains) / losses on IO Agency MBS Net (gains) / losses on trading assets Loss attributable to non-controlling interests Net (gains) / losses on disposal of investments Core earnings $33,546 $6,906 $466,202 $59,731 $90 $226,462 ($62,356) (1) Represents a component of Net gains (losses) on trading assets. 12
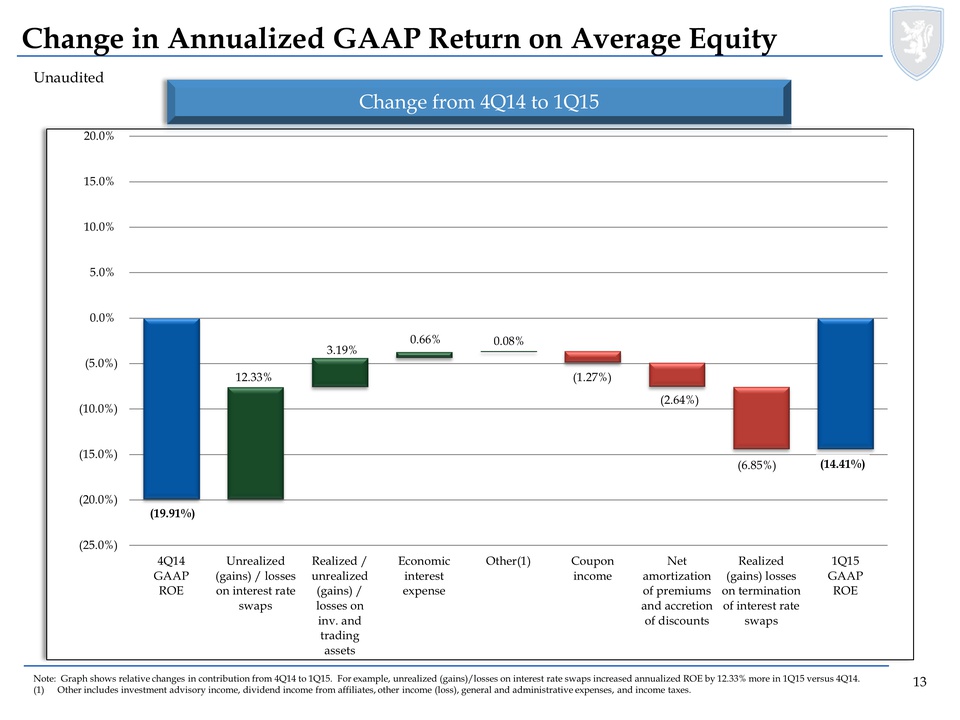
Change in Annualized GAAP Return on Average Equity Unaudited Change from 4Q14 to 1Q15 (14.41%) (19.91%) 4Q14 GAAP ROE Unrealized (gains) / losses on interest rate swaps Realized / unrealized (gains) / losses on inv. and trading assets Economic interest expense Other(1) Coupon income Net amortization of premiums and accretion of discounts Realized (gains) losses on termination of interest rate swaps 1Q15 GAAP ROE (1.27%) 0.66% 0.08% 3.19% 12.33% (6.85%) (2.64%) Note: Graph shows relative changes in contribution from 4Q14 to 1Q15. For example, unrealized (gains)/losses on interest rate swaps increased annualized ROE by 12.33% more in 1Q15 versus 4Q14. (1) Other includes investment advisory income, dividend income from affiliates, other income (loss), general and administrative expenses, and income taxes. 13
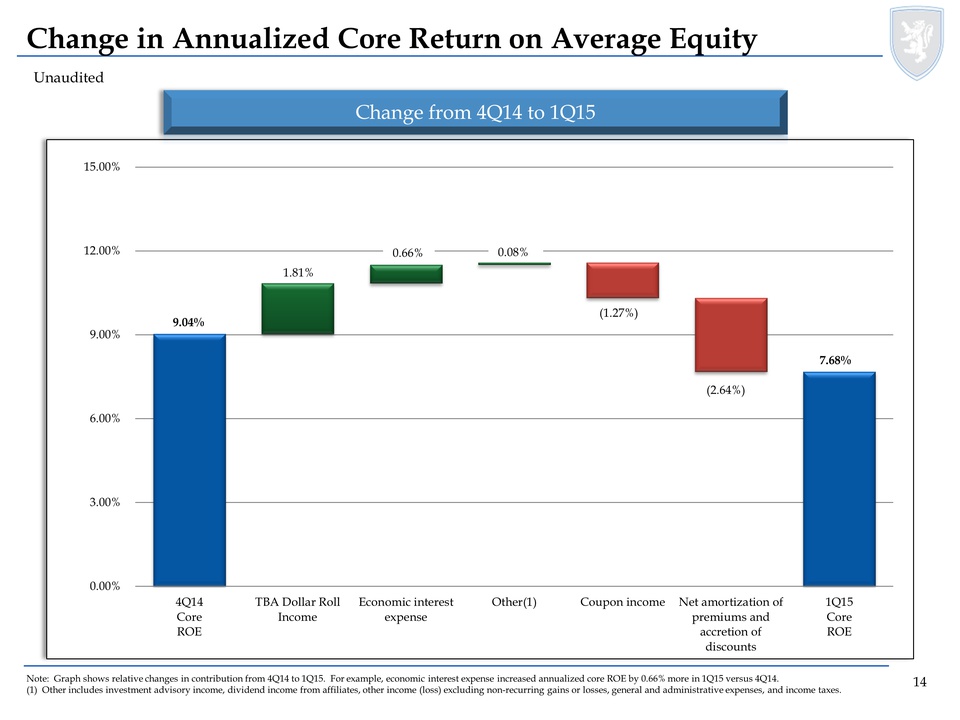
Change in Annualized Core Return on Average Equity Unaudited Change from 4Q14 to 1Q15 7.68% 9.04% 4Q14 Core ROE TBA Dollar Roll Income Economic interest expense Other(1) Coupon income Net amortization of premiums and accretion of discounts 1Q15 Core ROE 0.66% (2.64%) (1.27%) 0.08% 1.81% Note: Graph shows relative changes in contribution from 4Q14 to 1Q15. For example, economic interest expense increased annualized core ROE by 0.66% more in 1Q15 versus 4Q14. (1) Other includes investment advisory income, dividend income from affiliates, other income (loss) excluding non-recurring gains or losses, general and administrative expenses, and income taxes. 14
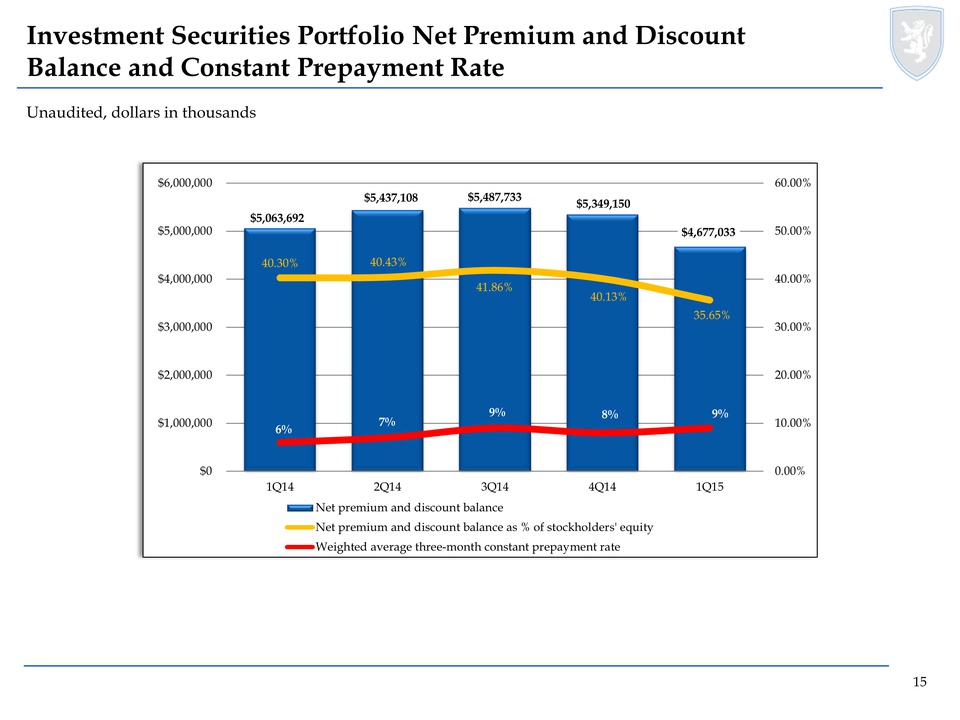
Investment Securities Portfolio Net Premium and Discount Balance and Constant Prepayment Rate Unaudited, dollars in thousands $5,063,692 $5,437,108 $5,487,733 $5,349,150 $4,677,033 40.30% 40.43% 41.86% 40.13% 35.65% 6% 7% 9% 8% 9% Net premium and discount balance Net premium and discount balance as % of stockholders' equity Weighted average three-month constant prepayment rate 15
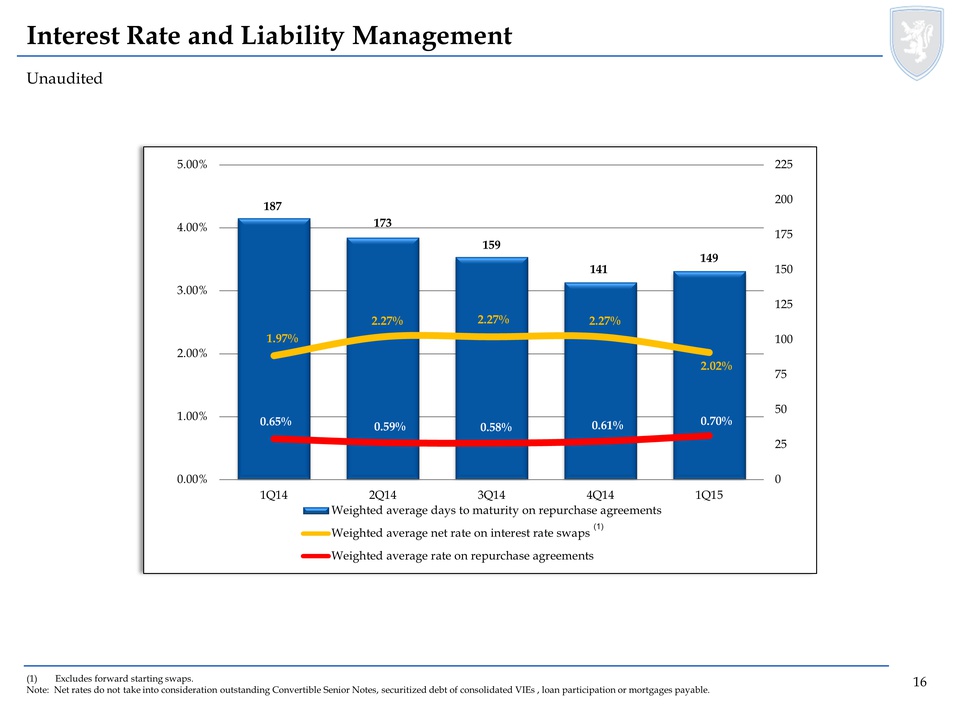
Interest Rate and Liability Management Unaudited 187 173 159 141 149 1.97% 2.27% 2.27% 2.27% 2.02% 0.65% 0.59% 0.58% 0.61% 0.70% Weighted average days to maturity on repurchase agreements Weighted average net rate on interest rate swaps Weighted average rate on repurchase agreements (1) Excludes forward starting swaps. Note: Net rates do not take into consideration outstanding Convertible Senior Notes, securitized debt of consolidated VIEs , loan participation or mortgages payable. 16
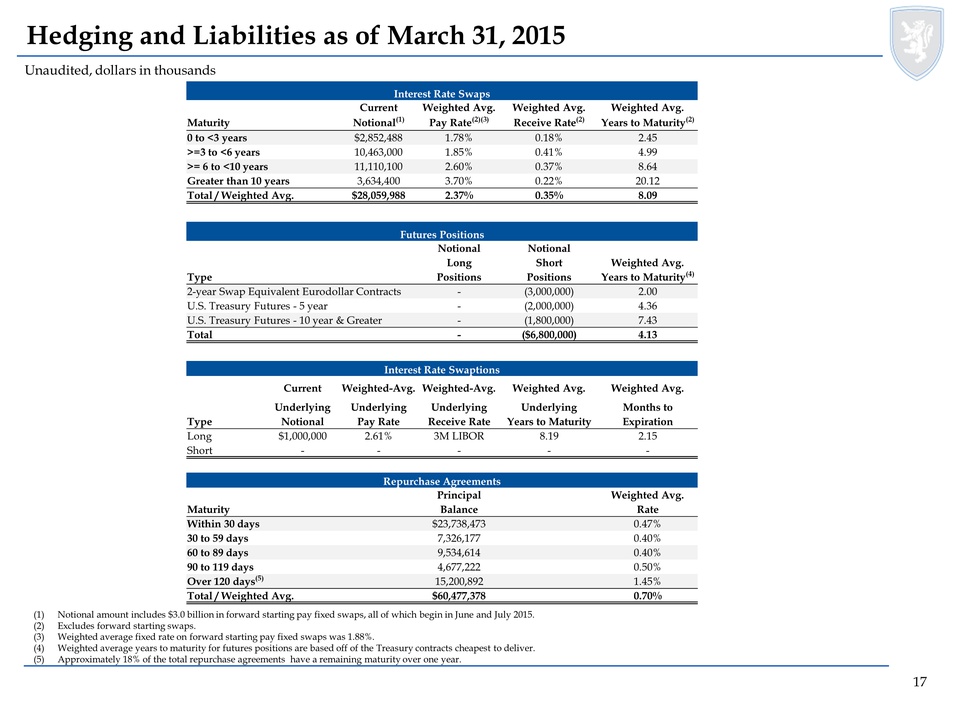
Hedging and Liabilities as of March 31, 2015 Unaudited, dollars in thousands Interest Rate Swaps Current Weighted Avg. Weighted Avg. Weighted Avg. Maturity Notional(1) Pay Rate(2)(3) Receive Rate(2) Years to Maturity(2) 0 to <3 years $2,852,488 1.78% 0.18% 2.45 >=3 to <6 years 10,463,000 1.85% 0.41% 4.99 >= 6 to <10 years 11,110,100 2.60% 0.37% 8.64 Greater than 10 years 3,634,400 3.70% 0.22% 20.12 Total / Weighted Avg. $28,059,988 2.37% 0.35% 8.09 Futures Positions Notional Notional Long Short Weighted Avg. Type Positions Positions Years to Maturity(4) 2-year Swap Equivalent Eurodollar Contracts - (3,000,000) 2.00 U.S. Treasury Futures - 5 year - (2,000,000) 4.36 U.S. Treasury Futures - 10 year & Greater - (1,800,000) 7.43 Total - ($6,800,000) 4.13 Interest Rate Swaptions Current Weighted-Avg. Weighted-Avg. Weighted Avg. Weighted Avg. Underlying Underlying Underlying Underlying Months to Type Notional Pay Rate Receive Rate Years to Maturity Expiration Long $1,000,000 2.61% 3M LIBOR 8.19 2.15 Short - - - - - Repurchase Agreements Principal Weighted Avg. Maturity Balance Rate Within 30 days $23,738,473 0.47% 30 to 59 days 7,326,177 0.40% 60 to 89 days 9,534,614 0.40% 90 to 119 days 4,677,222 0.50% Over 120 days(5) 15,200,892 1.45% Total / Weighted Avg. $60,477,378 0.70% (1) Notional amount includes $3.0 billion in forward starting pay fixed swaps, all of which begin in June and July 2015. (2) Excludes forward starting swaps. (3) Weighted average fixed rate on forward starting pay fixed swaps was 1.88%. (4) Weighted average years to maturity for futures positions are based off of the Treasury contracts cheapest to deliver. (5) Approximately 18% of the total repurchase agreements have a remaining maturity over one year. 17
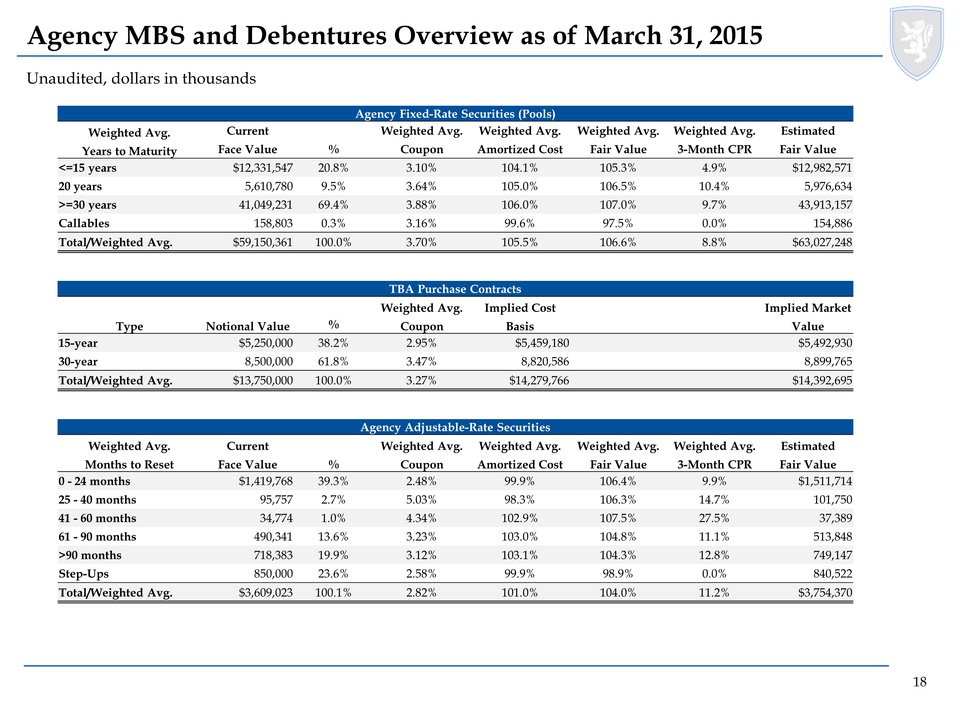
Agency MBS and Debentures Overview as of March 31, 2015 Unaudited, dollars in thousands Agency Fixed-Rate Securities (Pools) Weighted Avg. Current Weighted Avg. Weighted Avg. Weighted Avg. Weighted Avg. Estimated Years to Maturity Face Value % Coupon Amortized Cost Fair Value 3-Month CPR Fair Value <=15 years $12,331,547 20.8% 3.10% 104.1% 105.3% 4.9% $12,982,571 20 years 5,610,780 9.5% 3.64% 105.0% 106.5% 10.4% 5,976,634 >=30 years 41,049,231 69.4% 3.88% 106.0% 107.0% 9.7% 43,913,157 Callables 158,803 0.3% 3.16% 99.6% 97.5% 0.0% 154,886 Total/Weighted Avg. $59,150,361 100.0% 3.70% 105.5% 106.6% 8.8% $63,027,248 TBA Purchase Contracts Weighted Avg. Implied Cost Implied Market Type Notional Value % Coupon Basis Value 15-year $5,250,000 38.2% 2.95% $5,459,180 $5,492,930 30-year 8,500,000 61.8% 3.47% 8,820,586 8,899,765 Total/Weighted Avg. $13,750,000 100.0% 3.27% $14,279,766 $14,392,695 Agency Adjustable-Rate Securities Weighted Avg. Current Weighted Avg. Weighted Avg. Weighted Avg. Weighted Avg. Estimated Months to Reset Face Value % Coupon Amortized Cost Fair Value 3-Month CPR Fair Value 0 - 24 months $1,419,768 39.3% 2.48% 99.9% 106.4% 9.9% $1,511,714 25 - 40 months 95,757 2.7% 5.03% 98.3% 106.3% 14.7% 101,750 41 - 60 months 34,774 1.0% 4.34% 102.9% 107.5% 27.5% 37,389 61 - 90 months 490,341 13.6% 3.23% 103.0% 104.8% 11.1% 513,848 >90 months 718,383 19.9% 3.12% 103.1% 104.3% 12.8% 749,147 Step-Ups 850,000 23.6% 2.58% 99.9% 98.9% 0.0% 840,522 Total/Weighted Avg. $3,609,023 100.1% 2.82% 101.0% 104.0% 11.2% $3,754,370 18
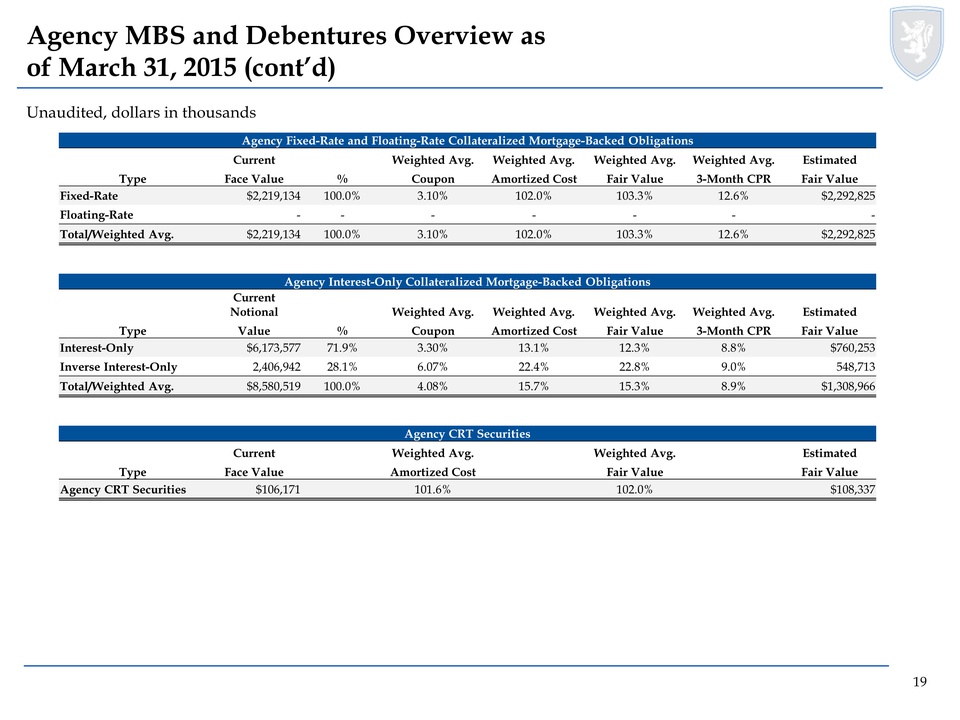
Agency MBS and Debentures Overview as of March 31, 2015 (cont’d) Unaudited, dollars in thousands Agency Fixed-Rate and Floating-Rate Collateralized Mortgage-Backed Obligations Current Weighted Avg. Weighted Avg. Weighted Avg. Weighted Avg. Estimated Type Face Value % Coupon Amortized Cost Fair Value 3-Month CPR Fair Value Fixed-Rate $2,219,134 100.0% 3.10% 102.0% 103.3% 12.6% $2,292,825 Floating-Rate - - - - - - - Total/Weighted Avg. $2,219,134 100.0% 3.10% 102.0% 103.3% 12.6% $2,292,825 Agency Interest-Only Collateralized Mortgage-Backed Obligations Current Notional Weighted Avg. Weighted Avg. Weighted Avg. Weighted Avg. Estimated Type Value % Coupon Amortized Cost Fair Value 3-Month CPR Fair Value Interest-Only $6,173,577 71.9% 3.30% 13.1% 12.3% 8.8% $760,253 Inverse Interest-Only 2,406,942 28.1% 6.07% 22.4% 22.8% 9.0% 548,713 Total/Weighted Avg. $8,580,519 100.0% 4.08% 15.7% 15.3% 8.9% $1,308,966 Agency CRT Securities Current Weighted Avg. Weighted Avg. Estimated Type Face Value Amortized Cost Fair Value Fair Value Agency CRT Securities $106,171 101.6% 102.0% $108,337 19
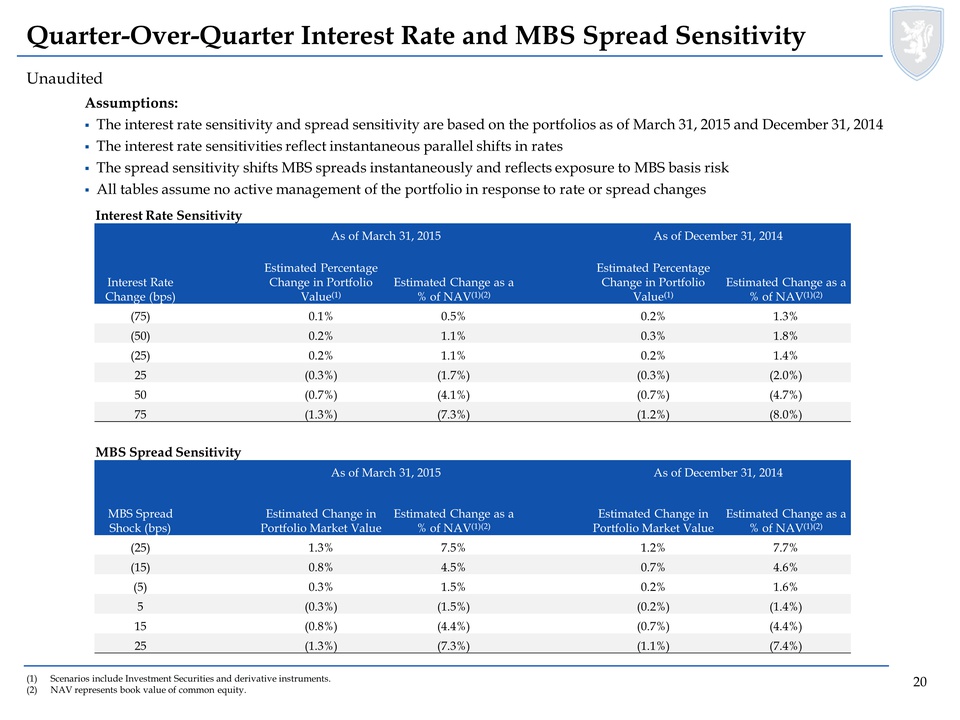
Quarter-Over-Quarter Interest Rate and MBS Spread Sensitivity Unaudited Assumptions: The interest rate sensitivity and spread sensitivity are based on the portfolios as of March 31, 2015 and December 31, 2014 The interest rate sensitivities reflect instantaneous parallel shifts in rates The spread sensitivity shifts MBS spreads instantaneously and reflects exposure to MBS basis risk All tables assume no active management of the portfolio in response to rate or spread changes Interest Rate Sensitivity As of March 31, 2015 As of December 31, 2014 Interest Rate Change (bps) Estimated Percentage Change in Portfolio Value(1) Estimated Change as a % of NAV(1)(2) Estimated Percentage Change in Portfolio Value(1) Estimated Change as a % of NAV(1)(2) (75) 0.1% 0.5% 0.2% 1.3% (50) 0.2% 1.1% 0.3% 1.8% (25) 0.2% 1.1% 0.2% 1.4% 25 (0.3%) (1.7%) (0.3%) (2.0%) 50 (0.7%) (4.1%) (0.7%) (4.7%) 75 (1.3%) (7.3%) (1.2%) (8.0%) MBS Spread Sensitivity As of March 31, 2015 As of December 31, 2014 MBS Spread Shock (bps) Estimated Change in Portfolio Market Value Estimated Change as a % of NAV(1)(2) Estimated Change in Portfolio Market Value Estimated Change as a % of NAV(1)(2) (25) 1.3% 7.5% 1.2% 7.7% (15) 0.8% 4.5% 0.7% 4.6% (5) 0.3% 1.5% 0.2% 1.6% 5 (0.3%) (1.5%) (0.2%) (1.4%) 15 (0.8%) (4.4%) (0.7%) (4.4%) 25 (1.3%) (7.3%) (1.1%) (7.4%) (1) Scenarios include Investment Securities and derivative instruments. (2) NAV represents book value of common equity. 20
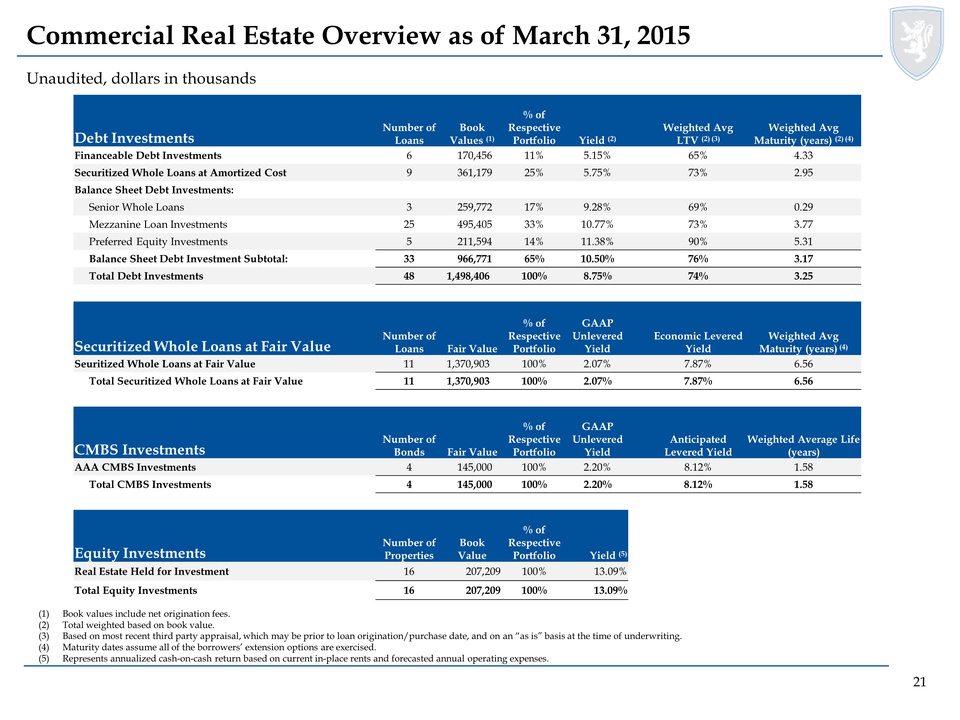
Commercial Real Estate Overview as of March 31, 2015 Unaudited, dollars in thousands Debt Investments Number of Loans Book Values (1) % of Respective Portfolio Yield (2) Weighted Avg LTV (2) (3) Weighted Avg Maturity (years) (2) (4) Financeable Debt Investments 6 170,456 11% 5.15% 65% 4.33 Securitized Whole Loans at Amortized Cost 9 361,179 25% 5.75% 73% 2.95 Balance Sheet Debt Investments: Senior Whole Loans 3 259,772 17% 9.28% 69% 0.29 Mezzanine Loan Investments 25 495,405 33% 10.77% 73% 3.77 Preferred Equity Investments 5 211,594 14% 11.38% 90% 5.31 Balance Sheet Debt Investment Subtotal: 33 966,771 65% 10.50% 76% 3.17 Total Debt Investments 48 1,498,406 100% 8.75% 74% 3.25 Securitized Whole Loans at Fair Value Number of Loans Fair Value % of Respective Portfolio GAAP Unlevered Yield Economic Levered Yield Weighted Avg Maturity (years) (4) Seuritized Whole Loans at Fair Value 11 1,370,903 100% 2.07% 7.87% 6.56 Total Securitized Whole Loans at Fair Value 11 1,370,903 100% 2.07% 7.87% 6.56 CMBS Investments Number of Bonds Fair Value % of Respective Portfolio GAAP Unlevered Yield Anticipated Levered Yield Weighted Average Life (years) AAA CMBS Investments 4 145,000 100% 2.20% 8.12% 1.58 Total CMBS Investments 4 145,000 100% 2.20% 8.12% 1.58 Equity Investments Number of Properties Book Value % of Respective Portfolio Yield (5) Real Estate Held for Investment 16 207,209 100% 13.09% Total Equity Investments 16 207,209 100% 13.09% (1) Book values include net origination fees. (2) Total weighted based on book value. (3) Based on most recent third party appraisal, which may be prior to loan origination/purchase date, and on an “as is” basis at the time of underwriting. (4) Maturity dates assume all of the borrowers’ extension options are exercised. (5) Represents annualized cash-on-cash return based on current in-place rents and forecasted annual operating expenses. 21
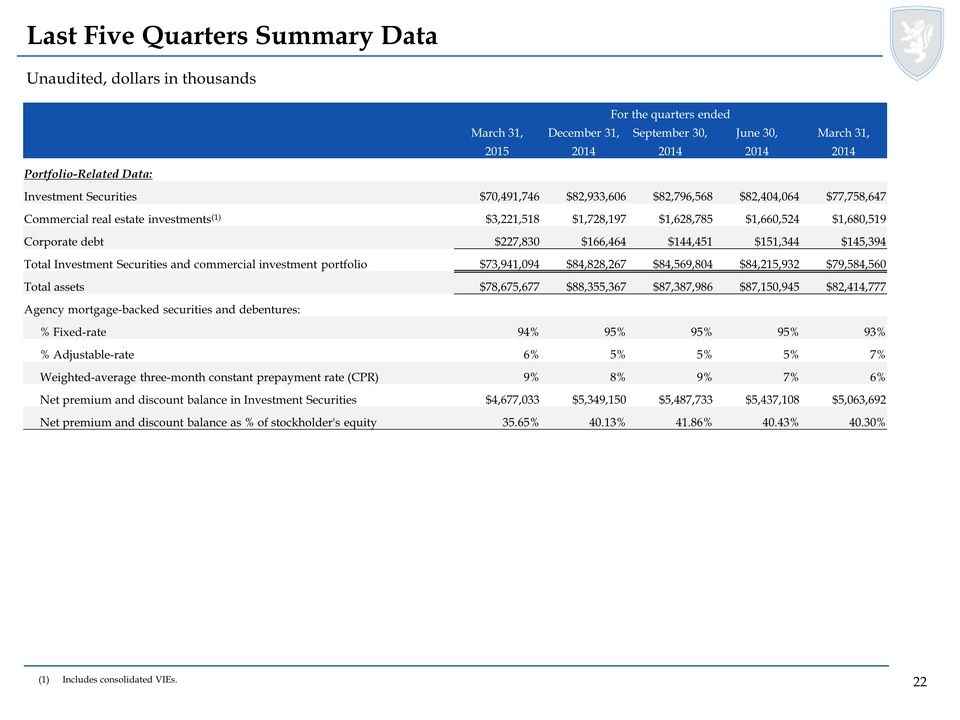
Last Five Quarters Summary Data Unaudited, dollars in thousands For the quarters ended March 31, December 31, September 30, June 30, March 31, 2015 2014 2014 2014 2014 Portfolio-Related Data: Investment Securities $70,491,746 $82,933,606 $82,796,568 $82,404,064 $77,758,647 Commercial real estate investments(1) $3,221,518 $1,728,197 $1,628,785 $1,660,524 $1,680,519 Corporate debt $227,830 $166,464 $144,451 $151,344 $145,394 Total Investment Securities and commercial investment portfolio $73,941,094 $84,828,267 $84,569,804 $84,215,932 $79,584,560 Total assets $78,675,677 $88,355,367 $87,387,986 $87,150,945 $82,414,777 Agency mortgage-backed securities and debentures: % Fixed-rate 94% 95% 95% 95% 93% % Adjustable-rate 6% 5% 5% 5% 7% Weighted-average three-month constant prepayment rate (CPR) 9% 8% 9% 7% 6% Net premium and discount balance in Investment Securities $4,677,033 $5,349,150 $5,487,733 $5,437,108 $5,063,692 Net premium and discount balance as % of stockholder's equity 35.65% 40.13% 41.86% 40.43% 40.30% (1) Includes consolidated VIEs. 22
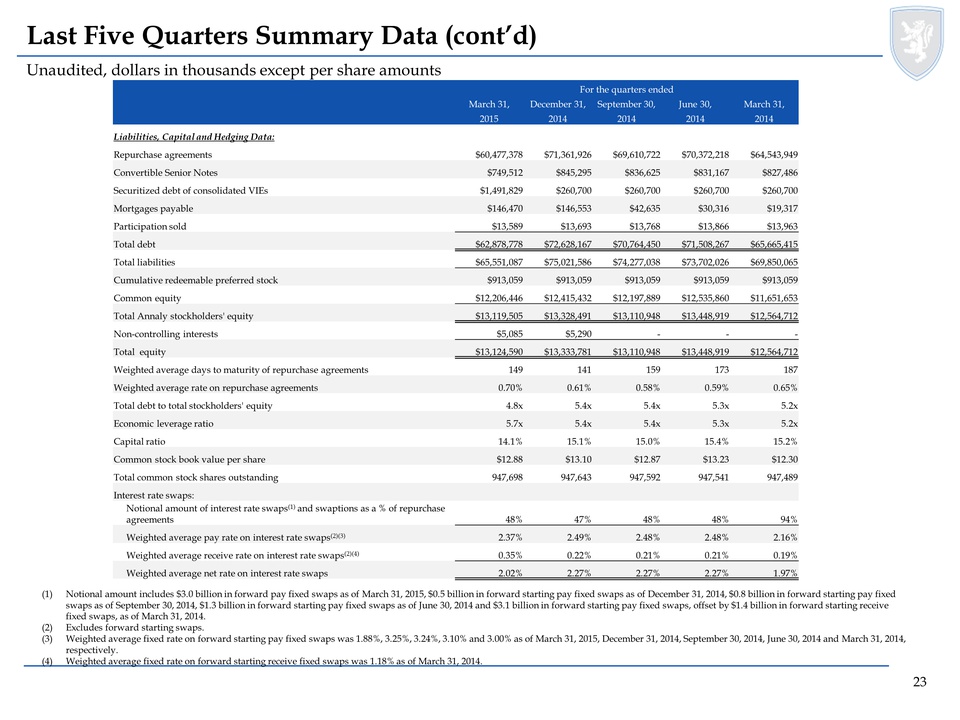
Last Five Quarters Summary Data (cont’d) Unaudited, dollars in thousands except per share amounts For the quarters ended March 31, December 31, September 30, June 30, March 31, 2015 2014 2014 2014 2014 Liabilities, Capital and Hedging Data: Repurchase agreements $60,477,378 $71,361,926 $69,610,722 $70,372,218 $64,543,949 Convertible Senior Notes $749,512 $845,295 $836,625 $831,167 $827,486 Securitized debt of consolidated VIEs $1,491,829 $260,700 $260,700 $260,700 $260,700 Mortgages payable $146,470 $146,553 $42,635 $30,316 $19,317 Participation sold $13,589 $13,693 $13,768 $13,866 $13,963 Total debt $62,878,778 $72,628,167 $70,764,450 $71,508,267 $65,665,415 Total liabilities $65,551,087 $75,021,586 $74,277,038 $73,702,026 $69,850,065 Cumulative redeemable preferred stock $913,059 $913,059 $913,059 $913,059 $913,059 Common equity $12,206,446 $12,415,432 $12,197,889 $12,535,860 $11,651,653 Total Annaly stockholders' equity $13,119,505 $13,328,491 $13,110,948 $13,448,919 $12,564,712 Non-controlling interests $5,085 $5,290 - - - Total equity $13,124,590 $13,333,781 $13,110,948 $13,448,919 $12,564,712 Weighted average days to maturity of repurchase agreements 149 141 159 173 187 Weighted average rate on repurchase agreements 0.70% 0.61% 0.58% 0.59% 0.65% Total debt to total stockholders' equity 4.8x 5.4x 5.4x 5.3x 5.2x Economic leverage ratio 5.7x 5.4x 5.4x 5.3x 5.2x Capital ratio 14.1% 15.1% 15.0% 15.4% 15.2% Common stock book value per share $12.88 $13.10 $12.87 $13.23 $12.30 Total common stock shares outstanding 947,698 947,643 947,592 947,541 947,489 Interest rate swaps: Notional amount of interest rate swaps(1) and swaptions as a % of repurchase agreements 48% 47% 48% 48% 94% Weighted average pay rate on interest rate swaps(2)(3) 2.37% 2.49% 2.48% 2.48% 2.16% Weighted average receive rate on interest rate swaps(2)(4) 0.35% 0.22% 0.21% 0.21% 0.19% Weighted average net rate on interest rate swaps 2.02% 2.27% 2.27% 2.27% 1.97% (1) Notional amount includes $3.0 billion in forward pay fixed swaps as of March 31, 2015, $0.5 billion in forward starting pay fixed swaps as of December 31, 2014, $0.8 billion in forward starting pay fixed swaps as of September 30, 2014, $1.3 billion in forward starting pay fixed swaps as of June 30, 2014 and $3.1 billion in forward starting pay fixed swaps, offset by $1.4 billion in forward starting receive fixed swaps, as of March 31, 2014. (2) Excludes forward starting swaps. (3) Weighted average fixed rate on forward starting pay fixed swaps was 1.88%, 3.25%, 3.24%, 3.10% and 3.00% as of March 31, 2015, December 31, 2014, September 30, 2014, June 30, 2014 and March 31, 2014, respectively. (4) Weighted average fixed rate on forward starting receive fixed swaps was 1.18% as of March 31, 2014. 23
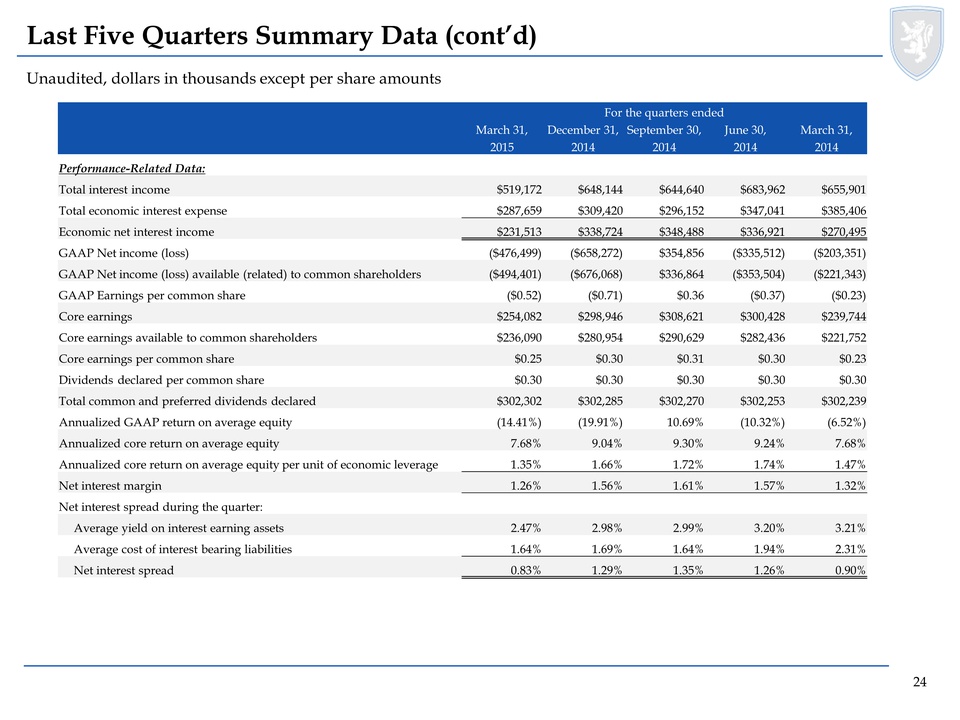
Last Five Quarters Summary Data (cont’d) Unaudited, dollars in thousands except per share amounts For the quarters ended March 31, December 31, September 30, June 30, March 31, 2015 2014 2014 2014 2014 Performance-Related Data: Total interest income $519,172 $648,144 $644,640 $683,962 $655,901 Total economic interest expense $287,659 $309,420 $296,152 $347,041 $385,406 Economic net interest income $231,513 $338,724 $348,488 $336,921 $270,495 GAAP Net income (loss) ($476,499) ($658,272) $354,856 ($335,512) ($203,351) GAAP Net income (loss) available (related) to common shareholders ($494,401) ($676,068) $336,864 ($353,504) ($221,343) GAAP Earnings per common share ($0.52) ($0.71) $0.36 ($0.37) ($0.23) Core earnings $254,082 $298,946 $308,621 $300,428 $239,744 Core earnings available to common shareholders $236,090 $280,954 $290,629 $282,436 $221,752 Core earnings per common share $0.25 $0.30 $0.31 $0.30 $0.23 Dividends declared per common share $0.30 $0.30 $0.30 $0.30 $0.30 Total common and preferred dividends declared $302,302 $302,285 $302,270 $302,253 $302,239 Annualized GAAP return on average equity (14.41%) (19.91%) 10.69% (10.32%) (6.52%) Annualized core return on average equity 7.68% 9.04% 9.30% 9.24% 7.68% Annualized core return on average equity per unit of economic leverage 1.35% 1.66% 1.72% 1.74% 1.47% Net interest margin 1.26% 1.56% 1.61% 1.57% 1.32% Net interest spread during the quarter: Average yield on interest earning assets 2.47% 2.98% 2.99% 3.20% 3.21% Average cost of interest bearing liabilities 1.64% 1.69% 1.64% 1.94% 2.31% Net interest spread 0.83% 1.29% 1.35% 1.26% 0.90% 24
Serious News for Serious Traders! Try StreetInsider.com Premium Free!
You May Also Be Interested In
- Cabka announces 30 May 2024 AGM Agenda
- Net Asset Value(s)
- Tims China Announces Fourth Quarter and Full Year 2023 Financial Results
Create E-mail Alert Related Categories
SEC FilingsSign up for StreetInsider Free!
Receive full access to all new and archived articles, unlimited portfolio tracking, e-mail alerts, custom newswires and RSS feeds - and more!
