

Form 8-K AMERICAN CAMPUS COMMUNIT For: Jul 27
 Tweet
Tweet Share
ShareUNITED STATES
SECURITIES AND EXCHANGE COMMISSION
Washington D.C., 20549
Form 8-K
Current Report
Pursuant to Section 13 or 15(d) of the Securities Exchange Act of 1934
Date Of Report (Date Of Earliest Event Reported): July 27, 2015
American Campus Communities, Inc.
(Exact Name of Registrant as Specified in its Charter)
Commission File Number: 001-32265
|
MD
|
|
760753089
|
|
(State or Other Jurisdiction Of
|
|
(I.R.S. Employer
|
|
Incorporation or Organization)
|
|
Identification No.)
|
12700 Hill Country Blvd., Suite T-200
Austin, Texas 78738
(Address of Principal Executive Offices, Including Zip Code)
512-732-1000
(Registrant’s Telephone Number, Including Area Code)
Check the appropriate box below if the Form 8-K filing is intended to simultaneously satisfy the filing obligation of the registrant under any of the following provisions (see General Instruction A.2. below):
[ ] Written communications pursuant to Rule 425 under the Securities Act (17 CFR 230.425)
[ ] Soliciting material pursuant to Rule 14a-12 under the Exchange Act(17CFR240.14a-12)
[ ] Pre-commencement communications pursuant to Rule 14d-2(b) under the Exchange Act(17CFR240.14d-2(b))
[ ] Pre-commencement communications pursuant to Rule 13e-4(c) under the Exchange Act(17CFR240.13e-4(c))
ITEM 2.02 RESULTS OF OPERATIONS AND FINANCIAL CONDITION
On July 27, 2015, American Campus Communities, Inc. (the “Company”) issued a press release (the “Earnings Release”) announcing, among other things, earnings for the quarter ended June 30, 2015. The text of the Earnings Release is included as Exhibit 99.1 to this Current Report.
The Earnings Release is furnished pursuant to Item 2.02 and shall not be deemed "filed" for purposes of Section 18 of the Securities Exchange Act of 1934 (the "Exchange Act"), or subject to the liabilities of that Section. The information in this Current Report shall not be incorporated by reference in any filing under the Securities Act of 1933 or the Exchange Act, except as shall be expressly set forth by specific reference in such filing.
On July 27, 2015, the Company disclosed a supplemental analyst package in connection with its earnings conference call for the quarter ended June 30, 2015 which took place on July 28, 2015. A copy of the supplemental analyst package is attached hereto as Exhibit 99.2.
The supplemental analyst package is furnished pursuant to Item 7.01 and shall not be deemed "filed" for purposes of Section 18 of the Exchange Act, or subject to the liabilities of that Section. The information in this Current Report shall not be incorporated by reference in any filing under the Securities Act of 1933 or the Exchange Act, except as shall be expressly set forth by specific reference in such filing.
ITEM 9.01 FINANCIAL STATEMENTS AND EXHIBITS
The list of exhibits is incorporated herein by reference to the Exhibit Index.
Signature(s)
Pursuant to the Requirements of the Securities Exchange Act of 1934, the registrant has duly caused this Report to be signed on its behalf by the undersigned hereunto duly authorized.
|
American Campus Communities, Inc.
|
||
|
Date: July 28, 2015
|
By:
|
/s/ Jonathan A. Graf
|
|
Jonathan A. Graf
|
||
|
Executive Vice President, Chief Financial
|
||
| Officer, Secretary and Treasurer |
Exhibit Index
|
Exhibit No.
|
Description
|
|
|
EX-99.1
|
Earnings Release Dated July 27, 2015
|
|
|
EX-99.2
|
Supplemental Analyst Package –Second Quarter 2015
|
Exhibit 99.1
American Campus Communities, Inc. Reports Second Quarter 2015 Financial Results
Strong core performance
Capital recycling continues to improve portfolio quality and fund high yielding development
AUSTIN, Texas -- (BUSINESS WIRE)—July 27, 2015--American Campus Communities, Inc. (NYSE: ACC) today announced the following financial results for the quarter ended June 30, 2015.
Highlights
|
●
|
Reported quarterly FFOM of $0.57 per fully diluted share or $65.2 million, versus $0.58 per fully diluted share or $62.3 million for the second quarter prior year.
|
|
●
|
Increased same store wholly-owned net operating income ("NOI") by 4.7 percent over the second quarter 2014.
|
|
●
|
Achieved same store wholly-owned occupancy of 88.9 percent as of June 30, 2015 compared to 87.8 percent for the same date prior year.
|
|
●
|
Preleased the same store wholly-owned portfolio for the upcoming academic year to 100.8 percent applied for and 94.6 percent leased as of July 24, 2015 with a current projected rental rate increase of 2.9 percent. This compares to 101.9 percent applied for and 94.6 percent leased for the same date prior year.
|
|
●
|
Awarded the right to negotiate two new on-campus development projects with the University of Kansas. The projects remain subject to feasibility analysis and transaction structuring.
|
|
●
|
Commenced construction on two previously announced wholly-owned developments, Merwick Stanworth Phase II, a $48.3 million ACE on-campus development consisting of 198 units serving faculty and staff members of Princeton University, and U Club Sunnyside, a 536-bed, $46.3 million community located adjacent to West Virginia University. Both communities are slated for delivery in Fall 2016.
|
|
●
|
Acquired Crest at Pearl, a 343-bed community located pedestrian to the University of Texas at Austin, in the West Campus submarket. Also during the quarter, completed the acquisition of UP at Metroplex, a 710-bed community located pedestrian to Binghamton University, a State University of New York System (SUNY) campus, along with a development site adjacent to UP at Metroplex which is planned as a 560-bed townhome community targeting delivery in Fall 2017.
|
|
●
|
Continued capital recycling efforts with the previously announced sale of seven non-core properties in a portfolio for $173.6 million. The sale included the defeasance of $18.1 million in secured mortgage debt. Additionally, subsequent to quarter end, completed the sale of three non-core properties in a portfolio for $32.1 million. Containing 1,200 beds, the three assets average 14 years old and 1.0 miles from campus.
|
|
●
|
Closed on financing and commenced construction on a third-party on-campus development project at Northeastern Illinois University with $2.1 million in development fees expected to be earned during the construction period which is scheduled for completion in Fall 2016.
|
“We are very pleased with our core value creation driven by 4.7% same store NOI growth this quarter,” said Bill Bayless, American Campus CEO. “In addition, the vibrant transaction market has enabled us to accretively recycle non-core assets into our high yielding core development pipeline, thus improving our overall portfolio quality and positioning the company to continue to drive long-term NOI growth.”
Second Quarter Operating Results
Revenue for the 2015 second quarter totaled $177.9 million, a 3.4 percent increase from $172.0 million in the second quarter 2014 and operating income for the quarter decreased $1.0 million or 2.8 percent over the prior year second quarter. The increase in revenues was primarily due to growth resulting from increased rental rates and occupancy for the 2014-2015 academic year, recently completed development properties, and property acquisitions. The decrease in operating income was primarily due to an increase in depreciation and amortization expense and the loss of operating income associated with recently sold properties. Net income for the 2015 second quarter totaled $15.6 million, or $0.14 per fully diluted share, compared with net income of $13.4 million, or $0.12 per fully diluted share, for the same quarter in 2014. The increase in net income as compared to the prior year quarter is primarily due to nonoperating gains from the disposition of real estate. FFO for the 2015 second quarter totaled $63.1 million, or $0.55 per fully diluted share, as compared to $61.6 million, or $0.58 per fully diluted share for the same quarter in 2014. FFOM for the 2015 second quarter was $65.2 million, or $0.57 per fully diluted share as compared to $62.3 million, or $0.58 per fully diluted share for the same quarter in 2014. A reconciliation of FFO and FFOM to net income is shown in Table 3.
NOI for same store wholly-owned properties was $80.8 million in the quarter, an increase of 4.7 percent over $77.2 million in the 2014 second quarter. Same store wholly-owned property revenues increased by 3.3 percent over the 2014 second quarter due to an increase in occupancy and average rental rates for the 2014-2015 academic year. Same store wholly-owned property operating expenses increased by 1.8 percent over the prior year quarter. NOI for the total wholly-owned portfolio increased 3.8 percent to $90.9 million for the quarter from $87.6 million in the comparable period of 2014.
Portfolio Update
As of July 24, 2015, the company’s same store wholly-owned portfolio was 100.8 percent applied for and 94.6 percent leased for the upcoming academic year compared to 101.9 percent applied for and 94.6 percent leased for the same date prior year, with a 2.9 percent current projected rental rate increase over the in-place rent.
Developments
The company is progressing on the construction of its $550.5 million owned development pipeline with expected delivery in Fall 2015 and 2016. The owned developments are all core Class A assets pedestrian to campus in their respective markets and are on track to achieve stabilized development yields in the range of 6.5 - 7.0 percent. The four new owned development projects scheduled to open Fall 2015, totaling $313.7 million, are preleased at an average of 82.0 percent for the upcoming academic year as of July 24, 2015 with two assets preleased to 99.0 percent and above.
During the quarter, University Crossings, a 1927-built asset which was acquired by the company in the 2008 GMH transaction and was converted to an ACE community with Drexel University in 2013, was taken out of service to begin the substantial renovations that were contemplated as part of the ACE conversion. The property will resume operations with partial occupancy in Fall 2015 and is expected to fully re-stabilize in Fall 2016.
American Campus Equity (ACE)
During the quarter, the company commenced construction on University Pointe, an ACE development in the heart of the University of Louisville campus, under a full reimbursement agreement with the University. Pending a successful resolution of final administrative matters, the company anticipates completion of the final ground lease in August 2015, thus paving the way for a Fall 2016 delivery of the 532-bed, $44.2 million, apartment community which is replacing 324 beds in three existing residence halls that have been demolished.
Also during the quarter, the company commenced construction on Merwick Stanworth Phase II, a $48.3 million ACE on-campus development at Princeton University which is slated for delivery in Fall 2016. The 198-unit pedestrian community is located less than one-half mile from core campus, is intended to serve and house primarily faculty and staff members of Princeton University, and unlike student housing communities, this property is expected to stabilize in a manner consistent with a multi-family development during the first academic session.
Off-Campus Owned
The company commenced construction on its 100th development, U Club Sunnyside, a $46.3 million community serving students attending West Virginia University. The 536-bed development, which is targeting a Fall 2016 delivery, will be located less than 0.1 miles from campus on the previous site of Sunnyside Commons, a prior ACC acquisition property which has been demolished to facilitate the new development.
Acquisitions
In June, the company acquired Crest at Pearl, a 343-bed core property located pedestrian to the University of Texas at Austin, and UP at Metroplex, a 710-bed property serving students attending Binghamton University, a SUNY campus. Totaling $109.1 million, the acquisitions expand the company’s presence in multiple property markets with Crest at Pearl increasing the company’s dominant market position in Austin to seven properties serving approximately 5,000 students. After investment of $3.7 million of upfront capital improvements, the two acquisitions target an average year one cap rate of 5.5 percent nominal and 5.3 percent economic. The acquisition of UP at Metroplex is complemented by the purchase of an adjacent development parcel which targets a $51.3 million, 560-bed, community with delivery slated for Fall 2017.
Dispositions
As previously announced, in May, the company completed the sale of a seven property portfolio for $173.6 million. The sale included the defeasance of $18.1 million in secured mortgage debt. The seven non-core assets contain 5,096 beds, average 1.1 miles from their respective campuses and average 18 years old. The portfolio was sold at an economic cap rate of 6.5 percent based on in-place rental revenue, escalated trailing-12 other income and operating expenses, and portfolio average capital reserves.
Subsequent to quarter end, the company continued with its capital recycling efforts and completed the sale of an additional three non-core properties in a single portfolio for $32.1 million. The properties contain 1,200 beds serving students attending Middle Tennessee State University in Murfreesboro, Tennessee, average 1.0 miles from campus and 14 years of age. The assets were sold at an economic cap rate of 6.4 percent based on in-place rental revenue, trailing-12 operating expenses and portfolio average capital reserves.
Capital Recycling Summary
Year-to-date, when including the January closing of the final assets in the 2014 disposition package, the company has completed the disposition of 20 non-core assets for a total sales price of $436.7 million and an average economic cap rate of 6.3 percent. The proceeds from these dispositions are being recycled into the company’s $313.7 million high yielding 2015 development pipeline and $274.4 million of core acquisitions completed year-to-date. This represents a significant improvement in portfolio quality as the 20 disposition properties average 1.2 miles from their respective campuses and an average age of over 15 years, while the core pedestrian growth assets average less than 0.2 miles from their respective campuses and an average age of 2 years.
Third-Party Services
During the quarter, the company completed construction of the Lakeside Graduate Community, a third-party development on the campus of Princeton University. Upon completion of development, the company commenced management of the 715-bed community with stabilized annual fees estimated to be $180 thousand.
Also during the quarter, the company closed on financing and commenced construction on a third-party on-campus development project containing 440 beds at Northeastern Illinois University. The company expects to earn $2.1 million in development fees throughout the construction period with completion scheduled for Fall 2016.
During the quarter, the company completed contracted pre-development services and earned $117 thousand in fees relating to the future development of an estimated 700-bed residence hall on the main campus of the University of Vermont, thereby concluding the company’s role in the transaction.
Capital Markets
At-The-Market (ATM) Share Offering Program
The company did not sell any shares under the ATM Share Offering Program during the second quarter.
2015 Outlook
The company is maintaining its previously stated guidance range for the fiscal year 2015, anticipating that FFO will be in the range of $2.33 to $2.45 per fully diluted share, and FFOM, excluding the impact of transaction costs, will be in the range of $2.30 to $2.42 per fully diluted share.
“With the conclusion of the first half of 2015, we continue to be pleased with the operating performance of our properties and the current progress of the lease-up for the 2015-2016 academic year,” said Jon Graf, American Campus CFO. “While the acquisition and disposition activity completed to date is in line with the transaction assumptions at the lower end of the guidance range, our full year results continue to be dependent upon the final outcome of the 2015-2016 lease-up, overall operational performance, and any additional external growth completed in the second half of 2015.”
All guidance is based on the current expectations and judgment of the company’s management team.
Supplemental Information and Earnings Conference Call
Supplemental financial and operating information, as well as this release, are available in the investor relations section of the American Campus Communities website, www.americancampus.com. In addition, the company will host a conference call to discuss second quarter results and the 2015 outlook on Tuesday, July 28, 2015 at 11 a.m. EDT (10:00 a.m. CDT). Participants from within the U.S. may dial 888-317-6003 passcode 5660122, and participants outside the U.S. may dial 412-317-6061 passcode 5660122 at least 10 minutes prior to the call.
To listen to the live broadcast, go to www.americancampus.com at least 15 minutes prior to the call so that required audio software can be downloaded. Informational slides in the form of the supplemental analyst package can be accessed via the website. A replay of the conference call will be available beginning one hour after the end of the call until August 12, 2015 by dialing 877-344-7529 or 412-317-0088 conference number 10067131. The replay also will be available for one year at www.americancampus.com. The call will also be available as a podcast on www.reitcafe.comwww.REITcafe.com and on the company’s website shortly after the call.
Non-GAAP Financial Measures
The National Association of Real Estate Investment Trusts ("NAREIT") currently defines Funds from Operations ("FFO") as net income or loss attributable to common shares computed in accordance with generally accepted accounting principles ("GAAP"), excluding gains or losses from depreciable operating property sales, impairment charges and real estate depreciation and amortization, and after adjustments for unconsolidated partnerships and joint ventures. We present FFO because we consider it an important supplemental measure of our operating performance and believe it is frequently used by securities analysts, investors and other interested parties in the evaluation of REITs, many of which present FFO when reporting their results. We also believe it is meaningful to present a measure we refer to as FFO-Modified, or FFOM, which reflects certain adjustments related to the economic performance of our on-campus participating properties and excludes property acquisition costs and other non-cash items, as we determine in good faith. FFO and FFOM should not be considered as alternatives to net income or loss computed in accordance with GAAP as an indicator of our financial performance or to cash flow from operating activities computed in accordance with GAAP as an indicator of our liquidity, nor are these measures indicative of funds available to fund our cash needs, including our ability to pay dividends or make distributions.
The company defines property NOI as property revenues less direct property operating expenses, excluding depreciation, but including allocated corporate general and administrative expenses.
About American Campus Communities
American Campus Communities, Inc. is the largest owner, manager and developer of high-quality student housing communities in the United States. The company is a fully integrated, self-managed and self-administered equity real estate investment trust (REIT) with expertise in the design, finance, development, construction management and operational management of student housing properties. As of June 30, 2015, American Campus Communities owned 159 student housing properties containing approximately 96,400 beds. Including its owned and third-party managed properties, ACC's total managed portfolio consisted of 198 properties with approximately 126,800 beds. Visit www.americancampus.com.
Forward-Looking Statements
In addition to historical information, this press release contains forward-looking statements under the federal securities law. These statements are based on current expectations, estimates and projections about the industry and markets in which American Campus operates management's beliefs, and assumptions made by management. Forward-looking statements are not guarantees of future performance and involve certain risks and uncertainties, which are difficult to predict.
Table 1
American Campus Communities, Inc. and Subsidiaries
Consolidated Balance Sheets
(dollars in thousands)
|
|
June 30, 2015
|
December 31, 2014
|
||||||
|
(unaudited)
|
||||||||
|
Assets
|
||||||||
|
Investments in real estate:
|
||||||||
|
Wholly-owned properties, net
|
$ | 5,370,868 | $ | 5,308,707 | ||||
|
Wholly-owned properties held for sale
|
26,498 | 131,014 | ||||||
|
On-campus participating properties, net
|
91,582 | 94,128 | ||||||
|
Investments in real estate, net
|
5,488,948 | 5,533,849 | ||||||
|
Cash and cash equivalents
|
8,765 | 25,062 | ||||||
|
Restricted cash
|
40,673 | 31,937 | ||||||
|
Student contracts receivable, net
|
8,052 | 10,145 | ||||||
|
Other assets1
|
263,732 | 233,755 | ||||||
|
Total assets
|
$ | 5,810,170 | $ | 5,834,748 | ||||
|
Liabilities and equity
|
||||||||
|
Liabilities:
|
||||||||
|
Secured mortgage, construction and bond debt
|
$ | 1,105,432 | $ | 1,331,914 | ||||
|
Unsecured notes
|
798,389 | 798,305 | ||||||
|
Unsecured term loans
|
600,000 | 600,000 | ||||||
|
Unsecured revolving credit facility
|
229,400 | 242,500 | ||||||
|
Accounts payable and accrued expenses
|
68,185 | 70,629 | ||||||
|
Other liabilities2
|
115,701 | 121,645 | ||||||
|
Total liabilities
|
2,917,107 | 3,164,993 | ||||||
|
Redeemable noncontrolling interests
|
62,091 | 54,472 | ||||||
|
Equity:
|
||||||||
|
American Campus Communities, Inc. and
|
|
|
||||||
|
Subsidiaries stockholders' equity:
|
|
|||||||
|
Common stock
|
1,123 | 1,072 | ||||||
|
Additional paid in capital
|
3,323,010 | 3,102,540 | ||||||
|
Accumulated earnings and dividends
|
(490,368 | ) | (487,986 | ) | ||||
|
Accumulated other comprehensive loss
|
(6,891 | ) | (6,072 | ) | ||||
| Total American Campus Communities, Inc. and | ||||||||
|
Subsidiaries stockholders' equity
|
2,826,874 | 2,609,554 | ||||||
|
Noncontrolling interests - partially owned properties
|
4,098 | 5,729 | ||||||
|
Total equity
|
2,830,972 | 2,615,283 | ||||||
|
Total liabilities and equity
|
$ | 5,810,170 | $ | 5,834,748 | ||||
|
1.
|
As of June 30, 2015, other assets include approximately $22.6 million related to net deferred financing costs and the net value of in-place leases.
|
|
2.
|
As of June 30, 2015, other liabilities include approximately $56.8 million in deferred revenue and fee income.
|
Table 2
American Campus Communities, Inc. and Subsidiaries
Consolidated Statements of Comprehensive Income
(unaudited, dollars in thousands, except share and per share dat
|
Three Months Ended June 30,
|
Six Months Ended June 30,
|
|||||||||||||||
|
2015
|
2014
|
2015
|
2014
|
|||||||||||||
|
Revenues
|
||||||||||||||||
|
Wholly-owned properties
|
$ | 167,468 | $ | 163,056 | $ | 347,366 | $ | 335,006 | ||||||||
|
On-campus participating properties
|
5,704 | 4,735 | 14,904 | 12,923 | ||||||||||||
|
Third-party development services
|
1,677 | 1,581 | 2,241 | 1,768 | ||||||||||||
|
Third-party management services
|
2,324 | 1,997 | 4,325 | 3,982 | ||||||||||||
|
Resident services
|
701 | 608 | 1,531 | 1,481 | ||||||||||||
|
Total revenues
|
177,874 | 171,977 | 370,367 | 355,160 | ||||||||||||
|
Operating expenses
|
||||||||||||||||
|
Wholly-owned properties
|
77,251 | 76,034 | 156,261 | 151,842 | ||||||||||||
|
On-campus participating properties
|
2,942 | 2,780 | 5,610 | 5,262 | ||||||||||||
|
Third-party development and management services
|
3,952 | 2,720 | 6,999 | 5,506 | ||||||||||||
|
General and administrative
|
5,738 | 4,978 | 10,581 | 9,352 | ||||||||||||
|
Depreciation and amortization
|
51,578 | 48,450 | 102,229 | 96,625 | ||||||||||||
|
Ground/facility leases
|
1,961 | 1,582 | 4,059 | 3,145 | ||||||||||||
|
Total operating expenses
|
143,422 | 136,544 | 285,739 | 271,732 | ||||||||||||
|
Operating income
|
34,452 | 35,433 | 84,628 | 83,428 | ||||||||||||
|
Nonoperating income and (expenses)
|
||||||||||||||||
|
Interest income
|
1,085 | 1,037 | 2,197 | 2,068 | ||||||||||||
|
Interest expense
|
(20,586 | ) | (20,989 | ) | (42,574 | ) | (42,079 | ) | ||||||||
|
Amortization of deferred financing costs
|
(1,338 | ) | (1,461 | ) | (2,717 | ) | (2,960 | ) | ||||||||
|
Gain from disposition of real estate1
|
3,790 | - | 48,042 | - | ||||||||||||
|
Loss from early extinguishment of debt
|
(1,175 | ) | - | (1,770 | ) | - | ||||||||||
|
Total nonoperating (expenses) income
|
(18,224 | ) | (21,413 | ) | 3,178 | (42,971 | ) | |||||||||
|
Income before income taxes and discontinued operations
|
16,228 | 14,020 | 87,806 | 40,457 | ||||||||||||
|
Income tax provision
|
(310 | ) | (289 | ) | (621 | ) | (579 | ) | ||||||||
|
Income from continuing operations
|
15,918 | 13,731 | 87,185 | 39,878 | ||||||||||||
|
Discontinued operations2
|
||||||||||||||||
|
Loss attributable to discontinued operations
|
- | - | - | (123 | ) | |||||||||||
|
Gain from disposition of real estate
|
- | - | - | 2,843 | ||||||||||||
|
Total discontinued operations
|
- | - | - | 2,720 | ||||||||||||
|
Net income
|
15,918 | 13,731 | 87,185 | 42,598 | ||||||||||||
|
Net income attributable to noncontrolling interests
|
(338 | ) | (293 | ) | (1,408 | ) | (762 | ) | ||||||||
|
Net income attributable to ACC, Inc. and
Subsidiaries common stockholders
|
$ | 15,580 | $ | 13,438 | $ | 85,777 | $ | 41,836 | ||||||||
|
Other comprehensive loss
|
||||||||||||||||
|
Change in fair value of interest rate swaps
|
845 | (4,877 | ) | (1,023 | ) | (5,870 | ) | |||||||||
|
Comprehensive income
|
$ | 16,425 | $ | 8,561 | $ | 84,754 | $ | 35,966 | ||||||||
|
Net income per share attributable to ACC, Inc.
and Subsidiaries common stockholders
|
||||||||||||||||
|
Basic
|
$ | 0.14 | $ | 0.13 | $ | 0.76 | $ | 0.39 | ||||||||
|
Diluted
|
$ | 0.14 | $ | 0.12 | $ | 0.76 | $ | 0.39 | ||||||||
|
Weighted-average common shares outstanding
|
||||||||||||||||
|
Basic
|
112,308,114 | 104,918,131 | 111,635,345 | 104,870,167 | ||||||||||||
|
Diluted
|
112,983,939 | 105,609,561 | 113,652,341 | 105,583,346 | ||||||||||||
|
1.
|
Represents net gains from the sale of wholly-owned properties. Due to a recent change in accounting guidance, disposals of individual operating properties or portfolios that do not represent a strategic shift in the Company’s operations will no longer qualify as discontinued operations and will be classified within income from continuing operations.
|
|
2.
|
The operations for any properties sold during 2014 that were classified as held for sale as of December 31, 2013 are not subject to the new accounting guidance for discontinued operations and have been presented in discontinued operations.
|
Table 3
American Campus Communities, Inc. and Subsidiaries
Consolidated Statements of Funds From Operations
(unaudited, dollars in thousands, except share and per share data)
|
Three Months Ended June 30,
|
Six Months Ended June 30,
|
|||||||||||||||
|
2015
|
2014
|
2015
|
2014
|
|||||||||||||
|
Net income attributable to American Campus Communities, Inc.
and Subsidiaries common stockholders
|
$ | 15,580 | $ | 13,438 | $ | 85,777 | $ | 41,836 | ||||||||
|
Noncontrolling interests
|
338 | 293 | 1,408 | 762 | ||||||||||||
|
Gain from disposition of real estate
|
(3,790 | ) | - | (48,042 | ) | (2,843 | ) | |||||||||
|
Real estate related depreciation and amortization
|
50,985 | 47,884 | 101,009 | 95,652 | ||||||||||||
|
Funds from operations ("FFO") attributable to
common stockholders and OP unitholders
|
63,113 | 61,615 | 140,152 | 135,407 | ||||||||||||
|
Elimination of operations of on-campus participating properties
|
||||||||||||||||
|
Net income from on-campus participating properties
|
969 | 880 | (1,699 | ) | (1,991 | ) | ||||||||||
|
Amortization of investment in on-campus participating properties
|
(1,735 | ) | (1,228 | ) | (3,451 | ) | (2,440 | ) | ||||||||
| 62,347 | 61,267 | 135,002 | 130,976 | |||||||||||||
|
Modifications to reflect operational performance of on-campus
participating properties
|
||||||||||||||||
|
Our share of net cash flow1
|
739 | 650 | 1,614 | 1,277 | ||||||||||||
|
Management fees
|
241 | 209 | 668 | 584 | ||||||||||||
|
On-campus participating properties development fees2
|
- | 191 | - | 428 | ||||||||||||
|
Impact of on-campus participating properties
|
980 | 1,050 | 2,282 | 2,289 | ||||||||||||
|
Property acquisition costs
|
683 | - | 2,213 | - | ||||||||||||
|
Elimination of loss from early extinguishment of debt3
|
1,175 | - | 1,770 | - | ||||||||||||
|
Funds from operations-modified ("FFOM") attributable to
common stockholders and OP unitholders
|
$ | 65,185 | $ | 62,317 | $ | 141,267 | $ | 133,265 | ||||||||
|
FFO per share - diluted
|
$ | 0.55 | $ | 0.58 | $ | 1.23 | $ | 1.27 | ||||||||
|
FFOM per share - diluted
|
$ | 0.57 | $ | 0.58 | $ | 1.24 | $ | 1.25 | ||||||||
|
Weighted average common shares outstanding - diluted
|
114,541,910 | 106,947,442 | 113,762,540 | 106,923,696 | ||||||||||||
|
1.
|
50% of the properties’ net cash available for distribution after payment of operating expenses, debt service (including repayment of principal) and capital expenditures. Represents amounts accrued for the interim periods, which is included in ground/facility leases expense in the consolidated statements of comprehensive income.
|
|
2.
|
Represents development and construction management fees related to the West Virginia University on-campus participating property, which completed construction in August 2014.
|
|
3.
|
Represents losses associated with the early pay-off of mortgage loans for four properties sold during the six months ended June 30, 2015. Such costs are excluded from gains from disposition of real estate reported in accordance with GAAP. However, we view the losses from early extinguishment of debt associated with the sales of real estate as an incremental cost of the sale transactions because we extinguished the debt in connection with the consummation of the sale transactions and we had no intent to extinguish the debt absent such transactions. We believe that adjusting FFO to exclude these losses more appropriately reflects the results of our operations exclusive of the impact of our disposition transactions.
|
CONTACT: American Campus Communities, Inc., Austin
Ryan Dennison, 512-732-1000
Exhibit 99.2
SUPPLEMENTAL ANALYST PACKAGE 2Q 2015 July 27, 2015

Table of Contents

FINANCIAL highlights $ in thousands, except share and per share data 1 Excluding net gains from property dispositions and losses from the early extinguishment of debt, net income attributable to ACC for the three months ended June 30, 2015 and 2014 would have been $13.0 million and $13.4 million, respectively. Excluding net gains from property dispositions and losses from the early extinguishment of debt, net income attributable to ACC for the six months ended June 30, 2015 and 2014 would have been $39.5 million and $41.8 million, respectively. Market capitalization is calculated based on a common share price of $37.69 and $41.36 as of June 30, 2015 and December 31, 2014, respectively, and fully diluted common shares totaling 114,537,250 and 109,075,328 as of June 30, 2015 and December 31, 2014, respectively.Based on Adjusted Earnings Before Interest, Taxes, Depreciation, and Amortization (“EBITDA”) and Adjusted Interest Expense of $365.6 million and $98.1 million, respectively, for the four most recently completed fiscal quarters. Includes pro forma adjustments to EBITDA and Interest Expense of $7.7 million and $7.9 million, respectively, to reflect all acquisitions, development deliveries, dispositions, debt repayments and debt refinancings as if such transactions had occurred on the first day of the 12 month period presented. Adjusted Interest Expense includes $9.8 million of interest capitalized for GAAP purposes and excludes $12.3 million of amortization of net debt premiums related to mortgage loans assumed in connection with acquisitions.

Consolidated balance sheets $ in thousands 2 As of June 30, 2015, other assets include approximately $22.6 million related to net deferred financing costs and the net value of in-place leases.As of June 30, 2015, other liabilities include approximately $56.8 million in deferred revenue and fee income.

Consolidated statements of Comprehensive Income Unaudited, $ in thousands, except share and per share data 3 Represents net gains from the sale of wholly-owned properties. Due to a recent change in accounting guidance, disposals of individual operating properties or portfolios that do not represent a strategic shift in the Company’s operations will no longer qualify as discontinued operations and will be classified within income from continuing operations.The operations for any properties sold during 2014 that were classified as held for sale as of December 31, 2013 are not subject to the new accounting guidance for discontinued operations and have been presented in discontinued operations.

Consolidated statements of funds from operations Unaudited, $ in thousands, except share and per share data 4 50% of the properties’ net cash available for distribution after payment of operating expenses, debt service (including repayment of principal) and capital expenditures. Represents amounts accrued for the interim periods, which is included in ground/facility leases expense in the consolidated statements of comprehensive income (refer to page 3).Represents development and construction management fees related to the West Virginia University on-campus participating property, which completed construction in August 2014.Represents losses associated with the early pay-off of mortgage loans for four properties sold during the six months ended June 30, 2015. Such costs are excluded from gains from disposition of real estate reported in accordance with GAAP. However, we view the losses from early extinguishment of debt associated with the sales of real estate as an incremental cost of the sale transactions because we extinguished the debt in connection with the consummation of the sale transactions and we had no intent to extinguish the debt absent such transactions. We believe that adjusting FFO to exclude these losses more appropriately reflects the results of our operations exclusive of the impact of our disposition transactions.

Wholly-owned properties results of operations1 $ in thousands Note: The same store grouping above represents properties owned or operated for the entire comparative periods presented. The second quarter same store grouping includes properties purchased or developed prior to April 1, 2014. The year-to-date same store grouping includes properties purchased or developed prior to January 1, 2014.Excludes Hawks Landing, a property that was sold in February 2014 which is classified within discontinued operations on the accompanying consolidated statements of comprehensive income.Includes The Enclave, a property that was sold in September 2014 along with 10 properties sold in the first quarter 2015 and seven properties sold in the second quarter 2015 which are disclosed on page 16. Due to a recent change in accounting guidance, these disposals along with future disposals of individual operating properties will no longer qualify as discontinued operations and will be classified within income from continuing operations on the consolidated statements of comprehensive income (refer to page 3).Includes revenues that are reflected as Resident Services Revenue on the accompanying consolidated statements of comprehensive income. See page 6 for detail of same store operating expenses. 5

Same store wholly-owned properties operating expenses$ in thousands, except per bed data Note: Similar to the same store groupings on page 5, the second quarter same store grouping includes properties purchased or developed prior to April 1, 2014. The year-to-date same store grouping includes properties purchased or developed prior to January 1, 2014. Represents gross expenses prior to any recoveries from tenants, which are reflected in wholly-owned properties revenues. The increase over the prior year is primarily related to owned development deliveries and property acquisitions placed into service in 2013 that were assessed at full value for the first time. Excluding the impact of such assessments on these properties, the increase in property taxes would have been 2.8% for the three months ended June 30, 2015 and 3.8% for the six months ended June 30, 2015. Includes security costs, shuttle costs, and property-level general and administrative costs as well as an allocation of costs related to corporate management and oversight. Also includes acquisition integration costs, bad debt, food service, and other miscellaneous expenses. The increase over the prior year is primarily due to additional costs incurred in 2015 related to general inflationary increases in corporate payroll and related costs, as well as the company’s ongoing investment in upgrading and developing our next-generation technology platform, which is expected to enhance our future scalability and provide operational efficiencies.Includes payroll and related expenses for on-site personnel including general managers, maintenance staff, and leasing staff. Includes general maintenance costs such as interior painting, routine landscaping, pest control, fire protection, snow removal, elevator maintenance, roof and parking lot repairs, and other miscellaneous building repair costs. Also includes costs related to the annual turn process. Includes costs related to property marketing campaigns associated with our annual leasing efforts. The decrease over the prior year is due to the continued strategic refinement of our marketing activities to yield optimal efficiency and effectiveness. 6
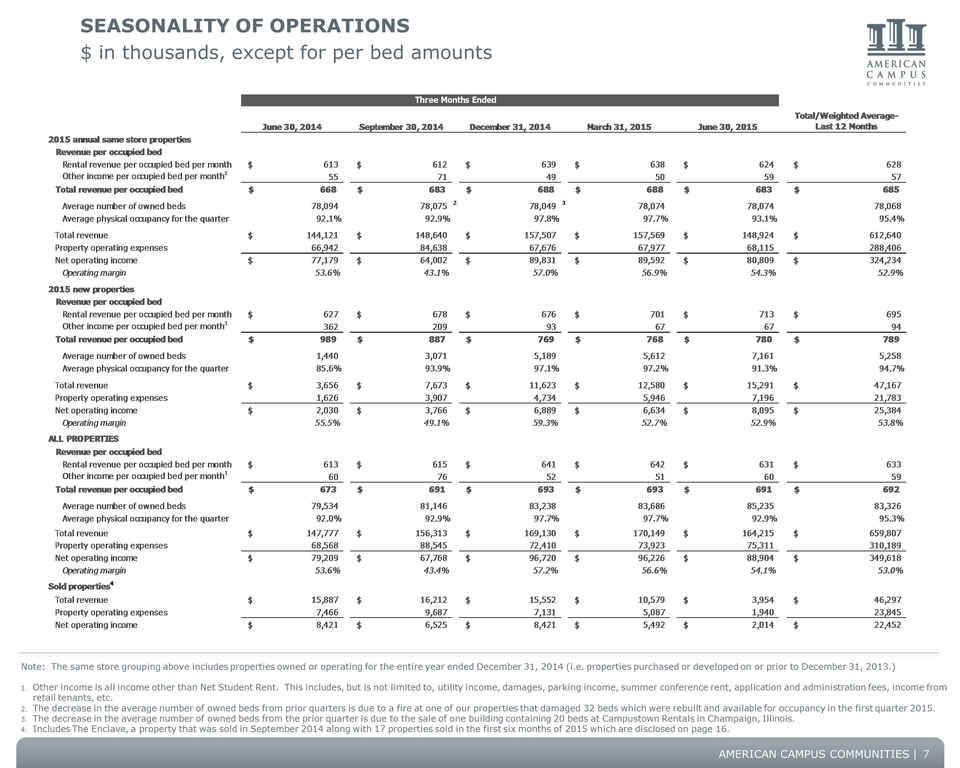
Seasonality of operations $ in thousands, except for per bed amounts Note: The same store grouping above includes properties owned or operating for the entire year ended December 31, 2014 (i.e. properties purchased or developed on or prior to December 31, 2013.) Other income is all income other than Net Student Rent. This includes, but is not limited to, utility income, damages, parking income, summer conference rent, application and administration fees, income from retail tenants, etc.The decrease in the average number of owned beds from prior quarters is due to a fire at one of our properties that damaged 32 beds which were rebuilt and available for occupancy in the first quarter 2015.The decrease in the average number of owned beds from the prior quarter is due to the sale of one building containing 20 beds at Campustown Rentals in Champaign, Illinois.Includes The Enclave, a property that was sold in September 2014 along with 17 properties sold in the first six months of 2015 which are disclosed on page 16. 7

PORTFOLIO OVERVIEWSummary 8 Note: The same store grouping above includes all properties in the same store grouping for the first quarter 2015. This represents properties purchased or developed prior to January 1, 2014.Represents The Standard, a property located in Athens, GA that was purchased in October 2014.Includes four wholly-owned properties that were acquired in the first quarter 2015 and two that were acquired in the second quarter 2015. Refer to page 16 for additional information about these property acquisitions. Includes five wholly-owned properties that completed construction and opened for occupancy in June and August 2014. Also includes University Walk, a property subject to a pre-sale agreement that completed construction in August 2014 and was purchased by the company in February 2015. Represents University Crossings in Philadelphia, PA which is currently undergoing significant redevelopment activity and is anticipated to stabilize by Fall 2016.Properties not owned or under ACC management during the prior year are excluded for purposes of calculating the prior year occupancy. Occupancy at our on-campus participating properties is low during the summer months due to the expiration of the nine-month leases concurrent with the end of the spring semester.

2015/2016 Leasing StatusWholly-owned properties – summary 9 Note: The same store grouping presented above for purposes of disclosing the pre-leasing status for the upcoming 2015/2016 academic year represents properties that will be classified as same store properties during the fourth quarter 2015 (the first full quarter of operations in the 2015/2016 academic year.) This represents properties purchased or developed prior to October 1, 2014. As of July 24, 2015 for current year and July 24, 2014 for prior year. Rentable beds exclude beds needed for on-site staff.As of September 30, 2014. Properties not owned or under ACC management during the prior year, or properties whose leasing progress is not comparable to the prior year as a result of plans to renovate or redevelop the property, are excluded for purposes of calculating the prior year percentage of rentable beds and final fall 2014 occupancy.Projected rate increase reflects projected rental rates anticipated to be achieved through the end of the company’s leasing cycle, up to targeted occupancy.
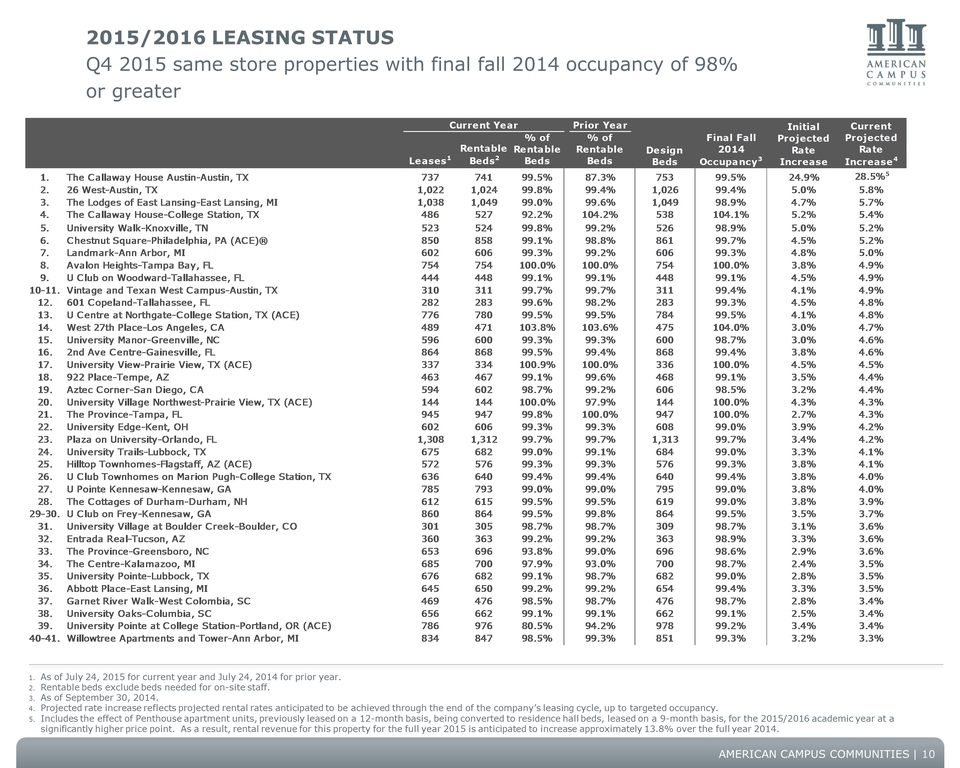
2015/2016 Leasing Status Q4 2015 same store properties with final fall 2014 occupancy of 98% or greater 10 As of July 24, 2015 for current year and July 24, 2014 for prior year. Rentable beds exclude beds needed for on-site staff.As of September 30, 2014.Projected rate increase reflects projected rental rates anticipated to be achieved through the end of the company’s leasing cycle, up to targeted occupancy.Includes the effect of Penthouse apartment units, previously leased on a 12-month basis, being converted to residence hall beds, leased on a 9-month basis, for the 2015/2016 academic year at a significantly higher price point. As a result, rental revenue for this property for the full year 2015 is anticipated to increase approximately 13.8% over the full year 2014.
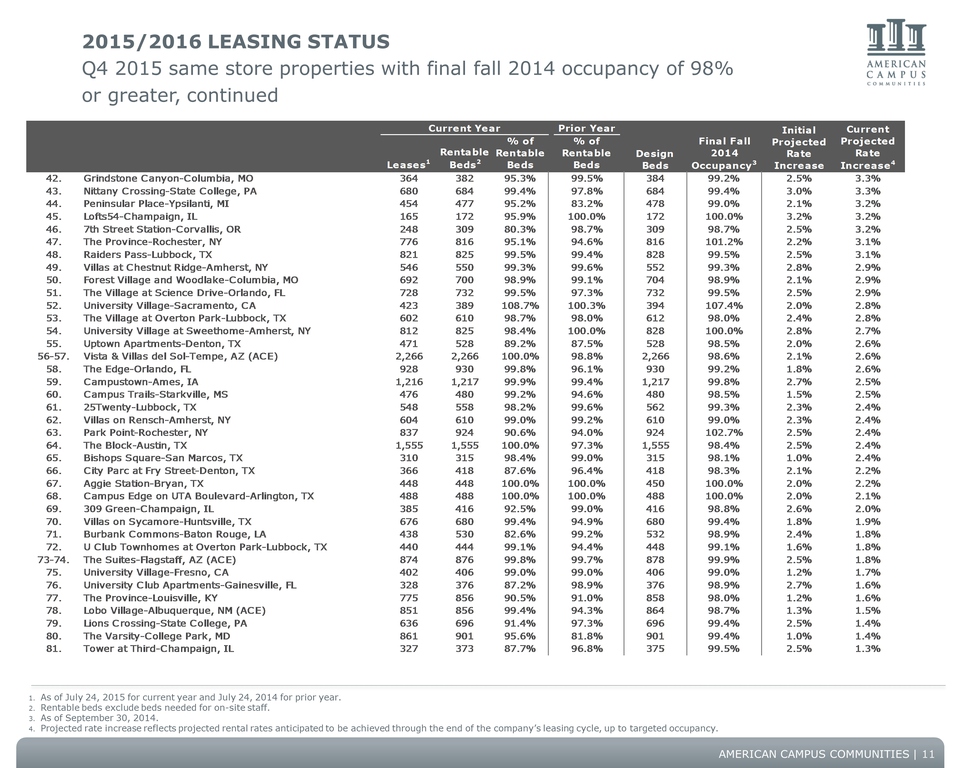
2015/2016 Leasing Status Q4 2015 same store properties with final fall 2014 occupancy of 98% or greater, continued 11 As of July 24, 2015 for current year and July 24, 2014 for prior year. Rentable beds exclude beds needed for on-site staff.As of September 30, 2014.Projected rate increase reflects projected rental rates anticipated to be achieved through the end of the company’s leasing cycle, up to targeted occupancy.

2015/2016 Leasing Status Q4 2015 same store properties with final fall 2014 occupancy of 98% or greater, continued 12 As of July 24, 2015 for current year and July 24, 2014 for prior year. Rentable beds exclude beds needed for on-site staff.As of September 30, 2014.Projected rate increase reflects projected rental rates anticipated to be achieved through the end of the company’s leasing cycle, up to targeted occupancy.

2015/2016 Leasing Status Q4 2015 same store properties with final fall 2014 occupancy between 95% and 98% 13 As of July 24, 2015 for current year and July 24, 2014 for prior year. Rentable beds exclude beds needed for on-site staff.As of September 30, 2014.Projected rate increase reflects projected rental rates anticipated to be achieved through the end of the company’s leasing cycle, up to targeted occupancy.Property is leased under the University on-campus assignment process.
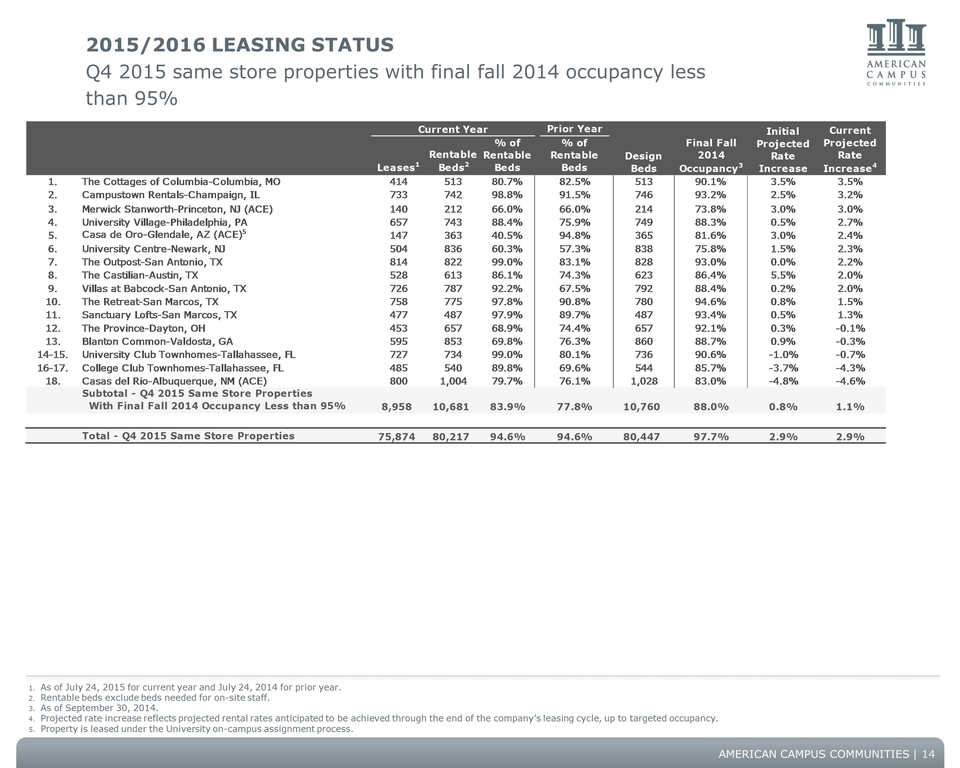
2015/2016 Leasing Status Q4 2015 same store properties with final fall 2014 occupancy less than 95% As of July 24, 2015 for current year and July 24, 2014 for prior year. Rentable beds exclude beds needed for on-site staff.As of September 30, 2014.Projected rate increase reflects projected rental rates anticipated to be achieved through the end of the company’s leasing cycle, up to targeted occupancy.Property is leased under the University on-campus assignment process. 14

2015/2016 Leasing Status New wholly-owned properties As of July 24, 2015 for current year and July 24, 2014 for prior year.Rentable beds exclude beds needed for on-site staff.As of September 30, 2014.Projected rate increase reflects projected rental rates anticipated to be achieved through the end of the company’s leasing cycle, up to targeted occupancy.Properties not owned or under ACC management during the prior year, or properties whose leasing progress is not comparable to the prior year as a result of plans to renovate or redevelop the property, are excluded for purposes calculated the prior year percentage of rentable beds and final fall 2014 occupancy. 15

INVESTMENT UPDATE $ in thousands 16
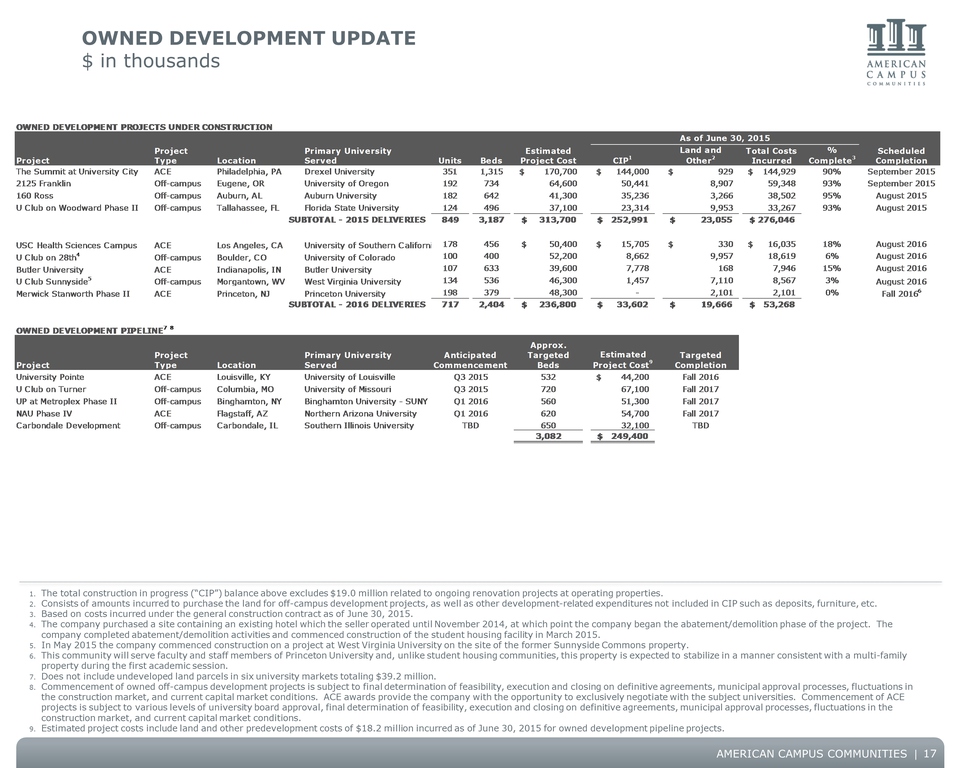
OWNED DEVELOPMENT UPDATE $ in thousands 17 The total construction in progress (“CIP”) balance above excludes $19.0 million related to ongoing renovation projects at operating properties.Consists of amounts incurred to purchase the land for off-campus development projects, as well as other development-related expenditures not included in CIP such as deposits, furniture, etc.Based on costs incurred under the general construction contract as of June 30, 2015.The company purchased a site containing an existing hotel which the seller operated until November 2014, at which point the company began the abatement/demolition phase of the project. The company completed abatement/demolition activities and commenced construction of the student housing facility in March 2015.In May 2015 the company commenced construction on a project at West Virginia University on the site of the former Sunnyside Commons property.This community will serve faculty and staff members of Princeton University and, unlike student housing communities, this property is expected to stabilize in a manner consistent with a multi-family property during the first academic session.Does not include undeveloped land parcels in six university markets totaling $39.2 million. Commencement of owned off-campus development projects is subject to final determination of feasibility, execution and closing on definitive agreements, municipal approval processes, fluctuations in the construction market, and current capital market conditions. ACE awards provide the company with the opportunity to exclusively negotiate with the subject universities. Commencement of ACE projects is subject to various levels of university board approval, final determination of feasibility, execution and closing on definitive agreements, municipal approval processes, fluctuations in the construction market, and current capital market conditions.Estimated project costs include land and other predevelopment costs of $18.2 million incurred as of June 30, 2015 for owned development pipeline projects.

Third-party development update $ in thousands 18 Under the terms of the predevelopment services agreement, we performed various predevelopment activities for which we earned a fee of $0.1 million. This concludes the company’s role in this transaction.These awards relate to speculative development projects that are subject to final determination of feasibility, execution and closing on definitive agreements, and fluctuations in the construction and financing markets. Anticipated commencement and fees are dependent upon the availability of project financing, which is affected by current capital market conditions.In March 2015, the company entered into a Pre-development Services Agreement (“Agreement”) with the university for a proposed third-party on-campus development project. If the university terminates the Agreement and utilizes the project plans within ten years of the termination date, we will receive a fee for the performance of predevelopment activities in the range of $0.5 million to $0.9 million. The full scope, fees and construction period have not been finalized.

Management services update $ in thousands 19 Stabilized annual fees are dependent upon the achievement of anticipated occupancy levels.We will earn a fee during the construction phase of this property for services related to the initial lease-up and operations, which we anticipate will begin in July 2015. We do not expect the stabilized annual management fee to be earned upon completion of construction and commencement of operations to be materially different from the fee earned during the construction period. We will earn a fee related to the initial lease-up of this property prior to September 2015, at which time we will earn the full contracted amount.

CAPITAL STRUCTURE AS OF June 30, 2015 $ in millions, except share and per share data Note – refer to the Definitions outlined on pages 21 and 22 for detailed definitions of terms appearing on this page.Excludes net unamortized debt premiums related to mortgage loans assumed in connection with acquisitions of $55.1 million and the unamortized original issue discount on unsecured notes of $1.6 million.Based on share price of $37.69 and fully diluted share count of 114,537,250 as of June 30, 2015. Assumes conversion of 1,557,290 common and preferred Operating Partnership units and 665,555 unvested restricted stock awards.Excludes accumulated depreciation of $770.2 million and receivables and intangible assets, net of accumulated amortization, of $30.8 million. Based on Adjusted Earnings Before Interest, Taxes, Depreciation, and Amortization (“EBITDA”) and Adjusted Interest Expense of $365.6 million and $98.1 million, respectively, for the four most recently completed fiscal quarters. Includes pro forma adjustments to EBITDA and Interest Expense of $7.7 million and $7.9 million, respectively, to reflect all acquisitions, development deliveries, dispositions, debt repayments and debt refinancings as if such transactions had occurred on the first day of the 12 month period presented. Adjusted Interest Expense includes $9.8 million of interest capitalized for GAAP purposes and excludes $12.3 million of amortization of net debt premiums related to mortgage loans assumed in connection with acquisitions.Including the amortization of net debt premiums related to mortgage loans assumed in connection with property acquisitions, the effective interest rate for fixed rate mortgage loans is 3.6%. 20 TotalDebt 5.2% 5.9% 3.2% 2.8% 1.7% 5.6% 5.3% 4.1% 4.0% 4.3% Fixed Rate Mortgage Loans 5.2% 5.9% 5.8% 4.2% - 5.6% 5.4% 4.1% 7.2% 3.7% Weighted Average Interest Rate Of Debt Maturing Each Year

DEFINITIONS 21 * These definitions are provided for purposes of calculating the company’s bond covenants and other key ratios.

DEFINITIONS, continued 22 * These definitions are provided for purposes of calculating the company’s bond covenants and other key ratios.
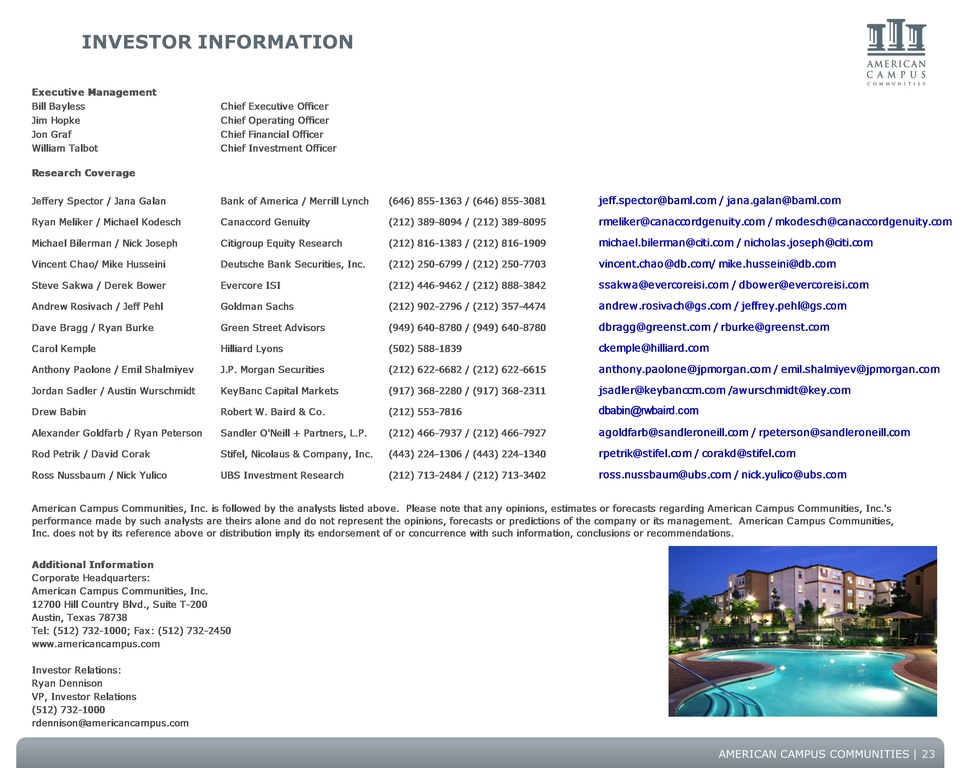
Investor information 23
Forward-looking statementS In addition to historical information, this supplemental package contains forward-looking statements under the federal securities law. These statements are based on current expectations, estimates and projections about the industry and markets in which American Campus operates, management's beliefs, and assumptions made by management. Forward-looking statements are not guarantees of future performance and involve certain risks and uncertainties, which are difficult to predict.
Serious News for Serious Traders! Try StreetInsider.com Premium Free!
You May Also Be Interested In
- Aker Carbon Capture: Presentation of Q1 2024 results
- Purpose Investments Inc. Announces Updated April 2024 Distribution Rate and Record and Ex-Distribution dates for Purpose High Interest Savings Fund, Purpose US Cash Fund, Purpose Cash Management Fund,
- DPL Financial Partners releases statement on final DOL Retirement Security Rule
Create E-mail Alert Related Categories
SEC FilingsSign up for StreetInsider Free!
Receive full access to all new and archived articles, unlimited portfolio tracking, e-mail alerts, custom newswires and RSS feeds - and more!
