

Form 8-K ALCOA INC. For: Apr 11
 Tweet
Tweet Share
Share
UNITED STATES
SECURITIES AND EXCHANGE COMMISSION
Washington, D.C. 20549
FORM 8-K
CURRENT REPORT
PURSUANT TO SECTION 13 OR 15(d)
OF THE SECURITIES EXCHANGE ACT OF 1934
Date of Report (Date of earliest event reported): April 14, 2016 (April 11, 2016)
ALCOA INC.
(Exact name of Registrant as specified in its charter)
| Pennsylvania | 1-3610 | 25-0317820 | ||
| (State or Other Jurisdiction of Incorporation) |
(Commission File Number) |
(I.R.S. Employer Identification Number) |
| 390 Park Avenue, New York, New York | 10022-4608 | |
| (Address of Principal Executive Offices) | (Zip Code) |
Office of Investor Relations 212-836-2674
Office of the Secretary 212-836-2732
(Registrant’s telephone number, including area code)
(Former Name or Former Address, if Changed Since Last Report)
Check the appropriate box below if the Form 8-K filing is intended to simultaneously satisfy the filing obligation of the Registrant under any of the following provisions:
| ¨ | Written communications pursuant to Rule 425 under the Securities Act (17 CFR 230.425) |
| ¨ | Soliciting material pursuant to Rule 14a-12 under the Exchange Act (17 CFR 240.14a-12) |
| ¨ | Pre-commencement communications pursuant to Rule 14d-2(b) under the Exchange Act (17 CFR 240.14d-2(b)) |
| ¨ | Pre-commencement communications pursuant to Rule 13e-4(c) under the Exchange Act (17 CFR 240.13e-4(c)) |
| Item 2.02. | Results of Operations and Financial Condition. |
On April 11, 2016, Alcoa Inc. held its first quarter 2016 earnings conference call, broadcast live by webcast. A transcript of the call and a copy of the slides presented during the call are attached hereto as Exhibits 99.1 and 99.2, respectively, and are hereby incorporated by reference.
* * * * *
The information in this Current Report on Form 8-K, including Exhibits 99.1 and 99.2, is being furnished in accordance with the provisions of General Instruction B.2 of Form 8-K.
Forward-Looking Statements
This communication contains statements that relate to future events and expectations, and as such constitute forward-looking statements within the meaning of the Private Securities Litigation Reform Act of 1995. Forward-looking statements include those containing such words as “anticipates,” “believes,” “could,” “estimates,” “expects,” “forecasts,” “goal,” “intends,” “may,” “outlook,” “plans,” “projects,” “seeks,” “sees,” “should,” “targets,” “will,” “would,” or other words of similar meaning. All statements that reflect Alcoa’s expectations, assumptions or projections about the future, other than statements of historical fact, are forward-looking statements, including, without limitation, forecasts concerning global demand growth for aluminum, supply/demand balances, and growth of the aerospace, automotive, and other end markets; statements regarding targeted financial results or operating performance; statements about Alcoa’s strategies, outlook, business and financial prospects; and statements regarding the separation transaction, including the future performance of Value-Add Company and Upstream Company if the separation is completed, the expected benefits of the separation, and the expected timing of the Form 10 filing and the completion of the separation. Forward-looking statements are not guarantees of future performance and are subject to risks, uncertainties, and changes in circumstances that are difficult to predict. Although Alcoa believes that the expectations reflected in any forward-looking statements are based on reasonable assumptions, it can give no assurance that these expectations will be attained and it is possible that actual results may differ materially from those indicated by these forward-looking statements due to a variety of risks and uncertainties. Such risks and uncertainties include, but are not limited to: (a) uncertainties as to the timing of the separation and whether it will be completed; (b) the possibility that various closing conditions for the separation may not be satisfied; (c) failure of the separation to qualify for the expected tax treatment; (d) the possibility that any third-party consents required in connection with the separation will not be received; (e) the impact of the separation on the businesses of Alcoa; (f) the risk that the businesses will not be separated successfully or such separation may be more difficult, time-consuming or costly than expected, which could result in additional demands on Alcoa’s resources, systems, procedures and controls, disruption of its ongoing business and diversion of management’s attention from other business concerns; (g) material adverse changes in aluminum industry conditions, including global supply and demand conditions and fluctuations in London Metal Exchange-based prices and premiums, as applicable, for primary aluminum, alumina, and other products,
2
and fluctuations in indexed-based and spot prices for alumina; (h) deterioration in global economic and financial market conditions generally; (i) unfavorable changes in the markets served by Alcoa; (j) the impact of changes in foreign currency exchange rates on costs and results; (k) increases in energy costs; (l) the inability to achieve the level of revenue growth, cash generation, cost savings, improvement in profitability and margins, fiscal discipline, or strengthening of competitiveness and operations (including executing on the business improvement plans, moving the Upstream alumina and aluminum businesses down on the industry cost curves, and increasing revenues and improving margins in the Value-Add businesses) anticipated from restructuring programs and productivity improvement, cash sustainability, technology advancements (including, without limitation, advanced aluminum alloys, Alcoa Micromill, and other materials and processes), and other initiatives; (m) Alcoa’s inability to realize expected benefits, in each case as planned and by targeted completion dates, from acquisitions, divestitures, facility closures, curtailments, or expansions, or international joint ventures; (n) political, economic, and regulatory risks in the countries in which Alcoa operates or sells products; (o) the outcome of contingencies, including legal proceedings, government or regulatory investigations, and environmental remediation; (p) the impact of cyber attacks and potential information technology or data security breaches; (q) the potential failure to retain key employees while the separation transaction is pending or after it is completed; (r) the risk that increased debt levels, deterioration in debt protection metrics, contraction in liquidity, or other factors could adversely affect the targeted credit ratings for Value-Add Company or Upstream Company; and (s) the other risk factors discussed in Alcoa’s Form 10-K for the year ended December 31, 2015, and other reports filed with the U.S. Securities and Exchange Commission (SEC). Alcoa disclaims any obligation to update publicly any forward-looking statements, whether in response to new information, future events or otherwise, except as required by applicable law. Market projections are subject to the risks discussed above and other risks in the market.
| Item 9.01. | Financial Statements and Exhibits. |
| (d) | Exhibits. |
The following are furnished as exhibits to this report:
| 99.1 | Transcript of Alcoa Inc. first quarter 2016 earnings call. | |
| 99.2 | Slides presented during Alcoa Inc. first quarter 2016 earnings call. | |
3
SIGNATURES
Pursuant to the requirements of the Securities Exchange Act of 1934, the Registrant has duly caused this report to be signed on its behalf by the undersigned hereunto duly authorized.
| ALCOA INC. | ||
| By: | /s/ Audrey Strauss | |
| Name: | Audrey Strauss | |
| Title: | Executive Vice President, Chief Legal Officer and Secretary | |
Dated: April 14, 2016
4
EXHIBIT INDEX
| Exhibit |
Description | |
| 99.1 | Transcript of Alcoa Inc. first quarter 2016 earnings call. | |
| 99.2 | Slides presented during Alcoa Inc. first quarter 2016 earnings call. | |
5
Exhibit 99.1
| Event ID: | 137608125962 | |
| Event Name: | Q1 2016 Alcoa Inc Earnings Call | |
| Event Date: | 2016-04-11T21:00:00 UTC |
P: Operator;;
C: Matthew Garth; Alcoa Inc.; VP of Financial Planning and Analysis & IR
C: Klaus Kleinfeld; Alcoa Inc.; Chairman & CEO
C: William Oplinger; Alcoa Inc.; EVP & CFO
P: Evan Kurtz; Morgan Stanley; Analyst
P: Curt Woodworth; Credit Suisse; Analyst
P: David Gagliano; BMO Capital Markets; Analyst
P: Justin Bergner; Gabelli & Company; Analyst
P: Tony Rizzuto; Cowen and Company; Analyst
P: Josh Sullivan; Sterne, Agee & Leach, Inc.; Analyst
P: Charles Bradford; Bradford Research; Analyst
P: Justine Fisher; Goldman Sachs; Analyst
+++ presentation
Operator^ Good day, ladies and gentlemen, and welcome to the first-quarter 2016 Alcoa earnings conference call. My name is Shannon, and I will be your operator for today. As a reminder, today’s conference is being recorded for replay purposes. I would now like to turn the conference over to your host for today, Matthew Garth, Vice President of Financial Planning and Analysis and Investor Relations. Please proceed.
Matthew Garth^ Thank you, Shannon. Good afternoon, and welcome to Alcoa’s first-quarter 2016 earnings conference call.
Let me begin by apologizing for the late distribution of the press release. Our news wire provider network went down, so we distributed the release as quickly as we could. I’m joined today by Klaus Kleinfeld, Chairman and Chief Executive Officer; and William Oplinger, Executive Vice President and Chief Financial Officer. After comments by Klaus and Bill, we will take your questions.
Before we begin, I’d like to remind you that today’s discussion will contain forward-looking statements relating to future events and expectations. You can find factors that cause the Company’s actual results to differ materially from these projections listed in today’s press release and presentation, and in our most recent SEC filings. In addition, we have included some non-GAAP financial measures in our discussion. Reconciliations to the most directly-comparable GAAP financial measures can be found in today’s press release, in the appendix to today’s presentation, and on our website at www.alcoa.com under the “Invest” section. Any reference in our discussion today to historical EBITDA means adjusted EBITDA, from which we have provided reconciliations and calculations in the appendix. With that, I’d like to turn the call over to Klaus.
Klaus Kleinfeld^ Very good, Matt. Thank you very much. In the usual fashion, let me characterize the quarter. Solid performance, strong
productivity, separation on track. We have, for your better digestion actually, separated out your Arconic, as the new value-add company will be called, and new Alcoa, gives you a better taste for the future two firms.
Let’s start with the Arconic segment. Revenue is $3.3 billion, down 2.2% overall. This is really a combination of the growth of 6.7%, predominantly acquisition related, and a decline of 8.3% from metals and FX changes, and also minus 0.6% from divestitures or closing of operations. Profits are up 8%, record adjusted EBITDA margin of 16.4%.
If we then go down into the segments, global rolled products profit up 26%, the EBITDA margin per metric ton, probably the best measure of how they’re doing, $374. And if you include the Warrick metal, cold metal plant it would have been even at $390 per metric ton.
And then in Engineered Products and Solutions, record first-quarter revenues, record first-quarter profit up 4%, Transportation and Construction Solutions up 3% profitability, and record first-quarter adjusted EBITDA margin of 14.9%. Good news, also, we’ve been able to secure a supply agreement with Airbus for 3D printed titanium parts for Airbus on the planes. So this is obviously also indicating an important future business opportunity.
We’ve been able to secure multi-year $1 billion industrial gas turbine contract, the largest IGT contract to date. We have been able to sell Remmele Medical, proceeds of $102 million. $179 million of productivity, plan is $650 million in 2016. Global rolled products, transportation, construction solutions are on track to meet their three-year targets, and we have set a new goal for EPS that will better reflect the aerospace market and the Firth Rixson performance, and obviously we’ll go into it and I’ll talk to this in detail in my presentation.
So then, when you go to the new Alcoa segments, third-party revenues of $1.7 billion, down 32%. This also is a combination of growth of 4.5%, offset by 26% through lower prices and FX, and another 10.6% through the curtailment and closures of operations. Both segments are profitable. We’ve been able to sign a $350 million third-party bauxite contract.
Ma’aden, the refinery is now at 80%, nameplate capacity, we’ve been able to curtail, fully curtail. We are able to fully curtail Point Comfort by the second quarter. Warrick smelter is closed, $175 million of productivity, plan is $550 million in 2016.
We’ve sold the pipeline, natural gas pipeline, or our stake in it, in Western Australia, for $154 million, and we are on track to meet our three-year targets, which is a cost curve target to get down to 38th percentile for aluminum and the 21st percentile for alumina. And as a third point, separation is on track. With this, let me hand over, Bill, to you.
William Oplinger^ Thanks, Klaus. As we usually do, let’s review the income statement. First-quarter 2016 revenue totaled $4.9 billion, down approximately 15% year-over-year. Organic growth, and growth from the
recent acquisitions was offset by lower alumina and metal pricing, and the impact of divested and closed businesses. Cost of goods sold percentage decreased by 230 basis points sequentially, largely due to productivity gains.
Overhead spending increased year-over-year, primarily as a result of costs related to planned separation of the Company, and the acquisition of RTI. Other expenses of $34 million were related to the results of our Ma’aden joint venture and unfavorable currency translation. First-quarter effective tax rate of 73.2% was primarily due to non-deductible separation costs, and tax associated with an asset sale and discrete tax items in the quarter. Excluding these impacts, our operational rate was 32%.
Overall, net income for the quarter was $16 million or $0.00 per share. Preferred dividends were $18 million in the quarter, which reduced EPS by $0.01 per share. Excluding special items, net income was $108 million, or $0.07 a share.
Let’s take a closer look at the special items. In the quarter, we recorded after-tax charges of $92 million or $0.07 per share, primarily related to restructuring and separation costs. Restructuring across the business included accelerated depreciation of the Warrick smelter, costs from the Wenatchee and Point Comfort curtailments, and headcount reductions associated with lower market demand, largely in the aerospace businesses.
In the EPS segment we’ve reduced 600 positions in the first quarter, and have a plan to reduce an additional 400 positions this year, also, given the current market environment, we’re evaluating a further reduction of up to 1,000 positions. Portfolio transaction costs stem from work being done to separate the Company. Note that roughly 75% of the restructuring-related charges are non-cash.
Now, let’s look at our performance versus a year ago. First-quarter adjusted earnings of $108 million were down $255 million from the prior-year quarter, driven largely by the drop in alumina and metal prices. Lower prices, predominantly related to new contracts that have been signed over the last year, drove a negative impact also. However, strong productivity gains in all segments contributed $232 million in savings, which more than offset $80 million in cost increases. The largest driver of these cost increases were costs associated with our recent exits in the upstream business, as well as increases in labor and benefits.
Now let’s move to the segment results. GRP turned in another strong quarter, as growth in automotive sheet shipments and solid productivity gains were partially offset by spending on growth projects and utilizing cold metal at the Warrick facility, after the smelter shutdown. As Klaus alluded to, EBITDA per ton was $374 a metric ton, or $390 a metric ton, excluding the costs associated with the Warrick curtailment, well above the three-year target of $344 a metric ton.
As we look to the second quarter of 2016, we expect GRP’s performance to reflect the following factors: Strong automotive sheet shipments, lower
commercial transportation build rates, and $15 million of costs after-tax to secure metal as a result of the Warrick smelter curtailment. Overall, ATOI for the segment is expected to be up 5% to 7%, excluding the Warrick impact.
Let’s move to EPS. EPS posted record revenue for the first quarter, driven by the inclusion of RTI, now known as ATEP, Alcoa Titanium Engineered Products. ATOI was $162 million for the quarter, up 4% versus the prior year. ATEP contributed $17 million in ATOI, which is ahead of our business case estimates.
Firth Rixson delivered ATOI of $11 million, and an EBITDA of $34 million. On an operational basis, after-tax productivity gains in the segment of $66 million more than offset cost increases of $39 million, and growth project spend of $15 million. As I mentioned in the overall Alcoa bridge, the unfavorable price mix is mainly in our base aerospace segments. Klaus will spend some more time talking about the performance drivers in EPS here shortly.
As we look to the second quarter, we expect the aerospace market to remain solid. However, it will be tampered by declines in legacy program deliveries, careful new program ramp-ups, and inventory management at OEMs. We expect to gain share through innovation, and continue to drive productivity across all businesses, amid pricing pressures. Overall, for the second quarter, we anticipate ATOI to be up 5% to 10% year-over-year.
Now, let’s move to TCS. TCS first-quarter revenue declined 9% year-over-year driven by the North American heavy duty truck market, and the relatively weak Brazilian market. ATOI for the first quarter was $39 million, up slightly versus the prior-year quarter, as productivity gains more than offset currency, market headwinds, and cost increases.
As we look to the second quarter, we expect improvement in the North American non-residential construction market, with sustained levels in Europe. Continued softness in the North American heavy duty truck market, offset by European improvement, continued weakness in our Brazil operations, stemming from the current economic environment. However, the second-quarter ATOI is expected to be flat year-over-year, as strong productivity gains counter these factors.
Let’s now move on to Alumina. Sequentially, the alumina segment was heavily impacted by declines in API pricing, which fell another 19% on average this quarter. Strong productivity at our operating locations, and improved mix of smelter grade shipments priced on API helped to partially offset these pricing headwinds. We’ve ramped down our Point Comfort refinery, which is currently operating on one digester, and we will be fully curtailed in the second quarter.
Creep production, however, with our system will offset the Point Comfort decline, yielding flat production sequentially. As we look forward to the second quarter, API pricing, as it usually does, will follow a 30-day lag, and LME pricing to follow a 60-day lag. Continued expansion of third party sales of bauxite, as Klaus alluded to, we recently signed a large bauxite contract. Benefit from acceleration of our productivity program. ATOI is expected to be up $15 million, excluding impacts of pricing and currency.
Let me turn to Primary Metals. Primary Metals first-quarter ATOI improved by $54 million sequentially, due to very strong productivity improvements, and further declines in alumina costs. The closure of the Warrick smelter was completed in the quarter. Looking forward to the second quarter, we expect production will decrease 50,000 metric tons, because of the Warrick closure.
Pricing, as it usually does, will follow a 15-day lag to the LME, and energy sales will continue to decline, but our accelerated productivity program and favorable raw material costs will more than offset these headwinds. In this segment, ATOI is expected to be up $10 million, excluding the impacts of pricing and currency.
Before I move on to working capital, let me summarize the second-quarter guidance. GRP up 5% to 7%, excluding the Warrick cold metal plant. EPS up 5% to 10%. TCS flat in tough market conditions, and the upstream up $25 million, excluding pricing and currency impacts.
Let’s take a look at working capital. DWC increased 14 days year-over-year. Acquisitions, mainly ATEP, drove 10 days, while the organic business increased by 4 days. In the organic portion of the business, the increase of 4 days is almost entirely related to the ramp-up of our automotive sheet business and new growth programs and EPS.
We move on to the cash flow statement. Cash from operations was negative $430 million for the quarter, leading to free cash flow of negative $681 million. This reflects our usual seasonal increase in working capital, as well as annual incentive compensation payments, semi-annual interest payments, and the third of five annual DOJ and SEC settlement payments, related to the Alba case.
This quarter, we contributed $70 million of cash to the pension plan. One question we often get asked is whether the pension expense sits in the segments or in corporate, so I’ll take a second to clear that up. Pension expense associated with the active employees and retirees from existing businesses is included in the respective segment. Pension expense associated with sold, closed businesses, or corporate employees, sits in corporate. Capital expenditures for the quarter were $251 million, with $123 million related to return-seeking projects.
We ended the quarter with $1.4 billion of cash. We’ve also announced the sale of a few assets to increase our cash position, so let me take a look at those in more detail. As you can see from this slide, we’ve initiated the sale of non-essential assets as part of our actions to strengthen liquidity during the separation process.
These include both upstream and future Arconic assets. We’ve announced the sales of our stake, as Klaus alluded to, in the Western Australia pipeline, and ATEP’s medical device business, and have already closed on the pipeline deal. In addition, we are redeeming the corporate owned life insurance program which was set up a number of decades ago. Those sales
generated $234 million in the first quarter, with approximately $270 million more expected in the second quarter. So if we move to the balance sheet, we ended the quarter with $1.4 billion in cash on hand and debt at $9.1 billion, resulting in net debt of $7.7 billion, slightly higher than our position last year at this time.
Now let’s take a look at the aluminum market fundamentals. We’re revising our 2016 global demand for aluminum from 6% to 5%, with consumption on pace to reach 59.7 million metric tons. The slight decline in demand is from two key markets, China and North America.
Chinese growth is being reduced to 6.5% versus our prior forecast of 8%, due to slower growth in the construction and electrical segments. North American demand growth is being reduced to 4%. However, at the same time, we’ve seen a reduction in supply, leaving our 2016 deficit projection largely intact. Aluminum supply growth is projected at only 2% year-over-year. At approximately 3% supply growth, China’s net supply growth rate is the lowest that it’s been since the global financial crisis.
Even outside of China, we see the majority of growth coming from Asia, while North America has curtailed significant production, putting the rest of the world on track for 1.5% supply growth in 2016. So the net impact is a global deficit of aluminum of approximately 1.1 million metric tons, with the rest of the world in deficit by nearly 2 million metric tons and China in surplus. Global inventories on a days of consumption basis have fallen, both year-over-year and versus last quarter, and we expect them to continue to fall, due to the global deficit this year. Premiums seem to have stabilized with all three of the major global premiums currently above their low points from the fourth quarter.
We move to the alumina market. The 2016 alumina market is also in deficit of approximately 1.4 million metric tons. However, this is a fairly large revision from our prior estimate of 2.2 million metric tons. The lower deficit is predominantly the result of lower demand due to smelting, as I alluded to on the smelting side, and Chinese refinery restarts.
Similar to aluminum, alumina demand growth is projected to outpace supply growth globally in 2016, moving the market from the 2015 surplus to a projected deficit. The price has responded to the improving fundamentals, recovering almost $50 per ton since the lows we experienced at the beginning of the year. Now, let me turn it back over to Klaus.
Klaus Kleinfeld^ Thank you very much, Bill. So why don’t we start with a look into the end markets that are most relevant for Arconic and also for the new future Alcoa.
Start with aerospace. Aerospace we project 6% to 8% growth this year. This is a little lower than our 8% to 9% that we saw for this year earlier in the year.
We see that the market is going through a transition, given an unprecedented level of new model introductions, and we are seeing lower orders due to that for legacy models, and a careful ramp-up of the new models. Large commercial aircraft deliveries stand at 9%, plus 9%. The order book, the jet order book is bigger than nine years of production.
We actually see solid airline fundamentals from passenger mile demand to the cargo demand, airline profitability is expected to hit a record this year. The global trend is also fully intact with the middle class as well as urbanization and the cancellations are below the five-year average and below 2% of the gross order book.
Let’s go to automotive, and let’s start with North America. We believe a 1% to 5% growth. This confirms our earlier view. Production was up 7.4%, strong sales, 3.1%, sustained demand also, we see the average age of the vehicles of 12 years and older is increasing, so pent-up demand showing in there.
Stable inventories with 65 days. The average transaction price is up 2%. So all of that are pretty good news in that market in North America.
In EU, automotive in EU rising production of 1.9% and the west, 4.3% offset by minus 14% in Eastern Europe. Strong registrations, over 10%, and exports increased, expected to increase by 6.9%. China, production’s recovering, plus 3.9%. We expect for the full year, 2% to 5%, and then sales, plus 4.1% year-to-date and minus 1.3% year-over-year.
So let’s go to the next segment. The heavy duty trucks and trailer. North America, we already had a pretty bleak outlook for this year.
And originally said minus 19 to minus 23. Looks even worse than what we saw before. Granted, it comes off now a high base of last year. We see minus 23 to minus 27.
Production is down 19%, weak rate growth demand, weak orders down 42%, inventories climbing 15.6%, it now stands at 66,800. The 10-year average is 47,400, so gives you a feel for it. The order book is falling, it stands currently at 131,000. This is still bigger than the historic average of 101,000, which is reflective of the strength that we’ve seen in the previous year there.
So Europe, we actually think that it’s also a little slower, 1% to 5%. We originally thought it would be 3% to 7%. We see strength in Western Europe, production’s up 20%, registrations are up almost 22%. At the same time, we see a decline in Eastern Europe, down 8.6%, mainly driven by the two big markets, Russia and Turkey.
In China, sales are up 26.8%. Production’s turning, slowly turning. Remember, they had this artifact with end of 2014 with the change in emission standards there.
So packaging, no news on all fronts. We believe North America minus 1% to zero, Europe 1% to 2% growth, China, 5% to 8% growth.
Then on building and construction, North America 4% to 6% growth. We see the non-residential contracts awarded at plus 4.7%. Architectural building index relatively steady. Housing starts at 10.6 plus.
Europe we believe is going to be between zero and minus 2%, flat to slight decline, obviously very substantially, depending on what country in Europe you look at. China, plus 3% to 5%, we see there.
Last segment here, industrial gas turbines, we see a growth of 2% to 4%, actually stabilizing, strongly driven by the new high efficient turbines, with advanced technology. Heavy duty gas turbine orders are up 12%, that’s pretty nice. And the 60 hertz gas-fired generation market is up 18.5%, also strong demand for spares and component upgrades. So that actually concludes the part of the end markets.
So let’s now go over to look at the business side, and let’s start with what we call future Arconic, or value-add businesses. Let’s talk about the first-quarter performance and the outlook for the second quarter, and then for full year. This is a very unique year, because usually, as you know, we don’t give a full-year guidance at this time of the year, but this is the final year of this time’s three-year target, so we put this in here to give you an overview on that.
So on GRP, to start with the first one, order shipments up 38%, strong productivity. You can see the mix is changing in the portfolio. We also believe in the second quarter that the profitability is going to be up 5% to 7% year over year, and we are confirming our target which is $6 billion to $6.2 billion of revenues, and $344 per metric ton of profitability.
On TCS, we have seen a record first quarter with an EBITDA margin of 14.9%, in spite of the headwinds, obviously that our wheels business has been facing through the heavy duty trucks and trailer business, that I just mentioned. Very, very good performance. Our outlook for the second quarter is pretty much, because of that, flat year-over-year, and we are confirming the target of $2 billion to $2.2 billion revenues, and a 15% return on that.
EPS, we have seen a record first quarter. We’ve seen an EBITDA margin of 21%, and we will see more about ATEP or former RTI that’s ahead of what we planned, and Firth Rixson is progressing but behind, and I’ll talk more about this in depth. We are, as the second quarter outlook, saying this is going to be up 5% to 10%.
As you remember, our three-year target was at $7.2 billion revenues, with a 23%. We are lowering this target and putting out a new goal, and our goal in depth into this, to explain what the situation is there, and the new goal is $6 billion to $6.2 billion in revenues and profitability between 21% to 22%. So let’s give you more details, so that you can reconcile the old to the new target.
And I would actually encourage everybody who has a chance to look at the slides, to look at the slides, so that you can actually follow these buckets in the best possible way, right? Because I think you want to understand what’s really going on there. So let’s start here on the revenue side. On the revenue side, we’re coming down from $7.2 billion to $6 billion to $6.2 billion.
We already said at Investor Day, compared to when we put the target up, the exchange rate has changed. That alone has an impact on the revenue of roughly $200 million. Then comes the aero industry headwinds that we’ve seen here, and that is an impact of roughly $500 million.
The non-aero headwinds, which is mainly the off-highway segment and the mining segment here, as well as oil and gas, adds another $200 million revenue headwinds. Then the lower performance of Firth Rixson, another $300 million, and there’s a positive one of $200 million of share gains. That pretty much explains why we have set this target, and what has been happening in there.
Let’s now to go to the right hand side, and do exactly the same thing on the profitability side, so on the EBITDA side. So you’ve seen what we’re doing on the right-hand side, what this shows here, is what are we planning to do to get to the new target which is 1.260 to 1.360 which is basically the amount in between 21% and 22%. So we’re focusing on those things that we can control very strongly.
So productivity, we expect to have at $400 million. Then we have counter position to that, which is cost increases of $280 million. But if you look at the character of these cost increases, this is not all bad because quite — the majority of that really is costs that are either ramped up costs for organic growth, like our aluminum lithium facility in Lafayette, or the move to low-cost countries where we basically invest in bringing this over there, and will substantially reduce our costs going forward here.
Then competitive pricing, that also shouldn’t be a surprise. You know how the customers are beating down on everybody in the aerospace industry. At the same time, you’ve seen that we have been able to win $10 billion of new contracts. We had to give about $100 million of pricing. At the same time, beneath that, you actually see there’s also already in this year a positive part with the share gains, that we are getting there roughly $60 million, and then obviously a big positive, It’s obviously more important to be on the platform than not to be on the platform. And then, at the last point, is we see a full year of RTI in here which we call ATEP now. We’re substantially ahead of plan, and that adds another $110 million.
So let’s go to the next slide and let me address Firth Rixson, because that’s where a lot of questions obviously are coming from you all. This is clearly behind our original expectation, and this has been impacted by market headwinds, the press outage, and the isothermal ramp-up, and I referred to those things already in previous conversations, but let me put some numbers around it. But before I do that, let me update you where these things stand.
The press is back online. And in isothermal, we are also seeing additional demand. We’re pursuing this. The qualification of the existing contract continues. We believe that production shipments will start in 2017.
All included, that said, our 2016 revenue guidance comes down from our plan from $1.6 billion to $1.1 billion to $1 billion, with a margin of 14% to 16%, and an absolute EBITDA of $150 million to $170 million. So if you now go to the yellow box here in the upper left corner, you actually see that, and that’s a bit of good news, that we are making progress here. Because if you compare the first quarter of 2015 with the first quarter now, you’re actually seeing profitability is up from 11.6 to 14.3.
Let’s also spend a minute on how do we get to this performance, and so that we better understand what goes into achieving this 2016, this new 2016 goal. Again, the focus is on those actions that we have full control over ourselves. So it’s no surprise for you, that you see a big chunk of that being productivity, and another chunk of this being actions by management, like exiting unprofitable product, entering new engine platforms, optimizing available capacity, right? At the same time, there are some headwinds and these headwinds will remain, and we’ve talked about that.
So we have improved the performance, as you’ve seen, but we are clearly behind. And if I were to quantify that, I’d probably say probably by about two years behind here. So keep in mind, at the same time, the Firth Rixson acquisition is not about a quarter or a year.
The Firth Rixson acquisition, you have to see in light of what it is doing for Arconic. It is an important cornerstone for our aerospace presence. It is allowing us already today to have a full product suite for the jet engines. This has positioned us on a very different level via our jet engine, as well as our industrial gas turbine customers.
So let’s also now go and talk about another substantial acquisition that we did last year, which is RTI, or as we call it today, ATEP. So the integration is going very well. The performance is up, and it’s ahead of plan. If you look here on this slide, on the left hand side, this shows the pre-acquisition EBITDA and EBITDA margin, and the margin has been around 14%.
If you now look to the right hand side, and look at the first-quarter performance of former RTI, now ATEP, the profitability has been increased to 18.7%. What have we done? We’ve been able to accelerate our synergies. We are probably a year ahead, and we’ve been able to gain share. All of this together has allowed us to overcome the market headwinds that we’ve also seen here.
So therefore, we feel comfortable with our targets for this year, that you see on the right hand side here, to basically be able to get to 17% to 19% margin and generate $135 million to $160 million of EBITDA in 2016. Just to make this complete, our third but much smaller acquisition, TITAL, is fully on track.
You have seen this, in this quarter, the excellent performance of GRP. We have consistently and continued to shift to higher margin, higher value product in GRP. One of the questions that I’ve been receiving from some of you is, why don’t we see more of this and faster? And I want to provide some color, so that you see what is really going on in this.
So therefore, here on the left hand side, you see the measure for profitability in this business is basically the conversion margin, EBITDA per metric ton, right? And we’ve broken out here GRP into really two segments, packaging and aero transportation, industrial, which is basically the rest. You see what’s been happening. A massive decline in profitability in packaging, minus 55% in this timeframe that we’ve chosen here.
At the same time, as we are doing portfolio actions and selling and closing rolling mills, as well as order ramps up, we’ve been able to increase the aero transportation industrial segments, the profitability by 62%. And the good news is, and that’s what you see on the right hand side, auto will continue to grow in the coming years. So we very much push for constant productivity, and that is what we can control, and as you know, that’s much needed in light of the headwinds.
So the good news is, if you look at the left hand side here, at Arconic, we currently have 11,644 actions under way for this year, right? And the actions so far have generated $179 million of productivity by the end of the first quarter. The target is to get up to $650 million of productivity by 2016, and I think we’re well on track to do that.
The same good news is true for the future new Alcoa. Future new Alcoa has achieved $175 million of productivity target at $550 million, and there are 5,518 actions underway to get to that target. Also, well deployed, as we would call it.
So let’s also look at new Alcoa, our upstream business. We’re driving down the cost curve, and we’re meeting the three-year targets. Alumina curtailed Point Comfort, will be curtailed Point Comfort this quarter.
Saudi Arabia, 80% at nameplate capacity, Suralco curtailed, good productivity, outlook up $15 million, with constant pricing and currency for the second quarter, and we are confirming the target to come down to the 21st percentile by the end of the year on the cost curve. Aluminum, Warrick smelter closed. Wenatchee curtailed. Record low cost per ton in Saudi Arabia, good productivity. In the second quarter, we believe the profits will be up by $10 million, again, assuming pricing and currency constant. And we are confirming our cost curve target to come down to the 38th percentile by the end of the year.
Lastly, let me update you on the separation. We are on course for the second half of 2016. There’s a lot of detailed work going into separating a 120-year-old firm. Very exciting, but I would say the most interesting thing for you out there has probably been the launch of our new value-add name, and the refresh of the Alcoa brand, which we should see on page 14. There it is, for those that haven’t seen that yet.
Let me summarize this. We’re pulling all upstream levers. Arconic is geared for profitable growth, substantially in aero and auto. We see traction there, our robust business improvement programs underway, and we are on track for the separation in the second half. So with this, I turn it over to the Q&A.
+++ q-and-a
Operator^ (Operator Instructions)
Your first question comes from the line of Evan Kurtz from Morgan Stanley. Your line is open. Please go ahead.
Evan Kurtz^ Thanks everyone. Thanks for taking my questions. Just a quick one on aerospace. Seems like the market might be weakening a little bit. I was wondering how you protect yourself from that? Do you have any minimum requirements, contracts where you get some take or pay penalties if they dip below a certain amount in a given year?
Klaus Kleinfeld^ The contracts vary substantially, but typically, the way this works is you get certain components on a jet engine or on a plane platform, and then it all depends on whether — how much this sells, and typically if it doesn’t sell, you don’t get it. If it sells more, you get more. That’s really how this works.
Evan Kurtz^ Okay. So if they were to cut production schedules more, that would be a one-for-one relative to your revenue in aerospace, is that how to think about it?
Klaus Kleinfeld^ That’s exactly how you have to think about it. What you’re seeing here is a little bit of a different phenomenon. They are very carefully ramping up the new platforms, and that’s, I think, a very responsible behavior on their side, because there’s a lot of new technology in the jet engines, as well as in the structures, so they are carefully ramping it up, so that they are not spreading the goods all over the planet, and then if there are maintenance issues, they have an issue.
I see it rather than stretching out, because the demand, as you can see by what I just talked about on the end market, demand continues to be strong, right? You have a nine year order book. And there’s almost no cancellations and the fundamentals are strong, so that’s what’s happening in the market.
Evan Kurtz^ Thanks for that. My follow-up is just on the bauxite opportunity. Nice to see the $300 million third-party sale. What is the — I was hoping could you size the opportunity there. How much spare bauxite capacity do you have? I assume with some of the refineries down, that you can go above and beyond that, but any quantifying, that would be helpful.
William Oplinger^ We have curtailed Point Comfort. We’ve curtailed Suriname. And so any additional bauxite that we’re getting out of the system, we’re selling into the third-party market. And so the size of that deal that we just recently announced is $350 million over a couple of years, and as we’re looking to grow our third-party bauxite business.
Klaus Kleinfeld^ The nice thing is with the mining, it’s much easier to increase your capacity, as well as to slow down your capacity. This is not like in a refinery or in a smelter, where you have certain increments. A smelter you basically can typically only do a half a line, in a refinery it’s a digester that’s the unit that you can bring up or down.
In a bauxite mine, it’s much, much easier, and you can ramp it up and ramp it down much faster. You leave it in the air, in — you leave it in the ground, we’re still on aerospace, you leave it in the ground, you leave it in the ground, if there’s no demand, and you bring it out. Frankly, I think we are really not limited by our own capabilities. We have one of the largest bauxite reserves.
William Oplinger^ We have one of the largest bauxite reserves, and we’re the largest bauxite miner. We mine around 45 million metric tons a year, and looking to get bigger in the third party market.
Klaus Kleinfeld^ Exactly.
Evan Kurtz^ Thanks, everyone.
Operator^ Your next question comes from the line of Curt Woodworth from Credit Suisse. Your line is open. Please go ahead.
Curt Woodworth^ First question just on the guidance at Firth Rixson. When you look at it relative to your initial guidance, say 18 months ago, you’re off almost $190 million of EBITDA, and you commented that you think that’s — you’re two years behind your initial plans. The question is, how much of the miss is on the isothermal piece, and then when you say you’re two years out, does that mean you still think you can hit that initial target you outlined for the $1.6 billion of revenue, and the $350 million of EBITDA?
Klaus Kleinfeld^ Well, the good news on the isothermal, we have structured the contract in such a way that we have a performance clause in there. This is not directly for the isothermal alone. It’s for Savannah, and that was more for practical purposes, how to calculate that. That’s $130 million, if I recall that correctly. So that’s a performance, that’s a performance part in the purchasing agreement, with the seller. So in case that doesn’t happen, we would not have to —
Curt Woodworth^ That’s $150 million earn-out that we —.
Klaus Kleinfeld^ Exactly. So that’s the good news there. The other thing is on isothermal, as I mentioned before, it is coming up, the qualification is underway, and we have had additional requests from customers, which we are currently working on securing, which obviously allow us to improve the utilization of the isothermal press. We knew from the start on that isothermal, it’s a very, very complicated technology, and that’s why we did the earn-out, because we knew there was a risk in it from the start. Again, to be clear, the earn-out is on Savannah in total, not just on isothermal.
The question you mentioned, the second part of your question, will we get it in two years? Frankly, after our recent experiences, I would really leave it as I described it. We’re two years behind, and I would say we will work on it.
And the other plan, which is something that I shared with some of you already, but let me share it here. We are planning the moment — we are separating the two companies. We will be coming out with new three-year or multi-year, let me put it this way, multi-year targets.
By that time, so in the second half of the year you will also get much more clarity on the longer term for both companies, and we will also come out with the measurements that are more in tune with the two types of businesses that you will be seeing, a commodity business, as well as the high performance technology business. We have been talking to quite a number of investors, and we’re currently in the process of getting the investor matrix lined up.
Curt Woodworth^ As a follow-up, just on the packaging business, you said that profitability’s down about 55%. It’s not clear what the timetable is on that chart but it looks like it’s —
Klaus Kleinfeld^ Timetable’s very simple. It starts basically with the year —
William Oplinger^ 2011.
Klaus Kleinfeld^ 2011. We put the 2011 at 100%, and then you see how it’s going from there.
Curt Woodworth^ Falling 55% roughly, in say two years. Do you think that’s a structural change? How much of that — do you see a bottoming, and is it a combination of say, scrap spreads narrowing and pricing pressure, or mix, and do you think you can turn that around at all, because it’s still significant.
Klaus Kleinfeld^ Looks on the chart as two years but really it’s four, because we only showed 2011 to basically early 2016.
Curt Woodworth^ It is pretty flat the first year.
Klaus Kleinfeld^ Well, yes, in the first two years. The answer is very simple, yes, there is a structural change in the business and that’s also why we have been doing things like, for instance, changing Tennessee, that used to be a packaging mill only, into an automotive and packaging mill. That’s why we have been restructuring some other parts, closing some down, on our Australian mills, for instance, two Australian mills.
We sold the three mills in Europe, two in Spain, one in France, this all goes into it. We clearly believe that there is a structural change in the market, and we’re very happy that we have been building up the higher value businesses in there, and that’s really what you can see here also. But the unfortunate thing is the market, the packaging market has really substantially deteriorated.
William Oplinger^ And I would also point out, Curt, you look at the strength of the productivity that GRP has done year over year, and that’s really an attempt to offset some of these declines in the market in packaging.
Curt Woodworth^ Okay. Got it. Thank you.
Operator^ Your next question comes from the line of David Gagliano from BMO Capital Markets.
(Operator Instructions)
David Gagliano^ Thank you for taking my questions. Also, thank you for the increased visibility on the targets in the downstream. Actually, I have a question that’s related to the other two segments. I don’t know if I’m reading this correctly, but it looks to me like you say the GRP and the TCS segments are on track to meet the three-year targets for 2016.
And you gave revenue numbers for each of those segments in the press release. But if I look back at the November 2015 investor day, the revenue numbers in the press release for those two segments are about $1 billion below what they were, as of November 2015. So I’m wondering if you could give us a similar bridge that you gave for the EPS segment, to explain the difference.
Klaus Kleinfeld^ To be honest, I’m looking at it right now and I’m happy to put this out in the deck. I’m not sure whether, we probably have to run this through our legal process here. But I tell you, it’s very simple, and it ties back to what I just explained. Remember how much we have divested and closed also in the GRP side.
What we’ve basically done, if you take the original target, was nominal $7.1 billion, right? And we’ve divested and closed about $1.1 billion. So the target for 2013 where we put this out was roughly — the starting point was roughly $6 billion. And then if you look at what we have been able to add, through all the other things here, so automotive and stuff, and look at the LME and the FX, it brings it basically down to $6.1 billion.
William Oplinger^ And on the TCS side, Dave, there’s around $200 million negative impact from currency, also. So the numbers that you see on page 6, from it’s probably not page 6 on your deck, but from Klaus’ presentation, have been adjusted for ForEx impacts.
David Gagliano^ Okay. And so just — but just to clarify, on the GRP business, the $7 billion number that was provided November 2015 was pre —
Klaus Kleinfeld^ $7.1 billion.
David Gagliano^ $7.1 billion, was pre any divestitures?
Klaus Kleinfeld^ It was pre any divestitures and closures, and they have eliminated on that chart the LME and FX. You also have to see the LME pass-through part here and GRP.
David Gagliano^ Okay. Great. Thanks very much.
Operator^ Your next question comes from the line of Justin Bergner from Gabelli & Company. Your line is open. Please go ahead.
Justin Bergner^ Question on the separation. Is there any update you can give us on when we can expect the first Form 10 filing, or any update you can give us on sort of how matters are progressing vis-a-vis pension and the PBGC?
Klaus Kleinfeld^ Two things really. On the Form 10, we’ve always said first half of 2016 is when we put out the — is when we will put out the Form 10. And we will —
William Oplinger^ Regarding the PBGC, we’ve had initial conversations, initial discussions with the PBGC. It’s gone well, and we’ll update you, as we can. But the initial discussions have gone well.
Justin Bergner^ Great. That’s good to hear. As you divest some of these non-core assets, is it possible to provide us a net proceeds number, relative to that $750 million, and should we expect Alcoa to continue to work through divesting non-core assets opportunistically in the quarters ahead?
Klaus Kleinfeld^ We’re always looking at opportunities, how to monetize and generate value. So I think this has always been the case, if you look also in the previous year.
William Oplinger^ On the net proceeds side, you almost have to go one by one. But on the pipeline, you realize that we will have a tax impact, and also, we are a — it’s an AWAC asset, so we get our 60% share there. On Remmele, there will be a small tax impact, and then on the corporate owned life insurance, that will largely show up as cash this year, and we’re likely to consume a tax attribute in future years. So largely, that one will be without tax impact this year in 2016. So the total proceeds, slightly less than the $750 million we have for the gross.
Justin Bergner^ Great. Thanks for taking my questions.
Operator^ Your next question comes from the line of Tony Rizzuto from Cowen and Co. Your line is open. Please go ahead.
Tony Rizzuto^ Thanks for taking my questions. My first question is, what percentage of your aero business is spares or aftermarket versus OEM business?
Klaus Kleinfeld^ That’s a good one. Do you know it offhand?
William Oplinger^ I don’t know it offhand, Klaus. I hate to put a number out there without the actual numbers.
Klaus Kleinfeld^ Neither would I. Neither would I.
Tony Rizzuto^ I’ll follow up with you guys then offline.
Klaus Kleinfeld^ Exactly, Tony.
Tony Rizzuto^ Okay. And then the second question if I may, maybe if I could possibly ask a third question if that’s all right —
Klaus Kleinfeld^ Let’s start with the second before the third.
Tony Rizzuto^ All right. With regard to GRP, it sounded like you are seeing increased pressures on margins in the packaging market. Is that fair? Is that a fair statement?
Klaus Kleinfeld^ Just look at the slide that we just discussed here. There’s no way to deny that. At the same time, I’m not sure — I would say, we have seen the level to come down to this level, as we have it. So I think that — you’re talking about GRP, right, on packaging?
Tony Rizzuto^ Yes. And I’m talking about the level of acceleration in those pressures, because I am hearing — (multiple speakers)
Klaus Kleinfeld^ I would say this, at this point in time, we’re not seeing that increasing, but we’re also not seeing it trend upward.
William Oplinger^ I would reference you back, Tony, at least to our short-term guidance. And so we’re trying to be very clear in all of our short-term guidance that all of our segments are trending upward, with the exception of TCS. And so on the GRP side, we said, I think 5% to 7% year-over-year. So even if we see additional pricing pressures, we’re able to mitigate it through good cost control.
Klaus Kleinfeld^ With regards to the spares, our good team is just providing it, and I don’t want to go into each one of the segments, but I would say — I would say, it varies substantially depending on which one of the aerospace segments you are looking at, and it can go from — I think it also varies, if you look at by year, and I only have here in front of me one year. So it varies, if you look at, this is 2015, if you look at 2015, it varies from 50% in that year, some businesses, to 16%, or actually 10%, 10% in some other businesses, right? But I would be very careful with this number, right? Because the segment that has the 50% I think that’s a very unique situation that we had in 2015.
Tony Rizzuto^ Okay. That’s helpful. May I ask a quick third question if I may?
Klaus Kleinfeld^ Sure, go ahead.
Tony Rizzuto^ Of the upstream adjusted EBITDA that you reported, $185 million in Q1, approximately what percentage would be from power sales?
William Oplinger^ Let us come back to you on that one, Tony. I don’t have the numbers in front of me, but I think that the — just to give you some color, power sales have been down on a sequential quarter basis, and on a year-over-year basis, as we’ve seen the Brazilian power prices come off fairly substantially. So I can get you that number in a minute.
Tony Rizzuto^ All right. Got it. Thank you so much, gentlemen.
Operator^ Your next question comes from the line of Josh Sullivan from Sterne Capital. Your line is open. Please go ahead.
Josh Sullivan^ Just regarding the revised EPS guidance, you talked about pricing pressures from the OEMs. Do you think we’ve seen the bottom of that pressure, or just how do you see that playing out over the next 24 months? And if you could dissect that between maybe the legacy aircraft, and next generation aircraft?
Klaus Kleinfeld^ Look, I think that there’s enormous pressure from the OEMs. They are under pressure, through their customers. This pressure will continue. We are assuming this pressure will continue, and we will have to continue to build productivity in, and we will also have to continue to win through innovation, and basically put out new cars, come out with new ideas so it’s not just giving a certain reduction on price, but coming up with a technical solution that’s superior, so that we can jointly win. And that’s I think where our technical skills come in, and we are pretty good at that.
But the pricing pressure will continue. That’s what we are assuming, and we are in the business also to help our customers to win. So that will be going on. You also see, we’re pretty proud of having won this Airbus contract for 3D metals printing, and in this case, it’s titanium. I don’t know whether you noticed that.
As you may be aware of, also, we brought our new powder metals plant online beginning of the year, and that allows us to do powder very, very high quality metals powder for three different types of metal alloys, and in the main titanium alloys, nickel alloy as well as aluminum alloys. So this is a big, big enabler for the future growth.
Josh Sullivan^ Okay. Thank you.
Operator^ Your next question comes from the line of Charles Bradford from Bradford research. Your line is open. Please go ahead.
Charles Bradford^ Just a simple question on the insurance sales. Was there a profit, and do you expect to book a profit in the second quarter, when you finish up those sales? It may have been in your deck. I might have missed it.
William Oplinger^ There was no book — no accounting gain on those sales, Chuck. There is a lower tax basis, so we will have some tax expense associated with it, but no book gain.
Charles Bradford^ Thank you.
William Oplinger^ And Tony, to answer Tony Rizzuto, I was able to grab the numbers fairly quickly. Around 25% of that $185 million of upstream EBITDA is associated with energy sales. Now, that’s our energy business unit. So that would be inclusive of energy that we’re selling externally, and internally. So it would be inclusive of energy we sell at the Warrick facility, up in Canada, at our ownership there, and then also in Brazil.
Klaus Kleinfeld^ Next question, please.
Operator^ (Operator Instructions)
Your next question comes from the line of Justine Fisher from Goldman Sachs. Your line is open. Please go ahead.
Justine Fisher^ The first question I have is related to the pension liabilities. You had mentioned earlier in the presentation that there are liabilities associated with operating businesses, and then anything that’s curtailed goes with — can be left at the corporate level, I guess, as opposed to the segment level. Does that mean that those liabilities would potentially be offloaded to the PBGC, so if we are looking at potential standalone for the upstream business, we can exclude — I won’t quantify, but exclude some of the legacy liabilities that are on current Alcoa’s balance sheet?
William Oplinger^ No, we would not be looking at offloading any of the legacy liabilities to the PBGC. The legacy liabilities will be split between the two companies. That’s part of the activity that we’re going through now. And clearly, when we sit down with the PBGC, they have an interest in how those get split, and the creditworthiness of the two companies. So that’s part of the exercise, but none get offloaded per se.
Justine Fisher^ Okay. Could you reduce or reschedule any of the cash payments related to those liabilities, that might saddle the upstream Company?
William Oplinger^ We are making the minimum ERISA payments today on those liabilities. And so, we’re currently on a GAAP basis, around 74% funded. On an ERISA basis, I believe it’s in the lower 90s. But there would not be any further reduction of payments that we could make, that we’re making, less than we’re making currently.
Justine Fisher^ Just one last question. In this timetable on steps to completion in the presentation, it mentions complete financing in the second half of 2016. What financing is that? I mean, if the debt can move downstream and you guys haven’t announced anything, but if hypothetically it did, it seems to me there wouldn’t necessarily need to be any new financing. Can you talk about what that refers to?
William Oplinger^ Sure. We would be looking, the debt ultimately will be attributed to the upstream and the downstream. In order to do that, we will go out and without getting into too much detail around the orientation of the separation, we will go out into the market, raise debt on one of the two entities, and then pay off debt at the other entity. And so that’s what the financing would be.
Justine Fisher^ Okay. Thanks very much.
Operator^ At this time, this is all the time we have, and I’d like to turn the call back to Mr. Klaus Kleinfeld.
Klaus Kleinfeld^ Very good. So you have seen this quarter, our profits were up in every Arconic segment. Alumina, aluminum segment, both profitable in a very low pricing environment. We are laser beam focused on the things that we can control, productivity, high productivity, we showed you this, winning major contracts, monetizing non-essential assets. You should expect our focus continues there.
Looking ahead, we are on track to meet our three-year targets in all businesses except EPS, and I hope I gave you also the clear adjusted expectations to better reflect what is going on in aerospace, as well as the lower Firth Rixson performance, and the better RTI performance that shows you our new expectations for EPS, and those ones, and the other thing here is separation is on track. So stay tuned.
We will obviously have many more opportunities coming up here to talk. Thank you very much for joining us for this call. Thank you.
Operator^ This concludes today’s conference call. You may now disconnect.
 [Alcoa logo] [Alcoa logo] 1 April 11, 2016 1 st Quarter Earnings Conference [Alcoa logo] Exhibit 99.2 |
 [Alcoa logo] Important Information 2 Forward–Looking Statements This presentation contains statements that relate to future events and expectations and as such constitute forward-looking statements
within the meaning of the Private Securities Litigation Reform
Act of 1995. Forward-looking statements include those containing such words as “anticipates,” “believes,” “could,” “estimates,” “expects,” “forecasts,” “goal,”
“intends,” “may,” “outlook,”
“plans,” “projects,” “seeks,” “sees,” “should,” “targets,” “will,” “would,” or other words of similar meaning.
All statements that reflect Alcoa’s expectations, assumptions
or projections about the future, other than statements of
historical fact, are forward-looking statements, including, without limitation, forecasts concerning global demand growth for aluminum, supply/demand balances, and growth of the aerospace, automotive, and other end markets; statements regarding targeted financial
results or operating performance; statements about Alcoa’s
strategies, outlook, business and financial prospects; and statements regarding the separation transaction, including the future performance of Value-Add Company and Upstream Company if the separation is completed, the expected benefits of the separation, and the expected
timing of
the Form 10 filing and the completion of the
separation. Forward-looking statements are not guarantees of future
performance and are subject to risks, uncertainties, and changes in circumstances that are difficult to predict. Although Alcoa believes that the expectations reflected in any forward-looking statements are based on reasonable assumptions, it can
give no assurance that these expectations will be attained and it
is possible that actual results may differ materially from those indicated by these forward-looking statements due to a variety of risks and uncertainties. Such risks and uncertainties include, but are not limited to: (a) uncertainties as to the timing of the separation and whether it will be completed; (b)
the possibility that various closing conditions for the
separation may not be satisfied; (c) failure of the separation to qualify for
the expected tax treatment; (d) the possibility that any
third-party consents required in connection with the
separation will not be received; (e) the impact of the separation on the
businesses of Alcoa; (f) the risk that the businesses will not be separated successfully or such separation may be more difficult, time-consuming or costly than expected, which could result in additional demands on Alcoa’s resources, systems,
procedures and controls, disruption of its ongoing business and
diversion of management’s attention from other business concerns; (g) material adverse changes in aluminum industry conditions, including global supply and demand conditions and fluctuations in London Metal Exchange-based prices and premiums, as applicable, for primary aluminum, alumina, and other products,
and fluctuations in indexed-based and spot prices for
alumina;; (h) deterioration in global economic and financial market conditions generally; (i) unfavorable changes in the markets served by Alcoa; (j) the impact of changes in foreign currency exchange rates on costs and results; (k) increases in energy costs; (l) the inability to achieve the level of revenue growth,
cash generation, cost savings, improvement in profitability and
margins, fiscal discipline, or strengthening of competitiveness and operations (including executing on the business improvement plans, moving the Upstream alumina and aluminum businesses down on the industry cost curves, and increasing revenues and improving margins in the Value-Add
businesses) anticipated from restructuring programs and
productivity improvement, cash sustainability, technology
advancements (including, without limitation, advanced aluminum alloys, Alcoa Micromill, and other materials and processes), and other initiatives; (m) Alcoa’s inability to realize expected benefits, in each case as planned and by targeted
completion dates, from acquisitions, divestitures, facility
closures, curtailments, or expansions, or international joint
ventures; (n) political, economic, and regulatory risks in the countries in which Alcoa operates or sells products; (o) the outcome of contingencies, including legal proceedings, government or regulatory investigations, and environmental remediation; (p) the impact of
cyber attacks and potential information technology or data
security breaches; (q) the potential failure to retain key employees while the separation transaction is pending or after it is completed; (r) the risk that increased debt levels, deterioration in debt protection metrics, contraction in liquidity, or other factors could adversely affect the targeted credit ratings
for Value-Add Company or Upstream Company; and (s) the other
risk factors discussed in Alcoa’s Form 10-K for the year ended December 31, 2015, and other reports filed with the U.S. Securities and Exchange Commission (SEC). Alcoa disclaims
any obligation to update publicly any forward-looking statements, whether
in response to new information, future events or otherwise, except as required by applicable law. Market projections are subject to the risks discussed above and other risks in the market.
[Alcoa logo] |
 [Alcoa logo] Important Information (continued) 3 Non-GAAP Financial Measures Some of the information included in this presentation is derived from Alcoa’s consolidated financial information but is not
presented in Alcoa’s financial statements prepared in
accordance with accounting principles generally accepted in the United States of America (GAAP). Certain of these data are considered “non-GAAP financial measures” under SEC rules. These non-GAAP financial measures supplement our GAAP disclosures and should not be considered
an alternative to the GAAP measure. Reconciliations to the
most directly comparable GAAP financial measures and management’s rationale for the use of the non-GAAP financial measures can be found in the Appendix to this presentation. Alcoa has not provided a reconciliation of any forward-looking non-GAAP financial measures to the most directly comparable GAAP financial measures, due primarily to variability and difficulty in making accurate forecasts and projections, as not all of the
information necessary for a quantitative reconciliation is
available to Alcoa without unreasonable effort. Any reference to historical EBITDA means adjusted EBITDA, for which we have provided calculations and reconciliations in the Appendix. |
 [Alcoa logo] [Alcoa logo] Klaus Kleinfeld Chairman and Chief Executive Officer 4 April 11, 2016 [Alcoa logo] |
 [Alcoa logo] Separation on Track 1Q 2016 Overview 5 Delivering Solid Performance, Strong Productivity – Separation on Track Arconic Segments (Value-Add) Revenue $3.3B down 2.2% YoY: 6.7% revenue
increase predominantly related to acquisitions, offset by 8.3%
decline from metal and foreign exchange and 0.6% revenue decline from divested or closed operations ATOI of $269M, up 8% YoY, adj. EBITDA $537M, up 7% YoY, Record adjusted EBITDA margin 16.4% Global Rolled Products: $68m ATOI, up 26% YoY and adjusted EBITDA per metric ton $374, up 8% YoY due to strong cost control; automotive sheet shipment growth up 38% YoY Engineered Products and Solutions: Record Q1 Revenue of $1.4B; Record 1Q ATOI of $162M, up 4% YoY Transportation and Construction Solutions: $39M ATOI, up 3% YoY, Record 1Q adjusted EBITDA margin of 14.9% Supply Agreement for 3D-printed titanium fuselage and engine pylon parts to Airbus Multi-year ~$1B contract for advanced Industrial Gas Turbine (IGT) components, Alcoa’s largest IGT contract to date Agreement to sell RTI Remmele Medical business for $102m
Achieved $179 million in Productivity savings, on target to deliver $650 million in 2016 Global Rolled Products, Transportation and Construction Solutions on track to meet three-year 2016 targets; New goals set for EPS to better reflect aerospace market conditions and Firth Rixson performance
New Alcoa Segments (Upstream) 3 rd Party Revenue of $1.7B down 32.2% YoY: 4.5% revenue increase from organic growth more than offset by 26.1% revenue decline due to lower pricing and foreign exchange impacts and 10.6% revenue decline predominantly related to
curtailed or closed operations
Total Revenue of $2.1B, ATOI of $22 million, and adj. EBITDA of $185M
Profitable Alumina and Primary Metals segments despite 19% price decline in API, and flat aluminum pricing, sequentially; YoY declines of 40% and 26%, respectively
Signed new Third-Party Bauxite Contracts valued at over $350
million over the next two years Ma’aden-Alcoa joint venture
refinery continued to ramp-up, now at 80% of nameplate capacity
Pt. Comfort, Texas refinery on track to be
fully curtailed by end of second quarter; closed Warrick smelter in Indiana Achieved $175 million in productivity
savings, on target to deliver $550 million in 2016 Sold stake in Dampier to Bunbury Natural Gas Pipeline in Western
Australia (WA) for $154m.
Gas supply secured for three WA alumina
refineries On
track to meet 2016 Cost Curve Goals: 21 st percentile in Alumina and 38 th percentile in Primary Metals Launched New Value-Add
Brand “Arconic”
& Refreshed New Alcoa
Brand Form 10
to be filed in first half 2016 See appendix for EBITDA reconciliations and adjusted EBITDA margin of 21.0%; Aerospace sales up 14%YoY |
 [Alcoa logo] William Oplinger Executive Vice President and Chief Financial Officer 6 April 11, 2016 |
 [Alcoa logo] Income Statement Summary $ Millions, except aluminum prices and per-share amounts 1Q15 4Q15 1Q16 Prior Year Change Sequential Change Realized Aluminum Price ($/MT) $2,420 $1,799 $1,793 ($627) ($6) Revenue $5,819 $5,245 $4,947 ($872) ($298) Cost of Goods Sold $4,443 $4,404 $4,041 ($402) ($363) COGS % Revenue 76.4% 84.0% 81.7% 5.3 % pts. (2.3 % pts.) Selling, General Administrative, Other $232 $262 $260 $28 ($2) SGA % Revenue 4.0% 5.0% 5.3% 1.3 % pts. 0.3 % pts. Other (Income) Expenses, Net ($12) $29 $34 $46 $5 Restructuring and Other Charges $177 $735 $93 ($84) ($642) Effective Tax Rate 47.0% (6.1%) 73.2% 26.2 % pts. 79.3 % pts. EBITDA $1,089 $519 $603 ($486) $84 Net Income (Loss) $195 ($701) $16 ($179) $717 Net Income (Loss) per Diluted Share $0.14 ($0.55) $0.00 ($0.14) $0.55 Income excl. Special Items $363 $65 $108 ($255) $43 Income per Diluted Share excl. Special Items $0.28 $0.04 $0.07 ($0.21) $0.03 See appendix for EBITDA and Adjusted Income reconciliations 7 |
 [Alcoa logo] Special Items See appendix for Adjusted Income reconciliation
$ Millions, except per-share amounts
1Q15 4Q15 1Q16 Income Statement Classification Segment Net Income (Loss) $195 ($701) $16 Net Income (Loss) per Diluted Share $0.14 ($0.55) $0.00 Restructuring-Related ($158) ($287) ($63) Restructuring and Other Charges/COGS Corporate/All Tax Items ($4) ($189) ($12) Income Taxes Corporate Portfolio Transaction Costs ($7) ($12) ($17) SG&A Corporate Mark-to-Market Energy Contracts $1 ($5) - Other Expenses, Net Corporate Italian Energy Matter - ($201) - Restructuring and Other Charges Corporate Q4’15 Overhead Reduction Program - ($47) - Restructuring and Other Charges/COGS Corporate Goodwill Impairment - ($25) - Impairment of Goodwill Corporate Special Items ($168) ($766) ($92) Net Income excl. Special Items $363 $65 $108 Net Income per Diluted Share excl. Special Items $0.28 $0.04 $0.07 8 |
 [Alcoa logo] Net Income excluding Special Items ($ Millions) Adjusted Earnings Down on Lower LME, API and Regional Premiums Market -$366 Performance +$208 Cost Headwinds -$97 Note: Metal Price = LME + Regional Premium; Regional Premium previously reported in Price/Mix category
See appendix for Adjusted Income reconciliation
$108 $363 -$32 Volume $8 Currency $4 API -$87 Metal Price -$283 1Q 15 -$9 Productivity Price / Mix $232 -$8 1Q 16 Raw Materials Cost Increases / Other -$80 Energy 9 |
 [Alcoa logo] 1Q 15 1 4Q 15 1Q 16 3 rd Party Revenue ($ Millions) 1,621 1,422 1,397 3 rd Party Conversion Revenue ($ Millions) 757 732 737 ATOI ($ Millions) 54 52 68 EBITDA/MT ($) 347 312 374 1Q16 Actual and 2Q16 Outlook – Global Rolled Products GRP: Productivity and Auto Uplift Offset Headwinds EBITDA/MT up 12% YoY excluding impact to secure alternative metal supply
at Warrick
Auto sheet shipments up 38% year-over-year Volume and pricing pressure from packaging,
Lower demand from Aero
due to inventory overhang and significantly
reduced N.A. heavy duty truck build rates Continued investments of $5M in Growth projects including Micromill
TM R&D, Saudi JV and throughput/capacity increases
at key plants Strong productivity
more than offset cost increases
Auto sheet shipments expected to
be up ~35% as Tennessee Auto
ramp-up accelerates Continued pricing pressure from packaging Lower demand from
Aero due to new model transition and
reduced N.A. heavy duty truck build rates expected to continue ATOI is expected to be up 5-7% excluding $15M impact to secure alternative metal supply at Warrick, and current currency rates
2 nd Quarter Year-over-Year Outlook 1 st Quarter Business Highlights 1 st Quarter ATOI Results $ Millions 1 st Quarter ATOI Performance Bridge -$6 -$2 -$2 -$4 -$5 -$2 1Q16 Warrick Cold Metal Plan (CMP) Cost Incr./ Other Prod- uctivity Price / Mix Volume Currency 1Q15 Growth Projects 1. 1Q15 amounts have been revised to remove impact of metal price lag 2. EBITDA/MT include impact from Warrick metal
supply. Without that impact, EBITDA/MT is $390. See appendix for additional information
and EBITDA reconciliation. 10
$68 $35 $54 2 |
 [Alcoa logo] 1Q 15 4Q 15 1Q 16 3 Party Revenue ($ Millions) 1,257 1,409 1,449 ATOI ($ Millions) 156 123 162 EBITDA Margin 22.4% 17.3% 21.0% 1 Quarter ATOI Performance Bridge 1Q16 Actual and 2Q16 Outlook – Engineered Products and Solutions Aerospace market remains strong despite slower ramp up of next generation platforms due to simultaneous launches of new
technologies and
inventory overhangs at OEMs Oil & Gas, European Industrial Gas Turbine, North America Commercial Transportation markets increasingly softer
Pricing pressure across all markets, except
IGT Share gains through innovation
and productivity continue
ATOI is expected to be up 5% to 10%
year-over
-year
1 Quarter ATOI Results 1 Quarter Business Highlights Price / Mix -$30 1Q16 Growth Projects Volume Currency -$15 ATEP Cost Increases -$39 Productivity 1Q15 EPS: Strong Productivity and Benefits From Acquisitions Revenue growth of 15% year-over-year driven by acquisitions,
partially offset by pricing pressure, inventory
overhang in Aero
OEMs, and softening
markets Alcoa Titanium and Engineered Products (ATEP) ATOI of +$17M; EBITDA margin at 18.7%, above 1Q’15 of 14.1%
Year-over-year improvement driven by productivity and
ATEP 1
1Q15 amounts have been revised to remove impact of metal price lag; see appendix for
additional information & EBITDA reconciliation.
2 ATEP: created from RTI acquisition. 3 EBITDA margin excludes impact of $4.7 million of transaction costs 11 2 3 1 rd st st st nd 3 2 Quarter Year-over-Year Outlook $66 $6 $1 $162 $156 $17 $ Millions |
 [Alcoa logo] $ Millions 1Q 15 4Q 15 1Q 16 3 Party Revenue ($ Millions) 471 444 429 ATOI ($ Millions) 38 40 39 EBITDA Margin 13.4% 14.6% 14.9% 2 Quarter Year-over-Year Outlook 1 Quarter ATOI Performance Bridge 1Q16 Actual and 2Q16 Outlook – Transportation and Construction Solutions TCS: Strong Productivity Offsets Market Headwinds Improving N.A. Non-Residential Construction with sustained levels in
Europe N.A. Heavy Duty Truck build rates continue to decline, slightly offset
by improvement in Europe
Brazil’s current economic environment continues to negatively impact business results Robust productivity gains
throughout the business ATOI
is expected to be flat year-over-year at current currencies Revenue down 9% year-over-year; attributable to
N.A. Heavy Duty Truck
and relatively weak Brazilian
markets Record Q1 EBITDA margin of 14.9%
N.A. Non-Residential Construction remains solid; softness continues in Europe N.A. Heavy Duty Truck build rates continue to decline; Europe continues to improve; bright spots in Asia Pacific Strong Productivity actions offset cost increases and revenue decline
1 Quarter ATOI Results 1 Quarter Business Highlights 1. 1Q15 amounts have been revised to remove impact of metal price lag See appendix for additional information and EBITDA reconciliation. $19 $0 $39 $38 1Q16 Productivity -$11 Price / Mix Cost Increases Volume -$6 Currency -$1 1Q15 12 st st st nd rd 1 |
 [Alcoa logo] Alumina: Pricing Headwinds Continue to Impact Earnings 1Q16 Actual and 2Q16 Outlook – Alumina API pricing down 19% sequentially, 40% year over year Announced curtailments drive
production down ~530
KMT Continued
productivity gains through strong cost control
Saudi Arabia refinery continues to
ramp-up,
now at 80% of name plate capacity
Production expected to be flat sequentially
~85% of 3 party shipments on API or spot pricing for 2016 API pricing follows 30-day
lag; LME pricing
follows 60-day lag Continue
expanding 3 party bauxite sales
and benefit from accelerated productivity program ATOI to be up $15M excluding pricing
and currency impacts 1Q 15
4Q 15 1Q 16 Production (kmt) 3,933 3,856 3,330 3 Party Shipments (kmt) 2,538 2,713 2,168 3 Party Revenue ($ Millions) 887 732 545 3 Party Price ($/MT) 344 267 249 ATOI ($ Millions) 221 98 8 1 Quarter ATOI Results 1 Quarter Business Highlights 2 Quarter Sequential Outlook $ Millions 1 Quarter ATOI Performance Bridge Cost Increases / Other $14 Energy Price / Mix -$8 Currency $1 $8 Volume -$6 API -$93 Prod- uctivity $0 LME 1Q16 $8 -$6 4Q15 $98 13 st st st rd rd rd rd rd nd |
 [Alcoa logo] Primary Metals: Profitable Despite Difficult Pricing Environment $ Millions 1Q16 Actual and 2Q16 Outlook – Primary Metals -$9 -$1 -$2 $14 -$40 $1 $2 1Q16 Cost Incr. / Other Energy Currency API $25 Metal prices $11 4Q15 Price /Mix $27 Prod- uctivity Volume Realized price flat sequentially Announcement and execution of Warrick closure Lower alumina, raw materials, and productivity drive positive
ATOI for the quarter
Energy sales continue to decline, offset by seasonal
low prices in Spain
Announced curtailments drive production down ~50
KMT Pricing to follow a
15-day lag to LME
Lower prices for energy sales in Brazil and U.S. hit ATOI by $18M Accelerated productivity program and raw material pricing
more than offset energy headwinds ATOI to be up $10M excluding impact of pricing and currency
1Q 15 4Q 15 1Q 16 Production (kmt) 711 699 655 3 Party Shipments (kmt) 589 644 575 3 Party Revenue ($ Millions) 1,572 1,236 1,123 3 Party Price ($/MT) 2,420 1,799 1,793 ATOI ($ Millions) 187 (40) 14 1 Quarter ATOI Results 1 Quarter Business Highlights 1 Quarter ATOI Performance Bridge 2 Quarter Sequential Outlook 1 Metal Price = LME + Regional Premium; Regional Premium previously reported in Price/Mix category
14 rd rd rd st st st nd 1 |
 [Alcoa logo] 2 days lower Base Business DWC +4 days Year-over-Year, Acquisitions Add 10 days Average Days Working Capital since First Quarter 2011 6 days lower See appendix for days working capital reconciliation 2 days lower 14 days higher Acquisitions (10 days) Alcoa ex-Acquisitions (37 days) 37 4 days higher YoY from organic business 3 days higher 33 15 47 43 40 34 33 28 32 33 30 28 31 29 32 30 36 35 34 36 40 40 40 |
 [Alcoa logo] ($ Millions) 1Q15 4Q15 1Q16 Net Income (Loss) before Noncontrolling Interests $255 ($765) $11 Depreciation, Depletion and Amortization $321 $321 $309 Change in Working Capital ($595) $571 ($469) Pension Expense in Excess of Contributions $37 $13 $13 Other Adjustments ($193) $725 ($294) Cash from Operations ($175) $865 ($430) Dividends to Shareholders ($54) ($74) ($57) Change in Debt $24 ($122) - Net (Distributions)/Contributions from Noncontrolling Interests ($29) ($32) ($50) Other Financing Activities $33 ($2) - Cash from Financing Activities ($26) ($230) ($107) Capital Expenditures ($247) ($398) ($251) Acquisitions/Divestitures/Asset Sales ($212) - $222 Other Investing Activities ($6) ($59) $28 Cash from Investing Activities ($465) ($457) ($1) Free Cash Flow ($422) $467 ($681) Cash on Hand $1,191 $1,919 $1,384 Seasonal Working Capital Increase Drives FCF to ($681) Million 1Q15, 4Q15 and 1Q16 Cash Flow See appendix for Free Cash Flow reconciliation 16 |
 [Alcoa logo] 1Q16 Asset Sale Announcements Over $700 Million to be Generated by Announced Asset Sales DBNG Pipeline Remmele Company Owned Life Insurance Sell all of Alcoa of Australia’s 20% minority interest in the Australia Dampier to Bunbury Natural
Gas Pipeline
Western Australia’s principal gas transmission pipeline
and is the only pipeline connecting the gas reserves in the north to Perth customers ~$150M Cash Proceeds ~$100M ~$500M Q2 2016 A $70M contract manufacturer of medical devices,
including minimally invasive surgical tools, spinal,
drug infusion and dental implants, vascular
components, and urology instruments
Acquired in 2015 as part of RTI
transaction Q2 2016 Q1 & Q2 2016 Redemption of company-owned life insurance A portion sold in 1Q ($234M), with a second portion in 2Q Total Cash Proceeds ~$750M Closing 1 Alcoa of Australia is owned 60% by Alcoa Inc. and 40% by Alumina Limited. 1 Represents full year 2015 Pro forma revenue 17 1 2 |
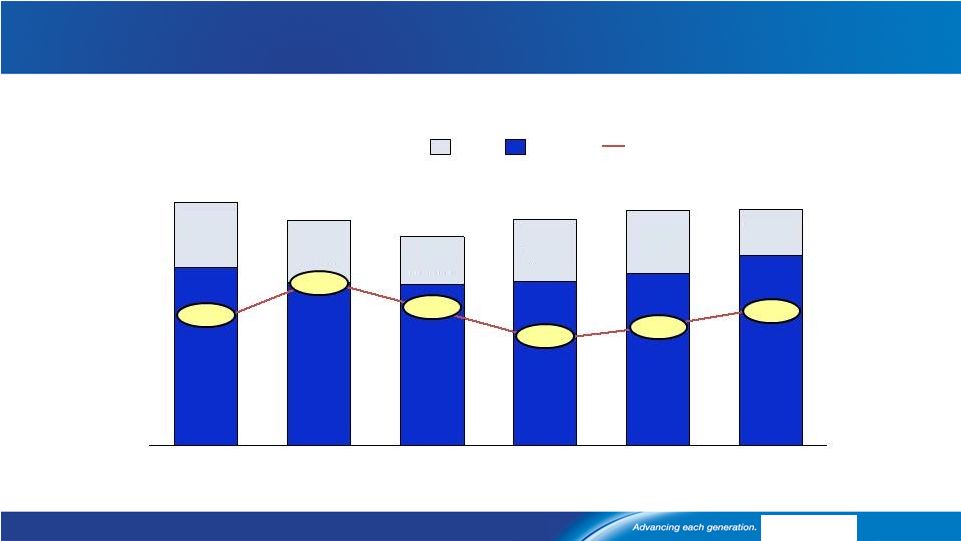 [Alcoa logo] 1Q16 9,069 7,685 2015 9,052 7,133 2014 8,787 6,910 2013 8,246 6,809 2012 8,744 6,883 2011 9,273 7,334 ($ Millions) Net Debt Cash Debt-to-LTM EBITDA 2.47 2.84 4.16 LTM = last twelve months; See appendix for Net Debt and LTM EBITDA reconciliations. Note: Debt amounts for 2011 – 2015 have been updated to reflect the adoption of FASB guidance (effective January 1, 2016) requiring presentation of debt issuance costs as a reduction to debt rather than as a
noncurrent asset. Debt, Net Debt, and Debt-to-LTM
EBITDA Cash on hand at $1.4 Billion
2.79 3.24 3.28 18 1,939 1,861 1,437 1,877 1,919 1,384 |
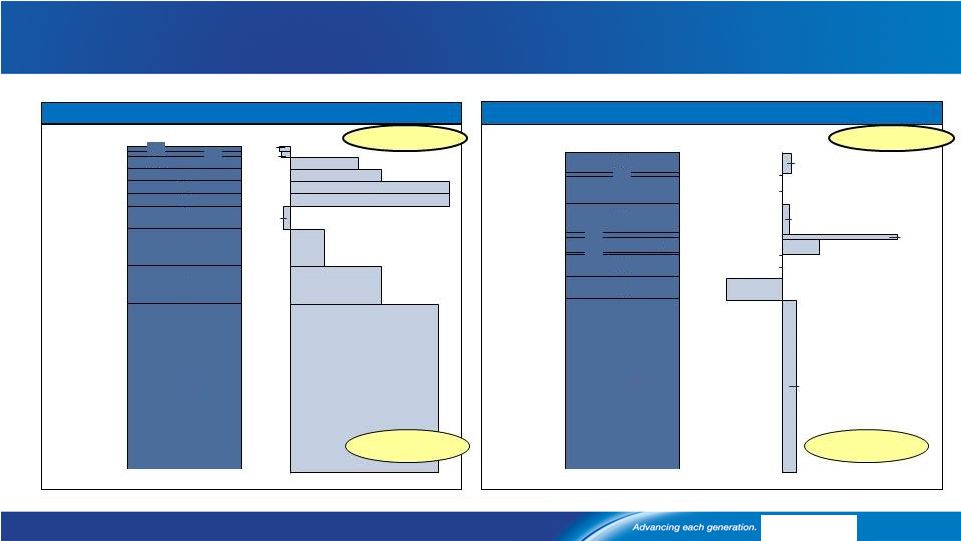 [Alcoa logo] China 1.0 0.9 China 0.4 0.9 0.8 6.5% 4.0% 1.5% -0.3% 7.0% 7.0% 4.0% 3.0% -0.4% -0.5% 2016 Aluminum Demand growth at 5% while supply only grows at 2% Primary aluminum demand and supply by region 2016 Primary Aluminum Demand & YoY Growth (Mt) 2016 Primary Aluminum Supply & YoY Growth (Mt) -12.0% 1.5% 3.0% 2.0% 0.0% 25.0% 0.0% 8.0% 0.0% 0.0% 59.7 Mt 58.7 Mt Russia Brazil Other 1 MENA SE Asia India North Asia Europe North America Russia Brazil Other 1 MENA SE Asia India North Asia Europe North America ROW +3% China +6.5% Global +5% Global +2% ROW +1.5% China +3% Source: Alcoa analysis, CRU, Wood Mackenzie, IAI, CNIA, NBS, Aladdiny; figures rounded;
1 Other includes Africa, E. Europe, Latin America ex Brazil, Oceania, Other Asia 19 30.8 7.0 6.8 4.2 2.4 2.3 2.2 2.2 31.7 4.0 4.0 2.7 5.6 4.9 3.7 |
 [Alcoa logo] Aluminum Deficit Continues; Projected at 1.1Mmt Source: Alcoa analysis, CRU, Wood Mackenzie, IAI, CNIA, NBS, Aladdiny, Bloomberg
Aluminum fundamentals overview
Premiums have started to stabilize ($/t)
220 200 180 160 140 120 100 80 03/31/16 150 01/01/16 10/01/15 USA Japan Europe (Duty Paid) Changes since Oct./Nov. Lows +$30 +$25 Global Inventories at 59 days; -5 days YoY Continue to see global deficit in 2016 2016E Aluminum Balance (kmt) China Rest of World Surplus 930 Deficit (1,980) Prod. at Beginning Run Rate Prod. to be Added/Restarted Prod. to be Closed/Curtailed Total Supply Demand Net Balance +$19 Global Inventories down 45% from 2009 Peak of 108 days 20 $1,200 $1,700 $2,200 $2,700 $3,200 0 7 14 21 28 35 42 49 56 63 70 77 84 91 98 105 Financed Stocks China Incl SRB Producer Japan Port LME Cash 176 115 China 30,700 3,400 (2,390) 31,710 (30,780) 930 Rest of World 26,620 760 (410) 26,970 (28,950) (1,980) |
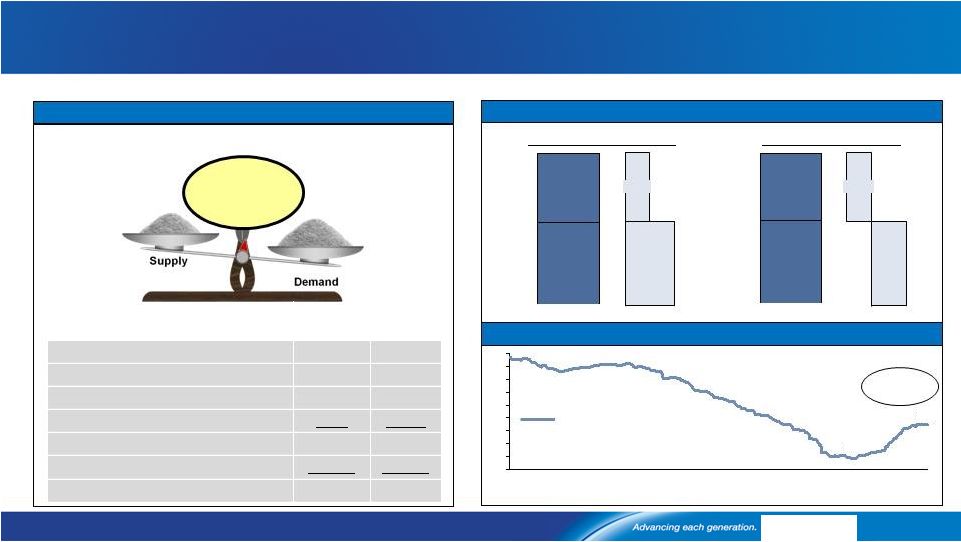 [Alcoa logo] 280 300 320 340 360 240 260 200 180 220 Mar 2016 Jan 2016 Jul 2015 Jan 2015 Alumina Deficit at 1.4Mmt; Refining Curtailments Support Price Source: Alcoa analysis, CRU, Wood Mackenzie, IAI, CNIA, NBS, Aladdiny, Bloomberg
*Alumina price = FOB WA price
Alumina fundamentals overview
Demand growth at 4% while supply only grows at 1% in 2016
Price has started to recover ($/t)
Alumina Price* +$52 vs. Jan. Lows China Rest of World 2016 Prod. at Beginning Run Rate 57,500 56,740 2016 Prod. to be Added/Restarted 4,370 1,410 2016 Prod. to be Closed/Curtailed (3,790) (3,020) Imports/(Exports) – Full Year 4,360 (4,360) Total Supply 62,440 50,770 Demand (62,300) (52,330) Net Balance 140 (1,560) Continue to see large deficit for 2016 2016E Alumina Balance (kmt) ROW China 52.3 62.3 5.6% 2.7% 50.8 China 62.4 ROW -3.2% 4.5% Demand & YoY Growth (Mt) Supply & YoY Growth (Mt) 114.6 Mt 113.2 Mt 21 Deficit (1,420) 249 197 |
 [Alcoa logo] Klaus Kleinfeld Chairman and Chief Executive Officer 22 April 11, 2016 |
 [Alcoa logo] Aerospace Growth at Lower Pace; Continued Growth in Automotive End Market 2016 Growth Global and Regional Commentary Source: Alcoa analysis 1) International Air Transport Association 2016 Expectations 2) IHS (Jul 2015)
Alcoa End Markets: Current Assessment of 2016 vs. 2015
Aerospace 6% to 8% Global sales growth Automotive E.U. 1% to 4% China 2% to 5% N.A. 1% to 5% • Market Transition given unprecedented level of New Model Introductions • Lower Orders for Legacy models + Careful Ramp-Up of new models due to simultaneous launch of new technologies (body + engine) and supply chain changes
• Large Commercial Aircraft Deliveries +9% • Strong Commercial Jet Order Book of ~14,600 planes : >9 Years Production at 2015 delivery rates ; ~23,800 engines on firm order • Solid Airline Fundamentals 1 : -’16FC +6.9% Passenger
(’15:
+6.7%);
+2.8% Cargo (’15: 1.7%);
- Record Airline Profitability expected ($36B); - Global trend in tact: +Middle Class AND +Urbanization • Cancellations (2015 LCA) Below 5-Year Average and <2% of Gross Order Book • Production Up: +7.4%YTDFeb’16 (2.88M vehicles) • Strong Sales: U.S. sales +3.1%YTDMar ‘16; Light Truck penetration at 57.9% of market • Sustained demand:
Vehicles 12+ years old continue to grow and will increase 15% by 2020 2 • Stable Inventory: 65 days (industry target is 60-65 days) • Average transaction price up 2% (Mar’16 vs. Mar’15) driven by continued strength in Light Truck; ratio of incentives to transaction price
relatively flat • Rising Production: +1.9%YTDFeb ‘16, West up +4.3%YTD(89%
share) , offsets East, down -14.0%YTD (11% share) • Strong Registrations: +10.1%YTDFeb’16;
Exports to increase 6.9% in 2016 (+1.9% in
2015) •
Recovering Production:
+3.9%YTD Feb’16 and -1.2%YoY(Feb’16 vs. Feb’15) • Sales +4.1%YTDFeb’15 and -1.3%YoY (Feb’16 vs. Feb’15) driven by tax incentives and light truck demand • Growth propelled by increasing middle class, exports,
and evolving emissions policies 23 1% to 4% Global production growth |
 [Alcoa logo] HDT – N.A.: Further Decline, Strength in Europe; Packaging Stable End Market 2016 Growth Global and Regional Commentary Alcoa End Markets: Current Assessment of 2016 vs. 2015 Source: Alcoa analysis. HDT = Heavy Duty Truck. Packaging: 2016 Projections Packaging 1% to 3% Global sales growth N.A. -1% to 0% E.U. 1% to 2% China 5% to 8% • Demand decline: Weakness (-1% to -2%) in Carbonated
Soft Drinks (CSD) • Moderate growth in Beer Segment
(+1% to +2%) to partially offset CSD
• Growth led by modest growth (1% to 2%) in Western Europe,
partially offset by downward pressure in Eastern Europe
(primarily declines in Russia) •
Growth led by aluminum can penetration from glass in beer segment Heavy Duty Truck and Trailer N.A. -23% to -27% E.U. 1% to 5% China 1% to 4% • Declining Production: Down 19.0% YTD Feb’16 at 40.4k vs. 49.9k trucks • Weak Freight Growth: Freight tonmiles up 0.2% YTD Feb ’16 • Weak Orders: Down 42.0% YoY (Feb’16 vs. Feb‘15) • Climbing Inventory: Up 15.6% YoY (Feb’16 vs. Feb‘15) at 66.8k [10-year average 47.4k] • Falling Orderbook: At 131.0k, down 30.9% YoY (Feb’16 vs. Feb‘15), and down 1.9% month- over-month. This still remains above its 10-year historical avg. of
101k • Strength in WEU: Production up 20.0% YoY (Feb’16 vs. Feb’15) and up 20.9% YTD Feb ’16; • Registrations up 21.8% YTD Feb ’16, despite
Orders down 2.7% YTD Feb ’16 • Decline in EEU: Production down 8.6% YTD (Feb ‘16) from Russia and Turkey weakness • Strong Sales: Up 26.8% YoY (Feb’16 vs. Feb‘15) , and up 6.3% YTD Feb ’16 • Production Turning: Down 1.3% YoY (Feb’16 vs. Feb‘15) , and down 7.3% YTD Feb ’16 24 -4% to 0% Global production decline |
 [Alcoa logo] Commercial B&C and Global Airfoil Market Continue to Grow 25 End Market 2016 Growth Global and Regional Commentary Source: Alcoa analysis; B&C = Building and construction.
Alcoa End Markets: Current Assessment of 2016 vs. 2015
Industrial Gas Turbines 2% to 4% Global airfoil market growth • Market moving towards higher value-add product as customers develop new, high efficiency turbines with
advanced technology •
New heavy duty gas turbine units ordered +12% in 2015 (globally) • U.S. (60 Hz) gas-fired generation +18.5% in 2015 driving strong demand for
spares and component upgrades
on existing turbines •
2015 OECD electricity demand up 0.7% y/y but still 0.6% below 2008 levels
Building and Construction N.A. 4% to 6% E.U. 0% to -2% China 3% to 5% 4% to 6% Global sales growth • Non-Residential Contracts Awarded: +4.7% in Feb. (mean of 12-month rolling average)
• Architectural Billings Index Relatively Steady: In 2015, it averaged 51.6, with only Aug.’15 registering below 50 at 48.8. In Feb.’16 it was 50.3, up from 49.6 in Jan.’16
• Housing Starts up +10.6% in 2015 (vs. 2014); starts grew +5.2% in Feb’16 (vs. Jan 16) • Flat to slight decline as E.U.
economies continue to stabilize, outlook varies by country • Continued moderation of growth in
2016 from 5% in 2015 and 8% in 2014 |
 [Alcoa logo] Future Arconic: GRP and TCS on 3-Year Target; EPS New 2016 Goal 26 1Q16 Arconic Performance and 2016 Goals GRP TCS EPS 3 rd Party Revenue 2 ($B) EBITDA (%, $/MT) 1Q 2016
Highlights •
Revenue $1,397M; auto shipments up 38% • Strong productivity; $374 1 EBITDA/MT • Portfolio: Strength in auto Improving Mix
• Revenue at $429M • Strong productivity; Record 1 st quarter EBITDA Margin 14.9% • Portfolio: BCS improving; LA extrusions weak 2Q 2016 Outlook • ATOI up 5-7% YoY
excluding $15M impact to secure
alternative metal supply at Warrick
• ATOI flat
YoY • ATOI up 5-10% YoY
2016 Goal • Record 1 st quarter revenue $1,449M • Strong productivity; EBITDA Margin
21.0% • Portfolio: ATEP ahead; FR progressing 1) EBITDA/MT includes impact from Warrick cold metal program. Without that impact, EBITDA/MT is $390 2) 3-Yr Target Revenue
adjusted for FX/LME: GRP $(0.9)M; TCS $(0.2)M 3) Does not
include impact of announced sale of Remmele Medical Business 4) Excludes Warrick CMP impact. See appendix for EBITDA reconciliations 6.0-6.2 7.2 2.1 2.0-2.2 6.0-6.2 6.1 ~23% ~15% $344/MT 4 $344/MT ~15% 3-Yr Target 2016 Goal 3-Yr Target 2016 Goal 3-Yr Target 2016 Goal 3 21-22% |
 $5.3B $1.3B 3 Year Target $4.7B $4.0B 2015 $2.5B $7.2B New Target $4.1B to $4.2B $1.9B to $2.0B $6.0B to $6.2B EPS 2016 Goal: $6.0-6.2B Revenue, 21%-22% EBITDA Margin 2016 EPS Revenue ($B) and EBITDA (%) Overview FX Aero Industry Headwinds Non-Aero Headwinds Firth Rixson
Share Gains (~ -$0.2B) (~ -$0.5B) (~ -$0.2B) (~ -$0.3B) (~ +$0.2B) 2016 2015 $161M $1,110M $949M $1,000M 2016 $1,260M to $1,360M $260M to $360M Productivity Cost Increases Competitive Pricing Share Gain and Market Full Year of RTI (ATEP) (~ +$400M) (~ -$280M) (~ -$100M) (~ +$60M) New Revenue Target of $6.0B to $6.2B New EBITDA Target of 21% to 22% 21.0% - 22.0% EBITDA margin 20.8% EBITDA margin Inorganic Organic ~23% EBITDA margin 1. Does not include impact of announced sale of Remmele Medical Business See appendix for EBITDA reconciliations (~ +$110M) 27 [Alcoa logo] 1 1 |
 Productivity o Operational Improvement o Accelerated Capture of Synergies Markets & Share Gains o Aerospace Market o Oil & Gas, Off-Highway Lower o Exiting Unprofitable Products o Entering New Engine Platforms o Optimizing Available Capacity Cost Increases o Production Ramp-up o Qualification Costs o Labor Costs Competitive Pricing o Legacy Contracts Firth Rixson: Improvement Underway; 2016 EBITDA Margin 14%-16% 2015-2016 EPS Firth Rixson Revenue ($B) and EBITDA ($M,%) Overview Q1 ’16 Actuals: $237M Revenue; 14.3% EBITDA Q1 ’15 Actuals: $232M Revenue; 11.6% EBITDA 2015 Actual $136M $0.9B $1.0 to $1.1B New 2016 Goal $150M to $170M 14.5% EBITDA margin 14.0% - 16.0% EBITDA margin (~ +$55M) (~ -$8M) (~ -$40M) (~ +$20M) Revenue EBITDA 28 [Alcoa logo] |
 1) ATEP
(RTI) pre-acquisition results exclude deal-related costs 2) Does not include impact of announced sale of Remmele Medical Business; Post the sale ATEP EBITDA margin target unchanged; revenue target range reduction dependent on timing (annual sales of $70 million). See appendix for EBITDA
reconciliations $794M
$810M – $830M $135M – $160M 2014 Actual 14.5% EBITDA margin 1Q 2015 Actual 1Q 2016 Actual 2016 Target 14.1% EBITDA margin 1 18.7% EBITDA margin ~17.0% - 19.0% EBITDA margin Pre-Acquisition: EBITDA Margin of ~14% 2014-2016 EPS ATEP Revenue ($M) and EBITDA ($M,%) Overview ATEP Ahead of Integration Plan, Delivering 17-19% EBITDA Margin in 2016 Accelerated Capture of Synergies is 1 year ahead Share Gains Ti Aluminide for engine programs Ti Mill Products for JSF B787 PiBox 3D Printing for Airbus $38M vs. $7.8M gross synergies target achieved to date Revenue EBITDA Revenue EBITDA Post-Acquisition: EBITDA Margin of 17%-19% 29 [Alcoa logo] $38M $203M $28M $198M $115M 2 |
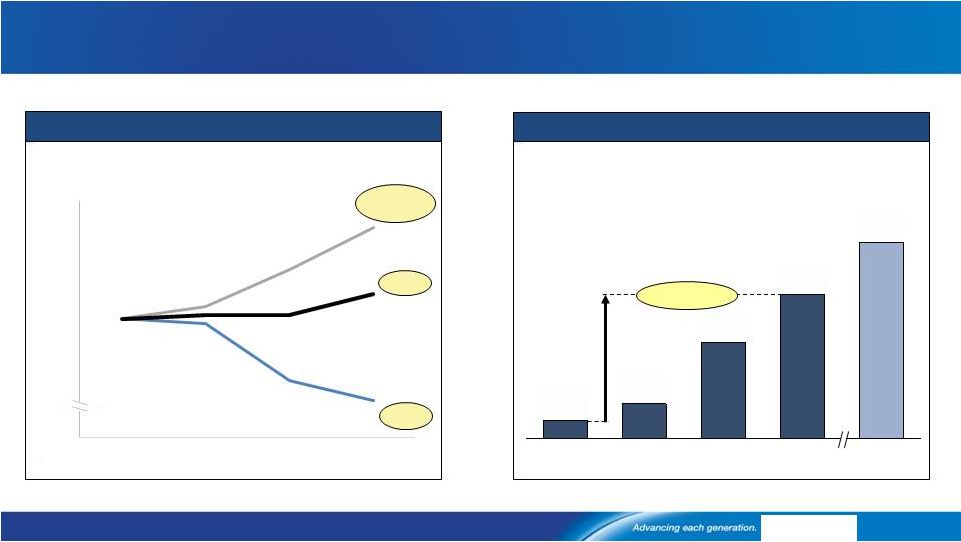 [Alcoa logo] GRP Shifting to Higher Margin Led by Automotive Growth Source: Alcoa Automotive Marketing See appendix for EBITDA reconciliations GRP Profitability and Auto Growth 133% 162% Aero, Transportation & Industrial Packaging GRP +62% -55% EBITDA/MT Indexed % change Shifting to a Higher Margin Product Mix GRP Growing Auto Revenue 2013 2011 2018P 2016E 2015 52% CAGR +17% GRP Automotive Sheet Revenue $M +2% +3% 0 30 60 100 140 180 2011 2013 2015 1Q'16 $1,300 $956 $634 $229 $117 |
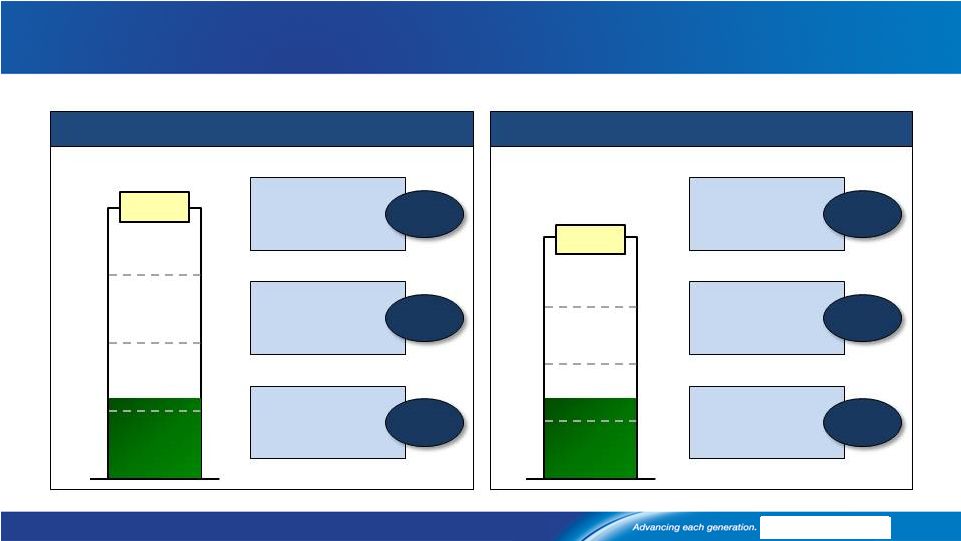 [Alcoa logo] Productivity Programs Achieved $364M1 of $1,200M Target through Q1’16 31 Alcoa Gross Productivity Program Q12016 Future Arconic Achieved $179M of $650M Target Future New Alcoa Achieved $175M of $550M Target Business Programs Procurement Overhead Business Programs Procurement Overhead $98M $70M $11M $27M $142M $6M 2016 Productivity $ Millions 2016 Productivity $ Millions 1) Productivity: Future Arconic = $179M; Future New Alcoa = $175M; Corporate = $10M
$179M $175M $650M $550M |
 [Alcoa logo] 500 0 10 20 30 40 60 50 0 1,000 3,000 2,500 2,000 1,500 40 100 20 60 80 0 120 400 500 100 0 300 200 New Alcoa: Driving Down Cost Curve in 2016, Meeting 3-Year Targets 32 1Q16 New Alcoa Highlights and 2016 Targets Alumina: 21 Percentile 1Q 2016 Highlights 2016 Targets $/MT Reshaping portfolio: Warrick smelter closed March
24 First full quarter with Wenatchee curtailed Saudi Arabia smelter Q1 record low cost/ton Lowering costs: $107m gross productivity Cash cost per ton declined $145/ton,
10% sequentially
Reshaping Portfolio:
Curtailed 1.2 mmt at Pt. Comfort Saudi Arabia refinery at 80% of capacity First full quarter with Suralco
curtailed Lowering costs: $68m gross productivity Cash cost per ton declined
$15/ton, 7% sequentially
Aluminum: 38 Percentile
$/MT 2Q 2016 Outlook ATOI up $10M from Q1 excluding pricing and currency impacts ATOI up $15M
from Q1 excluding pricing and currency impacts Alumina Aluminum 2010: 30 th Percentile 2015: 23 rd Percentile 2016: 21 st Percentile Production (MMT) 2010: 51 st Percentile Production (MMT) 2016: 38 th Percentile 2015: 43 rd Percentile st th |
 [Alcoa logo] Executing Separation – On Course for Second Half of 2016 33 Separation Approximate Timeline and Path to Completion 4Q 2015 1 st Half 2016 2 nd Half 2016 Launched New
Value-Add Name and Brand and Refreshed Alcoa
Brand Separate
Supplier/Partner Contracts
Form 10 Filing - e.g., – 3-Year Carve-Out and 1-Year Pro-Forma Financials – Form of Separation and Legal Structure – Capital Structure – Allocation of Assets and Liabilities – Governance Structure Form 10 Effectiveness and Final Board Approval Complete Separation of IT Systems and Infrastructure Complete Financing Begin Trading as Two Companies Launched the Separation Program Office Announced the Executive Management Teams Confirmed U.S. Domicile for Both Companies Launched New Business Improvement Programs for 2016 – Value-Add to Deliver $650M – Upstream to Deliver $600M – Above Includes Overhead Reductions Across
Alcoa
($100M 1 in 2016, $225M over two years) 1) $50M of $100M to be realized in 2016 comes from Value-Add, remaining $50M from Upstream. |
 [Alcoa logo] Successfully Launched Two Strong Brands Ahead of Separation 34 Arconic and New Alcoa branding |
 [Alcoa logo] Arconic Geared for Profitable Growth; Significant Aero, Auto Traction Robust Business Improvement Programs to Strengthen Both Portfolios Pulling All Upstream Levers to Improve Profitability 35 On Track to Separate into Two Strong Companies On Track for Completing Separation 2 nd Half of 2016 |
 [Alcoa logo] Matthew Garth Vice President, Investor Relations and FP&A Alcoa 390 Park Avenue New York, NY 10022-4608 Telephone: (212) 836-2674 Email: matthew.garth@alcoa.com www.alcoa.com Additional Information 36 |
 [Alcoa logo] |
 [Alcoa logo] EPS Sequential Quarter Bridge Value Add Segment Bridges – 1Q 2016 GRP Sequential Quarter Bridge EPS = Engineered Products and Solutions GRP = Global Rolled Products
TCS = Transportation and Construction Solutions
4Q15 $123 Price / Mix -$19 Volume $20 Currency $1 1Q16 $162 Cost Increases/ Other -$9 Productivity $46 TCS Sequential Quarter Bridge $4 Price / Mix $1 Volume -$3 Currency 1Q16 $39 Cost Increases/ Other -$3 Productivity $0 4Q15 $40 1Q16 $68 Cost Increases / Other $4 Prod- uctivity $7 4Q15 $52 Price / Mix $3 Volume $3 Currency -$1 38 $ Millions $ Millions $ Millions |
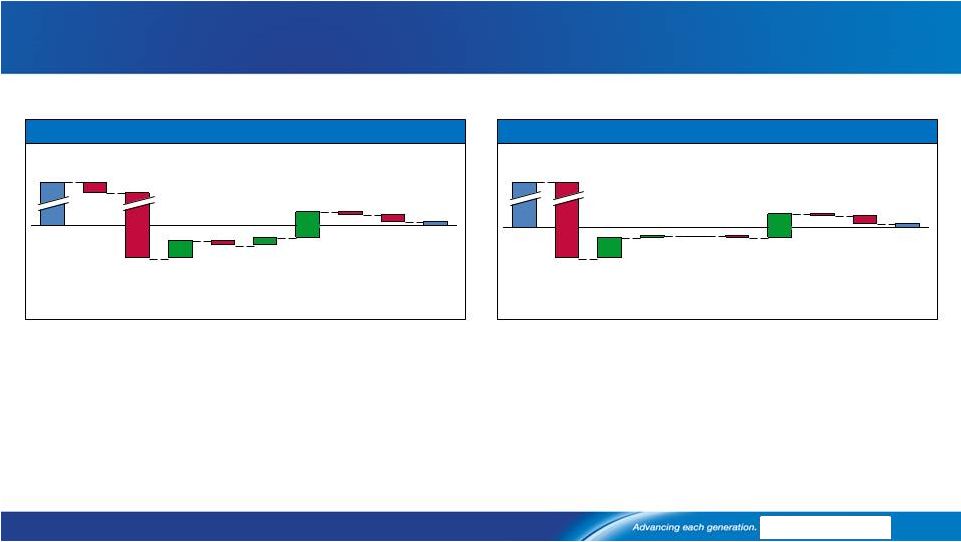 [Alcoa logo] Upstream Segment Bridges – 1Q 2016 Volume -$10 $8 Cost Increases / Other -$13 Energy Currency $34 API -$261 LME -$20 1Q15 $221 -$5 Prod- uctivity $47 Price / Mix $15 1Q16 Alumina Year-over-Year Bridge Primary Metals Year-over-Year Bridge $70 Metal Prices -$288 1Q15 $187 1Q16 $14 Cost Increases / Other -$24 Energy -$8 Prod- uctivity $77 Price / Mix -$5 Volume -$1 Currency $6 API 39 $ Millions $ Millions |
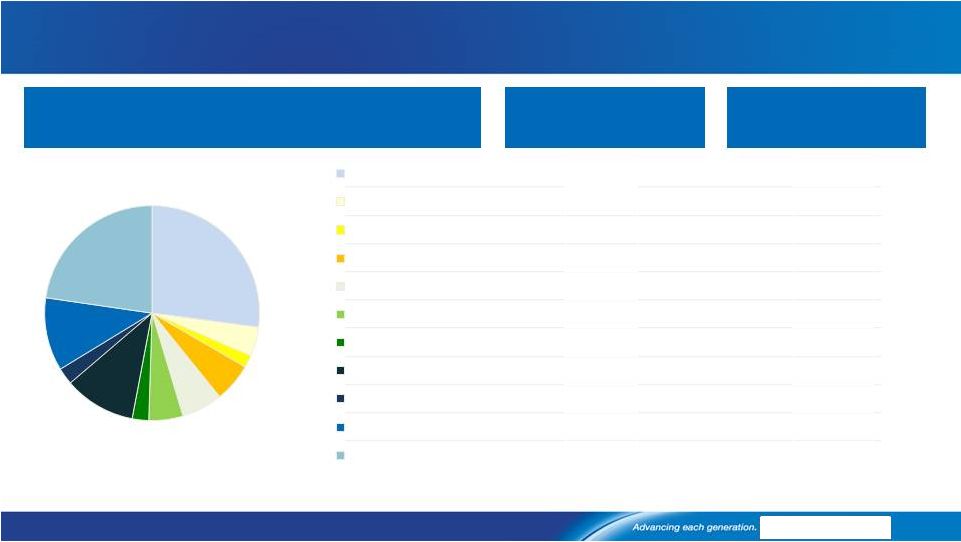 [Alcoa logo] Revenue Change by Market - 1Q 2016 2% 25% 7% 0% (14%) 0% 27% (10%) 7% (26%) (9%) 8% 10% (4%) (3%) (21%) (16%) 52% (18%) 13% (39%) (29%) 1Q16 Third-Party Revenue Sequential Change Year-Over-Year Change 40 27% 4% 2% 6% 6% 5% 2% 11% 3% 11% 23% Aerospace Automotive Brazing B&C Comm. Transport Industrial Products IGT Packaging Distribution/Other Alumina Primary Metals |
 [Alcoa logo] Composition of Upstream Production Costs Input Cost Inventory flow Pricing convention Annual ATOI Sensitivity Fuel oil 1 – 2 months Prior month $2m per $1/bbl Natural gas N/A N/A N/A Caustic soda 3 - 6 months Spot & semi- annual $6m per $10/DMT Refining Cost Structure Smelting Cost Structure Input Cost Inventory flow Pricing convention Annual ATOI Sensitivity Coke 1 - 2 months Spot, quarterly & semi-annual $5m per $10/MT Pitch 1 - 2 months Spot, quarterly & semi-annual $1m per $10/MT 1 Natural gas information related to Point Comfort will no longer apply as we are curtailing the plant. Australia
is priced on a rolling 16 quarter average
41 Alumina 31% Carbon 13% Power 24% Materials 7% Conversion 25% Fuel Oil 7% Natural gas 13% Caustic 10% Bauxite 26% Conversion 44% 1 |
 [Alcoa logo] Alcoa Upstream Capacity Closed, Sold, and Idled Facility Year kmt Baie Comeau 2008 53 Eastalco 2010 195 Badin 2010 60 Tennessee 2011 215 Rockdale 2011 76 Baie Comeau 2013 105 Fusina 2013 44 Massena East 2013 41 Massena East 2014 84 Point Henry 2014 190 Portovesme 2014 150 Mt. Holly (sale) 2014 115 Pocos 2015 96 Warrick 2016 269 Total 1,693 Closed/sold since December 2007 Facility Year kmt Portland 2008 30 Rockdale 2008 191 Aviles 2012 32 La Coruna 2012 24 Sao Luis 2013 97 Sao Luis 2014 97 Sao Luis 2015 74 Wenatchee 2015 184 Total 729 Smelting Capacity Idled Refining Capacity Facility Year kmt Jamalco (sale) 2014 779 Total 779 Closed/sold since December 2007 Facility Year kmt Point Comfort 2008 340 Suriname 2009 870 Suriname 2015 1,337 Point Comfort 2016 1,508 Total 4,055 Idled 42 |
 [Alcoa logo] Reconciliation of ATOI to Consolidated Net Income (Loss) Attributable to Alcoa (in millions) 1Q15 2Q15 3Q15 4Q15 2015 1Q16 Total segment ATOI $656 $567 $410 $273 $1,906 $291 Unallocated amounts (net of tax): Impact of LIFO 7 36 50 43 136 4 Metal price lag (23) (39) (48) (23) (133) 1 Interest expense (80) (80) (80) (84) (324) (83) Noncontrolling interests (60) (67) (62) 64 (125) 5 Corporate expense (62) (65) (72) (67) (266) (55) Impairment of goodwill – – – (25) (25) – Restructuring and other charges (161) (159) (48) (575) (943) (61) Other (82) (53) (106) (307) (548) (86) Consolidated net income (loss) attributable to Alcoa $195 $140 $44 $(701) $(322) $16 43 |
 [Alcoa logo] Reconciliation of ATOI to Consolidated Net Income (Loss) Attributable to Alcoa (1) – Supplemental View (in millions) 1Q14 2Q14 3Q14 4Q14 2014 1Q15 2Q15 3Q15 4Q15 2015 1Q16 Total segment ATOI (2) $320 $408 $581 $659 $1,968 $656 $567 $410 $273 $1,906 $291 Unallocated amounts (net of tax): Impact of LIFO (7) (8) (18) (21) (54) 7 36 50 43 136 4 Metal price lag (2) 7 11 38 22 78 (23) (39) (48) (23) (133) 1 Interest expense (78) (69) (72) (80) (299) (80) (80) (80) (84) (324) (83) Noncontrolling interests (20) (13) (29) (72) (134) (95) (87) (92) (25) (299) 3 Corporate expense (66) (58) (68) (60) (252) (56) (60) (55) (55) (226) (38) Other (58) (55) (62) (16) (191) (46) (87) (76) (64) (273) (70) Income excluding special items 98 216 370 432 1,116 363 250 109 65 787 108 Special items (3) (276) (78) (221) (273) (848) (168) (110) (65) (766) (1,109) (92) Consolidated net (loss) income attributable to Alcoa $(178) $138 $149 $159 $268 $195 $140 $44 $(701) $(322) $16 44 (1) In the third quarter of 2015, management approved a realignment of Alcoa’s Engineered Products and Solutions segment due to the
expansion of this part of Alcoa’s business portfolio through both organic and
inorganic growth. A portion of this realignment consisted of moving
the Latin American extrusions business from Corporate into a new Transportation and Construction Solutions segment (see the Reconciliation of Transportation and Construction Solutions Adjusted EBITDA for additional
information). Segment information for all prior periods presented was revised to
reflect the new segment structure. (2)
Effective in the second quarter of 2015, management removed the impact of metal price
lag from the results of the Global Rolled Products and Engineered Products
and Solutions (now Engineered Products and Solutions and Transportation and
Construction Solutions –
see footnote 1 above) segments in order to enhance the visibility of the underlying
operating performance of these businesses. Metal price lag describes the timing difference created when the average price of metal sold differs from the average cost of the metal when purchased by the respective segment. The impact of metal price lag is now reported as a separate line item in Alcoa’s reconciliation of total segment ATOI to consolidated net (loss) income attributable to Alcoa.
As a result, this change does not impact the consolidated results of
Alcoa. Segment information for all prior periods presented
was updated to reflect this change.
(3) Special items are defined as restructuring and other charges, discrete tax items, and other special items. See the Reconciliation of
Adjusted Income for additional information. NOTES FOR CORPORATE AMOUNTS:
LIFO and Metal price lag – these items tend to offset each other over time as the same underlying market conditions typically drive both amounts. Noncontrolling interests – primarily represents Alumina Limited’s 40% share of the operating results of the Alcoa World Alumina and Chemicals joint venture, which principally comprises Alcoa’s Alumina segment. Corporate expense – represents general and administrative expenses attributable to Alcoa’s corporate and business support locations, as well as costs associated with Alcoa’s corporate research and development center. Other – includes all other income and expenses not included in the segments, primarily: postretirement benefits and environmental remediation costs
associated with certain closed or divested businesses; various corporate
eliminations of inter-segment transactions; certain corporate foreign currency gains and losses; and the impact of the difference between the income tax rates applicable to the segments
and the consolidated effective tax rate of the Company.
|
 [Alcoa logo] Reconciliation of Adjusted Income (Loss) (in millions, except per-share amounts) Income (Loss) Diluted EPS (3) Quarter ended Quarter ended March 31, December 31, March 31, March 31, December 31, March 31, 2015 2015 2016 2015 2015 2016 Net income (loss) attributable to Alcoa $195 $(701) $16 $0.14 $(0.55) $0.00 Restructuring and other charges 158 507 61 Discrete tax items (1) – 187 2 Other special items (2) 10 72 29 Net income attributable to Alcoa – as adjusted $363 $65 $108 0.28 0.04 0.07 Net income (loss) attributable to Alcoa – as adjusted is a non-GAAP financial measure. Management believes that this measure is meaningful to investors because management reviews the operating results of Alcoa excluding the impacts of restructuring and other charges, discrete tax items, and other special items (collectively, “special items”). There can be no assurances that additional special items will not occur
in future periods. To compensate for this limitation, management believes that it is appropriate to consider both Net income (loss) attributable to Alcoa determined under GAAP as well as Net income attributable to Alcoa – as adjusted. (1) Discrete tax items include the following: • for the quarter ended March 31, 2016, a net charge for a number of small items; and
• for the quarter ended December 31, 2015, a charge for valuation allowances related to certain U.S. and Iceland deferred tax assets ($190) and a
net benefit for a small number of items ($3). (2)
Other special items include the following:
• for the quarter ended March 31, 2016, costs associated with the planned separation of Alcoa ($17), an unfavorable tax impact resulting from the
difference between Alcoa’s consolidated estimated annual effective tax rate and the statutory rates applicable to special items ($8), an unfavorable tax impact related to the interim period treatment of operational losses in certain foreign jurisdictions for which no tax benefit was recognized
($2), and a write-down on inventory related to the permanent closure of the Warrick smelter ($2); • for the quarter ended December 31, 2015, a write-down of inventory related to the permanent closure or temporary curtailment of various facilities in Suriname and the United States ($28), an impairment of goodwill related to the soft alloy extrusion business in Brazil ($25), costs associated with the planned separation of Alcoa ($12), a net unfavorable change in certain mark-to-market energy derivative contracts ($5), and an unfavorable tax impact related to the interim period treatment of operational losses in certain foreign jurisdictions for which no tax benefit was recognized ($2); and • for the quarter ended March 31, 2015, an unfavorable tax impact related to the interim period treatment of operational losses in certain foreign jurisdictions for which no tax benefit was recognized ($35), a favorable tax impact resulting from the difference between Alcoa’s consolidated estimated annual effective tax rate and the statutory rates applicable to special items ($31), costs associated with acquisitions of aerospace
businesses ($7), and a net favorable change in certain mark-to-market energy derivative contracts ($1). (3) The average number of shares applicable to diluted EPS for Net income (loss) attributable to Alcoa common shareholders excludes certain share equivalents as their effect was anti-dilutive. However, certain of these share equivalents may become dilutive in the EPS calculation applicable to Net income attributable to Alcoa common shareholders – as adjusted due to a larger and/or positive numerator. Specifically: • for the quarter ended March 31, 2016, share equivalents associated with outstanding employee stock options and awards were dilutive based on Net income attributable to Alcoa common shareholders – as adjusted, resulting in a diluted average number of shares of • 1,324,558,308; • for the quarter ended December 31, 2015, share equivalents associated with outstanding employee stock options and awards were dilutive based on Net income attributable to Alcoa common shareholders – as adjusted, resulting in a diluted average number of shares of 1,324,378,133; and • for the quarter ended March 30, 2015, share equivalents associated with mandatory convertible preferred were diluted based on Net Income attributable to Alcoa common shareholders – as adjusted, resulting in a diluted average number of shares of 1,315,558,890. Additionally, the subtraction of preferred stock dividends declared from the numerator (see footnote 1 to the Statement of Consolidated Operations) needs to be reversed since the related mandatory convertible preferred stock was dilutive in the EPS calculation for Net income attributable to Alcoa – as adjusted. 45 |
 [Alcoa logo] Reconciliation of Alcoa Adjusted EBITDA ($ in millions) 2005 2006 2007 2008 2009 2010 2011 2012 2013 2014 2015 1Q15 4Q15 1Q16 Net income (loss) attributable to Alcoa $1,233 $2,248 $2,564 $(74) $(1,151) $254 $611 $191 $(2,285) $268 $(322) $195 $(701) $16 Add: Net income (loss) attributable to noncontrolling interests 259 436 365 221 61 138 194 (29) 41 (91) 125 60 (64) (5) Cumulative effect of accounting changes 2 – – – – – – – – – – – – – Loss (income) from discontinued operations 50 (22) 250 303 166 8 3 – – – – – – – Provision (benefit) for income taxes 464 853 1,623 342 (574) 148 255 162 428 320 445 226 44 30 Other (income) expenses, net (478) (236) (1,920) (59) (161) 5 (87) (341) (25) 47 2 (12) 29 34 Interest expense 339 384 401 407 470 494 524 490 453 473 498 122 129 127 Restructuring and other charges 266 507 268 939 237 207 281 172 782 1,168 1,195 177 735 93 Impairment of goodwill – – – – – – – – 1,731 – 25 – 25 – Provision for depreciation, depletion, and amortization 1,227 1,252 1,244 1,234 1,311 1,450 1,479 1,460 1,421 1,371 1,280 321 322 308 Adjusted EBITDA $3,362 $5,422 $4,795 $3,313 $359 $2,704 $3,260 $2,105 $2,546 $3,556 $3,248 $1,089 $519 $603 Sales $24,149 $28,950 $29,280 $26,901 $18,439 $21,013 $24,951 $23,700 $23,032 $23,906 $22,534 $5,819 $5,245 $4,947 Adjusted EBITDA Margin 13.9% 18.7% 16.4% 12.3% 1.9% 12.9% 13.1% 8.9% 11.1% 14.9% 14.4% 18.7% 9.9% 12.2% Alcoa’s definition of Adjusted EBITDA (Earnings before interest, taxes, depreciation, and amortization) is net margin plus an add-back for depreciation, depletion, and amortization. Net margin is equivalent to Sales minus the following items: Cost of goods sold; Selling, general administrative, and other expenses; Research and development expenses; and Provision for depreciation, depletion, and amortization. Adjusted EBITDA is a non- GAAP financial measure. Management believes that this measure is meaningful to investors because Adjusted EBITDA provides additional information with respect to Alcoa’s operating performance and the Company’s ability to meet its financial obligations. The Adjusted EBITDA presented may not be comparable to similarly titled measures of other
companies. 46 |
 [Alcoa logo] Reconciliation of Alumina Adjusted EBITDA ($ in millions, except per metric ton amounts) 2005 2006 2007 2008 2009 2010 2011 2012 2013 2014 2015 1Q15 4Q15 1Q16 After-tax operating income (ATOI) $682 $1,050 $956 $727 $112 $301 $607 $90 $259 $370 $746 $221 $98 $8 Add: Depreciation, depletion, and amortization 172 192 267 268 292 406 444 455 426 387 296 80 68 63 Equity loss (income) – 2 (1) (7) (8) (10) (25) (5) 4 29 41 7 14 14 Income taxes 246 428 340 277 (22) 60 179 (27) 66 153 300 92 36 5 Other (8) (6) 2 (26) (92) (5) (44) (8) (6) (28) 1 – 2 – Adjusted EBITDA $1,092 $1,666 $1,564 $1,239 $282 $752 $1,161 $505 $749 $911 $1,384 $400 $218 $90 Production (thousand metric tons) (kmt) 14,598 15,128 15,084 15,256 14,265 15,922 16,486 16,342 16,618 16,606 15,720 3,933 3,856 3,330 Adjusted EBITDA / Production ($ per metric ton) $75 $110 $104 $81 $20 $47 $70 $31 $45 $55 $88 $102 $57 $27 Alcoa’s definition of Adjusted EBITDA (Earnings before interest, taxes, depreciation, and amortization) is net margin plus an add-back for depreciation, depletion, and amortization. Net margin is equivalent to Sales minus the following items: Cost of goods sold; Selling, general administrative, and other expenses; Research and development expenses; and Provision for depreciation, depletion, and amortization. The Other line in the table above includes gains/losses on asset sales and other non-operating items. Adjusted EBITDA is a non-GAAP financial measure.
Management believes that this measure is meaningful to investors because Adjusted EBITDA provides additional information with respect to Alcoa’s operating performance and the Company’s ability to meet its financial obligations. The Adjusted EBITDA presented may not be comparable to similarly titled measures of other companies. 47 |
 [Alcoa logo] Reconciliation of Primary Metals Adjusted EBITDA ($ in millions, except per metric ton amounts) 2005 2006 2007 2008 2009 2010 2011 2012 2013 2014 2015 1Q15 4Q15 1Q16 After-tax operating income (ATOI) $822 $1,760 $1,445 $931 $(612) $488 $481 $309 $(20) $594 $155 $187 $(40) $14 Add: Depreciation, depletion, and amortization 368 395 410 503 560 571 556 532 526 494 429 109 105 102 Equity loss (income) 12 (82) (57) (2) 26 (1) 7 27 51 34 12 3 (3) (4) Income taxes 307 726 542 172 (365) 96 92 106 (74) 203 (28) 57 (42) (16) Other (96) (13) (27) (32) (176) (7) 2 (422) (8) (6) (2) (1) 1 (1) Adjusted EBITDA $1,413 $2,786 $2,313 $1,572 $(567) $1,147 $1,138 $552 $475 $1,319 $566 $355 $21 $95 Production (thousand metric tons) (kmt) 3,554 3,552 3,693 4,007 3,564 3,586 3,775 3,742 3,550 3,125 2,811 711 699 655 Adjusted EBITDA / Production ($ per metric ton) $398 $784 $626 $392 $(159) $320 $301 $148 $134 $422 $201 $499 $30 $145 Alcoa’s definition of Adjusted EBITDA (Earnings before interest, taxes, depreciation, and amortization) is net margin plus an add-back for depreciation, depletion, and amortization. Net margin is equivalent to Sales minus the following items: Cost of goods sold; Selling, general administrative, and other expenses; Research and development expenses; and Provision for depreciation, depletion, and amortization. The Other line in the table above includes gains/losses on asset sales and other non-operating items. Adjusted EBITDA is a non-GAAP financial measure.
Management believes that this measure is meaningful to investors because Adjusted EBITDA provides additional information with respect to Alcoa’s operating performance and the Company’s ability to meet its financial
obligations. The Adjusted EBITDA presented may not be comparable to similarly titled measures of other companies. 48 |
 [Alcoa logo] Reconciliation of Upstream(1) Adjusted EBITDA (in millions) 2008 2009 2010 2011 2012 2013 2014 2015 1Q15 4Q15 1Q16 After-tax operating income (ATOI) $1,658 $(500) $789 $1,088 $399 $239 $964 $901 $408 $58 $22 Add: Depreciation, depletion, and amortization 771 852 977 1,000 987 952 881 725 189 173 165 Equity (income) loss (9) 18 (11) (18) 22 55 63 53 10 11 10 Income taxes 449 (387) 156 271 79 (8) 356 272 149 (6) (11) Other (58) (268) (12) (42) (430) (14) (34) (1) (1) 3 (1) Adjusted EBITDA $2,811 $(285) $1,899 $2,299 $1,057 $1,224 $2,230 $1,950 $755 $239 $185 Alcoa’s definition of Adjusted EBITDA (Earnings before interest, taxes, depreciation, and amortization) is net margin plus an add-back for depreciation, depletion, and amortization. Net margin is equivalent to Sales minus the following items: Cost of goods sold; Selling, general administrative, and other expenses; Research and development expenses; and Provision for depreciation, depletion, and amortization. The Other line in the table above includes gains/losses on asset sales and other non-operating items. Adjusted EBITDA is a non-GAAP financial measure.
Management believes that this measure is meaningful to investors because Adjusted EBITDA provides additional information with respect to Alcoa’s operating performance and the Company’s ability to meet its financial
obligations. The Adjusted EBITDA presented may not be comparable to similarly titled measures of other companies. 49 (1) Upstream is composed of the Alumina and Primary Metals segments. |
 [Alcoa logo] Reconciliation of Global Rolled Products Adjusted EBITDA ($ in millions, except per metric ton amounts) 2005 2006 2007 2008 2009 2010 2011 2012 2013 2014 2015 1Q15 4Q15 1Q16 After-tax operating income (ATOI) $278 $233 $178 $(3) $(49) $220 $266 $358 $292 $245 $244 $54 $52 $68 Add: Depreciation, depletion, and amortization 220 223 227 216 227 238 237 229 226 235 227 56 59 56 Equity loss – 2 – – – – 3 6 13 27 32 9 8 11 Income taxes 121 58 92 35 48 92 104 167 123 89 109 36 20 34 Other 1 20 1 6 (2) 1 1 (2) – (1) (1) – – (1) Adjusted EBITDA $620 $536 $498 $254 $224 $551 $611 $758 $654 $595 $611 $155 $139 $168 Total shipments (thousand metric tons) (kmt) 2,250 2,376 2,482 2,361 1,888 1,755 1,866 1,943 1,989 2,056 1,836 447 446 449 Adjusted EBITDA / Total shipments ($ per metric ton) $276 $226 $201 $108 $119 $314 $327 $390 $329 $289 $333 $347 $312 $374 Alcoa’s definition of Adjusted EBITDA (Earnings before interest, taxes, depreciation, and amortization) is net margin plus an add-back for depreciation, depletion, and amortization. Net margin is equivalent to Sales minus the following items: Cost of goods sold; Selling, general administrative, and other expenses; Research and development expenses; and Provision for depreciation, depletion, and amortization. The Other line in the table above includes gains/losses on asset sales and other non-operating items. Adjusted EBITDA is a non-GAAP financial measure.
Management believes that this measure is meaningful to investors because Adjusted EBITDA provides additional information with respect to Alcoa’s operating performance and the Company’s ability to meet its financial
obligations. The Adjusted EBITDA presented may not be comparable to similarly titled measures of other companies. 50 |
 [Alcoa logo] Reconciliation of Engineered Products and Solutions Adjusted EBITDA ($ in millions) 2005 2006 2007 2008 2009 2010 2011 2012 2013 2014 2015 1Q15 4Q15 1Q16 After-tax operating income (ATOI) $183 $237 $351 $465 $321 $355 $436 $484 $569 $579 $595 $156 $123 $162 Add: Depreciation, depletion, and amortization 114 111 114 118 118 114 120 122 124 137 233 51 67 65 Income taxes 86 128 186 225 159 182 224 248 286 298 282 76 54 78 Other (12) 2 2 2 2 – – – – – – (1) – – Adjusted EBITDA $371 $478 $653 $810 $600 $651 $780 $854 $979 $1,014 $1,110 $282 $244 $305 Third-party sales $2,966 $3,406 $3,821 $4,215 $3,355 $3,225 $3,716 $3,863 $4,054 $4,217 $5,342 $1,257 $1,409 $1,449 Adjusted EBITDA Margin 12.5% 14.0% 17.1% 19.2% 17.9% 20.2% 21.0% 22.1% 24.1% 24.0% 20.8% 22.4% 17.3% 21.0% Alcoa’s definition of Adjusted EBITDA (Earnings before interest, taxes, depreciation, and amortization) is net margin plus an
add-back for depreciation, depletion, and amortization. Net margin is
equivalent to Sales minus the following items: Cost of goods sold;
Selling, general administrative, and other expenses; Research and development expenses; and Provision for depreciation, depletion, and amortization. The Other line in the table above includes gains/losses on asset sales and other non-operating
items. Adjusted EBITDA is a non-GAAP financial measure.
Management believes that this measure is meaningful to investors because Adjusted EBITDA provides additional information with respect to Alcoa’s operating performance and the Company’s
ability to meet its financial obligations. The Adjusted EBITDA presented may not
be comparable to similarly titled measures of other companies.
51 |
 [Alcoa logo] Reconciliation of Transportation and Construction Solutions Adjusted EBITDA ($ in millions) 2005 2006 2007 2008 2009 2010 2011 2012 2013 2014 2015 1Q15 4Q15 1Q16 After-tax operating income (ATOI) $94 $129 $94 $82 $5 $73 $109 $126 $167 $180 $166 $38 $40 $39 Add: Depreciation, depletion, and amortization 50 45 55 53 65 48 45 42 42 42 43 10 11 11 Equity loss (income) – 6 – – (2) (2) (1) – – – – – – – Income taxes 30 27 7 – (21) 18 38 49 67 69 63 14 14 14 Other 1 (4) (10) – – – (1) (9) (2) – (1) 1 – – Adjusted EBITDA $175 $203 $146 $135 $47 $137 $190 $208 $274 $291 $271 $63 $65 $64 Third-party sales $1,954 $2,204 $2,249 $2,270 $1,537 $1,656 $1,936 $1,914 $1,951 $2,021 $1,882 $471 $444 $429 Adjusted EBITDA Margin 9.0% 9.2% 6.5% 5.9% 3.1% 8.3% 9.8% 10.9% 14.0% 14.4% 14.4% 13.4% 14.6% 14.9% Alcoa’s definition of Adjusted EBITDA (Earnings before interest, taxes, depreciation, and amortization) is net margin plus an
add-back for depreciation, depletion, and amortization. Net margin is
equivalent to Sales minus the following items: Cost of goods sold;
Selling, general administrative, and other expenses; Research and development expenses; and Provision for depreciation, depletion, and amortization. The Other line in the table above includes gains/losses on asset sales and other non-operating
items. Adjusted EBITDA is a non-GAAP financial measure.
Management believes that this measure is meaningful to investors because Adjusted EBITDA provides additional information with respect to Alcoa’s operating performance and the Company’s
ability to meet its financial obligations. The Adjusted EBITDA presented may not
be comparable to similarly titled measures of other companies.
52 |
 [Alcoa logo] Reconciliation of Value Add (1) Adjusted EBITDA ($ in millions) 2008 2009 2010 2011 2012 2013 2014 2015 1Q15 4Q15 1Q16 After-tax operating income (ATOI) $544 $277 $648 $811 $968 $1,028 $1,004 $1,005 $248 $215 $269 Add: Depreciation, depletion, and amortization 387 410 400 402 393 392 414 503 117 137 132 Equity (income) loss – (2) (2) 2 6 13 27 32 9 8 11 Income taxes 260 186 292 366 464 476 456 454 126 88 126 Other 8 – 1 – (11) (2) (1) (2) – – (1) Adjusted EBITDA $1,199 $871 $1,339 $1,581 $1,820 $1,907 $1,900 $1,992 $500 $448 $537 Third-party sales $15,451 $10,961 $11,158 $13,294 $13,155 $13,111 $13,589 $13,462 $3,349 $3,275 $3,275 Adjusted EBITDA Margin 7.8% 7.9% 12.0% 11.9% 13.8% 14.5% 14.0% 14.8% 14.9% 13.7% 16.4% Alcoa’s definition of Adjusted EBITDA (Earnings before interest, taxes, depreciation, and amortization) is net margin plus an
add-back for depreciation, depletion, and amortization. Net margin is
equivalent to Sales minus the following items: Cost of goods sold;
Selling, general administrative, and other expenses; Research and development expenses; and Provision for depreciation, depletion, and amortization. The Other line in the table above includes gains/losses on asset sales and other non-operating
items. Adjusted EBITDA is a non-GAAP financial measure.
Management believes that this measure is meaningful to investors because Adjusted EBITDA provides additional information with respect to Alcoa’s operating performance and the Company’s
ability to meet its financial obligations. The Adjusted EBITDA presented may not
be comparable to similarly titled measures of other companies.
53 (1) Value Add is composed of the Global Rolled Products, Engineered Products and Solutions, and Transportation and Construction Solutions
segments. |
 [Alcoa logo] Reconciliation of Free Cash Flow (in millions) Year ended Quarter ended December 31, 2010 December 31, 2011 December 31, 2012 December 31, 2013 December 31, 2014 December 31, 2015 March 31, 2015 December 31, 2015 March 31, 2016 Cash from operations $2,261 $2,193 $1,497 $1,578 $1,674 $1,582 $(175) $865 $(430) Capital expenditures (1,015) (1,287) (1,261) (1,193) (1,219) (1,180) (247) (398) (251) Free cash flow $1,246 $906 $236 $385 $455 $402 $(422) $467 $(681) Free Cash Flow is a non-GAAP financial measure. Management believes that this measure is meaningful to investors because management
reviews cash flows generated from operations after taking into consideration
capital expenditures due to the fact that these expenditures are considered necessary to
maintain and expand Alcoa’s asset base and are expected to generate future cash flows from operations. It is important to note that Free Cash Flow does not represent the residual cash flow available for discretionary expenditures since other non-discretionary
expenditures, such as mandatory debt service requirements, are not deducted from the measure. 54 |
 [Alcoa logo] Days Working Capital Days Working Capital = Working Capital divided by (Sales/number of days in the quarter).
(1) The deferred purchase price receivable relates to an arrangement to sell certain customer receivables to several financial institutions on a
recurring basis. Alcoa is adding back this receivable for the purposes of the Days Working Capital calculation. (2) The Working Capital for each period presented represents an average quarter Working Capital, which reflects the capital invested during a given quarter. As such, the components
of Working Capital for each period presented represent the average of the
ending balances in each of the three months during the respective quarter.
55 ($ in millions) Quarter ended 31-Mar-12 30-Jun-12 30-Sep-12 31-Dec-12 31-Mar-13 30-Jun-13 30-Sep-13 31-Dec-13 Receivables from customers, less allowances $1,709 $1,650 $1,600 $1,573 $1,704 $1,483 $1,427 $1,383 Add: Deferred purchase price receivable (1) 85 144 104 53 50 223 347 339 Receivables from customers, less allowances, as adjusted 1,794 1,794 1,704 1,626 1,754 1,706 1,774 1,722 Add: Inventories 3,079 3,097 3,051 2,894 2,961 2,949 2,932 2,783 Less: Accounts payable, trade 2,660 2,594 2,496 2,587 2,656 2,820 2,746 2,816 Working Capital (2) $2,213 $2,297 $2,259 $1,933 $2,059 $1,835 $1,960 $1,689 Sales $6,006 $5,963 $5,833 $5,898 $5,833 $5,849 $5,765 $5,585 Days Working Capital 34 35 36 30 32 29 31 28 |
 [Alcoa logo] Days Working Capital Days Working Capital = Working Capital divided by (Sales/number of days in the quarter).
(1) The deferred purchase price receivable relates to an arrangement to sell certain customer receivables to several financial institutions on a
recurring basis. Alcoa is adding back this receivable for the purposes of the Days Working Capital calculation. (2) The Working Capital for each period presented represents an average quarter Working Capital, which reflects the capital invested
during a given quarter. As such, the components of Working Capital for each
period presented represent the average of the ending balances in each of
the three months during the respective quarter. (3)
In the quarters ended September 30, 2015, December 31, 2015, and March 31, 2016
Working Capital and Sales include $405 and $147, respectively, $606 and $207, respectively, and $640 and $217, respectively, related to two acquisitions, TITAL (March 2015), and RTI International Metals (July 2015). Excluding these amounts, Days Working Capital was 35, 33 and 37 for the quarters ended
September 30, 2015, December 31, 2015, and March 31, 2016, respectively.
56 ($ in millions) Quarter ended 31-Mar-14 30-Jun-14 30-Sep-14 31-Dec-14 31-Mar-15 30-Jun-15 30-Sep-15 (3) 31-Dec-15 (3) 31-Mar-16 (3) Receivables from customers, less allowances $1,391 $1,401 $1,526 $1,513 $1,487 $1,548 $1,489 $1,428 $1,462 Add: Deferred purchase price receivable (1) 238 371 438 395 389 421 382 324 238 Receivables from customers, less allowances, as adjusted 1,629 1,772 1,964 1,908 1,876 1,969 1,871 1,752 1,700 Add: Inventories 2,974 3,201 3,194 3,064 3,189 3,230 3,443 3,523 3,516 Less: Accounts payable, trade 2,813 2,880 3,016 3,021 2,936 2,978 2,871 2,842 2,654 Working Capital (2) $1,790 $2,093 $2,142 $1,951 $2,129 $2,221 $2,443 $2,433 $2,562 Sales $5,454 $5,836 $6,239 $6,377 $5,819 $5,897 $5,573 $5,245 $4,947 Days Working Capital 30 33 32 28 33 34 40 43 47 |
 [Alcoa logo] Reconciliation of Net Debt Net debt is a non-GAAP financial measure. Management believes that this measure is meaningful to investors because management assesses
Alcoa’s leverage position after factoring in available cash that
could be used to repay outstanding debt. (in millions)
December 31, March 31, 2011 2012 2013 2014 2015 2016 Short-term borrowings $62 $53 $57 $54 $38 $40 Commercial paper 224 – – – – – Long-term debt due within one year 445 465 655 29 21 772 Long-term debt, less amount due within one year 8,542 8,226 7,534 8,704 8,993 8,257 Total debt (1) 9,273 8,744 8,246 8,787 9,052 9,069 Less: Cash and cash equivalents 1,939 1,861 1,437 1,877 1,919 1,384 Net debt $7,334 $6,883 $6,809 $6,910 $7,133 $7,685 57 (1) Debt amounts for 2011-2015 have been updated to reflect the adoption of FASB guidance (effective January 1, 2016) requiring presentation of
debt issuance costs as a reduction of debt rather than as a noncurrent
asset. |
 [Alcoa logo] Reconciliation of Debt-to-Adjusted EBITDA Ratio ($ in millions) 2011 2012 2013 2014 2015 1Q16* Net income (loss) attributable to Alcoa $611 $191 $(2,285) $268 $(322) $(501) Add: Net income (loss) attributable to noncontrolling interests 194 (29) 41 (91) 125 60 Loss from discontinued operations 3 – – – – – Provision for income taxes 255 162 428 320 445 249 Other expenses (income), net (87) (341) (25) 47 2 48 Interest expense 524 490 453 473 498 503 Restructuring and other charges 281 172 782 1,168 1,195 1,111 Impairment of goodwill – – 1,731 – 25 25 Provision for depreciation, depletion, and amortization 1,479 1,460 1,421 1,371 1,280 1,267 Adjusted EBITDA $3,260 $2,105 $2,546 $3,556 $3,248 $2,762 Total Debt (1) $9,273 $8,744 $8,246 $8,787 $9,052 $9,069 Debt-to-Adjusted EBITDA Ratio 2.84 4.16 3.24 2.47 2.79 3.28 Alcoa’s definition of Adjusted EBITDA (Earnings before interest, taxes, depreciation, and amortization) is net margin plus an add-back for depreciation, depletion, and amortization. Net margin is equivalent to Sales minus the following items: Cost of goods sold; Selling, general administrative, and other expenses; Research and development expenses; and Provision for depreciation, depletion, and amortization. Adjusted EBITDA is a non- GAAP financial measure. Management believes that this measure is meaningful to investors because Adjusted EBITDA provides additional
information with respect to Alcoa’s operating performance and the Company’s ability to meet its financial obligations. The Adjusted EBITDA presented may not be comparable to similarly titled measures of other
companies. 58
•The calculation of Adjusted EBITDA for the quarter ended March 31, 2016 is based
on the trailing twelve months. (1)
Debt amounts for 2011-2015 have been updated to reflect the adoption of FASB
guidance (effective January 1, 2016) requiring presentation of debt issuance costs as a reduction of debt rather than as a noncurrent asset. |
 [Alcoa logo] Reconciliation of RTI International Metals Adjusted EBITDA* ($ in millions) 2014 1Q15 Net income $31 $5 Add: Net loss attributable to discontinued operations - – Provision (benefit) for income taxes 10 (1) Interest expense 31 8 Interest income - - Other (income) expense, net (2) - Merger-related expenses – 5 Depreciation and amortization 45 11 Adjusted EBITDA $115 $28 Net sales $794 $198 Adjusted EBITDA Margin 14.5% 14.1% 59 * The calculation of Adjusted EBITDA for RTI International Metals (RTI) (now Alcoa Titanium and Engineered Products) is based on Alcoa’s
definition of Adjusted EBITDA (see below) and does not purport to be the
manner in which RTI’s former management would have calculated RTI’s Adjusted EBITDA. Additionally, this calculation of Adjusted EBITDA is not intended to suggest that RTI’s former management used Adjusted EBITDA as a measure of RTI’s profitability. The amounts used in
these calculations were obtained from RTI’s Annual Report on Form
10-K for the year ended December 31, 2014 and Quarterly Report on Form 10-Q for the three months ended March 31, 2015 filed with the U.S. Securities and Exchange Commission on February 26, 2015 and April 30, 2015, respectively. Alcoa’s definition of Adjusted EBITDA (Earnings before interest, taxes, depreciation, and amortization) is net margin plus an add-back
for depreciation, depletion, and amortization. Net margin is
equivalent to Sales minus the following items: Cost of goods sold; Selling, general administrative, and other expenses; Research and development expenses; and Provision for depreciation, depletion, and amortization. Adjusted EBITDA is a non-GAAP financial measure. Management believes
that this measure is meaningful to investors because Adjusted EBITDA
provides additional information with respect to Alcoa’s operating performance and the Company’s ability to meet its financial obligations. The Adjusted EBITDA presented may not be comparable to similarly titled measures of other companies.
|
Serious News for Serious Traders! Try StreetInsider.com Premium Free!
You May Also Be Interested In
- Morgan Stanley Upgrades Alcoa (AA) to Equalweight, 'Balance of Risks Improving'
- Alcoa (AA) PT Raised to $32 at UBS
- GA-ASI Selected to Build CCA for AFLCMC
Create E-mail Alert Related Categories
SEC FilingsSign up for StreetInsider Free!
Receive full access to all new and archived articles, unlimited portfolio tracking, e-mail alerts, custom newswires and RSS feeds - and more!
