

Form 8-K AGL RESOURCES INC For: Mar 25
 Tweet
Tweet Share
Share|
UNITED STATES
|
||
|
SECURITIES AND EXCHANGE COMMISSION
|
||
|
Washington, D.C. 20549
|
||
|
FORM 8-K
|
||
|
CURRENT REPORT
|
||
|
PURSUANT TO SECTION 13 OR 15(d) OF
|
||
|
THE SECURITIES EXCHANGE ACT OF 1934
|
||
|
Date of Report (Date of earliest event reported): March 25, 2015
|
||
|
AGL RESOURCES INC.
|
||
|
(Exact name of registrant as specified in its charter)
|
||
|
Georgia
|
1-14174
|
58-2210952
|
|
(State or other jurisdiction of incorporation)
|
(Commission File No.)
|
(I.R.S. Employer Identification No.)
|
|
Ten Peachtree Place NE, Atlanta, Georgia 30309
|
||
|
(Address and zip code of principal executive offices)
|
||
|
404-584-4000
|
||
|
(Registrant's telephone number, including area code)
|
||
|
Not Applicable
|
||
|
(Former name or former address, if changed since last report)
|
||
|
Check the appropriate box below if the Form 8-K filing is intended to simultaneously satisfy the filing obligation of the registrant under any of the following provisions:
|
||
|
¨ Written communications pursuant to Rule 425 under the Securities Act (17 CFR 230.425)
|
||
|
¨ Soliciting material pursuant to Rule 14a-12 under the Exchange Act (17 CFR 240.14a-12)
|
||
|
¨ Pre-commencement communications pursuant to Rule 14d-2(b) under the Exchange Act (17 CFR 240.14d-2(b))
|
||
|
¨ Pre-commencement communications pursuant to Rule 13e-4(c) under the Exchange Act (17 CFR 240.13e-4(c))
|
||
Item 7.01 Regulation FD Disclosure
On March 25, 2015, AGL Resources Inc. (the “Company”) issued a press release announcing an increase to its 2015 earnings per share guidance due to colder-than-normal weather across its distribution and retail businesses through the first two months of 2015, as well as stronger-than-expected results at its wholesale business. A copy of the press release is attached hereto as Exhibit 99.1 and incorporated by reference herein.
The Company also will host its annual Analyst Day for institutional investors at the New York Stock Exchange on March 25, 2015. The presentation is expected to begin at 9:00 a.m. Eastern Time and will be available via a live audio webcast on the “Investor Relations” section of our website at www.aglresources.com. The presentation will include the slides attached hereto as Exhibit 99.2 and incorporated by reference herein. The presentation refers to certain financial measures that were not prepared in accordance with accounting principles generally accepted in the United States of America (GAAP). Reconciliations of those non-GAAP financial measures to the most directly comparable GAAP financial measures can be found in the appendix to the presentation materials and also on the Company’s website at www.aglresources.com under the Investor Relations section.
The information contained in this Item 7.01, as well as Exhibits 99.1 and 99.2 referenced herein, shall not be deemed “filed” for purposes of Section 18 of the Securities Exchange Act of 1934, nor shall it be deemed incorporated by reference in any filing under the Securities Act of 1933 or the Securities Exchange Act of 1934 unless AGL Resources Inc. expressly so incorporates such information by reference.
Item 9.01 Financial Statements and Exhibits
|
(d)
|
Exhibits
|
|
Exhibit No.
|
Description
|
||
| 99.1 |
Press Release, dated March 25, 2015, announcing an increase to 2015 guidance
|
||
| 99.2 |
Investor Presentation Materials
|
||
2
SIGNATURE
Pursuant to the requirements of the Securities Exchange Act of 1934, the registrant has duly caused this report to be signed on its behalf by the undersigned hereunto duly authorized.
|
AGL RESOURCES INC.
|
|
|
(Registrant)
|
|
|
Date: March 25, 2015
|
/s/ Andrew W. Evans
|
|
Executive Vice President and Chief Financial Officer
|
3
Exhibit Index
|
Exhibit No.
|
Description
|
||
| 99.1 |
Press Release, dated March 25, 2015, announcing an increase to 2015 guidance
|
||
| 99.2 |
Investor Presentation Materials
|
||
4
News Release
AGL Resources Increases 2015 Earnings Guidance
|
·
|
2015 EPS guidance increased to $2.85 - $3.10 on a consolidated basis (from $2.70-$2.90)
|
|
·
|
2015 EPS guidance increased to $2.70 - $2.80 excluding wholesale services (from $2.65-$2.75)
|
|
·
|
Revised expectations driven by colder-than-normal weather through February 2015 as well as stronger-than-expected results at wholesale services
|
ATLANTA, March 25, 2015 -- AGL Resources Inc. (NYSE: GAS) today announced that it is increasing its 2015 earnings per share guidance driven by colder-than-normal weather across its distribution and retail businesses through the first two months of 2015, as well as stronger-than-expected results at its wholesale business. Subsequent to the company's issuance of original guidance on February 11, 2015, results improved in the distribution and retail businesses due to weather that was 36% colder-than-normal throughout February across the company's service areas. In addition, the wholesale services business generated commercial activity during February that was significantly above expectations included in the original guidance range.
2015 EPS Guidance
|
Diluted EPS
|
Revised Guidance (3/25/15)
|
Initial Guidance (2/11/15)
|
||||||
|
Consolidated EPS
|
$ | 2.85 - $3.10 | $ | 2.70 - $2.90 | ||||
|
EPS, excluding wholesale services
|
$ | 2.70 - $2.80 | $ | 2.65 - $2.75 |
In addition to the EPS guidance noted above, economic earnings for the wholesale services segment is expected to be between $80 million and $110 million (up from prior expectations of $50 million) for 2015, driven by strong commercial activity through the first two months of the year. EBIT reported in accordance with GAAP is expected to be between $40 million and $60 million (up from $15 million to $25 million), assuming no mark-to-market gains or losses in 2015 for 2016 and forward positions.
ANALYST DAY
As a reminder, AGL Resources will hold its annual investor conference today beginning at 9 a.m ET. A live webcast and replay of the conference will be available at www.aglresources.com in the Investor Relations section.
1
About AGL Resources
AGL Resources (NYSE: GAS) is an Atlanta-based energy services holding company with operations in natural gas distribution, retail operations, wholesale services and midstream operations. AGL Resources serves approximately 4.5 million utility customers through its regulated distribution subsidiaries in seven states. The company also serves approximately 630,000 retail energy customers and approximately 1.2 million customer service contracts through its SouthStar Energy Services joint venture and Pivotal Home Solutions, which market natural gas and related home services. Other non-utility businesses include asset management for natural gas wholesale customers through Sequent Energy Management and ownership and operation of natural gas storage facilities. AGL Resources is a member of the S&P 500 Index.
Forward-Looking Statements
This press release includes forward-looking statements under the safe harbor provisions of the Private Securities Litigation Reform Act of 1995. Forward-looking statements often include words such as "anticipate," "assume," "believe," "expect," "forecast," "future," "goal," "indicate," "intend," "may," "outlook," "plan," "potential," "predict," "target," or similar expressions. Forward-looking statements contained in this press release include, without limitation, our 2015 earnings guidance, the financial performance of our wholesale business and related expectations and assumptions. Actual results could differ materially from such forward-looking statements. The factors that could cause actual results to differ are more fully described in AGL Resources’ SEC filings. Forward-looking statements are only as of the date they are made. We disclaim any obligation to publicly revise any forward-looking statement, whether as a result of future events, new information or otherwise, except as required by law.
Contacts:
Financial
Sarah Stashak
Director, Investor Relations
Office: 404-584-4577
Media
Tami Gerke
Director, External Communications
Office: 404-584-3873
2

2015 Investor Conference March 25, 2015

Agenda 2015 Investor Conference * 8:30 – 9:00 REGISTRATION & BREAKFAST REGISTRATION & BREAKFAST 9:00 – 9:05 Welcome Remarks Sarah Stashak Director, Investor Relations 9:05 – 9:25 CEO Remarks John Somerhalder Chairman, President & CEO 9:25 – 9:50 Financial Overview Drew Evans EVP & CFO 9:50 – 10:30 Distribution Operations Hank Linginfelter EVP, Distribution Operations 10:30 – 10:45 BREAK BREAK 10:45 – 11:05 Retail Operations Drew Evans EVP & CFO 11:05 – 11:30 Midstream Operations & Wholesale Services Peter Tumminello EVP, Wholesale Services 11:30 – 11:45 Concluding Remarks Final Q&A Concluding Remarks Final Q&A 11:45 – 12:30 LUNCH LUNCH

Forward Looking Statements Forward-Looking Statements This presentation includes forward-looking statements under the safe harbor provisions of the Private Securities Litigation Reform Act of 1995. Forward-looking statements often include words such as "anticipate," "assume," "believe," "expect," "forecast," "future," "goal," "indicate," "intend," "may," "outlook," "plan," "potential," "predict," "target," or similar expressions. Actual results could differ materially from such forward-looking statements. The factors that could cause actual results to differ are more fully described in AGL Resources’ SEC filings. Non-GAAP Financial Information This presentation refers to certain financial measures that were not prepared in accordance with U.S. generally accepted accounting principles. Reconciliations of those non-GAAP financial measures to the most directly comparable GAAP financial measures can be found in the Appendix herein and also on the company’s website at www.aglresources.com under the Investor Relations section. 2015 Investor Conference *
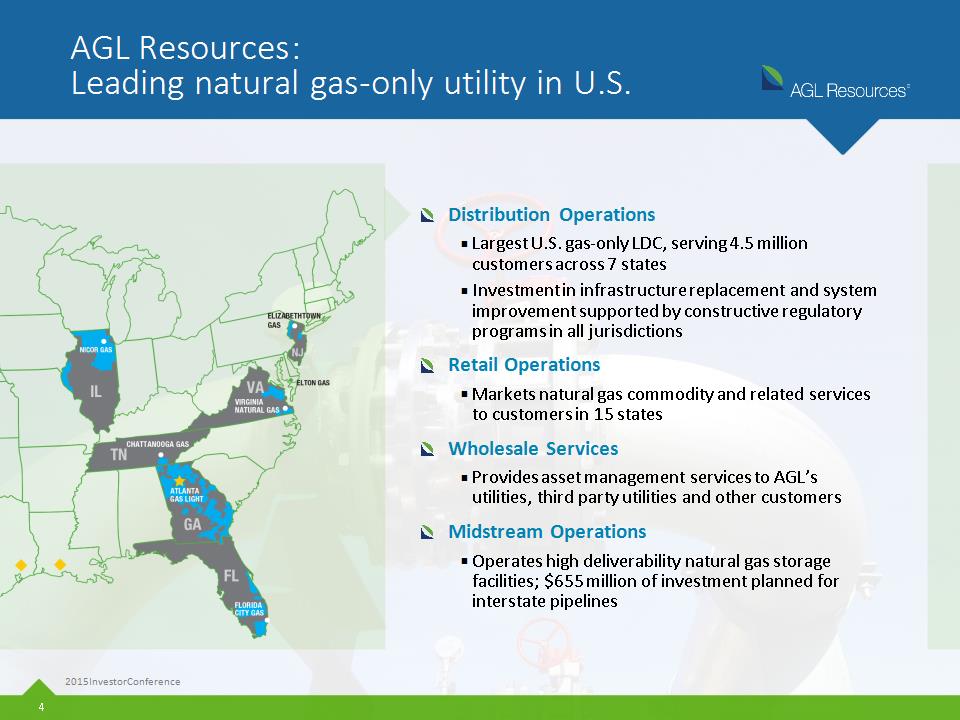
AGL Resources: Leading natural gas-only utility in U.S. Distribution Operations Largest U.S. gas-only LDC, serving 4.5 million customers across 7 states Investment in infrastructure replacement and system improvement supported by constructive regulatory programs in all jurisdictions Retail Operations Markets natural gas commodity and related services to customers in 15 states Wholesale Services Provides asset management services to AGL’s utilities, third party utilities and other customers Midstream Operations Operates high deliverability natural gas storage facilities; $655 million of investment planned for interstate pipelines 2015 Investor Conference *

Corporate strategy in place to generate predictable, attractive earnings stream Invest in utility projects that drive rate base growth with minimal regulatory lag Invest in interstate pipelines supported by long-term contracts Target EBIT contribution from utilities and pipelines of ~80% Sale of Tropical Shipping in 2014 resulted in natural gas-focused business mix EBIT Contribution by Segment 2015 Investor Conference * 5-year plan forecasts ~80% of EBIT from utilities and pipeline investments $450M ~$1B ~$750M
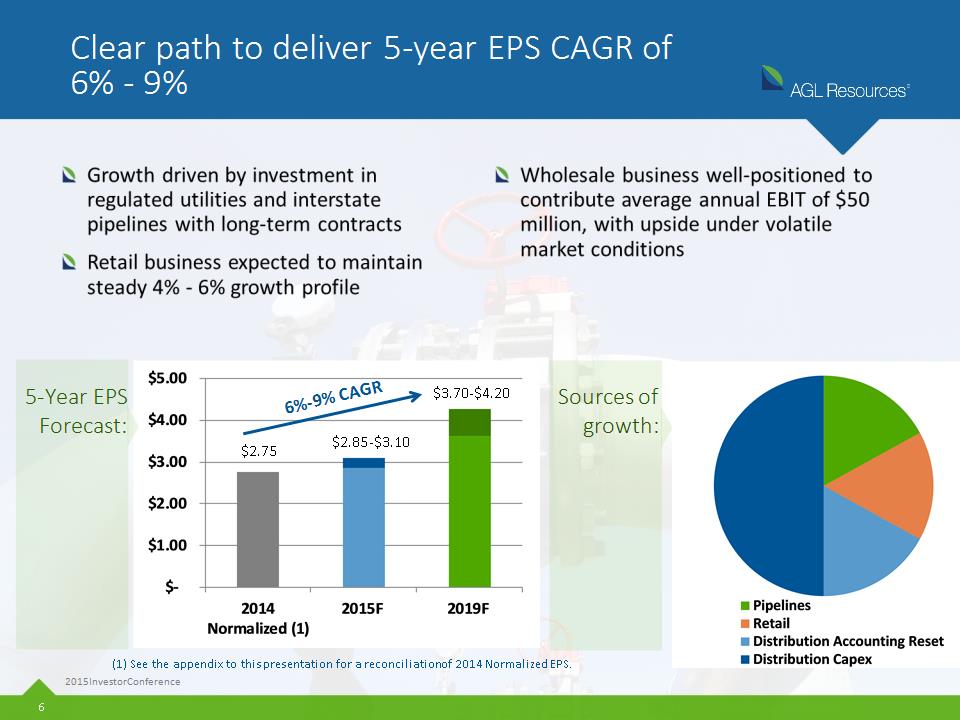
Clear path to deliver 5-year EPS CAGR of 6% - 9% (1) See the appendix to this presentation for a reconciliation of 2014 Normalized EPS. 5-Year EPS Forecast: 2015 Investor Conference * $2.75 $2.85-$3.10 $3.70-$4.20 6%-9% CAGR Sources of growth:

Utility and pipeline capital investment are foundations for growth 95% of capital investment dedicated to regulated utilities and pipelines Utility and pipeline investments result in doubling of regulated rate base over 10-year period, with utility rate base CAGR of 7% - 9% Balance sheet strongest in over a decade Current capex plan fundable with no equity issuance required Note: 2018-2019 capex expected to be higher as rider renewals and new programs are requested 5-Year Capital Investment Forecast (millions) 2015 Investor Conference *

Pipeline investments support utility supply needs and result in attractive shareholder returns Dalton Lateral PennEast Atlantic Coast Prairie State $200M investment Benefiting Atlanta Gas Light customers 100% contracted, 25-yr average tenor Completion: 2Q17 $220M investment Benefiting Elizabethtown Gas customers 96% contracted, 14-year average tenor Completion: 4Q17 $235M investment Benefiting Virginia Natural Gas customers 93% contracted, 20-year average tenor Completion 4Q18 Open season concluded, discussions ongoing with interested shippers Proposed Chicago-area route, benefiting Nicor Gas customers 2015 Investor Conference * Investment in three major interstate pipelines connected to AGL’s utilities expected to result in aggregate annual EPS of ~$0.18 once complete Long-term, utility supported contracts Supply diversity for customers

Significant investment opportunities in 2015-2019 drive strong 5-year plan Disciplined approach to acquisitions and divestitures has created organic growth opportunities across all business segments 2015 Investor Conference * DISTRIBUTION Diversified across 7 states and utilities Average annual capital investment of ~$950 million Virtually no regulatory lag to recover rider investment Opportunities for extensions and new programs RETAIL Stable, diverse earnings mix Minimal capital requirements to generate strong returns Maintain 4% - 6% annual growth rate driven by organic growth and opportunistic M&A WHOLESALE Targeted annual EBIT of $50 million with upside in volatile conditions Revenue sharing with utilities remains core to strategy Surplus earnings support regulated capex program and shareholder returns MIDSTREAM Investment of $655M in interstate pipelines Pipelines nearly 100% subscribed under long-term contracts Modest recovery in storage rates Continued investment in LNG for transportation

2015 – 2019 Financial Plan Drew Evans *

Key takeaways AGL offers a low-risk investment in predominantly regulated assets Five-year capital investment program drives improved earnings growth rate 2015 – 2017 CAGR of 5% - 8% 2015 – 2019 CAGR of 6% - 9% Expect to invest more than $5 billion over a 5-year period, with capital allocated to projects that have little to no regulatory lag and that generate attractive returns Capital program to be funded through cash from operations and long-term debt issuance, with no equity issuance required Earnings growth over the period tied to core regulated operations and complementary business segments; wholesale services business provides an option for potential incremental upside under certain market conditions 1 2 5 3 4 2015 Investor Conference * 6 Strong cash flow generation to fund future dividend increases, building on long-term track record of returning value to shareholders

2014 earnings strongest in company’s history 2015 Investor Conference * 2014 HIGHLIGHTS Strong operating performance in all segments Record earnings, up 92%, driven by: Strong wholesale services commercial activity and net hedge gains Non-weather related customer usage and growth Colder-than-normal weather across distribution and retail Operating expense up 3%, including higher compensation expense related to record wholesale earnings Results included the acceleration of 2015 wholesale services earnings into 2014 due to mark-to-market accounting

Increasing 2015 guidance to reflect strong start to the year Increasing both core earnings (excluding wholesale) and consolidated earnings guidance 2015 consolidated earnings now expected to be in the range of $2.85 to $3.10 per share 2015 core earnings now expected to be in the range of $2.70 to $2.80 per share Increases reflect strong start to the year, driven by colder-than-normal weather for distribution and retail segments, and stronger commercial activity in wholesale services 2015 GUIDANCE UPDATE 2015 EPS (excluding Wholesale Services) $2.70 Midpoint $2.75 Midpoint $2.65 - $2.75 $2.70 - $2.80 2015 EPS (consolidated) $2.80 Midpoint $2.98 Midpoint $2.70 - $2.90 $2.85 - $3.10 * 2015 Investor Conference

Revised long-term outlook driven by robust capital investment program and rate relief 2015 Investor Conference * Pre-2015 Outlook CURRENT 3-Year Outlook CURRENT 5-Year Outlook Target EPS Growth CAGR 4%-6% 5%-8% 6%-9%+ Target Rate Base Growth 4.5%-5.5% 7%-9% 7%-9% Estimated Capital Expenditures $750 M annually with ~22% under riders $5+ B over five years with ~40% of utility cap ex under riders $5+ B over five years with ~40% of utility cap ex under riders Rate Case Assumptions No rate cases since 2010 Rate case filings expected in several jurisdictions Rate case filings expected in several jurisdictions

2015 – 2019 projected average annual capital spend of $1.1 billion Nearly 90% of regulated distribution capital deployed over the period unlagged Contributions from pipeline projects further enhance predictable earnings stream Significant opportunities for additional regulated investment in later years of planning cycle Corporate strategy in place to enhance predictable earnings stream Long-term capital allocation focused on regulated projects 2015 Investor Conference *
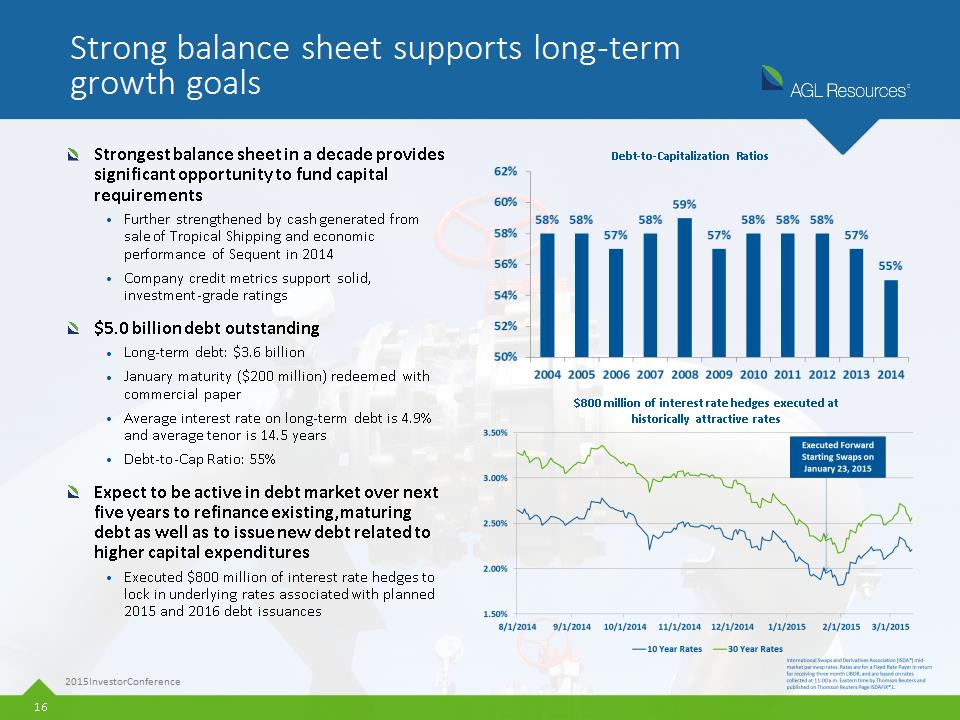
Strong balance sheet supports long-term growth goals Strongest balance sheet in a decade provides significant opportunity to fund capital requirements Further strengthened by cash generated from sale of Tropical Shipping and economic performance of Sequent in 2014 Company credit metrics support solid, investment-grade ratings $5.0 billion debt outstanding Long-term debt: $3.6 billion January maturity ($200 million) redeemed with commercial paper Average interest rate on long-term debt is 4.9% and average tenor is 14.5 years Debt-to-Cap Ratio: 55% Expect to be active in debt market over next five years to refinance existing, maturing debt as well as to issue new debt related to higher capital expenditures Executed $800 million of interest rate hedges to lock in underlying rates associated with planned 2015 and 2016 debt issuances 2015 Investor Conference * $800 million of interest rate hedges executed at historically attractive rates Debt-to-Capitalization Ratios

Commitment to strong investment-grade ratings AGL Resources AGL Resources AGL Resources Nicor Gas Nicor Gas Nicor Gas S&P Moody’s Fitch S&P Moody’s Fitch Corporate rating BBB+ n/a BBB+ BBB+ n/a A Senior unsecured BBB+ A3 BBB+ BBB+ A2 A+ Commercial paper A2 P2 F2 A2 P1 F1 2014 2019F Debt-to-capitalization ratios Debt 55% Equity 41% *

Demonstrated track record of dividend increases and commitment to dividend growth Management and the Board of Directors have demonstrated commitment to dividend growth 13 consecutive years of dividend increases 4% annual increases in 2015 and 2014 Future dividend growth supported by increasing regulated cash flows Target payout ratio is approximately 65% 2002 – 2015 CAGR = 5% * Notes: Years 2010-2013 reflect accounting revisions as disclosed 11/7/14 (see page 89 of this presentation). Years 2010-2012 exclude Nicor merger-related expenses, with 2012 also excluding PBR expenses. 2014 reflects record wholesale services earnings.
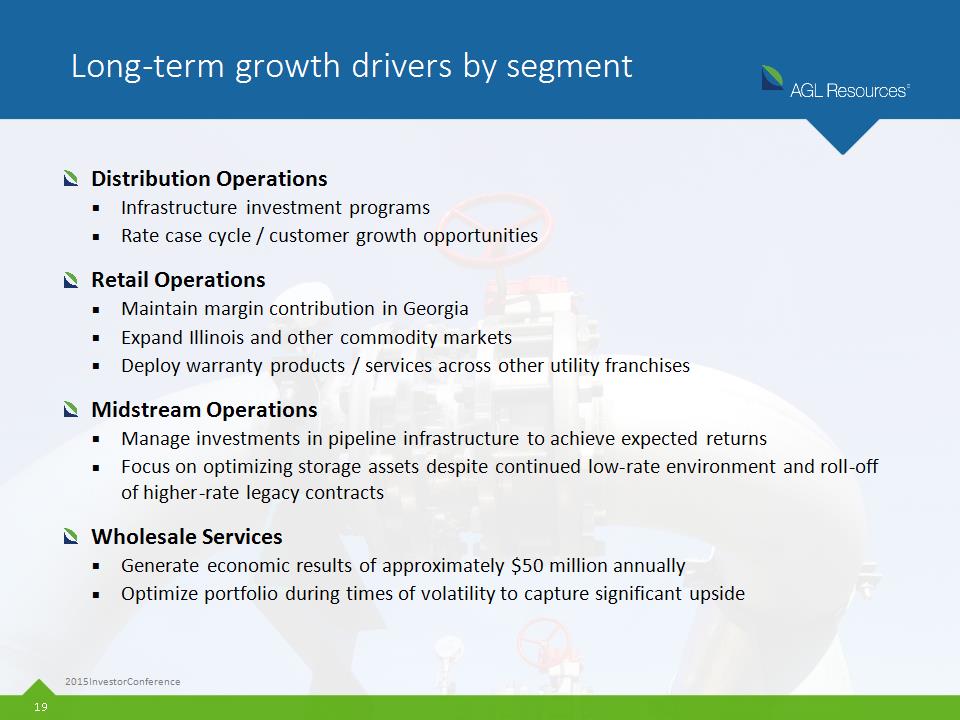
Long-term growth drivers by segment Distribution Operations Infrastructure investment programs Rate case cycle / customer growth opportunities Retail Operations Maintain margin contribution in Georgia Expand Illinois and other commodity markets Deploy warranty products / services across other utility franchises Midstream Operations Manage investments in pipeline infrastructure to achieve expected returns Focus on optimizing storage assets despite continued low-rate environment and roll-off of higher-rate legacy contracts Wholesale Services Generate economic results of approximately $50 million annually Optimize portfolio during times of volatility to capture significant upside 2015 Investor Conference *

Commitment to creating long-term value 2015 Investor Conference * Execute on 5-year growth plan Deliver superior earnings results Maintain dividend growth Capital investments of ~$5 billion over next five years Investments focused on growing rate base and other regulated assets No equity issuance required to fund growth plan EPS CAGR of 5% - 8% for 2015 – 2017 EPS CAGR of 6% - 9% for 2015 – 2019 Long-term growth rate among highest in the LDC sector Growing regulated cash flows provide strong support for dividend increases Long-term track record of dividend growth

Distribution Operations Hank Linginfelter *

Leading natural gas utility in U.S. KEY STATISTICS Largest gas-only LDC in U.S. 4.5 million customers Approximately 1 out of every 16 meters in U.S. served by an AGL utility 80,700 miles of pipeline 4,500 employees Substantially decoupled rates in most large jurisdictions Minimal downside risk related to weather Infrastructure replacement riders in place at largest utilities 2015 Investor Conference *

Steady EBIT growth poised to accelerate 2015 Investor Conference * Distribution EBIT Growth Forecast: 5% - 8% (millions) 2014 Normalized EBIT: $552M $720M-$815M Note: See the appendix to this presentation for a reconciliation of 2014 Normalized EBIT.

90% of capital investment not subject to regulatory lag 50% of investment related to infrastructure riders or new business 75% of base capital covered by depreciation expense, allowing rate base to grow while minimizing cash outlay Well-defined capital investment plan Utility Capital Investment Plan (millions) 2015 Investor Conference * Note: 2018-2019 capex expected to be higher as rider renewals and new programs are requested

2014-2019 rate base CAGR forecast: 7% - 9% In 2014, 30% of rate base related to Nicor Gas and 44% to Atlanta Gas Light Accelerating capex in Illinois, combined with lower depreciation rate approved in 2013, expected to nearly double Nicor Gas rate base over 10-year period Capital investment drives rate base growth Rate Base Growth (millions) 2015 Investor Conference * Note: Increase in 2011 reflects Nicor acquisition.

5% CAGR driven by rider investment 8% CAGR includes customer growth and modest rate relief Base and rider growth drives 5% - 8% EBIT CAGR EBIT Growth Forecast (millions) 2015 Investor Conference *

Existing rider programs support forecast Illinois Georgia New Jersey Virginia “Investing in Illinois” program: 9-year program (expires 2023) with annual average spending of approximately $200 million - $250 million; unlagged recovery at authorized ROE 10.17% Multiple programs: 4-8 year programs (expire 2017) with annual average spending of approximately $100 million - $200 million; unlagged recovery at authorized ROE 10.75% Filed for PRP true-up in February 2015 to recover $178 million (program completed in 2013) AIR program: 4-year program (expires 2017) with annual average spending of $30 million; deferral of recovery until 2016 rate case at ROE of 9.75%, consistent with similar programs of other NJ utilities SAVE program: 5-year program (expires 2017) with annual average spending of $25 million; unlagged recovery authorized ROE 10.00% 2015 Investor Conference *

Atlanta Gas Light pioneered natural gas infrastructure replacement programs in Georgia beginning in 1998, with similar programs to follow in Illinois, New Jersey and Virginia Across its systems, AGL Resources’ utilities have replaced over 3,000 miles of bare steel, cast iron and improperly coated pipelines Programs have resulted in improved safety performance, lower annual maintenance costs and increased system reliability Next phase of infrastructure investment focused on replacement of thousands of miles of vintage plastic pipelines, as well as pressure improvement and other system reliability projects Industry leader in pipeline replacement and upgrades 2015 Investor Conference *

Regulatory protections in place for customers and shareholders 2015 Investor Conference * (1) Nicor Gas does not have a commission-approved weather normalization program. However, since 2013 the company has implemented a weather hedging program designed to minimize the impact of warmer-than-normal weather, while retaining the ability to benefit from colder-than-normal weather. At Chattanooga Gas, weather normalization only occurs for large customers. (2) Chattanooga Revenue Normalization Adjustment was set to expire in May 2014, but it has been extended in its current form until the Commission concludes a proceeding on the matter. Utility Rate Decoupling Weather Normalization Bad Debt Recovery Conservation Program Recovery Infrastructure Programs Nicor Gas (~70% Fixed) (1) Atlanta Gas Light (Straight –Fixed -Variable) Virginia Natural Gas (Revenue Normalization) Elizabethtown Gas Florida City Gas Chattanooga Gas (2) (Revenue Normalization) (1) (2)

Capital investment and anticipated increases in operating costs expected to drive rate case filings in multiple jurisdictions over the next several years Solid performance relative to allowed ROE Note: Earned ROE for Nicor Gas is weather-normalized. Performance relative to allowed ROE 2015 Investor Conference * # Customers (thousands) 2,195 1,560 287 281 105 63 $1,561 $2,315 $590 $519 $182 $104 Rate Base (millions)
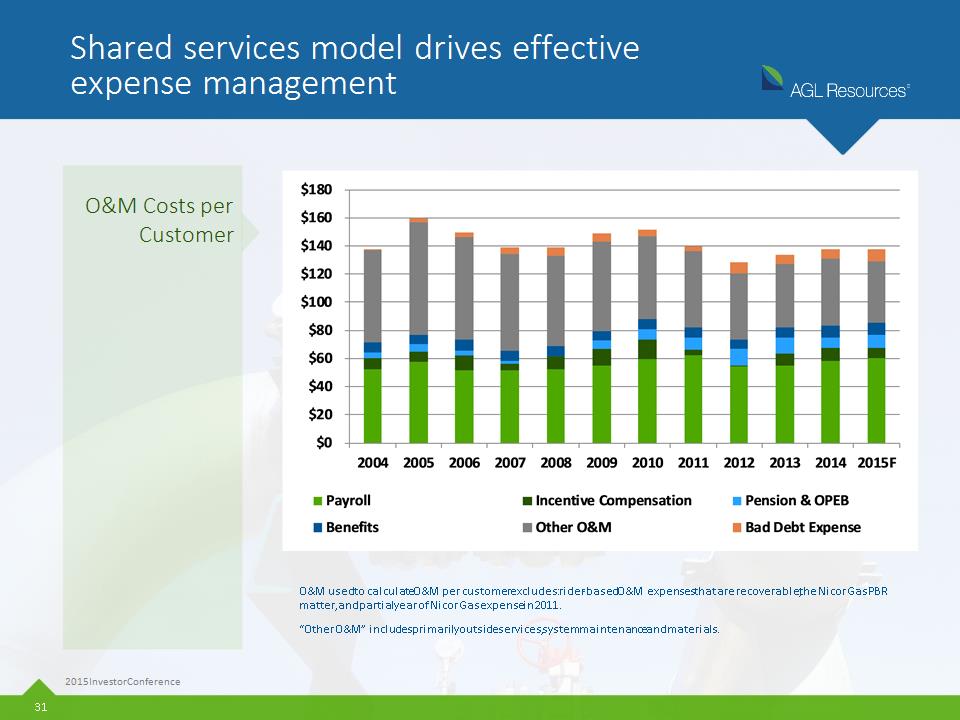
Shared services model drives effective expense management 2015 Investor Conference * O&M used to calculate O&M per customer excludes: rider-based O&M expenses that are recoverable, the Nicor Gas PBR matter, and partial year of Nicor Gas expense in 2011. “Other O&M” includes primarily outside services, system maintenance and materials. O&M Costs per Customer

Continuing Customer Growth 2015 Investor Conference * Natural gas continues to be low cost, competitive energy source Forecasted new meters of 35,000 for 2015 -- highest since 2008 and 80% more than 2011 New customers expected to result in $13 million in top-line growth in 2015 Residential growth driven by conversions and continued improvement in housing market Increased opportunities in multi-family and high-rise apartment buildings Substantial increase in large commercial and industrial customers customer cost/year Source: AGA
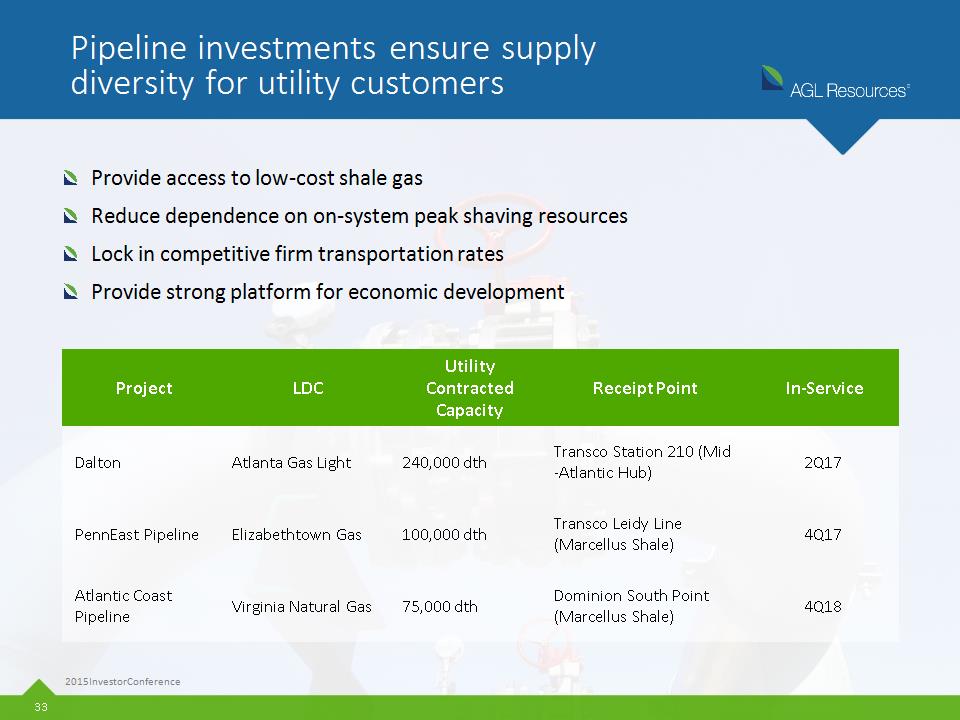
Provide access to low-cost shale gas Reduce dependence on on-system peak shaving resources Lock in competitive firm transportation rates Provide strong platform for economic development Pipeline investments ensure supply diversity for utility customers 2015 Investor Conference * Project LDC Utility Contracted Capacity Receipt Point In-Service Dalton Atlanta Gas Light 240,000 dth Transco Station 210 (Mid-Atlantic Hub) 2Q17 PennEast Pipeline Elizabethtown Gas 100,000 dth Transco Leidy Line (Marcellus Shale) 4Q17 Atlantic Coast Pipeline Virginia Natural Gas 75,000 dth Dominion South Point (Marcellus Shale) 4Q18

AMAs with Sequent (AGL Resources’ wholesale marketer) have resulted in over $270 million in gas cost savings for customers since 2001 In 2014, utility AMAs with Sequent delivered $47 million in benefits to AGL’s utilities Agreements in place for all AGL utilities with exception of Nicor Gas Asset management agreements deliver significant value to AGL utilities 2015 Investor Conference * Millions shared under Sequent Asset Management Agreements (AMAs) Millions shared under Sequent Asset Management Agreements (AMAs) Millions shared under Sequent Asset Management Agreements (AMAs) Utility Total Amount Received 2014 Total Amount Received Since 2001 Atlanta Gas Light $ 13 $ 92 Elizabethtown Gas $ 18 $ 73 Virginia Natural Gas $ 14 $ 69 Florida City Gas $ 1 $ 9 Chattanooga Gas $ 1 $ 29
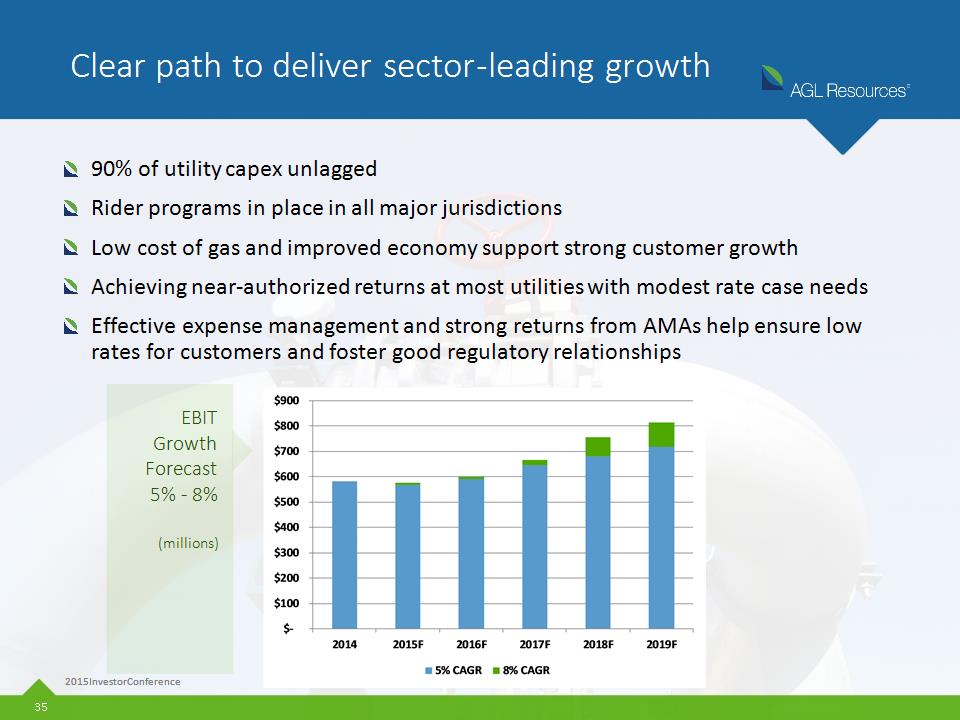
90% of utility capex unlagged Rider programs in place in all major jurisdictions Low cost of gas and improved economy support strong customer growth Achieving near-authorized returns at most utilities with modest rate case needs Effective expense management and strong returns from AMAs help ensure low rates for customers and foster good regulatory relationships Clear path to deliver sector-leading growth 2015 Investor Conference * 2015 Investor Conference EBIT Growth Forecast 5% - 8% (millions)

Retail Operations Drew Evans *

Leading provider of natural gas commodity and related services 2015 Investor Conference * SouthStar Provider of natural gas commodity to residential, commercial, industrial, CNG/LNG transportation fuel and power generation customers Pivotal Home Solutions Provider of warranty and leasing services for home appliances, pipes and wiring Both businesses focus on marketing energy products and services to retail customers and providing excellent customer service Total customer count of 1.4 million Total 2014 revenue of $994 million Total EBIT of $114M, net of minority interest Total deployed capital of $380 million

SouthStar operates in 11 states and behind 24 LDCs with varying degrees of deregulation Serves 650,000 customers (includes residential, commercial, industrial, CNG/LNG transportation fuel customers and power generators) Primary markets are in Georgia (fully deregulated) and Illinois Offers wide variety of pricing plans to meet customer needs Utilizes a local branding model 85% owned by AGL Resources, 15% owned by Piedmont Natural Gas SouthStar: Leverage experience managing large Georgia retail base across multiple states 2015 Investor Conference *

Pivotal Home Solutions operates in 14 states, primarily behind utility partners 1.2 million service contracts (700,000+ unique customers) Base of recurring revenue contracts include line protection, warranty, maintenance and leasing plans, with monthly charges ranging from $4 - $36 Wholly owned entity created by Nicor in 1992 Purchased NiSource’s service business for $120 million in 2013 with approximately 500,000 customer contracts Provides services behind 7 third party utilities Near-term focus on deploying business model behind AGL utilities Pivotal Home Solutions: Provides strong base of recurring contract revenue 2015 Investor Conference *

Manage retail businesses to deliver significant, stable earnings contribution 5-year expected EBIT CAGR of 4%-6% based on weather and MTM normalized 2014 EBIT of $116 million, net of minority interest Minimal investment required to generate strong returns Track record of delivering reliable growth through combination of organic opportunities and selective M&A Leader in Georgia since inception of market’s deregulation in 1998 2015 Investor Conference *

Deliver results via organic growth and accretive acquisitions 2015 Investor Conference * Notes: EBIT performance above represents earnings in each year, less minority interest. 2015F includes ~$10 million benefit related to significantly colder-than-normal weather through February 2015, as well as MTM hedge gains of ~$16 million related to 2014. Retail Operations EBIT, less minority interest (millions) Purchased Dynegy’s 20% equity interest Increased AGL’s earnings share to 75% from 70% Purchased additional 15% equity interest from Piedmont Nicor acquisition Acquired NiSource and Illinois retail businesses

While the Georgia market still drives segment performance, reliance on single market significantly reduced via Nicor acquisition in 2011 and acquisitions of retail commodity and services customers in 2013 M&A has driven gross margin diversification Substantial gross margin diversification over 2-year period 2015 Investor Conference * 2012 2014 Commodity - Georgia Commodity - Other Services - Illinois Services - Other

Organic growth and opportunistic M&A drive 4% - 6% CAGR forecast 2015 Investor Conference * Organic growth Opportunistic M&A could provide additional support Maintain strong margin contribution from Georgia and continued growth in Illinois and expanded markets Expect to triple energy margin contribution from expanded markets over 5-year period 475,000 potential service contract additions for Pivotal Home Solutions Significant addressable market expansion with affiliate utilities Additional opportunities in growing transportation fuels (CNG/LNG) market Track record of selective, opportunistic , and value-creating M&A has proven to be an effective strategy, resulting in significant economic and operating opportunities Successfully integrated acquisition of Illinois customers in 2013 Successfully integrated NiSource acquisition in 2013 Competitive M&A market, but opportunities exist
Midstream Operations Pete Tumminello *

Focused on high deliverability salt dome storage and depleted reservoir storage Storage facilities provide customers with firm, interruptible, wheeling, and park and loan services Customers include utilities, gas marketers and E&P companies Current operating facilities include: Jefferson Island Storage & Hub (7.3 Bcf) Golden Triangle Storage (13.5 Bcf) Central Valley Gas Storage (11 Bcf) Trussville LNG (60,000 gpd) Operating segment also includes Magnolia Pipeline, equity interest in Horizon Pipeline, renewable gas operations and select pipeline investments outside of state regulatory jurisdiction (Dalton Pipeline, PennEast Pipeline and Atlantic Coast Pipeline) Diverse set of storage and LNG assets 2015 Investor Conference * Central Valley Golden Triangle Storage and Hub Jefferson Island Storage and Hub Trussville LNG

Midstream results expected to improve as legacy contract roll-off cycle ends 2015 Investor Conference * Midstream Operations EBIT, excluding new pipeline investments (millions) *2013 excludes $8 million loss related to impairment of Sawgrass Storage project and 2014 excludes $10 million loss on a retained fuel true-up *2015 EBIT represents the mid-point of earnings guidance EBIT decline driven by roll-off of legacy storage contracts at above-market rates 5-year plan assumes EBIT contribution of $5 million - $10 million in 2019, excluding new pipeline investments

Storage market cycle showing signs of improvement 2004 to 2009 – Storage rates above $0.20/Dth/mo due to storage congestion, high commodity price, high volatility Low level of storage developments in previous years Increasing year-over-year production (post 2006) Reduced demand: warm winters (03/2004 – 06/2007), recession (2009) 2010 to 2013 – Storage rates fell below $0.05/Dth/mo in some cases due to oversupply, low commodity price, low volatility Significant increase in storage capacity and deliverability Large production increases Increasing demand: economic recovery, coal to gas switching, more normal winters 2014 to 2015 – Expect continuation of current fundamentals and storage values Strong weather-driven extrinsic values in 2014 Seeing signs of moderate storage rate recovery 2016 to 2020 Expectation – demand market, higher commodity price, slightly higher volatility Storage development flat to low Production increases expected to match demand increases Strong demand growth: LNG exports, industrial renaissance, power demand 2015 Investor Conference *
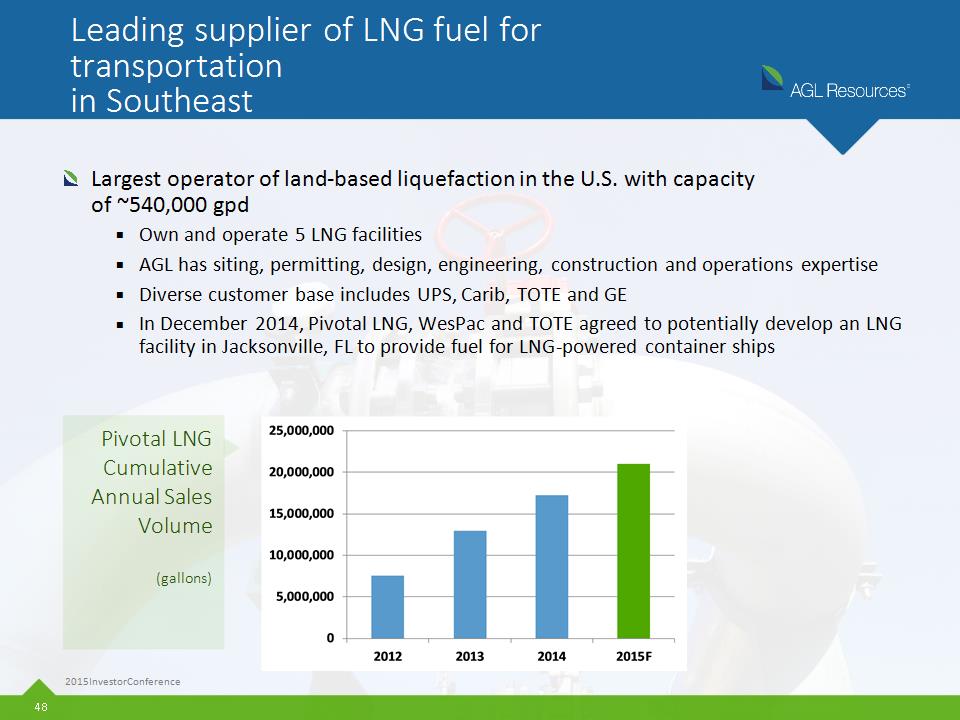
Leading supplier of LNG fuel for transportation in Southeast Largest operator of land-based liquefaction in the U.S. with capacity of ~540,000 gpd Own and operate 5 LNG facilities AGL has siting, permitting, design, engineering, construction and operations expertise Diverse customer base includes UPS, Carib, TOTE and GE In December 2014, Pivotal LNG, WesPac and TOTE agreed to potentially develop an LNG facility in Jacksonville, FL to provide fuel for LNG-powered container ships 2015 Investor Conference * Pivotal LNG Cumulative Annual Sales Volume (gallons)

LNG value proposition remains solid, even in lower-oil price environment 2015 Investor Conference *

Expect modest near-term improvement in midstream segment performance Expect segment EBIT of approximately $70 million – 6% of corporate total – by 2019 driven by: Completion of pipeline construction Modest recovery in storage rates Continued growth in LNG for transportation 2015 Investor Conference * Midstream EBIT Composition 2019F

Wholesale Services Pete Tumminello *

Wholesale services business provides option on volatility while enhancing utility operations Wholesale services business – Sequent – is a leading natural gas and logistics services business Base economic earnings forecast of $50 million annually, on average, with significant upside under high volatility market conditions Effective management and optimization of affiliate and third-party utility assets Diverse portfolio of transportation and storage assets, as well as fuel supply agreements Leading industry expertise in physical gas delivery and changing natural gas grid Top 10 natural gas physical provider and asset manager nationally Top gas provider for spot power generation fuel market 2015 Investor Conference *

Record 2014 results delivered significant value to utility customers and shareholders 2014 EBIT of $422 million and economic earnings of $277 million best in company’s 14 year history Results driven by pipeline transportation positions in the constrained Northeast and Midwest corridors related to significantly colder-than-normal weather and growing base of power generation customers $47 million returned to AGL Resources’ utilities in 2014 Strong cash generation helped to further strengthen corporate balance sheet 2015 Investor Conference * Wholesale EBIT and Economic Earnings (millions) Note: 2013 EBIT excludes gain on sale of Compass Energy. See the appendix to this presentation for a reconciliation to Economic Earnings.
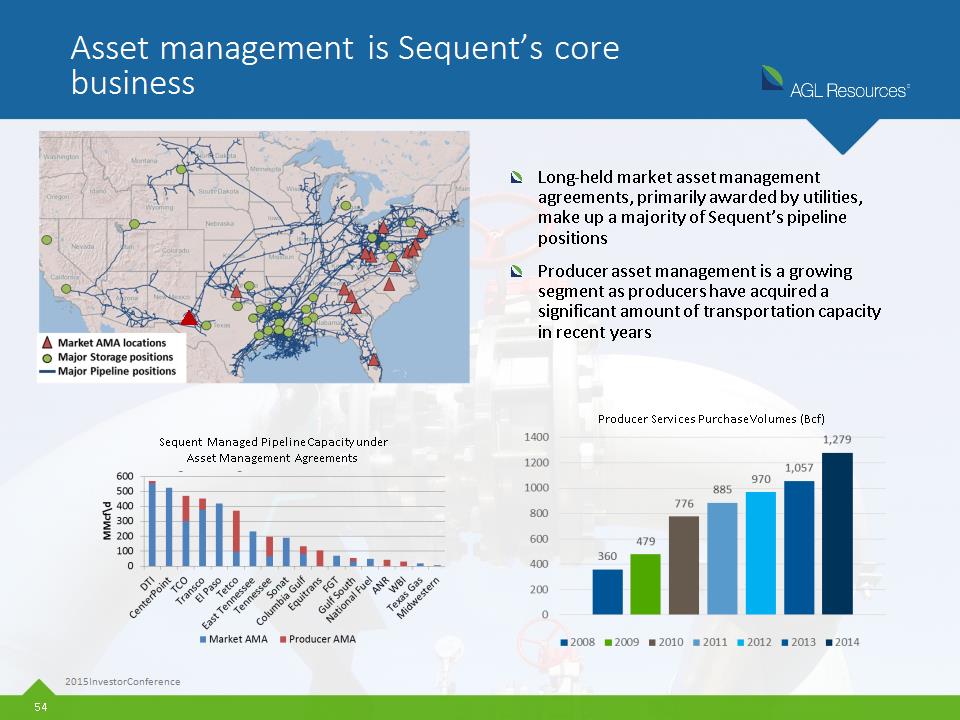
Asset management is Sequent’s core business Long-held market asset management agreements, primarily awarded by utilities, make up a majority of Sequent’s pipeline positions Producer asset management is a growing segment as producers have acquired a significant amount of transportation capacity in recent years 2015 Investor Conference * Sequent Managed Pipeline Capacity under Asset Management Agreements Producer Services Purchase Volumes (Bcf) ▲

Sequent supplies significant volumes to power generation market Gas demand for power generation in 2014 averaged slightly above 2013 Power generation is expected to be one of the primary drivers of natural gas demand Sequent actively pursuing natural gas generation customers, driving growth in power generation sales volumes 2015 Investor Conference * Gas for Power Generation Forecast Power plants Sequent serves as gas fuel manager Sequent Power Generation Sales Volumes (Bcf)

Sequent’s AMAs with AGL Resources’ utilities continue to generate strong customer benefits Affiliate asset management agreements “core” to Sequent’s business - $272 million of life-to-date sharing payments under the asset agreements 2015 Investor Conference * Pipeline Capacity (Dth\d) Primary Affiliate Sonat 191,000 AGL Transco 281,000 ETG, VNG Columbia Gas 184,000 VNG Dominion Transmission 347,000 VNG Texas Eastern 98,000 ETG

Wholesale services expects to deliver an average of $50M of economic earnings annually in 2015-2019 (normal volatility) 2015 Investor Conference * Business model proven successful under variety of market conditions, delivering significant earnings with closely managed downside risk Asset management agreements result in revenue sharing with customers including gas utilities, producers and power generators Shale production growth continues to create opportunities to capture constraint spreads Transport and storage portfolios aligned to capture changing flows and spreads -- Revolutionary natural gas market continues to provide opportunities for prudent and nimble marketers

Shale gas supply and related transportation continue to drive wholesale market prices in key markets 2015 Investor Conference * U.S. production is projected to increase 2.4 Bcf/day by 2018 with Northeast production supplying approximately 300% of this growth Growth in demand to be driven by LNG exports starting around 2016, steady industrial demand growth and gas-fired power generation demand Weak storage spreads last few years expected to modestly improve New pipelines constructed out of Marcellus/Utica expected to create downward pressure on New Jersey/Pennsylvania/Mid Atlantic price differentials to Henry Hub; Expect continued price spikes in constrained markets under severe weather conditions until material new pipelines are in service Anticipate growing volumes from Marcellus/Utica moving to Southeast, Midcontinent and Eastern Canada over time

Northeast U.S. – Basis Differentials 2015 Investor Conference * Source: Platts Material price volatility past three winters in key Northeast markets where Sequent has a large transportation portfolio Expect these price spikes to moderate as new pipelines are placed into service Ongoing price weakness in core Marcellus and Utica shale plays places a premium value on Sequent’s portfolio
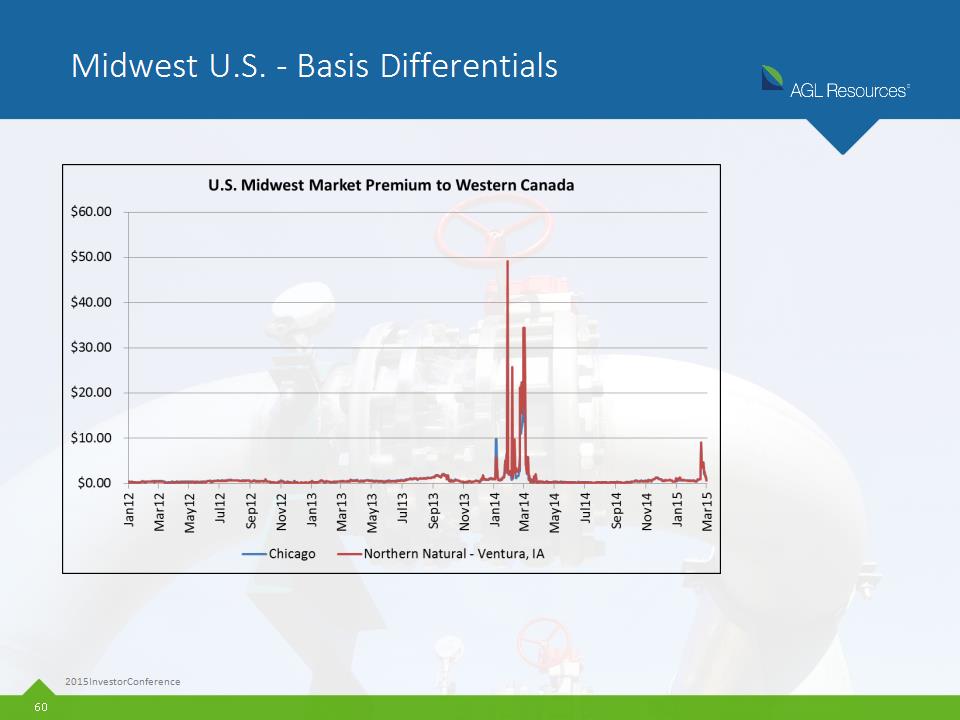
Midwest U.S. – Basis Differentials 2015 Investor Conference *
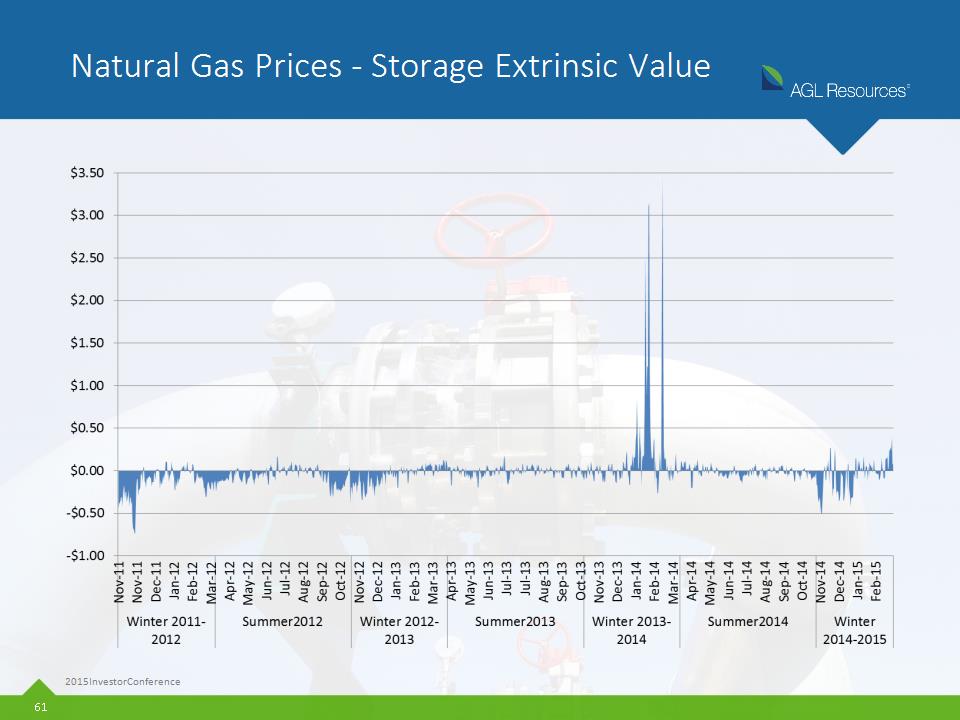
Natural Gas Prices – Storage Extrinsic Value 2015 Investor Conference *

Expected Impact of New Pipelines 2014-2015 2015 Investor Conference * 2014 Pipeline Additions 2015 Pipeline Additions Major Project TETCO TEAM 2014 (North Atlantic, Gulf Coast, and Midwest) TGP Backhaul (Gulf Coast) REX Seneca (Midwest) NET Mexico (Mexico) Virginia Southside (South Atlantic) Major Project TGP Broad Run Flexibility (Gulf Coast) TETCO OPEN (Gulf Coast) REX East to West (Midwest) TETCO Uniontown to Gas City (Midwest) Leidy Southeast (South Atlantic) TCO East Side Expansion (North Atlantic)

Expected Impact of New Pipelines 2016 - 2018 2015 Investor Conference * 2016 through 2018 Pipeline Additions Expect significant reduction in transportation values in some areas, particularly Northeast and Mid-Atlantic markets. Opportunity for significant producer asset management business and optimization value associated with major changes to U.S. natural gas grid. Year Major Projects 2016 ET Rover (Gulf Coast) NGPL Gulf Market Expansion Constitution (North Atlantic) 2017 REX Clarington West (Midwest) Nexus (Midwest) Prairie State (Midwest) Atlantic Sunrise (South Atlantic) Sabal Trail (South Atlantic) Col Gulf Rayne Xpress (Gulf Coast) PennEast Pipeline (North Atlantic) 2018 Atlantic Coast Pipeline (South Atlantic) Appalachia Connector (South Atlantic) TGP New England Direct (North Atlantic) TETCO Appalachia to Market (North Atlantic)
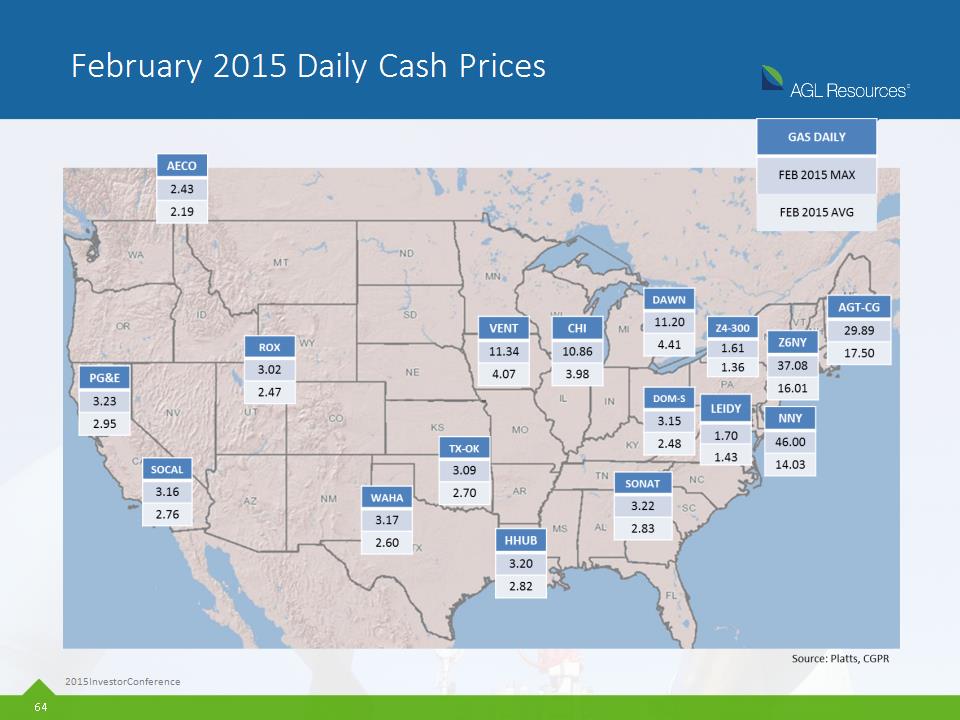
February 2015 Daily Cash Prices 2015 Investor Conference *
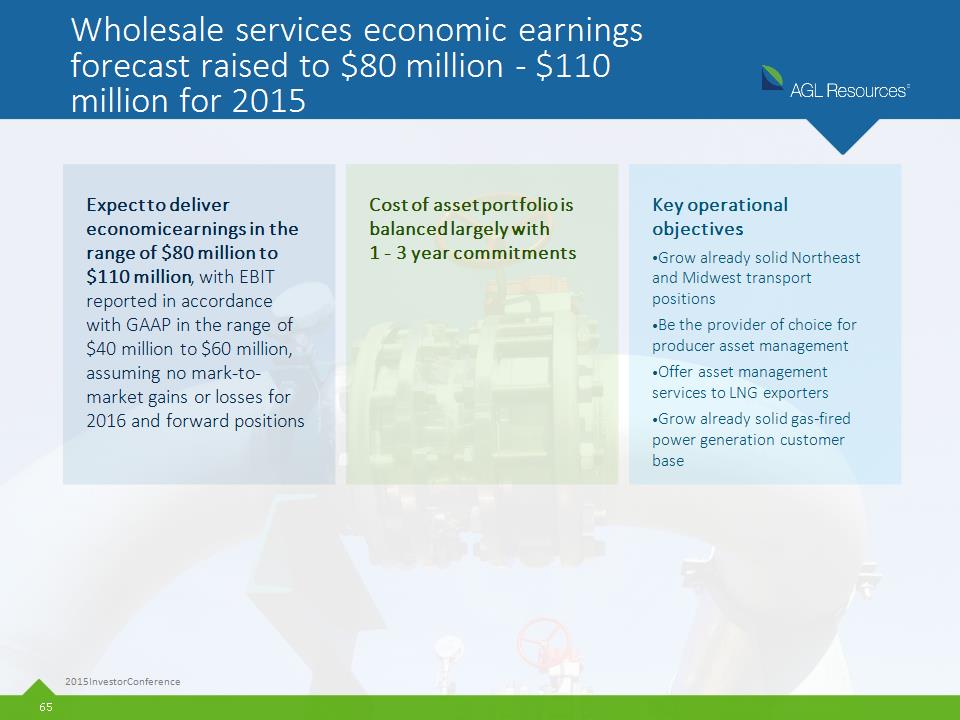
Wholesale services economic earnings forecast raised to $80 million - $110 million for 2015 2015 Investor Conference * Expect to deliver economic earnings in the range of $80 million to $110 million, with EBIT reported in accordance with GAAP in the range of $40 million to $60 million, assuming no mark-to-market gains or losses for 2016 and forward positions Cost of asset portfolio is balanced largely with 1 – 3 year commitments Key operational objectives: Grow already solid Northeast and Midwest transport positions Be the provider of choice for producer asset management Offer asset management services to LNG exporters Grow already solid gas-fired power generation customer base

Key Takeaways
Key Takeaways 2015 Investor Conference * Corporate strategy in place to generate predictable, attractive earnings stream Clear path to deliver 5-year EPS CAGR of 6%-9% EPS growth supported by well-defined capital expenditure plan Balance sheet supports capital expenditure plan with no equity issuance required Expect continued dividend growth

Q&A *

Appendix *

Reconciliation of 2014 results and 2015 expectations $2.70 Midpoint $2.75 Midpoint $2.80 Midpoint $2.93 Midpoint As a result of hedge accounting movements at wholesale services, we accelerated the reporting of $0.29 per share into 2014 that otherwise would have been reported in future periods (2015 and 2016) Further, mark-to-market accounting and LOCOM negatively impacted 2014 in the retail segment by $0.08 per share Adjusting for mark-to-market and inventory accounting in 2014, our core earnings results were within our revised guidance range Absent these timing issues, our original expected 2015 earnings would be approaching $3.00 per share, consistent with our original expectations * 2015 Investor Conference
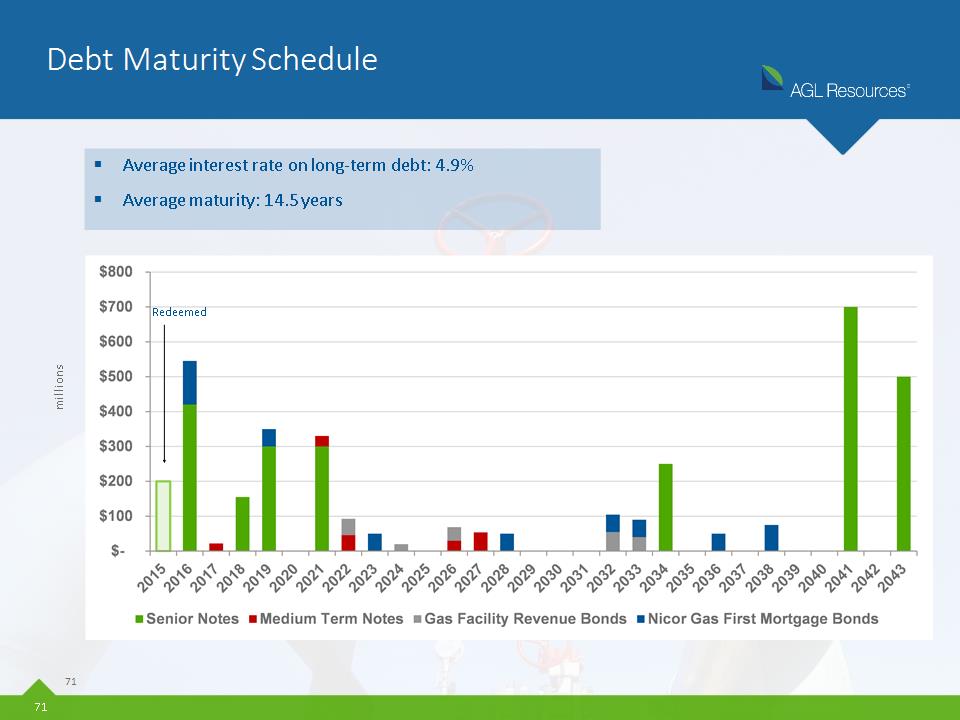
Debt Maturity Schedule Average interest rate on long-term debt: 4.9% Average maturity: 14.5 years millions * Redeemed *

Distribution 2014 to 2015F EBIT reconciliation Colder-than-normal weather benefited the distribution operations segment in 1Q15 Year-over-year EBIT increase of 4.7% on a weather-normalized basis Rate Base Growth ~5.2% 2015 Investor Conference * ~$5+ million weather benefit through Feb. 2015, net of expenses (1) Weather impact of $20 million; $5 million of synergy sharing in Georgia; $4 million of other one-time items.

Utility Rate Case History 2015 Investor Conference * Utility Last Rate Case Key Outcomes Nicor Gas March 2009 (Stay out ended December 2014) $80 million rate increase Bad debt rider approved in February 2010 providing recovery from (or credit to) customers for the difference between actual expense and $63 million benchmark Rate case reset heating degree days benchmark from 5,830 to 5,600 Atlanta Gas Light October 2010 $27 million rate increase approved Included ~$10 million in new customer service and safety programs Adopted new acquisition synergy sharing policy; upon approval will begin sharing $5 million annually with Georgia customers Virginia Natural Gas December 2011 $11 million increase in base rates Recovery of $3 million in costs previously recovered through base rates now recovered through PGA Approval to recover gas portion of bad debts through the PGA Elizabethtown Gas December 2009 $3 million rate increase New depreciation rates decreased expense $5 million Two-year rate freeze concluded in 2011 Rate case filing requirement by Sept. 2016 in conjunction with AIR approval Florida City Gas February 2004 $7 million rate increase Approval in late 2007 to include acquisition adjustment amortization expense in operating income and acquisition adjustment asset balance in rate base for regulatory surveillance reporting purposes Chattanooga Gas May 2010 Instituted new rate design that encourages customer conservation First decoupled rate design for TN utility New depreciation rates decreased expense by $2 million annually

Demonstrated track record of constructive regulatory and legislative outcomes 2015 Investor Conference * 2013 May 2013 VNG CARE program approved August 2013 ETG AIR approved Nicor depreciation study effective 2014 September 2013 ETG ENDURE filed 2015 2016 December 2013 AGL Synergies Sharing filed 2019 Rate Case Cycles begin in multiple jurisdictions Filing required at Elizabethtown Gas by September 2016 Additional jurisdictions TBD January 2015 Investing in Illinois program began December 2014 Nicor Rate freeze ended February 2015 AGL PRP true-up filed
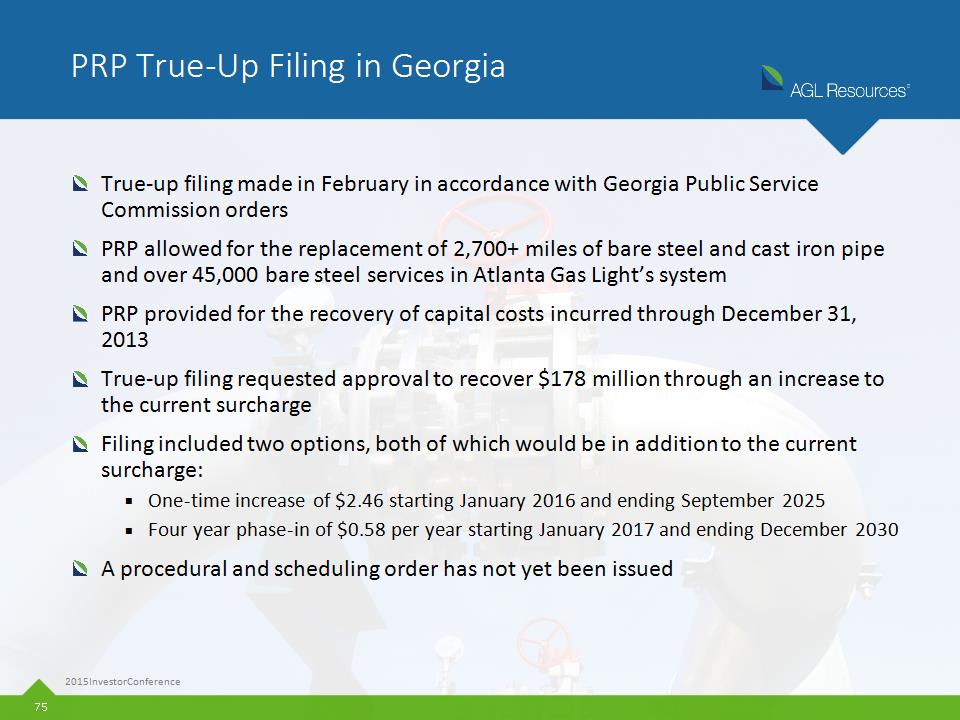
PRP True-Up Filing in Georgia 2015 Investor Conference * True-up filing made in February in accordance with Georgia Public Service Commission orders PRP allowed for the replacement of 2,700+ miles of bare steel and cast iron pipe and over 45,000 bare steel services in Atlanta Gas Light’s system PRP provided for the recovery of capital costs incurred through December 31, 2013 True-up filing requested approval to recover $178 million through an increase to the current surcharge Filing included two options, both of which would be in addition to the current surcharge: One-time increase of $2.46 starting January 2016 and ending September 2025 Four year phase-in of $0.58 per year starting January 2017 and ending December 2030 A procedural and scheduling order has not yet been issued
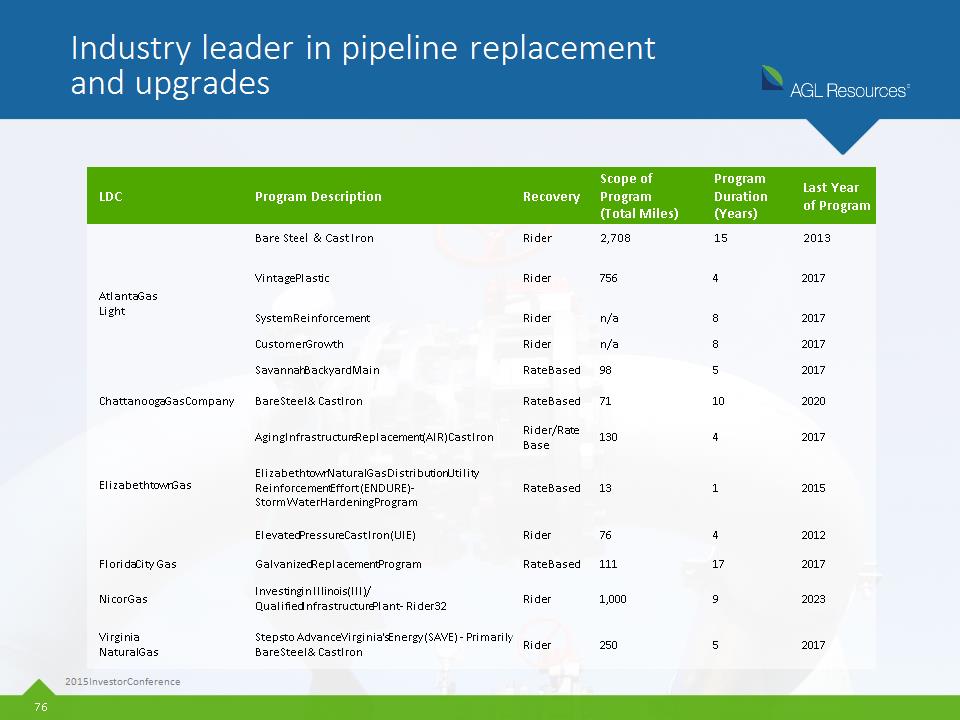
Industry leader in pipeline replacement and upgrades 2015 Investor Conference * LDC Program Description Recovery Scope of Program (Total Miles) Program Duration (Years) Last Year of Program Atlanta Gas Light Bare Steel & Cast Iron Rider 2,708 15 2013 Atlanta Gas Light Vintage Plastic Rider 756 4 2017 Atlanta Gas Light System Reinforcement Rider n/a 8 2017 Atlanta Gas Light Customer Growth Rider n/a 8 2017 Atlanta Gas Light Savannah Backyard Main Rate Based 98 5 2017 Chattanooga Gas Company Bare Steel & Cast Iron Rate Based 71 10 2020 Elizabethtown Gas Aging Infrastructure Replacement (AIR) Cast Iron Rider/Rate Base 130 4 2017 Elizabethtown Gas Elizabethtown Natural Gas Distribution Utility Reinforcement Effort (ENDURE) - Storm Water Hardening Program Rate Based 13 1 2015 Elizabethtown Gas Elevated Pressure Cast Iron (UIE) Rider 76 4 2012 Florida City Gas Galvanized Replacement Program Rate Based 111 17 2017 Nicor Gas Investing in Illinois (III) / Qualified Infrastructure Plant - Rider 32 Rider 1,000 9 2023 Virginia Natural Gas Steps to Advance Virginia's Energy (SAVE) - Primarily Bare Steel & Cast Iron Rider 250 5 2017

Utility Capital Expenditures Forecast 2015 Investor Conference * 2014 2015E 2016E 2017E 2018E 2019E Base Capex 557 550 600 600 600 600 Rider - Georgia 84 140 180 110 20 100 Rider - Virginia 24 25 25 25 25 25 Rider - Illinois 22 200 265 245 205 225 Rider - New Jersey 35 35 30 20 - - Total Rider Capex 165 400 500 400 250 350 Total Utility Capex 722 950 1,100 1,000 850 950

Focus: Nicor Gas Expect to add over 10,000 new meters in 2015, an 8% increase over 2014 Commercial customer growth driven by fast food restaurants, grocery chains, and big box stores, as well as natural gas for the farming market and industrial projects Residential customer growth driven by housing growth and extension into unserved territories 2015 Investor Conference * Rate Base (in thousands) $ 1,561,000 Customers 2,195,000 2014 New Meters 9,567 2015 (F) New Meters 10,345 (in millions) 2014 Cap Ex 2015 (F) Cap Ex Base $ 200.1 $ 157.3 New Business $ 32.6 $ 25.8 Riders – Investing in Illinois $ 21.8 $ 204.5

Focus: Atlanta Gas Light Expect to add nearly 15,000 new meters in 2015, a 7% increase from 2014 Commercial customer growth driven by new commercial construction and transitioning existing customers from interruptible to firm service Residential customer growth driven by new construction, particularly in Metro Atlanta Mid- to high-rise apartment construction accelerating; nearly 2,100 new units in with natural gas service 2014 2015 Investor Conference * (in millions) 2014 Cap Ex 2015 (F) Cap Ex Base $ 126.3 $ 138.9 New Business $ 25.8 $ 28.0 Riders $ 84.3 $ 150.7 Rider - iSRP $ 12.3 $ 72.9 Rider – iCGP $ 10.2 $ 15.5 Rider - iVPR $ 61.7 $ 61.5 Rate Base (in thousands) $ 2,315,000 Customers 1,560,000 2014 New Meters 13,961 2015 (F) New Meters 14,950

Focus: Virginia Natural Gas Expect to add more than 4,800 new meters in 2015, an increase of 20% increase year-over-year Emphasis on conversions which continues to be the main source of top line growth (45% increase year-over-year) With the increase in step down households coupled with the largest population segment of millennials, multifamily growth is a top priority 2015 Investor Conference * Rate Base (in thousands) $ 590,000 Customers 287,000 2014 New Meters 4,025 2015 (F) New Meters 4,839 (in millions) 2014 Cap Ex 2015 (F) Cap Ex Base $ 36.9 $ 23.8 New Business $ 10.2 $ 15.5 Riders - SAVE $ 23.9 $ 25.0
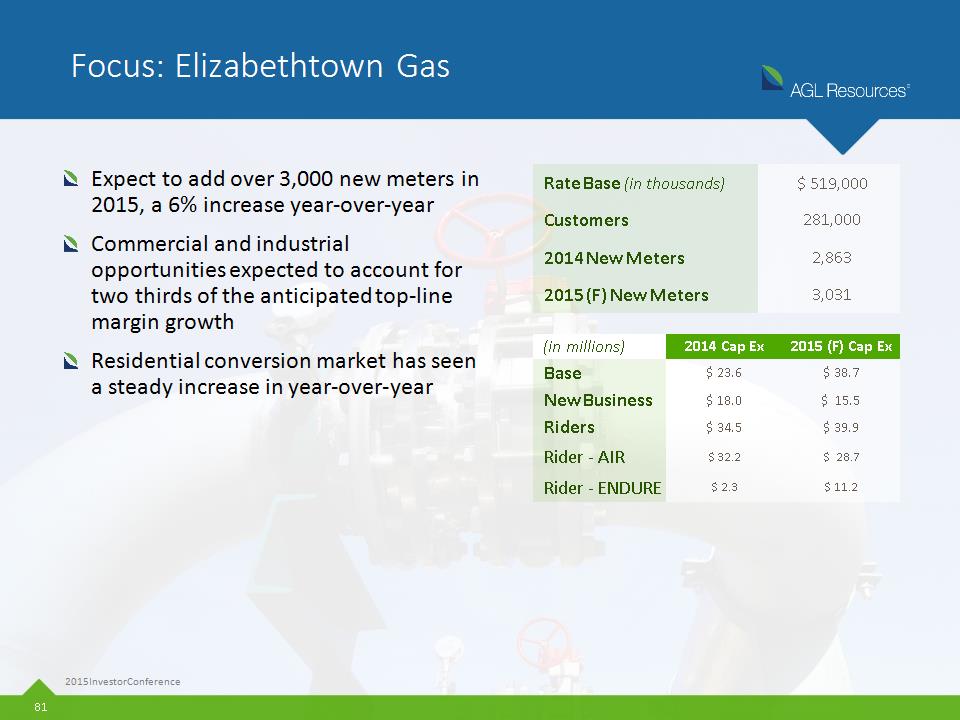
Focus: Elizabethtown Gas Expect to add over 3,000 new meters in 2015, a 6% increase year-over-year Commercial and industrial opportunities expected to account for two thirds of the anticipated top-line margin growth Residential conversion market has seen a steady increase in year-over-year 2015 Investor Conference * Rate Base (in thousands) $ 519,000 Customers 281,000 2014 New Meters 2,863 2015 (F) New Meters 3,031 (in millions) 2014 Cap Ex 2015 (F) Cap Ex Base $ 23.6 $ 38.7 New Business $ 18.0 $ 15.5 Riders $ 34.5 $ 39.9 Rider – AIR $ 32.2 $ 28.7 Rider – ENDURE $ 2.3 $ 11.2

Focus: Florida City Gas Expect to add more than 1,500 total meters in 2015, a 2% increase year-over-year Continue to be opportunistic around new construction, leveraging residential and commercial rebate programs to defray the up-front costs Anticipate the addition of Pivotal Home Solutions leasing programs being rolled out in 2015 to have a significant impact on retention, conversion and reactivation 2015 Investor Conference * Rate Base (in thousands) $ 182,000 Customers 105,000 2014 New Meters 1,499 2015 (F) New Meters 1,522 (in millions) 2014 Cap Ex 2015 (F) Cap Ex Base $ 12.4 $ 25.4 New Business $ 7.9 $ 8.4 Riders n/a n/a

Focus: Chattanooga Gas Expect to add nearly 740 new meters in 2015, in line with 2014 New residential construction expected to remain flat Enhanced focus on conversions near main, utilizing appliance rebate program and channel partner network 2015 Investor Conference * Rate Base (in thousands) $ 104,000 Customers 63,000 2014 New Meters 752 2015 (F) New Meters 737 (in millions) 2014 Cap Ex 2015 (F) Cap Ex Base $ 27.9 $ 13.4 New Business $ 1.3 $ 1.7 Riders n/a n/a

Focus: Elkton Gas Expect acceleration new construction, particularly in multi - family housing units 2015 Investor Conference * Rate Base (in thousands) $ 7,000 Customers 6,000 2014 New Meters 80 2015 (F) New Meters 45 (in millions) 2014 Cap Ex 2015 (F) Cap Ex Base $ 0.9 $ 1.4 New Business $ 0.2 $ 0.2 Riders n/a n/a

Pipeline investments of $655 million to drive enhanced earnings growth Dalton PennEast Atlantic Coast Total Project Cost Estimate $400 million $1.1 billion $4.7 billion AGL Resources Investment $200 million $220 million $235 million Capacity (Dtd) 448,000 1,000,000 1,500,000 % Contracted 100% 96% 93% Average Contract Tenor 25 years 14 years 20 years Length (miles) 106 108 550 Completion Est. 2Q17 4Q17 4Q18 Ownership 50% AGL; 50% Williams AGL, NJR, SJI and UGI each 20%; Spectra and PSEG each 10% Dominion 45%; Duke 40%; Piedmont 10%; AGL 5% Project Manager Williams UGI Dominion 2015 Investor Conference *

Current and forecasted contracted capacity rates 2015 Investor Conference * **Expiring and available capacity is expected to be contracted out on a firm basis or used for the provision of other storage services, depending on customer interest and market demand.

Wholesale Services - Economic Earnings Economic earnings adjusts wholesale services’ EBIT by adjusting for mark-to-market accounting recorded during the current period, offset by mark-to-market accounting adjustments reported in prior periods related to Sequent’s natural gas transportation portfolio. Economic earnings further reflect the changes in wholesale services’ storage roll-out value. 2015 Investor Conference * in millions 2015(F) 2014 2013 2012 2011 2010 2009 2008 2007 2006 2005 Wholesale services EBIT reported on a GAAP basis $50 $422 $(14) $(3) $5 $49 $47 $60 $34 $90 $49 Current and prior year realized storage roll-out value, net 10 – 20 (31) 1 24 (13) (14) 30 (11) (7) 2 15 Current transportation hedge movement, net of prior hedge offset* 20 – 30 (106) 83 20 24 12 (48) 7 19 (17) 4 Deferred Incentive Compensation 5 (8) - - - - - - - - - Economic Earnings $95 $277 $70 $41 $16 $47 $29 $56 $46 $75 $68 As of December 31, 2014, remaining prior period mark-to-market gains to offset in future annual periods are $11M in 2015 and $15M in 2016+ 2013 excludes $11M gain on sale of Compass Energy in May 2013 and 2014 includes a $3M payment related to the settlement of an earn-out provision from the sale For 2015, assumes no hedge gains and losses on 2016 and forward positions. Further, GAAP and economic EBIT represent the midpoint of updated guidance.

Reconciliation to 2014 Normalized EPS 2015 Investor Conference *

Reconciliation to Adjusted EPS 2015 Investor Conference *
Serious News for Serious Traders! Try StreetInsider.com Premium Free!
You May Also Be Interested In
- PPG Board of Directors announce quarterly dividend of 65 cents per share
- Pharming Group announces the placement of €100 million convertible bonds due 2029
- Consilience.ai Unveils AlphaIQ Platform for Instant and Verifiable Insights for Financial Analysis
Create E-mail Alert Related Categories
SEC FilingsSign up for StreetInsider Free!
Receive full access to all new and archived articles, unlimited portfolio tracking, e-mail alerts, custom newswires and RSS feeds - and more!
