

Form 8-K AECOM For: Sep 10
 Tweet
Tweet Share
Share
UNITED STATES
SECURITIES AND EXCHANGE COMMISSION
Washington, D.C. 20549
_________________
FORM 8-K
CURRENT REPORT
PURSUANT TO SECTION 13 OR 15(d) OF THE
SECURITIES EXCHANGE ACT OF 1934
Date of Report (Date of earliest event reported): September 10, 2015
AECOM
(Exact name of Registrant as specified in its charter)
|
Delaware |
|
0-52423 |
|
61-1088522 |
|
(State or Other Jurisdiction |
|
(Commission |
|
(I.R.S. Employer |
|
of Incorporation) |
|
File Number) |
|
Identification No.) |
1999 Avenue of the Stars, Suite 2600
Los Angeles, California 90067
(Address of Principal Executive Offices, including Zip Code)
Registrant’s telephone number, including area code (213) 593-8000
Not Applicable
(Former Name or Former Address, if Changed Since Last Report)
Check the appropriate box below if the Form 8-K filing is intended to simultaneously satisfy the filing obligation of the registrant under any of the following provisions (see General Instruction A.2. below):
[ ] Written communications pursuant to Rule 425 under the Securities Act (17 CFR 230.425)
[ ] Soliciting material pursuant to Rule 14a-12 under the Exchange Act (17 CFR 240.14a-12)
[ ] Pre-commencement communications pursuant to Rule 14d-(b) under the Exchange Act (17 CFR 240.14d-2(b))
[ ] Pre-commencement communications pursuant to Rule 13e-4(c) under the Exchange Act (17 CFR 240.13e-4(c))
Item 7.01. Regulation FD Disclosure.
A copy of materials that will be used in investor meetings beginning September 10, 2015 is attached to this Current Report on Form 8-K as Exhibit 99.1. These materials are dated September 10, 2015 and the Company disclaims any obligation to correct or update these materials in the future.
The information contained in this Current Report Form 8-K that is furnished under this Item 7.01 is being furnished pursuant to Item 7.01 of Form 8-K and shall not be deemed to be “filed” for purposes of Section 18 of the Securities Exchange Act of 1934, as amended.
Item 9.01 Financial Statements and Exhibits.
(d) Exhibits
99.1 Investor Presentation dated September 10, 2015.
SIGNATURES
Pursuant to the requirements of the Securities Exchange Act of 1934, the Registrant has duly caused this report to be signed on its behalf by the undersigned thereto duly authorized.
|
|
AECOM | |
|
|
| |
|
|
| |
|
Dated: September 10, 2015 |
By: |
/s/ DAVID Y. GAN |
|
|
|
David Y. Gan |
|
|
|
Senior Vice President, Assistant General Counsel |
EXHIBIT INDEX
|
Exhibit |
|
|
|
|
|
|
|
99.1 |
|
Investor Presentation dated September 10, 2015. |
Exhibit 99.1


Safe Harbor
Except for historical information contained herein, this presentation contains “forward-looking statements.” All statements other than statements of historical fact are “forward-looking statements” for purposes of federal and state securities laws, including any projections of earnings, revenue, cash flows, tax rate, share count, amortization, acquisition and integration costs, or other financial items; any statements of the plans, strategies and objectives for future operations; any statements regarding future economic conditions or performance; any statements of belief; and any statements of assumptions underlying any of the foregoing. Forward-looking statements may include the words “may,” “will,” “estimate,” “intend,” “continue,” “believe,” “expect” or “anticipate” and other similar words.
Although we believe that the expectations reflected in any of our forward-looking statements are reasonable, actual results could differ materially from those projected or assumed in any of our forward-looking statements. Our future financial condition and results of operations, as well as any forward-looking statements, are subject to change and to inherent risks and uncertainties, such as those disclosed in this presentation. Important factors that could cause our actual results, performance and achievements, or industry results to differ materially from estimates or projections contained in forward-looking statements include, among others, the following:
· demand for our services is cyclical;
· uncertainties related to government contract appropriations;
· governmental agencies may modify, curtail or terminate our contracts;
· government contracts are subject to audits and adjustments of contractual terms;
· losses under fixed-price contracts;
· limited control over operations run through our joint venture entities;
· misconduct by our employees or consultants or our failure to comply with laws or regulations applicable to our business;
· our leveraged position and ability to service our debt;
· exposure to legal, political and economic risks in different countries as well as currency exchange rate fluctuations;
· the failure to retain and recruit key technical and management personnel;
· our insurance policies may not provide adequate coverage;
· unexpected adjustments and cancellations related to our backlog;
· dependence on third party contractors who fail to satisfy their obligations;
· systems and information technology interruption; and
· changing client preferences/demands, fiscal positions and payment patterns.
Additional factors that could cause actual results to differ materially from our forward-looking statements are set forth in our Quarterly Report on Form 10-Q for the period ended June 30, 2015, and our other filings with the Securities and Exchange Commission. We do not intend, and undertake no obligation, to update any forward-looking statement.
Non-GAAP Measures
Certain measures contained in this presentation are not calculated in accordance with generally accepted accounting principles (GAAP) and should not be considered a replacement for GAAP results. Non-GAAP financial measures appearing in the presentation are identified in the footnotes. A reconciliation of these non-GAAP measures to the most directly comparable GAAP financial measures is found in the attached appendix and in our 2015 third-quarter earnings release on the Investors section of our Web site at: http://investors.aecom.com.
![]()


|
Vision: Become the world’s leading fully integrated infrastructure firm.
· Leading provider of infrastructure services with skillsets enhanced through the URS combination.
· Services span the life-cycle of a project from conception and financing through design, construction, and management services.
· Global footprint to deliver services to our 25,000 clients and support multinational clients anywhere in the world.
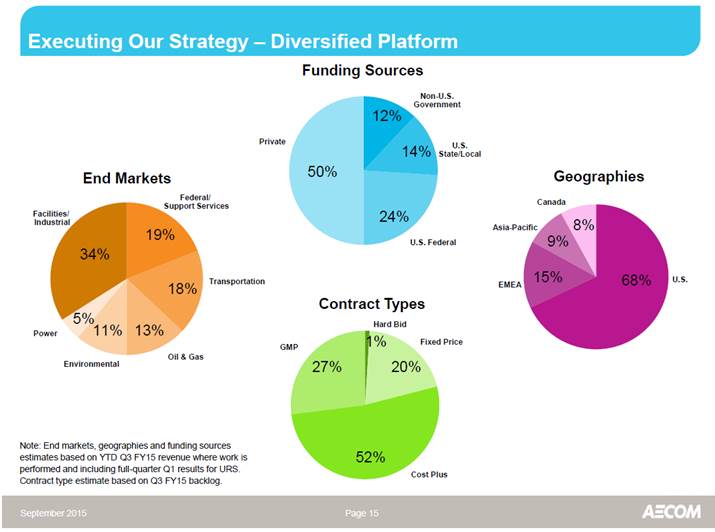
· Lower-risk contract mix and widely diversified end-market exposure lowers earnings volatility and produces consistent cash flow.
· Proven track record of disciplined capital allocation priorities. |
|
|

![]()

|
Free cash flow generation and debt reduction on track. – Generated $150 million of free cash flow1 in Q3 FY15. – YTD FY15, generated $427 million of free cash flow and reduced debt by more than $550 million2.
Q3 FY15 positive organic growth. – Delivered 7% organic revenue growth at constant currency3 led by Construction Services (+54%).
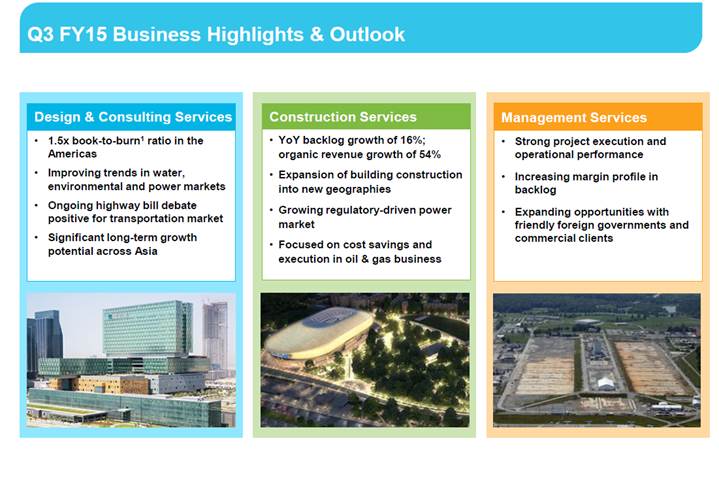
Americas Design recovery progressing. – 1.5x book-to-burn ratio4 in Q3 FY15. – Contracted backlog increased sequentially. – End-market trends remain supportive of a continued recovery.
Private sector construction remains strong. – Organic building construction backlog increased 16% YoY. – Energy, industrial and power backlog increased sequentially.
Federal diversification continued. – Improving mix to higher-margin cybersecurity, intelligence, surveillance and commercial opportunities. – $5.8 billion of bids under evaluation by customers, a sequential increase from $5.2 billion. |
|
|
1 Free cash flow is defined as cash flow from operations less capital expenditures net of proceeds from disposals. 2 Subsequent to the close of the URS Corporation transaction. 3 Results expressed in constant currency are presented excluding the impact from changes in currency-exchange rates. 4 Book-to-burn ratio is defined as the amount of new business divided by the revenue recognized during the period.
![]()

We are executing against our plan to deliver synergies, leverage growth opportunities, and reduce our debt.
Expect to exit FY16 at a $275-million synergy run rate.
|
- Exited 3Q FY15 at a $145-million run rate.
- Completed 153 office consolidations, resulting in 2.2 million square feet of reduced space.
- Consolidated ERP systems for both Americas Design, Management Services and Corporate.
- Making progress on labor, non-labor, and real estate savings.
- Attractive financial returns on cash outlays to achieve synergies.
- Expect to deliver $110 million of gross synergy savings in FY15.
Pursuing substantial growth opportunities.
- Expanded private-sector offering.
- Enhanced capabilities to leverage global platform. |
|
|

![]()

YTD FY15 Highlights
· Closed financing of URS transaction.
· Generated $427 million of FCF1.
· Repaid over $550 million in debt subsequent to closing the URS transaction in October.
FY12-YTD FY15 Highlights
· Repurchased $660 million of stock.
· Cumulative FCF1 of $1.5 billion; exceeded net income.
Capital Allocation Priorities
· Expect to generate $600-$800 million of FCF1/year from FY15 to FY17.
· Ability to achieve approximately 2x debt to EBITDA2 by FY17; maintaining flexibility to respond to changes in financial market conditions.
1 Free cash flow is defined as cash flow from operations less capital expenditures net of proceeds from disposals, and excludes goodwill impairment charges and is a non-GAAP measure. 2 EBITDA is a non-GAAP measure.
![]()

· Adjusted EPS1 guidance of $3.05 to $3.45
· Prior EPS guidance modified due to lower estimates of non-cash normal profit.
· Operating performance consistent with prior outlook.
· The net impact of normal margin is now expected to be $0.19 vs. our prior full-year estimate of $0.30.
· Other Metrics
· Effective adjusted tax rate2 of approximately 30%.
· FY15 share count of approximately 151 million.
· 50 weeks of URS contribution.
· Approximately $200 million in depreciation expense.
· Approximately $390 million of amortization of intangible assets4.
· Approximately $220 million in interest expense.
· Capital expenditures3 of approximately $110 million.
· Approximately $400 million of acquisition and integration-related expenses.
· Approximately $110 million of gross synergies to be realized in FY15.
1 Adjusted EPS excludes acquisition and integration-related expenses, financing charges in interest expense, and the amortization of intangible assets. 2 Inclusive of non-controlling interest deduction and adjusted for acquisition and integration expenses, financing charges in interest expense, the amortization of intangible assets, and unusual discrete items. 3 Capital expenditures, net of proceeds from disposals. 4 Amortization of intangible assets expense includes the impact of amortization included in equity in earnings of joint ventures and non-controlling interests.
![]()

AECOM holds the leading position in several market categories.
|
· An estimated $3.6 trillion1 is needed to maintain domestic infrastructure.
· Congress working towards a funding solution to support a multi-year highway authorization.
· Power and chemical opportunities increasing due to lower energy prices.
· Private spending improving; still below prior peak levels.
· AECOM holds a top ranking2 in key markets:
- #1 Transportation - #1 General Building - #1 Hazardous Waste - #2 Power - #2 Water - #2 Sewer and Waste - #3 Manufacturing - #3 Industrial Process |
|
|

1 Per American Society of Civil Engineers. 2 Per Engineering News-Record.
![]()

|
#1 ranked design firm and #1 designer in international markets1.
· Strengthened competitive position in the Americas.
– Concentrated in regions with strong funding (e.g., New York, Los Angeles, and Miami).
– Enhanced capabilities in late-cycle markets that benefit from improving economic trends.
· Public sector market outlook.
– Increasing opportunities in core civil infrastructure market.
– Longer-term P3 market opportunity is promising.
· Improving pipeline of opportunities.
– Increased private-sector spend in industrial, freight, power, environmental and water.
– Emerging markets continue to develop new infrastructure.
– Strong outlook for infrastructure spending in Southeast Asia where multilateral funding opportunities are growing. |
|
|

1 Per Engineering News-Record.
![]()

|
Leading vertical construction platform enhanced with the addition of legacy URS oil & gas and energy, industrial and power businesses.
· Built on a heritage of delivering large, complex, and often unique projects.
· Managing the business to respond to commodity price volatility.
· Focused on risk management and execution excellence across Energy, Infrastructure and Industrial Construction businesses.
· Opportunities to leverage our leading design capabilities into DBFO roles. |
|
|

![]()
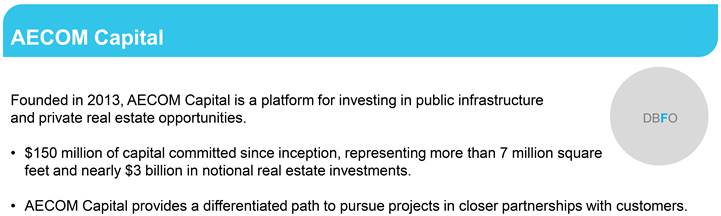
Targeting at least 20% IRR on real estate investments


|
Management Services (MS) extends AECOM’s integrated model beyond design and construction through life-cycle management and support for government and commercial clients.
· Expanded federal capabilities. · Minimal overlap with legacy URS federal services. · AECOM’s diversification strategy accelerated by leading DOE, DOD, and intelligence capabilities.
· Long-term growth driven by leveraging MS site management strength into commercial operations and maintenance opportunities across AECOM’s global platform.
· Leading nuclear remediation capabilities provide a strong resume for global nuclear decommissioning and decontamination work.
· Recent wins and $5.8 billion of bids under evaluation by our clients provide a strong backdrop for the combined enterprise.
|
|


![]()
1 Book-to-burn ratio is defined as the amount of new business divided by the revenue recognized during the period.
![]()

|
|
|
Three Months Ended |
|
Nine Months Ended |
| |||||||||||
|
|
|
Jun 30, |
|
Mar 31, |
|
Jun 30, |
|
Jun 30, |
|
Jun 30, |
| |||||
|
(in millions, except per share data) |
|
2014 |
|
2015 |
|
2015 |
|
2014 |
|
2015 |
| |||||
|
|
|
|
|
|
|
|
|
|
|
|
| |||||
|
Income from operations |
|
$ |
91.6 |
|
$ |
6.5 |
|
$ |
41.3 |
|
$ |
250.4 |
|
$ |
33.6 |
|
|
Acquisition and integration expenses |
|
7.8 |
|
91.6 |
|
88.5 |
|
7.8 |
|
318.6 |
| |||||
|
Amortization of intangible assets |
|
5.9 |
|
111.7 |
|
94.1 |
|
17.4 |
|
320.0 |
| |||||
|
Adjusted income from operations |
|
$ |
105.3 |
|
$ |
209.8 |
|
$ |
223.9 |
|
$ |
275.6 |
|
$ |
672.2 |
|
|
|
|
|
|
|
|
|
|
|
|
|
| |||||
|
Income (loss) before income tax expense |
|
$ |
82.8 |
|
$ |
(55.2 |
) |
$ |
(8.7 |
) |
$ |
220.5 |
|
$ |
(194.2 |
) |
|
Acquisition and integration expenses |
|
7.8 |
|
91.6 |
|
88.5 |
|
7.8 |
|
318.6 |
| |||||
|
Amortization of intangible assets |
|
5.9 |
|
111.7 |
|
94.1 |
|
17.4 |
|
320.0 |
| |||||
|
Financing charges in interest expense |
|
- |
|
4.0 |
|
3.9 |
|
- |
|
75.9 |
| |||||
|
Adjusted income before income tax expense |
|
$ |
96.5 |
|
$ |
152.1 |
|
$ |
177.8 |
|
$ |
245.7 |
|
$ |
520.3 |
|
|
|
|
|
|
|
|
|
|
|
|
|
| |||||
|
Income tax expense (benefit) |
|
$ |
13.8 |
|
$ |
(75.8 |
) |
$ |
(8.5 |
) |
$ |
52.5 |
|
$ |
(96.5 |
) |
|
Tax effect of the above adjustments |
|
4.0 |
|
112.7 |
|
50.3 |
|
7.3 |
|
221.9 |
| |||||
|
Adjusted income tax expense |
|
$ |
17.8 |
|
$ |
36.9 |
|
$ |
41.8 |
|
$ |
59.8 |
|
$ |
125.4 |
|
|
|
|
|
|
|
|
|
|
|
|
|
| |||||
|
Noncontrolling interests in income of consolidated subsidiaries, net of tax |
|
$ |
0.2 |
|
$ |
(20.4 |
) |
$ |
(16.9 |
) |
$ |
(2.2 |
) |
$ |
(58.2 |
) |
|
Amortization of intangible assets included in NCI, net of tax |
|
(0.8 |
) |
(5.6 |
) |
(5.6 |
) |
(1.6 |
) |
(18.6 |
) | |||||
|
Adjusted noncontrolling interests in income of consolidated subsidiaries, net of tax |
|
$ |
(0.6 |
) |
$ |
(26.0 |
) |
$ |
(22.5 |
) |
$ |
(3.8 |
) |
$ |
(76.8 |
) |
|
|
|
|
|
|
|
|
|
|
|
|
| |||||
|
Net income (loss) attributable to AECOM |
|
$ |
69.2 |
|
$ |
0.2 |
|
$ |
(17.1 |
) |
$ |
165.8 |
|
$ |
(155.9 |
) |
|
Acquisition and integration expenses |
|
7.8 |
|
91.6 |
|
88.5 |
|
7.8 |
|
318.6 |
| |||||
|
Amortization of intangible assets |
|
5.9 |
|
111.7 |
|
94.1 |
|
17.4 |
|
320.0 |
| |||||
|
Financing charges in interest expense |
|
- |
|
4.0 |
|
3.9 |
|
- |
|
75.9 |
| |||||
|
Tax effect of the above adjustments |
|
(4.0 |
) |
(112.7 |
) |
(50.3 |
) |
(7.3 |
) |
(221.9 |
) | |||||
|
Amortization of intangible assets included in NCI, net of tax |
|
(0.8 |
) |
(5.6 |
) |
(5.6 |
) |
(1.6 |
) |
(18.6 |
) | |||||
|
Adjusted net income attributable to AECOM |
|
$ |
78.1 |
|
$ |
89.2 |
|
$ |
113.5 |
|
$ |
182.1 |
|
$ |
318.1 |
|
|
|
|
|
|
|
|
|
|
|
|
|
| |||||
|
Net income (loss) attributable to AECOM – per diluted share |
|
$ |
0.70 |
|
$ |
- |
|
$ |
(0.11 |
) |
$ |
1.69 |
|
$ |
(1.05 |
) |
|
Per diluted share adjustments: |
|
|
|
|
|
|
|
|
|
|
| |||||
|
Acquisition and integration expenses |
|
0.08 |
|
0.60 |
|
0.58 |
|
0.08 |
|
2.12 |
| |||||
|
Amortization of intangible assets |
|
0.06 |
|
0.73 |
|
0.61 |
|
0.18 |
|
2.13 |
| |||||
|
Financing charges in interest expense |
|
- |
|
0.03 |
|
0.03 |
|
- |
|
0.52 |
| |||||
|
Tax effect of the above adjustments |
|
(0.04 |
) |
(0.74 |
) |
(0.33 |
) |
(0.08 |
) |
(1.48 |
) | |||||
|
Amortization of intangible assets included in NCI, net of tax |
|
(0.01 |
) |
(0.04 |
) |
(0.04 |
) |
(0.02 |
) |
(0.12 |
) | |||||
|
Adjusted net income attributable to AECOM – per diluted share |
|
$ |
0.79 |
|
$ |
0.58 |
|
$ |
0.74 |
|
$ |
1.85 |
|
$ |
2.12 |
|
![]()

|
(in millions, except per share data) |
|
Three Months Ended |
|
Nine Months Ended |
| |||||||||||
|
|
|
Jun 30, |
|
Mar 31, |
|
Jun 30, |
|
Jun 30, |
|
Jun 30, |
| |||||
|
|
|
2014 |
|
2015 |
|
2015 |
|
2014 |
|
2015 |
| |||||
|
|
|
|
|
|
|
|
|
|
|
|
| |||||
|
EBITDA |
|
$ |
11.9 |
|
$ |
143.4 |
|
$ |
167.7 |
|
$ |
212.4 |
|
$ |
427.9 |
|
|
Acquisition and integration expenses |
|
111.8 |
|
91.6 |
|
88.5 |
|
111.8 |
|
318.6 |
| |||||
|
Depreciation expense included in acquisition and integration expense line above |
|
- |
|
(8.3 |
) |
(6.0 |
) |
- |
|
(14.3 |
) | |||||
|
Adjusted EBITDA |
|
$ |
123.7 |
|
$ |
226.7 |
|
$ |
250.2 |
|
$ |
324.2 |
|
$ |
732.2 |
|
|
|
|
|
|
|
|
|
|
|
|
|
| |||||
|
Design & Consulting Services Segment: |
|
|
|
|
|
|
|
|
|
|
| |||||
|
Income from operations |
|
$ |
93.7 |
|
$ |
51.6 |
|
$ |
104.1 |
|
$ |
256.4 |
|
$ |
203.5 |
|
|
Amortization of intangible assets |
|
4.6 |
|
56.6 |
|
40.9 |
|
13.1 |
|
147.4 |
| |||||
|
Adjusted income from operations |
|
$ |
98.3 |
|
$ |
108.2 |
|
$ |
145.0 |
|
$ |
269.5 |
|
$ |
350.9 |
|
|
|
|
|
|
|
|
|
|
|
|
|
| |||||
|
Construction Services Segment: |
|
|
|
|
|
|
|
|
|
|
| |||||
|
Income (loss) from operations |
|
$ |
5.6 |
|
$ |
7.2 |
|
$ |
(4.0 |
) |
$ |
18.8 |
|
$ |
44.4 |
|
|
Amortization of intangible assets |
|
0.8 |
|
19.0 |
|
14.8 |
|
2.4 |
|
65.7 |
| |||||
|
Adjusted income from operations |
|
$ |
6.4 |
|
$ |
26.2 |
|
$ |
10.8 |
|
$ |
21.2 |
|
$ |
110.1 |
|
|
|
|
|
|
|
|
|
|
|
|
|
| |||||
|
Management Services Segment: |
|
|
|
|
|
|
|
|
|
|
| |||||
|
Income from operations |
|
$ |
15.1 |
|
$ |
69.2 |
|
$ |
54.2 |
|
$ |
48.4 |
|
$ |
193.0 |
|
|
Amortization of intangible assets |
|
0.6 |
|
36.1 |
|
38.4 |
|
1.9 |
|
106.9 |
| |||||
|
Adjusted income from operations |
|
$ |
15.7 |
|
$ |
105.3 |
|
$ |
92.6 |
|
$ |
50.3 |
|
$ |
299.9 |
|
![]()


![]()
Serious News for Serious Traders! Try StreetInsider.com Premium Free!
You May Also Be Interested In
- AECOM Technology (ACM) PT Raised to $105 at KeyBanc
- AECOM announces planned dates for second quarter fiscal 2024 earnings results and conference call
- Wright Electric Announces First Steps of Electric Propulsion Testing
Create E-mail Alert Related Categories
SEC FilingsSign up for StreetInsider Free!
Receive full access to all new and archived articles, unlimited portfolio tracking, e-mail alerts, custom newswires and RSS feeds - and more!
