

Form 8-K ADVANCED DRAINAGE SYSTEM For: Jun 03
 Tweet
Tweet Share
Share
UNITED STATES
SECURITIES AND EXCHANGE COMMISSION
Washington, D.C. 20549
FORM 8-K
CURRENT REPORT
Pursuant to Section 13 or 15(d)
of the Securities Exchange Act of 1934
Date of Report (Date of earliest event reported): June 3, 2015
Advanced Drainage Systems, Inc.
(Exact name of registrant as specified in its charter)
| Delaware | 001-36557 | 51-0105665 | ||
| (State or other Jurisdiction of Incorporation) |
(Commission File Number) |
(IRS Employer Identification No.) |
| 4640 Trueman Boulevard, Hilliard, Ohio 43026 |
43026 | |
| (Address of Principal Executive Offices) | (Zip Code) |
Registrant’s telephone number, including area code: (614) 658-0050
(Former name or former address if changed since last report.)
Check the appropriate box below if the Form 8-K filing is intended to simultaneously satisfy the filing obligation of the registrant under any of the following provisions:
| ¨ | Written communications pursuant to Rule 425 under the Securities Act (17 CFR 230.425) |
| ¨ | Soliciting material pursuant to Rule 14a-12 under the Exchange Act (17 CFR 240.14a-12) |
| ¨ | Pre-commencement communications pursuant to Rule 14d-2(b) under the Exchange Act (17 CFR 240.14d-2(b)) |
| ¨ | Pre-commencement communications pursuant to Rule 13e-4(c) under the Exchange Act (17 CFR 240.13e-4(c)) |
| Item 7.01 | Regulation FD Disclosure. |
As previously announced, on June 3, 2015, Advanced Drainage Systems, Inc.’s (the “Company”) Co-Chief Operating Officer and Executive Vice President, Ronald R. Vitarelli, and Chief Financial Officer and Executive Vice President, Mark B. Sturgeon, will be presenting at the Deutsche Bank Global Industrials and Basic Materials Conference in Chicago. A copy of the Company’s slides forming the basis of the presentation is being furnished as Exhibit 99.1 and hereby incorporated by reference.
The information furnished pursuant to this Item 7.01, including Exhibit 99.1, shall not be deemed “filed” for purposes of Section 18 of the Securities Exchange Act of 1934 (the “Exchange Act”) or otherwise subject to the liabilities under Section 18 of the Exchange Act and shall not be deemed to be incorporated by reference into any filing of the Company under the Securities Act of 1933 or the Exchange Act.
| Item 9.01 | Financial Statements and Exhibits. |
| (d) | Exhibits |
The following exhibit is being furnished as part of this report:
| Exhibit | Description | |
| 99.1 | Advanced Drainage Systems, Inc. Presentation Slides, June 3, 2015 Deutsche Bank Global Industrials and Basic Materials Conference | |
SIGNATURES
Pursuant to the requirements of the Securities Exchange Act of 1934, the Registrant has duly caused this report to be signed on its behalf by the undersigned hereunto duly authorized.
| ADVANCED DRAINAGE SYSTEMS, INC. | ||||||
| Date: June 3, 2015 | By: | /s/ Mark B. Sturgeon | ||||
| Name: | Mark B. Sturgeon | |||||
| Title: | EVP, CFO, Secretary & Treasurer | |||||
| Exhibit 99.1
|
Deutsche Bank Global Industrials and Basic Materials Conference
June 3, 2015
LEADERSHIP • GROWTH • MOMENTUM THROUGH STRENGTH
|
|
Forward Looking Statements and Non-GAAP Financial Metrics
Certain statements in this presentation may be deemed to be forward-looking statements within the meaning of Section 27A of the Securities Act of 1933, as amended, and Section 21E of the Securities Exchange Act of 1934, as amended. These statements are not historical facts but rather are based on the Company’s current expectations, estimates and projections regarding the Company’s business, operations and other factors relating thereto. Words such as “may,” “will,” “could,” “would,” “should,” “anticipate,” “predict,” “potential,” “continue,” “expects,” “intends,” “plans,” “projects,” “believes,” “confident,” “estimates” and similar expressions are used to identify these forward-looking statements. Factors that could cause actual results to differ from those reflected in forward-looking statements relating to our operations and business include: fluctuations in the price and availability of resins and other raw materials and our ability to pass any increased costs of raw materials on to our customers in a timely manner; volatility in general business and economic conditions in the markets in which we operate, including, without limitation, factors relating to availability of credit, interest rates, fluctuations in capital and business and consumer confidence; cyclicality and seasonality of the non-residential and residential construction markets and infrastructure spending; the risks of increasing competition in our existing and future markets, including competition from both manufacturers of high performance thermoplastic corrugated pipe and manufacturers of products using alternative materials; our ability to continue to convert current demand for concrete, steel and PVC pipe products into demand for our high performance thermoplastic corrugated pipe and Allied Products; the effect of weather or seasonality; the loss of any of our significant customers; the risks of doing business internationally; the risks of conducting a portion of our operations through joint ventures; our ability to expand into new geographic or product markets; our ability to achieve the acquisition component of our growth strategy; the risk associated with manufacturing processes; our ability to manage our assets; the risks associated with our product warranties; our ability to manage our supply purchasing and customer credit policies; the risks associated with our self-insured programs; our ability to control labor costs and to attract, train and retain highly-qualified employees and key personnel; our ability to protect our intellectual property rights; changes in laws and regulations, including environmental laws and regulations; our ability to project product mix; the risks associated with our current levels of indebtedness; our ability to meet future capital requirements and fund our liquidity needs; and the other risks and uncertainties described in the Company’s filings with the Securities and Exchange Commission. New risks and uncertainties emerge from time to time and it is not possible for the Company to predict all risks and uncertainties that could have an impact on the forward-looking statements contained in this press release. In light of the significant uncertainties inherent in the forward-looking information included herein, the inclusion of such information should not be regarded as a representation by the Company or any other person
that the Company’s expectations, objectives or plans will be achieved in the timeframe anticipated or at all. Investors are cautioned not to place undue reliance on the Company’s forward-looking statements and the
Company undertakes no obligation to publicly update or revise any forward-looking statements, whether as a result of new information, future events or otherwise, except as required by law.
This presentation includes certain non-GAAP financial measures to describe the Company’s performance. The reconciliation of those measures to GAAP measures are provided within the appendix of the presentation. Those disclosures should not be viewed as a substitute for operating results determined in accordance with GAAP, nor are they necessarily comparable to non-GAAP performance measures that may be presented by other companies.
LEADERSHIP • GROWTH • MOMENTUM THROUGH STRENGTH 2
|
|
ADS – An Industrial Growth Company
?The leading player in the industry
?The only complete solutions provider for the water management industry, with a history of product innovation
?Track record of market share gains with material conversion growing steadily over time
?Large addressable opportunity across diverse construction markets
?Demonstrated ability to deliver above market growth, EBITDA margin expansion and strong cash flows
?Experienced management team with significant ownership stake
LEADERSHIP • GROWTH • MOMENTUM THROUGH STRENGTH 3
|
|
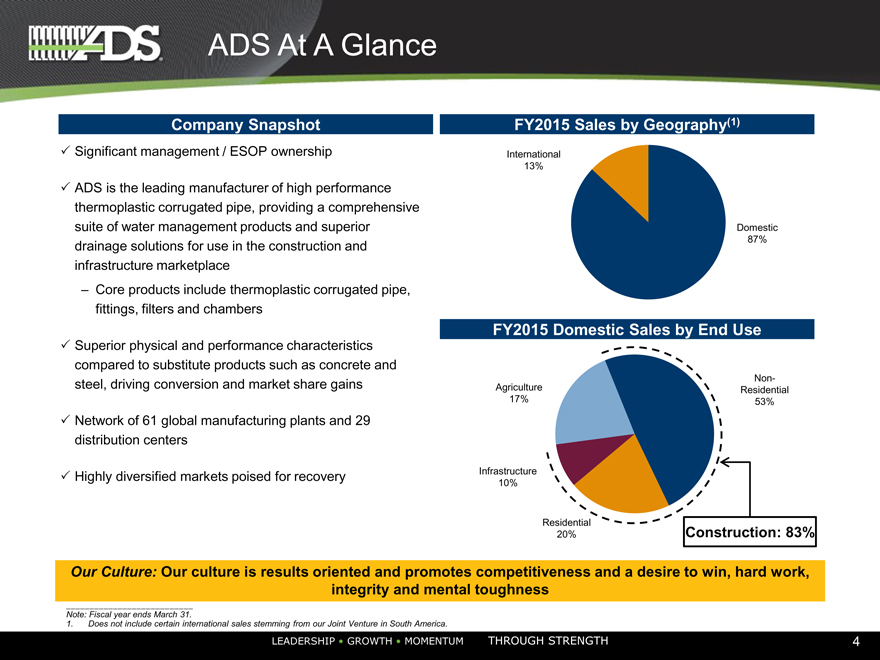
ADS At A Glance
Company Snapshot
? Significant management / ESOP ownership
? ADS is the leading manufacturer of high performance thermoplastic corrugated pipe, providing a comprehensive suite of water management products and superior drainage solutions for use in the construction and infrastructure marketplace
– Core products include thermoplastic corrugated pipe, fittings, filters and chambers
? Superior physical and performance characteristics compared to substitute products such as concrete and steel, driving conversion and market share gains
? Network of 61 global manufacturing plants and 29 distribution centers
? Highly diversified markets poised for recovery
FY2015 Sales by Geography(1)
International 13%
Domestic 87%
FY2015 Domestic Sales by End Use
Agriculture Non-17% Residential 53%
Infrastructure 10%
Residential
20% Construction: 83%
Our Culture: Our culture is results oriented and promotes competitiveness and a desire to win, hard work, integrity and mental toughness
Note: Fiscal year ends March 31.
1. Does not include certain international sales stemming from our Joint Venture in South America.
LEADERSHIP • GROWTH • MOMENTUM THROUGH STRENGTH 4
|
|
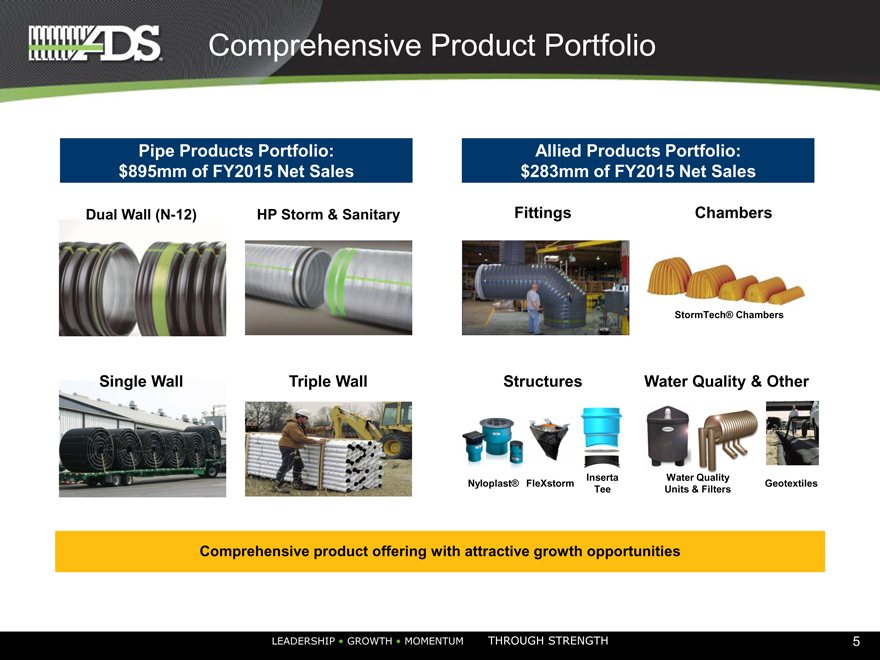
Comprehensive Product Portfolio
Pipe Products Portfolio: $895mm of FY2015 Net Sales
Dual Wall (N-12) HP Storm & Sanitary
Single Wall Triple Wall
Allied Products Portfolio: $283mm of FY2015 Net Sales
Fittings Chambers
StormTech® Chambers
Structures Water Quality & Other
Inserta Water Quality
Nyloplast® FleXstorm Geotextiles Tee Units & Filters
Comprehensive product offering with attractive growth opportunities
| 5 |
|
|
|
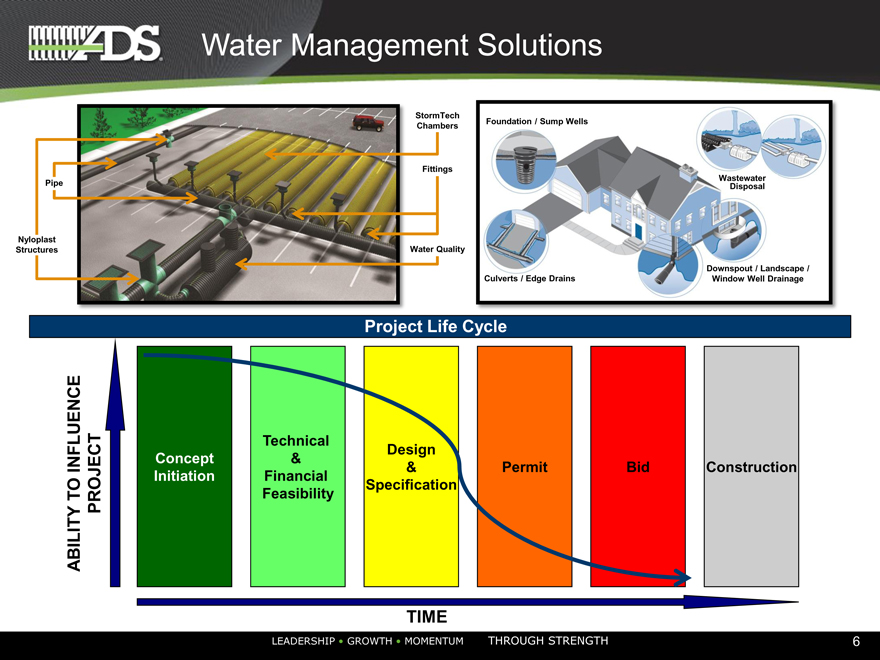
Water Management Solutions
StormTech Chambers
Fittings Pipe
Nyloplast
Structures Water Quality
Foundation / Sump Wells
Wastewater Disposal
Downspout / Landscape / Culverts / Edge Drains Window Well Drainage
Project Life Cycle
Technical
Design Concept &
INFLUENCE & Permit Bid Construction Initiation Financial Specification TO Feasibility
ABILITY PROJECT
TIME
LEADERSHIP • GROWTH • MOMENTUM THROUGH STRENGTH 6
|
|
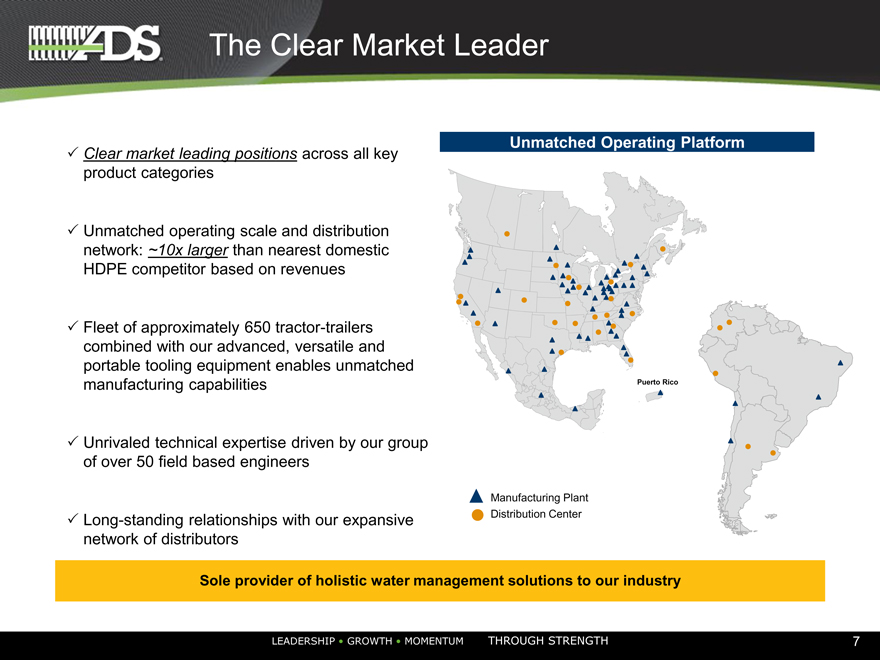
The Clear Market Leader
? Clear market leading positions across all key product categories
? Unmatched operating scale and distribution network: ~10x larger than nearest domestic HDPE competitor based on revenues
? Fleet of approximately 650 tractor-trailers combined with our advanced, versatile and portable tooling equipment enables unmatched manufacturing capabilities
? Unrivaled technical expertise driven by our group of over 50 field based engineers
? Long-standing relationships with our expansive network of distributors
Unmatched Operating Platform
Puerto Rico
Manufacturing Plant Distribution Center
Sole provider of holistic water management solutions to our industry
LEADERSHIP • GROWTH • MOMENTUM THROUGH STRENGTH 7
|
|
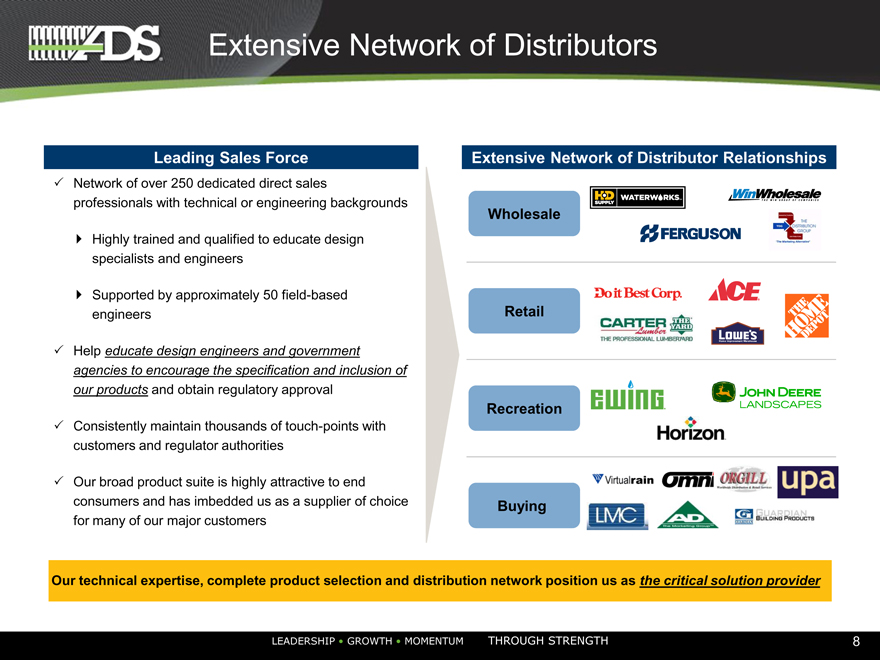
Extensive Network of Distributors
Leading Sales Force
? Network of over 250 dedicated direct sales professionals with technical or engineering backgrounds
? Highly trained and qualified to educate design specialists and engineers
? Supported by approximately 50 field-based engineers
? Help educate design engineers and government agencies to encourage the specification and inclusion of our products and obtain regulatory approval
? Consistently maintain thousands of touch-points with customers and regulator authorities
? Our broad product suite is highly attractive to end consumers and has imbedded us as a supplier of choice for many of our major customers
Extensive Network of Distributor Relationships
Wholesale Retail Recreation Buying
Our technical expertise, complete product selection and distribution network position us as the critical solution provider
RSHIP • GROWTH • MOMENTUM THROUGH STRENGTH 8
|
|
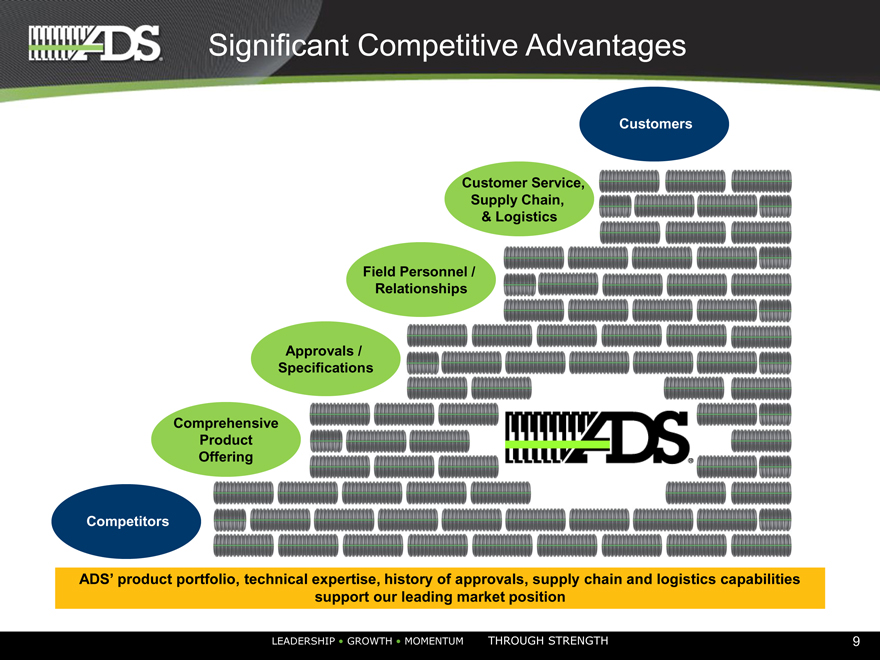
Significant Competitive Advantages
Customers
Customer Service, Supply Chain,
& Logistics
Field Personnel / Relationships
Approvals / Specifications
Comprehensive Product Offering
Competitors
ADS’ product portfolio, technical expertise, history of approvals, supply chain and logistics capabilities support our leading market position
LEADERSHIP • GROWTH • MOMENTUM THROUGH STRENGTH 9
|
|
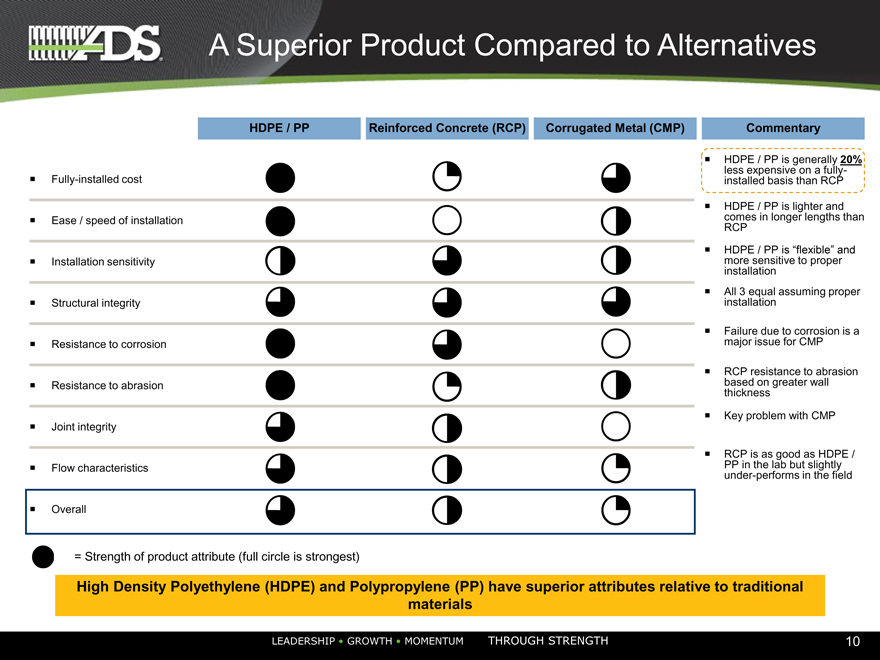
A Superior Product Compared to Alternatives
HDPE / PP Reinforced Concrete (RCP) Corrugated Metal (CMP) Commentary
HDPE / PP is generally 20% Fully-installed cost less expensive on a fully-installed basis than RCP
? HDPE / PP is lighter and ? Ease / speed of installation comes in longer lengths than RCP
? HDPE / PP is “flexible” and
? Installation sensitivity more sensitive to proper installation ? All 3 equal assuming proper ? Structural integrity installation
? Failure due to corrosion is a ? Resistance to corrosion major issue for CMP
? RCP resistance to abrasion ? Resistance to abrasion based on greater wall thickness
? Key problem with CMP ? Joint integrity
? RCP is as good as HDPE / ? Flow characteristics PP in the lab but slightly under-performs in the field
? Overall
= Strength of product attribute (full circle is strongest)
High Density Polyethylene (HDPE) and Polypropylene (PP) have superior attributes relative to traditional materials
LEADERSHIP • GROWTH • MOMENTUM THROUGH STRENGTH 10
|
|
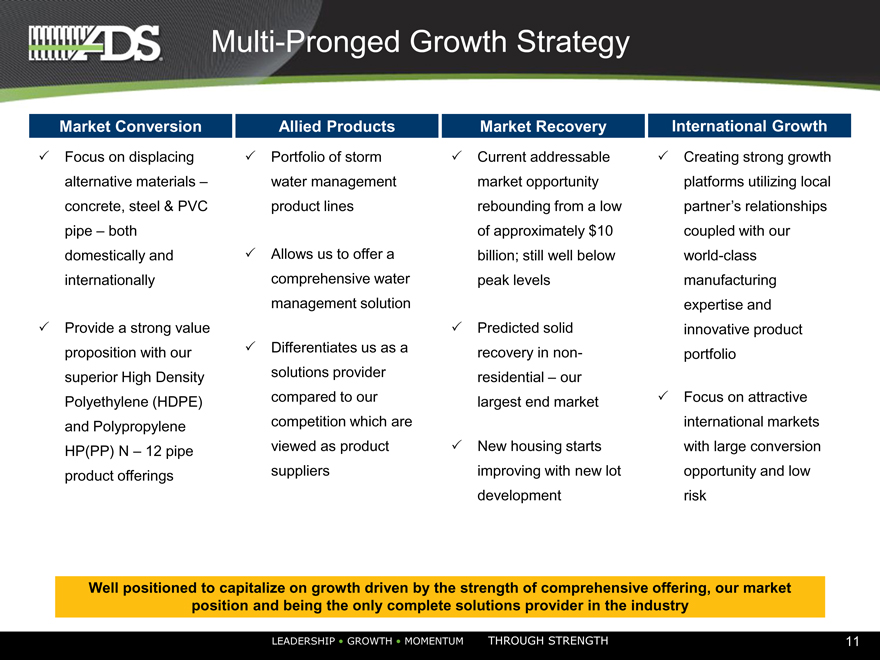
Multi-Pronged Growth Strategy
Market Conversion Allied Products Market Recovery International Growth
? Focus on displacing ? Portfolio of storm ? Current addressable ? Creating strong growth alternative materials – water management market opportunity platforms utilizing local concrete, steel & PVC product lines rebounding from a low partner’s relationships pipe – both of approximately $10 coupled with our domestically and ? Allows us to offer a billion; still well below world-class internationally comprehensive water peak levels manufacturing management solution expertise and ? Provide a strong value ? Predicted solid innovative product proposition with our ? Differentiates us as a recovery in non- portfolio superior High Density solutions provider residential – our Polyethylene (HDPE) compared to our largest end market ? Focus on attractive and Polypropylene competition which are international markets HP(PP) N – 12 pipe viewed as product ? New housing starts with large conversion product offerings suppliers improving with new lot opportunity and low development risk
Well positioned to capitalize on growth driven by the strength of comprehensive offering, our market position and being the only complete solutions provider in the industry
LEADERSHIP • GROWTH • MOMENTUM THROUGH STRENGTH 11
|
|
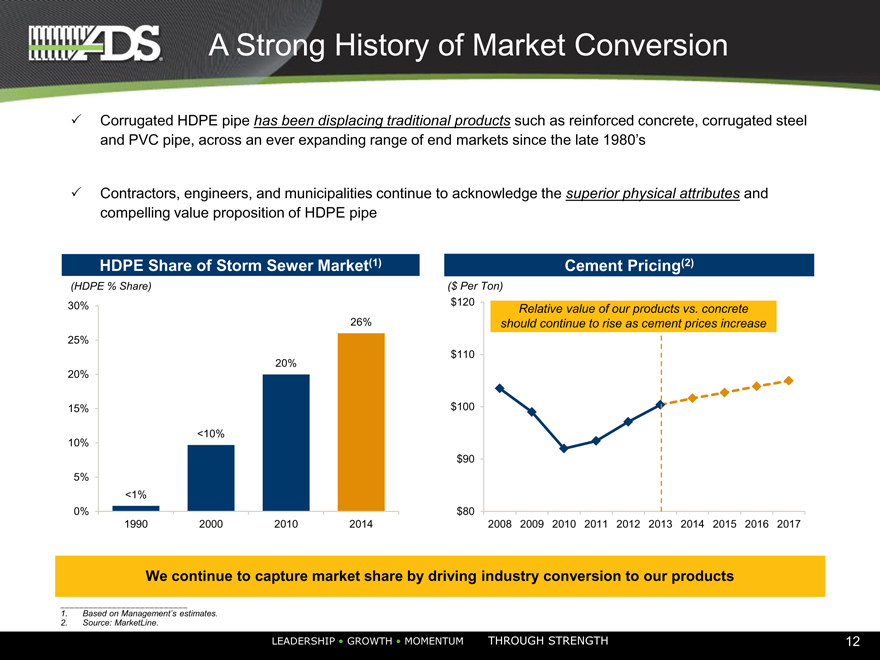
A Strong History of Market Conversion
? Corrugated HDPE pipe has been displacing traditional products such as reinforced concrete, corrugated steel and PVC pipe, across an ever expanding range of end markets since the late 1980’s
? Contractors, engineers, and municipalities continue to acknowledge the superior physical attributes and compelling value proposition of HDPE pipe
HDPE Share of Storm Sewer Market(1)
(HDPE % Share)
30%
26% 25%
20% 20%
15%
10% <10%
5%
<1% 0%
1990 2000 2010 2014
Cement Pricing(2)
($ Per Ton) $120
Relative value of our products vs. concrete should continue to rise as cement prices increase
$110 $100 $90
$80
2008 2009 2010 2011 2012 2013 2014 2015 2016 2017
We continue to capture market share by driving industry conversion to our products
1. Based on Management’s estimates.
2. Source: MarketLine.
LEADERSHIP • GROWTH • MOMENTUM THROUGH STRENGTH 12
|
|
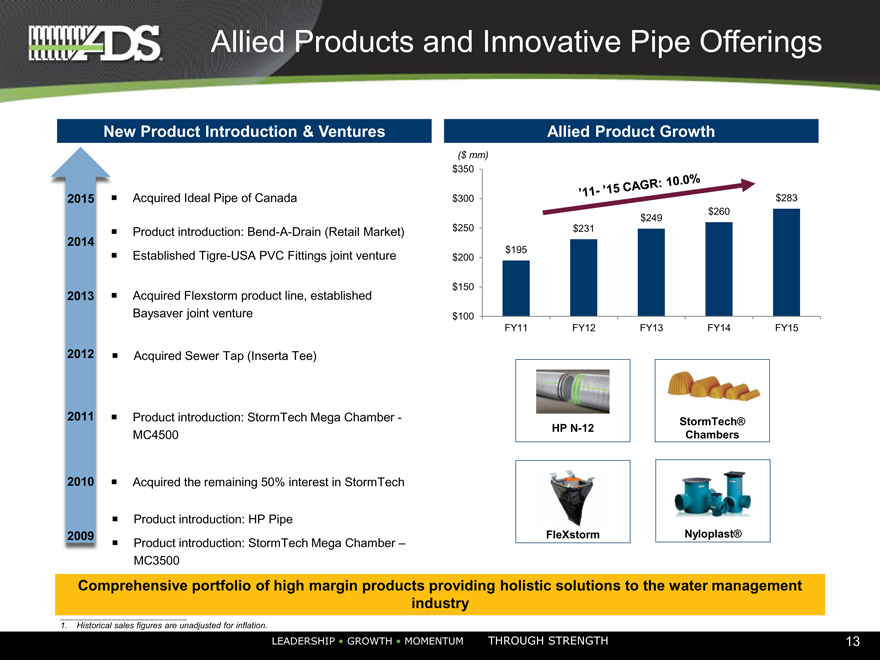
Allied Products and Innovative Pipe Offerings
New Product Introduction & Ventures
2015 ? Acquired Ideal Pipe of Canada
? Product introduction: Bend-A-Drain (Retail Market)
2014
? Established Tigre-USA PVC Fittings joint venture
2013 ? Acquired Flexstorm product line, established Baysaver joint venture
2012 ? Acquired Sewer Tap (Inserta Tee)
2011 ? Product introduction: StormTech Mega Chamber—MC4500
2010 ? Acquired the remaining 50% interest in StormTech
? Product introduction: HP Pipe
2009
? Product introduction: StormTech Mega Chamber – MC3500
Allied Product Growth
($ mm) $350
$300 $283 $260 $249 $250 $231
$195 $200
$150
$100
FY11 FY12 FY13 FY14 FY15
StormTech® HP N-12 Chambers
FleXstorm Nyloplast®
Comprehensive portfolio of high margin products providing holistic solutions to the water management industry
1. Historical sales figures are unadjusted for inflation.
LEADERSHIP • GROWTH • MOMENTUM THROUGH STRENGTH 13
|
|
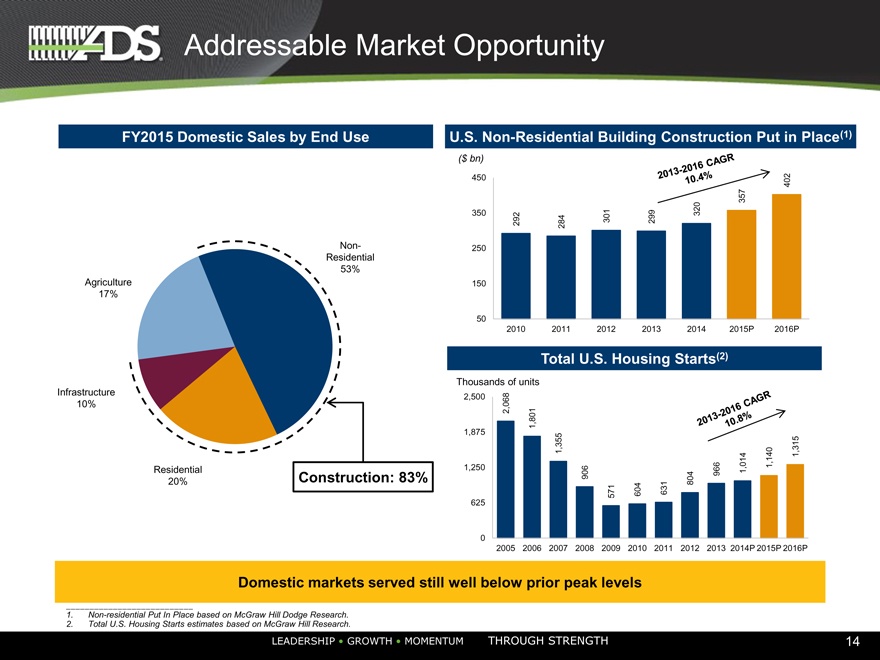
Addressable Market Opportunity
FY2015 Domestic Sales by End Use
Non-Residential 53% Agriculture 17%
Infrastructure 10%
Residential
20% Construction: 83%
U.S. Non-Residential Building Construction Put in Place(1)
($ bn)
450 402 357 350 292 301 299 320 284 250
150
50
2010 2011 2012 2013 2014 2015P 2016P
Total U.S. Housing Starts(2)
Thousands of units
2,500 2,068 1,801 1,875
1,355 1,315 1,250 1,140 906 966 1,014 604 631 804 625 571
0
2005 2006 2007 2008 2009 2010 2011 2012 2013 2014P 2015P 2016P
Domestic markets served still well below prior peak levels
1. Non-residential Put In Place based on McGraw Hill Dodge Research.
2. Total U.S. Housing Starts estimates based on McGraw Hill Research.
LEADERSHIP • GROWTH • MOMENTUM THROUGH STRENGTH 14
|
|
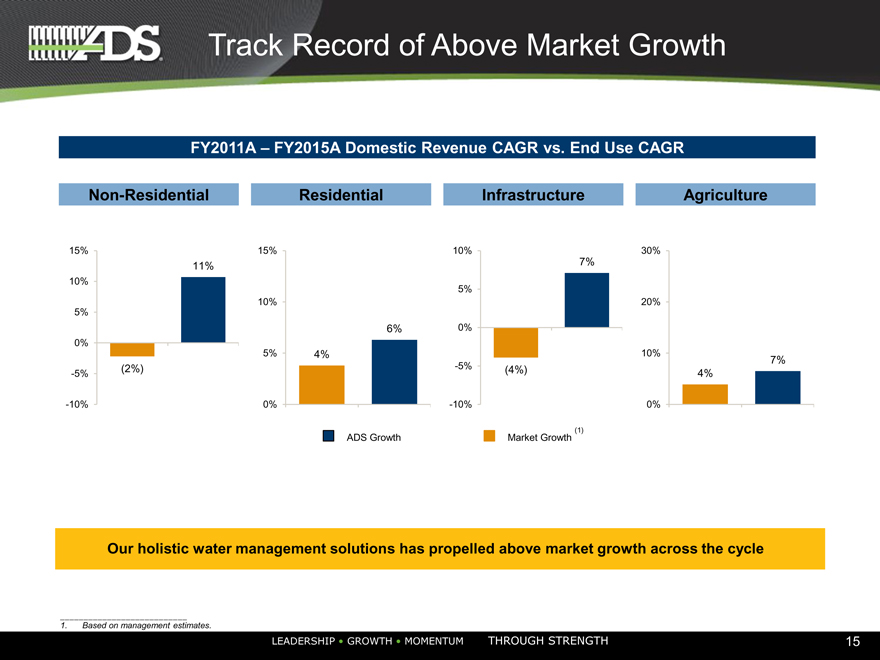
Track Record of Above Market Growth
FY2011A – FY2015A Domestic Revenue CAGR vs. End Use CAGR
Non-Residential Residential Infrastructure Agriculture
15%
11%
10%
5%
0%
(2%)
-5%
-10%
15%
10%
6%
5% 4%
0%
ADS Growth
10%
7%
5%
0%
-5% (4%)
-10%
Market Growth (1)
30%
20%
10%
7% 4%
0%
Our holistic water management solutions has propelled above market growth across the cycle
1. Based on management estimates.
LEADERSHIP • GROWTH • MOMENTUM THROUGH STRENGTH 15
|
|
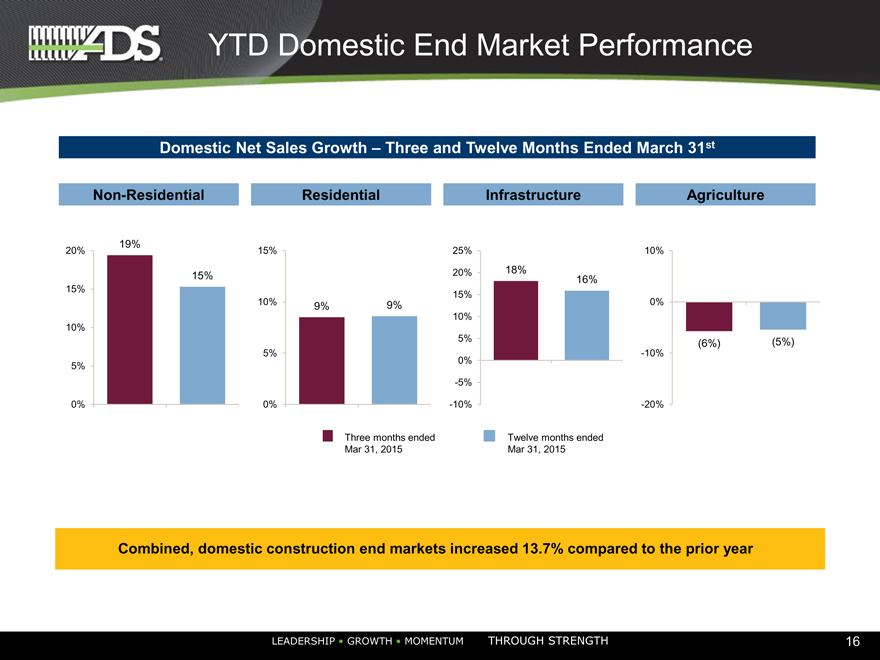
YTD Domestic End Market Performance
Domestic Net Sales Growth – Three and Twelve Months Ended March 31st
Non-Residential Residential Infrastructure Agriculture
19%
20%
15%
15% 10% 5% 0%
15%
10% 9% 9%
5%
0%
Three months ended Mar 31, 2015
25%
20% 18% 16%
15% 10% 5% 0% -5% -10%
Twelve months ended Mar 31, 2015
10%
0%
(6%) (5%)
-10%
-20%
Combined, domestic construction end markets increased 13.7% compared to the prior year
LEADERSHIP • GROWTH • MOMENTUM THROUGH STRENGTH 16
|
|
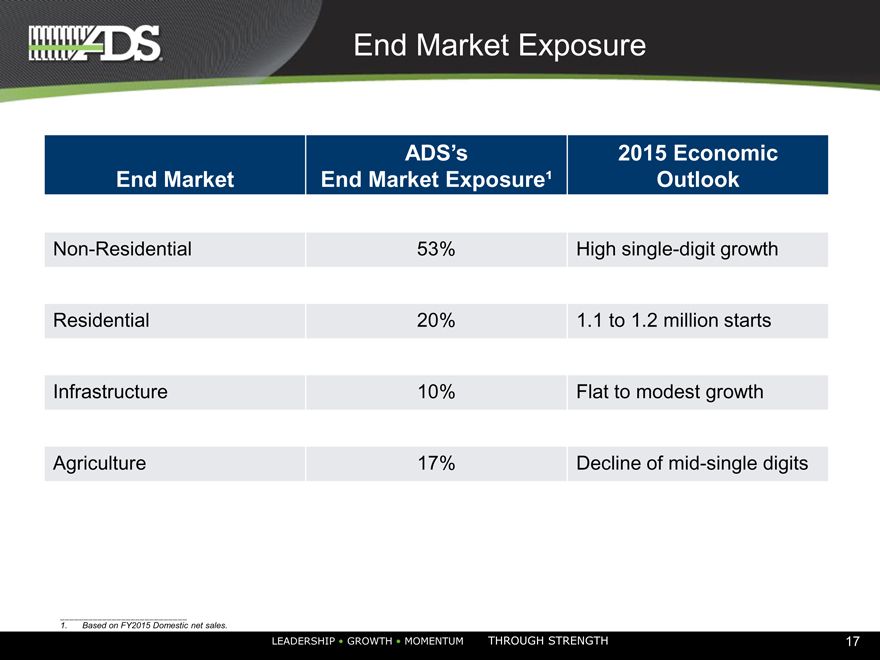
End Market Exposure
ADS’s 2015 Economic
End Market End Market Exposure¹ Outlook
Non-Residential 53% High single-digit growth Residential 20% 1.1 to 1.2 million starts Infrastructure 10% Flat to modest growth Agriculture 17% Decline of mid-single digits
1. Based on FY2015 Domestic net sales.
LEADERSHIP • GROWTH • MOMENTUM THROUGH STRENGTH 17
|
|
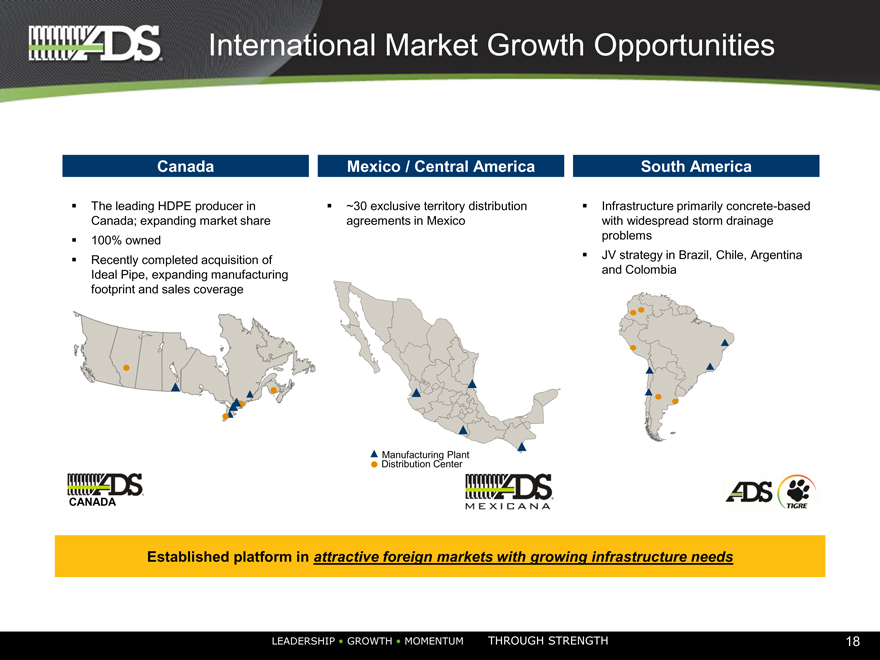
International Market Growth Opportunities
Canada
? The leading HDPE producer in Canada; expanding market share ? 100% owned ? Recently completed acquisition of Ideal Pipe, expanding manufacturing footprint and sales coverage
Mexico / Central America
? ~30 exclusive territory distribution agreements in Mexico
South America
? Infrastructure primarily concrete-based with widespread storm drainage problems ? JV strategy in Brazil, Chile, Argentina and Colombia
Manufacturing Plant Distribution Center
Established platform in attractive foreign markets with growing infrastructure needs
LEADERSHIP • GROWTH • MOMENTUM THROUGH STRENGTH 18
|
|
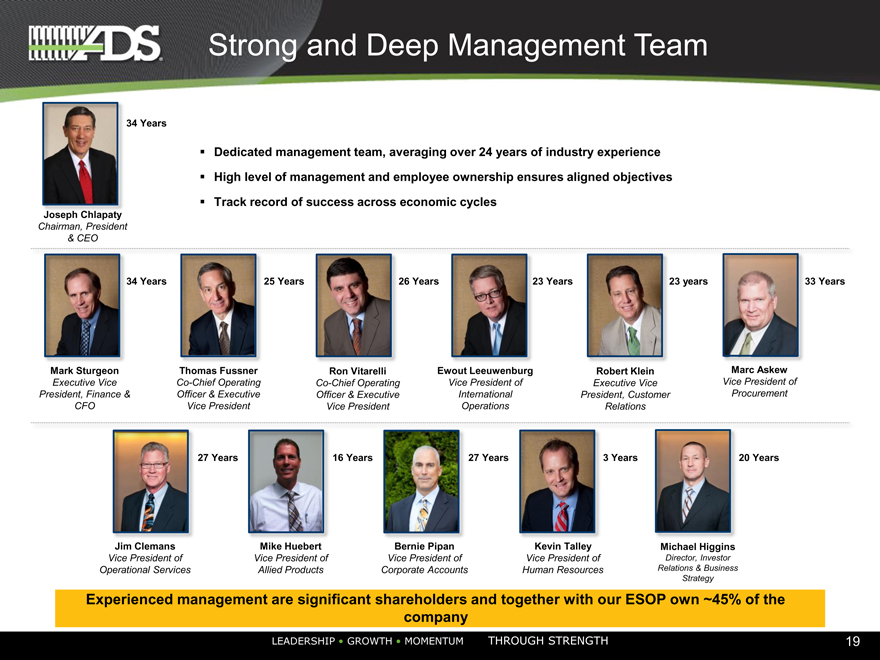
Strong and Deep Management Team
34 Years
Joseph Chlapaty
Chairman, President
& CEO
? Dedicated management team, averaging over 24 years of industry experience
? High level of management and employee ownership ensures aligned objectives
? Track record of success across economic cycles
34 Years
Mark Sturgeon
Executive Vice President, Finance & CFO
25 Years
Thomas Fussner
Co-Chief Operating
Officer & Executive
Vice President
26 Years
Ron Vitarelli
Co-Chief Operating Officer & Executive Vice President
23 Years
Ewout Leeuwenburg
Vice President of International Operations
23 years
Robert Klein
Executive Vice President, Customer Relations
33 Years
Marc Askew
Vice President of Procurement
27 Years
Jim Clemans
Vice President of Operational Services
16 Years
Mike Huebert
Vice President of Allied Products
27 Years
Bernie Pipan
Vice President of Corporate Accounts
| 3 |
|
Years |
Kevin Talley
Vice President of Human Resources
20 Years
Michael Higgins
Director, Investor Relations & Business Strategy
Experienced management are significant shareholders and together with our ESOP own ~45% of the company
LEADERSHIP • GROWTH • MOMENTUM THROUGH STRENGTH 19
|
|
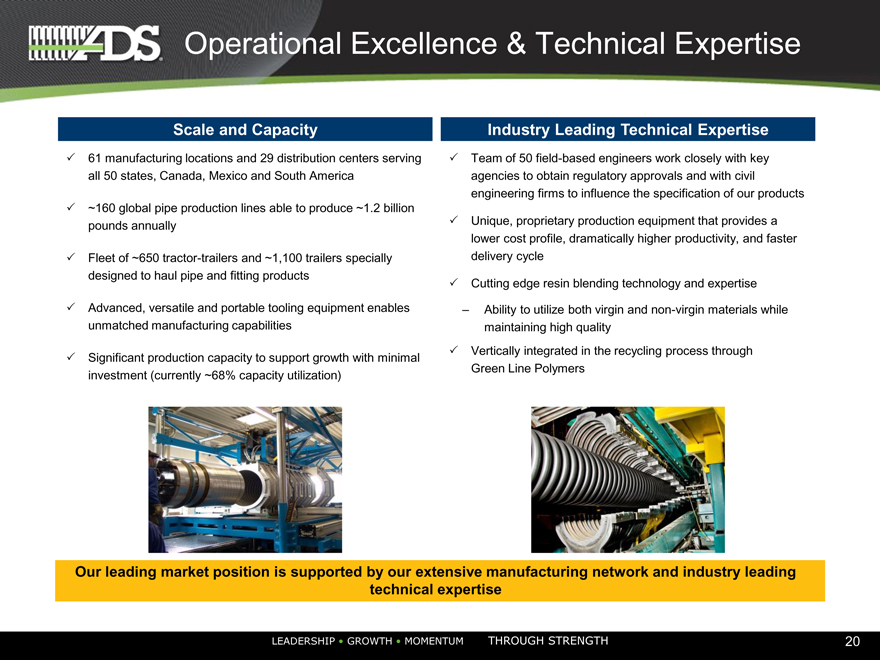
Operational Excellence & Technical Expertise
Scale and Capacity
? 61 manufacturing locations and 29 distribution centers serving all 50 states, Canada, Mexico and South America
? ~160 global pipe production lines able to produce ~1.2 billion pounds annually
? Fleet of ~650 tractor-trailers and ~1,100 trailers specially designed to haul pipe and fitting products
? Advanced, versatile and portable tooling equipment enables unmatched manufacturing capabilities
? Significant production capacity to support growth with minimal investment (currently ~68% capacity utilization)
Industry Leading Technical Expertise
? Team of 50 field-based engineers work closely with key agencies to obtain regulatory approvals and with civil engineering firms to influence the specification of our products
? Unique, proprietary production equipment that provides a lower cost profile, dramatically higher productivity, and faster delivery cycle
? Cutting edge resin blending technology and expertise
– Ability to utilize both virgin and non-virgin materials while maintaining high quality ? Vertically integrated in the recycling process through Green Line Polymers
Our leading market position is supported by our extensive manufacturing network and industry leading technical expertise
LEADERSHIP • GROWTH • MOMENTUM THROUGH STRENGTH 20
|
|
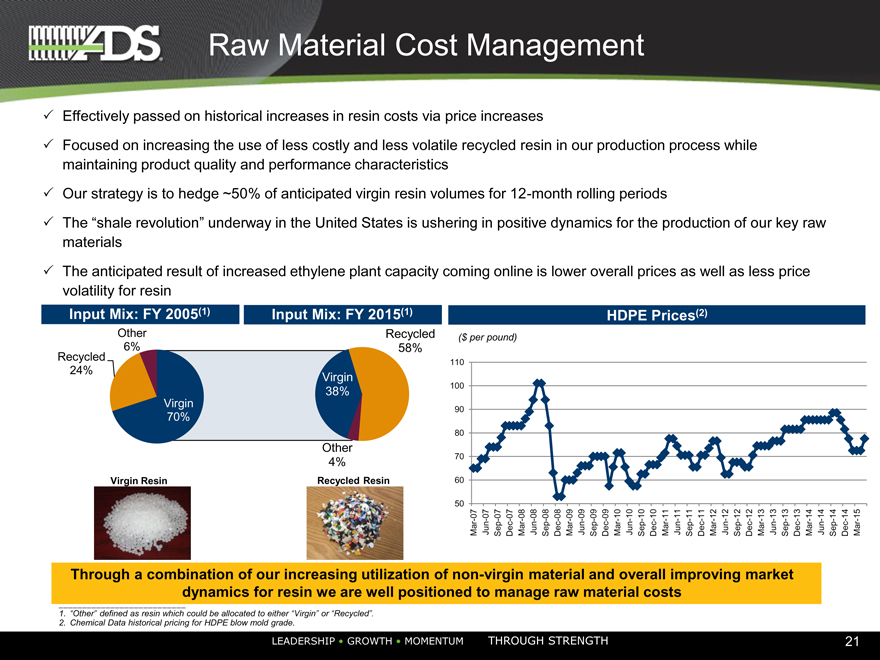
Raw material cost management
50 60 70 80 90 100 110 (
$
Mar-07 per
Jun-07
Sep-07
Dec-07 pound)
Mar-08
Jun-08
Sep-08
Dec-08
Mar-09
Jun-09
Sep-09
Dec-09
Mar-10
Jun-10
Sep-10
Dec-10
Mar-11
Jun-11
Sep-11
Dec-11
Mar-12
Jun-12
Sep-12
Dec-12
Mar-13
Jun-13
Sep-13
Dec-13
Mar-14
Jun-14
Sep-14
Dec-14
Mar-15
21
|
|
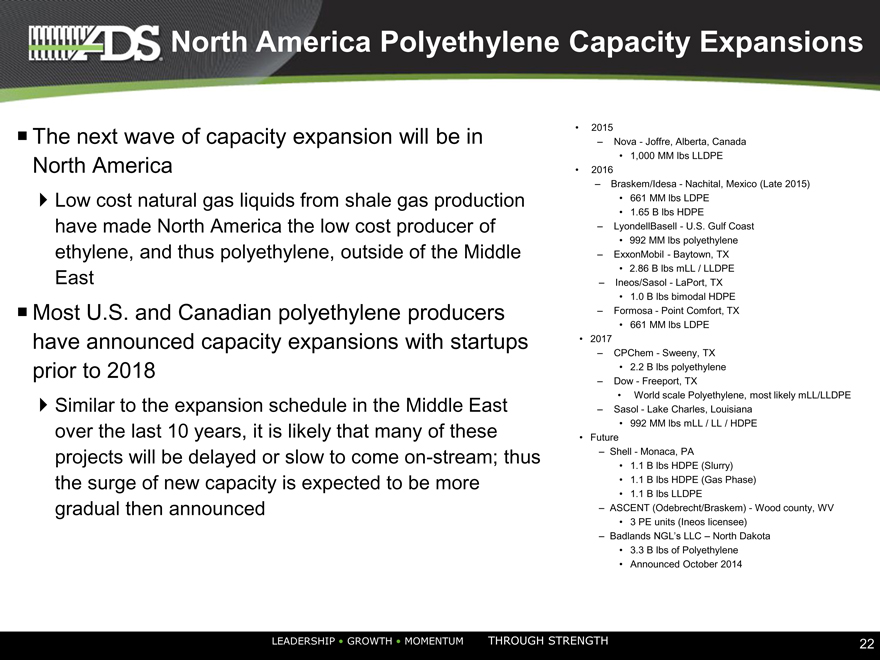
North America Polyethylene Capacity Expansions
?The next wave of capacity expansion will be in North America
? Low cost natural gas liquids from shale gas production have made North America the low cost producer of ethylene, and thus polyethylene, outside of the Middle East
?Most U.S. and Canadian polyethylene producers have announced capacity expansions with startups prior to 2018
Similar to the expansion schedule in the Middle East over the last 10 years, it is likely that many of these projects will be delayed or slow to come on-stream; thus the surge of new capacity is expected to be more gradual then announced
| • |
|
2015 – Nova—Joffre, Alberta, Canada |
| • |
|
1,000 MM lbs LLDPE |
| • |
|
2016 |
– Braskem/Idesa—Nachital, Mexico (Late 2015)
| • |
|
661 MM lbs LDPE |
| • |
|
1.65 B lbs HDPE |
– LyondellBasell—U.S. Gulf Coast
| • |
|
992 MM lbs polyethylene |
– ExxonMobil—Baytown, TX
| • |
|
2.86 B lbs mLL / LLDPE |
– Ineos/Sasol—LaPort, TX
| • |
|
1.0 B lbs bimodal HDPE |
– Formosa—Point Comfort, TX
| • |
|
661 MM lbs LDPE |
| • |
|
2017 |
– CPChem—Sweeny, TX
| • |
|
2.2 B lbs polyethylene |
– Dow—Freeport, TX
| • |
|
World scale Polyethylene, most likely mLL/LLDPE |
– Sasol—Lake Charles, Louisiana
| • |
|
992 MM lbs mLL / LL / HDPE |
| • |
|
Future |
– Shell—Monaca, PA
| • |
|
1.1 B lbs HDPE (Slurry) |
| • |
|
1.1 B lbs HDPE (Gas Phase) |
| • |
|
1.1 B lbs LLDPE |
– ASCENT (Odebrecht/Braskem)—Wood county, WV
| • |
|
3 PE units (Ineos licensee) |
– Badlands NGL’s LLC – North Dakota
| • |
|
3.3 B lbs of Polyethylene |
| • |
|
Announced October 2014 |
LEADERSHIP • GROWTH • MOMENTUM THROUGH STRENGTH
22
|
|
Financial Overview
LEADERSHIP • GROWTH • MOMENTUM THROUGH STRENGTH
|
|
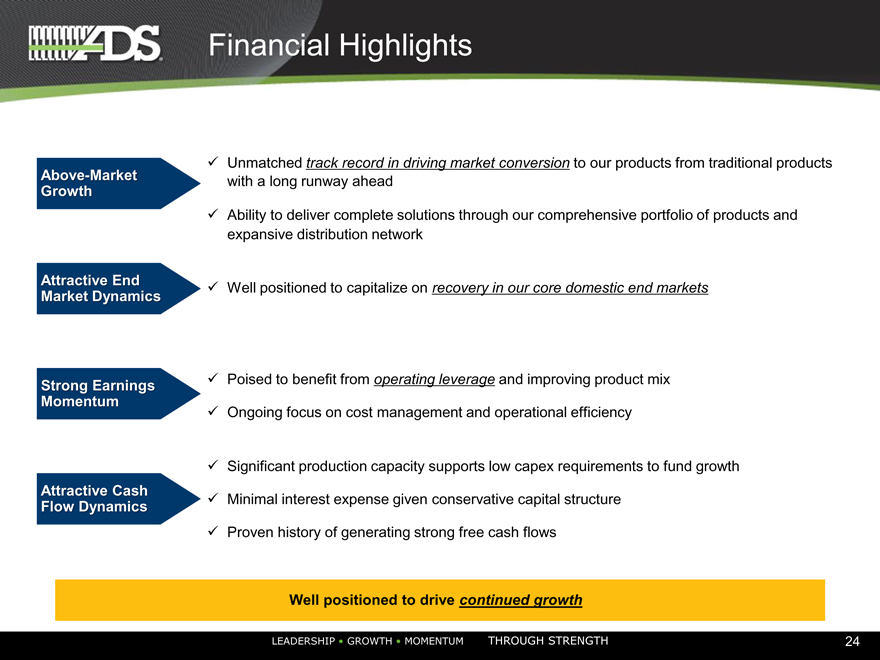
Financial Highlights
Above-Market Growth
Attractive End Market Dynamics
Strong Earnings Momentum
Attractive Cash Flow Dynamics
? Unmatched track record in driving market conversion to our products from traditional products with a long runway ahead
? Ability to deliver complete solutions through our comprehensive portfolio of products and expansive distribution network
? Well positioned to capitalize on recovery in our core domestic end markets
? Poised to benefit from operating leverage and improving product mix
? Ongoing focus on cost management and operational efficiency
? Significant production capacity supports low capex requirements to fund growth ? Minimal interest expense given conservative capital structure ? Proven history of generating strong free cash flows
Well positioned to drive continued growth
LEADERSHIP • GROWTH • MOMENTUM THROUGH STRENGTH 24
|
|
Historical Financial Performance
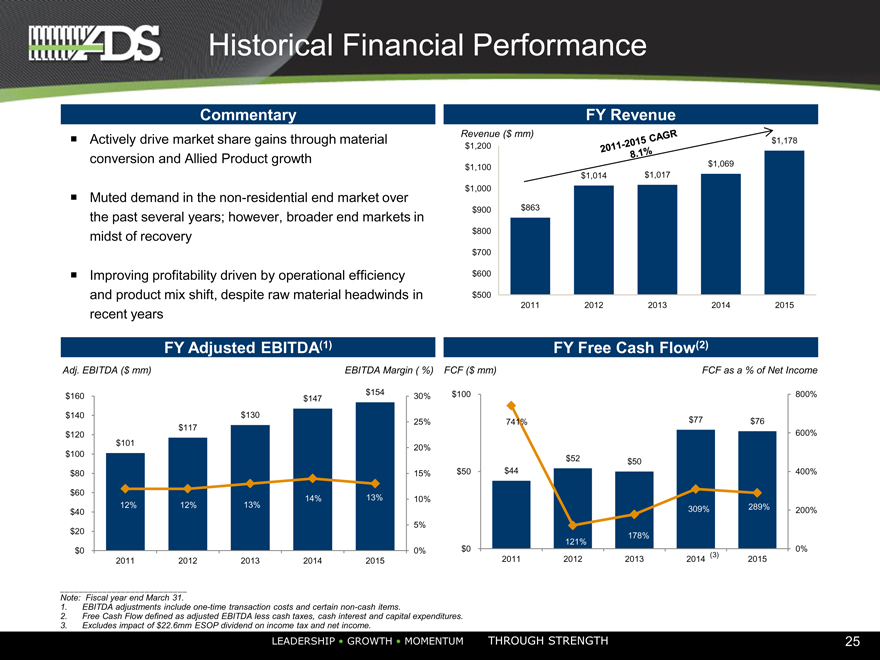
Commentary
? Actively drive market share gains through material conversion and Allied Product growth
? Muted demand in the non-residential end market over the past several years; however, broader end markets in midst of recovery
? Improving profitability driven by operational efficiency and product mix shift, despite raw material headwinds in recent years
FY Revenue
Revenue ($ mm) $1,178 $1,200
$1,100 $1,069 $1,014 $1,017 $1,000
$900 $863 $800 $700 $600
$500
2011 2012 2013 2014 2015
FY Adjusted EBITDA(1)
Adj. EBITDA ($ mm) EBITDA Margin ( %)
$154 $160 $147 30% $140 $130 25% $120 $117 $101 20% $100 12%
$80 15%
$60
12% 12% 13% 14% 13% 10% $40 5% $20
$0 0% 2011 2012 2013 2014 2015
FY Free Cash Flow(2)
FCF ($ mm) FCF as a % of Net Income
$100 800%
741% $77 $76
600%
$52 $50
$50 $44 400%
309% 289% 200%
178%
$0 121% 0%
| (3) |
|
2011 2012 2013 2014 2015
Note: Fiscal year end March 31.
1. EBITDA adjustments include one-time transaction costs and certain non-cash items.
2. Free Cash Flow defined as adjusted EBITDA less cash taxes, cash interest and capital expenditures.
3. Excludes impact of $22.6mm ESOP dividend on income tax and net income.
LEADERSHIP • GROWTH • MOMENTUM THROUGH STRENGTH 25
|
|
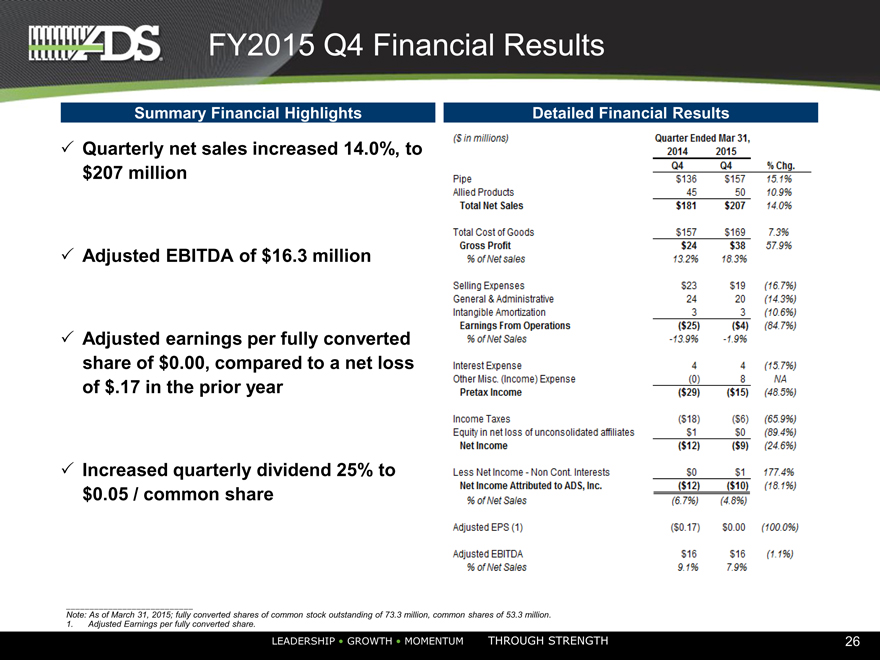
FY2015 Q4 Financial Results
Summary Financial Highlights
? Quarterly net sales increased 14.0%, $207 million
? Adjusted EBITDA of $16.3 million
? Adjusted earnings per fully converted share of $0.00, compared to a net loss of $.17 in the prior year
? Increased quarterly dividend 25% to $0.05 / common share
Note: As of March 31, 2015; fully converted shares of common stock outstanding of 73.3 million, common shares of 53.3 million.
1. Adjusted Earnings per fully converted share.
LEADERSHIP • GROWTH • MOMENTUM THROUGH STRENGTH 26
|
|
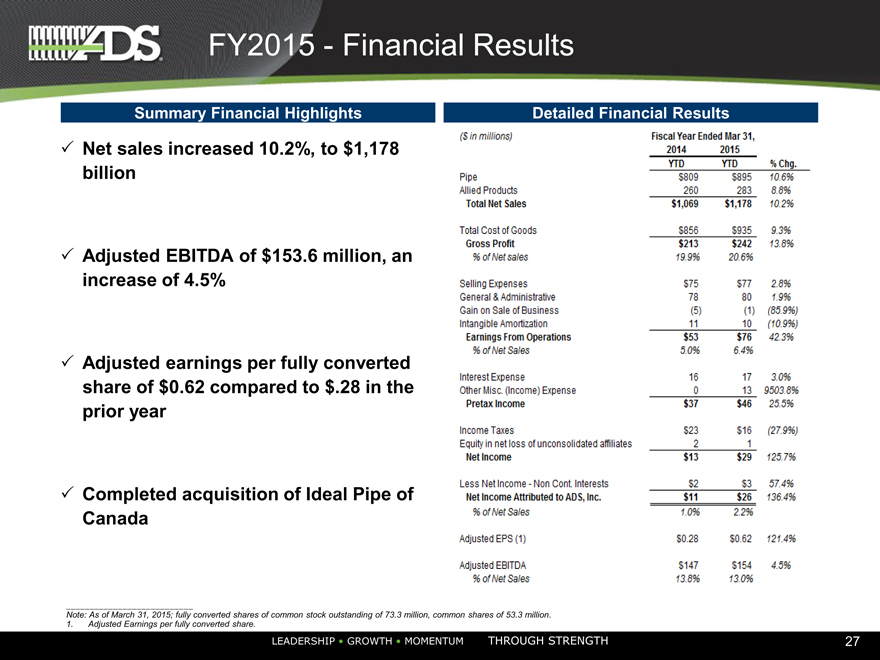
FY2015—Financial Results
Summary Financial Highlights
? Net sales increased 10.2%, to $1,178 billion
? Adjusted EBITDA of $153.6 million, an increase of 4.5%
? Adjusted earnings per fully converted share of $0.62 compared to $.28 in the prior year
? Completed acquisition of Ideal Pipe of Canada
Note: As of March 31, 2015; fully converted shares of common stock outstanding of 73.3 million, common shares of 53.3 million.
1. Adjusted Earnings per fully converted share.
LEADERSHIP • GROWTH • MOMENTUM THROUGH STRENGTH 27
|
|
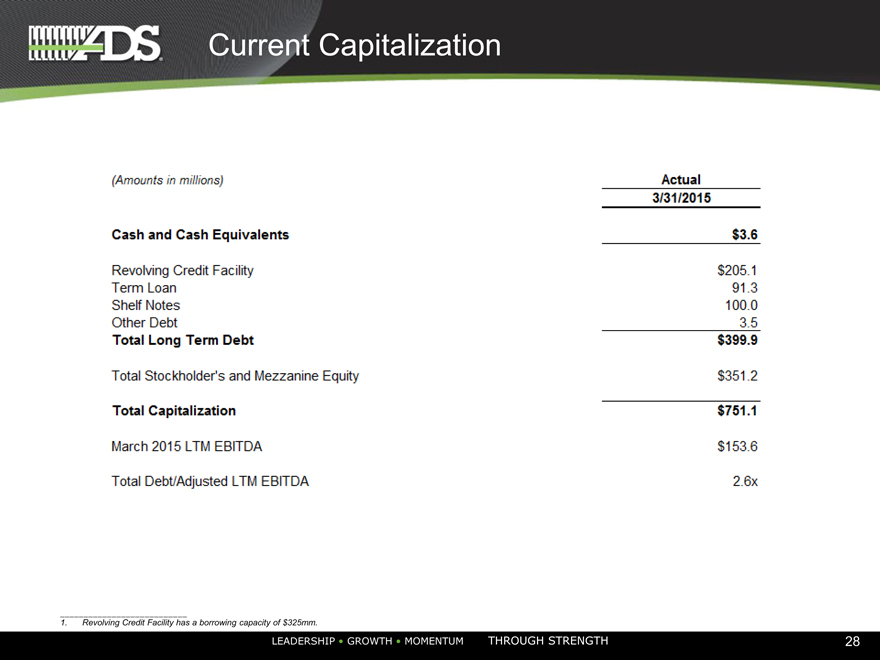
Current Capitalization
1. Revolving Credit Facility has a borrowing capacity of $325mm.
LEADERSHIP • GROWTH • MOMENTUM THROUGH STRENGTH 28
|
|

ADS – An Industrial Growth Company
?The leading player in the industry
?The only complete solutions provider for the water management industry, with a history of product innovation
?Track record of market share gains with material conversion growing steadily over time
?Large addressable opportunity across diverse construction markets
?Demonstrated ability to deliver above market growth, EBITDA margin expansion and strong cash flows
?Experienced management team with significant ownership stake
LEADERSHIP • GROWTH • MOMENTUM THROUGH STRENGTH 29
|
|
Appendix
LEADERSHIP • GROWTH • MOMENTUM THROUGH STRENGTH
|
|
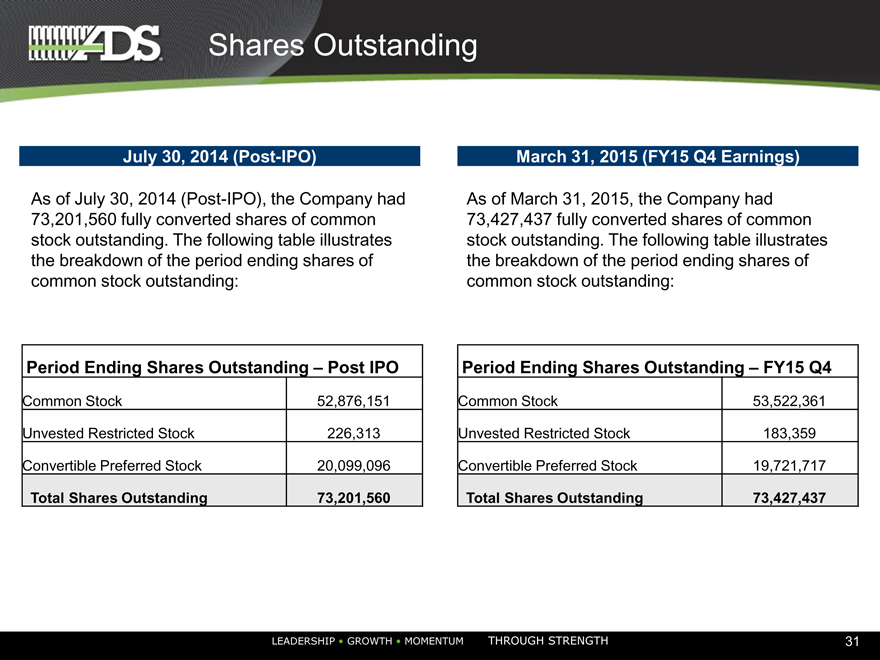
Shares Outstanding
July 30, 2014 (Post-IPO)
As of July 30, 2014 (Post-IPO), the Company had 73,201,560 fully converted shares of common stock outstanding. The following table illustrates the breakdown of the period ending shares of common stock outstanding:
March 31, 2015 (FY15 Q4 Earnings)
As of March 31, 2015, the Company had 73,427,437 fully converted shares of common stock outstanding. The following table illustrates the breakdown of the period ending shares of common stock outstanding:
Period Ending Shares Outstanding – Post IPO
Common Stock 52,876,151 Unvested Restricted Stock 226,313 Convertible Preferred Stock 20,099,096
Total Shares Outstanding 73,201,560
Period Ending Shares Outstanding – FY15 Q4
Common Stock 53,522,361 Unvested Restricted Stock 183,359 Convertible Preferred Stock 19,721,717
Total Shares Outstanding 73,427,437
LEADERSHIP • GROWTH • MOMENTUM THROUGH STRENGTH 31
Serious News for Serious Traders! Try StreetInsider.com Premium Free!
You May Also Be Interested In
- Textron Aviation’s Company-Owned Service Centers Receive Recertification as a Green Aviation Business from NATA
- U.S. News Announces 2024 Best Senior Living Ratings
- Creta Announces Yoshiki Okamoto's New Game Title "Project Creta" on 8th of April at Creta's Web3 GameFi Incubation Program NEXUS
Create E-mail Alert Related Categories
SEC FilingsSign up for StreetInsider Free!
Receive full access to all new and archived articles, unlimited portfolio tracking, e-mail alerts, custom newswires and RSS feeds - and more!
