

Form 8-K AAR CORP For: May 06
 Tweet
Tweet Share
Share
UNITED STATES
SECURITIES AND EXCHANGE COMMISSION
Washington, D.C. 20549
FORM 8-K
CURRENT REPORT
Pursuant to Section 13 or 15(d) of
the Securities Exchange Act of 1934
May 6, 2015
Date of Report (Date of Earliest Event Reported):
AAR CORP.
(Exact name of registrant as specified in its charter)
|
Delaware |
|
1-6263 |
|
36-2334820 |
|
(State of Incorporation) |
|
(Commission File Number) |
|
(IRS Employer Identification |
One AAR Place
1100 N. Wood Dale Road
Wood Dale, Illinois 60191
(Address and Zip Code of Principal Executive Offices)
Registrant’s telephone number, including area code: (630) 227-2000
Not Applicable
(Former name or former address, if changed since last report)
Check the appropriate box below if the Form 8-K filing is intended to simultaneously satisfy the filing obligation of the registrant under any of the following provisions:
o Written communications pursuant to Rule 425 under the Securities Act (17 CFR 230.425)
o Soliciting material pursuant to Rule 14a-12 under the Exchange Act (17 CFR 240.14a-12)
o Pre-commencement communications pursuant to Rule 14d-2(b) under the Exchange Act (17 CFR 240.14d-2(b))
o Pre-commencement communications pursuant to Rule 13e-4(c) under the Exchange Act (17 CFR 240.13e-4(c))
Item 8.01. Other Events.
John C. Fortson, Vice President, Chief Financial Officer and Treasurer of AAR CORP., will present at the Wells Fargo Industrial & Construction Conference on May 6, 2015 at the New York Palace Hotel in New York City and on May 7, 2015 at the Bernstein Industrials & Basic Materials Summit at the Grand Hyatt Hotel in New York City.
Attached as Exhibit 99.1 and Exhibit 99.2 are the slides that will be used by Mr. Fortson in his presentations.
Item 9.01. Financial Statements and Exhibits.
(d) Exhibits
99.1 Conference slides presented by AAR CORP. at the May 6, 2015 Wells Fargo Industrial & Construction Conference.
99.2 Conference slides presented by AAR CORP. at the May 7, 2015 Bernstein Industrials & Basic Materials Summit.
SIGNATURE
Pursuant to the requirements of the Securities Exchange Act of 1934, the registrant has duly caused this report to be signed on its behalf by the undersigned hereunto duly authorized.
Date: May 6, 2015
|
|
AAR CORP. | |
|
|
| |
|
|
| |
|
|
By: |
/S/ JOHN C. FORTSON |
|
|
|
John C. Fortson |
|
|
|
Vice President, Chief Financial Officer and Treasurer |
EXHIBIT INDEX
|
Exhibit Number |
|
Description |
|
|
|
|
|
99.1 |
|
Conference slides presented by AAR CORP. at the May 6, 2015 Wells Fargo Industrial & Construction Conference. |
|
|
|
|
|
99.2 |
|
Conference slides presented by AAR CORP. at the May 7, 2015 Bernstein Industrials & Basic Materials Summit. |
Exhibit 99.1
|
|
AAR CORP. Wells Fargo Industrial & Construction Conference New York May 5 - 6, 2015 |
|
|
Forward-Looking Statements 2 This presentation includes certain statements relating to future results, which are forward-looking statements as that term is defined in the Private Securities Litigation Reform Act of 1995. These forward-looking statements are based on beliefs of Company management, as well as assumptions and estimates based on information currently available to the Company, and are subject to certain risks and uncertainties that could cause actual results to differ materially from historical results or those anticipated, including those factors discussed under Item 1A, entitled “Risk Factors,” included in the Company’s Form 10-K for the fiscal year ended May 31, 2014. Should one or more of these risks or uncertainties materialize adversely, or should underlying assumptions or estimates prove incorrect, actual results may vary materially from those described. These events and uncertainties are difficult or impossible to predict accurately and many are beyond the Company’s control. The Company assumes no obligation to update any forward-looking statements to reflect events or circumstances after the date of such statements or to reflect the occurrence of anticipated or unanticipated events. For additional information, see the comments included in AAR’s filings with the Securities and Exchange Commission. |
|
|
Company Overview 3 |
|
|
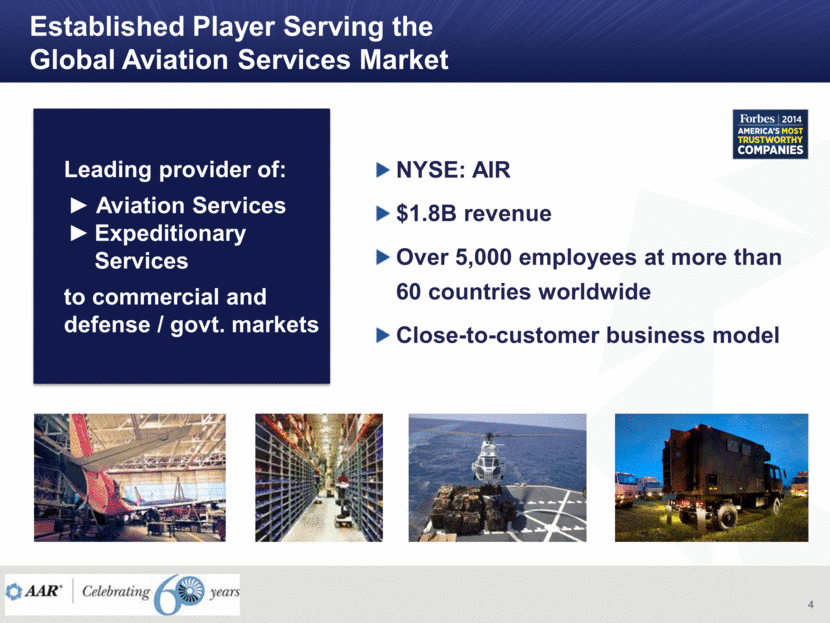
Established Player Serving the Global Aviation Services Market 4 Leading provider of: Aviation Services Expeditionary Services to commercial and defense / govt. markets NYSE: AIR $1.8B revenue Over 5,000 employees at more than 60 countries worldwide Close-to-customer business model |

|
|
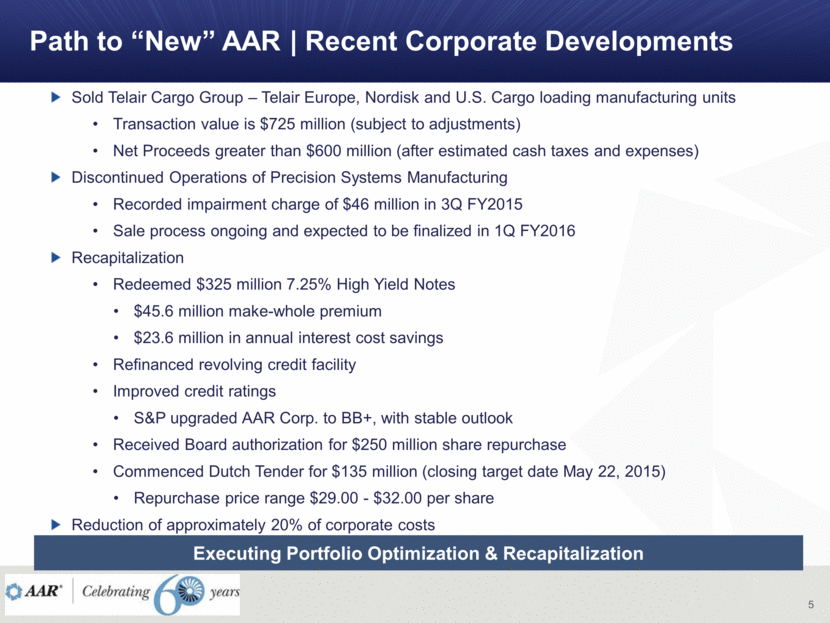
5 Path to “New” AAR Recent Corporate Developments Sold Telair Cargo Group – Telair Europe, Nordisk and U.S. Cargo loading manufacturing units Transaction value is $725 million (subject to adjustments) Net Proceeds greater than $600 million (after estimated cash taxes and expenses) Discontinued Operations of Precision Systems Manufacturing Recorded impairment charge of $46 million in 3Q FY2015 Sale process ongoing and expected to be finalized in 1Q FY2016 Recapitalization Redeemed $325 million 7.25% High Yield Notes $45.6 million make-whole premium $23.6 million in annual interest cost savings Refinanced revolving credit facility Improved credit ratings S&P upgraded AAR Corp. to BB+, with stable outlook Received Board authorization for $250 million share repurchase Commenced Dutch Tender for $135 million (closing target date May 22, 2015) Repurchase price range $29.00 - $32.00 per share Reduction of approximately 20% of corporate costs Executing Portfolio Optimization & Recapitalization |

|
|
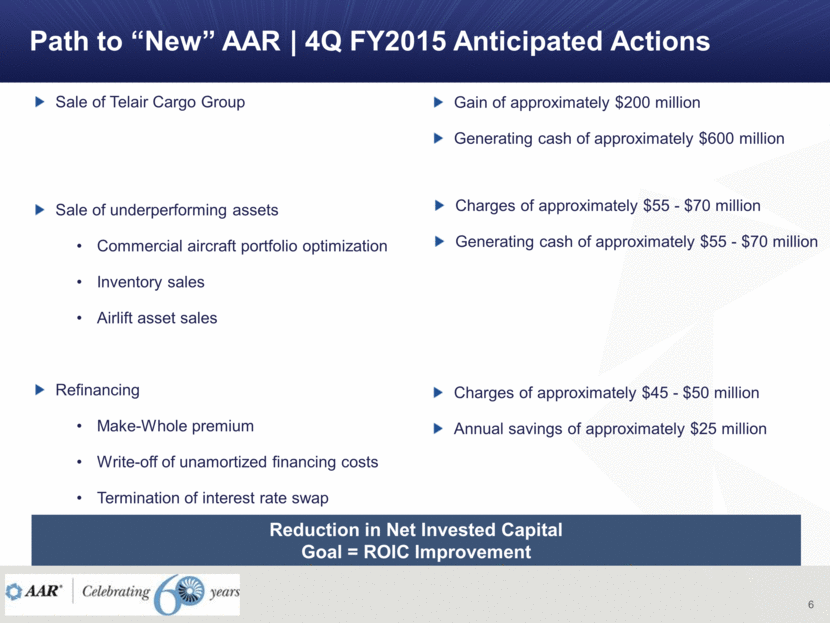
6 Path to “New” AAR 4Q FY2015 Anticipated Actions Sale of Telair Cargo Group Sale of underperforming assets Commercial aircraft portfolio optimization Inventory sales Airlift asset sales Refinancing Make-Whole premium Write-off of unamortized financing costs Termination of interest rate swap Reduction in Net Invested Capital Goal = ROIC Improvement Gain of approximately $200 million Generating cash of approximately $600 million Charges of approximately $55 - $70 million Generating cash of approximately $55 - $70 million Charges of approximately $45 - $50 million Annual savings of approximately $25 million |

|
|
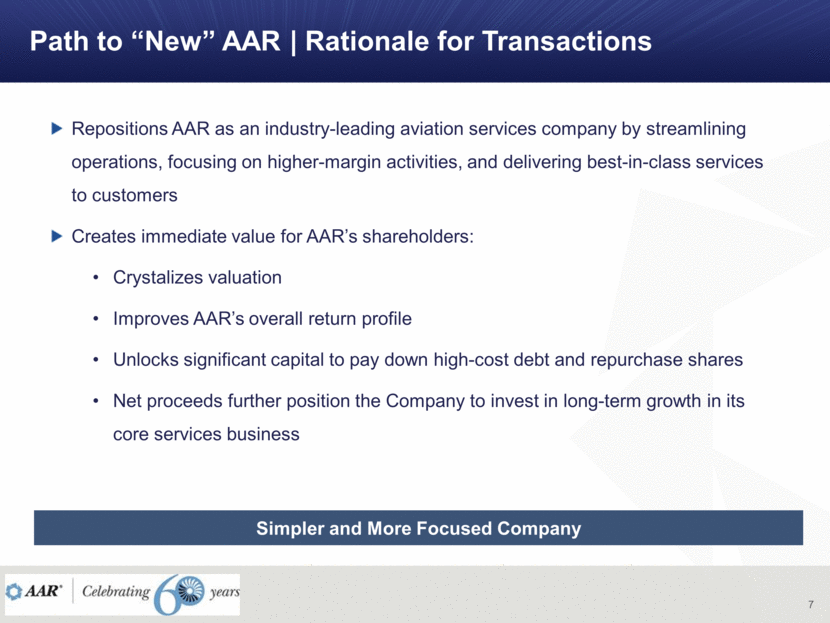
7 Path to “New” AAR Rationale for Transactions Repositions AAR as an industry-leading aviation services company by streamlining operations, focusing on higher-margin activities, and delivering best-in-class services to customers Creates immediate value for AAR’s shareholders: Crystalizes valuation Improves AAR’s overall return profile Unlocks significant capital to pay down high-cost debt and repurchase shares Net proceeds further position the Company to invest in long-term growth in its core services business Simpler and More Focused Company |

|
|
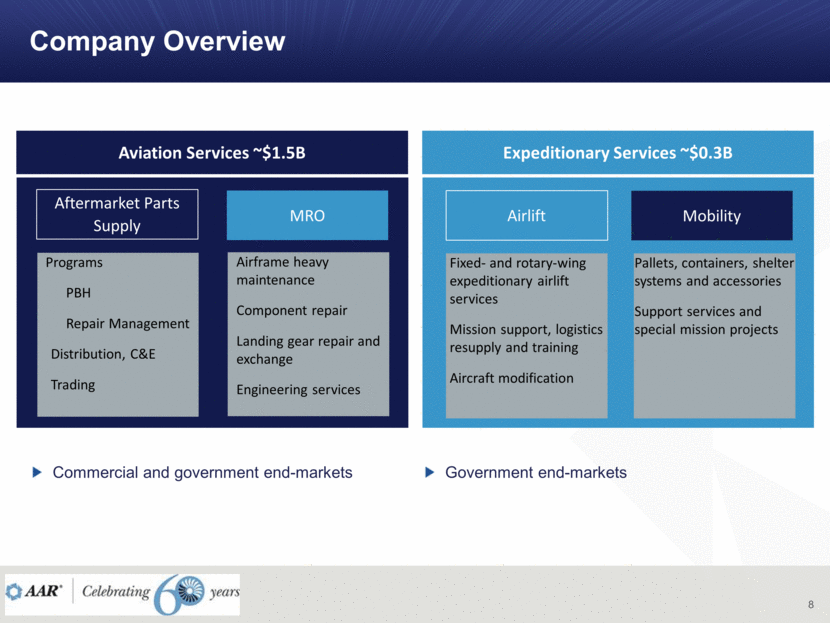
Company Overview 8 Aftermarket Parts Supply Aviation Services ~$1.5B Airlift Mobility Expeditionary Services ~$0.3B Programs PBH Repair Management Distribution, C&E Trading Fixed- and rotary-wing expeditionary airlift services Mission support, logistics resupply and training Aircraft modification Pallets, containers, shelter systems and accessories Support services and special mission projects Commercial and government end-markets Government end-markets MRO Airframe heavy maintenance Component repair Landing gear repair and exchange Engineering services |
|
|
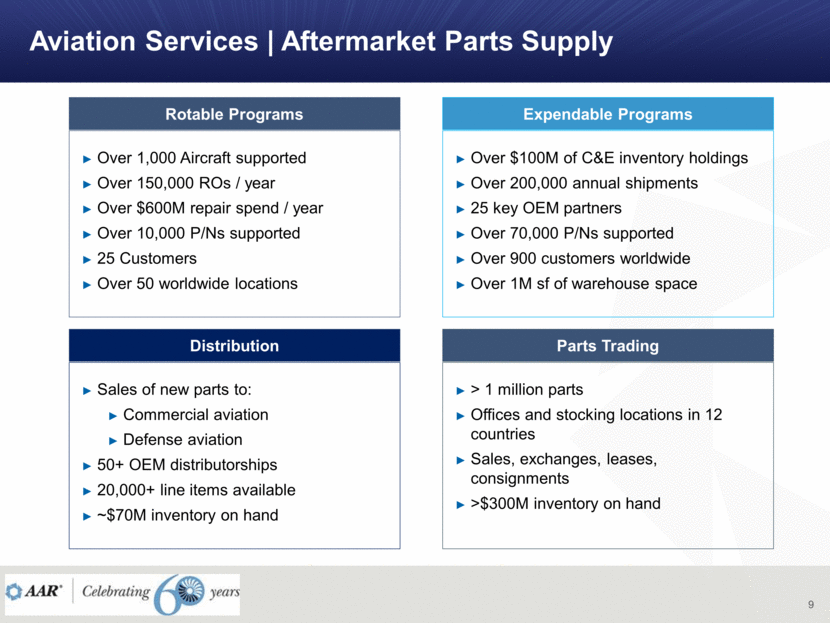
Aviation Services Aftermarket Parts Supply 9 Over 1,000 Aircraft supported Over 150,000 ROs / year Over $600M repair spend / year Over 10,000 P/Ns supported 25 Customers Over 50 worldwide locations Over $100M of C&E inventory holdings Over 200,000 annual shipments 25 key OEM partners Over 70,000 P/Ns supported Over 900 customers worldwide Over 1M sf of warehouse space Rotable Programs Expendable Programs Sales of new parts to: Commercial aviation Defense aviation 50+ OEM distributorships 20,000+ line items available ~$70M inventory on hand > 1 million parts Offices and stocking locations in 12 countries Sales, exchanges, leases, consignments >$300M inventory on hand Distribution Parts Trading |
|
|
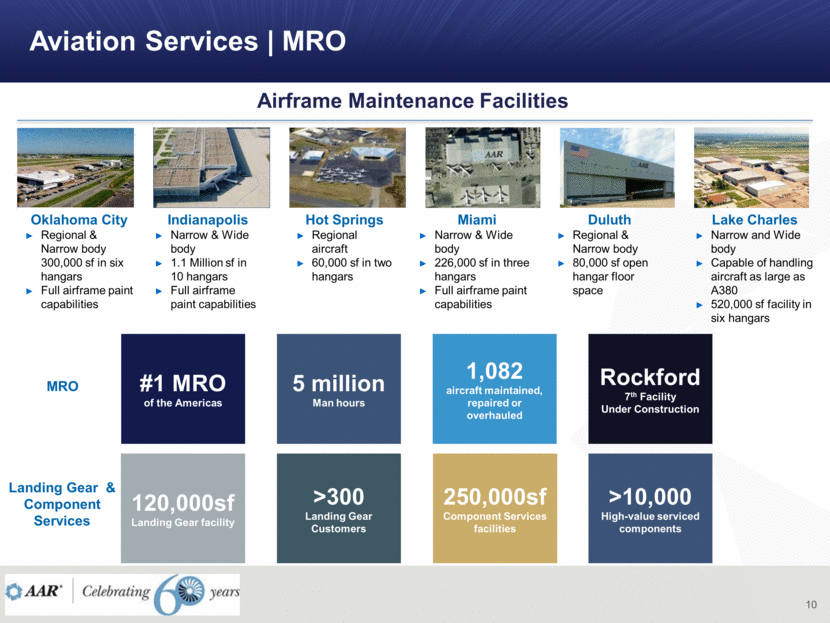
Aviation Services MRO 10 Oklahoma City Regional & Narrow body 300,000 sf in six hangars Full airframe paint capabilities Miami Narrow & Wide body 226,000 sf in three hangars Full airframe paint capabilities Indianapolis Narrow & Wide body 1.1 Million sf in 10 hangars Full airframe paint capabilities Hot Springs Regional aircraft 60,000 sf in two hangars Duluth Regional & Narrow body 80,000 sf open hangar floor space Lake Charles Narrow and Wide body Capable of handling aircraft as large as A380 520,000 sf facility in six hangars Airframe Maintenance Facilities 1,082 aircraft maintained, repaired or overhauled 5 million Man hours #1 MRO of the Americas Rockford 7th Facility Under Construction 120,000sf Landing Gear facility >300 Landing Gear Customers 250,000sf Component Services facilities >10,000 High-value serviced components MRO Landing Gear & Component Services |

|
|
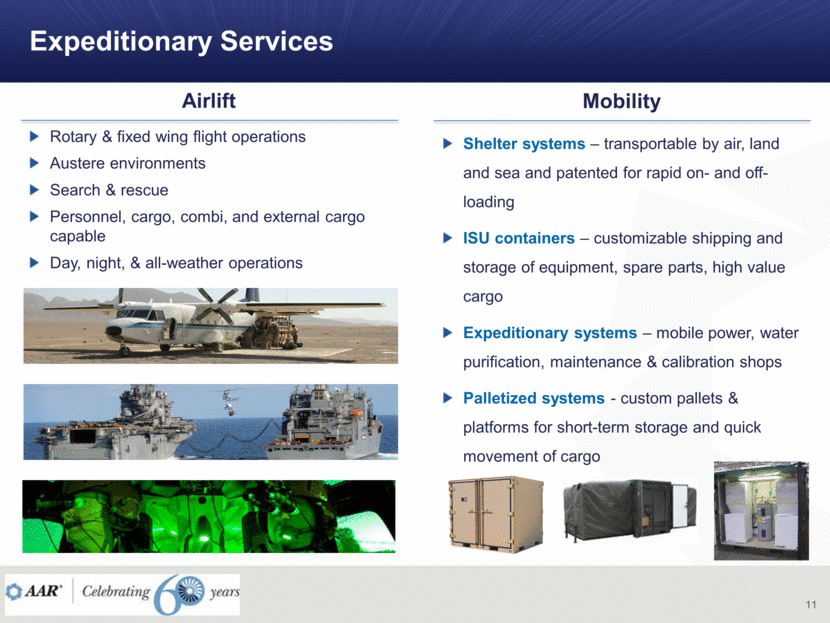
Expeditionary Services 11 Airlift Mobility Rotary & fixed wing flight operations Austere environments Search & rescue Personnel, cargo, combi, and external cargo capable Day, night, & all-weather operations Shelter systems – transportable by air, land and sea and patented for rapid on- and off-loading ISU containers – customizable shipping and storage of equipment, spare parts, high value cargo Expeditionary systems – mobile power, water purification, maintenance & calibration shops Palletized systems - custom pallets & platforms for short-term storage and quick movement of cargo |

|
|
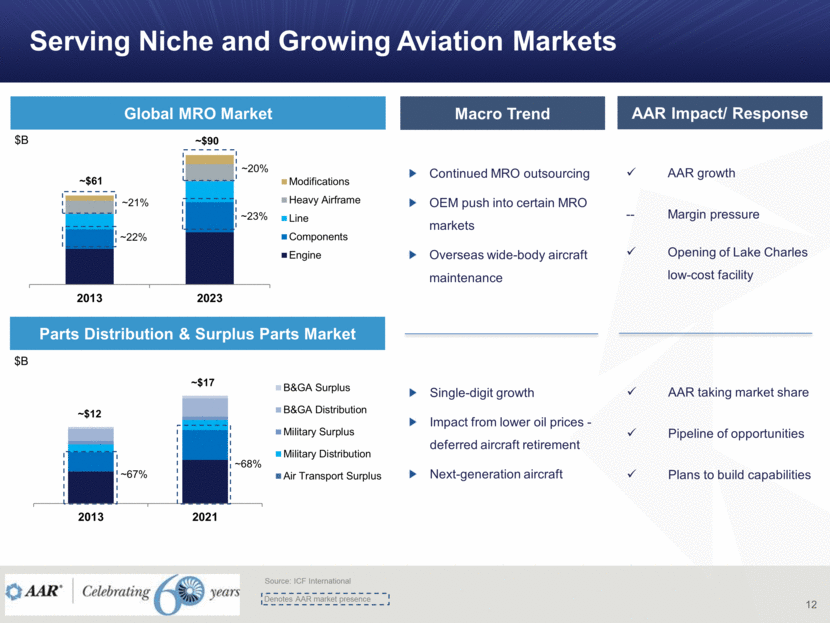
Serving Niche and Growing Aviation Markets 12 Global MRO Market ~$61 ~$90 $B Parts Distribution & Surplus Parts Market ~$12 ~$17 $B ~68% ~67% Source: ICF International ~20% ~21% Denotes AAR market presence ~23% ~22% Continued MRO outsourcing OEM push into certain MRO markets Overseas wide-body aircraft maintenance Macro Trend AAR Impact/ Response AAR growth -- Margin pressure Opening of Lake Charles low-cost facility Single-digit growth Impact from lower oil prices - deferred aircraft retirement Next-generation aircraft AAR taking market share Pipeline of opportunities Plans to build capabilities 2013 2023 Modifications Heavy Airframe Line Components Engine 2013 2021 B&GA Surplus B&GA Distribution Military Surplus Military Distribution Air Transport Surplus |
|
|
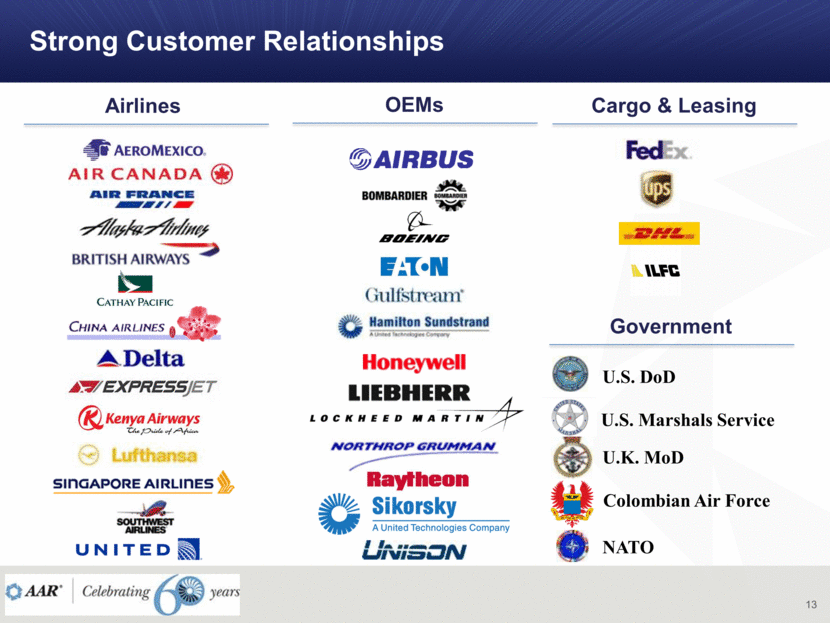
Strong Customer Relationships 13 NATO U.S. DoD U.K. MoD Colombian Air Force U.S. Marshals Service Airlines OEMs Cargo & Leasing Government |

|
|
Financial Performance 14 |
|
|
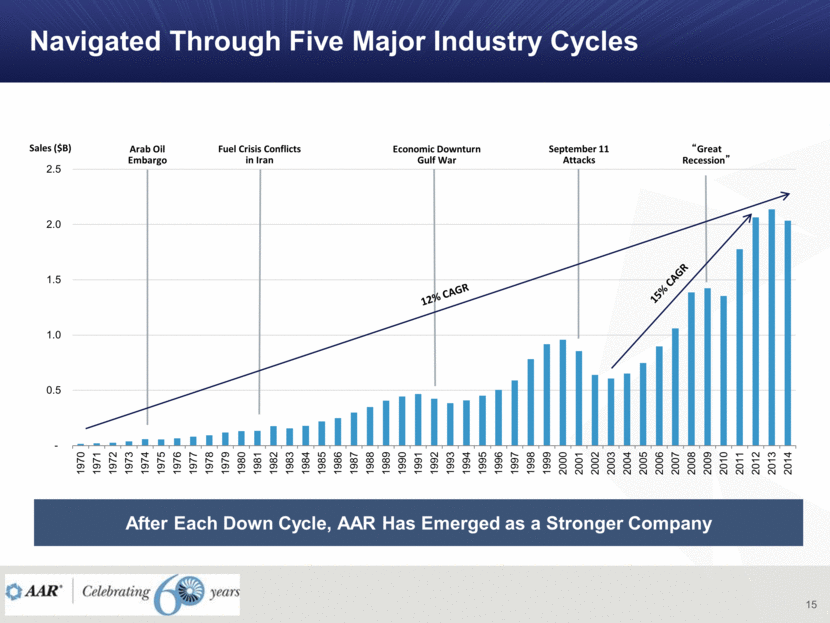
Navigated Through Five Major Industry Cycles 15 Arab Oil Embargo Fuel Crisis Conflicts in Iran Economic Downturn Gulf War September 11 Attacks “Great Recession” 12% CAGR Sales ($B) After Each Down Cycle, AAR Has Emerged as a Stronger Company 15% CAGR - 0.5 1.0 1.5 2.0 2.5 1970 1971 1972 1973 1974 1975 1976 1977 1978 1979 1980 1981 1982 1983 1984 1985 1986 1987 1988 1989 1990 1991 1992 1993 1994 1995 1996 1997 1998 1999 2000 2001 2002 2003 2004 2005 2006 2007 2008 2009 2010 2011 2012 2013 2014 |

|
|
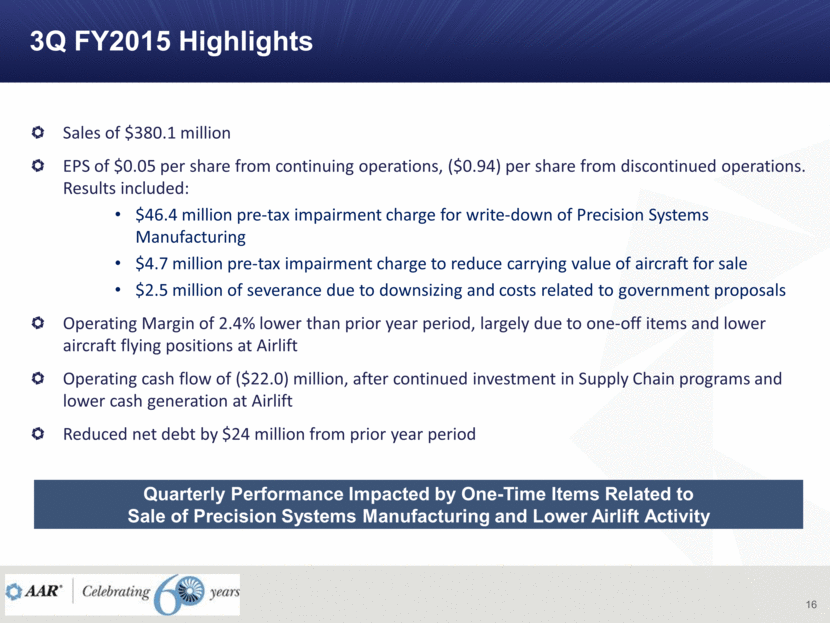
3Q FY2015 Highlights 16 Sales of $380.1 million EPS of $0.05 per share from continuing operations, ($0.94) per share from discontinued operations. Results included: $46.4 million pre-tax impairment charge for write-down of Precision Systems Manufacturing $4.7 million pre-tax impairment charge to reduce carrying value of aircraft for sale $2.5 million of severance due to downsizing and costs related to government proposals Operating Margin of 2.4% lower than prior year period, largely due to one-off items and lower aircraft flying positions at Airlift Operating cash flow of ($22.0) million, after continued investment in Supply Chain programs and lower cash generation at Airlift Reduced net debt by $24 million from prior year period Quarterly Performance Impacted by One-Time Items Related to Sale of Precision Systems Manufacturing and Lower Airlift Activity |

|
|
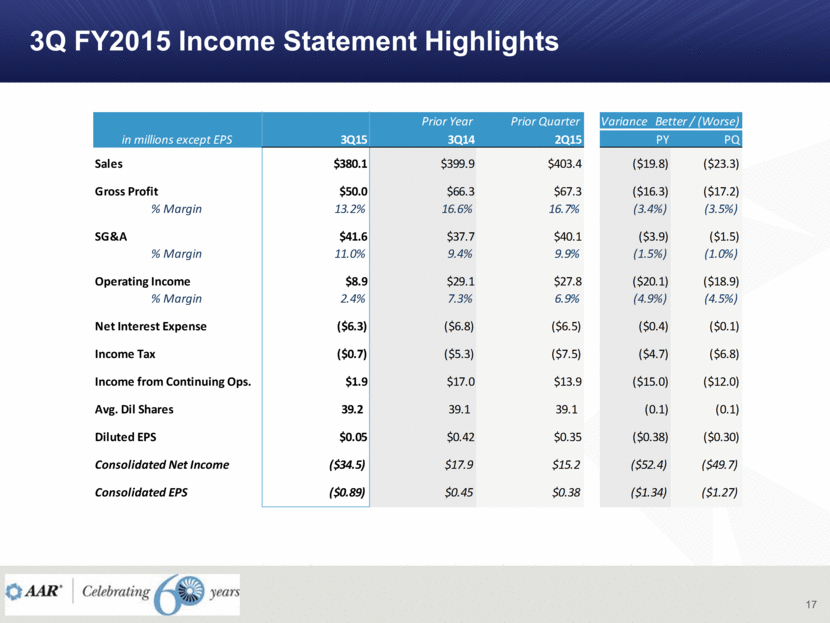
3Q FY2015 Income Statement Highlights 17 Prior Year Prior Quarter in millions except EPS 3Q15 3Q14 2Q15 PY PQ Sales $380.1 $399.9 $403.4 ($19.8) ($23.3) Gross Profit $50.0 $66.3 $67.3 ($16.3) ($17.2) % Margin 13.2% 16.6% 16.7% (3.4%) (3.5%) SG&A $41.6 $37.7 $40.1 ($3.9) ($1.5) % Margin 11.0% 9.4% 9.9% (1.5%) (1.0%) Operating Income $8.9 $29.1 $27.8 ($20.1) ($18.9) % Margin 2.4% 7.3% 6.9% (4.9%) (4.5%) Net Interest Expense ($6.3) ($6.8) ($6.5) ($0.4) ($0.1) Income Tax ($0.7) ($5.3) ($7.5) ($4.7) ($6.8) Income from Continuing Ops. $1.9 $17.0 $13.9 ($15.0) ($12.0) Avg. Dil Shares 39.2 39.1 39.1 (0.1) (0.1) Diluted EPS $0.05 $0.42 $0.35 ($0.38) ($0.30) Consolidated Net Income ($34.5) $17.9 $15.2 ($52.4) ($49.7) Consolidated EPS ($0.89) $0.45 $0.38 ($1.34) ($1.27) Variance Better / (Worse) |
|
|
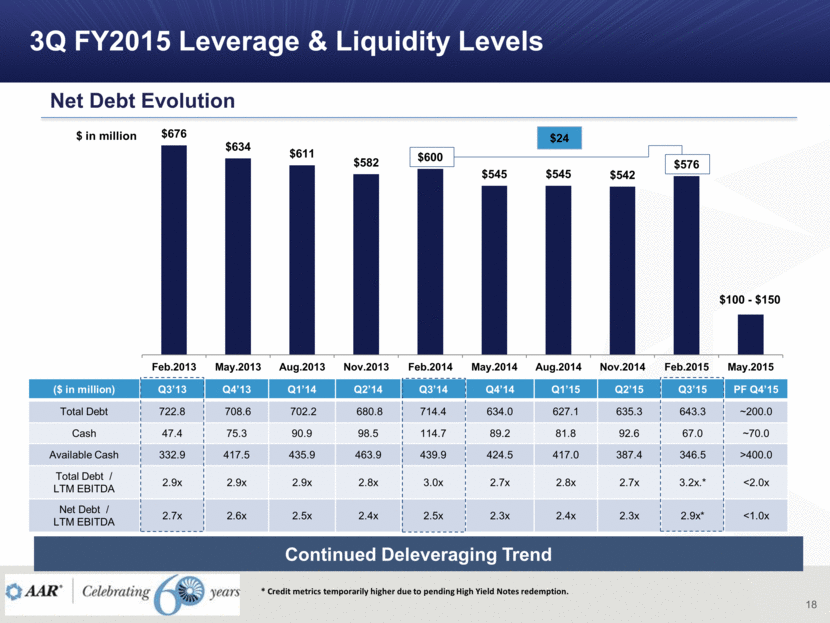
3Q FY2015 Leverage & Liquidity Levels 18 $ in million ($ in million) Q3’13 Q4’13 Q1’14 Q2’14 Q3’14 Q4’14 Q1’15 Q2’15 Q3’15 PF Q4’15 Total Debt 722.8 708.6 702.2 680.8 714.4 634.0 627.1 635.3 643.3 ~200.0 Cash 47.4 75.3 90.9 98.5 114.7 89.2 81.8 92.6 67.0 ~70.0 Available Cash 332.9 417.5 435.9 463.9 439.9 424.5 417.0 387.4 346.5 >400.0 Total Debt / LTM EBITDA 2.9x 2.9x 2.9x 2.8x 3.0x 2.7x 2.8x 2.7x 3.2x.* <2.0x Net Debt / LTM EBITDA 2.7x 2.6x 2.5x 2.4x 2.5x 2.3x 2.4x 2.3x 2.9x* <1.0x Continued Deleveraging Trend $24 * Credit metrics temporarily higher due to pending High Yield Notes redemption. Net Debt Evolution $100 - $150 $676 $634 $611 $582 $600 $545 $545 $542 $576 $130 Feb.2013 May.2013 Aug.2013 Nov.2013 Feb.2014 May.2014 Aug.2014 Nov.2014 Feb.2015 May.2015 |
|
|
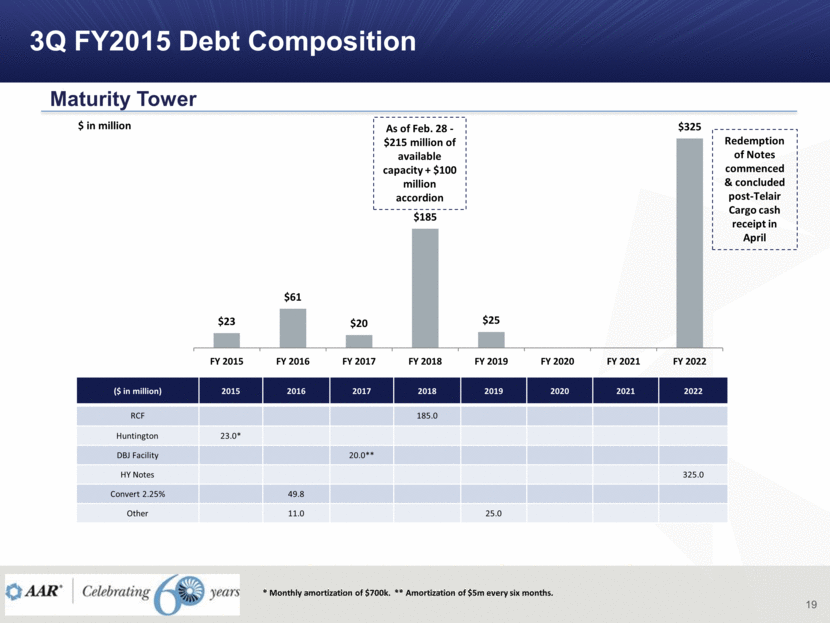
3Q FY2015 Debt Composition 19 Maturity Tower $ in million ($ in million) 2015 2016 2017 2018 2019 2020 2021 2022 RCF 185.0 Huntington 23.0* DBJ Facility 20.0** HY Notes 325.0 Convert 2.25% 49.8 Other 11.0 25.0 * Monthly amortization of $700k. ** Amortization of $5m every six months. As of Feb. 28 - $215 million of available capacity + $100 million accordion Redemption of Notes commenced & concluded post-Telair Cargo cash receipt in April $23 $61 $20 $185 $25 $325 FY 2015 FY 2016 FY 2017 FY 2018 FY 2019 FY 2020 FY 2021 FY 2022 |

|
|
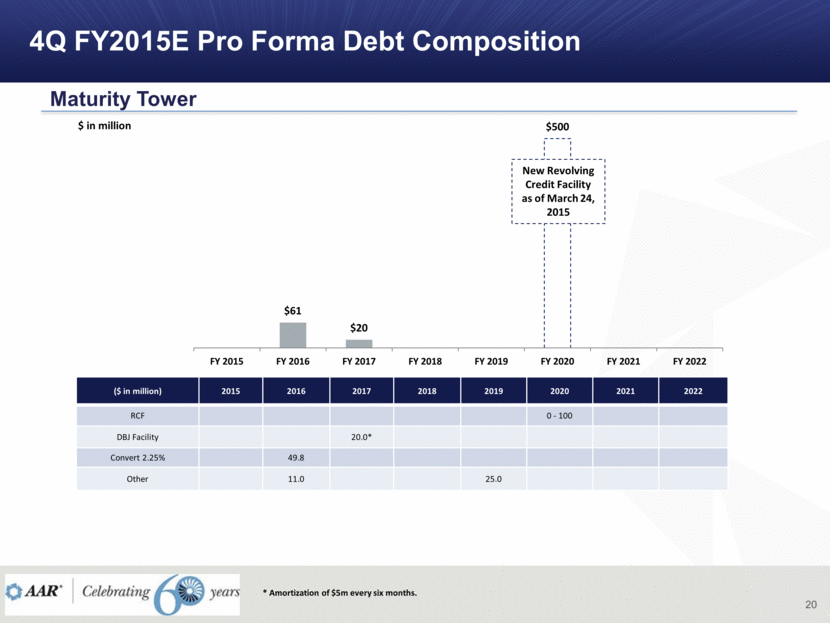
4Q FY2015E Pro Forma Debt Composition 20 Maturity Tower $ in million ($ in million) 2015 2016 2017 2018 2019 2020 2021 2022 RCF 0 - 100 DBJ Facility 20.0* Convert 2.25% 49.8 Other 11.0 25.0 * Amortization of $5m every six months. New Revolving Credit Facility as of March 24, 2015 $61 $20 $500 FY 2015 FY 2016 FY 2017 FY 2018 FY 2019 FY 2020 FY 2021 FY 2022 |
|
|
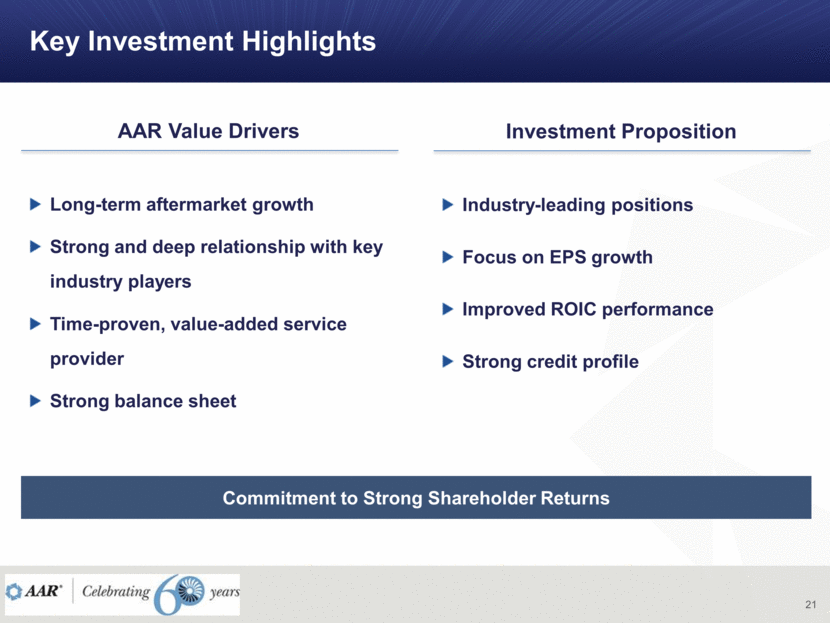
Key Investment Highlights 21 Commitment to Strong Shareholder Returns Long-term aftermarket growth Strong and deep relationship with key industry players Time-proven, value-added service provider Strong balance sheet AAR Value Drivers Investment Proposition Industry-leading positions Focus on EPS growth Improved ROIC performance Strong credit profile |
|
|
Appendix 22 |

|
|
23 Non-GAAP Disclosure Reconciliation ($ in millions) FY2008 FY2009 FY2010 FY2011 FY2012 FY2013 FY2014 Net income attributable to AAR $68.2 $56.8 $44.6 $69.8 $67.7 $55.0 $73.2 Provision for income taxes 36.6 27.5 21.0 33.6 25.5 26.8 32.1 Interest expense, net 27.7 30.0 25.8 30.3 36.5 40.1 40.4 Loss (gain) on debt extinguishment 2.0 (14.7) (0.9) (0.1) 0.7 0.3 - Loss (gain) on sale of investments (0.5) 1.4 1.2 - - - - Loss from discontinued operations net of tax 0.6 1.9 - - - - - Depreciation & amortization 39.6 40.1 38.9 57.8 72.0 79.7 80.4 Amortization of stock-based compensation 6.4 6.2 9.3 12.3 12.5 11.1 8.7 Gain on sale of product line - - - (5.9) - - - Impairment & non-recurring charges - 31.1 - 5.3 13.2 29.8 - Adjusted EBITDA $180.6 $180.3 $139.9 $203.1 $228.1 $242.8 $234.8 Pursuant to SEC Regulation G, the Company has included the following reconciliation of operating income reported on the basis of Generally Accepted Accounting Principles (“GAAP”) to Adjusted EBITDA on a non-GAAP basis. The Company believes the non-GAAP Adjusted EBITDA and ratios using Adjusted EBITDA are used by banks, debt holders and investors as important measures of the Company’s performance and ability to service debt obligations. |
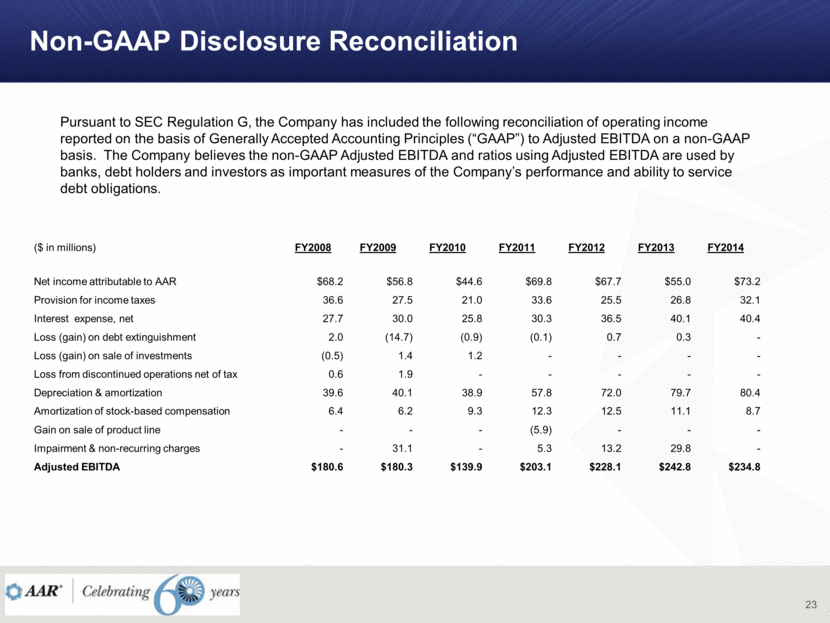
Exhibit 99.2
|
|
AAR CORP. Bernstein Industrial & Basic Materials Summit New York May 7 - 8, 2015 |

|
|
Forward-Looking Statements 2 This presentation includes certain statements relating to future results, which are forward-looking statements as that term is defined in the Private Securities Litigation Reform Act of 1995. These forward-looking statements are based on beliefs of Company management, as well as assumptions and estimates based on information currently available to the Company, and are subject to certain risks and uncertainties that could cause actual results to differ materially from historical results or those anticipated, including those factors discussed under Item 1A, entitled “Risk Factors,” included in the Company’s Form 10-K for the fiscal year ended May 31, 2014. Should one or more of these risks or uncertainties materialize adversely, or should underlying assumptions or estimates prove incorrect, actual results may vary materially from those described. These events and uncertainties are difficult or impossible to predict accurately and many are beyond the Company’s control. The Company assumes no obligation to update any forward-looking statements to reflect events or circumstances after the date of such statements or to reflect the occurrence of anticipated or unanticipated events. For additional information, see the comments included in AAR’s filings with the Securities and Exchange Commission. |

|
|
Company Overview 3 |

|
|
Established Player Serving the Global Aviation Services Market 4 Leading provider of: Aviation Services Expeditionary Services to commercial and defense / govt. markets NYSE: AIR $1.8B revenue Over 5,000 employees at more than 60 countries worldwide Close-to-customer business model |
|
|
5 Path to “New” AAR Recent Corporate Developments Sold Telair Cargo Group – Telair Europe, Nordisk and U.S. Cargo loading manufacturing units Transaction value is $725 million (subject to adjustments) Net Proceeds greater than $600 million (after estimated cash taxes and expenses) Discontinued Operations of Precision Systems Manufacturing Recorded impairment charge of $46 million in 3Q FY2015 Sale process ongoing and expected to be finalized in 1Q FY2016 Recapitalization Redeemed $325 million 7.25% High Yield Notes $45.6 million make-whole premium $23.6 million in annual interest cost savings Refinanced revolving credit facility Improved credit ratings S&P upgraded AAR Corp. to BB+, with stable outlook Received Board authorization for $250 million share repurchase Commenced Dutch Tender for $135 million (closing target date May 22, 2015) Repurchase price range $29.00 - $32.00 per share Reduction of approximately 20% of corporate costs Executing Portfolio Optimization & Recapitalization |
|
|
6 Path to “New” AAR 4Q FY2015 Anticipated Actions Sale of Telair Cargo Group Sale of underperforming assets Commercial aircraft portfolio optimization Inventory sales Airlift asset sales Refinancing Make-Whole premium Write-off of unamortized financing costs Termination of interest rate swap Reduction in Net Invested Capital Goal = ROIC Improvement Gain of approximately $200 million Generating cash of approximately $600 million Charges of approximately $55 - $70 million Generating cash of approximately $55 - $70 million Charges of approximately $45 - $50 million Annual savings of approximately $25 million |
|
|
7 Path to “New” AAR Rationale for Transactions Repositions AAR as an industry-leading aviation services company by streamlining operations, focusing on higher-margin activities, and delivering best-in-class services to customers Creates immediate value for AAR’s shareholders: Crystalizes valuation Improves AAR’s overall return profile Unlocks significant capital to pay down high-cost debt and repurchase shares Net proceeds further position the Company to invest in long-term growth in its core services business Simpler and More Focused Company |
|
|
Company Overview 8 Aftermarket Parts Supply Aviation Services ~$1.5B Airlift Mobility Expeditionary Services ~$0.3B Programs PBH Repair Management Distribution, C&E Trading Fixed- and rotary-wing expeditionary airlift services Mission support, logistics resupply and training Aircraft modification Pallets, containers, shelter systems and accessories Support services and special mission projects Commercial and government end-markets Government end-markets MRO Airframe heavy maintenance Component repair Landing gear repair and exchange Engineering services |

|
|
Aviation Services Aftermarket Parts Supply 9 Over 1,000 Aircraft supported Over 150,000 ROs / year Over $600M repair spend / year Over 10,000 P/Ns supported 25 Customers Over 50 worldwide locations Over $100M of C&E inventory holdings Over 200,000 annual shipments 25 key OEM partners Over 70,000 P/Ns supported Over 900 customers worldwide Over 1M sf of warehouse space Rotable Programs Expendable Programs Sales of new parts to: Commercial aviation Defense aviation 50+ OEM distributorships 20,000+ line items available ~$70M inventory on hand > 1 million parts Offices and stocking locations in 12 countries Sales, exchanges, leases, consignments >$300M inventory on hand Distribution Parts Trading |

|
|
Aviation Services MRO 10 Oklahoma City Regional & Narrow body 300,000 sf in six hangars Full airframe paint capabilities Miami Narrow & Wide body 226,000 sf in three hangars Full airframe paint capabilities Indianapolis Narrow & Wide body 1.1 Million sf in 10 hangars Full airframe paint capabilities Hot Springs Regional aircraft 60,000 sf in two hangars Duluth Regional & Narrow body 80,000 sf open hangar floor space Lake Charles Narrow and Wide body Capable of handling aircraft as large as A380 520,000 sf facility in six hangars Airframe Maintenance Facilities 1,082 aircraft maintained, repaired or overhauled 5 million Man hours #1 MRO of the Americas Rockford 7th Facility Under Construction 120,000sf Landing Gear facility >300 Landing Gear Customers 250,000sf Component Services facilities >10,000 High-value serviced components MRO Landing Gear & Component Services |
|
|
Expeditionary Services 11 Airlift Mobility Rotary & fixed wing flight operations Austere environments Search & rescue Personnel, cargo, combi, and external cargo capable Day, night, & all-weather operations Shelter systems – transportable by air, land and sea and patented for rapid on- and off-loading ISU containers – customizable shipping and storage of equipment, spare parts, high value cargo Expeditionary systems – mobile power, water purification, maintenance & calibration shops Palletized systems - custom pallets & platforms for short-term storage and quick movement of cargo |
|
|
Serving Niche and Growing Aviation Markets 12 Global MRO Market ~$61 ~$90 $B Parts Distribution & Surplus Parts Market ~$12 ~$17 $B ~68% ~67% Source: ICF International ~20% ~21% Denotes AAR market presence ~23% ~22% Continued MRO outsourcing OEM push into certain MRO markets Overseas wide-body aircraft maintenance Macro Trend AAR Impact/ Response AAR growth -- Margin pressure Opening of Lake Charles low-cost facility Single-digit growth Impact from lower oil prices - deferred aircraft retirement Next-generation aircraft AAR taking market share Pipeline of opportunities Plans to build capabilities 2013 2023 Modifications Heavy Airframe Line Components Engine 2013 2021 B&GA Surplus B&GA Distribution Military Surplus Military Distribution Air Transport Surplus |

|
|
Strong Customer Relationships 13 NATO U.S. DoD U.K. MoD Colombian Air Force U.S. Marshals Service Airlines OEMs Cargo & Leasing Government |
|
|
Financial Performance 14 |

|
|
Navigated Through Five Major Industry Cycles 15 Arab Oil Embargo Fuel Crisis Conflicts in Iran Economic Downturn Gulf War September 11 Attacks “Great Recession” 12% CAGR Sales ($B) After Each Down Cycle, AAR Has Emerged as a Stronger Company 15% CAGR - 0.5 1.0 1.5 2.0 2.5 1970 1971 1972 1973 1974 1975 1976 1977 1978 1979 1980 1981 1982 1983 1984 1985 1986 1987 1988 1989 1990 1991 1992 1993 1994 1995 1996 1997 1998 1999 2000 2001 2002 2003 2004 2005 2006 2007 2008 2009 2010 2011 2012 2013 2014 |
|
|
3Q FY2015 Highlights 16 Sales of $380.1 million EPS of $0.05 per share from continuing operations, ($0.94) per share from discontinued operations. Results included: $46.4 million pre-tax impairment charge for write-down of Precision Systems Manufacturing $4.7 million pre-tax impairment charge to reduce carrying value of aircraft for sale $2.5 million of severance due to downsizing and costs related to government proposals Operating Margin of 2.4% lower than prior year period, largely due to one-off items and lower aircraft flying positions at Airlift Operating cash flow of ($22.0) million, after continued investment in Supply Chain programs and lower cash generation at Airlift Reduced net debt by $24 million from prior year period Quarterly Performance Impacted by One-Time Items Related to Sale of Precision Systems Manufacturing and Lower Airlift Activity |
|
|
3Q FY2015 Income Statement Highlights 17 Prior Year Prior Quarter in millions except EPS 3Q15 3Q14 2Q15 PY PQ Sales $380.1 $399.9 $403.4 ($19.8) ($23.3) Gross Profit $50.0 $66.3 $67.3 ($16.3) ($17.2) % Margin 13.2% 16.6% 16.7% (3.4%) (3.5%) SG&A $41.6 $37.7 $40.1 ($3.9) ($1.5) % Margin 11.0% 9.4% 9.9% (1.5%) (1.0%) Operating Income $8.9 $29.1 $27.8 ($20.1) ($18.9) % Margin 2.4% 7.3% 6.9% (4.9%) (4.5%) Net Interest Expense ($6.3) ($6.8) ($6.5) ($0.4) ($0.1) Income Tax ($0.7) ($5.3) ($7.5) ($4.7) ($6.8) Income from Continuing Ops. $1.9 $17.0 $13.9 ($15.0) ($12.0) Avg. Dil Shares 39.2 39.1 39.1 (0.1) (0.1) Diluted EPS $0.05 $0.42 $0.35 ($0.38) ($0.30) Consolidated Net Income ($34.5) $17.9 $15.2 ($52.4) ($49.7) Consolidated EPS ($0.89) $0.45 $0.38 ($1.34) ($1.27) Variance Better / (Worse) |

|
|
3Q FY2015 Leverage & Liquidity Levels 18 $ in million ($ in million) Q3’13 Q4’13 Q1’14 Q2’14 Q3’14 Q4’14 Q1’15 Q2’15 Q3’15 PF Q4’15 Total Debt 722.8 708.6 702.2 680.8 714.4 634.0 627.1 635.3 643.3 ~200.0 Cash 47.4 75.3 90.9 98.5 114.7 89.2 81.8 92.6 67.0 ~70.0 Available Cash 332.9 417.5 435.9 463.9 439.9 424.5 417.0 387.4 346.5 >400.0 Total Debt / LTM EBITDA 2.9x 2.9x 2.9x 2.8x 3.0x 2.7x 2.8x 2.7x 3.2x.* <2.0x Net Debt / LTM EBITDA 2.7x 2.6x 2.5x 2.4x 2.5x 2.3x 2.4x 2.3x 2.9x* <1.0x Continued Deleveraging Trend $24 * Credit metrics temporarily higher due to pending High Yield Notes redemption. Net Debt Evolution $100 - $150 $676 $634 $611 $582 $600 $545 $545 $542 $576 $130 Feb.2013 May.2013 Aug.2013 Nov.2013 Feb.2014 May.2014 Aug.2014 Nov.2014 Feb.2015 May.2015 |

|
|
3Q FY2015 Debt Composition 19 Maturity Tower $ in million ($ in million) 2015 2016 2017 2018 2019 2020 2021 2022 RCF 185.0 Huntington 23.0* DBJ Facility 20.0** HY Notes 325.0 Convert 2.25% 49.8 Other 11.0 25.0 * Monthly amortization of $700k. ** Amortization of $5m every six months. As of Feb. 28 - $215 million of available capacity + $100 million accordion Redemption of Notes commenced & concluded post-Telair Cargo cash receipt in April $23 $61 $20 $185 $25 $325 FY 2015 FY 2016 FY 2017 FY 2018 FY 2019 FY 2020 FY 2021 FY 2022 |
|
|
4Q FY2015E Pro Forma Debt Composition 20 Maturity Tower $ in million ($ in million) 2015 2016 2017 2018 2019 2020 2021 2022 RCF 0 - 100 DBJ Facility 20.0* Convert 2.25% 49.8 Other 11.0 25.0 * Amortization of $5m every six months. New Revolving Credit Facility as of March 24, 2015 $61 $20 $500 FY 2015 FY 2016 FY 2017 FY 2018 FY 2019 FY 2020 FY 2021 FY 2022 |

|
|
Key Investment Highlights 21 Commitment to Strong Shareholder Returns Long-term aftermarket growth Strong and deep relationship with key industry players Time-proven, value-added service provider Strong balance sheet AAR Value Drivers Investment Proposition Industry-leading positions Focus on EPS growth Improved ROIC performance Strong credit profile |

|
|
Appendix 22 |
|
|
23 Non-GAAP Disclosure Reconciliation ($ in millions) FY2008 FY2009 FY2010 FY2011 FY2012 FY2013 FY2014 Net income attributable to AAR $68.2 $56.8 $44.6 $69.8 $67.7 $55.0 $73.2 Provision for income taxes 36.6 27.5 21.0 33.6 25.5 26.8 32.1 Interest expense, net 27.7 30.0 25.8 30.3 36.5 40.1 40.4 Loss (gain) on debt extinguishment 2.0 (14.7) (0.9) (0.1) 0.7 0.3 - Loss (gain) on sale of investments (0.5) 1.4 1.2 - - - - Loss from discontinued operations net of tax 0.6 1.9 - - - - - Depreciation & amortization 39.6 40.1 38.9 57.8 72.0 79.7 80.4 Amortization of stock-based compensation 6.4 6.2 9.3 12.3 12.5 11.1 8.7 Gain on sale of product line - - - (5.9) - - - Impairment & non-recurring charges - 31.1 - 5.3 13.2 29.8 - Adjusted EBITDA $180.6 $180.3 $139.9 $203.1 $228.1 $242.8 $234.8 Pursuant to SEC Regulation G, the Company has included the following reconciliation of operating income reported on the basis of Generally Accepted Accounting Principles (“GAAP”) to Adjusted EBITDA on a non-GAAP basis. The Company believes the non-GAAP Adjusted EBITDA and ratios using Adjusted EBITDA are used by banks, debt holders and investors as important measures of the Company’s performance and ability to service debt obligations. |

Serious News for Serious Traders! Try StreetInsider.com Premium Free!
You May Also Be Interested In
- AAR Corporation (AIR) PT Raised to $83 at Benchmark
- Peralta Community College District Seeks More Outstanding Leaders
- MCRO Edibles Launches Revolutionary Microdosed Edible Line With Specific Functional Mushrooms for Predictable Cannabis Experiences
Create E-mail Alert Related Categories
SEC FilingsSign up for StreetInsider Free!
Receive full access to all new and archived articles, unlimited portfolio tracking, e-mail alerts, custom newswires and RSS feeds - and more!
