

Form 6-K VimpelCom Ltd. For: May 13
 Tweet
Tweet Share
ShareTable of Contents
UNITED STATES
SECURITIES AND EXCHANGE COMMISSION
Washington, D.C. 20549
FORM 6-K
Report of Foreign Private Issuer
Pursuant to Rule 13a-16 or 15d-16
under the Securities Exchange Act of 1934
For the month of May 2015
Commission File Number 1-34694
VimpelCom Ltd.
(Translation of registrant’s name into English)
The Rock Building, Claude Debussylaan 88, 1082 MD, Amsterdam, the Netherlands
(Address of principal executive offices)
Indicate by check mark whether the registrant files or will file annual reports under cover Form 20-F or Form 40-F.
Form 20-F x Form 40-F ¨
Indicate by check mark if the registrant is submitting the Form 6-K in paper as permitted by Regulation S-T Rule 101(b)(1): ¨.
Indicate by check mark if the registrant is submitting the Form 6-K in paper as permitted by Regulation S-T Rule 101(b)(7): ¨.
Indicate by check mark whether the registrant by furnishing the information contained in this Form is also thereby furnishing the information to the Commission pursuant to Rule 12g3-2(b) under the Securities Exchange Act of 1934.
Yes ¨ No x
If “Yes” is marked, indicate below the file number assigned to the registrant in connection with Rule 12g3-2(b): 82- .
Table of Contents
SIGNATURES
Pursuant to the requirements of the Securities Exchange Act of 1934, the registrant has duly caused this report to be signed on its behalf by the undersigned, thereunto duly authorized.
| VIMPELCOM LTD. | ||||||
| (Registrant) | ||||||
| Date: May 13, 2015 | ||||||
| By: | /s/ Scott Dresser | |||||
| Name: | Scott Dresser | |||||
| Title: | Group General Counsel | |||||
Table of Contents

VIMPELCOM REPORTS CONTINUED OPERATIONAL IMPROVEMENTS AND
INCREASED EPS IN 1Q15 RESULTS –
ON TRACK TO DELIVER 2015 TARGETS
KEY RESULTS AND DEVELOPMENTS IN 1Q15
| • | Organic1 results in line with management expectations; annual 2015 targets confirmed |
| • | Reported revenue and EBITDA2 impacted by currency headwinds, down 30% YoY and 33% YoY respectively |
| • | Organic revenue and EBITDA decreased 2% YoY and 6% YoY respectively |
| • | Good operational performance with most business units in line or better than the market |
| • | Further debt optimization, realizing interest savings, improving currency mix and maturity profile |
| • | Mobile customer base increased 2% YoY3 to 218 million |
Amsterdam (May 13, 2015) – Netherlands based VimpelCom Ltd. (“VimpelCom”, “Company” or “Group”) (NASDAQ: VIP), a leading global provider of telecommunications services, today announces financial and operating results for the quarter ended March 31, 2015.
JEAN-YVES CHARLIER, CHIEF EXECUTIVE OFFICER, COMMENTS:
“Our reported revenue and EBITDA continue to be impacted by severe adverse currency movements. However, the first quarter results are in line with our expectations and most of our businesses show operational performance at par with or better than the markets we operate in. On an organic basis, service revenue declined 2% and EBITDA by 6% year on year, mainly as a result of the delayed launch of 3G services in Algeria and continuing market weakness in Italy. This was partly offset by service revenue growth in Bangladesh and Ukraine. During the quarter, we have successfully closed the transaction in Algeria, completed the sale of our towers in Italy, acquired a 3G license in Ukraine and launched 4G/LTE services in Georgia. Our customer base grew by 2% and we have made further progress in improving our debt structure. Across the Group, data revenue continues to grow in double digits, and we confirm our guidance for 2015. As the recently appointed Group CEO, I look forward to updating the market on our strategy in August.”
CONSOLIDATED FINANCIAL AND OPERATING HIGHLIGHTS
| USD mln | 1Q15 | 1Q14 | Reported YoY |
Organic1 YoY |
||||||||||||
| Total revenue |
3,515 | 5,024 | (30 | %) | (2 | %) | ||||||||||
| Service revenue |
3,358 | 4,810 | (30 | %) | (2 | %) | ||||||||||
| EBITDA2 |
1,396 | 2,088 | (33 | %) | (6 | %) | ||||||||||
| EBITDA margin2 |
39.7 | % | 41.6 | % | (1.9 | pp) | (1.7 | pp) | ||||||||
| EBIT |
879 | 924 | (5 | %) | ||||||||||||
| Net income attributable to VimpelCom shareholders |
184 | 38 | n.m | |||||||||||||
| EPS, basic (USD) |
0.11 | 0.02 | n.m | |||||||||||||
| Capital expenditures excl. licenses |
407 | 725 | (44 | %) | ||||||||||||
| Operating cash flow (EBITDA less CAPEX) |
989 | 1,363 | (27 | %) | ||||||||||||
| Net debt / LTM EBITDA4 |
2.4 | 2.4 | ||||||||||||||
| Net debt / LTM EBITDA4 excl. Italy |
1.2 | 1.2 | ||||||||||||||
| Total mobile customers (millions)3 |
218.1 | 213.3 | 2 | % | ||||||||||||
| 1) | Revenue and EBITDA organic growth are non-GAAP financial measures that exclude the effect of foreign currency movements and certain items such as liquidations and disposals |
| 2) | EBITDA and EBITDA margin are non-GAAP financial measures. For reconciliation see Attachment D |
| 3) | The numbers exclude customers in 1Q14 and 1Q15 of Wind Canada, CAR, Burundi and Zimbabwe |
| 4) | Normalized LTM EBITDA excluding one-off charges related to the Algeria closing transaction |
For all definitions please see Attachment F
VimpelCom Ltd. 1Q 2015 | 1
Table of Contents
| 4 | ||||
| 6 | ||||
| 11 | ||||
| 13 | ||||
| 15 | ||||
| 16 | ||||
| 17 | ||||
| 18 | ||||
| 20 | ||||
| 21 | ||||
| 23 | ||||
| 25 |
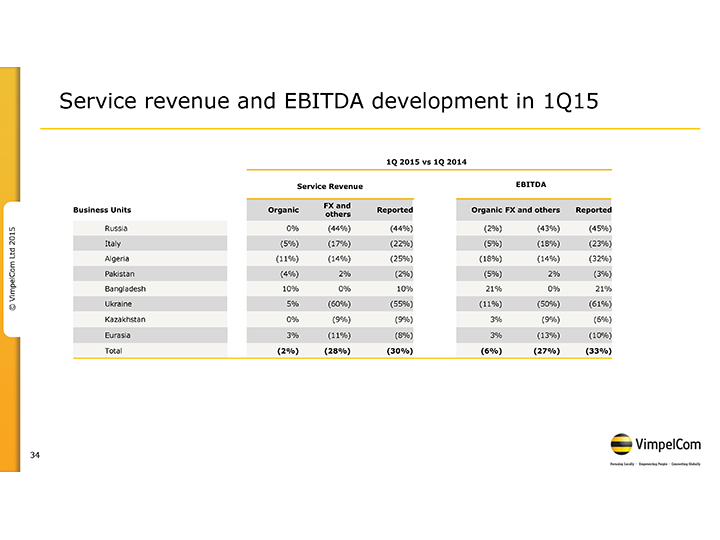
ORGANIC GROWTH REVENUE AND EBITDA
| 1Q15 vs 1Q14 | ||||||||||||||||||||||||
| Service revenue | EBITDA | |||||||||||||||||||||||
| Business Units | Organic | FX and others |
Reported | Organic | FX and others |
Reported | ||||||||||||||||||
| Russia |
0 | % | (44 | %) | (44 | %) | (2 | %) | (43 | %) | (45 | %) | ||||||||||||
| Italy |
(5 | %) | (17 | %) | (22 | %) | (5 | %) | (18 | %) | (23 | %) | ||||||||||||
| Algeria |
(11 | %) | (14 | %) | (25 | %) | (18 | %) | (14 | %) | (32 | %) | ||||||||||||
| Pakistan |
(4 | %) | 2 | % | (2 | %) | (5 | %) | 2 | % | (3 | %) | ||||||||||||
| Bangladesh |
10 | % | 0 | % | 10 | % | 21 | % | 0 | % | 21 | % | ||||||||||||
| Ukraine |
5 | % | (60 | %) | (55 | %) | (11 | %) | (50 | %) | (61 | %) | ||||||||||||
| Kazakhstan |
0 | % | (9 | %) | (9 | %) | 3 | % | (9 | %) | (6 | %) | ||||||||||||
| Eurasia |
3 | % | (11 | %) | (8 | %) | 3 | % | (13 | %) | (10 | %) | ||||||||||||
|
|
|
|
|
|
|
|
|
|
|
|
|
|||||||||||||
| Total |
(2 | %) | (28 | %) | (30 | %) | (6 | %) | (27 | %) | (33 | %) | ||||||||||||
|
|
|
|
|
|
|
|
|
|
|
|
|
|||||||||||||
MOBILE CUSTOMERS
| million | 1Q15 | 1Q14 | YoY | |||||||||
| Russia |
55.7 | 55.0 | 1 | % | ||||||||
| Italy |
21.4 | 22.0 | (3 | %) | ||||||||
| Algeria |
18.7 | 17.6 | 6 | % | ||||||||
| Pakistan |
38.2 | 38.2 | 0 | % | ||||||||
| Bangladesh |
31.8 | 29.4 | 8 | % | ||||||||
| Ukraine |
26.1 | 25.6 | 2 | % | ||||||||
| Kazakhstan |
9.6 | 9.2 | 5 | % | ||||||||
| Eurasia |
16.6 | 16.5 | 1 | % | ||||||||
|
|
|
|
|
|
|
|||||||
| Total |
218.1 | 213.3 | 2 | % | ||||||||
|
|
|
|
|
|
|
|||||||
PRESENTATION OF FINANCIAL RESULTS
VimpelCom results presented in this earnings release are based on IFRS and have not been audited.
Certain amounts and percentages that appear in this earnings release have been subject to rounding adjustments. As a result, certain numerical figures shown as totals, including in tables may not be an exact arithmetic aggregation of the figures that precede or follow them.
VimpelCom Ltd. 1Q 2015 | 2
Table of Contents
JEAN-YVES CHARLIER, CHIEF EXECUTIVE OFFICER, COMMENTS:

VimpelCom Ltd. 1Q 2015 | 3
Table of Contents
STRATEGIC UPDATE AND MAIN EVENTS
| • | New Group CEO appointed, strategic update to be provided with 2Q15 results |
| • | Successfully closed transaction in Algeria; USD 3.8 billion in net proceeds |
| • | Repaid USD 3.4 billion of debt |
| • | Italian tower sale completed; USD 0.7 billion in net proceeds |
| • | Concluded third and final stage of Italian refinancing |
| • | Acquired 3G license in Ukraine |
| • | 4G/LTE services launched in Georgia |
| • | Annual 2015 targets confirmed |
| VimpelCom Ltd. 1Q 2015 | 4 |
Table of Contents
| 1) | Revenue and EBITDA organic growth are non-GAAP financial measures that exclude the effect of foreign currency movements and certain items such as liquidations and disposals |
| 2) | EPS at constant currency and stable fair value of derivatives, excluding exceptional charges such as impairment charges, restructuring charges, litigation and settlements, impact of M&A transactions, other one-off charges and constant number of shares |

VimpelCom Ltd. 1Q 2015 | 5
Table of Contents
FINANCIAL AND OPERATING RESULTS 1Q15
| • | Service revenue declined organically 2% YoY, in line with management expectations |
| • | EBITDA declined organically 6% YoY, mainly due to revenue decline |
| • | EBITDA margin of 39.7%, down 1.9 p.p. YoY; organically down 1.7 p.p. YoY |
| • | Net Income attributable to VimpelCom shareholders increased YoY |
| • | Strengthening local management team in Algeria |
OPERATING FINANCIALS BY BUSINESS UNIT
| USD mln | 1Q15 | 1Q14 | Reported YoY |
Organic YoY |
||||||||||||
| Service revenue |
3,358 | 4,810 | (30 | %) | (2 | %) | ||||||||||
| Russia |
1,036 | 1,848 | (44 | %) | 0 | % | ||||||||||
| Italy |
1,107 | 1,419 | (22 | %) | (5 | %) | ||||||||||
| Algeria |
320 | 428 | (25 | %) | (11 | %) | ||||||||||
| Pakistan |
236 | 241 | (2 | %) | (4 | %) | ||||||||||
| Bangladesh |
145 | 132 | 10 | % | 10 | % | ||||||||||
| Ukraine |
151 | 334 | (55 | %) | 5 | % | ||||||||||
| Kazakhstan |
164 | 180 | (9 | %) | 0 | % | ||||||||||
| Eurasia |
242 | 264 | (8 | %) | 3 | % | ||||||||||
| other |
(43 | ) | (36 | ) | ||||||||||||
| EBITDA |
1,396 | 2,088 | (33 | %) | (6 | %) | ||||||||||
| Russia |
421 | 760 | (45 | %) | (2 | %) | ||||||||||
| Italy |
459 | 593 | (23 | %) | (5 | %) | ||||||||||
| Algeria |
169 | 247 | (32 | %) | (18 | %) | ||||||||||
| Pakistan |
96 | 99 | (3 | %) | (5 | %) | ||||||||||
| Bangladesh |
60 | 49 | 21 | % | 21 | % | ||||||||||
| Ukraine |
63 | 162 | (61 | %) | (11 | %) | ||||||||||
| Kazakhstan |
81 | 86 | (6 | %) | 3 | % | ||||||||||
| Eurasia |
120 | 133 | (10 | %) | 3 | % | ||||||||||
| other |
(73 | ) | (41 | ) | ||||||||||||
| EBITDA margin |
39.7 | % | 41.6 | % | (1.9 pp | ) | (1.7 pp | ) | ||||||||
FINANCIAL AND OPERATING PERFORMANCE OVERVIEW
| VimpelCom Ltd. 1Q 2015 | 6 |
Table of Contents
VimpelCom Ltd. 1Q 2015 | 7
Table of Contents
INCOME STATEMENT ELEMENTS & CAPITAL EXPENDITURES
| USD mln | 1Q15 | 1Q14 | Reported YoY |
Organic YoY |
||||||||||||
| Total revenue |
3,515 | 5,024 | (30 | %) | (2 | %) | ||||||||||
| Mobile service revenue |
2,856 | 4,024 | (29 | %) | (1 | %) | ||||||||||
| EBITDA |
1,396 | 2,088 | (33 | %) | (6 | %) | ||||||||||
| EBITDA margin |
39.7 | % | 41.6 | % | (1.9 | pp) | (1.7 | pp) | ||||||||
| Depreciation and amortization |
(885 | ) | (1,164 | ) | (24 | %) | ||||||||||
| Impairment loss |
(98 | ) | — | n.m. | ||||||||||||
| Gain from sale of towers in Italy |
466 | — | n.m. | |||||||||||||
| EBIT |
879 | 924 | (5 | %) | ||||||||||||
| Financial income and expenses |
(382 | ) | (513 | ) | (26 | %) | ||||||||||
| Net foreign exchange (loss)/gain and others |
(53 | ) | (165 | ) | (68 | %) | ||||||||||
| Profit before tax |
444 | 246 | 81 | % | ||||||||||||
| Income tax expense |
(271 | ) | (174 | ) | 56 | % | ||||||||||
| Profit for the period |
173 | 72 | n.m | |||||||||||||
| Net income attributable to VimpelCom shareholders |
184 | 38 | n.m | |||||||||||||
| 1Q15 | 1Q14 | YoY | ||||||||||||||
| Capex expenditures |
460 | 735 | (37 | %) | ||||||||||||
| Capex expenditures excluding licenses |
407 | 725 | (44 | %) | ||||||||||||
| Capex excl licenses/Revenue |
12 | % | 14 | % | ||||||||||||
VimpelCom Ltd. 1Q 2015 | 8
Table of Contents
STATEMENT OF FINANCIAL POSITION & CASH FLOW
| USD mln | 1Q15 | 4Q14 | QoQ | |||||||||
| Total assets |
38,393 | 41,042 | (6%) | |||||||||
| Shareholders’ equity |
5,494 | 5,006 | 10 | % | ||||||||
| Gross debt |
24,225 | 26,443 | (8 | %) | ||||||||
| Net debt |
17,608 | 19,992 | (12 | %) | ||||||||
| Gross debt / LTM EBITDA1 |
3.3 | 3.3 | ||||||||||
| Net debt / LTM EBITDA1 |
2.4 | 2.5 | ||||||||||
| Net debt / LTM EBITDA1 excl. Italy |
1.2 | 1.2 | ||||||||||
| USD mln | 1Q15 | 1Q14 | YoY | |||||||||
| Net cash from operating activities |
(764 | ) | 1,168 | n.m. | ||||||||
| Net cash from / (used in) investing activities |
51 | (1,211 | ) | n.m. | ||||||||
| Net cash from financing activities |
1,136 | 200 | n.m. | |||||||||
| 1) | Normalized LTM EBITDA excluding one-off charges related to the Algeria closing transaction |
VimpelCom Ltd. 1Q 2015 | 9
Table of Contents
BUSINESS UNIT PERFORMANCE IN 1Q15
| • | Russia |
| • | Italy |
| • | Algeria |
| • | Pakistan |
| • | Bangladesh |
| • | Ukraine |
| • | Kazakhstan |
| • | Eurasia |
VimpelCom Ltd. 1Q 2015 | 10
Table of Contents
| • | Continued operational improvements, with increasing NPS and improving churn |
| • | Mobile data revenue increased 18% YoY to RUB 10.4 billion |
| • | Mobile customer base expanded 1% YoY to 55.7 million |
| • | EBITDA excluding FOREX was up 5% YoY; reported EBITDA decreased 2% YoY to RUB 26.1 billion, mainly driven by currency headwinds; |
| • | EBITDA margin of 39.4%, excluding FOREX, up 2.8 p.p. YoY |
VimpelCom Ltd. 1Q 2015 | 11
Table of Contents
RUSSIA KEY INDICATORS
VimpelCom Ltd. 1Q 2015 | 12
Table of Contents
| • | Continued outperformance in mobile |
| • | Strong data revenue growth: mobile broadband up 17% YoY and fixed broadband up 2% YoY |
| • | Total revenue of EUR 1.1 billion; mobile service revenue down 3% YoY with trend improving versus previous quarters |
| • | EBITDA at EUR 406 million down 5% YoY, trend improving sequentially |
| • | Final step of refinancing successfully completed, annualized interest savings, including 2014 refinancing, of EUR 340 million |
VimpelCom Ltd. 1Q 2015 | 13
Table of Contents
ITALY KEY INDICATORS
VimpelCom Ltd. 1Q 2015 | 14
Table of Contents
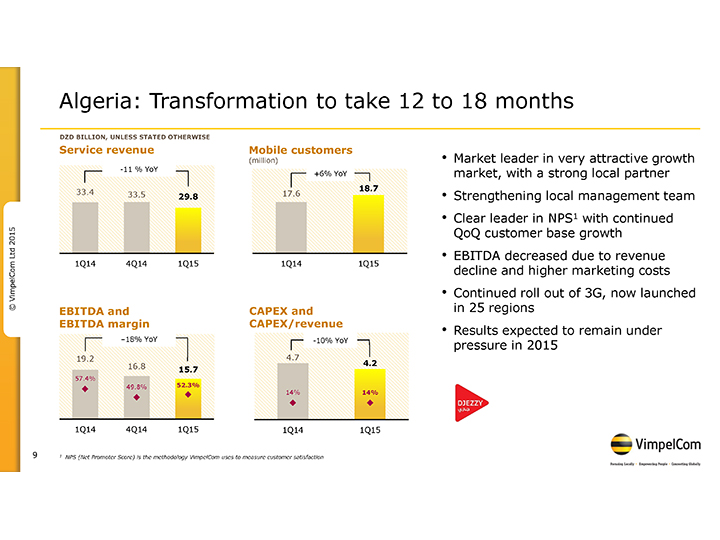
| • | Mobile customer base expanded by 6% YoY to 18.7 million customers |
| • | NPS leadership due to the new brand campaigns and continued 3G rollout |
| • | Service revenue and EBITDA decreased by 11% and 18% YoY, respectively, due to the gap in 3G rollout and strong price competition |
| • | Strong EBITDA margin of 52.3% and an operating cash flow margin of 38.3% |
ALGERIA KEY INDICATORS
| 1) | 3G customers include customers that have performed at least one mobile data event on 3G network in the previous four months |
VimpelCom Ltd. 1Q 2015 | 15
Table of Contents
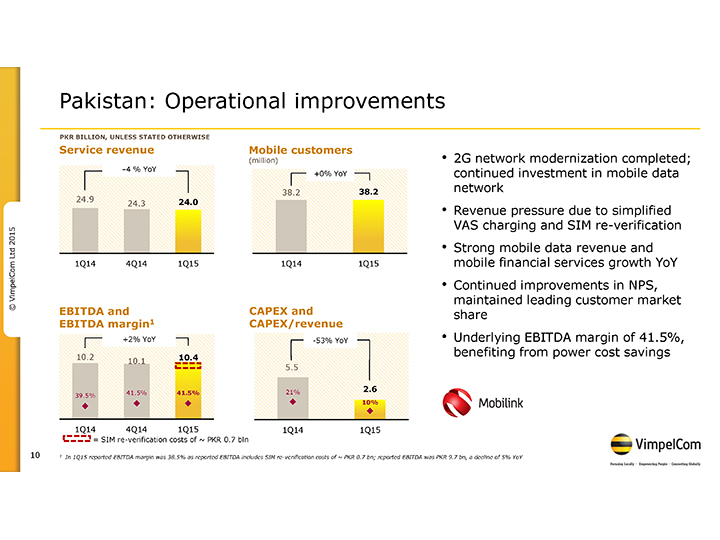
| • | Expected negative impact of SIM re-verification on performance |
| • | Service revenue decreased 4% YoY due to simplified charging regime of VAS and SIM re-verification activities |
| • | Notable increase in data revenue of 88% YoY and significant increase in MFS revenue |
| • | Improving underlying EBITDA margin of 41.5%, excluding SIM re-verification costs |
PAKISTAN KEY INDICATORS
VimpelCom Ltd. 1Q 2015 | 16
Table of Contents
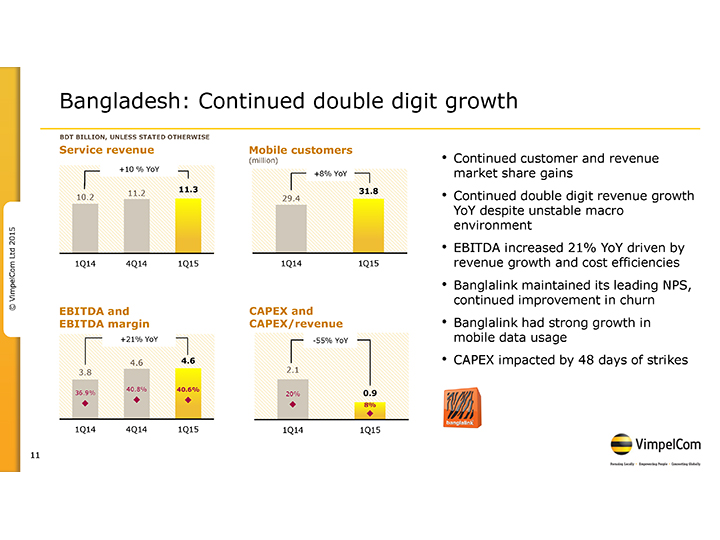
| • | Continued double digit growth of service revenue and EBITDA by 10% and 21% YoY respectively, despite unstable macroeconomic situation |
| • | Customer base expanded 8% YoY to 31.8 million due to NPS leadership and improved churn |
| • | Mobile data usage tripled |
| • | Continued customer and revenue market share growth |
BANGLADESH KEY INDICATORS
VimpelCom Ltd. 1Q 2015 | 17
Table of Contents
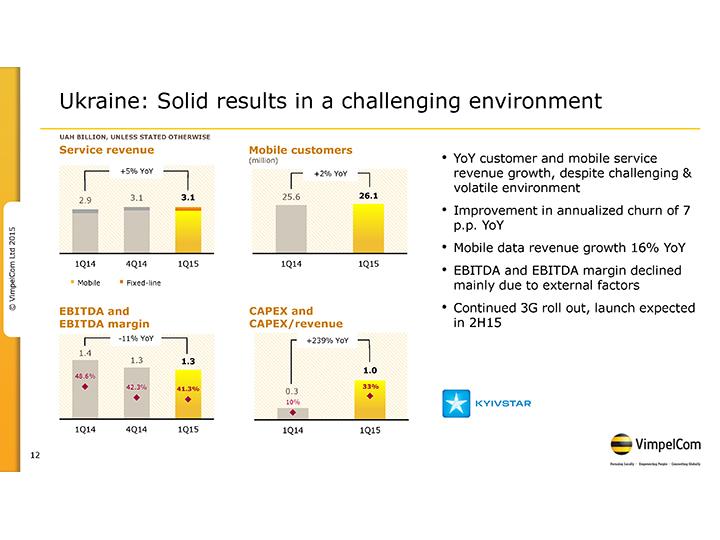
| • | Kyivstar is the clear market leader in a challenging and volatile environment |
| • | Mobile service revenue increased 7% YoY; mobile data revenue grew 16% YoY |
| • | Annualized churn improved 7pp YoY to 22%; mobile customer base increased 2% YoY to 26.1 million |
| • | EBITDA declined 11% YoY to UAH 1.3 billion, with an EBITDA margin of 41.3% |
| • | 3G license paid; continued investments in 3G network |
VimpelCom Ltd. 1Q 2015 | 18
Table of Contents
UKRAINE KEY INDICATORS
VimpelCom Ltd. 1Q 2015 | 19
Table of Contents
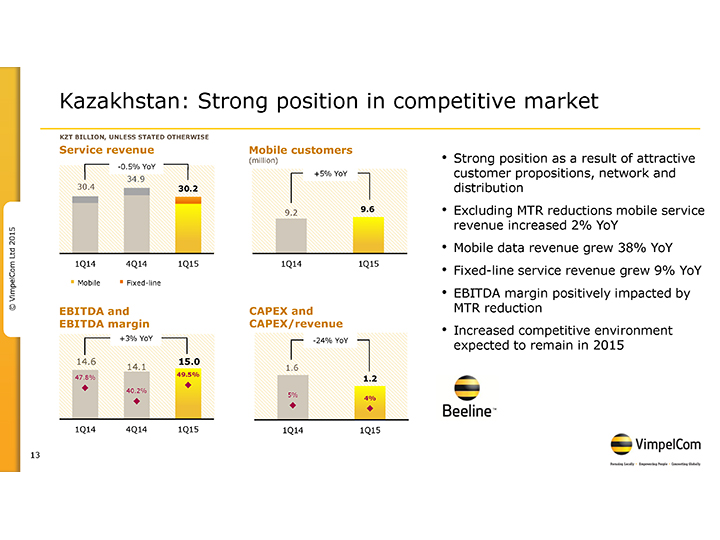
| • | Mobile service revenue declined 2% YoY, mainly driven by the MTR reduction and increased competition; Excluding MTR reduction mobile service revenue increased 2% YoY |
| • | Fixed-line service revenue grew 9% YoY to KZT 3.7 billion |
| • | Mobile data revenue grew 38% YoY to KZT 5.5 billion |
| • | Customer base expanded 5% YoY to 9.6 million |
| • | EBITDA grew 3% YoY to KZT 15.0 billion; EBITDA margin increased 1.7 pp YoY to 49.5% |
KAZAKHSTAN KEY INDICATORS
VimpelCom Ltd. 1Q 2015 | 20
Table of Contents
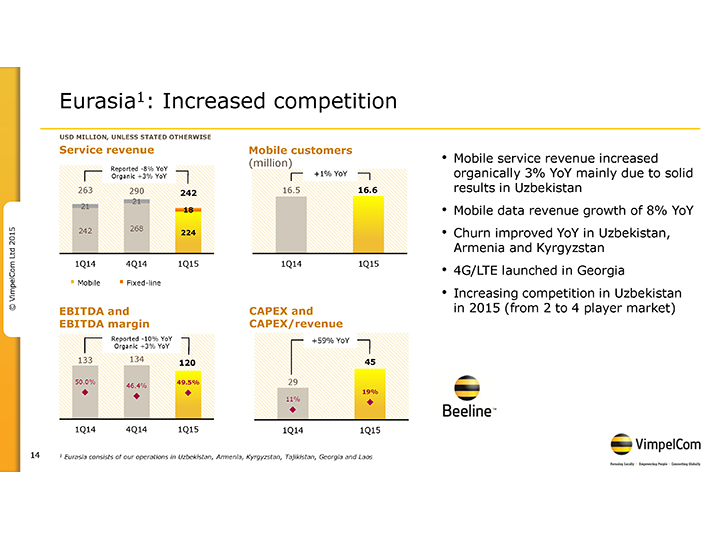
| • | Mobile service revenue increased organically by 3% YoY, driven by solid results in Uzbekistan |
| • | Mobile customer base expanded 1% YoY to 16.6 million |
| • | Mobile data revenue organic growth of 8% YoY |
| • | EBITDA reached USD 120 million, an organic increase of 3% YoY; Strong EBITDA margin of 49.5% |
| • | Solid results in Uzbekistan, launch of 4G/LTE in Georgia |
| 1) | Eurasia consists of VimpelCom’s operations in Uzbekistan, Kyrgyzstan, Armenia, Tajikistan, Georgia and Laos |
VimpelCom Ltd. 1Q 2015 | 21
Table of Contents
EURASIA KEY INDICATORS
VimpelCom Ltd. 1Q 2015 | 22
Table of Contents
On May 13, 2015 the Company will host an analyst & investor conference call on its 1Q15 results at 2:00 pm CET. The call and slide presentation may be accessed at http://www.vimpelcom.com
2:00 pm CET investor and analyst conference call
| US call-in number: +1 (877) 616-4476 Confirmation Code: 36877862
International call-in number: + 1 (402) 875-4763 Confirmation Code: 36877862
The conference call replay and the slide presentations webcast will be available until May 20, 2015. The slide presentation will also be available for download on the Company’s website.
Investor and analyst call replay US Replay Number: +1 (855) 859-2056 Confirmation Code: 36877862
International Replay Number: +1 (404) 537-3406 Confirmation Code: 36877862
CONTACT INFORMATION
| ||
| INVESTOR RELATIONS
Gerbrand Nijman / Remco Vergeer Tel: +31 20 79 77 200 (Amsterdam) |
MEDIA AND PUBLIC RELATIONS
Artem Minaev / Rozzyn Boy Tel: +31 20 79 77 200 (Amsterdam) | |
VimpelCom Ltd. 1Q 2015 | 23
Table of Contents
DISCLAIMER
This press release contains “forward-looking statements”, as the phrase is defined in Section 27A of the Securities Act of 1933, as amended, and Section 21E of the Securities Exchange Act of 1934, as amended. These statements relate to, among other things, the Company’s anticipated performance, future market developments and trends, anticipated benefits from the Algeria and Galata transactions, anticipated interest cost savings, operational and network development and network investment, expectations regarding its 4G/LTE agreement with MTS, anticipated benefits from 3G services in Ukraine and 4G/LTE services in Georgia, and the Company’s ability to realize its targets and strategic initiatives in the various countries of operation. The forward-looking statements included in this presentation are based on management’s best assessment of the Company’s strategic and financial position and of future market conditions and trends. These discussions involve risks and uncertainties. The actual outcome may differ materially from these statements as a result of continued volatility in the economies in our markets, unforeseen developments from competition, governmental regulation of the telecommunications industries, general political uncertainties in our markets, government investigations and/or litigation with third parties. Certain factors that could cause actual results to differ materially from those discussed in any forward-looking statements include the risk factors described in the Company’s Annual Report on Form 20-F for the year ended December 31, 2014 filed with the U.S. Securities and Exchange Commission (the “SEC”) and other public filings made by the Company with the SEC, which risk factors are incorporated herein by reference. The forward looking statements speak only as of the date hereof, and the Company disclaims any obligation to update them or to announce publicly any revision to any of the forward-looking statements contained in this release, or to make corrections to reflect future events or developments.
ABOUT VIMPELCOM LTD
VimpelCom, headquartered in Amsterdam, is one of the world’s largest integrated telecommunications services operators providing voice and data services through a range of traditional and broadband mobile and fixed technologies in Russia, Italy, Ukraine, Kazakhstan, Uzbekistan, Tajikistan, Armenia, Georgia, Kyrgyzstan, Laos, Algeria, Bangladesh, Pakistan and Zimbabwe. VimpelCom’s operations around the globe cover territory with a total population of approximately 740 million people. VimpelCom provides services under the “Beeline”, “Kyivstar”, “WIND”, “Infostrada” “Mobilink”, “banglalink”, “Telecel”, and “Djezzy” brands. As of March 31, 2015 VimpelCom had 218 million mobile customers on a combined basis. VimpelCom is traded on the NASDAQ Global Stock Market under the symbol (VIP). For more information visit: http://www.vimpelcom.com.
VimpelCom Ltd. 1Q 2015 | 24
Table of Contents
| Attachment A | 26 | |||||
| Attachment B | 29 | |||||
| Attachment C | 31 | |||||
| Attachment D | 32 | |||||
| Attachment E | WIND Telecomunicazioni group condensed financial statement of income |
34 | ||||
| Attachment F | 35 | |||||
For more information on financial and operating data for specific countries, please refer to the supplementary file Factbook1Q2015.xls on VimpelCom’s website at http://vimpelcom.com/ir/financials/results.wbp
VimpelCom Ltd. 1Q 2015 | 25
Table of Contents
ATTACHMENT A: VIMPELCOM LTD INTERIM FINANCIAL SCHEDULES
VIMPELCOM LTD UNAUDITED INTERIM CONSOLIDATED STATEMENTS OF INCOME
| USD mln | 1Q15 | 1Q14 | ||||||
| Total operating revenue |
3,515 | 5,024 | ||||||
| of which other revenue |
59 | 105 | ||||||
| Operating expenses |
||||||||
| Service costs, equipment and accessories |
851 | 1,228 | ||||||
| Selling, general and administrative expenses |
1,268 | 1,708 | ||||||
| Depreciation |
584 | 758 | ||||||
| Amortization |
286 | 394 | ||||||
| Impairment loss |
98 | — | ||||||
| Loss on disposals of non-current assets |
15 | 12 | ||||||
| Gain from sale of towers in Italy |
(466 | ) | — | |||||
| Total operating expenses |
2,636 | 4,100 | ||||||
| Operating profit |
879 | 924 | ||||||
| Finance costs |
394 | 527 | ||||||
| Finance income |
(12 | ) | (14 | ) | ||||
| Other non-operating losses/(gains) |
(73 | ) | 36 | |||||
| Shares of loss of associates and joint ventures accounted for using the equity method |
3 | 37 | ||||||
| Net foreign exchange (gain)/ loss |
123 | 92 | ||||||
| Profit before tax |
444 | 246 | ||||||
| Income tax expense |
271 | 174 | ||||||
| Profit for the period |
173 | 72 | ||||||
| Non-controlling interest |
(11 | ) | 34 | |||||
| Net income attributable to VimpelCom shareholders |
184 | 38 | ||||||
VimpelCom Ltd. 1Q 2015 | 26
Table of Contents
ATTACHMENT A: VIMPELCOM LTD INTERIM FINANCIAL SCHEDULES
VIMPELCOM LTD UNAUDITED INTERIM CONSOLIDATED STATEMENT OF FINANCIAL POSITION
| USD mln | 31 March 2015 | 31 December 2014 | ||||||
| Assets |
||||||||
| Non-current assets |
||||||||
| Property and equipment |
10,461 | 11,849 | ||||||
| Intangible assets |
6,786 | 7,717 | ||||||
| Goodwill |
9,307 | 10,285 | ||||||
| Investments in associates and joint ventures |
333 | 265 | ||||||
| Deferred tax asset |
462 | 575 | ||||||
| Income Tax advances, non-current |
75 | 91 | ||||||
| Financial assets |
1,350 | 602 | ||||||
| Other non-financial assets |
26 | 26 | ||||||
| Total non-current assets |
28,800 | 31,410 | ||||||
| Current assets |
||||||||
| Inventories |
129 | 117 | ||||||
| Trade and other receivables |
1,778 | 1,886 | ||||||
| Other non-financial assets |
635 | 797 | ||||||
| Current income tax asset |
248 | 219 | ||||||
| Other financial assets |
301 | 266 | ||||||
| Cash and cash equivalents |
6,499 | 6,342 | ||||||
| Total current assets |
9,590 | 9,627 | ||||||
| Assets classified as held for sale |
3 | 5 | ||||||
|
|
|
|
|
|||||
| Total assets |
38,393 | 41,042 | ||||||
|
|
|
|
|
|||||
| Equity and liabilities |
||||||||
| Equity |
||||||||
| Equity attributable to equity owners of the parent |
5,494 | 5,006 | ||||||
| Non-controlling interests |
243 | (1,030 | ) | |||||
| Total equity |
5,737 | 3,976 | ||||||
| Non-current liabilities |
||||||||
| Debt |
20,673 | 23,654 | ||||||
| Other financial liabilities |
335 | 282 | ||||||
| Provisions |
627 | 527 | ||||||
| Other non-financial liabilities |
362 | 401 | ||||||
| Deferred tax liability |
1,196 | 1,637 | ||||||
| Total non-current liabilities |
23,193 | 26,501 | ||||||
| Current liabilities |
||||||||
| Trade and other payables |
3,451 | 4,007 | ||||||
| Debt |
3,552 | 2,789 | ||||||
| Other financial liabilities |
389 | 399 | ||||||
| Other non-financial liabilities |
1,759 | 1,930 | ||||||
| Current income tax payable |
103 | 72 | ||||||
| Provisions |
209 | 1,368 | ||||||
| Total current liabilities |
9,463 | 10,565 | ||||||
| Liabilities associated with assets held for sale |
— | — | ||||||
|
|
|
|
|
|||||
| Total equity and liabilities |
38,393 | 41,042 | ||||||
|
|
|
|
|
|||||
VimpelCom Ltd. 1Q 2015 | 27
Table of Contents
ATTACHMENT A: VIMPELCOM LTD INTERIM FINANCIAL SCHEDULES
VIMPELCOM LTD UNAUDITED INTERIM CONSOLIDATED STATEMENTS OF CASH FLOWS
| USD mln | 1Q15 | 1Q14 | ||||||
| Operating activities |
||||||||
| Profit after tax |
173 | 72 | ||||||
| Income tax expenses |
271 | 174 | ||||||
| Profit before tax |
444 | 246 | ||||||
| Non-cash adjustment to reconcile profit before tax to net operating cash flows: |
||||||||
| Depreciation |
584 | 758 | ||||||
| Amortization |
286 | 394 | ||||||
| Impairment loss |
98 | — | ||||||
| Loss/(Gain) From disposal of non current assets |
(451 | ) | 11 | |||||
| Finance income |
(12 | ) | (14 | ) | ||||
| Finance cost |
394 | 527 | ||||||
| Other non operating losses / (Gains) |
(73 | ) | 37 | |||||
| Net foreign exchange loss / (gain) |
123 | 92 | ||||||
| Share of loss of associates and joint ventures |
3 | 36 | ||||||
| Movements in provisions and pensions |
(1,136 | ) | 29 | |||||
| Changes in working capital |
(251 | ) | (62 | ) | ||||
| Net interest paid |
(440 | ) | (667 | ) | ||||
| Net interest received |
11 | 15 | ||||||
| Income tax paid |
(344 | ) | (234 | ) | ||||
| Net cash from operating activities |
(764 | ) | 1,168 | |||||
| Proceeds from sale of property and equipment |
729 | — | ||||||
| Proceeds from sale of intangible assets |
1 | 2 | ||||||
| Purchase of property, plant and equipment |
(500 | ) | (1,023 | ) | ||||
| Purchase of licenses |
(28 | ) | (15 | ) | ||||
| Purchase of other intangible assets |
(114 | ) | (136 | ) | ||||
| Outflow for loan granted |
(100 | ) | (39 | ) | ||||
| Inflow from loan granted |
2 | — | ||||||
| Inflows/(outflows) from financial assets |
61 | (2 | ) | |||||
| Receipt of dividends |
— | 2 | ||||||
| Net cash used in investing activities |
51 | (1,211 | ) | |||||
| Gross proceeds from borrowings |
1,870 | 995 | ||||||
| Fees paid for the borrowings |
(16 | ) | (11 | ) | ||||
| Repayment of borrowings |
(2,986 | ) | (774 | ) | ||||
| Dividends paid to equity holders |
— | (10 | ) | |||||
| Dividends paid to non-controlling interests |
(57 | ) | — | |||||
| Proceeds from sale of non-controlling interests |
2,325 | — | ||||||
| Net cash from financing activities |
1,136 | 200 | ||||||
| Net increase in cash and cash equivalents |
423 | 157 | ||||||
| Net foreign exchange difference |
(266 | ) | (71 | ) | ||||
| Cash and cash equivalent at beginning of period |
6,342 | 4,454 | ||||||
| Cash and cash equivalent at end of period |
6,499 | 4,540 | ||||||
VimpelCom Ltd. 1Q 2015 | 28
Table of Contents
| as at 31 March 2015 | Type of debt | Interest rate | Outstanding debt (mln) |
Maturity date |
Guarantor | |||||
| VimpelCom Holdings B.V. |
Notes | 6.25% | USD 500(1) | March 1, 2017 | OJSC VimpelCom | |||||
| VimpelCom Holdings B.V. |
Notes | 7.50% | USD 1,500(2) | March 1, 2022 | OJSC VimpelCom | |||||
| VimpelCom Holdings B.V. |
Notes | 9.00% | USD 205 (RUB 12,000) |
February 13, 2018 | OJSC VimpelCom | |||||
| VimpelCom Holdings B.V. |
Notes | 5.20% | USD 600(3) | February 13, 2019 | OJSC VimpelCom | |||||
| VimpelCom Holdings B.V. |
Notes | 5.95% | USD 1,000(4) | February 13, 2023 | OJSC VimpelCom | |||||
| VimpelCom Amsterdam B.V. |
Loan from China Development Bank Corp. | 6 month LIBOR plus 3.30% |
USD 498 | December 21, 2020 | OJSC VimpelCom | |||||
| VimpelCom Amsterdam B.V. |
Loan from HSBC Bank plc | 1.72% | USD 238 | July 31, 2022 | EKN, OJSC VimpelCom | |||||
| VimpelCom Amsterdam B.V. |
Loan from OAO “Alfa-Bank” | 1 month LIBOR plus 3.25% |
USD 500 | April 17, 2017 | None | |||||
| VimpelCom Amsterdam B.V. |
Loan from OAO “Alfa-Bank” | 1 month LIBOR plus 3.25% |
USD 500 | May 3, 2017 | None | |||||
| OJSC VimpelCom |
Loan from UBS (Luxembourg) S.A. (funded by the issuance of loan participation notes by UBS (Luxembourg) S.A.) | 8.25% | USD 600(5) | May 23, 2016 | None | |||||
| OJSC VimpelCom |
Loan from VIP Finance Ireland (funded by the issuance of loan participation notes by VIP Finance Ireland) | 9.13% | USD 1,000(8) | April 30, 2018 | None | |||||
| OJSC VimpelCom |
Loan from VIP Finance Ireland (funded by the issuance of loan participation notes by VIP Finance Ireland) | 6.49% | USD 500(7) | February 2, 2016 | None | |||||
| OJSC VimpelCom |
Loan from VIP Finance Ireland Limited (funded by the issuance of loan participation notes by VIP Finance Ireland) | 7.75% | USD 1,000(8) | February 2, 2021 | None | |||||
| OJSC VimpelCom |
Loan from VC-Invest (funded by the RUB denominated bonds by VC-Invest) | 8.3% | USD 342 (RUB 20,000) |
October 13, 2015 | OJSC VimpelCom | |||||
| OJSC VimpelCom |
Loan from Sberbank | 9.00%(9) | USD 1,052 (RUB 61,500) |
April 11, 2018 | None | |||||
| OJSC VimpelCom |
Loan from Sberbank | 8.75% (9) | USD 44 (RUB 2,560) |
December 16, 2015 | None | |||||
| OJSC VimpelCom |
Loan from Sberbank | 10,75% (9) | USD 428 (RUB 25,000) |
May 29, 2017 | None | |||||
| OJSC VimpelCom |
Loan from HSBC Bank PLC | 3 month MosPRIME plus 1.05% |
USD 39 (RUB 2,268) |
November 30, 2017 |
EKN | |||||
| OJSC VimpelCom |
Loan from Unicredit Bank AG | AB SEK Rate plus 0.75% |
USD 31 | June 15, 2016 | EKN | |||||
| OJSC VimpelCom |
Loan from HSBC Bank PLC and Nordea Bank AB (publ) | 3 month MosPRIME plus 1.00% |
USD 66 (RUB 3,873) |
April 30, 2019 | EKN | |||||
| WIND Telecomunicazioni S.p.A. |
Senior facilities | 6 month EURIBOR plus 4.25%(10) |
USD 751 (EUR 700) |
November 26, 2019 |
Wind Telecomunicazioni S.p.A. |
VimpelCom Ltd. 1Q 2015 | 29
Table of Contents
ATTACHMENT B: DEBT OVERVIEW (CONTINUED)
| as at 31 March 2015 | Type of debt | Interest rate | Outstanding debt (mln) |
Maturity date |
Guarantor | |||||
| WIND Telecomunicazioni S.p.A. |
Debt vs. Italian Government (4G/LTE) | Rendistato plus 1.0% |
USD 174 (EUR 162) |
October 3, 2016(11) | None | |||||
| WIND Telecomunicazioni S.p.A. |
Terna Debt | 10.05% | USD 141 (EUR 131) |
December 31, 2035 | None | |||||
| WIND Acquisition Finance S.A. |
Senior Secured Notes | 3 month EURIBOR plus 5.25% |
USD 161 (EUR 150) |
April 13, 2019 | Wind Telecomunicazioni S.p.A. | |||||
| WIND Acquisition Finance S.A. |
Senior Secured Notes | 6.50% | USD 550 | April 30, 2020 | Wind Telecomunicazioni S.p.A. | |||||
| WIND Acquisition Finance S.A. |
Senior Notes | 7.00% | USD 1,878 (EUR 1,750) |
November 30, 2017 | Wind Telecomunicazioni S.p.A. | |||||
| WIND Acquisition Finance S.A. |
Senior Notes | 7.38% | USD 2,800 | June 15, 2016 | Wind Telecomunicazioni S.p.A. | |||||
| WIND Acquisition Finance S.A. |
Senior Secured Notes | 4.00% | USD 2,656 (EUR 2,475) |
April 30, 2019 | Wind Telecomunicazioni S.p.A. | |||||
| WIND Acquisition Finance S.A. |
Senior Secured Notes | 4.75% | USD 1,900 | July 15, 2020 | Wind Telecomunicazioni S.p.A. | |||||
| WIND Acquisition Finance S.A. |
Senior Secured Notes | 3 month EURIBOR plus 4.00% |
USD 617 (EUR 575) |
July 15, 2020 | Wind Telecomunicazioni S.p.A. | |||||
| WIND Acquisition Finance S.A. |
Senior Secured Notes | 3 month EURIBOR plus 4.12% |
USD 429 (EUR 400) |
July 15, 2020 | Wind Telecomunicazioni S.p.A. | |||||
| Pakistan Mobile Communications Limited (“PMCL”) |
Syndicated loan via MCB Bank Limited | 6 month KIBOR plus 1.25% |
USD 54 (PKR 5,500) |
November 28, 2017 | None | |||||
| PMCL |
Syndicated loan via MCB Bank Limited | 6 month KIBOR plus 1.25% |
USD 69 (PKR 7,000) |
May 16, 2019 | None | |||||
| PMCL |
Loan from Habib Bank Limited | 6 month KIBOR plus 1.15% |
USD 44 (PKR 4,500) |
May 16, 2019 | None | |||||
| PMCL |
Loan from United Bank Limited | 6 month KIBOR plus 1.10% |
USD 39 (EUR 4,000) |
May 16, 2021 | None | |||||
| Banglalink Digital Communications Ltd. (“BDC”) |
Senior Notes | 8.63% | USD 300 | May 6, 2019 | None | |||||
| BDC |
Facility Standard Chartered Bank | 8.25%-8.50% | USD 54 (BDT 4,195) |
April 29, 2016 | None | |||||
| Omnium Telecom Algeria SpA |
Syndicated Loan Facility | Bank of Algeria Re-Discount Rate plus 2.00% |
USD 512 (DZD 50,000) |
September 30, 2019 |
None | |||||
| Other loans, equipment financing and capital lease obligations |
USD 453 |
| 1) | USD 151 mln was tendered and settled on April 2, 2015. Outstanding principal amount after tender settlement is USD 349 mln |
| 2) | USD 220 mln was tendered and settled on April 2, 2015. Outstanding principal amount after tender settlement is USD 1,280 mln |
| 3) | USD 29 mln was tendered and settled on April 2, 2015. Outstanding principal amount after tender settlement is USD 571 mln |
| 4) | USD 17 mln was tendered and settled on April 2, 2015. Outstanding principal amount after tender settlement is USD 983 mln |
| 5) | USD 334 mln was tendered and settled on April 2, 2015. Outstanding principal amount after tender settlement is USD 266 mln |
| 6) | USD 501 mln was tendered and settled on April 2, 2015. Outstanding principal amount after tender settlement is USD 499 mln |
| 7) | USD 236 mln was tendered and settled on April 2, 2015. Outstanding principal amount after tender settlement is USD 264 mln |
| 8) | USD 349 mln was tendered and settled on April 2, 2015. Outstanding principal amount after tender settlement is USD 651 mln |
| 9) | On March 2, 2015, Sberbank notified OJSC VimpelCom of an increase in fixed interest rates (to between 14.50% and 16.25% with effect from June 1, 2015) in accordance with the terms of the credit facility agreements between OJSC VimpelCom and Sberbank. The actual amount of any increase in interest rates is subject to discussion between the parties. |
| 10) | Interest on the all tranches of the senior facility is based on EURIBOR for loans in Euros and LIBOR for loans in any other currency. Also interest rate margins may be reduced based on specified improvement in leverage ratios. |
| 11) | The debt against the Italian Government for 4G/LTE was fully prepaid on April 29, 2015. |
VimpelCom Ltd. 1Q 2015 | 30
Table of Contents
ATTACHMENT C: EURASIA COUNTRY UNITS KEY INDICATORS
UZBEKISTAN
| UZS bln | 1Q15 | 1Q14 | YoY | |||||||||
| Total revenue |
409 | 363 | 13% | |||||||||
| Mobile service revenue |
405 | 358 | 13% | |||||||||
| Fixed-line service revenue |
3 | 4 | (15%) | |||||||||
| EBITDA |
257 | 234 | 10% | |||||||||
| EBITDA margin |
62.7 | % | 64.4 | % | (1.7 pp | ) | ||||||
| Capex |
0 | 46 | (100%) | |||||||||
| Capex / Revenue |
0 | % | 13 | % | ||||||||
| Mobile |
||||||||||||
| Customers (mln) |
10.4 | 10.4 | (1%) | |||||||||
| ARPU (UZS) |
12,819 | 11,293 | 14% | |||||||||
| MOU (min) |
491 | 465 | 6% | |||||||||
ARMENIA
| AMD mln | 1Q15 | 1Q14 | YoY | |||||||||
| Total revenue |
12,528 | 13,672 | (8 | %) | ||||||||
| Mobile service revenue |
5,355 | 5,519 | (3 | %) | ||||||||
| Fixed-line service revenue |
6,943 | 7,766 | (11 | %) | ||||||||
| EBITDA |
4,415 | 4,997 | (12 | %) | ||||||||
| EBITDA margin |
35.2 | % | 36.6 | % | (1.4 | pp) | ||||||
| Capex |
975 | 501 | 95 | % | ||||||||
| Capex / Revenue |
8 | % | 4 | % | ||||||||
| Mobile |
||||||||||||
| Customers (mln) |
0.8 | 0.7 | 13 | % | ||||||||
| ARPU (AMD) |
2,229 | 2,589 | (14 | %) | ||||||||
| MOU (min) |
341 | 365 | (7 | %) | ||||||||
TAJIKISTAN
| USD mln | 1Q15 | 1Q14 | YoY | |||||||||
| Total revenue |
26 | 31 | (14 | %) | ||||||||
| Mobile service revenue |
26 | 31 | (15 | %) | ||||||||
| EBITDA |
14 | 14 | (3 | %) | ||||||||
| EBITDA margin |
52.8 | % | 46.6 | % | 6.2 | pp | ||||||
| Capex |
0 | 2 | (70 | %) | ||||||||
| Capex / Revenue |
2 | % | 5 | % | ||||||||
| Mobile |
||||||||||||
| Customers (mln) |
1.3 | 1.3 | (2 | %) | ||||||||
| ARPU (USD) |
7 | 8 | (14 | %) | ||||||||
| MOU (min) |
263 | 278 | (6 | %) | ||||||||
GEORGIA
| GEL mln | 1Q15 | 1Q14 | YoY | |||||||||
| Total revenue |
30 | 33 | (7 | %) | ||||||||
| Mobile service revenue |
26 | 30 | (11 | %) | ||||||||
| Fixed-line service revenue |
3 | 2 | 102 | % | ||||||||
| EBITDA |
4 | 9 | (50 | %) | ||||||||
| EBITDA margin |
14.2 | % | 26.2 | % | (12.0 | pp) | ||||||
| Capex |
83 | 3 | n.m. | |||||||||
| Capex / Revenue |
275 | % | 9 | % | ||||||||
| Mobile |
||||||||||||
| Customers (mln) |
1.3 | 1.1 | 15 | % | ||||||||
| ARPU (GEL) |
7 | 9 | (23 | %) | ||||||||
| MOU (min) |
226 | 214 | 6 | % | ||||||||
VimpelCom Ltd. 1Q 2015 | 31
Table of Contents
KYRGYZSTAN
| KGZ mln | 1Q15 | 1Q14 | YoY | |||||||||
| Total revenue |
2,340 | 1,988 | 18 | % | ||||||||
| Mobile service revenue |
2,318 | 1,975 | 17 | % | ||||||||
| EBITDA |
1,253 | 899 | 39 | % | ||||||||
| EBITDA margin |
53.6 | % | 45.2 | % | 8.4 | pp | ||||||
| Capex |
168 | 159 | 6 | % | ||||||||
| Capex / Revenue |
7 | % | 8 | % | ||||||||
| Mobile |
||||||||||||
| Customers (mln) |
2.7 | 2.6 | 4 | % | ||||||||
| ARPU (KGZ) |
281 | 248 | 14 | % | ||||||||
| MOU (min) |
261 | 294 | (11 | %) | ||||||||
ATTACHMENT D: RECONCILIATION TABLES
RECONCILIATION OF CONSOLIDATED EBITDA OF VIMPELCOM
| USD mln | 1Q15 | 1Q14 | ||||||
| Unaudited |
||||||||
| EBITDA |
1,396 | 2,088 | ||||||
| Depreciation |
(584 | ) | (758 | ) | ||||
| Amortization |
(286 | ) | (394 | ) | ||||
| Impairment loss |
(98 | ) | — | |||||
| Loss on disposals of non-current assets |
(15 | ) | (12 | ) | ||||
| Gain from sale of towers in Italy |
466 | — | ||||||
| EBIT |
879 | 924 | ||||||
| Financial Income and Expenses |
(382 | ) | (513 | ) | ||||
| - including finance income |
12 | 14 | ||||||
| - including finance costs |
(394 | ) | (527 | ) | ||||
| Net foreign exchange gain / (loss) and others |
(53 | ) | (165 | ) | ||||
| - including Other non-operating gains / (losses) |
73 | (36 | ) | |||||
| - including Shares of loss of associates and joint ventures accounted for using the equity method |
(3 | ) | (37 | ) | ||||
| - including Net foreign exchange gain / (losses) |
(123 | ) | (92 | ) | ||||
| EBT |
444 | 246 | ||||||
| Income tax expense |
271 | 174 | ||||||
| Profit for the year |
173 | 72 | ||||||
| Profit/(loss) for the year attributable to non-controlling interest |
(11 | ) | 34 | |||||
| Profit for the year attributable to the owners of the parent |
184 | 38 | ||||||
VimpelCom Ltd. 1Q 2015 | 32
Table of Contents
RECONCILIATION OF VIMPELCOM CONSOLIDATED NET DEBT
| USD mln | 1Q15 | 4Q14 | 3Q14 | |||||||||
| Net debt |
17,608 | 19,992 | 21,736 | |||||||||
| Cash and cash equivalents |
6,499 | 6,342 | 5,852 | |||||||||
| Long-term and short-term deposits |
118 | 109 | 126 | |||||||||
| Gross debt |
24,225 | 26,443 | 27,714 | |||||||||
| Interest accrued related to financial liabilities |
371 | 410 | 402 | |||||||||
| Fair Value adjustment |
49 | 29 | 8 | |||||||||
| Other unamortised adjustments to financial liabilities (fees, discounts etc.) |
(75 | ) | (106 | ) | (104 | ) | ||||||
| Other liabilities at amortized costs |
271 | 259 | 249 | |||||||||
| Derivatives designated as hedges |
108 | 89 | 106 | |||||||||
| Total debt and other financial liabilities |
24,949 | 27,124 | 28,375 | |||||||||
RECONCILIATION OF CONSOLIDATED LTM EBITDA ADJUSTED
| USD mln | 1Q15 LTM | 1Q14 LTM | ||||||
| Unaudited |
||||||||
| EBITDA |
7,277 | 8,000 | ||||||
| Add back provisions related to the 51% sale in Algeria |
50 | 1,266 | ||||||
| LTM EBITDA adjusted |
7,327 | 9,266 | ||||||
OPERATING CASH FLOW (EBITDA—CAPEX EXCL. LICENSES) RECONCILIATION
| USD mln | 1Q15 | 1Q14 | ||||||
| Unaudited |
||||||||
| Operating cash flow (EBITDA—CAPEX) |
982 | 1,363 | ||||||
| CAPEX excl. licenses |
414 | 725 | ||||||
| EBITDA |
1,396 | 2,088 | ||||||
| Changes in working capital and other |
(1,387 | ) | (34 | ) | ||||
| Net interest paid |
(429 | ) | (652 | ) | ||||
| Income tax paid |
(344 | ) | (234 | ) | ||||
| Net cash from operating activities |
(764 | ) | 1,168 | |||||
RATES OF FUNCTIONAL CURRENCIES TO USD1
| Average rates | Closing rates | |||||||||||||||||||||||
| 1Q15 | 1Q14 | YoY | 1Q15 | 4Q14 | QoQ | |||||||||||||||||||
| Russian Ruble |
62.19 | 34.96 | 77.9 | % | 58.46 | 56.26 | 3.9 | % | ||||||||||||||||
| Euro |
0.89 | 0.73 | 21.7 | % | 0.93 | 0.83 | 12.7 | % | ||||||||||||||||
| Algerian Dinar |
93.21 | 78.01 | 19.5 | % | 97.70 | 87.92 | 11.1 | % | ||||||||||||||||
| Pakistan Rupee |
101.41 | 103.55 | (2.1 | %) | 101.93 | 100.52 | 1.4 | % | ||||||||||||||||
| Bangladeshi Taka |
77.85 | 77.67 | 0.2 | % | 77.81 | 77.93 | (0.2 | %) | ||||||||||||||||
| Ukrainian Hryvnia |
21.12 | 8.86 | 138.3 | % | 23.44 | 15.77 | 48.7 | % | ||||||||||||||||
| Kazakh Tenge |
184.58 | 169.77 | 8.7 | % | 185.65 | 182.35 | 1.8 | % | ||||||||||||||||
| Uzbekistan Som |
2,450.60 | 2,221.80 | 10.3 | % | 2,490.20 | 2,422.40 | 2.80 | % | ||||||||||||||||
| Armenian Dram |
477.11 | 410.87 | 16.1 | % | 471.13 | 474.97 | (0.8 | %) | ||||||||||||||||
| Kyrgyz Som |
60.82 | 51.92 | 17.1 | % | 63.87 | 58.89 | 8.5 | % | ||||||||||||||||
| Georgian Lari |
2.07 | 1.75 | 18.5 | % | 2.23 | 1.86 | 19.5 | % | ||||||||||||||||
| 1) | Functional currency in Tajikistan is USD |
VimpelCom Ltd. 1Q 2015 | 33
Table of Contents
ATTACHMENT E: WIND TELECOMUNICAZIONI GROUP CONDENSED STATEMENTS OF INCOME
| EUR mln | 1Q15 | 1Q14 | YoY | |||||||||
| Total Revenue |
1,078 | 1,144 | (6 | %) | ||||||||
| EBITDA |
406 | 430 | (5 | %) | ||||||||
| D&A |
189 | (307 | ) | n.m. | ||||||||
| EBIT |
596 | 122 | n.m. | |||||||||
| Financial Income and expenses |
(77 | ) | (230 | ) | (67 | %) | ||||||
| EBT |
519 | (108 | ) | n.m. | ||||||||
| Income Tax |
(62 | ) | (11 | ) | n.m. | |||||||
| Net loss |
456 | (119 | ) | n.m. | ||||||||
VimpelCom Ltd. 1Q 2015 | 34
Table of Contents
ARPU (Average Revenue per User) is calculated by dividing service revenue for the relevant period, including revenue from voice-, roaming-, interconnect-, and value added services (including mobile data, SMS, MMS), but excluding revenue from visitors roaming, connection fees, sales of handsets and accessories and other non-service revenue, by the average number of customers during the period and dividing by the number of months in that period. For Business Unit Italy visitors roaming revenue is included into service revenue for ARPU calculation.
Data customers are the customer contracts that served as a basis for revenue generating activity in the three months prior to the measurement date, as a result of activities including monthly Internet access using FTTB and xDSL technologies as well as mobile Internet access via WiFi and USB modems using 2.5G/3G/4G/HSPA+ technologies. Italian Business Unit measure fixed data customers based on the number of active contracts signed, mobile data include customers that have performed at least one mobile Internet event in the previous month. Russian Business Unit includes IPTV activities. For Kazakhstan and Eurasia subsidiaries mobile data customers are those who have performed at least one mobile Internet event in the three-month period prior to the measurement date. For Algeria data customers are 3G customers who have performed at least one mobile data event on 3G network in the previous four months.
Capital expenditures (CAPEX), purchases of new equipment, new construction, upgrades, software, other long lived assets and related reasonable costs incurred prior to intended use of the non-current asset, accounted at the earliest event of advance payment or delivery. Long-lived assets acquired in business combinations are not included in capital expenditures.
EBIT is a non-GAAP measure and is calculated as EBITDA plus depreciation, amortization and impairment loss. Our management uses EBIT as a supplemental performance measure and believes that it provides useful information of earnings of the Company before making accruals for financial income and expenses and Net foreign exchange (loss)/gain and others. Reconciliation of EBIT to net income attributable to VimpelCom Ltd., the most directly comparable IFRS financial measure, is presented above.
EBITDA is a non-GAAP financial measure. EBITDA is defined as earnings before interest, tax, depreciation and amortization. VimpelCom calculates EBITDA as operating income before depreciation, amortization, loss from disposal of non-current assets and impairment loss and includes certain non-operating losses and gains mainly represented by litigation provisions for all of its Business Units except for its Russia Business Unit. The Russia Business Unit’s EBITDA is calculated as operating income before depreciation, amortization, loss from disposal of non-current assets and impairment loss. EBITDA should not be considered in isolation or as a substitute for analyses of the results as reported under IFRS. Our management uses EBITDA and EBITDA margin as supplemental performance measures and believes that EBITDA and EBITDA margin provide useful information to investors because they are indicators of the strength and performance of the Company’s business operations, including its ability to fund discretionary spending, such as capital expenditures, acquisitions and other investments, as well as indicating its ability to incur and service debt. In addition, the components of EBITDA include the key revenue and expense items for which the Company’s operating managers are responsible and upon which their performance is evaluated. EBITDA also assists management and investors by increasing the comparability of the Company’s performance against the performance of other telecommunications companies that provide EBITDA information. This increased comparability is achieved by excluding the potentially inconsistent effects between periods or companies of depreciation, amortization and impairment losses, which items may significantly affect operating income between periods. However, our EBITDA results may not be directly comparable to other companies’ reported EBITDA results due to variances and adjustments in the components of EBITDA (including our calculation of EBITDA) or calculation measures. Additionally, a limitation of EBITDA’s use as a performance measure is that it does not reflect the periodic costs of certain capitalized tangible and intangible assets used in generating revenue or the need to replace capital equipment over time. Reconciliation of EBITDA to net income attributable to VimpelCom Ltd., the most directly comparable IFRS financial measure, is presented above.
EBITDA margin is calculated as EBITDA divided by total revenue, expressed as a percentage.
Households passed are households located within buildings, in which indoor installation of all the FTTB equipment necessary to install terminal residential equipment has been completed.
LLU (local loop unbundling), in Italy, this is the regulatory process of allowing multiple telecommunications operators to use connections from Telecom Italia’s local exchanges to the customer’s premises.
MBOU (Megabyte of use) is calculated by dividing the total data traffic by the average mobile data customers during the period
VimpelCom Ltd. 1Q 2015 | 35
Table of Contents
MFS (Mobile financial services): is a variety of innovative services, such as mobile commerce or m-commerce, that use a mobile phone as the primary payment user interface and allow mobile customers to conduct money transfers to pay for
goods at an online store, make utility payments, pay fines and state fees, loan repayments, domestic and international remittances, pay mobile insurance and purchase tickets for air and rail travel, all via their mobile phone.
MNP (Mobile number portability) is a facility provided by telecommunications operators, which enables customers to keep their telephone numbers when they change operators.
Mobile customers are SIM-cards registered in the system as of a measurement date, users of which generated revenue at any time during the three months prior to the measurement date. This includes revenue coming from any incoming and outgoing calls, subscription fee accruals, debits related to service, outgoing SMS, Multimedia Messaging Service (referred to as MMS), data transmission and receipt sessions, but does not include incoming SMS and MMS sent by VimpelCom or abandoned calls. VimpelCom’s total number of mobile customers also includes SIM-cards for use of mobile Internet service via USB modems and customers for WiFi. The number for Italy is based on SIM-cards, users of which generated revenue at any time during the twelve months prior to the measurement date.
MOU (Monthly Average Minutes of Use per User) is generally calculated by dividing the total number of minutes of usage for incoming and outgoing calls during the relevant period (excluding guest roamers) by the average number of mobile customers during the period and dividing by the number of months in that period. Algeria, Pakistan and Bangladesh units measure MOU based on billed minutes
Net debt is a non-GAAP financial measure and is calculated as the sum of interest bearing long-term debt and short-term debt minus cash and cash equivalents, long-term and short-term deposits and fair value hedges. The Company believes that net debt provides useful information to investors because it shows the amount of debt outstanding to be paid after using available cash and cash equivalent and long-term and short-term deposits. Net debt should not be considered in isolation as an alternative to long-term debt and short-term debt, or any other measure of the company financial position. Reconciliation of net debt to long-term debt and short-term debt, the most directly comparable IFRS financial measures, is presented above in the reconciliation tables section.
Net foreign exchange (loss)/gain and others represents the sum of Net foreign exchange (loss)/gain, Equity in net (loss)/gain of associates and Other (expense)/income, net (primarily losses from derivative instruments), and is adjusted for certain non-operating losses and gains mainly represented by litigation provisions. Our management uses Net foreign exchange (loss)/gain and others as a supplemental performance measure and believes that it provides useful information about the impact of our debt denominated in foreign currencies on our results of operations due to fluctuations in exchange rates, the performance of our equity investees and other losses and gains the Company needs to manage to run the business.
NPS (Net Promoter Score) is the methodology VimpelCom uses to measure customer satisfaction.
OPEX, operational expenses, represents service costs and selling, general and administrative expenses.
Organic growth in revenue and EBITDA are non-GAAP financial measures that reflect changes in Revenue and EBITDA excluding foreign currency movements and other factors, such as businesses under liquidation, disposals, mergers and acquisitions.
Underlying growth Revenue and EBITDA also excludes MTR reductions and one-offs. We believe investors should consider these measures as they are more indicative of our ongoing performance and management uses these measures to evaluate the Company’s operational results and trends.
Reportable segments: the Company identified Russia, Italy, Algeria, Pakistan, Bangladesh, Ukraine and Eurasia based on the business activities in different geographical areas. Intersegment revenue is eliminated in consolidation.
Service costs represent costs directly associated with revenue generating activity such as traffic related expenses, cost of content and sim-cards as well as cost of handsets, telephone equipment and accessories sold.
Selling, general and administrative expenses represent expenses associated with customer acquisition and retention activities, network and IT maintenance, regular frequency payment, professional and consulting support, rent of premises, utilities, personnel and outsourcing as well as other general and administrative expenses. These expenses do not include personnel costs that have been capitalized as part of long-lived assets.
VimpelCom Ltd. 1Q 2015 | 36
Table of Contents

2015 Ltd 1Q15 Earnings Presentation VimpelCom © Amsterdam – May 13, 2015 Jean-Yves Charlier – CEO Andrew Davies – CFO 1
Table of Contents

Disclaimer This presentation contains “forward-looking statements”, as the phrase is defined in Section 27A of the Securities Act of 1933, as amended, and Section 21E of the Securities Exchange Act of 1934, as amended. These statements relate to, among other things, the Company’s anticipated performance, future market developments and trends, anticipated benefits from the Algeria and Galata transactions, anticipated interest cost savings and benefits from the capital structure optimization/financing improvements, operational and network development and network investment, and the Company’s ability to realize its targets and strategic initiatives in the various countries of operation. The forward-2015 looking statements included in this presentation are based on management’s best assessment of the Company’s Ltd strategic and financial position and of future market conditions and trends. These discussions involve risks and uncertainties. The actual outcome may differ materially from these statements as a result of continued volatility in the economies in our markets, unforeseen developments from competition, governmental regulation of the telecommunications industries, general political uncertainties in our markets, government investigations and/or VimpelCom litigation with third parties. Certain factors that could cause actual results to differ materially from those discussed in © any forward-looking statements include the risk factors described in the Company’s Annual Report on Form 20-F for the year ended December 31, 2014 filed with the U.S. Securities and Exchange Commission (the “SEC”) and other public filings made by the Company with the SEC, which risk factors are incorporated herein by reference. The forward looking statements speak only as of the date hereof, and the Company disclaims any obligation to update them or to announce publicly any revision to any of the forward-looking statements contained in this release, or to make corrections to reflect future events or developments. 2
Table of Contents

New Group CEO – Jean-Yves Charlier 2015 Ltd VimpelCom © Strategic update planned for August 6, 2015 3
Table of Contents

Strategic high lights • Successful closing of Algeria transaction • Repaid USD 3.4 billion of debt 2015 • Italian tower sale completed Ltd • Concluded 3rd and final stage of refinancing in Italy VimpelCom • Acquired 3G license in Ukraine © • 4G/LTE services launched in Georgia • On track to deliver 2015 targets 4
Table of Contents
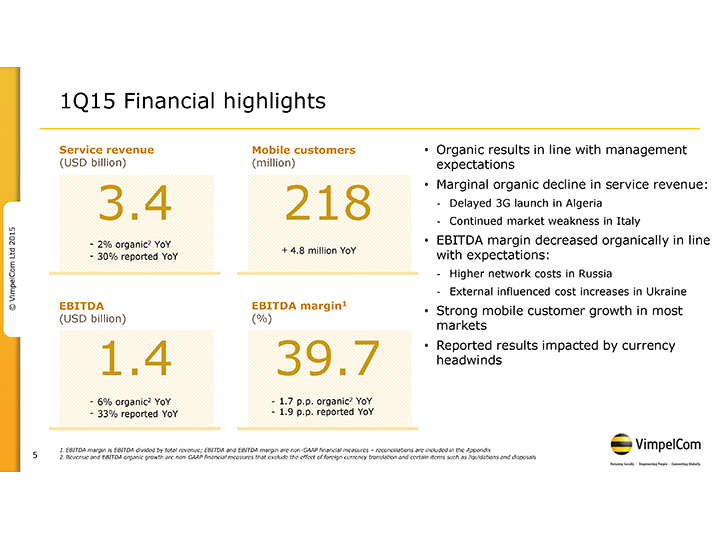
1Q15 Financial highlights Service revenue Mobile customers • Organic results in line with management (USD billion) (million) expectations • Marginal organic decline in service revenue: 3.4 218—Delayed 3G launch in Algeria —Continued market weakness in Italy 2015—2% organic2 YoY • EBITDA margin decreased organically in line Ltd + 4.8 million YoY —30% reported YoY with expectations: —Higher network costs in Russia VimpelCom—External influenced cost increases in Ukraine © EBITDA EBITDA margin1 • Strong mobile customer growth in most (USD billion) (%) markets • Reported results impacted by currency 1.4 39.7 headwinds —6% organic2 YoY—1.7 p.p. organic2 YoY —33% reported YoY—1.9 p.p. reported YoY 1. EBITDA margin is EBITDA divided by total revenue; EBITDA and EBITDA margin are non-GAAP financial measures – reconciliations are included in the Appendix 5 2. Revenue and EBITDA organic growth are non-GAAP financial measures that exclude the effect of foreign currency translation and certain items such as liquidations and disposals
Table of Contents
2015 Business Unit Performance Ltd VimpelCom 1Q15 © 6
Table of Contents
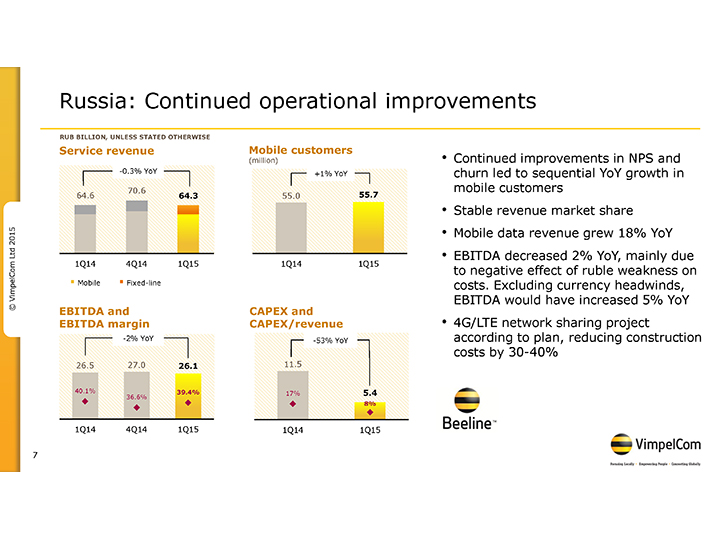
Russia: Continued operational improvements RUB BILLION, UNLESS STATED OTHERWISE Service revenue Mobile customers (million) • Continued improvements in NPS and -0.3% YoY +1% YoY churn led to sequential YoY growth in 70.6 mobile customers 64.6 64.3 55.0 55.7 • Stable revenue market share 2015 • Mobile data revenue grew 18% YoY Ltd mainly • EBITDA decreased 2% YoY, due 1Q14 4Q14 1Q15 1Q14 1Q15 to negative effect of ruble weakness on VimpelCom¡ Mobile ¡ Fixed-line costs. Excluding currency headwinds, © EBITDA and EBITDA would have increased 5% YoY CAPEX and EBITDA margin CAPEX/revenue • 4G/LTE network sharing project -2% YoY -53% YoY according to plan, reducing construction costs by 30-40% 26.5 27.0 26.1 11.5 40.1% 36.6% 39.4% 17% 5.4 8% 1Q14 4Q14 1Q15 1Q14 1Q15 7
Table of Contents
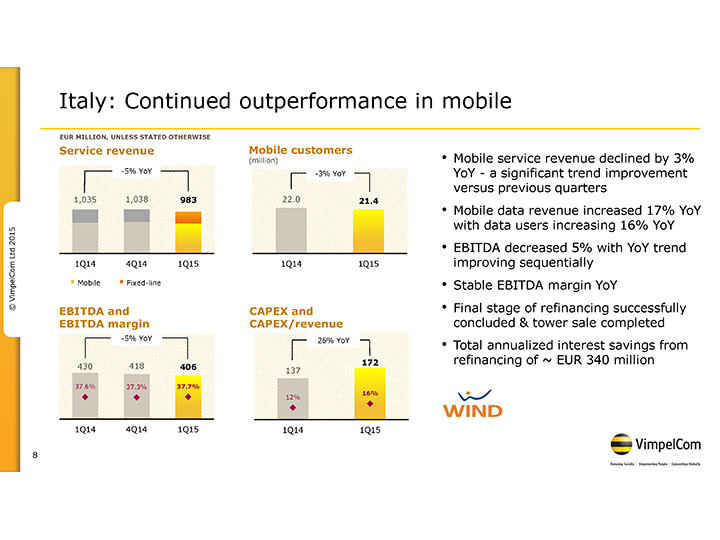
Italy: Continued outperformance in mobile EUR MILLION, UNLESS STATED OTHERWISE Service revenue Mobile customers (million) • Mobile service revenue declined by 3% -5% YoY -3% YoY YoY—a significant trend improvement versus previous quarters 1,035 1,038 983 22.0 21.4 YoY • Mobile data revenue increased 17% 2015 with data users increasing 16% YoY Ltd • EBITDA decreased 5% with YoY trend 1Q14 4Q14 1Q15 1Q14 1Q15 improving sequentially VimpelCom¡ Mobile ¡ Fixed-line • Stable EBITDA margin YoY © EBITDA and • Final stage of refinancing successfully CAPEX and EBITDA margin CAPEX/revenue concluded & tower sale completed -5% YoY 26% YoY • Total annualized interest savings from 172 refinancing of ~ EUR 340 million 430 418 406 137 37.6% 37.3% 37.7% 16% 12% 1Q14 4Q14 1Q15 1Q14 1Q15 8
Table of Contents
Algeria: Transformation to take 12 to 18 months DZD BILLION, UNLESS STATED OTHERWISE Service revenue Mobile customers (million) • Market leader in very attractive growth -11 % YoY +6% YoY market, with a strong local partner 33.4 18.7 33.5 29.8 17.6 • Strengthening local management team • Clear leader in NPS1 with continued 2015 QoQ customer base growth Ltd • EBITDA decreased due to revenue 1Q14 4Q14 1Q15 1Q14 1Q15 decline and higher marketing costs VimpelCom • Continued roll out of 3G, now launched © EBITDA and CAPEX and in 25 regions EBITDA margin CAPEX/revenue • Results expected to remain under –18% YoY -10% YoY pressure in 2015 19.2 4.7 16.8 4.2 15.7 57.4% 52.3% 49.8% 14% 14% 1Q14 4Q14 1Q15 1Q14 1Q15 9 1 NPS (Net Promoter Score) is the methodology VimpelCom uses to measure customer satisfaction
Table of Contents
Pakistan: Operational improvements PKR BILLION, UNLESS STATED OTHERWISE Service revenue Mobile customers (million) • 2G network modernization completed; –4 % YoY +0% YoY continued investment in mobile data 38.2 38.2 network 24.9 24.0 24.3 • Revenue pressure due to simplified 2015 VAS charging and SIM re-verification Ltd • Strong mobile data revenue and 1Q14 4Q14 1Q15 1Q14 1Q15 mobile financial services growth YoY VimpelCom • Continued improvements in NPS, © EBITDA and CAPEX and maintained leading customer market share EBITDA margin1 CAPEX/revenue +2% YoY -53% YoY • Underlying EBITDA margin of 41.5%, 10.2 benefiting from power cost savings 10.1 10.4 5.5 21% 2.6 39.5% 41.5% 41.5% 10% 1Q14 4Q14 1Q15 1Q14 1Q15 = SIM re-verification costs of ~ PKR 0.7 bln 10 1 In 1Q15 reported EBITDA margin was 38.5% as reported EBITDA includes SIM re-verification costs of ~ PKR 0.7 bn; reported EBITDA was PKR 9.7 bn, a decline of 5% YoY
Table of Contents
Bangladesh: Continued double digit growth BDT BILLION, UNLESS STATED OTHERWISE Service revenue Mobile customers (million) • Continued customer and revenue +10 % YoY +8% YoY market share gains 10.2 11.2 11.3 31.8 • Continued double digit revenue growth 29.4 YoY despite unstable macro 2015 environment Ltd • EBITDA increased 21% YoY driven by 1Q14 4Q14 1Q15 1Q14 1Q15 revenue growth and cost efficiencies VimpelCom • Banglalink maintained its leading NPS, © EBITDA and CAPEX and continued improvement in churn EBITDA margin CAPEX/revenue • Banglalink had strong growth in +21% YoY -55% YoY mobile data usage 4.6 4.6 • CAPEX impacted by 48 days of strikes 3.8 2.1 40.8% 40.6% 36.9% 20% 0.9 8% 1Q14 4Q14 1Q15 1Q14 1Q15 11
Table of Contents
Ukraine: Solid results in a challenging environment UAH BILLION, UNLESS STATED OTHERWISE Service revenue Mobile customers (million) • YoY customer and mobile service +5% YoY +2% YoY revenue growth, despite challenging & volatile environment 3.1 3.1 25.6 26.1 2.9 • Improvement in annualized churn of 7 2015 p.p. YoY Ltd • Mobile data revenue growth 16% YoY 1Q14 4Q14 1Q15 1Q14 1Q15 • EBITDA and EBITDA margin declined VimpelCom¡ Mobile ¡ Fixed-line mainly due to external factors © EBITDA and CAPEX and • Continued 3G roll out, launch expected EBITDA margin CAPEX/revenue in 2H15 -11% YoY +239% YoY 1.4 1.3 1.3 1.0 48.6% 42.3% 41.3% 33% 0.3 10% 1Q14 4Q14 1Q15 1Q14 1Q15 12
Table of Contents
Kazakhstan: Strong position in competitive market KZT BILLION, UNLESS STATED OTHERWISE Service revenue Mobile customers (million) • Strong position as a result of attractive -0.5% YoY +5% YoY customer propositions, network and 30.4 34.9 30.2 distribution 9.2 9.6 • Excluding MTR reductions mobile service 2015 revenue increased 2% YoY Ltd • Mobile data revenue grew 38% YoY 1Q14 4Q14 1Q15 1Q14 1Q15 • Fixed-line service revenue grew 9% YoY ¡ Mobile ¡ Fixed-line margin positively impacted by VimpelCom • EBITDA © EBITDA and CAPEX and MTR reduction EBITDA margin CAPEX/revenue • Increased competitive environment +3% YoY -24% YoY expected to remain in 2015 14.6 15.0 14.1 1.6 47.8% 49.5% 1.2 40.2% 5% 4% 1Q14 4Q14 1Q15 1Q14 1Q15 13
Table of Contents
Eurasia1: Increased competition USD MILLION, UNLESS STATED OTHERWISE Service revenue Mobile customers (million) • Mobile service revenue increased Reported -8% YoY Organic +3% YoY +1% YoY organically 3% YoY mainly due to solid 263 290 242 16.5 16.6 results in Uzbekistan 21 21 18 • Mobile data revenue growth of 8% YoY 268 2015 242 224 • Churn improved YoY in Uzbekistan, Ltd Armenia and Kyrgyzstan 1Q14 4Q14 1Q15 1Q14 1Q15 • 4G/LTE launched in Georgia ¡ Mobile ¡ Fixed-line Increasing competition in Uzbekistan VimpelCom • © EBITDA and CAPEX and in 2015 (from 2 to 4 player market) EBITDA margin CAPEX/revenue Reported -10% YoY +59% YoY Organic +3% YoY 133 134 120 45 50.0% 49.5% 29 46.4% 19% 11% 1Q14 4Q14 1Q15 1Q14 1Q15 14 1 Eurasia consists of our operations in Uzbekistan, Armenia, Kyrgyzstan, Tajikistan, Georgia and Laos
Table of Contents
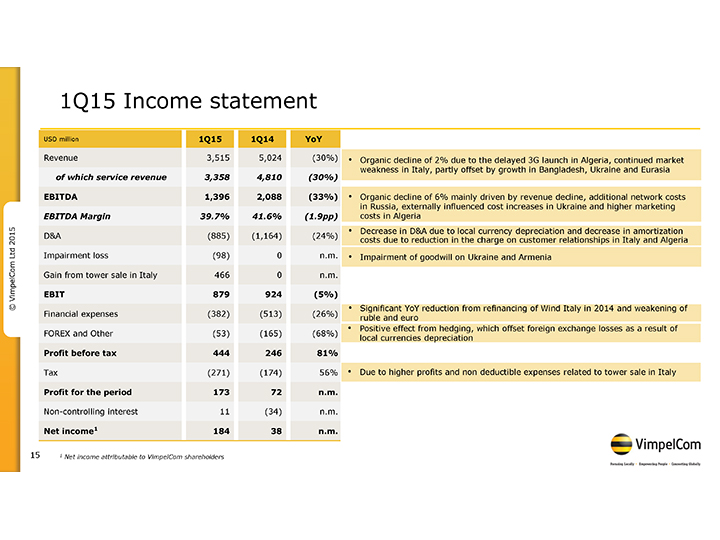
1Q15 Income statement USD million 1Q15 1Q14 YoY Revenue 3,515 5,024 (30%) • Organic decline of 2% due to the delayed 3G launch in Algeria, continued market of which service revenue 3,358 4,810 (30%) weakness in Italy, partly offset by growth in Bangladesh, Ukraine and Eurasia EBITDA 1,396 2,088 (33%) • Organic decline of 6% mainly driven by revenue decline, additional network costs in Russia, externally influenced cost increases in Ukraine and higher marketing EBITDA Margin 39.7% 41.6% (1.9pp) costs in Algeria • Decrease in D&A due to local currency depreciation and decrease in amortization D&A (885) (1,164) (24%) 2015 costs due to reduction in the charge on customer relationships in Italy and Algeria Ltd Impairment loss (98) 0 n.m. • Impairment of goodwill on Ukraine and Armenia Gain from tower sale in Italy 466 0 n.m. VimpelCom EBIT 879 924 (5%) © • Significant YoY reduction from refinancing of Wind Italy in 2014 and weakening of Financial expenses (382) (513) (26%) ruble and euro • Positive effect from hedging, which offset foreign exchange losses as a result of FOREX and Other (53) (165) (68%) local currencies depreciation Profit before tax 444 246 81% Tax (271) (174) 56% • Due to higher profits and non deductible expenses related to tower sale in Italy Profit for the period 173 72 n.m. Non-controlling interest 11 (34) n.m. Net income1 184 38 n.m. 15 1 Net income attributable to VimpelCom shareholders
Table of Contents
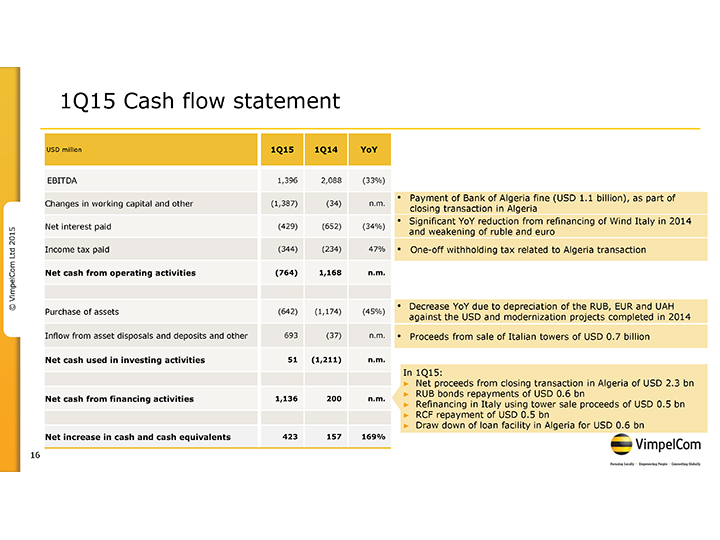
1Q15 Cash flow statement USD million 1Q15 1Q14 YoY EBITDA 1,396 2,088 (33%) • Payment of Bank of Algeria fine (USD 1.1 billion), as part of Changes in working capital and other (1,387) (34) n.m. closing transaction in Algeria • Significant YoY reduction from refinancing of Wind Italy in 2014 Net interest paid (429) (652) (34%) 2015 and weakening of ruble and euro Ltd Income tax paid (344) (234) 47% • One-off withholding tax related to Algeria transaction VimpelCom Net cash from operating activities (764) 1,168 n.m. © • Decrease YoY due to depreciation of the RUB, EUR and UAH Purchase of assets (642) (1,174) (45%) against the USD and modernization projects completed in 2014 Inflow from asset disposals and deposits and other 693 (37) n.m. • Proceeds from sale of Italian towers of USD 0.7 billion Net cash used in investing activities 51 (1,211) n.m. In 1Q15: ? Net proceeds from closing transaction in Algeria of USD 2.3 bn ? RUB bonds repayments of USD 0.6 bn Net cash from financing activities 1,136 200 n.m. ? Refinancing in Italy using tower sale proceeds of USD 0.5 bn ? RCF repayment of USD 0.5 bn ? Draw down of loan facility in Algeria for USD 0.6 bn Net increase in cash and cash equivalents 423 157 169% 16
Table of Contents
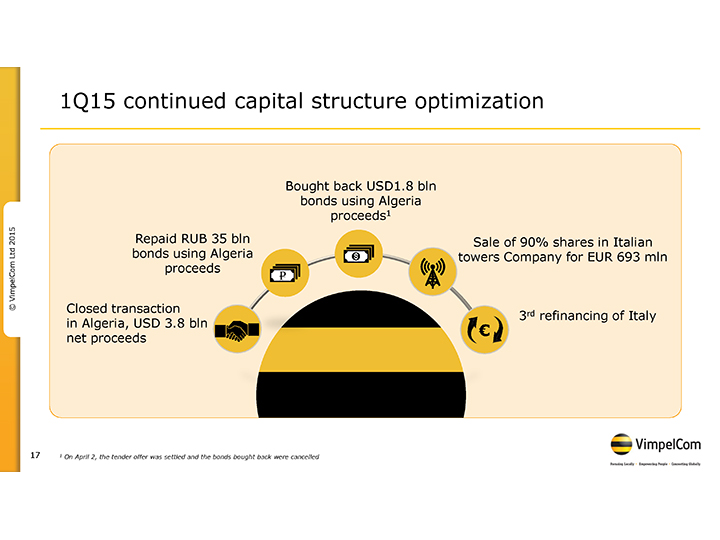
1Q15 continued capital structure optimization Bought back USD1.8 bln bonds using Algeria proceeds1 2015 Repaid RUB 35 bln Sale of 90% shares in Italian Ltd bonds using Algeria towers Company for EUR 693 mln VimpelCom proceeds © Closed transaction 3rd refinancing of Italy in Algeria, USD 3.8 bln € net proceeds 17 1 On April 2, the tender offer was settled and the bonds bought back were cancelled
Table of Contents
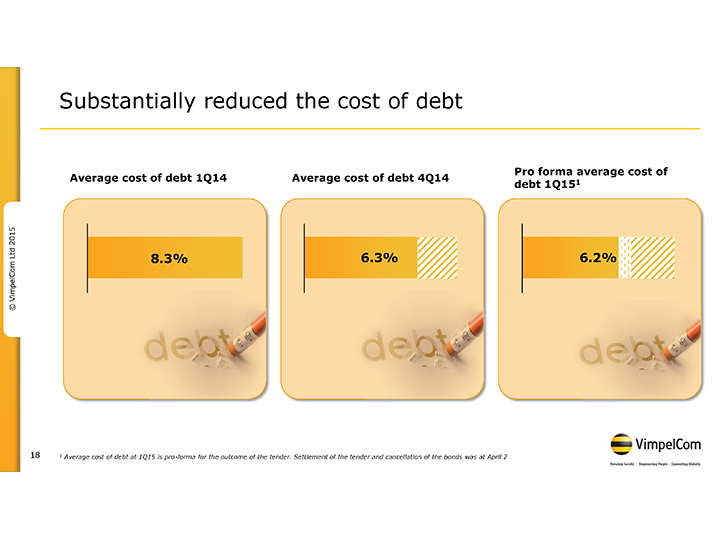
Substantially reduced the cost of debt Pro forma average cost of Average cost of debt 1Q14 Average cost of debt 4Q14 1 debt 1Q15 2015 Ltd VimpelCom 8.3% 6.3% 6.2% © 18 1 Average cost of debt at 1Q15 is pro-forma for the outcome of the tender. Settlement of the tender and cancellation of the bonds was at April 2
Table of Contents
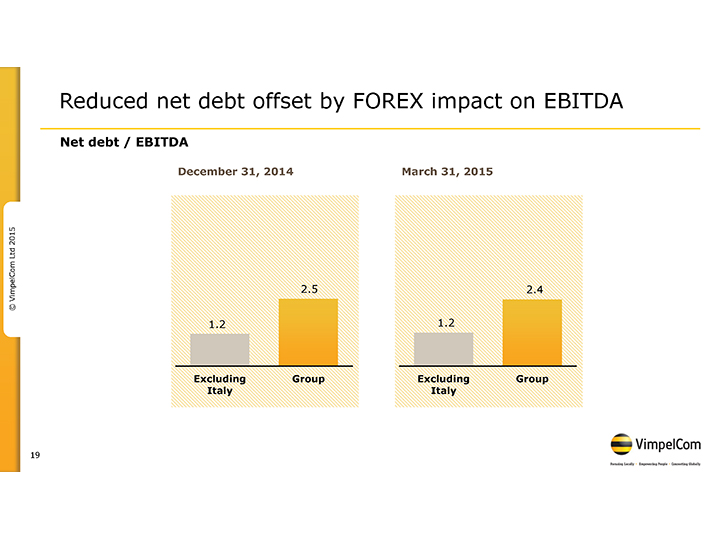
Reduced net debt offset by FOREX impact on EBITDA Net debt / EBITDA December 31, 2014 March 31, 2015 2015 Ltd VimpelCom 2.5 2.4 © 1.2 1.2 Excluding Group Excluding Group Italy Italy 19
Table of Contents
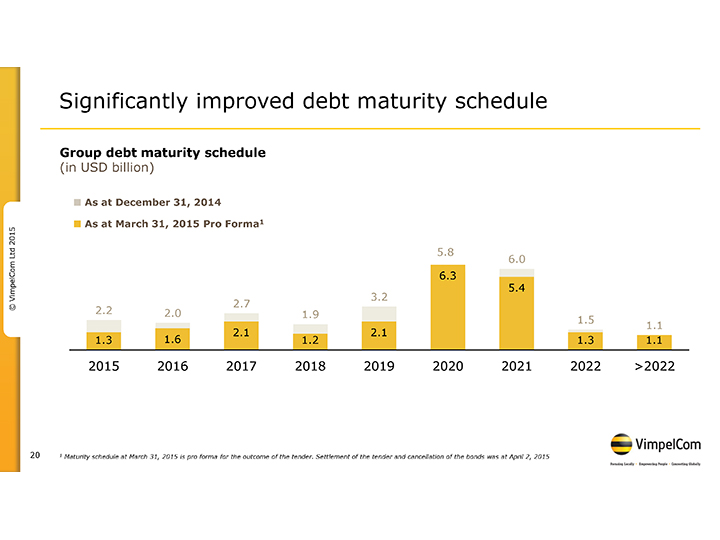
Significantly improved debt maturity schedule Group debt maturity schedule (in USD billion) ? As at December 31, 2014 ? As at March 31, 2015 Pro Forma1 2015 5.8 Ltd 6.0 6.3 5.4 VimpelCom 3.2 © 2.2 2.7 2.0 1.9 1.5 1.1 2.1 2.1 1.3 1.6 1.2 1.3 1.1 2015 2016 2017 2018 2019 2020 2021 2022 >2022 20 1 Maturity schedule at March 31, 2015 is pro forma for the outcome of the tender. Settlement of the tender and cancellation of the bonds was at April 2, 2015
Table of Contents
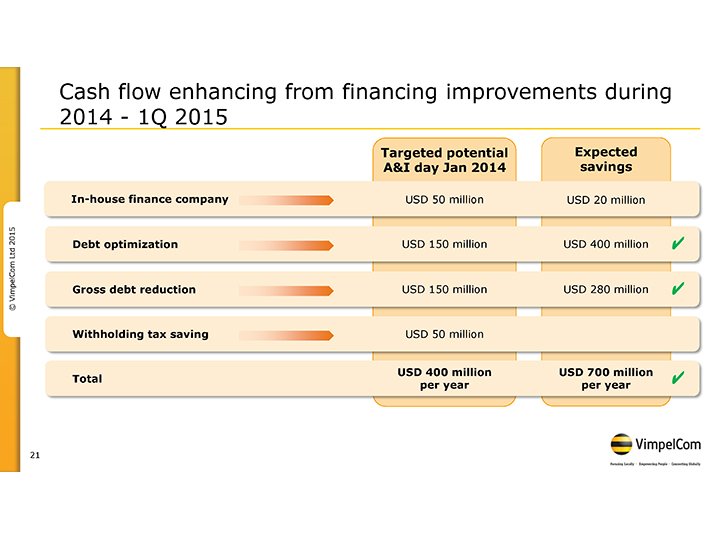
Cash flow enhancing from financing improvements during 2014—1Q 2015 Targeted potential Expected A&I day Jan 2014 savings In-house finance company USD 50 million USD 20 million 2015 Ltd Debt optimization USD 150 million USD 400 million VimpelCom Gross debt reduction USD 150 million USD 280 million © Withholding tax saving USD 50 million USD 400 million USD 700 million Total per year per year 21
Table of Contents
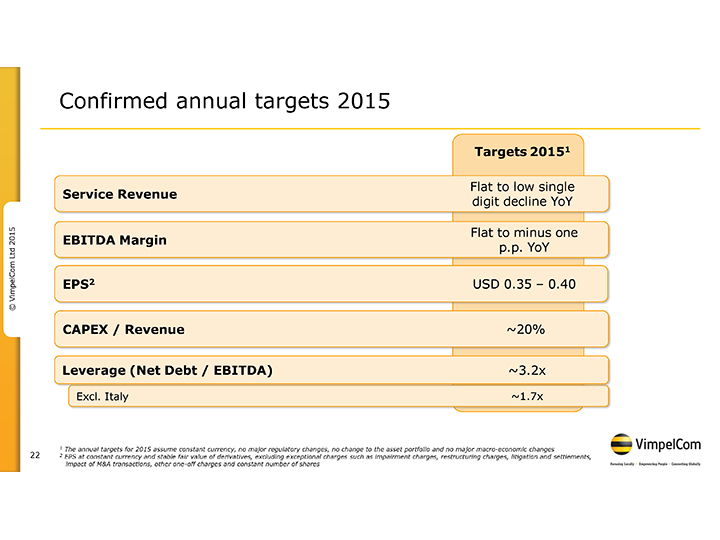
Confirmed annual targets 2015 Targets 20151 Flat to low single Service Revenue digit decline YoY Flat to minus one 2015 EBITDA Margin Ltd p.p. YoY VimpelCom EPS2 USD 0.35 – 0.40 © CAPEX / Revenue ~20% Leverage (Net Debt / EBITDA) ~3.2x Excl. Italy ~1.7x 1 The annual targets for 2015 assume constant currency, no major regulatory changes, no change to the asset portfolio and no major macro-economic changes 22 2 EPS at constant currency and stable fair value of derivatives, excluding exceptional charges such as impairment charges, restructuring charges, litigation and settlements, impact of M&A transactions, other one-off charges and constant number of shares
Table of Contents
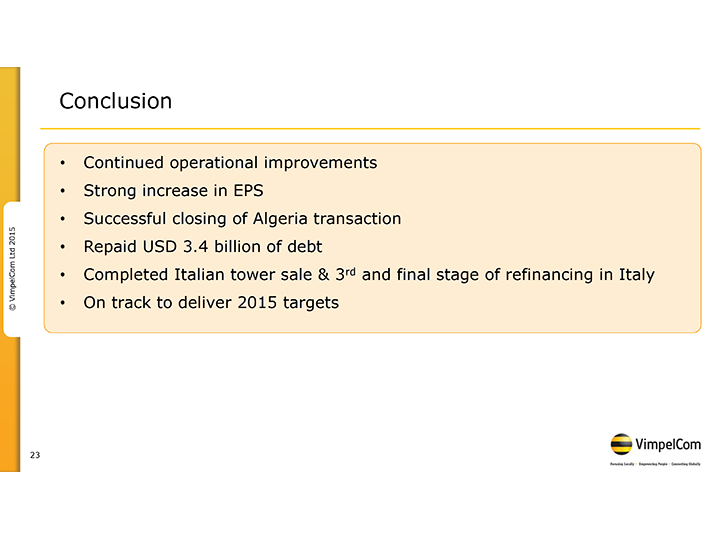
Conclusion • Continued operational improvements • Strong increase in EPS • Successful closing of Algeria transaction 2015 Ltd • Repaid USD 3.4 billion of debt VimpelCom • Completed Italian tower sale & 3rd and final stage of refinancing in Italy © • On track to deliver 2015 targets 23
Table of Contents

VimpelCom’s 4th Analyst & Investor site visit Moscow, Russia July 9, 2015 Moscow, Russia 2015 Presentations by Group CFO, Ltd Head of BU Russia and VimpelCom local management © 24
Table of Contents

2Q15 results & strategy update August 6, 2015 London 2015 Ltd VimpelCom © 25
Table of Contents
© VimpelCom Ltd 2015 26 Q&A
Table of Contents
Further information Investor Relations Claude Debussylaan 88 1082 MD Amsterdam The Netherlands T: +31 20 79 77 234 2015 E: [email protected] Ltd Visit our awards winning website Install VimpelCom’s App VimpelCom www.vimpelcom.com iPadApp © No.1 CORPORATE WEBSITE 2014 -2015 in the Netherlands 27
Table of Contents

© VimpelCom Ltd 2015 28 Thank you!
Table of Contents
© VimpelCom Ltd 2015 29 Appendix
Table of Contents
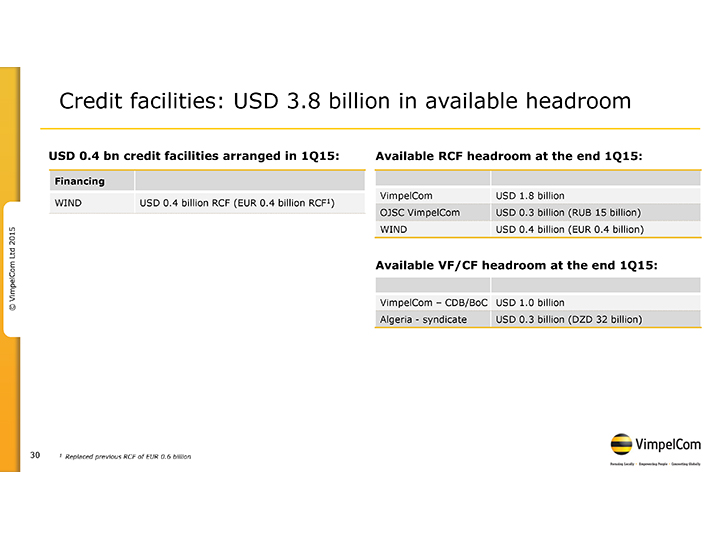
Credit facilities: USD 3.8 billion in available headroom USD 0.4 bn credit facilities arranged in 1Q15: Available RCF headroom at the end 1Q15: Financing VimpelCom USD 1.8 billion WIND USD 0.4 billion RCF (EUR 0.4 billion RCF1) OJSC VimpelCom USD 0.3 billion (RUB 15 billion) 2015 WIND USD 0.4 billion (EUR 0.4 billion) Ltd VimpelCom Available VF/CF headroom at the end 1Q15: © VimpelCom – CDB/BoC USD 1.0 billion Algeria—syndicate USD 0.3 billion (DZD 32 billion) 30 1 Replaced previous RCF of EUR 0.6 billion
Table of Contents

Debt maturity profile As at 31 March 2015, in USD billion Group debt maturity schedule by Business Units 6.3 Italy Russia 5.4 Other HQ 3.2 2015 2.1 2.1 1.6 Ltd 1.2 1.3 1.1 VimpelCom 20151 2016 2017 2018 2019 2020 2021 2022 >2022 © Group debt maturity schedule by currency2 20151 2016 2017 2018 2019 2020 2021 2022 >2022 EUR 0.1 0.1 0.0 0.0 0.9 5.7 4.1 0.0 0.1 48% USD 1.9 0.7 1.5 0.6 1.0 0.1 0.7 1.3 1.0 38% RUB 0.9 0.5 0.4 0.4 0.0 0.0 0.0 0.0 0.0 10% Other 0.2 0.2 0.2 0.2 0.2 0.0 0.0 0.0 0.0 5% 1 Includes USD 1.8 bln bonds tendered in March 2015, while settlement of the tender and cancellation of the bonds was at April 2, 2015 31 2 After effect of cross currency swaps
Table of Contents
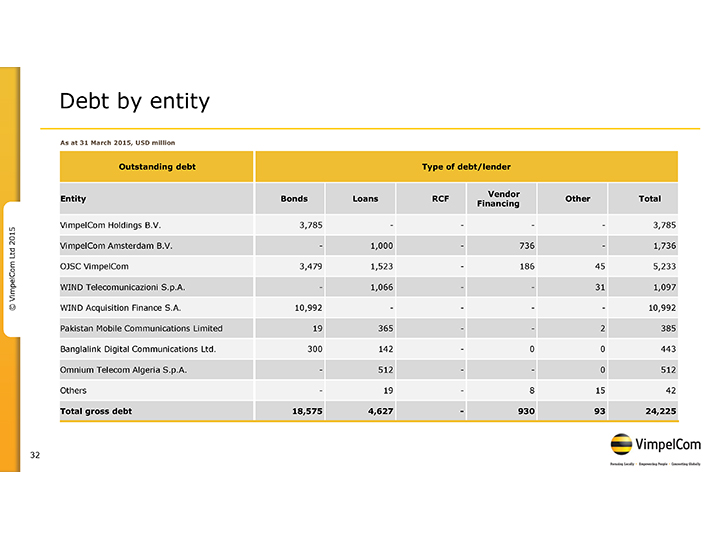
Debt by entity As at 31 March 2015, USD million Outstanding debt Type of debt/lender Vendor Entity Bonds Loans RCF Other Total Financing 2015 VimpelCom Holdings B.V. 3,785 — — 3,785 Ltd VimpelCom Amsterdam B.V. —1,000 —736 —1,736 OJSC VimpelCom 3,479 1,523—186 45 5,233 VimpelCom WIND Telecomunicazioni S.p.A. —1,066 — 31 1,097 © WIND Acquisition Finance S.A. 10,992 — — —10,992 Pakistan Mobile Communications Limited 19 365 — 2 385 Banglalink Digital Communications Ltd. 300 142 — 0 0 443 Omnium Telecom Algeria S.p.A. — 512 — — 0 512 Others — 19 — 8 15 42 Total gross debt 18,575 4,627 — 930 93 24,225 32
Table of Contents

FOREX rates used in annual targets for 2015 Currency FX rates versus USD Algeria DZD 92.0 Armenia AMD 415.0 2015 Bangladesh BDT 79.0 Ltd Egypt EGP 7.5 Georgia GEL 1.8 VimpelCom Italy EUR 0.91 © Kazakhstan KZT 190.0 Kyrgyzstan KGS 55.0 Pakistan PKR 105.0 Russia RUB 70.0 Ukraine UAH 25.0 33
Table of Contents
Service revenue and EBITDA development in 1Q15 1Q 2015 vs 1Q 2014 Service Revenue EBITDA FX and Business Units Organic Reported Organic FX and others Reported others 2015 Russia 0% (44%) (44%) (2%) (43%) (45%) Italy (5%) (17%) (22%) (5%) (18%) (23%) Ltd Algeria (11%) (14%) (25%) (18%) (14%) (32%) Pakistan (4%) 2% (2%) (5%) 2% (3%) VimpelCom Bangladesh 10% 0% 10% 21% 0% 21% © Ukraine 5% (60%) (55%) (11%) (50%) (61%) Kazakhstan 0% (9%) (9%) 3% (9%) (6%) Eurasia 3% (11%) (8%) 3% (13%) (10%) Total (2%) (28%) (30%) (6%) (27%) (33%) 34
Table of Contents
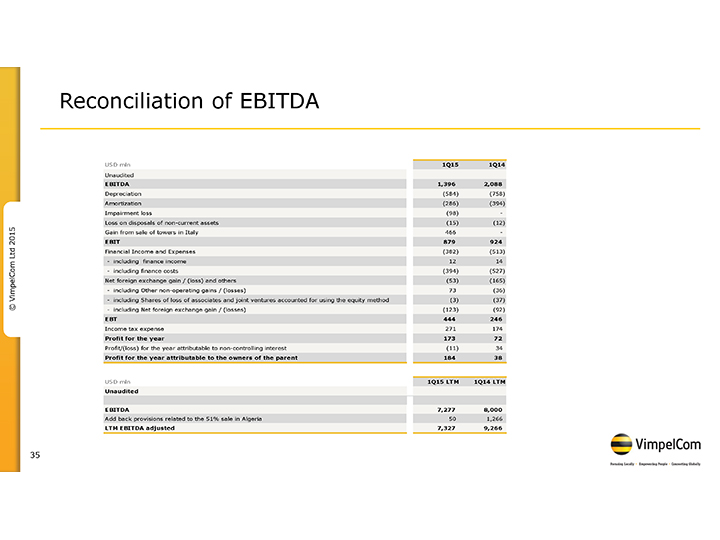
Reconciliation of EBITDA USD mln 1Q15 1Q14 Unaudited EBITDA 1,396 2,088 Depreciation (584) (758) Amortization (286) (394) Impairment loss (98) — Loss on disposals of non-current assets (15) (12) Gain from sale of towers in Italy 466 —2015 EBIT 879 924 Ltd Financial Income and Expenses (382) (513) —including finance income 12 14 —including finance costs (394) (527) Net foreign exchange gain / (loss) and others (53) (165) VimpelCom—including Other non-operating gains / (losses) 73 (36) —including Shares of loss of associates and joint ventures accounted for using the equity method (3) (37) ©—including Net foreign exchange gain / (losses) (123) (92) EBT 444 246 Income tax expense 271 174 Profit for the year 173 72 Profit/(loss) for the year attributable to non-controlling interest (11) 34 Profit for the year attributable to the owners of the parent 184 38 USD mln 1Q15 LTM 1Q14 LTM Unaudited EBITDA 7,277 8,000 Add back provisions related to the 51% sale in Algeria 50 1,266 LTM EBITDA adjusted 7,327 9,266 35
Table of Contents
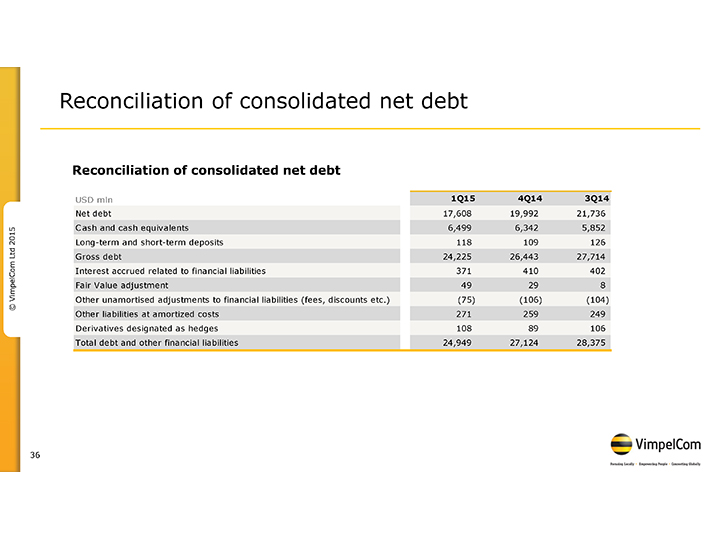
Reconciliation of consolidated net debt Reconciliation of consolidated net debt USD mln 1Q15 4Q14 3Q14 Net debt 17,608 19,992 21,736 2015 Cash and cash equivalents 6,499 6,342 5,852 Long-term and short-term deposits 118 109 126 Ltd Gross debt 24,225 26,443 27,714 Interest accrued related to financial liabilities 371 410 402 VimpelCom Fair Value adjustment 49 29 8 Other unamortised adjustments to financial liabilities (fees, discounts etc.) (75) (106) (104) © Other liabilities at amortized costs 271 259 249 Derivatives designated as hedges 108 89 106 Total debt and other financial liabilities 24,949 27,124 28,375 36
Table of Contents
Table of Contents
VimpelCom Ltd.
index page
(in USD millions, unless stated otherwise, unaudited)
| Consolidated |
1Q13 | 2Q13 | 3Q13 | 4Q13* | 1Q14 | 2Q14 | 3Q14 | 4Q14 | 1Q15 | FY12 | FY13* | FY14 | ||||||||||||||||||||||||||||||||||||
| Total operating revenue |
5,591 | 5,718 | 5,685 | 5,552 | 5,024 | 5,067 | 5,145 | 4,391 | 3,515 | 23,061 | 22,546 | 19,627 | ||||||||||||||||||||||||||||||||||||
| Service revenue |
5,313 | 5,449 | 5,477 | 5,290 | 4,810 | 4,861 | 4,847 | 4,207 | 3,358 | 22,122 | 21,531 | 18,725 | ||||||||||||||||||||||||||||||||||||
| EBITDA |
2,348 | 2,425 | 2,474 | 1,013 | 2,088 | 2,076 | 2,205 | 1,600 | 1,396 | 9,768 | 8,260 | 7,970 | ||||||||||||||||||||||||||||||||||||
| EBITDA margin (%) |
42.0 | % | 42.4 | % | 43.5 | % | 18.2 | % | 41.6 | % | 41.0 | % | 42.9 | % | 36.4 | % | 39.7 | % | 42.4 | % | 36.6 | % | 40.6 | % | ||||||||||||||||||||||||
| EBIT |
1,107 | 1,224 | 1,233 | (3,218 | ) | 924 | 938 | 1,143 | (421 | ) | 879 | 4,171 | 346 | 2,586 | ||||||||||||||||||||||||||||||||||
| Profit/(Loss) before tax |
543 | 762 | 665 | (3,994 | ) | 246 | 479 | 110 | (1,016 | ) | 444 | 2,282 | (2,024 | ) | (181 | ) | ||||||||||||||||||||||||||||||||
| Net income/(loss) |
408 | 573 | 255 | (3,861 | ) | 38 | 100 | 104 | (935 | ) | 184 | 1,539 | (2,625 | ) | (691 | ) | ||||||||||||||||||||||||||||||||
| Capital expenditures (CAPEX) |
755 | 791 | 1,040 | 1,720 | 735 | 1,331 | 978 | 1,211 | 460 | 4,120 | 4,306 | 4,256 | ||||||||||||||||||||||||||||||||||||
| CAPEX excluding licenses |
595 | 791 | 930 | 1,682 | 725 | 1,017 | 964 | 1,201 | 407 | 4,120 | 3,998 | 3,908 | ||||||||||||||||||||||||||||||||||||
| CAPEX excluding licenses / revenue |
11 | % | 14 | % | 16 | % | 30 | % | 14 | % | 20 | % | 19 | % | 27 | % | 12 | % | 18 | % | 18 | % | 20 | % | ||||||||||||||||||||||||
| Operating cash flow (EBITDA-CAPEX excluding licenses) |
1,753 | 1,634 | 1,544 | (669 | ) | 1,363 | 1,059 | 1,241 | 399 | 989 | 5,648 | 4,262 | 4,062 | |||||||||||||||||||||||||||||||||||
| OCF margin (%) |
31 | % | 29 | % | 27 | % | (12 | %) | 27 | % | 21 | % | 24 | % | 9 | % | 28 | % | 24 | % | 19 | % | 21 | % | ||||||||||||||||||||||||
Notes:
| (1) | As a result of the succesful resolution in Algeria, adjustments to the following items were made: |
| (a) | 4Q13 EBITDA, EBITDA margin, EBIT and Loss before tax of USD 1.3 bln to reflect BofA claim |
| (b) | 4Q14 EBITDA, EBITDA margin, EBIT and Loss before tax of USD 50 mln to reflect Cevital settlement |
| (2) | 4Q13 EBITDA and CAPEX were affected by USD 72 mln as a result of fixed assets write off and accounted as operating expenses in Uzbekistan |
| (3) | The FY12 Financial Statements have been restated for the Euroset fair value adjustment of USD 606 million |
| (4) | The customer numbers for 2012, 2013 and 2014 have been adjusted to remove customers in operations that have been sold and to reflect revised customer numbers in Algeria, due to the reported technical issue, and Ukraine where the definition of customers has been aligned to the group definition |
| (5) | 1Q13 and FY13 CAPEX excludes EUR 136 million of non-cash increase in Intangible Assets related to the contract with Terna in relation to the Right of Way of WIND’s backbone. |
| Customers* (mln) |
1Q13 | 2Q13 | 3Q13 | 4Q13 | 1Q14 | 2Q14 | 3Q14 | 4Q14 | 1Q15 | FY12 | FY13 | FY14 | ||||||||||||||||||||||||||||||||||||
| Russia |
55.7 | 57.1 | 58.1 | 56.5 | 55.0 | 56.3 | 57.3 | 57.2 | 55.7 | 56.1 | 56.5 | 57.2 | ||||||||||||||||||||||||||||||||||||
| Italy |
22.0 | 22.3 | 22.4 | 22.3 | 22.0 | 21.9 | 21.8 | 21.6 | 21.4 | 21.7 | 22.3 | 21.6 | ||||||||||||||||||||||||||||||||||||
| Algeria |
16.6 | 16.8 | 17.0 | 17.6 | 17.6 | 17.5 | 18.2 | 18.4 | 18.7 | 16.7 | 17.6 | 18.4 | ||||||||||||||||||||||||||||||||||||
| Pakistan |
36.3 | 37.1 | 37.4 | 37.6 | 38.2 | 38.8 | 38.7 | 38.5 | 38.2 | 36.1 | 37.6 | 38.5 | ||||||||||||||||||||||||||||||||||||
| Bangladesh |
25.9 | 27.1 | 28.1 | 28.8 | 29.4 | 29.8 | 30.2 | 30.8 | 31.8 | 25.9 | 28.8 | 30.8 | ||||||||||||||||||||||||||||||||||||
| Ukraine |
26.3 | 25.6 | 25.9 | 25.8 | 25.6 | 25.4 | 26.3 | 26.2 | 26.1 | 25.1 | 25.8 | 26.2 | ||||||||||||||||||||||||||||||||||||
| Kazakhstan |
8.5 | 8.8 | 9.0 | 9.2 | 9.2 | 9.6 | 9.8 | 9.8 | 9.6 | 8.6 | 9.2 | 9.8 | ||||||||||||||||||||||||||||||||||||
| Uzbekistan |
10.3 | 10.2 | 10.3 | 10.5 | 10.4 | 10.4 | 10.5 | 10.6 | 10.4 | 10.2 | 10.5 | 10.6 | ||||||||||||||||||||||||||||||||||||
| Armenia |
0.8 | 0.7 | 0.7 | 0.7 | 0.7 | 0.7 | 0.8 | 0.8 | 0.8 | 0.8 | 0.7 | 0.8 | ||||||||||||||||||||||||||||||||||||
| Tajikistan |
1.2 | 1.2 | 1.2 | 1.3 | 1.3 | 1.3 | 1.3 | 1.3 | 1.3 | 1.1 | 1.3 | 1.3 | ||||||||||||||||||||||||||||||||||||
| Georgia |
1.0 | 1.0 | 1.1 | 1.1 | 1.1 | 1.1 | 1.3 | 1.3 | 1.3 | 1.0 | 1.1 | 1.3 | ||||||||||||||||||||||||||||||||||||
| Kyrgystan |
2.2 | 2.3 | 2.5 | 2.7 | 2.6 | 2.6 | 2.7 | 2.7 | 2.7 | 2.5 | 2.7 | 2.7 | ||||||||||||||||||||||||||||||||||||
| Laos |
0.3 | 0.3 | 0.3 | 0.3 | 0.3 | 0.3 | 0.3 | 0.2 | 0.2 | 0.3 | 0.3 | 0.2 | ||||||||||||||||||||||||||||||||||||
|
|
|
|
|
|
|
|
|
|
|
|
|
|
|
|
|
|
|
|
|
|
|
|
|
|||||||||||||||||||||||||
| Total |
207.1 | 210.6 | 214.1 | 214.3 | 213.3 | 215.5 | 219.2 | 219.4 | 218.1 | 206.0 | 214.3 | 219.4 | ||||||||||||||||||||||||||||||||||||
|
|
|
|
|
|
|
|
|
|
|
|
|
|
|
|
|
|
|
|
|
|
|
|
|
|||||||||||||||||||||||||
| * | The numbers exclude customers of Wind Canada, CAR, Burundi and Zimbabwe |
Table of Contents
Russia
index page
(in USD millions, unless stated otherwise, unaudited)
| CONSOLIDATED |
1Q13 | 2Q13 | 3Q13 | 4Q13 | 1Q14 | 2Q14 | 3Q14 | 4Q14 | 1Q15 | FY12 | FY13 | FY14 | ||||||||||||||||||||||||||||||||||||
| Total operating revenue |
2,304 | 2,334 | 2,298 | 2,173 | 1,893 | 1,964 | 2,021 | 1,580 | 1,067 | 9,190 | 9,109 | 7,458 | ||||||||||||||||||||||||||||||||||||
| EBITDA |
963 | 997 | 980 | 876 | 760 | 813 | 827 | 580 | 421 | 3,878 | 3,815 | 2,980 | ||||||||||||||||||||||||||||||||||||
| EBITDA margin (%) |
41.8 | % | 42.7 | % | 42.6 | % | 40.3 | % | 40.1 | % | 41.4 | % | 40.9 | % | 36.6 | % | 39.4 | % | 42.2 | % | 41.9 | % | 40.0 | % | ||||||||||||||||||||||||
| Capital expenditures (CAPEX) |
220 | 355 | 395 | 852 | 325 | 392 | 419 | 423 | 84 | 1,630 | 1,822 | 1,559 | ||||||||||||||||||||||||||||||||||||
| CAPEX excluding licenses |
220 | 355 | 395 | 852 | 315 | 378 | 405 | 416 | 80 | 1,630 | 1,822 | 1,514 | ||||||||||||||||||||||||||||||||||||
| Operating cash flow (EBITDA-CAPEX excluding licenses) |
743 | 642 | 585 | 24 | 445 | 435 | 422 | 164 | 341 | 2,248 | 1,993 | 1,466 | ||||||||||||||||||||||||||||||||||||
| OCF margin (%) |
32 | % | 27 | % | 25 | % | 1 | % | 23 | % | 22 | % | 21 | % | 10 | % | 32 | % | 24 | % | 22 | % | 20 | % | ||||||||||||||||||||||||
| MOBILE |
1Q13 | 2Q13 | 3Q13 | 4Q13 | 1Q14 | 2Q14 | 3Q14 | 4Q14 | 1Q15 | FY12 | FY13 | FY14 | ||||||||||||||||||||||||||||||||||||
| Total operating revenues |
1,911 | 1,937 | 1,902 | 1,786 | 1,540 | 1,604 | 1,651 | 1,275 | 870 | 7,630 | 7,536 | 6,070 | ||||||||||||||||||||||||||||||||||||
| Service Revenue (Mobile) |
1,776 | 1,833 | 1,854 | 1,730 | 1,500 | 1,569 | 1,600 | 1,208 | 839 | 7,278 | 7,193 | 5,877 | ||||||||||||||||||||||||||||||||||||
| Data Revenue (Mobile) |
236 | 242 | 246 | 270 | 251 | 256 | 272 | 224 | 167 | 783 | 994 | 1,003 | ||||||||||||||||||||||||||||||||||||
| Customers (mln) |
55.7 | 57.1 | 58.1 | 56.5 | 55.0 | 56.3 | 57.3 | 57.2 | 55.7 | 56.1 | 56.5 | 57.2 | ||||||||||||||||||||||||||||||||||||
| Mobile data customers (mln) |
n.a. | n.a. | n.a. | n.a. | n.a. | n.a. | n.a. | n.a. | 32.0 | n.a. | n.a. | n.a. | ||||||||||||||||||||||||||||||||||||
| ARPU (USD) |
10.6 | 10.8 | 10.6 | 10.1 | 8.9 | 9.3 | 9.3 | 7.0 | 4.9 | n.a. | n.a. | n.a. | ||||||||||||||||||||||||||||||||||||
| MOU, min |
277 | 294 | 290 | 293 | 287 | 310 | 311 | 316 | 303 | n.a. | n.a. | n.a. | ||||||||||||||||||||||||||||||||||||
| Churn 3 months active base (quarterly), % |
15 | % | 14 | % | 15 | % | 18 | % | 17.1 | % | 13.4 | % | 14.5 | % | 15.7 | % | 15.8 | % | n.a. | n.a. | n.a. | |||||||||||||||||||||||||||
| MBOU |
n.a. | n.a. | n.a. | n.a. | n.a. | n.a. | n.a. | n.a. | 1,434 | n.a. | n.a. | n.a. | ||||||||||||||||||||||||||||||||||||
| FIXED-LINE |
1Q13 | 2Q13 | 3Q13 | 4Q13 | 1Q14 | 2Q14 | 3Q14 | 4Q14 | 1Q15 | FY12 | FY13 | FY14 | ||||||||||||||||||||||||||||||||||||
| Total operating revenue |
393 | 397 | 395 | 387 | 353 | 360 | 370 | 305 | 197 | 1,560 | 1,572 | 1,388 | ||||||||||||||||||||||||||||||||||||
| Service revenue |
387 | 392 | 392 | 381 | 348 | 355 | 366 | 303 | 196 | 1,539 | 1,552 | 1,372 | ||||||||||||||||||||||||||||||||||||
| Broadband revenue |
105 | 100 | 95 | 97 | 91 | 93 | 86 | 69 | 51 | 377 | 397 | 339 | ||||||||||||||||||||||||||||||||||||
| Broadband customers (mln) |
2.4 | 2.3 | 2.3 | 2.3 | 2.3 | 2.2 | 2.2 | 2.3 | 2.3 | 2.4 | 2.3 | 2.3 | ||||||||||||||||||||||||||||||||||||
| Broadband ARPU (USD) |
14.5 | 14.0 | 13.5 | 13.9 | 13.1 | 13.5 | 12.5 | 10.2 | 7.4 | n.a. | n.a. | n.a. | ||||||||||||||||||||||||||||||||||||
| FTTB revenue |
101 | 98 | 92 | 94 | 88 | 90 | 83 | 69 | 50 | 369 | 385 | 330 | ||||||||||||||||||||||||||||||||||||
| FTTB customers (mln) |
2.3 | 2.3 | 2.3 | 2.3 | 2.2 | 2.2 | 2.2 | 2.3 | 2.2 | 2.3 | 2.3 | 2.3 | ||||||||||||||||||||||||||||||||||||
| FTTB ARPU (USD) |
14.6 | 14.1 | 13.5 | 13.9 | 13.1 | 13.5 | 12.5 | 10.3 | 7.4 | n.a. | n.a. | n.a. | ||||||||||||||||||||||||||||||||||||
| (in RUB millions, unless stated otherwise, unaudited) | ||||||||||||||||||||||||||||||||||||||||||||||||
| CONSOLIDATED |
1Q13 | 2Q13 | 3Q13 | 4Q13 | 1Q14 | 2Q14 | 3Q14 | 4Q14 | 1Q15 | FY12 | FY13 | FY14 | ||||||||||||||||||||||||||||||||||||
| Total operating revenue |
70,080 | 73,816 | 75,354 | 70,660 | 66,148 | 68,722 | 73,082 | 73,947 | 66,276 | 285,375 | 289,910 | 281,899 | ||||||||||||||||||||||||||||||||||||
| EBITDA |
29,292 | 31,519 | 32,131 | 28,479 | 26,548 | 28,468 | 29,878 | 27,042 | 26,130 | 120,478 | 121,421 | 111,936 | ||||||||||||||||||||||||||||||||||||
| EBITDA margin (%) |
41.8 | % | 42.7 | % | 42.6 | % | 40.3 | % | 40.1 | % | 41.4 | % | 40.9 | % | 36.6 | % | 39.4 | % | 42.2 | % | 41.9 | % | 39.7 | % | ||||||||||||||||||||||||
| Capital expenditures (CAPEX) |
6,711 | 11,264 | 12,946 | 27,871 | 11,486 | 13,706 | 15,147 | 20,970 | 5,425 | 50,699 | 58,792 | 61,309 | ||||||||||||||||||||||||||||||||||||
| CAPEX excluding licenses |
6,711 | 11,264 | 12,946 | 27,871 | 11,145 | 13,218 | 14,631 | 20,494 | 5,165 | 50,699 | 58,792 | 59,488 | ||||||||||||||||||||||||||||||||||||
| Operating cash flow (EBITDA-CAPEX excluding licenses) |
22,581 | 20,255 | 19,185 | 608 | 15,403 | 15,250 | 15,247 | 6,548 | 20,964 | 69,779 | 62,629 | 52,448 | ||||||||||||||||||||||||||||||||||||
| OCF margin (%) |
32 | % | 27 | % | 25 | % | 1 | % | 23 | % | 22 | % | 21 | % | 9 | % | 32 | % | 24 | % | 22 | % | 18 | % | ||||||||||||||||||||||||
| MOBILE |
1Q13 | 2Q13 | 3Q13 | 4Q13 | 1Q14 | 2Q14 | 3Q14 | 4Q14 | 1Q15 | FY12 | FY13 | FY14 | ||||||||||||||||||||||||||||||||||||
| Total operating revenue |
58,117 | 61,254 | 62,395 | 58,087 | 53,805 | 56,133 | 59,691 | 59,637 | 54,024 | 236,922 | 239,852 | 229,266 | ||||||||||||||||||||||||||||||||||||
| Service revenue |
54,003 | 57,959 | 60,804 | 56,253 | 52,385 | 54,883 | 57,810 | 56,360 | 52,148 | 225,988 | 229,020 | 221,438 | ||||||||||||||||||||||||||||||||||||
| Data Revenue |
7,194 | 7,649 | 8,054 | 8,792 | 8,755 | 8,957 | 9,829 | 10,523 | 10,362 | 24,330 | 31,689 | 38,064 | ||||||||||||||||||||||||||||||||||||
| Customers (mln) |
55.7 | 57.1 | 58.1 | 56.5 | 55.0 | 56.3 | 57.3 | 57.2 | 55.7 | 56.1 | 56.5 | 57.2 | ||||||||||||||||||||||||||||||||||||
| Mobile data customers (mln) |
n.a. | n.a. | n.a. | n.a. | n.a. | n.a. | n.a. | n.a. | 32.0 | n.a. | n.a. | n.a. | ||||||||||||||||||||||||||||||||||||
| ARPU (RUB) |
321 | 341 | 349 | 327 | 310 | 326 | 336 | 325 | 305 | n.a. | n.a. | n.a. | ||||||||||||||||||||||||||||||||||||
| MOU (min) |
277 | 294 | 290 | 293 | 287 | 310 | 311 | 316 | 303 | n.a. | n.a. | n.a. | ||||||||||||||||||||||||||||||||||||
| Churn 3 months active base (quarterly) (%) |
15 | % | 14 | % | 15 | % | 18 | % | 17 | % | 13 | % | 15 | % | 16 | % | 16 | % | n.a. | n.a. | n.a. | |||||||||||||||||||||||||||
| MBOU |
n.a. | n.a. | n.a. | n.a. | n.a. | n.a. | n.a. | n.a. | 1,434 | n.a. | n.a. | n.a. | ||||||||||||||||||||||||||||||||||||
| FIXED-LINE |
1Q13 | 2Q13 | 3Q13 | 4Q13 | 1Q14 | 2Q14 | 3Q14 | 4Q14 | 1Q15 | FY12 | FY13 | FY14 | ||||||||||||||||||||||||||||||||||||
| Total operating revenue |
11,963 | 12,561 | 12,960 | 12,574 | 12,343 | 12,589 | 13,391 | 14,309 | 12,252 | 48,453 | 50,058 | 52,632 | ||||||||||||||||||||||||||||||||||||
| Service revenue |
11,774 | 12,396 | 12,841 | 12,402 | 12,175 | 12,444 | 13,228 | 14,217 | 12,200 | 47,814 | 49,413 | 52,064 | ||||||||||||||||||||||||||||||||||||
| Broadband revenue |
3,187 | 3,173 | 3,119 | 3,152 | 3,187 | 3,251 | 3,103 | 3,230 | 3,168 | 11,719 | 12,632 | 12,771 | ||||||||||||||||||||||||||||||||||||
| Broadband customers (mln) |
2.4 | 2.3 | 2.3 | 2.3 | 2.3 | 2.2 | 2.2 | 2.3 | 2.3 | 2.4 | 2.3 | 2.3 | ||||||||||||||||||||||||||||||||||||
| Broadband ARPU (RUB) |
440 | 443 | 443 | 451 | 457 | 474 | 454 | 477 | 459 | n.a. | n.a. | n.a. | ||||||||||||||||||||||||||||||||||||
| FTTB revenue |
3,086 | 3,084 | 3,024 | 3,056 | 3,078 | 3,156 | 3,004 | 3,196 | 3,095 | 11,446 | 12,250 | 12,434 | ||||||||||||||||||||||||||||||||||||
| FTTB customers (mln) |
2.3 | 2.3 | 2.3 | 2.3 | 2.2 | 2.2 | 2.2 | 2.3 | 2.2 | 2.3 | 2.3 | 2.3 | ||||||||||||||||||||||||||||||||||||
| FTTB ARPU (RUB) |
443 | 446 | 443 | 450 | 457 | 473 | 454 | 477 | 459 | n.a. | n.a. | n.a. | ||||||||||||||||||||||||||||||||||||
Table of Contents
Italy
index page
(in EUR millions, unless stated otherwise, unaudited)
| CONSOLIDATED |
1Q13 | 2Q13 | 3Q13 | 4Q13 | 1Q14 | 2Q14 | 3Q14 | 4Q14 | 1Q15 | FY12 | FY13 | FY14 | ||||||||||||||||||||||||||||||||||||
| Total operating revenue |
1,229 | 1,266 | 1,250 | 1,237 | 1,144 | 1,147 | 1,220 | 1,123 | 1,078 | 5,427 | 4,983 | 4,634 | ||||||||||||||||||||||||||||||||||||
| EBITDA |
461 | 475 | 507 | 500 | 430 | 435 | 521 | 418 | 406 | 2,062 | 1,943 | 1,804 | ||||||||||||||||||||||||||||||||||||
| EBITDA margin (%) |
37.5 | % | 37.5 | % | 40.6 | % | 40.4 | % | 37.6 | % | 38.0 | % | 42.7 | % | 37.2 | % | 37.7 | % | 38.0 | % | 39.0 | % | 38.9 | % | ||||||||||||||||||||||||
| Capital expenditures (CAPEX)* |
298 | 183 | 153 | 291 | 137 | 173 | 187 | 261 | 172 | 1,000 | 924 | 758 | ||||||||||||||||||||||||||||||||||||
| CAPEX excluding licenses** |
298 | 183 | 153 | 291 | 137 | 173 | 187 | 261 | 172 | 905 | 924 | 758 | ||||||||||||||||||||||||||||||||||||
| Operating cash flow (EBITDA-CAPEX excluding licenses)*** |
299 | 292 | 354 | 209 | 293 | 262 | 334 | 157 | 234 | 1,157 | 1,154 | 1,046 | ||||||||||||||||||||||||||||||||||||
| OCF margin (%) |
24 | % | 23 | % | 28 | % | 17 | % | 26 | % | 23 | % | 27 | % | 14 | % | 22 | % | 21 | % | 23 | % | 23 | % | ||||||||||||||||||||||||
| MOBILE |
1Q13 | 2Q13 | 3Q13 | 4Q13 | 1Q14 | 2Q14 | 3Q14 | 4Q14 | 1Q15 | FY12 | FY13 | FY14 | ||||||||||||||||||||||||||||||||||||
| Total operating revenue |
888 | 927 | 926 | 907 | 827 | 832 | 848 | 820 | 781 | 3,958 | 3,648 | 3,327 | ||||||||||||||||||||||||||||||||||||
| Service revenue |
815 | 828 | 839 | 800 | 729 | 737 | 763 | 746 | 705 | 3,677 | 3,282 | 2,975 | ||||||||||||||||||||||||||||||||||||
| Data Revenue |
106 | 116 | 134 | 131 | 132 | 137 | 152 | 152 | 154 | 361 | 488 | 573 | ||||||||||||||||||||||||||||||||||||
| Customers (mln) |
22.0 | 22.3 | 22.4 | 22.3 | 22.0 | 21.9 | 21.8 | 21.6 | 21.4 | 21.7 | 22.3 | 21.6 | ||||||||||||||||||||||||||||||||||||
| Data customers (mln)**** |
6.7 | 7.6 | 8.2 | 8.8 | 9.3 | 9.7 | 10.2 | 10.2 | 10.9 | 5.8 | 8.8 | 10.2 | ||||||||||||||||||||||||||||||||||||
| ARPU (€) |
12.4 | 12.4 | 12.5 | 11.9 | 10.9 | 11.1 | 11.6 | 11.4 | 10.9 | n.a. | n.a. | n.a. | ||||||||||||||||||||||||||||||||||||
| of which : |
||||||||||||||||||||||||||||||||||||||||||||||||
| ARPU voice (€) |
8.3 | 8.2 | 7.8 | 7.5 | 6.7 | 6.8 | 7.0 | 6.9 | 6.3 | n.a. | n.a. | n.a. | ||||||||||||||||||||||||||||||||||||
| ARPU data (€) |
4.1 | 4.2 | 4.7 | 4.4 | 4.2 | 4.3 | 4.6 | 4.5 | 4.5 | n.a. | n.a. | n.a. | ||||||||||||||||||||||||||||||||||||
| MOU (min.) |
216 | 233 | 240 | 256 | 254 | 265 | 262 | 274 | 267 | n.a. | n.a. | n.a. | ||||||||||||||||||||||||||||||||||||
| Total traffic (mln. min.) |
14,166 | 15,512 | 16,093 | 17,142 | 16,895 | 17,486 | 17,150 | 17,819 | 17,188 | n.a. | n.a. | n.a. | ||||||||||||||||||||||||||||||||||||
| Churn, annualised rate (%) |
35.5 | % | 37.5 | % | 39.7 | % | 33.5 | % | 32.2 | % | 29.9 | % | 32.0 | % | 31.6 | % | 35.1 | % | n.a. | n.a. | n.a. | |||||||||||||||||||||||||||
| MBOU |
n.a. | n.a. | n.a. | n.a. | n.a. | n.a. | n.a. | n.a. | 1,392 | n.a. | n.a. | n.a. | ||||||||||||||||||||||||||||||||||||
| FIXED-LINE |
1Q13 | 2Q13 | 3Q13 | 4Q13 | 1Q14 | 2Q14 | 3Q14 | 4Q14 | 1Q15 | FY12 | FY13 | FY14 | ||||||||||||||||||||||||||||||||||||
| Total operating revenue |
341 | 339 | 325 | 330 | 316 | 314 | 372 | 302 | 297 | 1,470 | 1,335 | 1,304 | ||||||||||||||||||||||||||||||||||||
| Service revenue |
332 | 330 | 312 | 320 | 306 | 303 | 291 | 292 | 278 | 1,376 | 1,295 | 1,192 | ||||||||||||||||||||||||||||||||||||
| Total voice customers (mln) |
3.1 | 3.0 | 3.0 | 3.0 | 3.0 | 2.9 | 2.9 | 2.8 | 2.8 | 3.1 | 3.0 | 2.8 | ||||||||||||||||||||||||||||||||||||
| of which : |
||||||||||||||||||||||||||||||||||||||||||||||||
| Total DIRECT voice customers (mln) |
2.5 | 2.5 | 2.4 | 2.4 | 2.4 | 2.4 | 2.4 | 2.4 | 2.4 | 2.5 | 2.4 | 2.4 | ||||||||||||||||||||||||||||||||||||
| Total INDIRECT voice customers (mln) |
0.6 | 0.6 | 0.6 | 0.5 | 0.5 | 0.5 | 0.5 | 0.4 | 0.4 | 0.6 | 0.5 | 0.4 | ||||||||||||||||||||||||||||||||||||
| Total fixed-line ARPU (€) |
31.3 | 31.2 | 30.0 | 30.3 | 29.8 | 29.9 | 29.0 | 28.7 | 27.9 | n.a. | n.a. | n.a. | ||||||||||||||||||||||||||||||||||||
| Total Traffic (mln. min.) |
4,449 | 4,036 | 3,209 | 3,888 | 3,627 | 3,410 | 2,616 | 3,292 | 3,137 | n.a. | n.a. | n.a. | ||||||||||||||||||||||||||||||||||||
| Total Internet customers (mln) |
2.3 | 2.2 | 2.2 | 2.2 | 2.2 | 2.2 | 2.2 | 2.2 | 2.2 | 2.3 | 2.2 | 2.2 | ||||||||||||||||||||||||||||||||||||
| of which : |
||||||||||||||||||||||||||||||||||||||||||||||||
| Broadband (mln) |
2.2 | 2.2 | 2.2 | 2.2 | 2.2 | 2.2 | 2.1 | 2.2 | 2.2 | 2.2 | 2.2 | 2.2 | ||||||||||||||||||||||||||||||||||||
| Broadband ARPU (€) |
20.2 | 20.2 | 20.4 | 20.5 | 20.8 | 21.3 | 21.4 | 21.6 | 21.1 | n.a. | n.a. | n.a. | ||||||||||||||||||||||||||||||||||||
| Dual-play customers (mln) |
1.9 | 1.9 | 1.9 | 1.9 | 1.9 | 1.9 | 1.9 | 1.9 | 2.0 | 1.8 | 1.9 | 1.9 | ||||||||||||||||||||||||||||||||||||
| * | Excluding impact of FOC CAPEX and including LTE |
| ** | Excluding impact of FOC and excluding LTE |
| *** | 1Q13 and FY13 CAPEX excludes EUR 136 million of non-cash increase in Intangible Assets related to the contract with Terna in relation to the Right of Way of WIND’s backbone |
| **** | Mobile data include customers that have performed at least one mobile Internet event in the previous month |
Table of Contents
Italy (continued)
(in USD millions, unless stated otherwise, unaudited)
| CONSOLIDATED |
1Q13 | 2Q13 | 3Q13 | 4Q13 | 1Q14 | 2Q14 | 3Q14 | 4Q14 | 1Q15 | FY12 | FY13 | FY14 | ||||||||||||||||||||||||||||||||||||
| Total operating revenue |
n.a. | n.a. | n.a. | n.a. | n.a. | n.a. | n.a. | n.a. | 1,213 | n.a. | n.a. | n.a. | ||||||||||||||||||||||||||||||||||||
| EBITDA |
n.a. | n.a. | n.a. | n.a. | n.a. | n.a. | n.a. | n.a. | 459 | n.a. | n.a. | n.a. | ||||||||||||||||||||||||||||||||||||
| EBITDA margin (%) |
n.a. | n.a. | n.a. | n.a. | n.a. | n.a. | n.a. | n.a. | 37.7 | % | n.a. | n.a. | n.a. | |||||||||||||||||||||||||||||||||||
| Capital expenditures (CAPEX)* |
n.a. | n.a. | n.a. | n.a. | n.a. | n.a. | n.a. | n.a. | 194 | n.a. | n.a. | n.a. | ||||||||||||||||||||||||||||||||||||
| CAPEX excluding licenses** |
n.a. | n.a. | n.a. | n.a. | n.a. | n.a. | n.a. | n.a. | 194 | n.a. | n.a. | n.a. | ||||||||||||||||||||||||||||||||||||
| Operating cash flow (EBITDA-CAPEX excluding licenses)*** |
n.a. | n.a. | n.a. | n.a. | n.a. | n.a. | n.a. | n.a. | 265 | n.a. | n.a. | n.a. | ||||||||||||||||||||||||||||||||||||
| OCF margin (%) |
n.a. | n.a. | n.a. | n.a. | n.a. | n.a. | n.a. | n.a. | 22 | % | n.a. | n.a. | n.a. | |||||||||||||||||||||||||||||||||||
| MOBILE |
1Q13 | 2Q13 | 3Q13 | 4Q13 | 1Q14 | 2Q14 | 3Q14 | 4Q14 | 1Q15 | FY12 | FY13 | FY14 | ||||||||||||||||||||||||||||||||||||
| Total operating revenue |
n.a. | n.a. | n.a. | n.a. | n.a. | n.a. | n.a. | n.a. | 794 | n.a. | n.a. | n.a. | ||||||||||||||||||||||||||||||||||||
| Service revenue |
n.a. | n.a. | n.a. | n.a. | n.a. | n.a. | n.a. | n.a. | 794 | n.a. | n.a. | n.a. | ||||||||||||||||||||||||||||||||||||
| Data Revenue |
n.a. | n.a. | n.a. | n.a. | n.a. | n.a. | n.a. | n.a. | 167 | n.a. | n.a. | n.a. | ||||||||||||||||||||||||||||||||||||
| Customers (mln) |
n.a. | n.a. | n.a. | n.a. | n.a. | n.a. | n.a. | n.a. | 19.2 | n.a. | n.a. | n.a. | ||||||||||||||||||||||||||||||||||||
| Data customers (mln)**** |
n.a. | n.a. | n.a. | n.a. | n.a. | n.a. | n.a. | n.a. | 10.9 | n.a. | n.a. | n.a. | ||||||||||||||||||||||||||||||||||||
| ARPU (USD) |
n.a. | n.a. | n.a. | n.a. | n.a. | n.a. | n.a. | n.a. | 11.8 | n.a. | n.a. | n.a. | ||||||||||||||||||||||||||||||||||||
| of which : |
n.a. | n.a. | n.a. | n.a. | n.a. | n.a. | n.a. | n.a. | n.a. | n.a. | n.a. | |||||||||||||||||||||||||||||||||||||
| ARPU voice (USD) |
n.a. | n.a. | n.a. | n.a. | n.a. | n.a. | n.a. | n.a. | 6.9 | n.a. | n.a. | n.a. | ||||||||||||||||||||||||||||||||||||
| ARPU data (USD) |
n.a. | n.a. | n.a. | n.a. | n.a. | n.a. | n.a. | n.a. | 4.9 | n.a. | n.a. | n.a. | ||||||||||||||||||||||||||||||||||||
| MOU (min.) |
n.a. | n.a. | n.a. | n.a. | n.a. | n.a. | n.a. | n.a. | 267 | n.a. | n.a. | n.a. | ||||||||||||||||||||||||||||||||||||
| Total traffic (mln. min.) |
n.a. | n.a. | n.a. | n.a. | n.a. | n.a. | n.a. | n.a. | 17,188 | n.a. | n.a. | n.a. | ||||||||||||||||||||||||||||||||||||
| Churn, annualised rate (%) |
n.a. | n.a. | n.a. | n.a. | n.a. | n.a. | n.a. | n.a. | 35.1 | % | n.a. | n.a. | n.a. | |||||||||||||||||||||||||||||||||||
| MBOU |
n.a. | n.a. | n.a. | n.a. | n.a. | n.a. | n.a. | n.a. | 1,392 | n.a. | n.a. | n.a. | ||||||||||||||||||||||||||||||||||||
| FIXED-LINE |
1Q13 | 2Q13 | 3Q13 | 4Q13 | 1Q14 | 2Q14 | 3Q14 | 4Q14 | 1Q15 | FY12 | FY13 | FY14 | ||||||||||||||||||||||||||||||||||||
| Total operating revenue |
n.a. | n.a. | n.a. | n.a. | n.a. | n.a. | n.a. | n.a. | 334 | n.a. | n.a. | n.a. | ||||||||||||||||||||||||||||||||||||
| Service revenue |
n.a. | n.a. | n.a. | n.a. | n.a. | n.a. | n.a. | n.a. | 313 | n.a. | n.a. | n.a. | ||||||||||||||||||||||||||||||||||||
| Total voice customers (mln) |
n.a. | n.a. | n.a. | n.a. | n.a. | n.a. | n.a. | n.a. | 2.8 | n.a. | n.a. | n.a. | ||||||||||||||||||||||||||||||||||||
| of which : |
||||||||||||||||||||||||||||||||||||||||||||||||
| Total DIRECT voice customers (mln) |
n.a. | n.a. | n.a. | n.a. | n.a. | n.a. | n.a. | n.a. | 2.4 | n.a. | n.a. | n.a. | ||||||||||||||||||||||||||||||||||||
| Total INDIRECT voice customers (mln) |
n.a. | n.a. | n.a. | n.a. | n.a. | n.a. | n.a. | n.a. | 0.4 | n.a. | n.a. | n.a. | ||||||||||||||||||||||||||||||||||||
| Total fixed-line ARPU (USD) |
n.a. | n.a. | n.a. | n.a. | n.a. | n.a. | n.a. | n.a. | 30.2 | n.a. | n.a. | n.a. | ||||||||||||||||||||||||||||||||||||
| Total Traffic (mln. min.) |
n.a. | n.a. | n.a. | n.a. | n.a. | n.a. | n.a. | n.a. | 3,137 | n.a. | n.a. | n.a. | ||||||||||||||||||||||||||||||||||||
| Total Internet customers (mln) |
n.a. | n.a. | n.a. | n.a. | n.a. | n.a. | n.a. | n.a. | 2.2 | n.a. | n.a. | n.a. | ||||||||||||||||||||||||||||||||||||
| of which : |
||||||||||||||||||||||||||||||||||||||||||||||||
| Broadband (mln) |
n.a. | n.a. | n.a. | n.a. | n.a. | n.a. | n.a. | n.a. | 2.2 | n.a. | n.a. | n.a. | ||||||||||||||||||||||||||||||||||||
| Broadband ARPU (USD) |
n.a. | n.a. | n.a. | n.a. | n.a. | n.a. | n.a. | n.a. | 22.8 | n.a. | n.a. | n.a. | ||||||||||||||||||||||||||||||||||||
| Dual-play customers (mln) |
n.a. | n.a. | n.a. | n.a. | n.a. | n.a. | n.a. | n.a. | 2.0 | n.a. | n.a. | n.a. | ||||||||||||||||||||||||||||||||||||
Table of Contents
Algeria
index page
(in USD millions, unless stated otherwise, unaudited)
| MOBILE |
1Q13 | 2Q13 | 3Q13 | 4Q13* | 1Q14 | 2Q14 | 3Q14 | 4Q14*** | 1Q15 | FY12 | FY13* | FY14*** | ||||||||||||||||||||||||||||||||||||
| Total operating revenue |
434 | 464 | 450 | 448 | 429 | 437 | 429 | 396 | 323 | 1,841 | 1,796 | 1,690 | ||||||||||||||||||||||||||||||||||||
| Service revenue |
432 | 463 | 449 | 447 | 428 | 434 | 422 | 393 | 320 | 1,841 | 1,791 | 1,678 | ||||||||||||||||||||||||||||||||||||
| EBITDA |
256 | 279 | 258 | 261 | 247 | 238 | 225 | 198 | 169 | 1,094 | 1,054 | 907 | ||||||||||||||||||||||||||||||||||||
| EBITDA margin (%) |
59.1 | % | 60.1 | % | 57.2 | % | 60.1 | % | 57.6 | % | 54.5 | % | 52.5 | % | 49.8 | % | 52.3 | % | 59.5 | % | 59.1 | % | 53.5 | % | ||||||||||||||||||||||||
| Capital expenditures (CAPEX) |
9 | 17 | 7 | 89 | 60 | 162 | 84 | 109 | 45 | 47 | 122 | 415 | ||||||||||||||||||||||||||||||||||||
| CAPEX excluding licenses |
9 | 17 | 7 | 51 | 60 | 162 | 84 | 109 | 45 | 47 | 84 | 415 | ||||||||||||||||||||||||||||||||||||
| Data Revenue |
1.8 | 2.0 | 2.5 | 2.1 | 2.6 | 2.4 | 9.1 | 7.8 | 8.0 | 5.8 | 8.4 | 22 | ||||||||||||||||||||||||||||||||||||
| Customers (mln)** |
16.6 | 16.8 | 17.0 | 17.6 | 17.6 | 17.5 | 18.2 | 18.4 | 18.7 | 16.7 | 17.6 | 18.4 | ||||||||||||||||||||||||||||||||||||
| ARPU (USD) |
8.6 | 9.2 | 8.4 | 8.6 | 8.1 | 8.2 | 7.7 | 7.2 | 5.7 | n.a. | n.a. | n.a. | ||||||||||||||||||||||||||||||||||||
| MOU (min) |
263 | 278 | 216 | 211 | 201 | 202 | 200 | 182 | 175 | n.a. | n.a. | n.a. | ||||||||||||||||||||||||||||||||||||
| Churn 3 months active base (quarterly) (%) |
7.6 | % | 6.9 | % | 13.7 | % | 6.1 | % | 6.0 | % | 6.1 | % | 6.0 | % | 5.7 | % | 6.2 | % | n.a. | n.a. | n.a. | |||||||||||||||||||||||||||
| MBOU |
n.a. | n.a. | n.a. | n.a. | n.a. | n.a. | n.a. | n.a. | 320 | n.a. | n.a. | n.a. | ||||||||||||||||||||||||||||||||||||
| Operating cash flow (EBITDA-CAPEX excluding licenses) |
248 | 262 | 251 | 210 | 187 | 76 | 141 | 116 | 124 | 1,047 | 971 | 520 | ||||||||||||||||||||||||||||||||||||
| OCF margin (%) |
57 | % | 56 | % | 56 | % | 47 | % | 44 | % | 17 | % | 33 | % | 29 | % | 38 | % | 57 | % | 54 | % | 31 | % | ||||||||||||||||||||||||
| (in DZD billions, unless stated otherwise, unaudited) | ||||||||||||||||||||||||||||||||||||||||||||||||
| MOBILE |
1Q13 | 2Q13 | 3Q13 | 4Q13* | 1Q14 | 2Q14 | 3Q14 | 4Q14 | 1Q15 | FY12 | FY13 | FY14 | ||||||||||||||||||||||||||||||||||||
| Total operating revenue |
34.1 | 36.7 | 36.0 | 35.9 | 33.5 | 34.5 | 34.4 | 33.7 | 30.0 | 143.1 | 142.7 | 136 | ||||||||||||||||||||||||||||||||||||
| Service revenue |
34.0 | 36.6 | 36.2 | 36.0 | 33.4 | 34.3 | 33.9 | 33.5 | 29.8 | 143.2 | 142.8 | 135 | ||||||||||||||||||||||||||||||||||||
| EBITDA |
20.2 | 22.0 | 21.0 | 22.0 | 19.2 | 18.8 | 18.1 | 16.8 | 15.7 | 84.0 | 84.0 | 73 | ||||||||||||||||||||||||||||||||||||
| EBITDA margin (%) |
59.2 | % | 60.1 | % | 57.2 | % | 60.1 | % | 57.4 | % | 54.5 | % | 52.5 | % | 49.8 | % | 52.3 | % | 59.5 | % | 59.1 | % | 53.5 | % | ||||||||||||||||||||||||
| Capital expenditures (CAPEX) |
n.a. | n.a. | n.a. | n.a. | n.a. | n.a. | n.a. | n.a. | 4.2 | n.a. | n.a. | n.a. | ||||||||||||||||||||||||||||||||||||
| CAPEX excluding licenses |
n.a. | n.a. | n.a. | n.a. | n.a. | n.a. | n.a. | n.a. | 4.2 | n.a. | n.a. | n.a. | ||||||||||||||||||||||||||||||||||||
| Data Revenue |
0.1 | 0.2 | 0.2 | 0.2 | 0.2 | 0.2 | 0.5 | 0.7 | 0.7 | 0.5 | 0.7 | 1.6 | ||||||||||||||||||||||||||||||||||||
| Customers (mln)** |
16.6 | 16.8 | 17.0 | 17.6 | 17.6 | 17.5 | 18.2 | 18.4 | 18.7 | 16.7 | 17.6 | 18.4 | ||||||||||||||||||||||||||||||||||||
| ARPU (DZD) |
677 | 727 | 680 | 689 | 629 | 648 | 629 | 610 | 528 | n.a. | n.a. | n.a. | ||||||||||||||||||||||||||||||||||||
| MOU (min) |
263 | 278 | 216 | 211 | 201 | 202 | 200 | 182 | 175 | n.a. | n.a. | n.a. | ||||||||||||||||||||||||||||||||||||
| Churn 3 months active base (quarterly) (%) |
7.6 | % | 6.9 | % | 13.7 | % | 6.1 | % | 6.0 | % | 6.1 | % | 6.0 | % | 5.7 | % | 6.2 | % | n.a. | n.a. | n.a. | |||||||||||||||||||||||||||
| MBOU |
n.a. | n.a. | n.a. | n.a. | n.a. | n.a. | n.a. | n.a. | 320 | n.a. | n.a. | n.a. | ||||||||||||||||||||||||||||||||||||
| * | 4Q13 EBITDA excludes USD 1.3 bln (DZD 99 bln) one-off provisions related to the 51% sale in Algeria |
| ** | Subscriber base has been adjusted by 1.4 million customers in 1Q13 because of a technical issue. |
This event does not impact historical reported revenue or EBITDA, but positively affects MOU and ARPU.
| *** | 4Q14 EBITDA excludes USD 50 mln (DZD 4 bln) one-off provisions related to the 51% sale in Algeria |
Table of Contents
Pakistan
index page
(in USD millions, unless stated otherwise, unaudited)
| MOBILE |
1Q13 | 2Q13 | 3Q13 | 4Q13 | 1Q14 | 2Q14 | 3Q14 | 4Q14 | 1Q15 | FY12 | FY13 | FY14 | ||||||||||||||||||||||||||||||||||||
| Total operating revenue |
278 | 289 | 259 | 240 | 251 | 268 | 241 | 251 | 249 | 1,132 | 1,066 | 1,010 | ||||||||||||||||||||||||||||||||||||
| Service revenue |
268 | 280 | 250 | 231 | 241 | 256 | 230 | 239 | 236 | 1,123 | 1,029 | 966 | ||||||||||||||||||||||||||||||||||||
| EBITDA |
117 | 125 | 111 | 89 | 99 | 104 | 84 | 99 | 96 | 488 | 442 | 386 | ||||||||||||||||||||||||||||||||||||
| EBITDA margin (%) |
42.3 | % | 43.0 | % | 43.0 | % | 37.2 | % | 39.5 | % | 38.9 | % | 34.9 | % | 39.5 | % | 38.5 | % | 43.1 | % | 41.5 | % | 38.2 | % | ||||||||||||||||||||||||
| Capital expenditures (CAPEX) |
9 | 39 | 52 | 90 | 55 | 410 | 97 | 89 | 26 | 173 | 190 | 651 | ||||||||||||||||||||||||||||||||||||
| CAPEX excluding licenses |
9 | 39 | 52 | 90 | 55 | 110 | 97 | 89 | 26 | 173 | 190 | 351 | ||||||||||||||||||||||||||||||||||||
| Data Revenue |
6.8 | 7.8 | 8.7 | 8.6 | 9.8 | 12.2 | 12.5 | 14.2 | 18.7 | 24.5 | 31.9 | 49 | ||||||||||||||||||||||||||||||||||||
| Customers (mln) |
36.3 | 37.1 | 37.4 | 37.6 | 38.2 | 38.8 | 38.7 | 38.5 | 38.2 | 36.1 | 37.6 | 38.5 | ||||||||||||||||||||||||||||||||||||
| ARPU (USD) |
2.5 | 2.5 | 2.2 | 2.0 | 2.0 | 2.2 | 1.9 | 2.0 | 2.0 | n.a. | n.a. | n.a. | ||||||||||||||||||||||||||||||||||||
| MOU (min) |
228 | 233 | 222 | 222 | 213 | 230 | 236 | 273 | 301 | n.a. | n.a. | n.a. | ||||||||||||||||||||||||||||||||||||
| Churn 3 months active base (quarterly) (%) |
3.9 | % | 5.3 | % | 6.5 | % | 7.3 | % | 5.7 | % | 6.4 | % | 6.8 | % | 7.0 | % | 3.8 | % | n.a. | n.a. | n.a. | |||||||||||||||||||||||||||
| MBOU |
n.a. | n.a. | n.a. | n.a. | n.a. | n.a. | n.a. | n.a. | 297 | n.a. | n.a. | n.a. | ||||||||||||||||||||||||||||||||||||
| Operating cash flow (EBITDA-CAPEX excluding licenses) |
108 | 86 | 59 | (1 | ) | 44 | (6 | ) | (13 | ) | 10 | 70 | 315 | 252 | 35 | |||||||||||||||||||||||||||||||||
| OCF margin (%) |
39 | % | 30 | % | 23 | % | 0 | % | 18 | % | (2 | %) | (5 | %) | 4 | % | 28 | % | 28 | % | 24 | % | 3 | % | ||||||||||||||||||||||||
| (in PKR billions, unless stated otherwise, unaudited) | ||||||||||||||||||||||||||||||||||||||||||||||||
| MOBILE |
1Q13 | 2Q13 | 3Q13 | 4Q13 | 1Q14 | 2Q14 | 3Q14 | 4Q14 | 1Q15 | FY12 | FY13 | FY14 | ||||||||||||||||||||||||||||||||||||
| Total operating revenue |
27.0 | 28.5 | 26.7 | 25.7 | 26.0 | 26.3 | 24.2 | 25.5 | 25.3 | 106.3 | 108.0 | 102.1 | ||||||||||||||||||||||||||||||||||||
| Service revenue |
26.3 | 27.6 | 25.7 | 24.5 | 24.9 | 25.2 | 23.1 | 24.3 | 24.0 | 104.8 | 104.1 | 97.5 | ||||||||||||||||||||||||||||||||||||
| EBITDA |
11.5 | 12.3 | 11.5 | 9.6 | 10.0 | 10.2 | 8.5 | 10.1 | 9.7 | 45.6 | 44.5 | 38.8 | ||||||||||||||||||||||||||||||||||||
| EBITDA margin (%) |
42.3 | % | 43.0 | % | 43.1 | % | 37.2 | % | 39.5 | % | 38.9 | % | 34.9 | % | 39.5 | % | 38.5 | % | 43.1 | % | 41.5 | % | 38.2 | % | ||||||||||||||||||||||||
| Capital expenditures (CAPEX) |
n.a. | n.a. | n.a. | n.a. | n.a. | n.a. | n.a. | n.a. | 2.6 | n.a. | n.a. | n.a. | ||||||||||||||||||||||||||||||||||||
| CAPEX excluding licenses |
n.a. | n.a. | n.a. | n.a. | n.a. | n.a. | n.a. | n.a. | 2.6 | n.a. | n.a. | n.a. | ||||||||||||||||||||||||||||||||||||
| Data Revenue |
0.7 | 0.8 | 0.9 | 0.9 | 1.0 | 1.2 | 1.3 | 1.4 | 1.9 | 2.3 | 3.3 | 4.9 | ||||||||||||||||||||||||||||||||||||
| Customers (mln) |
36.3 | 37.1 | 37.4 | 37.6 | 38.2 | 38.8 | 38.7 | 38.5 | 38.2 | 36.1 | 37.6 | 38.5 | ||||||||||||||||||||||||||||||||||||
| ARPU (PKR) |
244 | 249 | 229 | 219 | 216 | 214 | 195 | 204 | 203 | n.a. | n.a. | n.a. | ||||||||||||||||||||||||||||||||||||
| MOU (min) |
228 | 233 | 222 | 222 | 213 | 230 | 236 | 273 | 301 | n.a. | n.a. | n.a. | ||||||||||||||||||||||||||||||||||||
| Churn 3 months active base (quarterly) (%) |
3.9 | % | 5.3 | % | 6.5 | % | 7.3 | % | 5.7 | % | 6.4 | % | 6.8 | % | 7.0 | % | 3.8 | % | n.a. | n.a. | n.a. | |||||||||||||||||||||||||||
| MBOU |
n.a. | n.a. | n.a. | n.a. | n.a. | n.a. | n.a. | n.a. | 297 | n.a. | n.a. | n.a. | ||||||||||||||||||||||||||||||||||||
Table of Contents
Bangladesh
index page
(in USD millions, unless stated otherwise, unaudited)
| MOBILE |
1Q13 | 2Q13 | 3Q13 | 4Q13 | 1Q14 | 2Q14 | 3Q14 | 4Q14 | 1Q15 | FY12 | FY13 | FY14 | ||||||||||||||||||||||||||||||||||||
| Total operating revenue |
118 | 129 | 129 | 128 | 134 | 141 | 142 | 146 | 147 | 554 | 504 | 563 | ||||||||||||||||||||||||||||||||||||
| Service revenue |
118 | 129 | 129 | 122 | 132 | 139 | 140 | 144 | 145 | 554 | 498 | 556 | ||||||||||||||||||||||||||||||||||||
| EBITDA |
49 | 48 | 47 | 43 | 49 | 54 | 56 | 60 | 60 | 192 | 187 | 219 | ||||||||||||||||||||||||||||||||||||
| EBITDA margin (%) |
41.4 | % | 37.2 | % | 36.3 | % | 33.7 | % | 37.4 | % | 38.2 | % | 39.7 | % | 40.8 | % | 40.6 | % | 34.7 | % | 37.1 | % | 38.9 | % | ||||||||||||||||||||||||
| Capital expenditures (CAPEX) |
12 | 13 | 127 | 131 | 27 | 43 | 50 | 59 | 12 | 126 | 282 | 178 | ||||||||||||||||||||||||||||||||||||
| CAPEX excluding licenses |
12 | 13 | 17 | 131 | 27 | 43 | 50 | 59 | 12 | 126 | 172 | 178 | ||||||||||||||||||||||||||||||||||||
| Data Revenue |
2.5 | 2.8 | 3.8 | 4.0 | 4.4 | 5.0 | 6.3 | 7.5 | 8.6 | 6.8 | 13.1 | 23.2 | ||||||||||||||||||||||||||||||||||||
| Customers (mln) |
25.9 | 27.1 | 28.1 | 28.8 | 29.4 | 29.8 | 30.2 | 30.8 | 31.8 | 25.9 | 28.8 | 30.8 | ||||||||||||||||||||||||||||||||||||
| ARPU (USD) |
1.5 | 1.6 | 1.5 | 1.4 | 1.5 | 1.6 | 1.5 | 1.6 | 1.5 | n.a. | n.a. | n.a. | ||||||||||||||||||||||||||||||||||||
| MOU (min) |
175 | 198 | 189 | 183 | 188 | 201 | 200 | 186 | 199 | n.a. | n.a. | n.a. | ||||||||||||||||||||||||||||||||||||
| Churn 3 months active base (quarterly) (%) |
6.6 | % | 3.9 | % | 5.1 | % | 6.9 | % | 6.3 | % | 5.2 | % | 5.3 | % | 5.1 | % | 4.5 | % | n.a. | n.a. | n.a. | |||||||||||||||||||||||||||
| MBOU |
n.a. | n.a. | n.a. | n.a. | n.a. | n.a. | n.a. | n.a. | 66 | n.a. | n.a. | n.a. | ||||||||||||||||||||||||||||||||||||
| Operating cash flow (EBITDA-CAPEX excluding licenses) |
37 | 36 | 30 | (88 | ) | 23 | 11 | 7 | 1 | 48 | 65 | 15 | 41 | |||||||||||||||||||||||||||||||||||
| OCF margin (%) |
31 | % | 28 | % | 23 | % | (69 | %) | 17 | % | 8 | % | 5 | % | 0 | % | 32 | % | 12 | % | 3 | % | 7 | % | ||||||||||||||||||||||||
| (in BDT billions, unless stated otherwise, unaudited) | ||||||||||||||||||||||||||||||||||||||||||||||||
| MOBILE |
1Q13 | 2Q13 | 3Q13 | 4Q13 | 1Q14 | 2Q14 | 3Q14 | 4Q14 | 1Q15 | FY12 | FY13 | FY14 | ||||||||||||||||||||||||||||||||||||
| Total operating revenue |
9.3 | 10.1 | 10.0 | 10.0 | 10.2 | 10.9 | 11.0 | 11.3 | 11.4 | 45.6 | 39.4 | 43.5 | ||||||||||||||||||||||||||||||||||||
| Service revenue |
9.3 | 10.0 | 10.0 | 9.5 | 10.2 | 10.8 | 10.9 | 11.2 | 11.3 | 45.6 | 38.8 | 43.0 | ||||||||||||||||||||||||||||||||||||
| EBITDA |
3.8 | 3.7 | 3.6 | 3.4 | 4.0 | 4.2 | 4.4 | 4.6 | 4.6 | 16.0 | 14.6 | 17.2 | ||||||||||||||||||||||||||||||||||||
| EBITDA margin (%) |
41.3 | % | 37.2 | % | 36.3 | % | 33.7 | % | 37.4 | % | 38.2 | % | 39.7 | % | 40.8 | % | 40.6 | % | 34.7 | % | 37.1 | % | 38.9 | % | ||||||||||||||||||||||||
| Capital expenditures (CAPEX) |
n.a. | n.a. | n.a. | n.a. | n.a. | n.a. | n.a. | n.a. | 0.9 | n.a. | n.a. | n.a. | ||||||||||||||||||||||||||||||||||||
| CAPEX excluding licenses |
n.a. | n.a. | n.a. | n.a. | n.a. | n.a. | n.a. | n.a. | 0.9 | n.a. | n.a. | n.a. | ||||||||||||||||||||||||||||||||||||
| Data Revenue |
0.20 | 0.22 | 0.29 | 0.31 | 0.30 | 0.39 | 0.49 | 0.58 | 0.67 | 0.55 | 1.02 | 2 | ||||||||||||||||||||||||||||||||||||
| Customers (mln) |
25.9 | 27.1 | 28.1 | 28.8 | 29.4 | 29.8 | 30.2 | 30.8 | 31.8 | 25.9 | 28.8 | 30.8 | ||||||||||||||||||||||||||||||||||||
| ARPU (BDT) |
119 | 126 | 121 | 110 | 117 | 121 | 120 | 122 | 119 | n.a. | n.a. | n.a. | ||||||||||||||||||||||||||||||||||||
| MOU (min) |
175 | 198 | 189 | 183 | 188 | 201 | 200 | 186 | 199 | n.a. | n.a. | n.a. | ||||||||||||||||||||||||||||||||||||
| Churn 3 months active base (quarterly) (%) |
6.6 | % | 3.9 | % | 5.1 | % | 6.9 | % | 6.3 | % | 5.2 | % | 5.3 | % | 5.1 | % | 4.5 | % | n.a. | n.a. | n.a. | |||||||||||||||||||||||||||
| MBOU |
n.a. | n.a. | n.a. | n.a. | n.a. | n.a. | n.a. | n.a. | 66 | n.a. | n.a. | n.a. | ||||||||||||||||||||||||||||||||||||
Table of Contents
Ukraine
index page
(in USD millions, unless stated otherwise, unaudited)
| CONSOLIDATED |
1Q13 | 2Q13 | 3Q13 | 4Q13 | 1Q14 | 2Q14 | 3Q14 | 4Q14 | 1Q15 | FY12 | FY13 | FY14 | ||||||||||||||||||||||||||||||||||||
| Total operating revenue |
396 | 401 | 420 | 394 | 335 | 259 | 252 | 216 | 151 | 1,676 | 1,611 | 1,062 | ||||||||||||||||||||||||||||||||||||
| EBITDA |
194 | 192 | 208 | 186 | 162 | 115 | 114 | 92 | 63 | 859 | 781 | 483 | ||||||||||||||||||||||||||||||||||||
| EBITDA margin (%) |
49.0 | % | 48.0 | % | 49.6 | % | 47.2 | % | 48.6 | % | 44.5 | % | 45.4 | % | 42.7 | % | 41.3 | % | 51.3 | % | 48.5 | % | 45.2 | % | ||||||||||||||||||||||||
| Capital expenditures (CAPEX) |
42 | 48 | 66 | 56 | 35 | 30 | 35 | 37 | 45 | 231 | 212 | 137 | ||||||||||||||||||||||||||||||||||||
| CAPEX excluding licenses |
42 | 48 | 66 | 56 | 35 | 30 | 35 | 37 | 32 | 231 | 212 | 137 | ||||||||||||||||||||||||||||||||||||
| Operating cash flow (EBITDA-CAPEX excluding licenses) |
152 | 144 | 143 | 130 | 127 | 85 | 79 | 55 | 31 | 628 | 569 | 346 | ||||||||||||||||||||||||||||||||||||
| OCF margin (%) |
38 | % | 36 | % | 34 | % | 33 | % | 38 | % | 33 | % | 31 | % | 24 | % | 20 | % | 37 | % | 35 | % | 32 | % | ||||||||||||||||||||||||
| MOBILE |
1Q13 | 2Q13 | 3Q13 | 4Q13 | 1Q14 | 2Q14 | 3Q14 | 4Q14 | 1Q15 | FY12 | FY13 | FY14 | ||||||||||||||||||||||||||||||||||||
| Total operating revenue |
362 | 367 | 384 | 359 | 305 | 236 | 232 | 200 | 140 | 1,551 | 1,473 | 973 | ||||||||||||||||||||||||||||||||||||
| Service revenue |
355 | 360 | 376 | 357 | 305 | 235 | 231 | 199 | 139 | 1,522 | 1,448 | 970 | ||||||||||||||||||||||||||||||||||||
| Data Revenue |
26.4 | 27.0 | 29.3 | 29.9 | 27.6 | 20.5 | 19.5 | 17.8 | 14.0 | 102.0 | 112.6 | 85 | ||||||||||||||||||||||||||||||||||||
| Customers (mln)* |
26.3 | 25.6 | 25.9 | 25.8 | 25.6 | 25.4 | 26.3 | 26.2 | 26.1 | 25.1 | 25.8 | 26.2 | ||||||||||||||||||||||||||||||||||||
| Mobile data customers (mln) |
n.a. | n.a. | n.a. | n.a. | n.a. | n.a. | n.a. | n.a. | 11.3 | n.a. | n.a. | n.a. | ||||||||||||||||||||||||||||||||||||
| ARPU (USD) |
4.6 | 4.6 | 4.8 | 4.6 | 3.9 | 3.1 | 3.0 | 2.5 | 1.8 | n.a. | n.a. | n.a. | ||||||||||||||||||||||||||||||||||||
| MOU (min) |
484 | 486 | 497 | 504 | 498 | 506 | 517 | 524 | 536 | n.a. | n.a. | n.a. | ||||||||||||||||||||||||||||||||||||
| Churn 3 months active base (quarterly) (%) |
6.9 | % | 11.4 | % | 8.0 | % | 8.4 | % | 7.3 | % | 6.4 | % | 4.8 | % | 6.7 | % | 5.4 | % | n.a. | n.a. | n.a. | |||||||||||||||||||||||||||
| MBOU |
n.a. | n.a. | n.a. | n.a. | n.a. | n.a. | n.a. | n.a. | 82 | n.a. | n.a. | n.a. | ||||||||||||||||||||||||||||||||||||
| FIXED-LINE |
1Q13 | 2Q13 | 3Q13 | 4Q13 | 1Q14 | 2Q14 | 3Q14 | 4Q14 | 1Q15 | FY12 | FY13 | FY14 | ||||||||||||||||||||||||||||||||||||
| Total operating revenue |
33 | 33 | 36 | 35 | 30 | 24 | 20 | 16 | 11 | 125 | 137 | 90 | ||||||||||||||||||||||||||||||||||||
| Service revenue |
33 | 33 | 36 | 35 | 29 | 24 | 20 | 16 | 11 | 124 | 137 | 89 | ||||||||||||||||||||||||||||||||||||
| Broadband revenue |
12 | 13 | 13 | 13 | 13 | 10 | 9 | 8 | 6 | 34 | 51 | 40 | ||||||||||||||||||||||||||||||||||||
| Broadband customers (mln) |
0.7 | 0.7 | 0.7 | 0.8 | 0.8 | 0.8 | 0.8 | 0.8 | 0.8 | 0.6 | 0.8 | 0.8 | ||||||||||||||||||||||||||||||||||||
| Broadband ARPU (USD) |
6.3 | 6.2 | 6.1 | 6.0 | 5.6 | 4.0 | 3.6 | 3.2 | 2.3 | n.a. | n.a. | n.a. | ||||||||||||||||||||||||||||||||||||
| (in UAH millions, unless stated otherwise, unaudited) | ||||||||||||||||||||||||||||||||||||||||||||||||
| CONSOLIDATED |
1Q13 | 2Q13 | 3Q13 | 4Q13 | 1Q14 | 2Q14 | 3Q14 | 4Q14 | 1Q15 | FY12 | FY13 | FY14 | ||||||||||||||||||||||||||||||||||||
| Total operating revenue |
3,162 | 3,201 | 3,359 | 3,149 | 2,942 | 3,034 | 3,160 | 3,095 | 3,092 | 13,392 | 12,871 | 12,231 | ||||||||||||||||||||||||||||||||||||
| EBITDA |
1,550 | 1,536 | 1,666 | 1,487 | 1,430 | 1,349 | 1,436 | 1,311 | 1,278 | 6,867 | 6,239 | 5,526 | ||||||||||||||||||||||||||||||||||||
| EBITDA margin (%) |
49.0 | % | 48.0 | % | 49.6 | % | 47.2 | % | 48.6 | % | 44.5 | % | 45.5 | % | 42.3 | % | 41.3 | % | 51.3 | % | 48.5 | % | 45.2 | % | ||||||||||||||||||||||||
| Capital expenditures (CAPEX) |
336 | 383 | 525 | 447 | 305 | 354 | 445 | 554 | 1,033 | 1,848 | 1,690 | 1,658 | ||||||||||||||||||||||||||||||||||||
| CAPEX excluding licenses |
336 | 383 | 525 | 447 | 305 | 354 | 445 | 554 | 742 | 1,848 | 1,690 | 1,658 | ||||||||||||||||||||||||||||||||||||
| Operating cash flow (EBITDA-CAPEX excluding licenses) |
1,215 | 1,153 | 1,141 | 1,040 | 1,125 | 995 | 991 | 757 | 535 | 5,019 | 4,549 | 3,868 | ||||||||||||||||||||||||||||||||||||
| OCF margin (%) |
38 | % | 36 | % | 34 | % | 33 | % | 38 | % | 33 | % | 31 | % | 24 | % | 17 | % | 37 | % | 35 | % | 32 | % | ||||||||||||||||||||||||
| MOBILE |
1Q13 | 2Q13 | 3Q13 | 4Q13 | 1Q14 | 2Q14 | 3Q14 | 4Q14 | 1Q15 | FY12 | FY13 | FY14 | ||||||||||||||||||||||||||||||||||||
| Total operating revenue |
2,897 | 2,936 | 3,069 | 2,866 | 2,682 | 2,754 | 2,906 | 2,870 | 2,859 | 12,397 | 11,768 | 11,212 | ||||||||||||||||||||||||||||||||||||
| Service revenue |
2,836 | 2,879 | 3,008 | 2,856 | 2,677 | 2,750 | 2,899 | 2,863 | 2,851 | 12,152 | 11,579 | 11,189 | ||||||||||||||||||||||||||||||||||||
| Data Revenue |
210.7 | 216.0 | 234.0 | 239.0 | 242.3 | 240.4 | 244.6 | 256.4 | 281.4 | 816 | 900 | 984 | ||||||||||||||||||||||||||||||||||||
| Customers (mln)* |
26.3 | 25.6 | 25.9 | 25.8 | 25.6 | 25.4 | 26.3 | 26.2 | 26.1 | 25.1 | 25.8 | 26.2 | ||||||||||||||||||||||||||||||||||||
| Mobile data customers (mln) |
n.a. | n.a. | n.a. | n.a. | n.a. | n.a. | n.a. | n.a. | 11.3 | n.a. | n.a. | n.a. | ||||||||||||||||||||||||||||||||||||
| ARPU (UAH) |
36.5 | 36.5 | 38.2 | 36.5 | 34.6 | 35.7 | 37.0 | 36.1 | 36.0 | n.a. | n.a. | n.a. | ||||||||||||||||||||||||||||||||||||
| MOU (min) |
484 | 486 | 497 | 504 | 498 | 506 | 517 | 524 | 536 | n.a. | n.a. | n.a. | ||||||||||||||||||||||||||||||||||||
| Churn 3 months active base (quarterly) (%) |
6.9 | % | 11.4 | % | 8.0 | % | 8.4 | % | 7.3 | % | 6.4 | % | 4.8 | % | 6.7 | % | 5.4 | % | n.a. | n.a. | n.a. | |||||||||||||||||||||||||||
| MBOU |
n.a. | n.a. | n.a. | n.a. | n.a. | n.a. | n.a. | n.a. | 82 | n.a. | n.a. | n.a. | ||||||||||||||||||||||||||||||||||||
| FIXED-LINE |
1Q13 | 2Q13 | 3Q13 | 4Q13 | 1Q14 | 2Q14 | 3Q14 | 4Q14 | 1Q15 | FY12 | FY13 | FY14 | ||||||||||||||||||||||||||||||||||||
| Total operating revenue |
265 | 265 | 290 | 283 | 260 | 280 | 255 | 225 | 233 | 996 | 1,103 | 1,020 | ||||||||||||||||||||||||||||||||||||
| Service revenue |
265 | 265 | 290 | 282 | 259 | 279 | 254 | 225 | 233 | 995 | 1,102 | 1,017 | ||||||||||||||||||||||||||||||||||||
| Broadband revenue |
96 | 101 | 104 | 107 | 114 | 111 | 107 | 111 | 117 | 275 | 408 | 443 | ||||||||||||||||||||||||||||||||||||
| Broadband customers (mln) |
0.7 | 0.7 | 0.7 | 0.8 | 0.8 | 0.8 | 0.8 | 0.8 | 0.8 | 0.6 | 0.8 | 0.8 | ||||||||||||||||||||||||||||||||||||
| Broadband ARPU (UAH) |
50.0 | 49.7 | 48.8 | 48.1 | 49.1 | 47.1 | 44.6 | 45.5 | 47.7 | n.a. | n.a. | n.a. | ||||||||||||||||||||||||||||||||||||
| * | The 2012 customer base has been adjusted for the alignment of the active customer base definition |
Table of Contents
Kazakhstan
index page
(in USD millions, unless stated otherwise, unaudited)
| CONSOLIDATED |
1Q13 | 2Q13 | 3Q13 | 4Q13 | 1Q14 | 2Q14 | 3Q14 | 4Q14 | 1Q15 | FY12 | FY13 | FY14 | ||||||||||||||||||||||||||||||||||||
| Total operating revenue |
190 | 207 | 223 | 219 | 180 | 186 | 197 | 193 | 164 | 829 | 840 | 756 | ||||||||||||||||||||||||||||||||||||
| EBITDA |
89 | 99 | 98 | 105 | 86 | 90 | 95 | 78 | 81 | 394 | 391 | 349 | ||||||||||||||||||||||||||||||||||||
| EBITDA margin (%) |
46.7 | % | 47.9 | % | 43.9 | % | 47.7 | % | 47.8 | % | 48.7 | % | 48.2 | % | 40.2 | % | 49.5 | % | 47.6 | % | 46.5 | % | 46.2 | % | ||||||||||||||||||||||||
| Capital expenditures (CAPEX) |
25 | 37 | 39 | 58 | 9 | 17 | 26 | 57 | 7 | 166 | 159 | 109 | ||||||||||||||||||||||||||||||||||||
| CAPEX excluding licenses |
25 | 37 | 39 | 58 | 9 | 17 | 26 | 57 | 7 | 166 | 159 | 109 | ||||||||||||||||||||||||||||||||||||
| Operating cash flow (EBITDA-CAPEX excluding licenses) |
64 | 62 | 59 | 47 | 77 | 73 | 69 | 21 | 74 | 228 | 232 | 240 | ||||||||||||||||||||||||||||||||||||
| OCF margin (%) |
34 | % | 30 | % | 26 | % | 21 | % | 42 | % | 39 | % | 35 | % | 11 | % | 45 | % | 27 | % | 28 | % | 32 | % | ||||||||||||||||||||||||
| MOBILE |
1Q13 | 2Q13 | 3Q13 | 4Q13 | 1Q14 | 2Q14 | 3Q14 | 4Q14 | 1Q15 | FY12 | FY13 | FY14 | ||||||||||||||||||||||||||||||||||||
| Total operating revenue |
174 | 188 | 202 | 198 | 160 | 165 | 177 | 172 | 144 | 775 | 761 | 674 | ||||||||||||||||||||||||||||||||||||
| Service revenue |
173 | 188 | 202 | 198 | 159 | 165 | 177 | 172 | 144 | 775 | 761 | 673 | ||||||||||||||||||||||||||||||||||||
| Data Revenue |
21.5 | 21.3 | 22.6 | 25.7 | 23.4 | 21.5 | 26.8 | 30.9 | 30.0 | 66.8 | 91.1 | 103 | ||||||||||||||||||||||||||||||||||||
| Customers (mln) |
8.5 | 8.8 | 9.0 | 9.2 | 9.2 | 9.6 | 9.8 | 9.8 | 9.6 | 8.6 | 9.2 | 9.8 | ||||||||||||||||||||||||||||||||||||
| Mobile data customers (mln) |
4.8 | 4.9 | 5.1 | 5.2 | 5.2 | 5.3 | 5.4 | 5.4 | 5.2 | 4.7 | 5.2 | 5.4 | ||||||||||||||||||||||||||||||||||||
| ARPU (USD) |
7 | 7 | 7 | 7 | 6 | 6 | 6 | 6 | 5 | n.a. | n.a. | n.a. | ||||||||||||||||||||||||||||||||||||
| MOU (min) |
254 | 300 | 311 | 301 | 293 | 326 | 317 | 298 | 273 | n.a. | n.a. | n.a. | ||||||||||||||||||||||||||||||||||||
| Churn 3 months active base (quarterly) (%) |
13 | % | 11 | % | 12 | % | 13 | % | 13 | % | 11 | % | 13 | % | 14 | % | 13 | % | n.a. | n.a. | n.a. | |||||||||||||||||||||||||||
| MBOU |
n.a. | n.a. | n.a. | n.a. | n.a. | n.a. | n.a. | n.a. | 414 | n.a. | n.a. | n.a. | ||||||||||||||||||||||||||||||||||||
| FIXED-LINE |
1Q13 | 2Q13 | 3Q13 | 4Q13 | 1Q14 | 2Q14 | 3Q14 | 4Q14 | 1Q15 | FY12 | FY13 | FY14 | ||||||||||||||||||||||||||||||||||||
| Total operating revenue |
17 | 19 | 21 | 21 | 20 | 21 | 20 | 21 | 20 | 55 | 78 | 82 | ||||||||||||||||||||||||||||||||||||
| Service revenue |
16 | 19 | 21 | 21 | 20 | 21 | 20 | 21 | 20 | 54 | 77 | 82 | ||||||||||||||||||||||||||||||||||||
| Broadband revenue |
9 | 9 | 8 | 9 | 9 | 8 | 8 | 9 | 12 | 20 | 34 | 34 | ||||||||||||||||||||||||||||||||||||
| Broadband customers (mln) |
0.2 | 0.2 | 0.2 | 0.2 | 0.2 | 0.2 | 0.2 | 0.2 | 0.2 | 0.2 | 0.2 | 0.2 | ||||||||||||||||||||||||||||||||||||
| Broadband ARPU (USD) |
18 | 17 | 17 | 18 | 16 | 14 | 14 | 15 | 20 | n.a. | n.a. | n.a. | ||||||||||||||||||||||||||||||||||||
| (in KZT millions, unless stated otherwise, unaudited) | ||||||||||||||||||||||||||||||||||||||||||||||||
| CONSOLIDATED |
1Q13 | 2Q13 | 3Q13 | 4Q13 | 1Q14 | 2Q14 | 3Q14 | 4Q14 | 1Q15 | FY12 | FY13 | FY14 | ||||||||||||||||||||||||||||||||||||
| Total operating revenue |
28,650 | 31,300 | 34,068 | 33,730 | 30,453 | 33,920 | 35,928 | 34,965 | 30,284 | 123,665 | 127,748 | 135,266 | ||||||||||||||||||||||||||||||||||||
| EBITDA |
13,373 | 14,991 | 14,966 | 16,105 | 14,558 | 16,532 | 17,322 | 14,061 | 14,981 | 58,814 | 59,435 | 62,473 | ||||||||||||||||||||||||||||||||||||
| EBITDA margin (%) |
46.7 | % | 47.9 | % | 43.9 | % | 47.7 | % | 47.8 | % | 48.7 | % | 48.2 | % | 40.2 | % | 49.5 | % | 47.6 | % | 46.5 | % | 46.2 | % | ||||||||||||||||||||||||
| Capital expenditures (CAPEX) |
3,698 | 5,626 | 6,017 | 8,900 | 1,637 | 3,170 | 4,805 | 10,057 | 1,239 | 24,806 | 24,241 | 19,669 | ||||||||||||||||||||||||||||||||||||
| CAPEX excluding licenses |
3,698 | 5,626 | 6,017 | 8,900 | 1,637 | 3,170 | 4,805 | 10,057 | 1,239 | 24,806 | 24,241 | 19,669 | ||||||||||||||||||||||||||||||||||||
| Operating cash flow (EBITDA-CAPEX excluding licenses) |
9,676 | 9,364 | 8,949 | 7,205 | 12,921 | 13,362 | 12,517 | 4,004 | 13,742 | 34,006 | 35,194 | 42,804 | ||||||||||||||||||||||||||||||||||||
| OCF margin (%) |
34 | % | 30 | % | 26 | % | 21 | % | 42 | % | 39 | % | 35 | % | 11 | % | 45 | % | 27 | % | 28 | % | 32 | % | ||||||||||||||||||||||||
| MOBILE |
1Q13 | 2Q13 | 3Q13 | 4Q13 | 1Q14 | 2Q14 | 3Q14 | 4Q14 | 1Q15 | FY12 | FY13 | FY14 | ||||||||||||||||||||||||||||||||||||
| Total operating revenue |
26,149 | 28,383 | 30,911 | 30,513 | 27,009 | 30,167 | 32,284 | 31,183 | 26,564 | 115,543 | 115,956 | 120,643 | ||||||||||||||||||||||||||||||||||||
| Service revenue |
26,129 | 28,343 | 30,882 | 30,482 | 26,976 | 30,131 | 32,257 | 31,148 | 26,537 | 115,438 | 115,835 | 120,512 | ||||||||||||||||||||||||||||||||||||
| Data Revenue |
3,232 | 3,219 | 3,463 | 3,956 | 3,947 | 3,927 | 4,883 | 5,603 | 5,456 | 9,975 | 13,870 | 18,359 | ||||||||||||||||||||||||||||||||||||
| Customers (mln) |
8.5 | 8.8 | 9.0 | 9.2 | 9.2 | 9.6 | 9.8 | 9.8 | 9.6 | 8.6 | 9.2 | 9.2 | ||||||||||||||||||||||||||||||||||||
| Mobile data customers (mln) |
4.8 | 4.9 | 5.1 | 5.2 | 5.2 | 5.3 | 5.4 | 5.4 | 5.2 | 4.7 | 5.2 | 5.4 | ||||||||||||||||||||||||||||||||||||
| ARPU (KZT) |
1,012 | 1,101 | 1,141 | 1,110 | 975 | 1,058 | 1,098 | 1,041 | 898 | n.a. | n.a. | n.a. | ||||||||||||||||||||||||||||||||||||
| MOU (min) |
254 | 300 | 311 | 301 | 293 | 326 | 317 | 298 | 273 | n.a. | n.a. | n.a. | ||||||||||||||||||||||||||||||||||||
| Churn 3 months active base (quarterly) (%) |
13 | % | 11 | % | 12 | % | 13 | % | 13 | % | 11 | % | 13 | % | 14 | % | 14 | % | n.a. | n.a. | n.a. | |||||||||||||||||||||||||||
| MBOU |
n.a. | n.a. | n.a. | n.a. | n.a. | n.a. | n.a. | n.a. | 414 | n.a. | n.a. | n.a. | ||||||||||||||||||||||||||||||||||||
| FIXED-LINE |
1Q13 | 2Q13 | 3Q13 | 4Q13 | 1Q14 | 2Q14 | 3Q14 | 4Q14 | 1Q15 | FY12 | FY13 | FY14 | ||||||||||||||||||||||||||||||||||||
| Total operating revenue |
2,500 | 2,917 | 3,208 | 3,217 | 3,444 | 3,753 | 3,644 | 3,782 | 3,720 | 8,129 | 11,842 | 14,623 | ||||||||||||||||||||||||||||||||||||
| Service revenue |
2,480 | 2,940 | 3,147 | 3,214 | 3,412 | 3,748 | 3,608 | 3,769 | 3,707 | 8,050 | 11,781 | 14,537 | ||||||||||||||||||||||||||||||||||||
| Broadband revenue |
1,280 | 1,315 | 1,289 | 1,439 | 1,514 | 1,502 | 1,445 | 1,643 | 2,189 | 2,941 | 5,323 | 6,104 | ||||||||||||||||||||||||||||||||||||
| Broadband customers (mln) |
0.2 | 0.2 | 0.2 | 0.2 | 0.2 | 0.2 | 0.2 | 0.2 | 0.2 | 0.2 | 0.2 | 0.2 | ||||||||||||||||||||||||||||||||||||
| Broadband ARPU (KZT) |
2,651 | 2,600 | 2,597 | 2,707 | 2,685 | 2,632 | 2,581 | 2,740 | 3,726 | n.a. | n.a. | n.a. | ||||||||||||||||||||||||||||||||||||
Table of Contents
Uzbekistan
index page
(in USD millions, unless stated otherwise, unaudited)
| CONSOLIDATED |
1Q13 | 2Q13 | 3Q13 | 4Q13* | 1Q14 | 2Q14 | 3Q14 | 4Q14 | 1Q15 | FY12 | FY13* | FY14 | ||||||||||||||||||||||||||||||||||||
| Total operating revenue |
157 | 167 | 176 | 173 | 163 | 179 | 190 | 186 | 167 | 463 | 672 | 718 | ||||||||||||||||||||||||||||||||||||
| EBITDA |
102 | 108 | 116 | 21 | 105 | 115 | 127 | 115 | 105 | 253 | 347 | 462 | ||||||||||||||||||||||||||||||||||||
| EBITDA margin (%) |
65.2 | % | 64.7 | % | 66.0 | % | 11.9 | % | 64.4 | % | 64.2 | % | 66.5 | % | 61.6 | % | 62.7 | % | 54.6 | % | 51.5 | % | 64.2 | % | ||||||||||||||||||||||||
| Capital expenditures (CAPEX) |
59 | 35 | 65 | -17 | 21 | 10 | 20 | 28 | 0 | 137 | 142 | 79 | ||||||||||||||||||||||||||||||||||||
| CAPEX excluding licenses |
59 | 35 | 65 | -17 | 21 | 10 | 20 | 28 | 0 | 137 | 142 | 79 | ||||||||||||||||||||||||||||||||||||
| Operating cash flow (EBITDA-CAPEX excluding licenses) |
44 | 73 | 51 | 38 | 84 | 104 | 106 | 87 | 105 | 116 | 205 | 381 | ||||||||||||||||||||||||||||||||||||
| OCF margin (%) |
28 | % | 44 | % | 29 | % | 22 | % | 52 | % | 58 | % | 56 | % | 47 | % | 63 | % | 25 | % | 31 | % | 53 | % | ||||||||||||||||||||||||
| MOBILE |
1Q13 | 2Q13 | 3Q13 | 4Q13 | 1Q14 | 2Q14 | 3Q14 | 4Q14 | 1Q15 | FY12 | FY13 | FY14 | ||||||||||||||||||||||||||||||||||||
| Total operating revenue |
155 | 165 | 174 | 171 | 161 | 177 | 189 | 184 | 166 | 455 | 665 | 711 | ||||||||||||||||||||||||||||||||||||
| Service revenue |
154 | 164 | 174 | 171 | 161 | 176 | 189 | 184 | 165 | 451 | 663 | 710 | ||||||||||||||||||||||||||||||||||||
| Data Revenue |
20.2 | 21.5 | 25.7 | 27.3 | 30.4 | 31.3 | 34.9 | 35.7 | 34.3 | 47.1 | 94.8 | 132.3 | ||||||||||||||||||||||||||||||||||||
| Customers (mln) |
10.3 | 10.2 | 10.3 | 10.5 | 10.4 | 10.4 | 10.5 | 10.6 | 10.4 | 10.2 | 10.5 | 10.6 | ||||||||||||||||||||||||||||||||||||
| Mobile data customers (mln) |
5.0 | 5.0 | 5.3 | 5.4 | 5.4 | 5.3 | 5.4 | 5.5 | 5.2 | 4.8 | 5.4 | 5.5 | ||||||||||||||||||||||||||||||||||||
| ARPU (USD) |
5.0 | 5.3 | 5.6 | 5.0 | 5.1 | 5.6 | 6.0 | 5.8 | 5.2 | n.a. | n.a. | n.a. | ||||||||||||||||||||||||||||||||||||
| MOU (min) |
425 | 472 | 504 | 493 | 465 | 531 | 568 | 528 | 491 | n.a. | n.a. | n.a. | ||||||||||||||||||||||||||||||||||||
| Churn 3 months active base (quarterly) (%) |
13 | % | 15 | % | 14 | % | 13 | % | 12 | % | 12 | % | 12 | % | 12 | % | 12 | % | n.a. | n.a. | n.a. | |||||||||||||||||||||||||||
| FIXED-LINE |
1Q13 | 2Q13 | 3Q13 | 4Q13 | 1Q14 | 2Q14 | 3Q14 | 4Q14 | 1Q15 | FY12 | FY13 | FY14 | ||||||||||||||||||||||||||||||||||||
| Total operating revenue |
1.9 | 1.9 | 2.0 | 2.0 | 2.0 | 2.0 | 2.0 | 2.0 | 1.0 | 8.3 | 7.8 | 8.0 | ||||||||||||||||||||||||||||||||||||
| Service revenue |
1.9 | 1.9 | 1.9 | 1.8 | 1.8 | 2.0 | 2.0 | 2.0 | 1.0 | 8.3 | 7.5 | 7.8 | ||||||||||||||||||||||||||||||||||||
| Broadband revenue |
0.7 | 0.7 | 0.7 | 0.7 | 0.7 | 0.7 | 0.7 | 0.6 | 0.6 | 3.0 | 2.8 | 2.7 | ||||||||||||||||||||||||||||||||||||
| Broadband customers (mln) |
0.0 | 0.0 | 0.0 | 0.0 | 0.0 | 0.0 | 0.0 | 0.0 | 0.0 | 0.0 | 0.0 | 0.0 | ||||||||||||||||||||||||||||||||||||
| Broadband ARPU (USD) |
13.3 | 12.8 | 12.3 | 13.0 | 21.0 | 19.0 | 14.0 | 16.9 | 16.7 | n.a. | n.a. | n.a. | ||||||||||||||||||||||||||||||||||||
| (in UZS billions, unless stated otherwise, unaudited) | ||||||||||||||||||||||||||||||||||||||||||||||||
| CONSOLIDATED |
1Q13 | 2Q13 | 3Q13 | 4Q13* | 1Q14 | 2Q14 | 3Q14 | 4Q14 | 1Q15 | FY12 | FY13* | FY14 | ||||||||||||||||||||||||||||||||||||
| Total operating revenue |
316 | 345 | 373 | 378 | 363 | 409 | 446 | 445 | 409 | 883 | 1,412 | 1,662 | ||||||||||||||||||||||||||||||||||||
| EBITDA |
206 | 223 | 246 | 43 | 234 | 262 | 296 | 274 | 257 | 483 | 719 | 1,066 | ||||||||||||||||||||||||||||||||||||
| EBITDA margin (%) |
65.2 | % | 64.7 | % | 66.0 | % | 11.9 | % | 64.4 | % | 64.2 | % | 66.5 | % | 61.6 | % | 62.7 | % | 54.6 | % | 51.5 | % | 64.2 | % | ||||||||||||||||||||||||
| Capital expenditures (CAPEX) |
118 | 72 | 138 | -39 | 46 | 23 | 47 | 67 | 0 | 260 | 289 | 184 | ||||||||||||||||||||||||||||||||||||
| CAPEX excluding licenses |
118 | 72 | 138 | -39 | 46 | 23 | 47 | 67 | 0 | 260 | 289 | 184 | ||||||||||||||||||||||||||||||||||||
| Operating cash flow (EBITDA-CAPEX excluding licenses) |
88 | 151 | 108 | 82 | 188 | 239 | 249 | 207 | 257 | 224 | 429 | 882 | ||||||||||||||||||||||||||||||||||||
| OCF margin (%) |
28 | % | 44 | % | 29 | % | 22 | % | 52 | % | 58 | % | 56 | % | 46 | % | 63 | % | 25 | % | 30 | % | 53 | % | ||||||||||||||||||||||||
| MOBILE |
1Q13 | 2Q13 | 3Q13 | 4Q13 | 1Q14 | 2Q14 | 3Q14 | 4Q14 | 1Q15 | FY12 | FY13 | FY14 | ||||||||||||||||||||||||||||||||||||
| Total operating revenue |
312 | 341 | 369 | 374 | 359 | 405 | 442 | 441 | 406 | 867 | 1,396 | 1,646 | ||||||||||||||||||||||||||||||||||||
| Service revenue |
310 | 340 | 368 | 373 | 358 | 404 | 441 | 441 | 405 | 859 | 1,392 | 1,643 | ||||||||||||||||||||||||||||||||||||
| Data Revenue |
40.7 | 44.6 | 54.5 | 59.5 | 67.7 | 71.7 | 81.7 | 85.4 | 84.1 | 89.8 | 199.3 | 306.4 | ||||||||||||||||||||||||||||||||||||
| Customers (mln) |
10.3 | 10.2 | 10.3 | 10.5 | 10.4 | 10.4 | 10.5 | 10.6 | 10.4 | 10.2 | 10.5 | 10.6 | ||||||||||||||||||||||||||||||||||||
| Mobile data customers (mln) |
5.0 | 5.0 | 5.3 | 5.4 | 5.4 | 5.3 | 5.4 | 5.5 | 5.2 | 4.8 | 5.4 | 5.5 | ||||||||||||||||||||||||||||||||||||
| ARPU (UZS) |
9,986 | 10,983 | 11,854 | 11,821 | 11,293 | 12,805 | 13,955 | 13,804 | 12,819 | n.a. | n.a. | n.a. | ||||||||||||||||||||||||||||||||||||
| MOU (min) |
425 | 472 | 504 | 493 | 465 | 531 | 568 | 528 | 491 | n.a. | n.a. | n.a. | ||||||||||||||||||||||||||||||||||||
| Churn 3 months active base (quarterly) (%) |
13 | % | 15 | % | 14 | % | 13 | % | 12 | % | 12 | % | 12 | % | 12 | % | 12 | % | n.a. | n.a. | n.a. | |||||||||||||||||||||||||||
| FIXED-LINE |
1Q13 | 2Q13 | 3Q13 | 4Q13 | 1Q14 | 2Q14 | 3Q14 | 4Q14 | 1Q15 | FY12 | FY13 | FY14 | ||||||||||||||||||||||||||||||||||||
| Total operating revenue |
3.8 | 4.0 | 4.1 | 3.9 | 4.0 | 3.9 | 4.0 | 3.9 | 3.5 | 15.7 | 15.8 | 15.8 | ||||||||||||||||||||||||||||||||||||
| Service revenue |
3.7 | 4.0 | 4.1 | 3.9 | 4.0 | 3.9 | 3.9 | 3.8 | 3.4 | 15.5 | 15.7 | 15.6 | ||||||||||||||||||||||||||||||||||||
| Broadband revenue |
1.5 | 1.5 | 1.5 | 1.5 | 1.5 | 1.5 | 1.6 | 1.5 | 1.4 | 5.6 | 5.9 | 6.1 | ||||||||||||||||||||||||||||||||||||
| Broadband customers (mln) |
0.0 | 0.0 | 0.0 | 0.0 | 0.0 | 0.0 | 0.0 | 0.0 | 0.0 | 0.0 | 0.0 | 0.0 | ||||||||||||||||||||||||||||||||||||
| Broadband ARPU (UZS) |
26,737 | 26,460 | 26,144 | 28,293 | 46,631 | 43,076 | 43,970 | 40,462 | 45,518 | n.a. | n.a. | n.a. | ||||||||||||||||||||||||||||||||||||
| * | EBITDA and CAPEX were restated as fixed assets that should not have been capitalized in 2012 and 2011 were written off and accounted for as operating expenses |
Table of Contents
Armenia
index page
(in USD millions, unless stated otherwise, unaudited)
| CONSOLIDATED |
1Q13 | 2Q13 | 3Q13 | 4Q13 | 1Q14 | 2Q14 | 3Q14 | 4Q14 | 1Q15 | FY12 | FY13 | FY14 | ||||||||||||||||||||||||||||||||||||
| Total operating revenue |
35 | 35 | 37 | 38 | 33 | 34 | 39 | 32 | 26 | 158 | 145 | 138 | ||||||||||||||||||||||||||||||||||||
| EBITDA |
14 | 14 | 16 | 13 | 12 | 13 | 15 | 6 | 9 | 63 | 57 | 46 | ||||||||||||||||||||||||||||||||||||
| EBITDA margin (%) |
39.1 | % | 40.7 | % | 42.4 | % | 35.2 | % | 36.6 | % | 37.1 | % | 37.7 | % | 19.3 | % | 35.2 | % | 39.8 | % | 39.4 | % | 32.5 | % | ||||||||||||||||||||||||
| Capital expenditures (CAPEX) |
1 | 2 | 4 | 4 | 1 | 2 | 5 | 6 | 2 | 15 | 11 | 14 | ||||||||||||||||||||||||||||||||||||
| CAPEX excluding licenses |
1 | 2 | 4 | 4 | 1 | 2 | 5 | 6 | 2 | 15 | 11 | 14 | ||||||||||||||||||||||||||||||||||||
| Operating cash flow (EBITDA-CAPEX excluding licenses) |
12 | 12 | 12 | 9 | 11 | 11 | 10 | — | 7 | 48 | 46 | 32 | ||||||||||||||||||||||||||||||||||||
| OCF margin (%) |
35 | % | 35 | % | 32 | % | 24 | % | 33 | % | 30 | % | 26 | % | 0 | % | 27 | % | 30 | % | 32 | % | 22 | % | ||||||||||||||||||||||||
| MOBILE |
1Q13 | 2Q13 | 3Q13 | 4Q13 | 1Q14 | 2Q14 | 3Q14 | 4Q14 | 1Q15 | FY12 | FY13 | FY14 | ||||||||||||||||||||||||||||||||||||
| Total operating revenue |
15 | 15 | 17 | 17 | 14 | 15 | 18 | 15 | 12 | 71 | 64 | 62 | ||||||||||||||||||||||||||||||||||||
| Service revenue |
14 | 15 | 17 | 16 | 13 | 15 | 17 | 14 | 11 | 64 | 62 | 59 | ||||||||||||||||||||||||||||||||||||
| Data Revenue |
1.29 | 1.24 | 1.29 | 1.36 | 1.39 | 1.38 | 1.50 | 1.47 | 1.33 | 4.3 | 5.1 | 6 | ||||||||||||||||||||||||||||||||||||
| Customers (mln) |
0.8 | 0.7 | 0.7 | 0.7 | 0.7 | 0.7 | 0.8 | 0.8 | 0.8 | 0.8 | 0.7 | 0.8 | ||||||||||||||||||||||||||||||||||||
| Mobile data customers (mln) |
0.3 | 0.3 | 0.3 | 0.3 | 0.3 | 0.3 | 0.4 | 0.4 | 0.4 | 0.4 | 0.3 | 0.4 | ||||||||||||||||||||||||||||||||||||
| ARPU (USD) |
6.0 | 6.7 | 6.9 | 7.7 | 6.3 | 6.7 | 7.4 | 6.0 | 4.7 | n.a. | n.a. | n.a. | ||||||||||||||||||||||||||||||||||||
| MOU (min) |
295 | 353 | 377 | 388 | 365 | 382 | 377 | 371 | 341 | n.a. | n.a. | n.a. | ||||||||||||||||||||||||||||||||||||
| Churn 3 months active base (quarterly) (%) |
20.4 | % | 17.9 | % | 13.5 | % | 12.4 | % | 11.0 | % | 11.2 | % | 10.8 | % | 10.9 | % | 9.6 | % | n.a. | n.a. | n.a. | |||||||||||||||||||||||||||
| FIXED-LINE |
1Q13 | 2Q13 | 3Q13 | Q4 2013 | 1Q14 | 2Q14 | 3Q14 | 4Q14 | 1Q15 | FY12 | FY13 | FY14 | ||||||||||||||||||||||||||||||||||||
| Total operating revenue |
20 | 20 | 20 | 21 | 19 | 19 | 21 | 17 | 15 | 87 | 81 | 76 | ||||||||||||||||||||||||||||||||||||
| Service revenue |
20 | 20 | 19 | 21 | 19 | 19 | 21 | 17 | 15 | 86 | 80 | 76 | ||||||||||||||||||||||||||||||||||||
| Broadband revenue |
5.6 | 5.4 | 5.4 | 5.4 | 5.1 | 4.9 | 4.7 | 4.4 | 3.9 | 22.6 | 21.8 | 19 | ||||||||||||||||||||||||||||||||||||
| Broadband customers (mln) |
0.2 | 0.2 | 0.2 | 0.2 | 0.2 | 0.2 | 0.2 | 0.2 | 0.2 | 0.2 | 0.2 | 0.2 | ||||||||||||||||||||||||||||||||||||
| Broadband ARPU (USD) |
11.9 | 11.3 | 11.2 | 11.0 | 10.6 | 10.3 | 10.3 | 9.7 | 8.7 | n.a. | n.a. | n.a. | ||||||||||||||||||||||||||||||||||||
| (in AMD millions, unless stated otherwise, unaudited) | ||||||||||||||||||||||||||||||||||||||||||||||||
| CONSOLIDATED |
1Q13 | 2Q13 | 3Q13 | 4Q13 | 1Q14 | 2Q14 | 3Q14 | 4Q14 | 1Q15 | FY12 | FY13 | FY14 | ||||||||||||||||||||||||||||||||||||
| Total operating revenue |
14,179 | 14,485 | 15,237 | 15,378 | 13,672 | 14,136 | 15,812 | 13,859 | 12,528 | 63,441 | 59,278 | 57,479 | ||||||||||||||||||||||||||||||||||||
| EBITDA |
5,551 | 5,901 | 6,468 | 5,421 | 4,997 | 5,239 | 5,956 | 2,478 | 4,415 | 25,257 | 23,340 | 18,670 | ||||||||||||||||||||||||||||||||||||
| EBITDA margin (%) |
39.1 | % | 40.7 | % | 42.4 | % | 35.2 | % | 36.6 | % | 37.1 | % | 37.7 | % | 17.9 | % | 35.2 | % | 39.8 | % | 39.4 | % | 32.5 | % | ||||||||||||||||||||||||
| Capital expenditures (CAPEX) |
525 | 776 | 1,576 | 1,759 | 501 | 1,025 | 1,977 | 2,605 | 975 | 6,100 | 4,636 | 6,108 | ||||||||||||||||||||||||||||||||||||
| CAPEX excluding licenses |
525 | 776 | 1,576 | 1,759 | 501 | 1,025 | 1,977 | 2,605 | 975 | 6,100 | 4,636 | 6,108 | ||||||||||||||||||||||||||||||||||||
| Operating cash flow (EBITDA-CAPEX excluding licenses) |
5,025 | 5,125 | 4,892 | 3,662 | 4,496 | 4,214 | 3,979 | (127 | ) | 3,440 | 19,157 | 18,704 | 12,562 | |||||||||||||||||||||||||||||||||||
| OCF margin (%) |
35 | % | 35 | % | 32 | % | 24 | % | 33 | % | 30 | % | 25 | % | -1 | % | 27 | % | 30 | % | 32 | % | 22 | % | ||||||||||||||||||||||||
| MOBILE |
1Q13 | 2Q13 | 3Q13 | 4Q13 | 1Q14 | 2Q14 | 3Q14 | 4Q14 | 1Q15 | FY12 | FY13 | FY14 | ||||||||||||||||||||||||||||||||||||
| Total operating revenue |
5,966 | 6,267 | 7,214 | 6,812 | 5,856 | 6,297 | 7,158 | 6,429 | 5,568 | 28,605 | 26,259 | 25,740 | ||||||||||||||||||||||||||||||||||||
| Service revenue |
5,739 | 6,189 | 7,086 | 6,573 | 5,519 | 6,033 | 6,935 | 6,155 | 5,355 | 25,502 | 25,587 | 24,642 | ||||||||||||||||||||||||||||||||||||
| Data Revenue |
527 | 514 | 528 | 553 | 572 | 570 | 614 | 634 | 633 | 1,715 | 2,122 | 2,389 | ||||||||||||||||||||||||||||||||||||
| Customers (mln) |
0.8 | 0.7 | 0.7 | 0.7 | 0.7 | 0.7 | 0.8 | 0.8 | 0.8 | 0.8 | 0.7 | 0.8 | ||||||||||||||||||||||||||||||||||||
| Mobile data customers (mln) |
0.3 | 0.3 | 0.3 | 0.3 | 0.3 | 0.3 | 0.4 | 0.4 | 0.4 | 0.4 | 0.3 | 0.4 | ||||||||||||||||||||||||||||||||||||
| ARPU (AMD) |
2,446 | 2,781 | 3,292 | 3,093 | 2,589 | 2,752 | 3,020 | 2,588 | 2,229 | n.a. | n.a. | n.a. | ||||||||||||||||||||||||||||||||||||
| MOU (min) |
295 | 353 | 377 | 388 | 365 | 382 | 377 | 371 | 341 | n.a. | n.a. | n.a. | ||||||||||||||||||||||||||||||||||||
| Churn 3 months active base (quarterly) (%) |
20.4 | % | 17.9 | % | 13.5 | % | 12.4 | % | 11.0 | % | 11.2 | % | 10.8 | % | 10.9 | % | 9.6 | % | n.a. | n.a. | n.a. | |||||||||||||||||||||||||||
| FIXED |
1Q13 | 2Q13 | 3Q13 | 4Q13 | 1Q14 | 2Q14 | 3Q14 | 4Q14 | 1Q15 | FY12 | FY13 | FY14 | ||||||||||||||||||||||||||||||||||||
| Total operating revenue |
8,172 | 8,218 | 8,022 | 8,566 | 7,816 | 7,840 | 8,654 | 7,430 | 6,960 | 34,837 | 32,978 | 31,740 | ||||||||||||||||||||||||||||||||||||
| Service revenue |
8,122 | 8,173 | 7,954 | 8,510 | 7,766 | 7,811 | 8,638 | 7,407 | 6,943 | 34,239 | 32,759 | 31,622 | ||||||||||||||||||||||||||||||||||||
| Broadband revenue |
2,288 | 2,241 | 2,224 | 2,189 | 2,095 | 2,011 | 1,934 | 1,899 | 1,876 | 9,082 | 8,942 | 7,938 | ||||||||||||||||||||||||||||||||||||
| Broadband customers (mln) |
0.2 | 0.2 | 0.2 | 0.2 | 0.2 | 0.2 | 0.2 | 0.2 | 0.2 | 0.2 | 0.2 | 0.2 | ||||||||||||||||||||||||||||||||||||
| Broadband ARPU (AMD) |
4,863 | 4,690 | 4,612 | 4,461 | 4,369 | 4,260 | 4,189 | 4,174 | 4,136 | n.a. | n.a. | n.a. | ||||||||||||||||||||||||||||||||||||
Table of Contents
Tajikistan
index page
(in USD millions, unless stated otherwise, unaudited)
| CONSOLIDATED |
1Q13 | 2Q13 | 3Q13 | 4Q13 | 1Q14 | 2Q14 | 3Q14 | 4Q14 | 1Q15 | FY12 | FY13 | FY14 | ||||||||||||||||||||||||||||||||||||
| Total operating revenue |
29 | 38 | 44 | 37 | 31 | 37 | 41 | 33 | 26 | 107 | 148 | 142 | ||||||||||||||||||||||||||||||||||||
| EBITDA |
12 | 20 | 24 | 18 | 14 | 14 | 20 | 13 | 14 | 51 | 74 | 61 | ||||||||||||||||||||||||||||||||||||
| EBITDA margin (%) |
42.5 | % | 52.0 | % | 53.8 | % | 48.2 | % | 46.6 | % | 38.5 | % | 49.9 | % | 38.5 | % | 52.8 | % | 47.9 | % | 49.7 | % | 43.5 | % | ||||||||||||||||||||||||
| Capital expenditures (CAPEX) |
4 | 5 | 3 | 5 | 2 | 4 | 1 | 11 | 0 | 20 | 16 | 18 | ||||||||||||||||||||||||||||||||||||
| CAPEX excluding licenses |
4 | 5 | 3 | 5 | 2 | 4 | 1 | 11 | 0 | 20 | 16 | 18 | ||||||||||||||||||||||||||||||||||||
| Operating cash flow (EBITDA-CAPEX excluding licenses) |
9 | 15 | 21 | 13 | 13 | 11 | 19 | 2 | 13 | 31 | 57 | 44 | ||||||||||||||||||||||||||||||||||||
| OCF margin (%) |
30 | % | 40 | % | 48 | % | 34 | % | 41 | % | 29 | % | 47 | % | 5 | % | 53 | % | 29 | % | 39 | % | 31 | % | ||||||||||||||||||||||||
| MOBILE |
1Q13 | 2Q13 | 3Q13 | 4Q13 | 1Q14 | 2Q14 | 3Q14 | 4Q14 | 1Q15 | FY12 | FY13 | FY14 | ||||||||||||||||||||||||||||||||||||
| Total operating revenue |
28 | 37 | 43 | 36 | 31 | 37 | 41 | 33 | 26 | 103 | 144 | 142 | ||||||||||||||||||||||||||||||||||||
| Service revenue |
29 | 37 | 43 | 36 | 31 | 37 | 41 | 33 | 26 | 102 | 145 | 142 | ||||||||||||||||||||||||||||||||||||
| Data Revenue |
0.78 | 0.69 | 0.86 | 1.01 | 1.15 | 1.04 | 0.92 | 0.90 | 0.82 | 2.54 | 3.34 | 4.01 | ||||||||||||||||||||||||||||||||||||
| Customers (mln) |
1.2 | 1.2 | 1.2 | 1.3 | 1.3 | 1.3 | 1.3 | 1.3 | 1.3 | 1.1 | 1.3 | 1.3 | ||||||||||||||||||||||||||||||||||||
| Mobile data customers (mln) |
0.5 | 0.4 | 0.5 | 0.5 | 0.6 | 0.6 | 0.6 | 0.5 | 0.5 | 0.4 | 0.5 | 0.5 | ||||||||||||||||||||||||||||||||||||
| ARPU (USD) |
8.2 | 10.4 | 11.7 | 9.6 | 7.9 | 9.6 | 10.7 | 8.6 | 6.8 | n.a. | n.a. | n.a. | ||||||||||||||||||||||||||||||||||||
| MOU (min) |
235 | 263 | 277 | 307 | 278 | 283 | 297 | 287 | 263 | n.a. | n.a. | n.a. | ||||||||||||||||||||||||||||||||||||
| Churn 3 months active base (quarterly) (%) |
20.4 | % | 19.8 | % | 20.7 | % | 17.4 | % | 18.0 | % | 20.5 | % | 20.5 | % | 18.2 | % | 19.6 | % | n.a. | n.a. | n.a. | |||||||||||||||||||||||||||
| FIXED-LINE |
1Q13 | 2Q13 | 3Q13 | 4Q13 | 1Q14 | 2Q14 | 3Q14 | 4Q14 | 1Q15 | FY12 | FY13 | FY14 | ||||||||||||||||||||||||||||||||||||
| Total operating revenue |
0.7 | 0.9 | 1.0 | 0.1 | 0.0 | 0.2 | 0.1 | 0.0 | 0.0 | 4.3 | 2.7 | 0.3 | ||||||||||||||||||||||||||||||||||||
|
|
|
|
|
|
|
|
|
|
|
|
|
|
|
|
|
|
|
|
|
|
|
|
|
|||||||||||||||||||||||||
Table of Contents
Georgia
index page
(in USD millions, unless stated otherwise, unaudited)
| CONSOLIDATED |
1Q13 | 2Q13 | 3Q13 | 4Q13 | 1Q14 | 2Q14 | 3Q14 | 4Q14 | 1Q15 | FY12 | FY13 | FY14 | ||||||||||||||||||||||||||||||||||||
| Total operating revenue |
20 | 22 | 24 | 22 | 19 | 18 | 21 | 21 | 15 | 78 | 88 | 79 | ||||||||||||||||||||||||||||||||||||
| EBITDA |
6 | 7 | 8 | 6 | 5 | 4 | 6 | 5 | 2 | 21 | 27 | 20 | ||||||||||||||||||||||||||||||||||||
| EBITDA margin (%) |
27.9 | % | 31.0 | % | 33.6 | % | 28.6 | % | 26.2 | % | 25.2 | % | 27.7 | % | 21.4 | % | 14.3 | % | 27.3 | % | 30.4 | % | 25.1 | % | ||||||||||||||||||||||||
| Capital expenditures (CAPEX) |
1 | 2 | 12 | 4 | 2 | 3 | 6 | 10 | 40 | 13 | 18 | 21 | ||||||||||||||||||||||||||||||||||||
| CAPEX excluding licenses |
1 | 2 | 12 | 4 | 2 | 3 | 6 | 8 | 4 | 13 | 18 | 18 | ||||||||||||||||||||||||||||||||||||
| Operating cash flow (EBITDA-CAPEX excluding licenses) |
5 | 5 | (4 | ) | 2 | 3 | 1 | 0 | (3 | ) | (1 | ) | 9 | 8 | 1 | |||||||||||||||||||||||||||||||||
| OCF margin (%) |
24 | % | 22 | % | (13 | %) | 13 | % | 18 | % | 10 | % | 2 | % | (15 | %) | (9 | %) | 11 | % | 11 | % | 2 | % | ||||||||||||||||||||||||
| MOBILE |
1Q13 | 2Q13 | 3Q13 | 4Q13 | 1Q14 | 2Q14 | 3Q14 | 4Q14 | 1Q15 | FY12 | FY13 | FY14 | ||||||||||||||||||||||||||||||||||||
| Total operating revenue |
19 | 20 | 23 | 21 | 18 | 17 | 20 | 19 | 13 | 77 | 83 | 74 | ||||||||||||||||||||||||||||||||||||
| Service revenue |
18 | 19 | 22 | 20 | 17 | 17 | 20 | 19 | 13 | 73 | 79 | 73 | ||||||||||||||||||||||||||||||||||||
| Data Revenue |
0.6 | 0.6 | 0.7 | 0.7 | 0.6 | 0.6 | 0.7 | 0.6 | 0.5 | 2.3 | 2.6 | 2.5 | ||||||||||||||||||||||||||||||||||||
| Customers (mln) |
1.0 | 1.0 | 1.1 | 1.1 | 1.1 | 1.1 | 1.3 | 1.3 | 1.3 | 1.0 | 1.1 | 1.3 | ||||||||||||||||||||||||||||||||||||
| Mobile data customers (mln) |
0.4 | 0.4 | 0.4 | 0.4 | 0.4 | 0.4 | 0.4 | 0.4 | 0.5 | 0.4 | 0.4 | 0.4 | ||||||||||||||||||||||||||||||||||||
| ARPU (USD) |
6.3 | 6.4 | 6.4 | 5.9 | 5.0 | 4.9 | 5.3 | 4.5 | 3.2 | n.a. | n.a. | n.a. | ||||||||||||||||||||||||||||||||||||
| MOU (min) |
253 | 251 | 250 | 226 | 214 | 226 | 239 | 230 | 226 | n.a. | n.a. | n.a. | ||||||||||||||||||||||||||||||||||||
| Churn 3 months active base (quarterly) (%) |
19.4 | % | 16.5 | % | 16.7 | % | 21.4 | % | 16.1 | % | 16.4 | % | 15.9 | % | 21.3 | % | 16.7 | % | n.a. | n.a. | n.a. | |||||||||||||||||||||||||||
| FIXED |
1Q13 | 2Q13 | 3Q13 | 4Q13 | 1Q14 | 2Q14 | 3Q14 | 4Q14 | 1Q15 | FY12 | FY13 | FY14 | ||||||||||||||||||||||||||||||||||||
| Total operating revenue |
1.1 | 1.3 | 1.2 | 1.0 | 1.0 | 0.4 | 1.2 | 1.8 | 1.6 | 1.6 | 4.6 | 4.4 | ||||||||||||||||||||||||||||||||||||
| Service revenue |
1.1 | 1.3 | 1.2 | 1.2 | 0.9 | 0.4 | 1.2 | 1.8 | 1.6 | 1.5 | 4.8 | 4.3 | ||||||||||||||||||||||||||||||||||||
| (in GEL millions, unless stated otherwise, unaudited) | ||||||||||||||||||||||||||||||||||||||||||||||||
| CONSOLIDATED |
1Q13 | 2Q13 | 3Q13 | 4Q13 | 1Q14 | 2Q14 | 3Q14 | 4Q14 | 1Q15 | FY12 | FY13 | FY14 | ||||||||||||||||||||||||||||||||||||
| Total operating revenue |
33 | 36 | 40 | 38 | 33 | 31 | 37 | 39 | 30 | 129 | 147 | 140 | ||||||||||||||||||||||||||||||||||||
| EBITDA |
9 | 11 | 14 | 11 | 9 | 8 | 10 | 8 | 4 | 35 | 45 | 35 | ||||||||||||||||||||||||||||||||||||
| EBITDA margin (%) |
27.9 | % | 31.0 | % | 33.6 | % | 28.6 | % | 26.2 | % | 25.2 | % | 27.7 | % | 21.4 | % | 14.2 | % | 27.3 | % | 30.4 | % | 25.1 | % | ||||||||||||||||||||||||
| Capital expenditures (CAPEX) |
1 | 3 | 19 | 6 | 3 | 5 | 10 | 19 | 83 | 21 | 29 | 37 | ||||||||||||||||||||||||||||||||||||
| CAPEX excluding licenses |
1 | 3 | 19 | 6 | 3 | 5 | 10 | 14 | 7 | 21 | 29 | 32 | ||||||||||||||||||||||||||||||||||||
| Operating cash flow (EBITDA-CAPEX excluding licenses) |
8 | 8 | (5 | ) | 5 | 6 | 3 | 0 | (6 | ) | (3 | ) | 14 | 16 | 3 | |||||||||||||||||||||||||||||||||
| OCF margin (%) |
24 | % | 22 | % | (13 | %) | 13 | % | 18 | % | 10 | % | 0 | % | (15 | %) | (10 | %) | 11 | % | 11 | % | 2 | % | ||||||||||||||||||||||||
| MOBILE |
1Q13 | 2Q13 | 3Q13 | 4Q13 | 1Q14 | 2Q14 | 3Q14 | 4Q14 | 1Q15 | FY12 | FY13 | FY14 | ||||||||||||||||||||||||||||||||||||
| Total operating revenue |
31 | 33 | 38 | 36 | 31 | 31 | 35 | 35 | 27 | 127 | 138 | 132 | ||||||||||||||||||||||||||||||||||||
| Service revenue |
30 | 32 | 37 | 33 | 30 | 30 | 35 | 35 | 26 | 121 | 132 | 130 | ||||||||||||||||||||||||||||||||||||
| Data Revenue |
1.0 | 0.9 | 1.1 | 1.1 | 1.1 | 1.1 | 1.3 | 1.0 | 1.1 | 3.9 | 4.2 | 4.5 | ||||||||||||||||||||||||||||||||||||
| Customers (mln) |
0.97 | 1.01 | 1.10 | 1.09 | 1.11 | 1.15 | 1.25 | 1.25 | 1.28 | 1.0 | 1.1 | 1.3 | ||||||||||||||||||||||||||||||||||||
| Mobile data customers (mln) |
0.4 | 0.4 | 0.4 | 0.4 | 0.4 | 0.4 | 0.4 | 0.4 | 0.5 | 0.4 | 0.4 | 0.4 | ||||||||||||||||||||||||||||||||||||
| ARPU (GEL) |
10.4 | 11.0 | 11.0 | 10.0 | 8.7 | 8.5 | 9.2 | 8.2 | 6.7 | n.a. | n.a. | n.a. | ||||||||||||||||||||||||||||||||||||
| MOU (min) |
253 | 251 | 250 | 226 | 214 | 226 | 239 | 230 | 226 | n.a. | n.a. | n.a. | ||||||||||||||||||||||||||||||||||||
| Churn 3 months active base (quarterly) (%) |
19.4 | % | 16.5 | % | 16.7 | % | 21.4 | % | 16.1 | % | 16.4 | % | 15.9 | % | 21.3 | % | 16.7 | % | n.a. | n.a. | n.a. | |||||||||||||||||||||||||||
| FIXED |
1Q13 | 2Q13 | 3Q13 | 4Q13 | 1Q14 | 2Q14 | 3Q14 | 4Q14 | 1Q15 | FY12 | FY13 | FY14 | ||||||||||||||||||||||||||||||||||||
| Total operating revenue |
1.8 | 2.2 | 2.0 | 2.1 | 2.0 | 0.7 | 2.2 | 3.3 | 3.3 | 2.6 | 8.1 | 8.2 | ||||||||||||||||||||||||||||||||||||
| Service revenue |
1.8 | 2.2 | 2.0 | 2.1 | 1.6 | 0.7 | 2.2 | 3.3 | 3.3 | 2.5 | 8.1 | 7.8 | ||||||||||||||||||||||||||||||||||||
Table of Contents
Kyrgyzstan
index page
(in USD millions, unless stated otherwise, unaudited)
| CONSOLIDATED |
1Q13 | 2Q13 | 3Q13 | 4Q13 | 1Q14 | 2Q14 | 3Q14 | 4Q14 | 1Q15 | FY12 | FY13 | FY14 | ||||||||||||||||||||||||||||||||||||
| Total operating revenue |
44 | 51 | 53 | 44 | 38 | 44 | 51 | 45 | 38 | 161 | 192 | 178 | ||||||||||||||||||||||||||||||||||||
| EBITDA |
22 | 29 | 27 | 19 | 17 | 23 | 27 | 23 | 21 | 91 | 97 | 90 | ||||||||||||||||||||||||||||||||||||
| EBITDA margin (%) |
51.1 | % | 56.1 | % | 51.0 | % | 42.8 | % | 45.2 | % | 53.0 | % | 52.9 | % | 52.0 | % | 53.5 | % | 56.3 | % | 50.5 | % | 51.1 | % | ||||||||||||||||||||||||
| Capital expenditures (CAPEX) |
1 | 8 | 6 | 8 | 3 | 6 | 8 | 10 | 3 | 31 | 23 | 27 | ||||||||||||||||||||||||||||||||||||
| CAPEX excluding licenses |
1 | 8 | 6 | 8 | 3 | 6 | 8 | 10 | 3 | 31 | 23 | 27 | ||||||||||||||||||||||||||||||||||||
| Operating cash flow (EBITDA-CAPEX excluding licenses) |
21 | 21 | 21 | 11 | 14 | 17 | 19 | 14 | 18 | 60 | 74 | 64 | ||||||||||||||||||||||||||||||||||||
| OCF margin (%) |
48 | % | 40 | % | 40 | % | 25 | % | 37 | % | 40 | % | 37 | % | 30 | % | 46 | % | 37 | % | 38 | % | 36 | % | ||||||||||||||||||||||||
| MOBILE |
1Q13 | 2Q13 | 3Q13 | 4Q13 | 1Q14 | 2Q14 | 3Q14 | 4Q14 | 1Q15 | FY12 | FY13 | FY14 | ||||||||||||||||||||||||||||||||||||
| Total operating revenue |
44 | 51 | 53 | 44 | 38 | 44 | 51 | 45 | 38 | 161 | 192 | 178 | ||||||||||||||||||||||||||||||||||||
| Service revenue |
44 | 51 | 53 | 44 | 38 | 44 | 51 | 45 | 38 | 160 | 192 | 178 | ||||||||||||||||||||||||||||||||||||
| Data Revenue |
3.2 | 3.2 | 3.6 | 4.1 | 4.3 | 4.3 | 5.1 | 4.8 | 4.6 | 10.6 | 14.2 | 18.5 | ||||||||||||||||||||||||||||||||||||
| Customers (mln) |
2.2 | 2.3 | 2.5 | 2.7 | 2.6 | 2.6 | 2.7 | 2.7 | 2.7 | 2.5 | 2.7 | 2.7 | ||||||||||||||||||||||||||||||||||||
| Mobile data customers (mln) |
1.6 | 1.3 | 1.4 | 1.5 | 1.5 | 1.5 | 1.5 | 1.6 | 1.6 | 1.3 | 1.5 | 1.6 | ||||||||||||||||||||||||||||||||||||
| ARPU (USD) |
6.2 | 7.4 | 7.0 | 5.6 | 4.7 | 5.6 | 6.3 | 5.4 | 4.6 | n.a. | n.a. | n.a. | ||||||||||||||||||||||||||||||||||||
| MOU (min) |
228 | 280 | 310 | 311 | 294 | 294 | 298 | 285 | 261 | n.a. | n.a. | n.a. | ||||||||||||||||||||||||||||||||||||
| Churn 3 months active base (quarterly) (%) |
24 | % | 15 | % | 14 | % | 17 | % | 19 | % | 16 | % | 15 | % | 16 | % | 15 | % | n.a. | n.a. | n.a. | |||||||||||||||||||||||||||
| (in KGS millions, unless stated otherwise, unaudited) | ||||||||||||||||||||||||||||||||||||||||||||||||
| CONSOLIDATED |
1Q13 | 2Q13 | 3Q13 | 4Q13 | 1Q14 | 2Q14 | 3Q14 | 4Q14 | 1Q15 | FY12 | FY13 | FY14 | ||||||||||||||||||||||||||||||||||||
| Total operating revenue |
2,093 | 2,458 | 2,599 | 2,165 | 1,988 | 2,330 | 2,666 | 2,563 | 2,340 | 7,582 | 9,316 | 9,547 | ||||||||||||||||||||||||||||||||||||
| EBITDA |
1,069 | 1,380 | 1,326 | 927 | 899 | 1,234 | 1,410 | 1,333 | 1,253 | 4,266 | 4,702 | 4,876 | ||||||||||||||||||||||||||||||||||||
| EBITDA margin (%) |
51.1 | % | 56.1 | % | 51.0 | % | 42.8 | % | 45.2 | % | 53.0 | % | 52.9 | % | 52.0 | % | 53.6 | % | 56.3 | % | 50.5 | % | 51.1 | % | ||||||||||||||||||||||||
| Capital expenditures (CAPEX) |
55 | 403 | 284 | 395 | 159 | 305 | 412 | 562 | 168 | 1,461 | 1,137 | 1,438 | ||||||||||||||||||||||||||||||||||||
| CAPEX excluding licenses |
55 | 403 | 284 | 395 | 159 | 305 | 412 | 562 | 168 | 1,461 | 1,137 | 1,438 | ||||||||||||||||||||||||||||||||||||
| Operating cash flow (EBITDA-CAPEX excluding licenses) |
1,014 | 977 | 1,042 | 532 | 740 | 929 | 998 | 771 | 1,085 | 2,805 | 3,565 | 3,438 | ||||||||||||||||||||||||||||||||||||
| OCF margin (%) |
48 | % | 40 | % | 40 | % | 25 | % | 37 | % | 40 | % | 37 | % | 30 | % | 46 | % | 37 | % | 38 | % | 36 | % | ||||||||||||||||||||||||
| MOBILE |
1Q13 | 2Q13 | 3Q13 | 4Q13 | 1Q14 | 2Q14 | 3Q14 | 4Q14 | 1Q15 | FY12 | FY13 | FY14 | ||||||||||||||||||||||||||||||||||||
| Total operating revenue |
2,093 | 2,458 | 2,599 | 2,165 | 1,988 | 2,330 | 2,666 | 2,563 | 2,340 | 7,583 | 9,315 | 9,547 | ||||||||||||||||||||||||||||||||||||
| Service revenue |
2,077 | 2,443 | 2,583 | 2,151 | 1,975 | 2,322 | 2,658 | 2,549 | 2,318 | 7,517 | 9,254 | 9,504 | ||||||||||||||||||||||||||||||||||||
| Data Revenue |
153 | 155 | 178 | 200 | 221 | 229 | 266 | 272 | 282 | 499 | 686 | 988 | ||||||||||||||||||||||||||||||||||||
| Customers (mln) |
2.2 | 2.3 | 2.5 | 2.7 | 2.6 | 2.6 | 2.7 | 2.7 | 2.7 | 2.5 | 2.7 | 2.7 | ||||||||||||||||||||||||||||||||||||
| Mobile data customers (mln) |
1.6 | 1.3 | 1.4 | 1.5 | 1.5 | 1.5 | 1.5 | 1.6 | 1.6 | 1.3 | 1.5 | 1.6 | ||||||||||||||||||||||||||||||||||||
| ARPU, (KGS) |
294 | 355 | 353 | 274 | 248 | 297 | 330 | 310 | 282 | n.a. | n.a. | n.a. | ||||||||||||||||||||||||||||||||||||
| MOU (min) |
228 | 280 | 310 | 311 | 294 | 294 | 298 | 285 | 261 | n.a. | n.a. | n.a. | ||||||||||||||||||||||||||||||||||||
| Churn 3 months active base (quarterly) (%) |
24 | % | 15 | % | 14 | % | 17 | % | 19 | % | 16 | % | 15 | % | 16 | % | 15 | % | n.a. | n.a. | n.a. | |||||||||||||||||||||||||||
Table of Contents
Laos
index page
(in USD millions, unless stated otherwise, unaudited)
| CONSOLIDATED |
1Q13 | 2Q13 | 3Q13 | 4Q13 | 1Q14 | 2Q14 | 3Q14 | 4Q14 | 1Q15 | FY12 | FY13 | FY14 | ||||||||||||||||||||||||||||||||||||
| Total operating revenue* |
11.9 | 7.8 | 7.0 | 6.7 | 8.3 | 8.0 | 7.0 | 5.5 | 5.1 | 60.8 | 33.4 | 28.5 | ||||||||||||||||||||||||||||||||||||
| EBITDA* |
(0.9 | ) | 2.8 | 2.0 | 1.7 | 2.4 | 3.0 | 2.0 | 2.3 | 2.0 | (9.9) | 5.6 | 9.6 | |||||||||||||||||||||||||||||||||||
| EBITDA margin (%)* |
n.m. | 35.7 | % | 30.5 | % | 25.8 | % | 28.4 | % | 37.7 | % | 28.0 | % | 42.7 | % | 38.5 | % | n.a. | 16.9 | % | 33.6 | % | ||||||||||||||||||||||||||
| MOBILE |
1Q13 | 2Q13 | 3Q13 | 4Q13 | 1Q14 | 2Q14 | 3Q14 | 4Q14 | 1Q15 | FY12 | FY13 | FY14 | ||||||||||||||||||||||||||||||||||||
| Customers (mln) |
0.3 | 0.3 | 0.3 | 0.3 | 0.3 | 0.3 | 0.3 | 0.2 | 0.2 | 0.3 | 0.3 | 0.2 | ||||||||||||||||||||||||||||||||||||
| ARPU (USD) |
7.0 | 7.1 | 6.1 | 6.1 | 5.4 | 5.6 | 5.7 | 5.0 | 5.1 | n.a. | n.a. | n.a. | ||||||||||||||||||||||||||||||||||||
| * | Vietnam operations were sold in April 2012, Cambodia operations were sold in April 2013 |
Serious News for Serious Traders! Try StreetInsider.com Premium Free!
You May Also Be Interested In
- Port Houston Regular Commission Meeting
- Faraday Future Receives Letter from Nasdaq Regarding Form 10-K Filing
- FluroTech and GS Heli Announce Execution of Definitive Agreement
Create E-mail Alert Related Categories
SEC FilingsSign up for StreetInsider Free!
Receive full access to all new and archived articles, unlimited portfolio tracking, e-mail alerts, custom newswires and RSS feeds - and more!
