Form 6-K VimpelCom Ltd. For: May 12
UNITED STATES
SECURITIES AND EXCHANGE COMMISSION
Washington, D.C. 20549
FORM 6-K
Report of Foreign Private Issuer
Pursuant to Rule 13a-16 or 15d-16
under the Securities Exchange Act of 1934
For the month of May 2016
Commission File Number 1-34694
VimpelCom Ltd.
(Translation of registrant’s name into English)
The Rock Building, Claude Debussylaan 88, 1082 MD, Amsterdam, the Netherlands
(Address of principal executive offices)
Indicate by check mark whether the registrant files or will file annual reports under cover Form 20-F or Form 40-F.
Form 20-F x Form 40-F ¨
Indicate by check mark if the registrant is submitting the Form 6-K in paper as permitted by Regulation S-T Rule 101(b)(1): ¨.
Indicate by check mark if the registrant is submitting the Form 6-K in paper as permitted by Regulation S-T Rule 101(b)(7): ¨.
SIGNATURES
Pursuant to the requirements of the Securities Exchange Act of 1934, the registrant has duly caused this report to be signed on its behalf by the undersigned, thereunto duly authorized.
| VIMPELCOM LTD. | ||||||
| (Registrant) | ||||||
| Date: May 12, 2016 |
||||||
| By: | /s/ Scott Dresser | |||||
| Name: | Scott Dresser | |||||
| Title: | Group General Counsel | |||||

VIMPELCOM REPORTS POSITIVE REVENUE MOMENTUM
WITH 1Q 2016 RESULTS, FY16 GUIDANCE CONFIRMED
KEY RESULTS AND DEVELOPMENTS
| • | Revenue organic1 growth of 4% YoY, driven by strong growth in Emerging Markets and Eurasia |
| • | Underlying2 EBITDA organically increased 2% YoY. Reported EBITDA declined 19% YoY mainly due to currency headwinds and exceptional items of USD 40 million almost entirely related to performance transformation |
| • | Reported net income of USD 189 million of which USD 38 million from continued operations |
| • | Results on track and FY16 guidance confirmed |
| • | USD 1.2 billion bonds successfully issued on April 26, 2016 with 4 and 7 year maturities and 6.8% average coupon |
Amsterdam (May 12, 2016)—VimpelCom Ltd. (NASDAQ: VIP), the international communications and technology company, which is committed to bringing the digital world to each and every customer, today announces financial and operating results for the quarter ended March 31, 2016. These results and the prior year numbers reflect the reclassification of Italy as an asset held for sale pursuant to the announcement of the joint venture with 3 Italia in August 2015.
JEAN-YVES CHARLIER, CHIEF EXECUTIVE OFFICER, COMMENTS:
“VimpelCom has reported organic growth in both revenue (+4%) and underlying EBITDA (+2%) in the first quarter of 2016. As a result, underlying net income3 for the quarter improved by USD 270 million year-on-year to USD 237 million, demonstrating that the operating momentum we had at the end of 2015 has continued into 2016. Although we still face currency headwinds and adverse economic conditions in some of our markets, there are signs of an easing in pressures, with the exception of Russia. Excluding the payments in relation to the agreements regarding the Uzbekistan investigations, we generated positive free cash flow in the quarter as our performance transformation program accelerates. Our strategy to profoundly transform VimpelCom is firmly on course, particularly in the areas of cost base transformation, streamlining our portfolio, and greater globalization of our internal operations. VimpelCom remains on track to achieve its financial targets for the year.”
CONSOLIDATED FINANCIAL AND OPERATING HIGHLIGHTS (ITALY RECLASSIFIED AS AN ASSET HELD FOR SALE)
| USD mln | 1Q16 | 1Q15 | Reported YoY |
Organic1 YoY |
||||||||||||
| Total revenue, of which |
2,023 | 2,312 | (12%) | 4% | ||||||||||||
| mobile and fixed service revenue |
1,953 | 2,260 | (14%) | 3% | ||||||||||||
| mobile data revenue |
301 | 286 | 5% | 27% | ||||||||||||
| EBITDA |
758 | 938 | (19%) | (2%) | ||||||||||||
| EBITDA underlying2 |
799 | 945 | (15%) | 2% | ||||||||||||
| EBITDA margin underlying (EBITDA underlying / total revenue) |
39.5% | 40.9% | (1.4 p.p.) | (0.8 p.p.) | ||||||||||||
| Net income/(loss) from continued operations |
38 | (88) | n.m | |||||||||||||
| Net income/(loss) from discontinued operations |
197 | 261 | (24%) | |||||||||||||
| Net income/(loss) for the period attr. to VIP shareholders |
189 | 184 | 3% | |||||||||||||
| Capital expenditures excl. licenses |
151 | 210 | (28%) | |||||||||||||
| LTM Capex excl licenses/revenue |
18.2% | 20.3% | (2.1 p.p.) | |||||||||||||
| Operating cash flow (EBITDA underlying less Capex) |
647 | 734 | (12%) | |||||||||||||
| Operating cash flow margin (operating cash flow / total revenue) |
32.0% | 31.8% | 0.2 p.p. | |||||||||||||
| Net debt |
6,407 | 5,883 | 9% | |||||||||||||
| Net debt / underlying LTM EBITDA |
1.7 | 1.2 | ||||||||||||||
| Total mobile customers (millions)4 |
194.0 | 195.1 | ||||||||||||||
| Total fixed-line broadband customers (millions) |
3.4 | 3.5 | ||||||||||||||
| 1) | EBITDA, net debt, underlying EBITDA and organic growth are non-GAAP financial measures (see attachment D for reconciliation); organic change reflects changes in revenue and EBITDA excluding foreign currency movements and other factors, such as businesses under liquidation, disposals, mergers and acquisitions |
| 2) | Underlying EBITDA excludes transformation costs and material exceptional adjustments, see Attachment D |
| 3) | Underlying net loss in 1Q15 of USD 33 million excludes exceptional items in EBITDA of USD 7 million, the gain from tower sale in Italy of USD 322 million and impairments of USD 98 million; Underlying net income in 1Q16 of USD 237 million excludes exceptional items in EBITDA of USD 40 million and impairments of USD 8 million |
| 4) | Excluding Italy |
For all definitions please see Attachment G
VimpelCom Ltd. 1Q 2016 | 1

CONTENTS
| 3 | ||||
| 4 | ||||
| 8 | ||||
| 18 | ||||
| 19 | ||||
| 21 |
PRESENTATION OF FINANCIAL RESULTS
VimpelCom’s results presented in this earnings release are based on IFRS and have not been audited. Certain amounts and percentages that appear in this earnings release have been subject to rounding adjustments. As a result, certain numerical figures shown as totals, including those in tables, may not be an exact arithmetic aggregation of the figures that precede or follow them.
VimpelCom Ltd. 1Q 2016 | 2

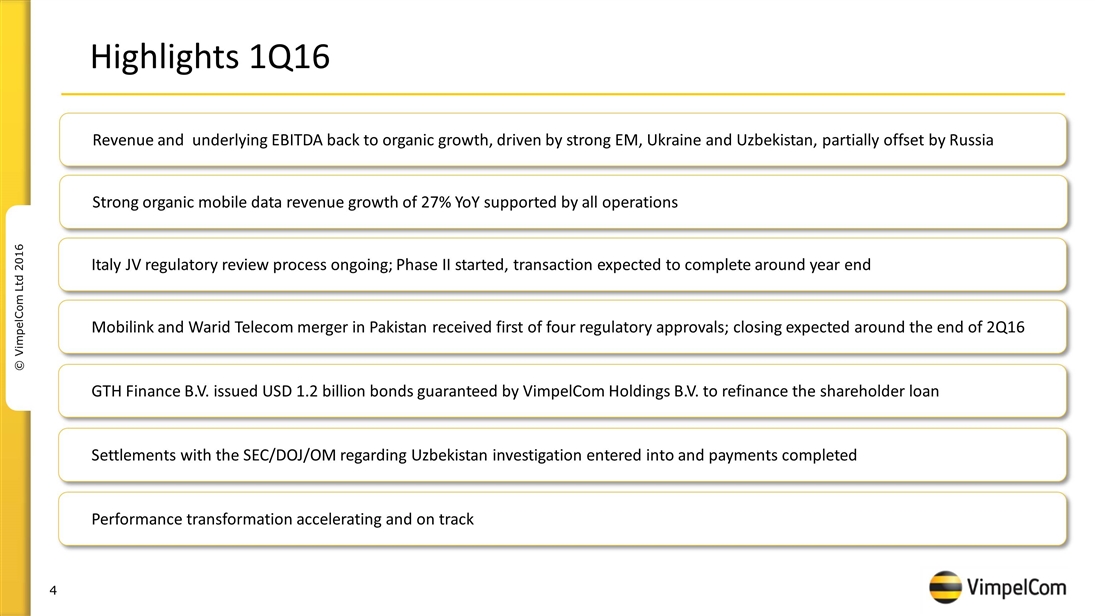
| • | Italy joint venture regulatory review process ongoing, Phase II review process started |
| • | Mobilink and Warid Telecom merger receives first regulatory approval from CCP |
| • | GTH issued USD 1.2 billion bonds guaranteed by VimpelCom Holdings to refinance shareholder loan |
| • | Telenor preference shares in VimpelCom redeemed; change in share ownership |
| • | Settlements with the SEC/DOJ/OM regarding Uzbekistan investigation entered into and payments completed |
| • | New CEO appointed in Algeria |
| VimpelCom Ltd. 1Q 2016 | 3 |

| • | Revenue showed increasing organic growth of 4% YoY |
| • | Underlying EBITDA organically increased by 2% YoY. Reported EBITDA declined 19% YoY mainly due to currency headwinds and exceptional items of USD 40 million related to performance transformation |
| • | Reported net income of USD 189 million, of which USD 38 million from continued operations |
FINANCIALS BY BUSINESS UNIT
| USD mln | 1Q16 | 1Q15 | Reported YoY |
Organic YoY |
Forex and Other |
|||||||||||||||
| Total revenue |
2,023 | 2,312 | (12%) | 4% | (16%) | |||||||||||||||
| Russia |
890 | 1,067 | (17%) | 0% | (17%) | |||||||||||||||
| Emerging markets |
710 | 724 | (2%) | 6% | (7%) | |||||||||||||||
| Eurasia |
436 | 552 | (21%) | 5% | (26%) | |||||||||||||||
| HQ and eliminations |
(13) | (31) | n.a. | n.a. | n.a. | |||||||||||||||
| EBITDA |
758 | 938 | (19%) | (2%) | (17%) | |||||||||||||||
| Russia |
324 | 421 | (23%) | (8%) | (15%) | |||||||||||||||
| Emerging markets |
345 | 326 | 6% | 15% | (9%) | |||||||||||||||
| Eurasia |
218 | 265 | (18%) | 8% | (26%) | |||||||||||||||
| HQ and eliminations |
(129) | (74) | n.a. | n.a. | n.a | |||||||||||||||
| EBITDA margin |
37.5% | 40.6% | (3.1p.p.) | |||||||||||||||||
| EBITDA underlying |
799 | 945 | (15%) | 2% | ||||||||||||||||
| Russia |
325 | 421 | (23%) | (7%) | ||||||||||||||||
| Emerging markets |
353 | 333 | 6% | 15% | ||||||||||||||||
| Eurasia |
215 | 265 | (19%) | 7% | ||||||||||||||||
| HQ and eliminations |
(94) | (74) | 27% | n.a. | ||||||||||||||||
| EBITDA margin underlying |
39.5% | 40.9% | (1.4p.p.) | (0.8p.p.) | ||||||||||||||||
VimpelCom Ltd. 1Q 2016 | 4

VimpelCom Ltd. 1Q 2016 | 5

INCOME STATEMENT ELEMENTS & CAPITAL EXPENDITURES
| USD mln | 1Q16 | 1Q15 | YoY | |||||||||
| Total revenue |
2,023 | 2,312 | (12%) | |||||||||
| Service revenue |
1,953 | 2,260 | (14%) | |||||||||
| EBITDA |
758 | 938 | (19%) | |||||||||
| EBITDA margin |
37.5% | 40.6% | (3.1p.p.) | |||||||||
| Depreciation and amortization and other |
(454) | (630) | (28%) | |||||||||
| EBIT |
304 | 308 | (1%) | |||||||||
| Financial income and expenses |
(168) | (215) | (22%) | |||||||||
| Net foreign exchange (loss)/gain and others |
19 | (101) | (119%) | |||||||||
| Profit/(loss) before tax |
155 | (8) | n.m | |||||||||
| Income tax expense |
(117) | (80) | 46% | |||||||||
| Profit/(loss) from continued operations |
38 | (88) | n.m | |||||||||
| Profit/(loss) from discontinued operations |
197 | 261 | (24%) | |||||||||
| Net income/(loss) attributable to VimpelCom shareholders |
189 | 184 | 3% | |||||||||
| 1Q16 | 1Q15 | YoY | ||||||||||
| Capex expenditures |
195 | 264 | (26%) | |||||||||
| Capex expenditures excl licenses |
151 | 210 | (28%) | |||||||||
| LTM Capex excl licenses/revenue |
18% | 20% | ||||||||||
VimpelCom Ltd. 1Q 2016 | 6

FINANCIAL POSITION & CASH FLOW
| USD mln | 1Q16 | 4Q15 | QoQ | |||||||||
| Total assets |
33,969 | 33,854 | 0% | |||||||||
| Shareholders’ equity |
4,045 | 3,765 | 7% | |||||||||
| Gross debt |
9,686 | 9,544 | 1% | |||||||||
| Net debt |
6,407 | 5,496 | 17% | |||||||||
| Net debt / underlying LTM EBITDA |
1.7 | 1.4 | ||||||||||
| USD mln | 1Q16 | 1Q15 | YoY | |||||||||
| Net cash from / (used in) operating activities |
(238) | (764) | 526 | |||||||||
| from continued operations |
(361) | (876) | 515 | |||||||||
| from discontinued operations |
123 | 112 | 11 | |||||||||
| Net cash from / (used in) investing activities |
(551) | 50 | (601) | |||||||||
| from continued operations |
(360) | (480) | 120 | |||||||||
| from discontinued operations |
(191) | 530 | (721) | |||||||||
| Net cash from / (used in) financing activities |
26 | 1,137 | (1,111) | |||||||||
| from continued operations |
36 | 1,646 | (1,610) | |||||||||
| from discontinued operations |
(10) | (509) | 500 | |||||||||
VimpelCom Ltd. 1Q 2016 | 7

| • Russia
|
||||
| • Algeria |
||||
| • Pakistan |
Emerging markets | |||
| • Bangladesh |
||||
| • Ukraine |
||||
| • Kazakhstan |
Eurasia | |||
| • Other |
||||
VimpelCom Ltd. 1Q 2016 | 8

FINANCIALS BY COUNTRY
| USD mln | 1Q16 | 1Q15 | Reported YoY |
Organic YoY |
||||||||||||
| Service revenue |
1,953 | 2,260 | (14%) | 3% | ||||||||||||
| Russia |
852 | 1,036 | (18%) | (1%) | ||||||||||||
| Algeria |
276 | 320 | (14%) | (0%) | ||||||||||||
| Pakistan |
257 | 236 | 9% | 12% | ||||||||||||
| Bangladesh |
153 | 145 | 6% | 6% | ||||||||||||
| Ukraine |
135 | 151 | (10%) | 12% | ||||||||||||
| Kazakhstan |
79 | 164 | (51%) | (7%) | ||||||||||||
| Uzbekistan |
165 | 167 | (1%) | 15% | ||||||||||||
| Kyrgyzstan |
31 | 38 | (18%) | (0%) | ||||||||||||
| Armenia |
22 | 26 | (16%) | (14%) | ||||||||||||
| Tajikistan |
19 | 26 | (27%) | (27%) | ||||||||||||
| Georgia |
10 | 14 | (30%) | (17%) | ||||||||||||
| HQ and eliminations |
(47 | ) | (62 | ) | n.a. | n.a. | ||||||||||
| EBITDA reported |
758 | 938 | (19%) | (2%) | ||||||||||||
| Russia |
324 | 421 | (23%) | (8%) | ||||||||||||
| Algeria |
158 | 169 | (6%) | 9% | ||||||||||||
| Pakistan |
116 | 96 | 21% | 25% | ||||||||||||
| Bangladesh |
70 | 60 | 18% | 19% | ||||||||||||
| Ukraine |
71 | 63 | 13% | 43% | ||||||||||||
| Kazakhstan |
31 | 81 | (61%) | (26%) | ||||||||||||
| Uzbekistan |
100 | 105 | (4%) | 11% | ||||||||||||
| Kyrgyzstan |
17 | 21 | (16%) | 2% | ||||||||||||
| Armenia |
8 | 9 | (13%) | (11%) | ||||||||||||
| Tajikistan |
12 | 14 | (15%) | (15%) | ||||||||||||
| Georgia |
2 | 2 | (4%) | 14% | ||||||||||||
| HQ and eliminations |
(152 | ) | (102 | ) | n.a. | n.a. | ||||||||||
| EBITDA Underlying |
799 | 945 | (15%) | 2% | ||||||||||||
| Russia |
325 | 421 | (23%) | (7%) | ||||||||||||
| Algeria |
158 | 169 | (6%) | 9% | ||||||||||||
| Pakistan |
119 | 103 | 16% | 20% | ||||||||||||
| Bangladesh |
75 | 60 | 25% | 26% | ||||||||||||
| Ukraine |
71 | 63 | 12% | 42% | ||||||||||||
| Kazakhstan |
32 | 81 | (60%) | (24%) | ||||||||||||
| Uzbekistan |
97 | 105 | (7%) | 7% | ||||||||||||
| Kyrgyzstan |
17 | 21 | (16%) | 2% | ||||||||||||
| Armenia |
8 | 9 | (13%) | (11%) | ||||||||||||
| Tajikistan |
12 | 14 | (15%) | (15%) | ||||||||||||
| Georgia |
2 | 2 | 0% | 18% | ||||||||||||
| HQ and eliminations |
(118 | ) | (102 | ) | n.a. | n.a. | ||||||||||
Note: HQ and eliminations in “financials by countries” differ from the “financials by business unit” due to eliminations within business unit.
VimpelCom Ltd. 1Q 2016 | 9

RUSSIA
| RUB mln | 1Q16 | 1Q15 | YoY | |||||||||
| Total revenue |
66,297 | 66,276 | 0% | |||||||||
| Mobile service revenue |
52,620 | 52,148 | 1% | |||||||||
| Fixed-line service revenue |
10,862 | 12,200 | (11%) | |||||||||
| EBITDA |
24,159 | 26,130 | (8%) | |||||||||
| EBITDA underlying |
24,212 | 26,130 | (7%) | |||||||||
| EBITDA margin |
36.4% | 39.4% | (3.0 p.p.) | |||||||||
| EBITDA margin underlying |
36.5% | 39.4% | (2.9 p.p.) | |||||||||
| Capex excl licenses |
3,181 | 5,179 | (39%) | |||||||||
| LTM Capex excl licenses /revenue |
18% | 19% | (1.0 p.p) | |||||||||
| Mobile |
||||||||||||
| Total revenue |
55,371 | 54,024 | 2% | |||||||||
| - of which mobile data |
12,188 | 10,204 | 19% | |||||||||
| Customers (mln) |
57.7 | 55.7 | 4% | |||||||||
| - of which data users (mln) |
32.6 | 31.0 | 5% | |||||||||
| ARPU (RUB) |
291 | 300 | (3%) | |||||||||
| MOU (min) |
315 | 303 | 4% | |||||||||
| Data usage (MB) |
1,931 | 1,483 | 30% | |||||||||
| Fixed-line |
||||||||||||
| Total revenue |
10,926 | 12,252 | (11%) | |||||||||
| Broadband revenue |
2,811 | 3,168 | (11%) | |||||||||
| Broadband customers (mln) |
2.2 | 2.3 | (4%) | |||||||||
| Broadband ARPU (RUB) |
422 | 459 | (8%) | |||||||||
VimpelCom Ltd. 1Q 2016 | 10

ALGERIA
| DZD bln | 1Q16 | 1Q15 | YoY | |||||||||
| Total revenue |
30.0 | 30.0 | 0% | |||||||||
| Mobile service revenue |
29.7 | 29.8 | (0%) | |||||||||
| of which mobile data |
1.7 | 0.7 | 135% | |||||||||
| EBITDA |
17.1 | 15.7 | 9% | |||||||||
| EBITDA Underlying |
17.1 | 15.7 | 9% | |||||||||
| EBITDA margin |
56.8% | 52.3% | 4.4 p.p. | |||||||||
| EBITDA Underlying margin |
56.8% | 52.3% | 4.4 p.p. | |||||||||
| Capex excl licenses |
2.9 | 4.2 | (32%) | |||||||||
| LTM Capex excl licenses/revenue |
14% | 23% | (9.0 p.p.) | |||||||||
| Mobile |
||||||||||||
| Customers (mln) |
16.7 | 17.1 | (2%) | |||||||||
| - of which mobile data customers (mln) 1 |
4.3 | 1.8 | 134% | |||||||||
| ARPU (DZD) |
583 | 566 | 3% | |||||||||
| MOU (min) |
348 | 344 | 1% | |||||||||
| Data usage (MB) |
295 | 208 | 42% | |||||||||
| 1) | Data customers were restated in order to comply with VimpelCom Group definition |
VimpelCom Ltd. 1Q 2016 | 11

PAKISTAN
| PKR bln | 1Q16 | 1Q15 | YoY | |||||||||
| Total revenue |
28.6 | 25.3 | 13% | |||||||||
| Mobile service revenue |
27.0 | 24.0 | 12% | |||||||||
| of which mobile data |
3.4 | 1.9 | 80% | |||||||||
| EBITDA |
12.2 | 9.7 | 25% | |||||||||
| EBITDA Underlying |
12.5 | 10.4 | 20% | |||||||||
| EBITDA margin |
42.6% | 38.5% | 4.1 p.p. | |||||||||
| EBITDA Underlying margin |
43.8% | 41.3% | 2.5 p.p. | |||||||||
| Capex excl licenses |
1.3 | 2.6 | (51%) | |||||||||
| LTM Capex excl licenses /revenue |
22% | 32% | (10.4 p.p) | |||||||||
| Mobile |
||||||||||||
| Customers (mln) |
38.1 | 38.2 | (0.2%) | |||||||||
| - of which mobile data customers (mln) |
18.3 | 14.8 | 24% | |||||||||
| ARPU (PKR) |
234 | 203 | 15% | |||||||||
| MOU (min) |
692 | 559 | 24% | |||||||||
| Data usage (MB) |
297 | 298 | 0% | |||||||||
VimpelCom Ltd. 1Q 2016 | 12

BANGLADESH
| BDT bln | 1Q16 | 1Q15 | YoY | |||||||||
| Total revenue |
12.2 | 11.4 | 6% | |||||||||
| Mobile service revenue |
12.0 | 11.3 | 6% | |||||||||
| of which mobile data |
1.1 | 0.7 | 60% | |||||||||
| EBITDA |
5.5 | 4.6 | 19% | |||||||||
| EBITDA Underlying |
5.9 | 4.6 | 26% | |||||||||
| EBITDA margin |
45.3% | 40.6% | 4.7 p.p. | |||||||||
| EBITDA Underlying margin |
48.1% | 40.6% | 7.6 p.p. | |||||||||
| Capex excl licenses |
1.3 | 0.9 | 44% | |||||||||
| LTM Capex excl licenses /revenue |
23% | 28% | (5.6 p.p) | |||||||||
| Mobile |
||||||||||||
| Customers (mln) |
31.6 | 31.8 | (0.7%) | |||||||||
| - of which mobile data customers (mln) |
14.4 | 12.9 | 12% | |||||||||
| ARPU (BDT) |
124 | 119 | 4% | |||||||||
| MOU (min) |
311 | 295 | 6% | |||||||||
| Data usage (MB) |
157 | 65 | 141% | |||||||||
VimpelCom Ltd. 1Q 2016 | 13

UKRAINE
| UAH mln | 1Q16 | 1Q15 | YoY | |||||||||
| Total revenue |
3,478 | 3,092 | 12% | |||||||||
| Mobile service revenue |
3,210 | 2,851 | 13% | |||||||||
| Fixed-line service revenue |
259 | 233 | 11% | |||||||||
| EBITDA |
1,830 | 1,278 | 43% | |||||||||
| EBITDA underlying |
1,810 | 1,278 | 42% | |||||||||
| EBITDA margin |
52.6% | 41.3% | 11.3 p.p. | |||||||||
| EBITDA underlying margin |
52.0% | 41.3% | 10.7 p.p. | |||||||||
| Capex excl licenses |
249 | 742 | (66%) | |||||||||
| LTM Capex excl licenses /revenue |
22% | 17% | 5.3 p.p. | |||||||||
| Mobile |
||||||||||||
| Total operating revenue |
3,220 | 2,859 | 13% | |||||||||
| of which mobile data |
496 | 281 | 76% | |||||||||
| Customers (mln) |
25 | 26 | (3%) | |||||||||
| of which data customers(mln) |
10.3 | 11.3 | (8%) | |||||||||
| ARPU (UAH) |
42 | 36 | 16% | |||||||||
| MOU (min) |
572 | 536 | 7% | |||||||||
| Data usage |
229 | 150 | 52% | |||||||||
| Fixed-line |
||||||||||||
| Total operating revenue |
259 | 233 | 11% | |||||||||
| Broadband revenue |
148 | 117 | 26% | |||||||||
| Broadband customers (mln) |
0.8 | 0.8 | (1%) | |||||||||
| Broadband ARPU (UAH) |
61 | 48 | 27% | |||||||||
VimpelCom Ltd. 1Q 2016 | 14

KAZAKHSTAN
| KZT mln | 1Q16 | 1Q15 | YoY | |||||||||
| Total revenue |
28,723 | 30,284 | (5.2%) | |||||||||
| Mobile service revenue |
23,424 | 26,537 | (12%) | |||||||||
| Fixed-line service revenue |
4,784 | 3,707 | 29% | |||||||||
| EBITDA |
11,119 | 14,981 | (26%) | |||||||||
| Underlying EBITDA |
11,444 | 14,981 | (24%) | |||||||||
| EBITDA margin |
38.7% | 49.5% | (10.8 p.p.) | |||||||||
| Underlying EBITDA margin |
39.8% | 49.5% | (9.6 p.p.) | |||||||||
| Capex excl licenses |
3,838 | 1,239 | 210% | |||||||||
| LTM Capex excl licenses /revenue |
16% | 14% | 1.2 p.p | |||||||||
| Mobile |
||||||||||||
| Total revenue |
23,931 | 26,564 | (10%) | |||||||||
| - of which mobile data |
5,775 | 5,456 | 6% | |||||||||
| Mobile customers (mln) |
9.2 | 9.6 | (4%) | |||||||||
| - of which mobile data customers (mln) |
4.8 | 5.2 | (6%) | |||||||||
| Mobile ARPU (KZT) |
806 | 898 | (10%) | |||||||||
| MOU (min) |
299 | 273 | 10% | |||||||||
| Data usage (MB) |
1,010 | 414 | 144% | |||||||||
| Fixed-line |
||||||||||||
| Total revenue |
4,792 | 3,720 | 29% | |||||||||
| Broadband revenues |
774 | 625 | 24% | |||||||||
| Broadband customers (mln) |
0.2 | 0.2 | 9% | |||||||||
| Broadband ARPU (KZT) |
3,332 | 2,942 | 13% | |||||||||
VimpelCom Ltd. 1Q 2016 | 15

VimpelCom Ltd. 1Q 2016 | 16

VimpelCom Ltd. 1Q 2016 | 17

ITALY (RECLASSIFIED AS AN ASSET HELD FOR SALE)
| EUR mln | 1Q16 | 1Q15 | YoY | |||||||||
| Total revenue |
1,064 | 1,078 | (1%) | |||||||||
| Mobile service revenue |
703 | 705 | (0%) | |||||||||
| Fixed-line service revenue |
263 | 278 | (5%) | |||||||||
| EBITDA |
381 | 406 | (6%) | |||||||||
| EBITDA margin |
36% | 38% | (1.9 p.p.) | |||||||||
| Capex excl licenses |
172.2 | 172.2 | 0.0% | |||||||||
| LTM Capex excl licenses/revenue |
18% | 17% | 0.3 p.p. | |||||||||
| Mobile |
||||||||||||
| Total revenue |
796 | 781 | 2% | |||||||||
| - of which mobile data |
174 | 154 | 13% | |||||||||
| Customers (mln) |
20.9 | 21.4 | (2%) | |||||||||
| - of which data customers (mln) |
11.6 | 10.9 | 6% | |||||||||
| ARPU (EUR) |
11 | 11 | 2% | |||||||||
| MOU (min) |
270 | 267 | 1% | |||||||||
| Data usage (MB) |
1,742 | 1,392 | 25% | |||||||||
| Fixed-line |
||||||||||||
| Total revenue |
269 | 297 | (10%) | |||||||||
| Total voice customers (mln) |
2.8 | 2.8 | (2%) | |||||||||
| ARPU (EUR) |
27.3 | 27.9 | (2%) | |||||||||
| Broadband customers (mln) |
2.3 | 2.2 | 3% | |||||||||
| Broadband ARPU (EUR) |
20.5 | 21.1 | (3%) | |||||||||
| Dual-play customers (mln) |
2.1 | 2.0 | 7% | |||||||||
VimpelCom Ltd. 1Q 2016 | 18

On May 12, 2016, VimpelCom will host an analyst & investor conference call on its 1Q 2016 results at 2:00 pm CET (1:00 pm BST). The call and slide presentation may be accessed at http://www.vimpelcom.com
2:00 pm CET investor and analyst conference call
US call-in number: + 1 (877) 280 1254
Confirmation Code: 7526428
International call-in number: + 1 (646) 254 3388
Confirmation Code: 7526428
The conference call replay and the slide presentations webcast will be available until May 25, 2016. The slide presentation will also be available for download on VimpelCom’s website.
Investor and analyst call replay
US Replay Number: +1 (866) 932 5017
Confirmation Code: 9715424
UK Replay Number: 0 800 358 7735
Confirmation Code: 9715424
CONTACT INFORMATION
| INVESTOR RELATIONS
Bart Morselt Tel: +31 20 79 77 200 (Amsterdam) |
MEDIA AND PUBLIC RELATIONS
Neil Moorhouse Tel: +31 20 79 77 200 (Amsterdam) |
VimpelCom Ltd. 1Q 2016 | 19

DISCLAIMER
This press release contains “forward-looking statements”, as the phrase is defined in Section 27A of the U.S. Securities Act of 1933, as amended, and Section 21E of the U.S. Securities Exchange Act of 1934, as amended. Forward-looking statements are not historical facts, and include statements relating to, among other things; the Company’s stated 2016 performance targets; future market developments and trends; expected synergies and timing of completion of the Italy joint venture and the Warid Telecom transaction; operational and network development and network investment, including expectations regarding the roll out and benefits of 4G/LTE in Russia and Italy, anticipated timing of roll-out and benefits from 3G services in Algeria, Pakistan and Ukraine and the Company’s ability to realize its targets and strategic initiatives in the various countries of operation. The forward-looking statements included in this release are based on management’s best assessment of the Company’s strategic and financial position and of future market conditions, trends and other potential developments. These discussions involve risks and uncertainties. The actual outcome may differ materially from these statements as a result of continued volatility in the economies in our markets, unforeseen developments from competition, governmental regulation of the telecommunications industries, general political uncertainties in our markets, government investigations or other regulatory actions and/or litigation with third parties, failure to satisfy or waive the conditions to completion of all or any of the Italy joint venture and the Warid Telecom transaction, failure to obtain the requisite regulatory approvals or the receipt of approvals on terms not acceptable to the parties to these transactions, failure of the expected benefits of the Italy joint venture and the Warid Telecom transaction to materialize as expected or at all due to, among other things, the parties’ inability to successfully implement integration strategies or otherwise realize the anticipated synergies, and other risks beyond the parties’ control and failure to meet expectations regarding various strategic initiatives, including, but not limited to, the performance transformation program. Certain other factors that could cause actual results to differ materially from those discussed in any forward-looking statements include the risk factors described in the Company’s Annual Report on Form 20-F for the year ended December 31, 2015 filed with the SEC and other public filings made by the Company with the SEC. The forward-looking statements speak only as of the date hereof, and the Company disclaims any obligation to update them or to announce publicly any revision to any of the forward-looking statements contained in this release, or to make corrections to reflect future events or developments.
ABOUT VIMPELCOM
VimpelCom (NASDAQ: VIP) is an international communications and technology company driven by a vision to unlock new opportunities for customers as they navigate the digital world. Present in some of the world’s most dynamic markets, VimpelCom provides more than 200 million customers with voice, fixed broadband, data and digital services. VimpelCom’s heritage as a pioneer in technology is the driving force behind a major transformation focused on bringing the digital world to each and every customer. VimpelCom offers services to customers in 14 markets including Russia, Italy, Algeria, Pakistan, Uzbekistan, Kazakhstan, Ukraine, Bangladesh, Kyrgyzstan, Tajikistan, Armenia, Georgia, Laos, and Zimbabwe. VimpelCom operates under the “Beeline”, “Kyivstar”, “WIND”, “Mobilink”, “banglalink”, “Telecel”, and “Djezzy” brands.

|
Follow us on Twitter @VimpelCom | |

|
visit our blog @ blog.vimpelcom.com | |

|
go to our website @ http://www.vimpelcom.com | |
VimpelCom Ltd. 1Q 2016 | 20

| Attachment A |
VimpelCom ltd interim financial schedules | 22 | ||||
| Attachment B |
Debt overview | 25 | ||||
| Attachment C |
Country details | 26 | ||||
| Attachment D |
Reconciliation tables | 28 | ||||
| Average rates of functional currencies to USD | ||||||
| Attachment E |
WIND Telecomunicazioni group condensed financial statement of income | 30 | ||||
| Attachment F |
Reconciliation of revised financial statements 4Q15 | 31 | ||||
| Attachment G |
32 | |||||
For more information on financial and operating data for specific countries, please refer to the supplementary file Factbook1Q2016.xls on VimpelCom’s website at http://vimpelcom.com/ir/financials/results.wbp
VimpelCom Ltd. 1Q 2016 | 21

ATTACHMENT A: VIMPELCOM LTD INTERIM FINANCIAL SCHEDULES
VIMPELCOM LTD UNAUDITED INTERIM CONSOLIDATED STATEMENTS OF INCOME
| USD mln | 1Q16 | 1Q15 | ||||||
| Total operating revenues |
2,023 | 2,312 | ||||||
| of which other revenues |
26 | 18 | ||||||
| Operating expenses |
||||||||
| Service costs, equipment and accessories |
445 | 514 | ||||||
| Selling, general and administrative expenses |
820 | 860 | ||||||
| Depreciation |
332 | 398 | ||||||
| Amortization |
112 | 127 | ||||||
| Impairment loss |
8 | 98 | ||||||
| Loss on disposals of non-current assets |
2 | 7 | ||||||
| Total operating expenses |
1,719 | 2,004 | ||||||
| Operating (profit)/ loss |
304 | 308 | ||||||
| Finance costs |
180 | 227 | ||||||
| Finance income |
(12 | ) | (12 | ) | ||||
| Other non-operating losses/(gains) |
38 | 9 | ||||||
| Shares of loss/(profit) of associates and joint ventures accounted for using the equity method |
5 | (16 | ) | |||||
| Net foreign exchange (gain)/ loss |
(62 | ) | 108 | |||||
| Profit /(loss) before tax |
155 | (8 | ) | |||||
| Income tax expense |
117 | 80 | ||||||
| Profit/ (loss) from continued operations |
38 | (88 | ) | |||||
| Profit/ (loss) from discontinued operations |
197 | 261 | ||||||
| Profit/(loss) for the period |
235 | 173 | ||||||
| Non-controlling interest |
(46 | ) | 11 | |||||
| The owners of the parent |
189 | 184 | ||||||
VimpelCom Ltd. 1Q 2016 | 22

ATTACHMENT A: VIMPELCOM LTD INTERIM FINANCIAL SCHEDULES
VIMPELCOM LTD UNAUDITED INTERIM CONSOLIDATED STATEMENT OF FINANCIAL POSITION
| USD mln | 31 March 2016 | 31 December 2015 | ||||||
| Assets |
||||||||
| Non-current assets |
||||||||
| Property and equipment |
6,211 | 6,239 | ||||||
| Intangible assets |
2,170 | 2,224 | ||||||
| Goodwill |
4,358 | 4,223 | ||||||
| Investments in associates and joint ventures |
211 | 201 | ||||||
| Deferred tax asset |
150 | 150 | ||||||
| Income Tax advances, non-current |
17 | 28 | ||||||
| Financial assets |
175 | 164 | ||||||
| Other non-financial assets |
118 | 105 | ||||||
| Total non-current assets |
13,410 | 13,334 | ||||||
| Current assets |
||||||||
| Inventories |
91 | 104 | ||||||
| Trade and other receivables |
700 | 677 | ||||||
| Other non-financial assets |
366 | 334 | ||||||
| Current income tax asset |
283 | 259 | ||||||
| Other financial assets |
287 | 395 | ||||||
| Cash and cash equivalents |
2,928 | 3,614 | ||||||
| Total current assets |
4,656 | 5,383 | ||||||
| Assets classified as held for sale |
15,902 | 15,137 | ||||||
| Total assets |
33,969 | 33,854 | ||||||
| Equity and liabilities |
||||||||
| Equity |
||||||||
| Equity attributable to equity owners of the parent |
4,045 | 3,765 | ||||||
| Non-controlling interests |
153 | 129 | ||||||
| Total equity |
4,198 | 3,894 | ||||||
| Non-current liabilities |
||||||||
| Debt |
7,911 | 8,025 | ||||||
| Other financial liabilities |
70 | 70 | ||||||
| Provisions |
355 | 350 | ||||||
| Other non-financial liabilities |
81 | 95 | ||||||
| Deferred tax liability |
380 | 404 | ||||||
| Total non-current liabilities |
8,796 | 8,944 | ||||||
| Current liabilities |
||||||||
| Trade and other payables |
1,508 | 1,768 | ||||||
| Dividends payable to the owners and NCI |
0 | 0 | ||||||
| Debt |
1,775 | 1,519 | ||||||
| Other financial liabilities |
233 | 174 | ||||||
| Other non-financial liabilities |
1,160 | 1,039 | ||||||
| Current income tax payable |
40 | 19 | ||||||
| Provisions |
197 | 1,020 | ||||||
| Total current liabilities |
4,914 | 5,539 | ||||||
| Liabilities associated with assets held for sale |
16,061 | 15,477 | ||||||
| Total equity and liabilities |
33,969 | 33,854 | ||||||
VimpelCom Ltd. 1Q 2016 | 23

ATTACHMENT A: VIMPELCOM LTD FINANCIAL SCHEDULES
VIMPELCOM LTD UNAUDITED INTERIM CONSOLIDATED STATEMENTS OF CASH FLOWS
| USD mln | 1Q16 | 1Q15 | ||||||
| Operating activities |
||||||||
| Profit after tax |
38 | (88) | ||||||
| Income tax expenses |
117 | 80 | ||||||
| Profit before tax |
155 | (8) | ||||||
| Non-cash adjustment to reconcile profit before tax to net operating cash flows: |
| |||||||
| Depreciation |
332 | 398 | ||||||
| Amortization |
112 | 127 | ||||||
| Impairment loss |
8 | 98 | ||||||
| Loss/(Gain) From disposal of non current assets |
1 | 7 | ||||||
| Finance income |
(12 | ) | (12) | |||||
| Finance cost |
180 | 227 | ||||||
| Other non operating losses / (Gains) |
37 | 11 | ||||||
| Net foreign exchange loss / (gain) |
(62 | ) | 108 | |||||
| Share of loss of associates and joint ventures |
5 | (16) | ||||||
| Movements in provisions and pensions |
(816 | ) | (1,148) | |||||
| Changes in working capital |
13 | (74) | ||||||
| Net interest paid |
(202 | ) | (263) | |||||
| Net interest received |
12 | 11 | ||||||
| Income tax paid |
(125 | ) | (342) | |||||
| Changes due to discontinued operations from operating activity |
123 | 112 | ||||||
| Net cash from/(used in) operating activities |
(238 | ) | (764) | |||||
| Proceeds from sale of property and equipment |
2 | 5 | ||||||
| Proceeds from sale of intangible assets |
0 | 1 | ||||||
| Purchase of property, plant and equipment |
(338 | ) | (362) | |||||
| Purchase of licenses |
(44 | ) | (28) | |||||
| Purchase of other intangible assets |
(57 | ) | (59) | |||||
| Outflow for loan granted |
(2 | ) | (100) | |||||
| Inflow from loan granted |
0 | 2 | ||||||
| Inflows/(outflows) from financial assets |
2 | 61 | ||||||
| Inflows/(outflows) from deposits |
76 | (0) | ||||||
| Acquisition of a subsidiary, net of cash acquired |
0 | 0 | ||||||
| Proceeds from sales of share in subsidiaries, net of cash |
0 | 0 | ||||||
| Receipt of dividends |
— | 0 | ||||||
| Discontinued operations in investing activity |
(191 | ) | 530 | |||||
| Net cash from/(used in) investing activities |
(551 | ) | 50 | |||||
| Net proceeds from exercise of share options |
0 | 1 | ||||||
| Acquisition of non-controlling interest |
— | — | ||||||
| Gross proceeds from borrowings |
498 | 803 | ||||||
| Fees paid for the borrowings |
(7 | ) | — | |||||
| Repayment of borrowings |
(456 | ) | (1,425) | |||||
| Dividends paid to equity holders |
— | (0) | ||||||
| Proceeds from sale of treasury stock |
— | — | ||||||
| Dividends paid to non-controlling interests |
— | (57) | ||||||
| Proceeds from sale of non-controlling interests |
— | 2,325 | ||||||
| Discontinued operations in financing activity |
(10 | ) | (509) | |||||
| Net cash from/(used in) financing activities |
26 | 1,137 | ||||||
| Net increase/(decrease) in cash and cash equivalents |
(763 | ) | 423 | |||||
| Cash and cash equivalent at beginning of period |
3,614 | 6,342 | ||||||
| Net foreign exchange difference related to continued operations |
(1 | ) | (266) | |||||
| Net foreign exchange difference related to discontinued operations |
10 | — | ||||||
| Cash and cash equivalent reclassified as Held for Sale at the beginning of the period |
314 | — | ||||||
| Cash and cash equivalent reclassified as Held for Sale at the end of the period |
(246 | ) | — | |||||
| Cash and cash equivalent at end of period |
2,928 | 6,499 | ||||||
VimpelCom Ltd. 1Q 2016 | 24

AS AT MARCH 31, 2016
| Type of debt | Interest rate | Debt currency |
Outstanding debt (mln) |
Outstanding debt (USD mln) |
Maturity date |
Guarantor | ||||||||||||||
| VimpelCom Holdings B.V. |
||||||||||||||||||||
| Notes |
6.2546% | USD | 349 | 349 | 01.03.2017 | PJSC VimpelCom | ||||||||||||||
| Notes |
7.5043% | USD | 1,280 | 1,280 | 01.03.2022 | PJSC VimpelCom | ||||||||||||||
| Notes |
9.0000% | RUB | 12,000 | 177 | 13.02.2018 | PJSC VimpelCom | ||||||||||||||
| Notes |
5.2000% | USD | 571 | 571 | 13.02.2019 | PJSC VimpelCom | ||||||||||||||
| Notes |
5.9500% | USD | 983 | 983 | 13.02.2023 | PJSC VimpelCom | ||||||||||||||
| VimpelCom Amsterdam B.V. |
||||||||||||||||||||
| Loan from AO Alfa Bank |
1 month LIBOR plus 3.15% |
USD | 500 | 500 | 17.04.2017 | VimpelCom Holdings B.V. | ||||||||||||||
| Loan from AO Alfa Bank |
1 month LIBOR plus 3.15% |
USD | 500 | 500 | 03.05.2017 | VimpelCom Holdings B.V. | ||||||||||||||
| Loan from China Development Bank Corporation |
6 month LIBOR plus 3.3% |
USD | 415 | 415 | 21.12.2020 | PJSC VimpelCom | ||||||||||||||
| Loan from HSBC Bank plc |
1.7200% | USD | 206 | 206 | 31.07.2022 | EKN, PJSC VimpelCom | ||||||||||||||
| PJSC VimpelCom |
||||||||||||||||||||
| Loan from VIP Finance Ireland (funded by the issuance of loan participation notes by VIP Finance Ireland) |
9.1250% | USD | 499 | 499 | 30.04.2018 | None | ||||||||||||||
| Loan from VIP Finance Ireland (funded by the issuance of loan participation notes by VIP Finance Ireland) |
7.7480% | USD | 651 | 651 | 02.02.2021 | None | ||||||||||||||
| Loan from UBS (Luxembourg) S.A. (funded by the issuance of loan participation notes by UBS (Luxembourg) S.A.) |
8.2500% | USD | 266 | 266 | 23.05.2016 | None | ||||||||||||||
| RUB denominated bonds |
10.0000% | RUB | 15,052 | 223 | 08.03.2022 | * | None | |||||||||||||
| RUB denominated bonds |
11.9000% | RUB | 25,000 | 370 | 03.10.2025 | ** | None | |||||||||||||
| Loan from Sberbank |
12.7500% | RUB | 43,929 | 650 | 11.04.2018 | None | ||||||||||||||
| Loan from Sberbank |
12.7500% | RUB | 13,889 | 205 | 29.05.2017 | None | ||||||||||||||
| Loan from Sberbank |
11.5500% | RUB | 30,000 | 444 | 29.06.2018 | None | ||||||||||||||
| Loan from HSBC Bank plc, Nordea Bank AB (publ) |
3 month MOSPRIME plus 1.0% |
RUB | 2,962 | 44 | 30.04.2019 | EKN | ||||||||||||||
| Pakistan Mobile Communications Limited (“PMCL”) |
||||||||||||||||||||
| Loan from Habib Bank Limited |
6 months KIBOR + 1.15% |
PKR | 4,500 | 43 | 16.05.2019 | None | ||||||||||||||
| Syndicated loan via MCB Bank Limited |
3 months KIBOR + 1.25% |
PKR | 3,500 | 33 | 28.11.2017 | None | ||||||||||||||
| Syndicated loan via MCB Bank Limited |
6 months KIBOR + 1.25% |
PKR | 7,000 | 67 | 16.05.2019 | None | ||||||||||||||
| Loan from United Bank Limited |
6 months KIBOR + 1.10% |
PKR | 4,000 | 38 | 16.05.2021 | None | ||||||||||||||
| Sukuk Certificates |
3 months KIBOR + 0.88% |
PKR | 6,900 | 66 | 22.12.2019 | None | ||||||||||||||
| Syndicated loan via Allied Bank Limited |
6 months KIBOR + 1.00% |
PKR | 3,619 | 35 | 26.11.2018 | None | ||||||||||||||
| Banglalink Digital Communications Ltd. (“BDC”) |
||||||||||||||||||||
| Senior Notes |
8.6250% | USD | 300 | 300 | 06.05.2019 | None | ||||||||||||||
| Omnium Telecom Algeria SpA |
||||||||||||||||||||
| Syndicated Loan Facility |
Bank of Algeria Re-Discount Rate + 2.0% |
DZD | 50,000 | 461 | 30.09.2019 | None | ||||||||||||||
|
Other loans, equipment financing and capital lease obligations |
310 | |||||||||||||||||||
| * | Subject to investor put option at March 17, 2017 |
| ** | Subject to investor put option at October 13, 2017 |
Note: the table does not include USD 1.2 billion of indebtedness as a result of the issuance of bonds by GTH Finance B.V. in April 2016.
VimpelCom Ltd. 1Q 2016 | 25

CUSTOMERS
| Mobile | Fixed-line broadband | |||||||||||||||||||||||
| million | 1Q16 | 1Q15 | YoY | 1Q16 | 1Q15 | YoY | ||||||||||||||||||
| Russia |
57.7 | 55.7 | 4 | % | 2.2 | 2.3 | (4 | %) | ||||||||||||||||
| Algeria |
16.7 | 17.1 | (2 | %) | — | — | — | |||||||||||||||||
| Pakistan |
38.1 | 38.2 | (0 | %) | — | — | — | |||||||||||||||||
| Bangladesh |
31.6 | 31.8 | (1 | %) | — | — | — | |||||||||||||||||
| Emerging markets |
86.3 | 87.1 | (1 | %) | — | — | — | |||||||||||||||||
| Ukraine |
25.3 | 26.1 | (3 | %) | 0.8 | 0.8 | (1 | %) | ||||||||||||||||
| Kazakhstan |
9.2 | 9.6 | (4 | %) | 0.2 | 0.2 | 9 | % | ||||||||||||||||
| Uzbekistan |
9.5 | 10.4 | (8 | %) | 0.00 | 0.01 | (100 | %) | ||||||||||||||||
| Armenia |
0.8 | 0.8 | 7 | % | 0.1 | 0.2 | (5 | %) | ||||||||||||||||
| Tajikistan |
1.2 | 1.3 | (6 | %) | — | — | — | |||||||||||||||||
| Georgia |
1.2 | 1.3 | (4 | %) | — | — | — | |||||||||||||||||
| Kyrgystan |
2.6 | 2.7 | (6 | %) | — | — | — | |||||||||||||||||
| Eurasia |
49.8 | 52.1 | (4 | %) | 1.2 | 1.2 | (1 | %) | ||||||||||||||||
| Laos |
0.2 | 0.2 | 4 | % | — | — | ||||||||||||||||||
| Total |
194.0 | 195.1 | (1 | %) | 3.4 | 3.5 | (3 | %) | ||||||||||||||||
| Italy |
20.9 | 21.4 | (2 | %) | 2.3 | 2.2 | 3 | % | ||||||||||||||||
UZBEKISTAN
| UZS bln | 1Q16 | 1Q15 | YoY | |||||||||
| Total revenue |
469 | 409 | 15% | |||||||||
| Mobile service revenue |
465 | 405 | 15% | |||||||||
| of which mobile data |
90 | 84 | 7% | |||||||||
| Fixed-line service revenue |
3 | 3 | 4% | |||||||||
| EBITDA |
285 | 257 | 11% | |||||||||
| EBITDA margin |
61% | 63% | (1.9 p.p.) | |||||||||
| Capex excl licenses |
85 | (0) | n.m. | |||||||||
| LTM Capex excl licenses /revenue |
12% | 8% | 4.0 p.p | |||||||||
| Mobile |
||||||||||||
| Customers (mln) |
9.5 | 10.4 | (8%) | |||||||||
| Of which mobile data customers |
4.4 | 5.2 | (16%) | |||||||||
| ARPU (UZS) |
15,877 | 12,883 | 23% | |||||||||
| MOU (min) |
472 | 498 | (5%) | |||||||||
| Data usage (MB) |
218 | 154 | 42% | |||||||||
ARMENIA
| AMD mln | 1Q16 | 1Q15 | YoY | |||||||||
| Total revenue |
11,010 | 12,528 | (12%) | |||||||||
| Mobile service revenue |
4,847 | 5,355 | (9%) | |||||||||
| - of which mobile data |
709 | 633 | 12% | |||||||||
| Fixed service revenue |
5,774 | 6,943 | (17%) | |||||||||
| EBITDA |
3,942 | 4,415 | (11%) | |||||||||
| EBITDA margin |
36% | 35% | 0.6 p.p | |||||||||
| Capex excl licenses |
247 | 975 | (75%) | |||||||||
| LTM Capex excl licenses /revenue |
14% | 12% | 2.2 p.p. | |||||||||
| Mobile |
||||||||||||
| Customers (mln) |
0.8 | 0.8 | 7% | |||||||||
| -of which mobile data customers |
0.4 | 0.4 | 5% | |||||||||
| ARPU (USD) |
1,861 | 2,229 | (16%) | |||||||||
| MOU (min) |
335 | 341 | (2%) | |||||||||
| Data usage(MB) |
1,504 | 1,248 | 21% | |||||||||
VimpelCom Ltd. 1Q 2016 | 26

TAJIKISTAN
| USD mln | 1Q16 | 1Q15 | YoY | |||||||||
| Total revenue |
19 | 26 | (27%) | |||||||||
| Mobile service revenue |
19 | 26 | (27%) | |||||||||
| - of which mobile data |
1 | 1 | (32%) | |||||||||
| EBITDA |
12 | 14 | (15%) | |||||||||
| EBITDA margin |
61.3% | 52.8% | 8.5 p.p | |||||||||
| Capex excl licenses |
(0) | 0 | n.m. | |||||||||
| LTM Capex excl licenses/revenue |
13% | 12% | 1.3 p.p | |||||||||
| Mobile |
||||||||||||
| Customers (mln) |
1.2 | 1.3 | (6%) | |||||||||
| - of which mobile data customers (mln) |
0.5 | 0.5 | 3% | |||||||||
| ARPU (USD) |
5.4 | 6.8 | (20%) | |||||||||
| MOU (min) |
279 | 263 | 6% | |||||||||
| Data usage (MB) |
265 | 89 | 199% | |||||||||
| GEORGIA | ||||||||||||
| GEL mln | 1Q16 | 1Q15 | YoY | |||||||||
| Total revenue |
25 | 30 | (17%) | |||||||||
| Mobile service revenue |
25 | 26 | (7%) | |||||||||
| -of which mobile data |
1 | 1 | 35% | |||||||||
| Fixed-line service revenue |
0 | 3 | (100%) | |||||||||
| EBITDA |
5 | 4 | 14% | |||||||||
| EBITDA margin |
19% | 14% | 5.2 p.p | |||||||||
| Capex excl licenses |
3 | 7 | (57%) | |||||||||
| LTM Capex excl licenses /revenue |
39% | 26% | 12.9 p.p | |||||||||
| Mobile |
||||||||||||
| Customers (mln) |
1.2 | 1.3 | (4%) | |||||||||
| -data customers |
0.4 | 0.5 | (3%) | |||||||||
| ARPU (GEL) |
6 | 7 | (7%) | |||||||||
| MOU (min) |
234 | 226 | 4% | |||||||||
| Data usage (MB) |
597 | 89 | 571% | |||||||||
| KYRGYZSTAN | ||||||||||||
| KGZ mln | 1Q16 | 1Q15 | YoY | |||||||||
| Total revenue |
2,332 | 2,340 | (0%) | |||||||||
| Mobile service revenue |
2,316 | 2,318 | (0%) | |||||||||
| - of which mobile data |
304 | 291 | 4% | |||||||||
| EBITDA |
1,279 | 1,253 | 2% | |||||||||
| EBITDA margin |
54.8% | 53.6% | 1.3 p.p | |||||||||
| Capex excl licenses |
152 | 168 | (10%) | |||||||||
| LTM Capex excl licenses/revenue |
13% | 15% | (1.1 p.p) | |||||||||
| Mobile |
||||||||||||
| Customers (mln) |
2.6 | 2.7 | (6%) | |||||||||
| - of which mobile data customers (mln) |
1.5 | 1.6 | (6%) | |||||||||
| ARPU (KGZ) |
289 | 281 | 3% | |||||||||
| MOU (min) |
206 | 261 | (21%) | |||||||||
| Data usage (MB) |
422 | 184 | 130% | |||||||||
VimpelCom Ltd. 1Q 2016 | 27

ATTACHMENT D: RECONCILIATION TABLES
RECONCILIATION OF CONSOLIDATED EBITDA OF VIMPELCOM
| USD mln | 1Q16 | 1Q15 | ||||||
| Unaudited |
||||||||
| EBITDA |
758 | 938 | ||||||
| Depreciation |
(332 | ) | (398 | ) | ||||
| Amortization |
(112 | ) | (127 | ) | ||||
| Impairment loss |
(8 | ) | (98 | ) | ||||
| Loss on disposals of non-current assets |
(1 | ) | (7 | ) | ||||
| EBIT |
304 | 308 | ||||||
| Financial Income and Expenses |
(168 | ) | (215 | ) | ||||
| - including finance income |
12 | 12 | ||||||
| - including finance costs |
(180 | ) | (227 | ) | ||||
| Net foreign exchange (loss)/gain and others |
19 | (101 | ) | |||||
| - including Other non-operating (losses)/gains |
(38 | ) | (9 | ) | ||||
| - including Shares of loss of associates and joint ventures accounted for using the equity method |
(5 | ) | 16 | |||||
| - including Net foreign exchange gain |
62 | (108 | ) | |||||
| EBT |
155 | (8 | ) | |||||
| Income tax expense |
117 | 80 | ||||||
| Profit/ (loss) from discontinued operations |
197 | 261 | ||||||
| Profit/(loss) for the year |
235 | 173 | ||||||
| Profit/(loss) for the year attributable to non-controlling interest |
46 | (11 | ) | |||||
| Profit for the year attributable to the owners of the parent |
189 | 184 | ||||||
VimpelCom Ltd. 1Q 2016 | 28

RECONCILIATION OF CONSOLIDATED REPORTED AND UNDERLYING EBITDA OF VIMPELCOM
| USD mln, unaudited | 1Q16 | 1Q15 | ||||||
| EBITDA |
758 | 938 | ||||||
|
|
|
|
|
|||||
| Transformation costs, of which |
44 | — | ||||||
| other transformation costs at OpCo level |
9 | |||||||
| other transformation costs at HQ level |
35 | |||||||
| Other exceptional items in OpCos, of which |
(4 | ) | 7 | |||||
| Reversal in tax provisions in Ukraine |
(1 | ) | ||||||
| Reversal of legal expenses and bad debt in Uzbekistan |
(3 | ) | ||||||
| Sim re-verification costs in Pakistan |
7 | |||||||
|
|
|
|
|
|||||
| Total exceptional items |
40 | 7 | ||||||
| EBITDA underlying |
799 | 945 | ||||||
VimpelCom Ltd. 1Q 2016 | 29

RECONCILIATION OF VIMPELCOM CONSOLIDATED NET DEBT
| USD mln | 31 March 2016 | 31 December 2015 | 31 March 2015 | |||||||||
| Net debt |
6,407 | 5,496 | 5,883 | |||||||||
| Cash and cash equivalents |
2,928 | 3,614 | 6,135 | |||||||||
| Long - term and short-term deposits |
351 | 434 | 118 | |||||||||
| Gross debt |
9,686 | 9,544 | 12,136 | |||||||||
| Interest accrued related to financial liabilities |
148 | 179 | 157 | |||||||||
| Fair value adjustment |
— | — | — | |||||||||
| Other unamortised adjustments to financial liabilities (fees, discounts etc.) |
57 | 60 | 60 | |||||||||
| Derivatives not designated as hedges |
50 | 2 | — | |||||||||
| Other liabilities at amortized costs |
— | — | 271 | |||||||||
| Derivatives designated as hedges |
48 | 3 | 33 | |||||||||
| Total other financial liabilities |
9,989 | 9,788 | 12,657 | |||||||||
RATES OF FUNCTIONAL CURRENCIES TO USD1
| Average rates | Closing rates | |||||||||||||||||||||||
| 1Q16 | 1Q15 | YoY | 1Q16 | 1Q15 | YoY | |||||||||||||||||||
| Russian Ruble |
74.63 | 62.19 | 20.0 | % | 67.61 | 58.46 | 15.6 | % | ||||||||||||||||
| Euro |
0.91 | 0.89 | 2.0 | % | 0.88 | 0.93 | -5.5 | % | ||||||||||||||||
| Algerian Dinar |
107.82 | 93.21 | 15.7 | % | 108.39 | 97.70 | 10.9 | % | ||||||||||||||||
| Pakistan Rupee |
104.74 | 101.41 | 3.3 | % | 104.71 | 101.93 | 2.7 | % | ||||||||||||||||
| Bangladeshi Taka |
78.47 | 77.85 | 0.8 | % | 78.38 | 77.81 | 0.7 | % | ||||||||||||||||
| Ukrainian Hryvnia |
25.65 | 21.12 | 21.5 | % | 26.22 | 23.44 | 11.9 | % | ||||||||||||||||
| Kazakh Tenge |
355.12 | 184.58 | 92.4 | % | 343.06 | 185.65 | 84.8 | % | ||||||||||||||||
| Uzbekistan Som |
2,843.5 | 2,450.6 | 16.0 | % | 2,876.7 | 2,490.2 | 15.5 | % | ||||||||||||||||
| Armenian Dram |
488.59 | 477.11 | 2.4 | % | 480.79 | 471.13 | 2.1 | % | ||||||||||||||||
| Kyrgyz Som |
74.21 | 60.82 | 22.0 | % | 70.02 | 63.87 | 9.6 | % | ||||||||||||||||
| Georgian Lari |
2.44 | 2.07 | 17.5 | % | 2.37 | 2.23 | 6.2 | % | ||||||||||||||||
| 1) | Functional currency in Tajikistan is USD |
ATTACHMENT E: WIND TELECOMUNICAZIONI GROUP CONDENSED STATEMENTS OF INCOME
| EUR mln | 1Q16 | 1Q15 | YoY | |||||||||
| Total Revenue |
1,064 | 1,078 | (1%) | |||||||||
| EBITDA |
381 | 406 | (6%) | |||||||||
| D&A |
(280 | ) | 189 | n.m. | ||||||||
| EBIT |
101 | 596 | n.m. | |||||||||
| Financial Income and expenses |
(61 | ) | (77 | ) | n.m. | |||||||
| EBT |
40 | 519 | n.m. | |||||||||
| Income Tax |
(29 | ) | (62 | ) | n.m. | |||||||
| Net profit/(loss) |
11 | 456 | n.m. | |||||||||
VimpelCom Ltd. 1Q 2016 | 30

ATTACHMENT F: RECONCILIATION OF REVISED FINANCIAL STATEMENTS 4Q15
REVISED STATEMENT OF FINANCIAL POSITION
Subsequent to the 4Q 2015 earnings release certain non-significant accounting adjustments were made to the financial statements, which are reflected in the tables below. References to 4Q 2015 figures throughout this earnings release reflect the figures as revised below.
| USD mln | 4Q15 as reported on February 17, 2016 |
Russia: reversal of restructuring provision |
Italy: reversal of deferred tax liability on a |
Uzbekistan reclassification |
4Q15 Revised |
|||||||||||||||
| Assets |
||||||||||||||||||||
| Total non-current assets |
13,317 | 17 | 13,334 | |||||||||||||||||
| Total current assets |
5,387 | (4 | ) | 5,383 | ||||||||||||||||
| Assets classified as held for sale |
15,137 | 15,137 | ||||||||||||||||||
| Total assets |
33,841 | (4 | ) | 17 | 33,854 | |||||||||||||||
| Equity and liabilities |
||||||||||||||||||||
| Equity attributable to equity owners of the parent |
3,729 | 14 | 22 | 3,765 | ||||||||||||||||
| Non-controlling interests |
129 | 129 | ||||||||||||||||||
| Total equity |
3,858 | 14 | 22 | 3,894 | ||||||||||||||||
| Total non-current liabilities |
8,874 | 70 | 8,944 | |||||||||||||||||
| Total current liabilities |
5,633 | (18 | ) | (5 | ) | (70 | ) | 5,539 | ||||||||||||
| Liabilities associated with assets held for sale |
15,477 | 15,477 | ||||||||||||||||||
| Total equity and liabilities |
33,841 | (4 | ) | 17 | 33,854 | |||||||||||||||
REVISED STATEMENT OF INCOME
| USD mln | 4Q15 as reported on February 17, 2016 |
Russia: reversal of provision |
Italy: reversal of liability on a loan |
4Q15 Revised |
||||||||||||
| Total operating revenues |
9,625 | 9,625 | ||||||||||||||
| Operating expenses |
9,119 | (18 | ) | 9,101 | ||||||||||||
| Operating profit |
506 | 18 | 524 | |||||||||||||
| Profit before tax |
(613 | ) | 18 | (595 | ) | |||||||||||
| Income tax expense |
238 | 4 | (22 | ) | 220 | |||||||||||
| Profit for the period |
(589 | ) | 14 | 22 | (553 | ) | ||||||||||
| Attributable to: |
||||||||||||||||
| Non-controlling interest |
103 | 102 | ||||||||||||||
| Net income attributable to VimpelCom shareholders |
(691 | ) | 14 | 22 | (655 | ) | ||||||||||
VimpelCom Ltd. 1Q 2016 | 31

ARPU (Average Revenue per User) is calculated by dividing service revenue for the relevant period, including revenue from voice-, roaming-, interconnect-, and value added services (including mobile data, SMS, MMS), but excluding revenue from visitors roaming, connection fees, sales of handsets and accessories and other non-service revenue, by the average number of customers during the period and dividing by the number of months in that period. For Italy Business Unit, visitors roaming revenue is included into service revenue for ARPU calculation.
Data customers are the customer contracts that served as a basis for revenue generating activity in the three months prior to the measurement date, as a result of activities including monthly Internet access using FTTB and xDSL technologies as well as mobile Internet access via WiFi and USB modems using 2.5G/3G/4G/HSPA+ technologies. The Italy Business Unit measures fixed data customers based on the number of active contracts signed and mobile data includes customers that have performed at least one mobile Internet event in the previous month. The Russia Business Unit includes IPTV activities. For Kazakhstan and Eurasia subsidiaries, mobile data customers are those who have performed at least one mobile Internet event in the three-month period prior to the measurement date. For Algeria, data customers are 3G customers who have performed at least one mobile data event on 3G network in the previous four months.
Capital expenditures (Capex) are purchases of new equipment, new construction, upgrades, software, other long lived assets and related reasonable costs incurred prior to intended use of the non-current asset, accounted at the earliest event of advance payment or delivery. Long-lived assets acquired in business combinations are not included in capital expenditures.
EBIT is a non-GAAP measure and is calculated as EBITDA plus depreciation, amortization and impairment loss. Our management uses EBIT as a supplemental performance measure and believes that it provides useful information of earnings of the Company before making accruals for financial income and expenses and net foreign exchange (loss)/gain and others. Reconciliation of EBIT to net income attributable to VimpelCom Ltd., the most directly comparable IFRS financial measure, is presented above.
EBITDA is a non-GAAP financial measure. EBITDA is defined as earnings before interest, tax, depreciation and amortization. VimpelCom calculates EBITDA as operating income before depreciation, amortization, loss from disposal of non-current assets and impairment loss and includes certain non-operating losses and gains mainly represented by litigation provisions for all of its Business Units except for its Russia Business Unit. The Russia Business Unit’s EBITDA is calculated as operating income before depreciation, amortization, loss from disposal of non-current assets and impairment loss. EBITDA should not be considered in isolation or as a substitute for analyses of the results as reported under IFRS. Our management uses EBITDA and EBITDA margin as supplemental performance measures and believes that EBITDA and EBITDA margin provide useful information to investors because they are indicators of the strength and performance of the Company’s business operations, including its ability to fund discretionary spending, such as capital expenditures, acquisitions and other investments, as well as indicating its ability to incur and service debt. In addition, the components of EBITDA include the key revenue and expense items for which the Company’s operating managers are responsible and upon which their performance is evaluated. EBITDA also assists management and investors by increasing the comparability of the Company’s performance against the performance of other telecommunications companies that provide EBITDA information. This increased comparability is achieved by excluding the potentially inconsistent effects between periods or companies of depreciation, amortization and impairment losses, which items may significantly affect operating income between periods. However, our EBITDA results may not be directly comparable to other companies’ reported EBITDA results due to variances and adjustments in the components of EBITDA (including our calculation of EBITDA) or calculation measures. Additionally, a limitation of EBITDA’s use as a performance measure is that it does not reflect the periodic costs of certain capitalized tangible and intangible assets used in generating revenue or the need to replace capital equipment over time. Reconciliation of EBITDA to net income attributable to VimpelCom Ltd., the most directly comparable IFRS financial measure, is presented above.
EBITDA margin is calculated as EBITDA divided by total revenue, expressed as a percentage.
Households passed are households located within buildings, in which indoor installation of all the FTTB equipment necessary to install terminal residential equipment has been completed.
MBOU (Megabyte of use) is calculated by dividing the total data traffic by the average mobile data customers during the period.
VimpelCom Ltd. 1Q 2016 | 32

MFS (Mobile financial services) is a variety of innovative services, such as mobile commerce or m-commerce, that use a mobile phone as the primary payment user interface and allow mobile customers to conduct money transfers to pay for items such as goods at an online store, utility payments, fines and state fees, loan repayments, domestic and international remittances, mobile insurance and tickets for air and rail travel, all via their mobile phone.
MNP (Mobile number portability) is a facility provided by telecommunications operators, which enables customers to keep their telephone numbers when they change operators.
Mobile customers are SIM-cards registered in the system as of a measurement date, users of which generated revenue at any time during the three months prior to the measurement date. This includes revenue coming from any incoming and outgoing calls, subscription fee accruals, debits related to service, outgoing SMS, Multimedia Messaging Service (referred to as MMS), data transmission and receipt sessions, but does not include incoming SMS and MMS sent by VimpelCom or abandoned calls. VimpelCom’s total number of mobile customers also includes SIM-cards for use of mobile Internet service via USB modems and customers for WiFi. The number for Italy is based on SIM-cards, users of which generated revenue at any time during the twelve months prior to the measurement date.
MOU (Monthly Average Minutes of Use per User) is generally calculated by dividing the total number of minutes of usage for incoming and outgoing calls during the relevant period (excluding guest roamers) by the average number of mobile customers during the period and dividing by the number of months in that period. Algeria, Pakistan and Bangladesh units measure MOU based on billed minutes.
Net debt is a non-GAAP financial measure and is calculated as the sum of interest bearing long-term debt and short-term debt minus cash and cash equivalents, long-term and short-term deposits and fair value hedges. The Company believes that net debt provides useful information to investors because it shows the amount of debt outstanding to be paid after using available cash and cash equivalent and long-term and short-term deposits. Net debt should not be considered in isolation as an alternative to long-term debt and short-term debt, or any other measure of the company financial position. Reconciliation of net debt to long-term debt and short-term debt, the most directly comparable IFRS financial measures, is presented above in the reconciliation tables section.
Net foreign exchange (loss)/gain and others represents the sum of Net foreign exchange (loss)/gain, Equity in net (loss)/gain of associates and Other (expense)/income, net (primarily losses from derivative instruments), and is adjusted for certain non-operating losses and gains mainly represented by litigation provisions. Our management uses Net foreign exchange (loss)/gain and others as a supplemental performance measure and believes that it provides useful information about the impact of our debt denominated in foreign currencies on our results of operations due to fluctuations in exchange rates, the performance of our equity investees and other losses and gains the Company needs to manage the business.
NPS (Net Promoter Score) is the methodology VimpelCom uses to measure customer satisfaction.
Operational expenses (Opex) represents service costs and selling, general and administrative expenses.
Organic growth in revenue and EBITDA are non-GAAP financial measures that reflect changes in Revenue and EBITDA excluding foreign currency movements and other factors, such as businesses under liquidation, disposals, mergers and acquisitions.
Underlying growth Revenue and EBITDA also excludes MTR reductions and one-offs. We believe investors should consider these measures as they are more indicative of our ongoing performance and management uses these measures to evaluate the Company’s operational results and trends.
Reportable segments: the Company identified Russia, Italy, Algeria, Pakistan, Bangladesh, Ukraine and Eurasia based on the business activities in different geographical areas. Intersegment revenue is eliminated in consolidation.
Service costs represent costs directly associated with revenue generating activity such as traffic related expenses, costs of content and sim-cards as well as costs of handsets, telephone equipment and accessories sold.
Selling, general and administrative expenses represent expenses associated with customer acquisition and retention activities, network and IT maintenance, regular frequency payment, professional and consulting support, rent of premises, utilities, personnel and outsourcing as well as other general and administrative expenses. These expenses do not include personnel costs that have been capitalized as part of long-lived assets.
VimpelCom Ltd. 1Q 2016 | 33
1Q16 Results Presentation Amsterdam – May 12, 2016 Jean-Yves Charlier – Chief Executive Officer Andrew Davies – Chief Financial Officer
Disclaimer This presentation contains “forward-looking statements”, as the phrase is defined in Section 27A of the U.S. Securities Act of 1933, as amended, and Section 21E of the U.S. Securities Exchange Act of 1934, as amended. Forward-looking statements are not historical facts, and include statements relating to, among other things, the Company's anticipated performance for 2016, future market developments and trends. The forward-looking statements included in this presentation are based on management’s best assessment of the Company’s strategic and financial position and of future market conditions, trends and other potential developments. These discussions involve risks and uncertainties. The actual outcome may differ materially from these statements as a result of: continued volatility in the economies in our markets; unforeseen developments from competition; governmental regulation of the telecommunications industries; general political uncertainties in our markets; government investigations and/or litigation with third parties; failure to realize synergies and/or the timing of completion of the Italy joint venture and the Warid Telecom transaction; failure to meet expectations regarding operational and network development and network investment, including expectations regarding the roll-out and the benefits of 4G/LTE in Russia and Italy, anticipated timing of roll-out and benefits from 3G services in Algeria, Pakistan and Ukraine, and failure to meet expectations regarding various strategic initiatives, including, but not limited to, the performance transformation program and/or changes to the capital structure. Certain other factors that could cause actual results to differ materially from those discussed in any forward-looking statements include the risk factors described in the Company’s Annual Report on Form 20-F for the year ended December 31, 2015 filed with the U.S. Securities and Exchange Commission (the “SEC”) and other public filings made by the Company with the SEC. The forward-looking statements speak only as of the date hereof, and the Company disclaims any obligation to update them or to announce publicly any revision to any of the forward-looking statements contained in this presentation, or to make corrections to reflect future events or developments.
1Q16 Results update - speakers and agenda Jean-Yves Charlier – Chief Executive Officer Group highlights Financial highlights Andrew Davies – Chief Financial Officer Group results review Country results review Group FY16 guidance Jean-Yves Charlier – Chief Executive Officer Final remarks Q&A session
Revenue and underlying EBITDA back to organic growth, driven by strong EM, Ukraine and Uzbekistan, partially offset by Russia Highlights 1Q16 Italy JV regulatory review process ongoing; Phase II started, transaction expected to complete around year end Performance transformation accelerating and on track GTH Finance B.V. issued USD 1.2 billion bonds guaranteed by VimpelCom Holdings B.V. to refinance the shareholder loan Mobilink and Warid Telecom merger in Pakistan received first of four regulatory approvals; closing expected around the end of 2Q16 Settlements with the SEC/DOJ/OM regarding Uzbekistan investigation entered into and payments completed Strong organic mobile data revenue growth of 27% YoY supported by all operations
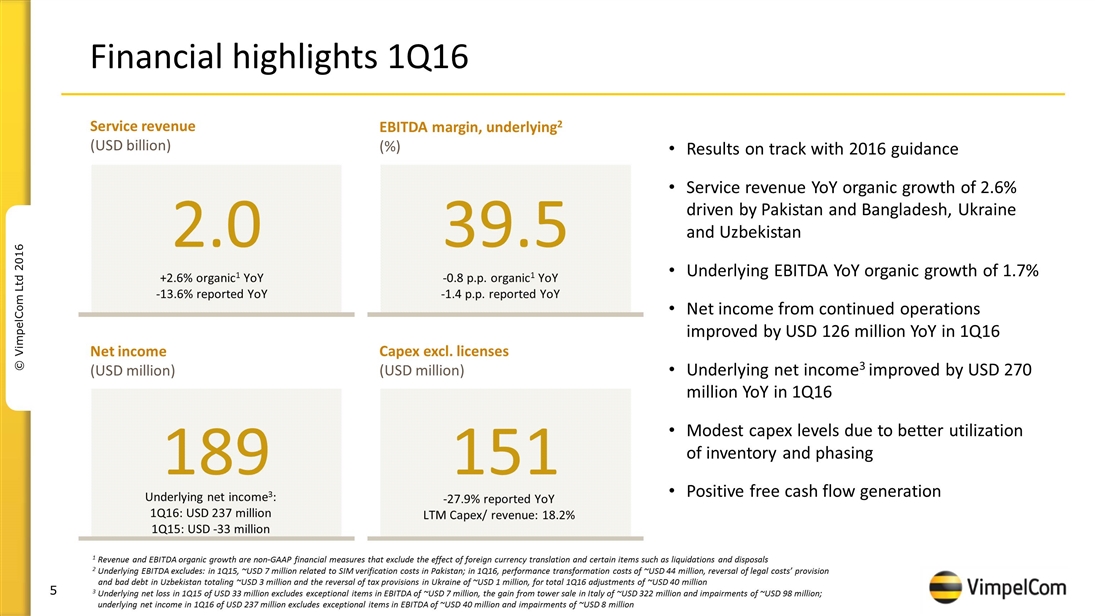
Financial highlights 1Q16 1 Revenue and EBITDA organic growth are non-GAAP financial measures that exclude the effect of foreign currency translation and certain items such as liquidations and disposals 2 Underlying EBITDA excludes: in 1Q15, ~USD 7 million related to SIM verification costs in Pakistan; in 1Q16, performance transformation costs of ~USD 44 million, reversal of legal costs’ provision and bad debt in Uzbekistan totaling ~USD 3 million and the reversal of tax provisions in Ukraine of ~USD 1 million, for total 1Q16 adjustments of ~USD 40 million 3 Underlying net loss in 1Q15 of USD 33 million excludes exceptional items in EBITDA of ~USD 7 million, the gain from tower sale in Italy of ~USD 322 million and impairments of ~USD 98 million; underlying net income in 1Q16 of USD 237 million excludes exceptional items in EBITDA of ~USD 40 million and impairments of ~USD 8 million Service revenue (USD billion) 2.0 Net income (USD million) EBITDA margin, underlying2 (%) Results on track with 2016 guidance Service revenue YoY organic growth of 2.6% driven by Pakistan and Bangladesh, Ukraine and Uzbekistan Underlying EBITDA YoY organic growth of 1.7% Net income from continued operations improved by USD 126 million YoY in 1Q16 Underlying net income3 improved by USD 270 million YoY in 1Q16 Modest capex levels due to better utilization of inventory and phasing Positive free cash flow generation 189 39.5 -0.8 p.p. organic1 YoY -1.4 p.p. reported YoY 151 +2.6% organic1 YoY -13.6% reported YoY Capex excl. licenses (USD million) -27.9% reported YoY LTM Capex/ revenue: 18.2% Underlying net income3: 1Q16: USD 237 million 1Q15: USD -33 million
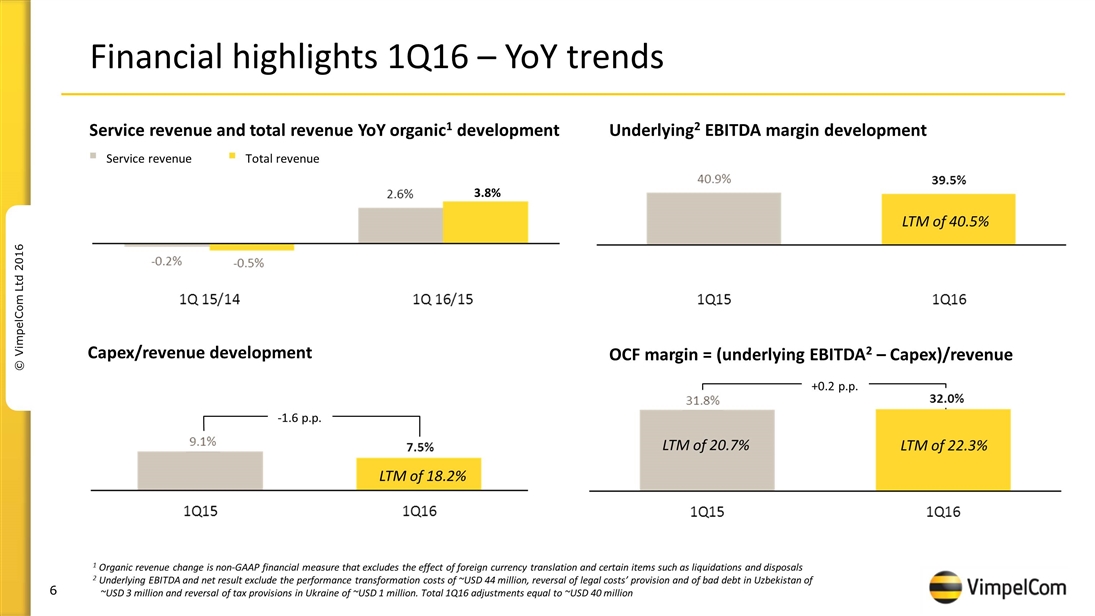
Financial highlights 1Q16 – YoY trends 1 Organic revenue change is non-GAAP financial measure that excludes the effect of foreign currency translation and certain items such as liquidations and disposals 2 Underlying EBITDA and net result exclude the performance transformation costs of ~USD 44 million, reversal of legal costs’ provision and of bad debt in Uzbekistan of ~USD 3 million and reversal of tax provisions in Ukraine of ~USD 1 million. Total 1Q16 adjustments equal to ~USD 40 million -1.6 p.p. +0.2 p.p. Service revenue and total revenue YoY organic1 development Underlying2 EBITDA margin development Capex/revenue development OCF margin = (underlying EBITDA2 – Capex)/revenue Service revenue Total revenue 3.8% LTM of 22.3% LTM of 18.2% LTM of 40.5% LTM of 20.7%
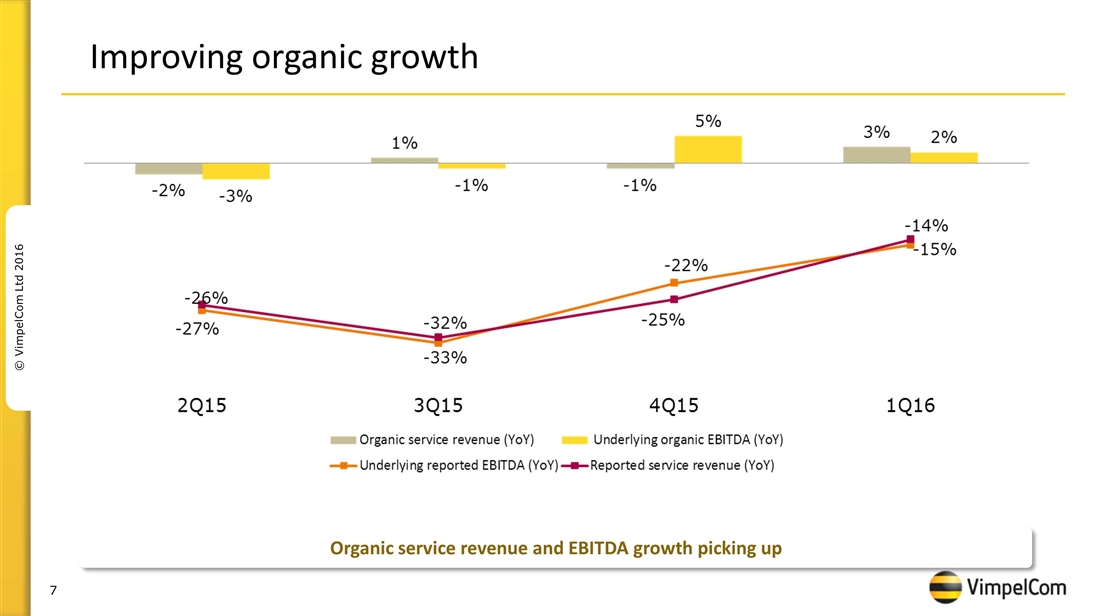
Improving organic growth Organic service revenue and EBITDA growth picking up
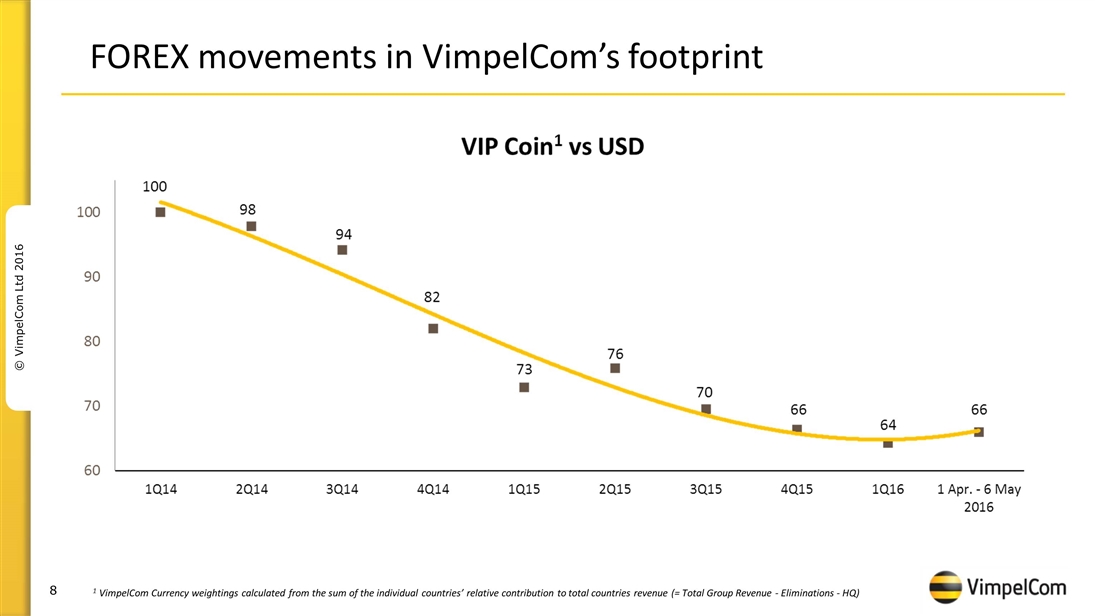
FOREX movements in VimpelCom’s footprint 1 VimpelCom Currency weightings calculated from the sum of the individual countries’ relative contribution to total countries revenue (= Total Group Revenue - Eliminations - HQ)
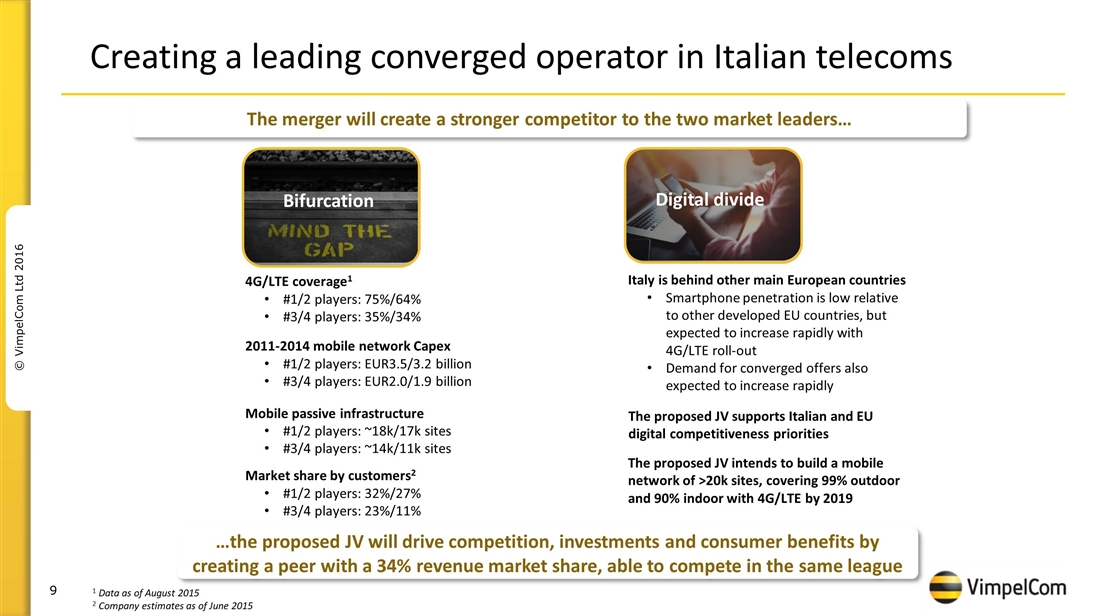
Creating a leading converged operator in Italian telecoms …the proposed JV will drive competition, investments and consumer benefits by creating a peer with a 34% revenue market share, able to compete in the same league The merger will create a stronger competitor to the two market leaders… Digital divide Bifurcation 4G/LTE coverage1 #1/2 players: 75%/64% #3/4 players: 35%/34% 2011-2014 mobile network Capex #1/2 players: EUR3.5/3.2 billion #3/4 players: EUR2.0/1.9 billion Mobile passive infrastructure #1/2 players: ~18k/17k sites #3/4 players: ~14k/11k sites Market share by customers2 #1/2 players: 32%/27% #3/4 players: 23%/11% Italy is behind other main European countries Smartphone penetration is low relative to other developed EU countries, but expected to increase rapidly with 4G/LTE roll-out Demand for converged offers also expected to increase rapidly The proposed JV supports Italian and EU digital competitiveness priorities The proposed JV intends to build a mobile network of >20k sites, covering 99% outdoor and 90% indoor with 4G/LTE by 2019 1 Data as of August 2015 2 Company estimates as of June 2015
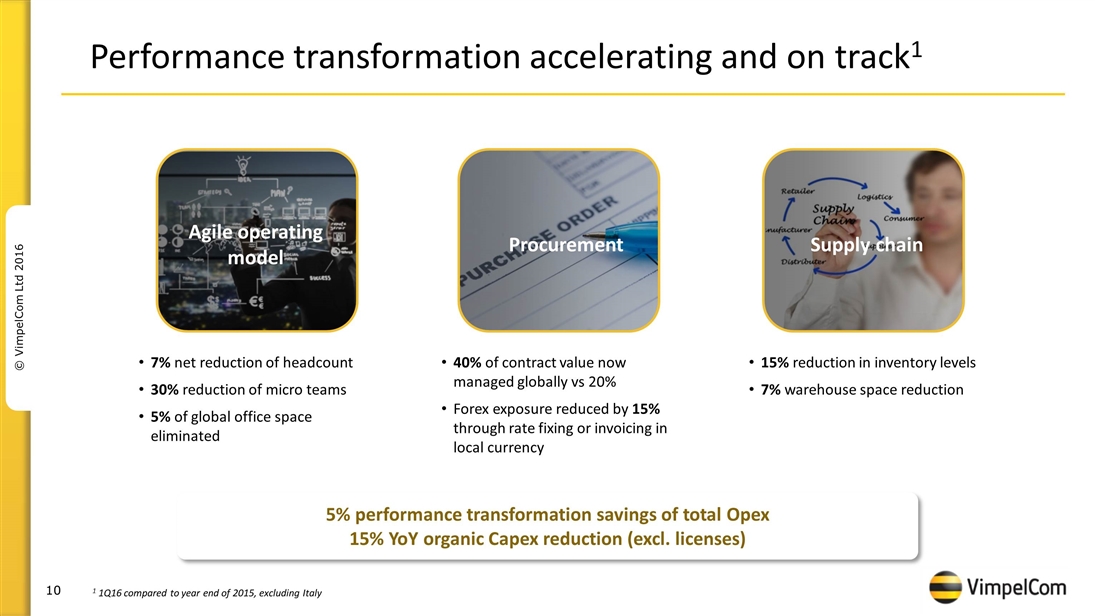
Performance transformation accelerating and on track1 Agile operating model Procurement Supply chain 7% net reduction of headcount 30% reduction of micro teams 5% of global office space eliminated 40% of contract value now managed globally vs 20% Forex exposure reduced by 15% through rate fixing or invoicing in local currency 15% reduction in inventory levels 7% warehouse space reduction 5% performance transformation savings of total Opex 15% YoY organic Capex reduction (excl. licenses) 1 1Q16 compared to year end of 2015, excluding Italy
1Q16 speakers and agenda Jean-Yves Charlier – Chief Executive Officer Group highlights Financial highlights Andrew Davies – Chief Financial Officer Group results review Country results review Group FY16 guidance Jean-Yves Charlier – Chief Executive Officer Final remarks Q&A session
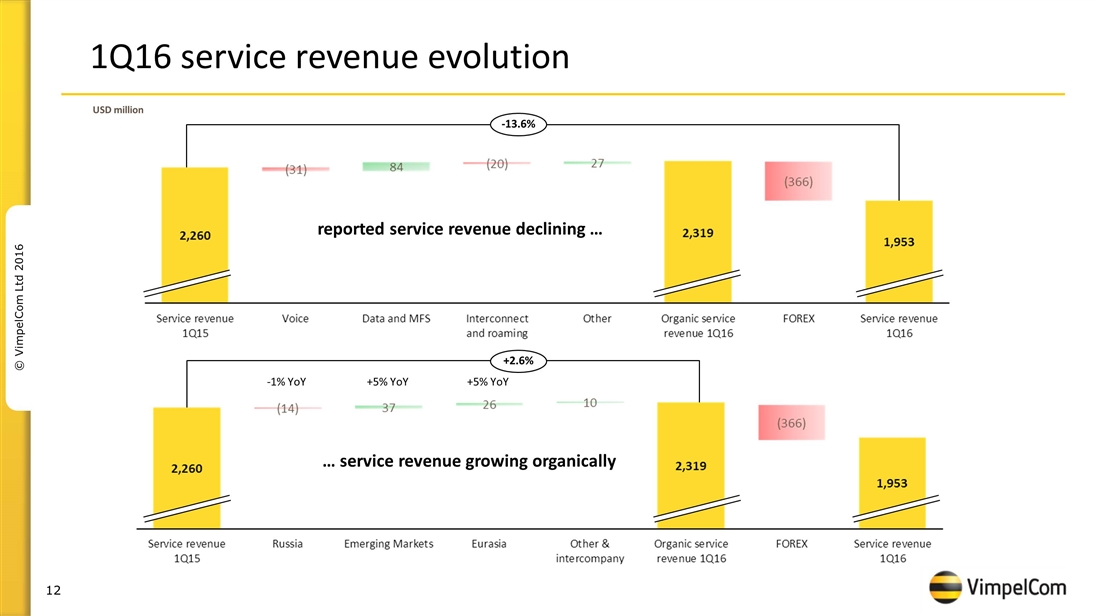
1Q16 service revenue evolution -13.6% +2.6% USD million reported service revenue declining … … service revenue growing organically -1% YoY +5% YoY +5% YoY
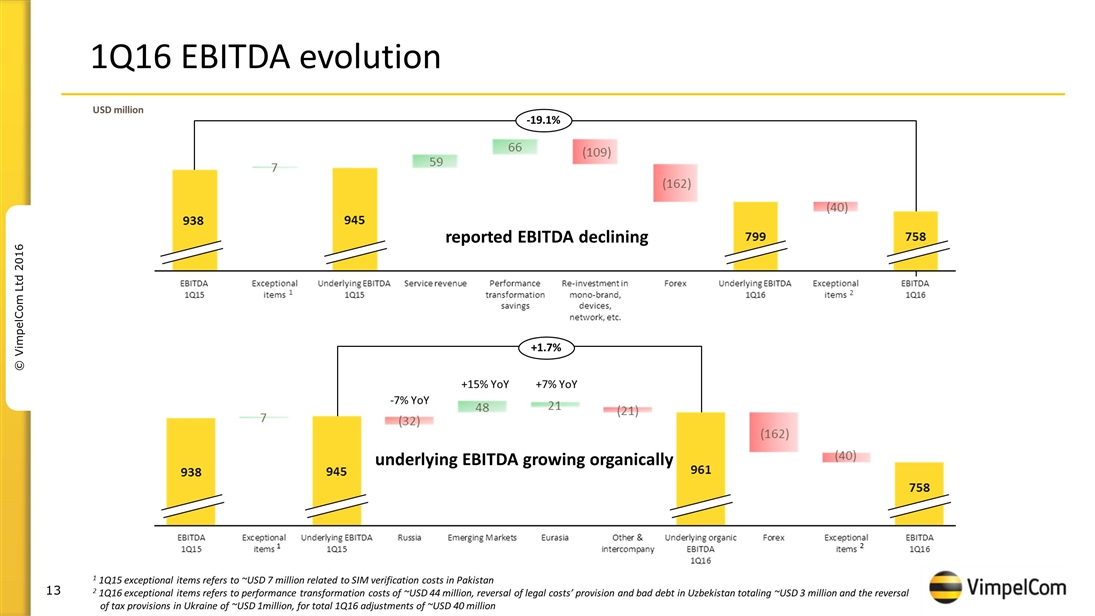
1Q16 EBITDA evolution -19.1% 2 +1.7% USD million 2 1 1Q15 exceptional items refers to ~USD 7 million related to SIM verification costs in Pakistan 2 1Q16 exceptional items refers to performance transformation costs of ~USD 44 million, reversal of legal costs’ provision and bad debt in Uzbekistan totaling ~USD 3 million and the reversal of tax provisions in Ukraine of ~USD 1million, for total 1Q16 adjustments of ~USD 40 million 1 1 reported EBITDA declining underlying EBITDA growing organically -7% YoY +15% YoY +7% YoY
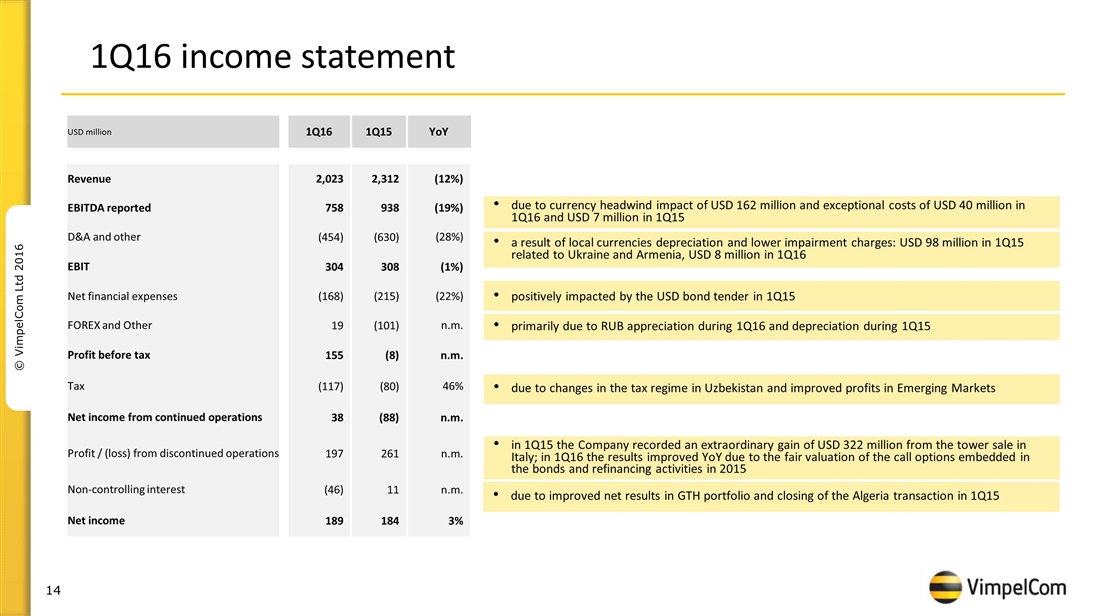
1Q16 income statement due to currency headwind impact of USD 162 million and exceptional costs of USD 40 million in 1Q16 and USD 7 million in 1Q15 a result of local currencies depreciation and lower impairment charges: USD 98 million in 1Q15 related to Ukraine and Armenia, USD 8 million in 1Q16 positively impacted by the USD bond tender in 1Q15 due to changes in the tax regime in Uzbekistan and improved profits in Emerging Markets in 1Q15 the Company recorded an extraordinary gain of USD 322 million from the tower sale in Italy; in 1Q16 the results improved YoY due to the fair valuation of the call options embedded in the bonds and refinancing activities in 2015 primarily due to RUB appreciation during 1Q16 and depreciation during 1Q15 USD million 1Q16 1Q15 YoY Revenue 2,023 2,312 (12%) EBITDA reported 758 938 (19%) D&A and other (454) (630) (28%) EBIT 304 308 (1%) Net financial expenses (168) (215) (22%) FOREX and Other 19 (101) n.m. Profit before tax 155 (8) n.m. Tax (117) (80) 46% Net income from continued operations 38 (88) n.m. Profit / (loss) from discontinued operations 197 261 n.m. Non-controlling interest (46) 11 n.m. Net income 189 184 3% due to improved net results in GTH portfolio and closing of the Algeria transaction in 1Q15
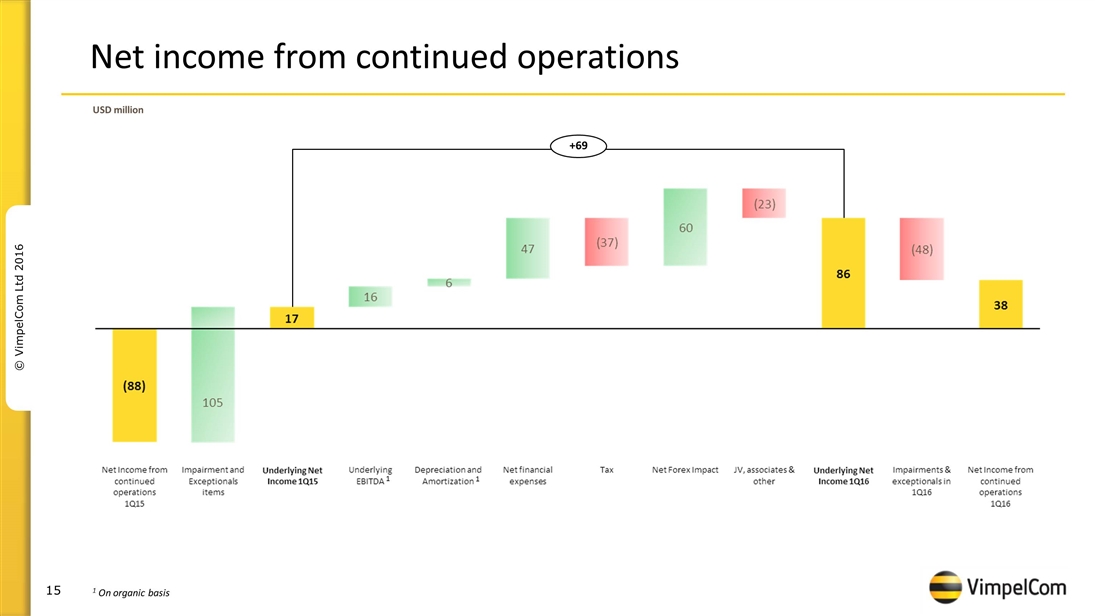
Net income from continued operations USD million +69 1 On organic basis 1 1
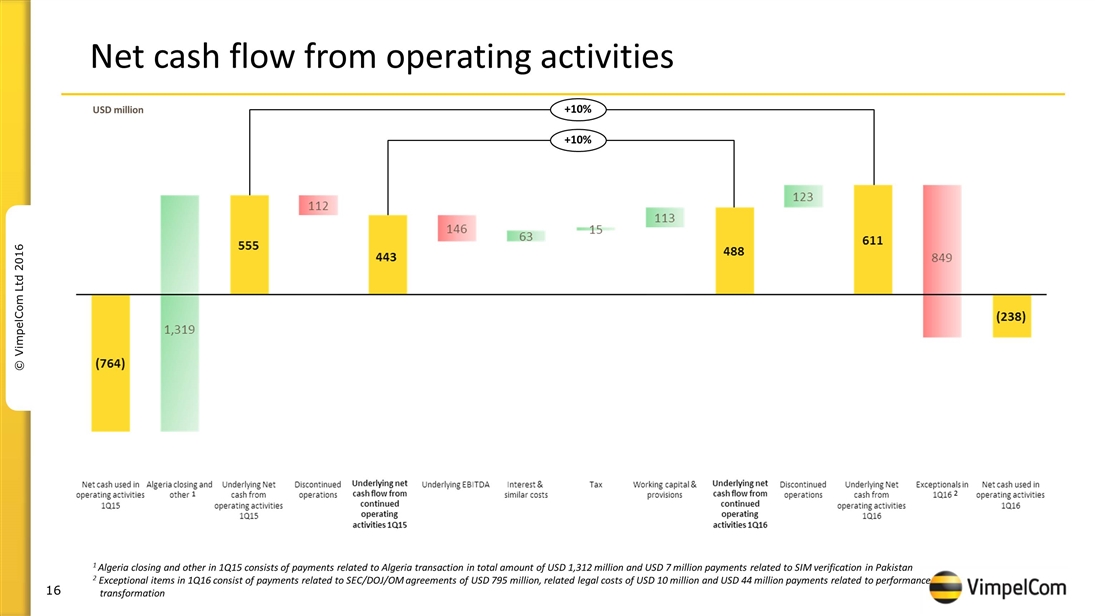
Net cash flow from operating activities USD million +10% +10% 1 Algeria closing and other in 1Q15 consists of payments related to Algeria transaction in total amount of USD 1,312 million and USD 7 million payments related to SIM verification in Pakistan 2 Exceptional items in 1Q16 consist of payments related to SEC/DOJ/OM agreements of USD 795 million, related legal costs of USD 10 million and USD 44 million payments related to performance transformation 2 1
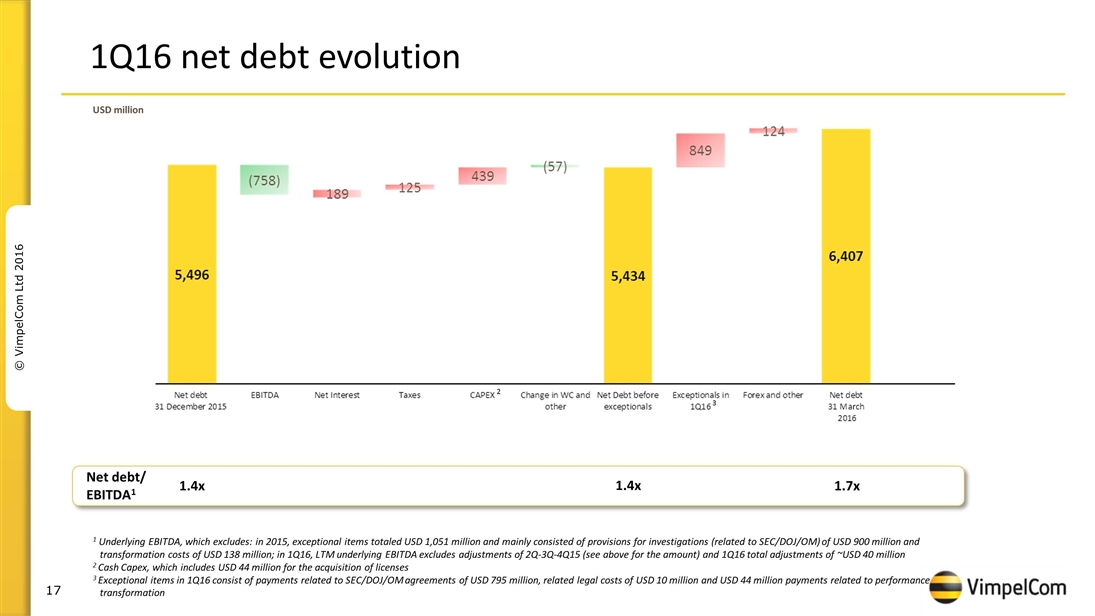
1Q16 net debt evolution 1 Underlying EBITDA, which excludes: in 2015, exceptional items totaled USD 1,051 million and mainly consisted of provisions for investigations (related to SEC/DOJ/OM) of USD 900 million and transformation costs of USD 138 million; in 1Q16, LTM underlying EBITDA excludes adjustments of 2Q-3Q-4Q15 (see above for the amount) and 1Q16 total adjustments of ~USD 40 million 2 Cash Capex, which includes USD 44 million for the acquisition of licenses 3 Exceptional items in 1Q16 consist of payments related to SEC/DOJ/OM agreements of USD 795 million, related legal costs of USD 10 million and USD 44 million payments related to performance transformation Net debt/ EBITDA1 1.7x 1.4x 2 3 1.4x USD million
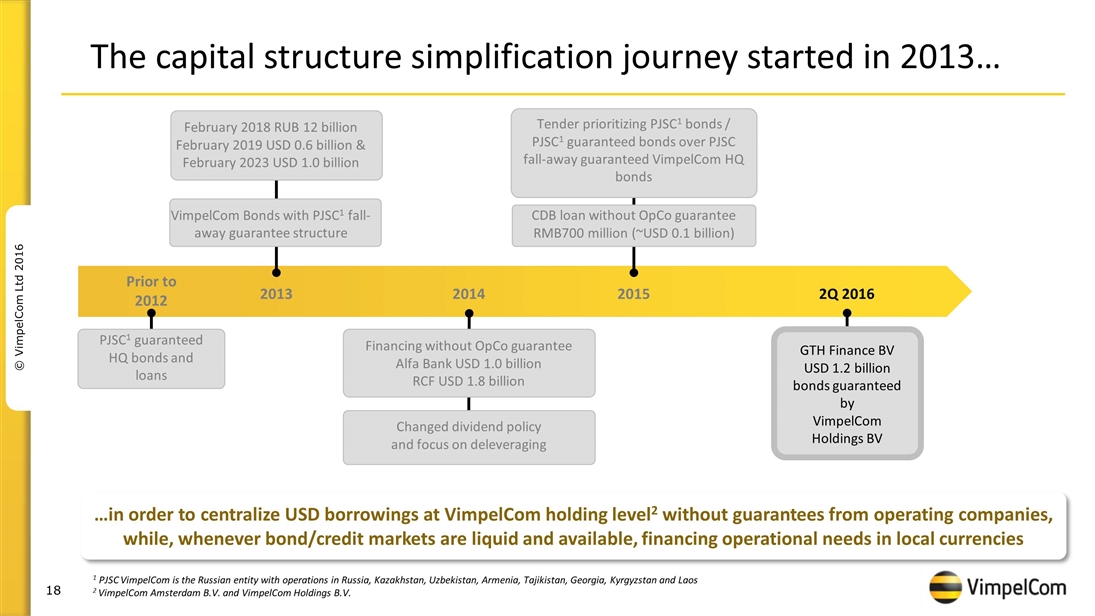
2013 2014 Prior to 2012 Changed dividend policy and focus on deleveraging PJSC1 guaranteed HQ bonds and loans Financing without OpCo guarantee Alfa Bank USD 1.0 billion RCF USD 1.8 billion 2015 Tender prioritizing PJSC1 bonds / PJSC1 guaranteed bonds over PJSC fall-away guaranteed VimpelCom HQ bonds CDB loan without OpCo guarantee RMB700 million (~USD 0.1 billion) 2Q 2016 GTH Finance BV USD 1.2 billion bonds guaranteed by VimpelCom Holdings BV …in order to centralize USD borrowings at VimpelCom holding level2 without guarantees from operating companies, while, whenever bond/credit markets are liquid and available, financing operational needs in local currencies 1 PJSC VimpelCom is the Russian entity with operations in Russia, Kazakhstan, Uzbekistan, Armenia, Tajikistan, Georgia, Kyrgyzstan and Laos 2 VimpelCom Amsterdam B.V. and VimpelCom Holdings B.V. February 2018 RUB 12 billion February 2019 USD 0.6 billion & February 2023 USD 1.0 billion VimpelCom Bonds with PJSC1 fall-away guarantee structure The capital structure simplification journey started in 2013…
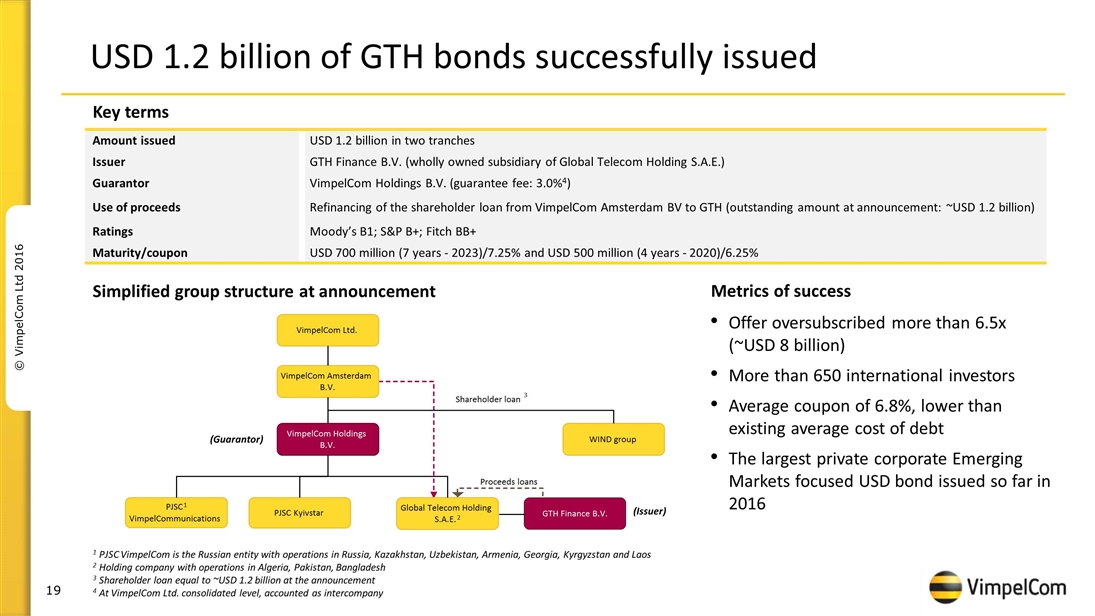
USD 1.2 billion of GTH bonds successfully issued Amount issued USD 1.2 billion in two tranches Issuer GTH Finance B.V. (wholly owned subsidiary of Global Telecom Holding S.A.E.) Guarantor VimpelCom Holdings B.V. (guarantee fee: 3.0%4) Use of proceeds Refinancing of the shareholder loan from VimpelCom Amsterdam BV to GTH (outstanding amount at announcement: ~USD 1.2 billion) Ratings Moody’s B1; S&P B+; Fitch BB+ Maturity/coupon USD 700 million (7 years - 2023)/7.25% and USD 500 million (4 years - 2020)/6.25% 1 PJSC VimpelCom is the Russian entity with operations in Russia, Kazakhstan, Uzbekistan, Armenia, Georgia, Kyrgyzstan and Laos 2 Holding company with operations in Algeria, Pakistan, Bangladesh 3 Shareholder loan equal to ~USD 1.2 billion at the announcement 4 At VimpelCom Ltd. consolidated level, accounted as intercompany Offer oversubscribed more than 6.5x (~USD 8 billion) More than 650 international investors Average coupon of 6.8%, lower than existing average cost of debt The largest private corporate Emerging Markets focused USD bond issued so far in 2016 Key terms Simplified group structure at announcement Metrics of success Global Telecom Holding S.A.E. 2 GTH Finance B.V. Proceeds loans (Issuer) Shareholder loan 3 VimpelCom Ltd. VimpelCom Amsterdam B.V. VimpelCom Holdings B.V. PJSC 1 VimpelCommunications WIND group PJSC Kyivstar (Guarantor)
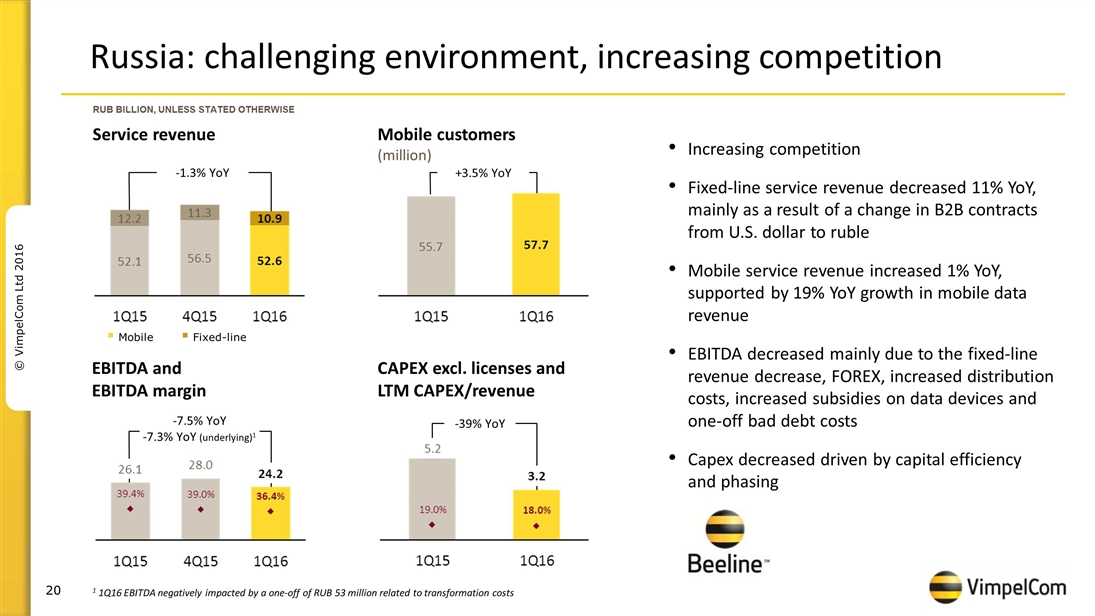
Russia: challenging environment, increasing competition Increasing competition Fixed-line service revenue decreased 11% YoY, mainly as a result of a change in B2B contracts from U.S. dollar to ruble Mobile service revenue increased 1% YoY, supported by 19% YoY growth in mobile data revenue EBITDA decreased mainly due to the fixed-line revenue decrease, FOREX, increased distribution costs, increased subsidies on data devices and one-off bad debt costs Capex decreased driven by capital efficiency and phasing RUB BILLION, UNLESS STATED OTHERWISE EBITDA and EBITDA margin CAPEX excl. licenses and LTM CAPEX/revenue Mobile customers (million) Mobile Fixed-line -1.3% YoY +3.5% YoY -7.5% YoY -7.3% YoY (underlying)1 -39% YoY Service revenue 1 1Q16 EBITDA negatively impacted by a one-off of RUB 53 million related to transformation costs
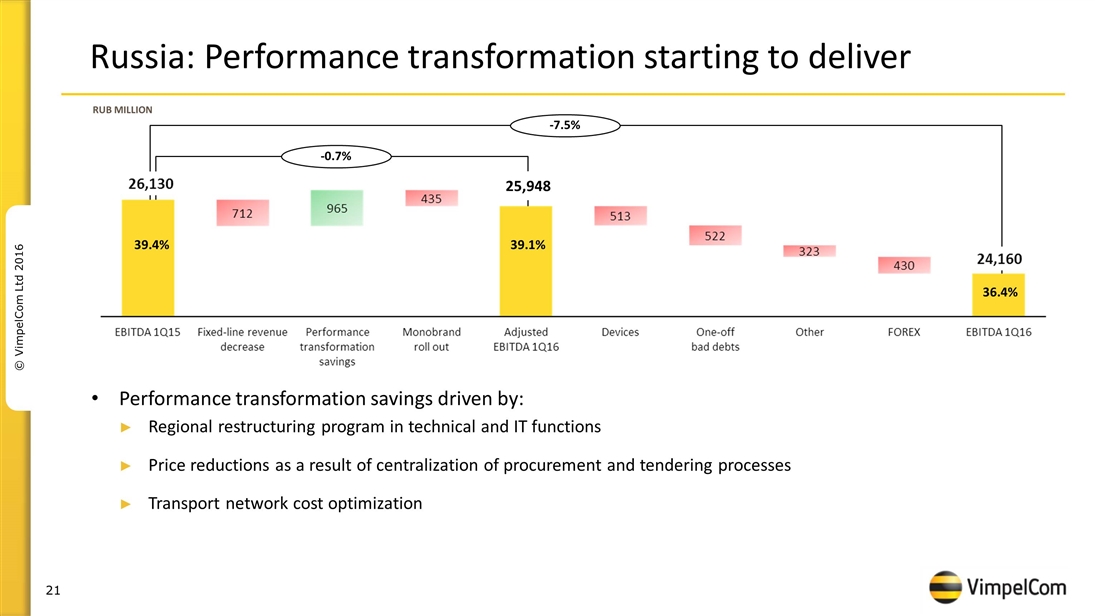
Russia: Performance transformation starting to deliver Performance transformation savings driven by: Regional restructuring program in technical and IT functions Price reductions as a result of centralization of procurement and tendering processes Transport network cost optimization RUB MILLION -7.5% -0.7% 36.4% 39.4% 25,948 39.1%
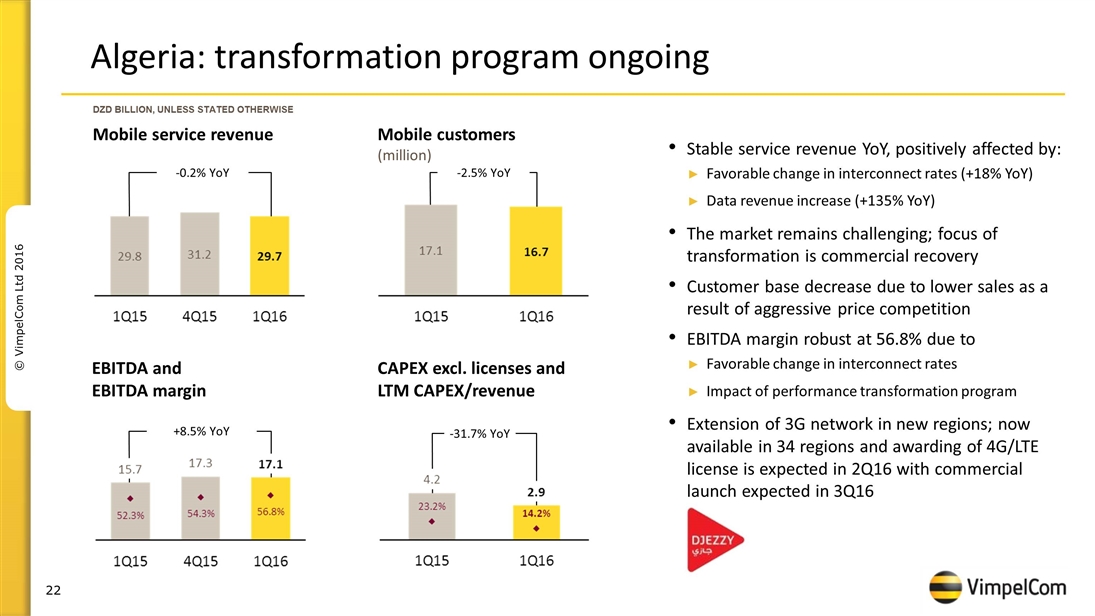
Algeria: transformation program ongoing Stable service revenue YoY, positively affected by: Favorable change in interconnect rates (+18% YoY) Data revenue increase (+135% YoY) The market remains challenging; focus of transformation is commercial recovery Customer base decrease due to lower sales as a result of aggressive price competition EBITDA margin robust at 56.8% due to Favorable change in interconnect rates Impact of performance transformation program Extension of 3G network in new regions; now available in 34 regions and awarding of 4G/LTE license is expected in 2Q16 with commercial launch expected in 3Q16 DZD BILLION, UNLESS STATED OTHERWISE -0.2% YoY -2.5% YoY +8.5% YoY -31.7% YoY EBITDA and EBITDA margin CAPEX excl. licenses and LTM CAPEX/revenue Mobile customers (million) Mobile service revenue
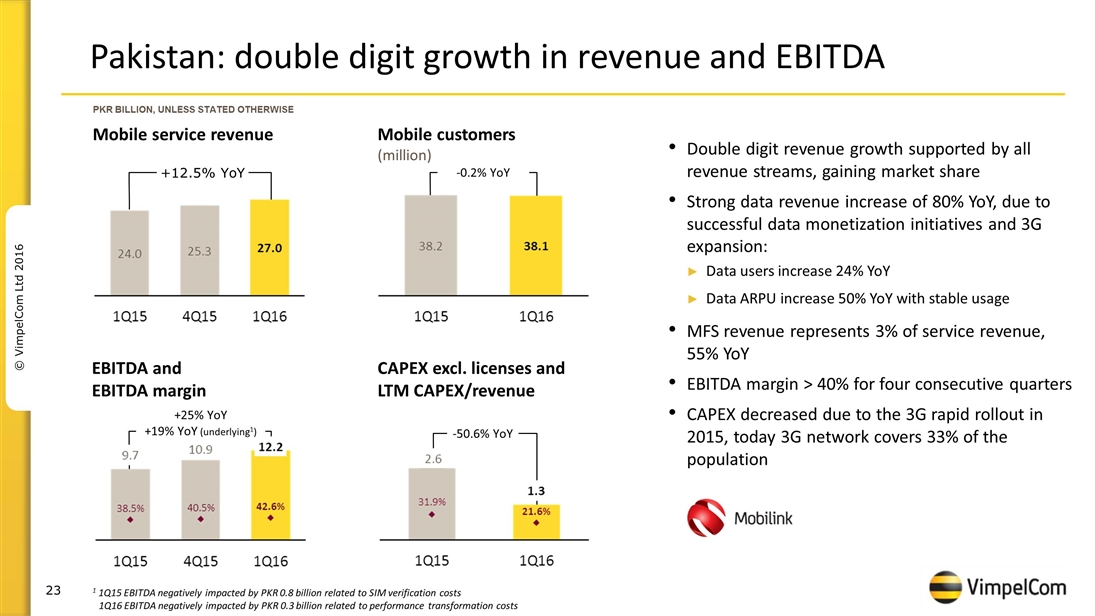
Pakistan: double digit growth in revenue and EBITDA Double digit revenue growth supported by all revenue streams, gaining market share Strong data revenue increase of 80% YoY, due to successful data monetization initiatives and 3G expansion: Data users increase 24% YoY Data ARPU increase 50% YoY with stable usage MFS revenue represents 3% of service revenue, 55% YoY EBITDA margin > 40% for four consecutive quarters CAPEX decreased due to the 3G rapid rollout in 2015, today 3G network covers 33% of the population PKR BILLION, UNLESS STATED OTHERWISE +12.5% YoY -0.2% YoY +25% YoY +19% YoY (underlying1) -50.6% YoY 1 1Q15 EBITDA negatively impacted by PKR 0.8 billion related to SIM verification costs 1Q16 EBITDA negatively impacted by PKR 0.3 billion related to performance transformation costs EBITDA and EBITDA margin CAPEX excl. licenses and LTM CAPEX/revenue Mobile service revenue Mobile customers (million)
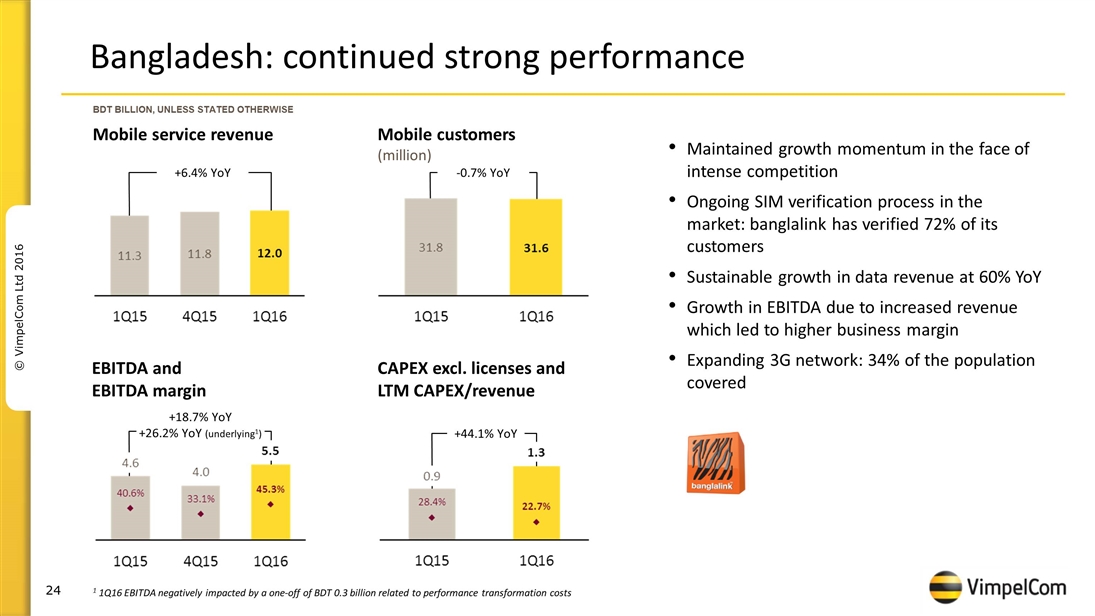
Bangladesh: continued strong performance Maintained growth momentum in the face of intense competition Ongoing SIM verification process in the market: banglalink has verified 72% of its customers Sustainable growth in data revenue at 60% YoY Growth in EBITDA due to increased revenue which led to higher business margin Expanding 3G network: 34% of the population covered BDT BILLION, UNLESS STATED OTHERWISE +6.4% YoY -0.7% YoY +18.7% YoY +26.2% YoY (underlying1) +44.1% YoY 1 1Q16 EBITDA negatively impacted by a one-off of BDT 0.3 billion related to performance transformation costs EBITDA and EBITDA margin CAPEX excl. licenses and LTM CAPEX/revenue Mobile customers (million) Mobile service revenue
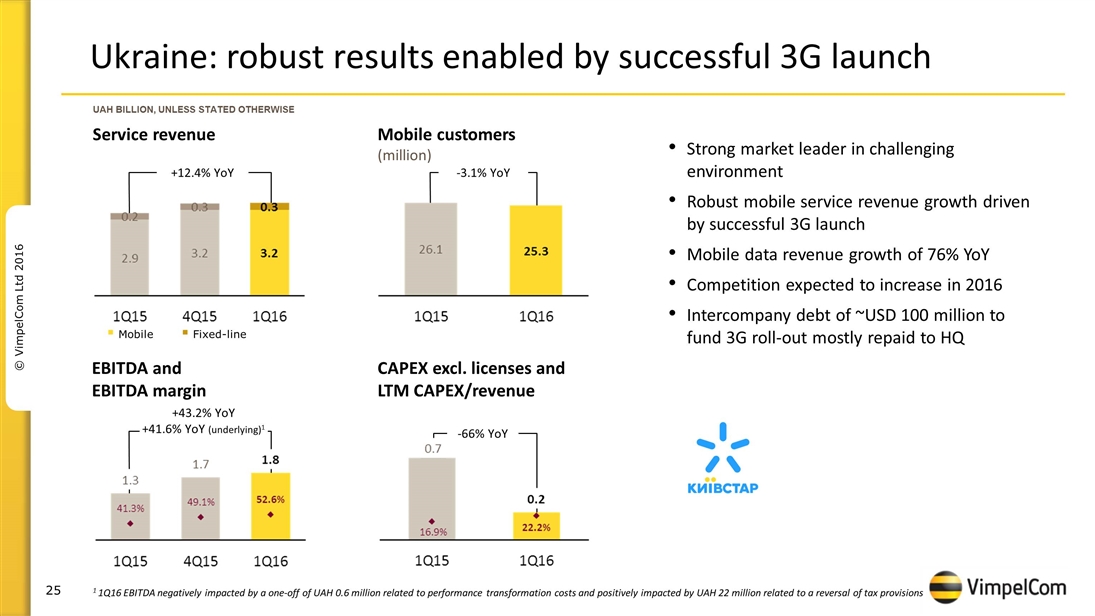
Ukraine: robust results enabled by successful 3G launch Strong market leader in challenging environment Robust mobile service revenue growth driven by successful 3G launch Mobile data revenue growth of 76% YoY Competition expected to increase in 2016 Intercompany debt of ~USD 100 million to fund 3G roll-out mostly repaid to HQ UAH BILLION, UNLESS STATED OTHERWISE Mobile Fixed-line +12.4% YoY -3.1% YoY +43.2% YoY +41.6% YoY (underlying)1 -66% YoY 1 1Q16 EBITDA negatively impacted by a one-off of UAH 0.6 million related to performance transformation costs and positively impacted by UAH 22 million related to a reversal of tax provisions EBITDA and EBITDA margin CAPEX excl. licenses and LTM CAPEX/revenue Mobile customers (million) Service revenue
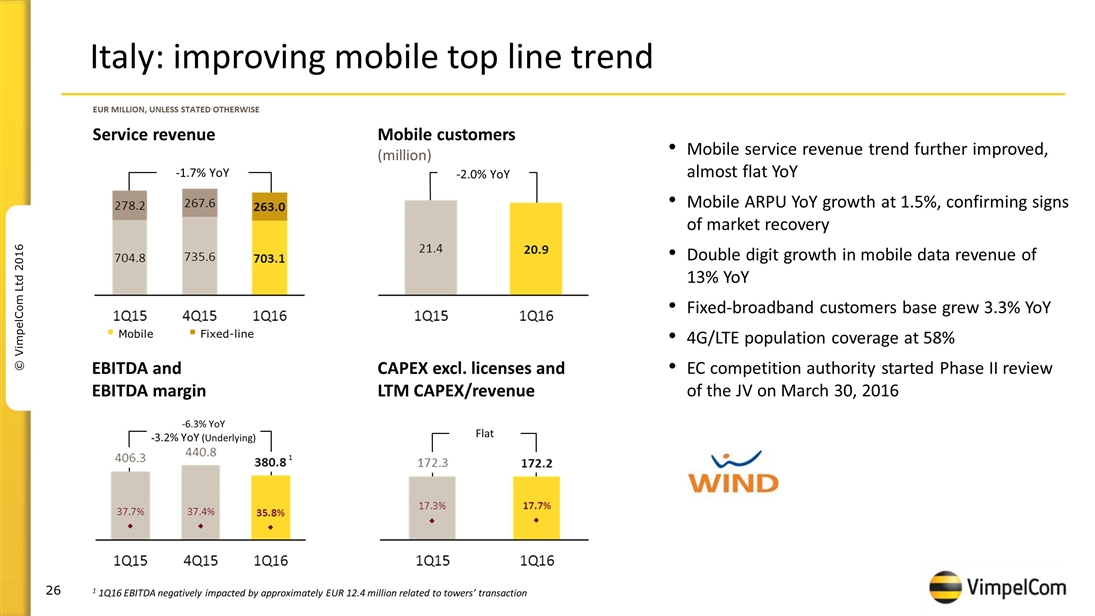
Italy: improving mobile top line trend Mobile service revenue trend further improved, almost flat YoY Mobile ARPU YoY growth at 1.5%, confirming signs of market recovery Double digit growth in mobile data revenue of 13% YoY Fixed-broadband customers base grew 3.3% YoY 4G/LTE population coverage at 58% EC competition authority started Phase II review of the JV on March 30, 2016 EUR MILLION, UNLESS STATED OTHERWISE Mobile Fixed-line -1.7% YoY -2.0% YoY -6.3% YoY -3.2% YoY (Underlying) Flat 1 1Q16 EBITDA negatively impacted by approximately EUR 12.4 million related to towers’ transaction EBITDA and EBITDA margin CAPEX excl. licenses and LTM CAPEX/revenue Mobile customers (million) Service revenue 1
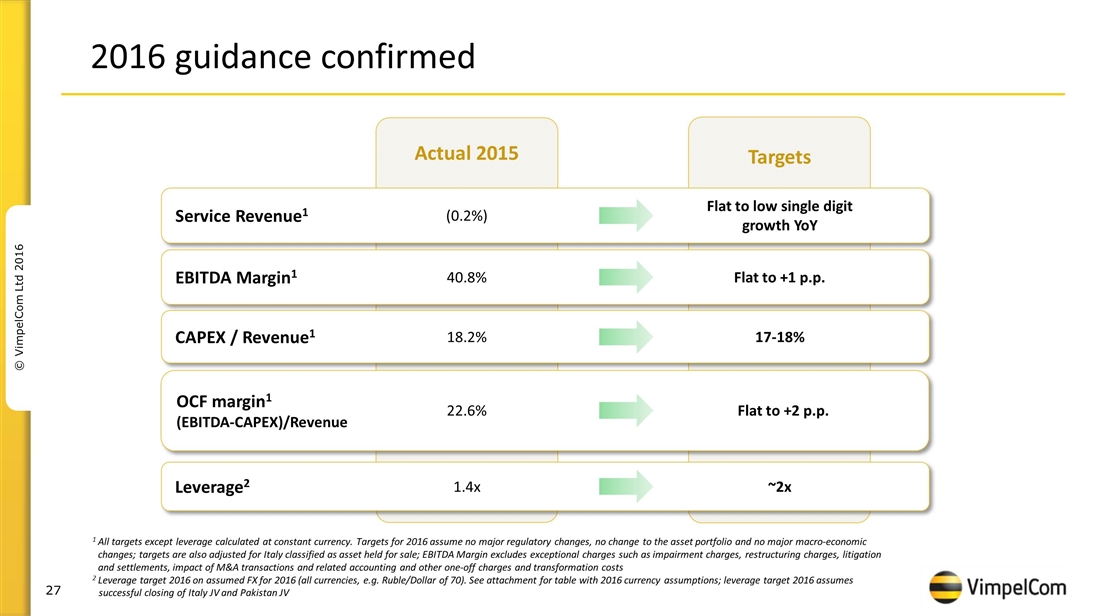
2016 guidance confirmed Service Revenue1 EBITDA Margin1 CAPEX / Revenue1 Leverage2 1 All targets except leverage calculated at constant currency. Targets for 2016 assume no major regulatory changes, no change to the asset portfolio and no major macro-economic changes; targets are also adjusted for Italy classified as asset held for sale; EBITDA Margin excludes exceptional charges such as impairment charges, restructuring charges, litigation and settlements, impact of M&A transactions and related accounting and other one-off charges and transformation costs 2 Leverage target 2016 on assumed FX for 2016 (all currencies, e.g. Ruble/Dollar of 70). See attachment for table with 2016 currency assumptions; leverage target 2016 assumes successful closing of Italy JV and Pakistan JV Actual 2015 Targets (0.2%) 40.8% 18.2% 1.4x Flat to low single digit growth YoY Flat to +1 p.p. 17-18% ~2x OCF margin1 (EBITDA-CAPEX)/Revenue Flat to +2 p.p. 22.6%
1Q16 speakers and agenda Jean-Yves Charlier – Chief Executive Officer Group highlights Financial highlights Andrew Davies – Chief Financial Officer Group results review Country results review Group FY16 guidance Jean-Yves Charlier – Chief Executive Officer Final remarks Q&A session
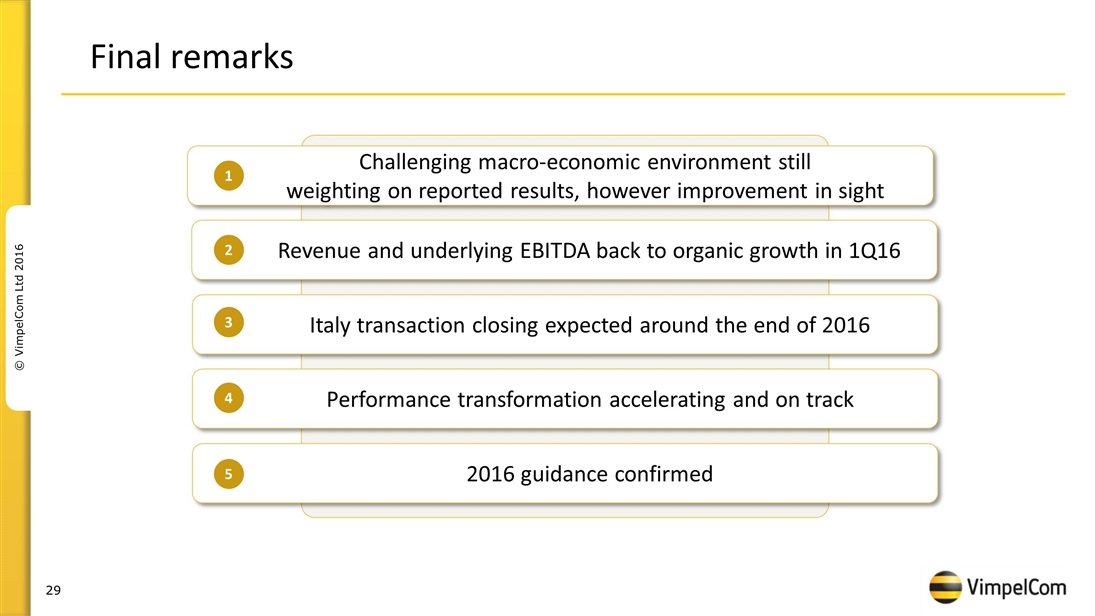
Final remarks Revenue and underlying EBITDA back to organic growth in 1Q16 Challenging macro-economic environment still weighting on reported results, however improvement in sight 2 Italy transaction closing expected around the end of 2016 3 Performance transformation accelerating and on track 4 2016 guidance confirmed 5 1
1Q16 speakers and agenda Jean-Yves Charlier – Chief Executive Officer Group highlights Financial highlights Andrew Davies – Chief Financial Officer Group results review Country results review Group FY16 guidance Jean-Yves Charlier – Chief Executive Officer Final remarks Q&A session
Further information Investor Relations Claude Debussylaan 88 1082 MD Amsterdam The Netherlands T: +31 20 79 77 234 E: [email protected] Visit our website www.vimpelcom.com

Appendix
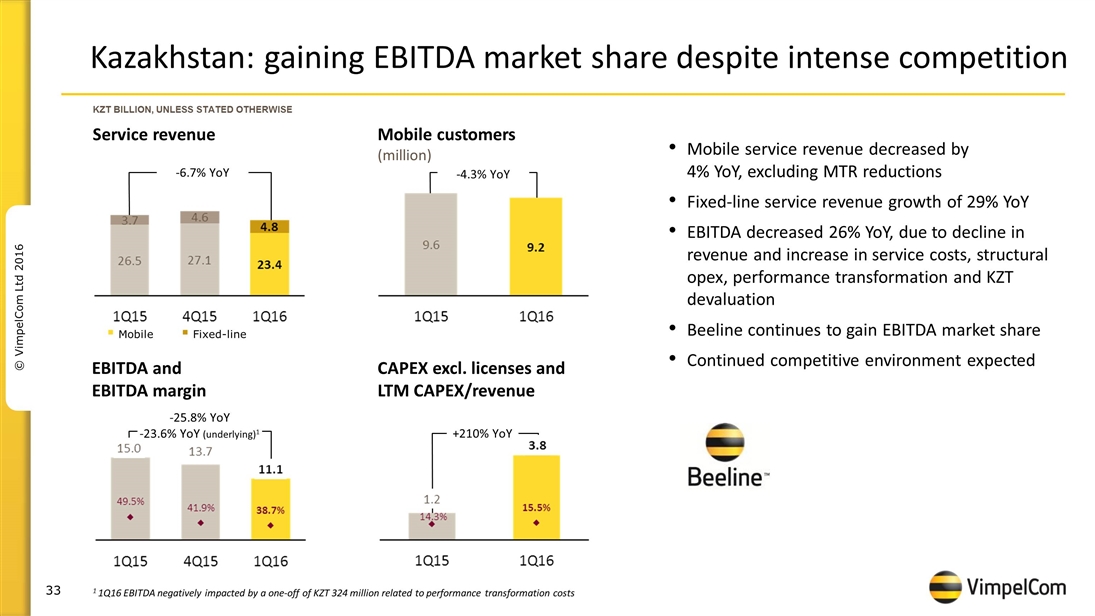
Kazakhstan: gaining EBITDA market share despite intense competition Mobile service revenue decreased by 4% YoY, excluding MTR reductions Fixed-line service revenue growth of 29% YoY EBITDA decreased 26% YoY, due to decline in revenue and increase in service costs, structural opex, performance transformation and KZT devaluation Beeline continues to gain EBITDA market share Continued competitive environment expected KZT BILLION, UNLESS STATED OTHERWISE Mobile Fixed-line -6.7% YoY -4.3% YoY -25.8% YoY -23.6% YoY (underlying)1 +210% YoY 1 1Q16 EBITDA negatively impacted by a one-off of KZT 324 million related to performance transformation costs EBITDA and EBITDA margin CAPEX excl. licenses and LTM CAPEX/revenue Mobile customers (million) Service revenue
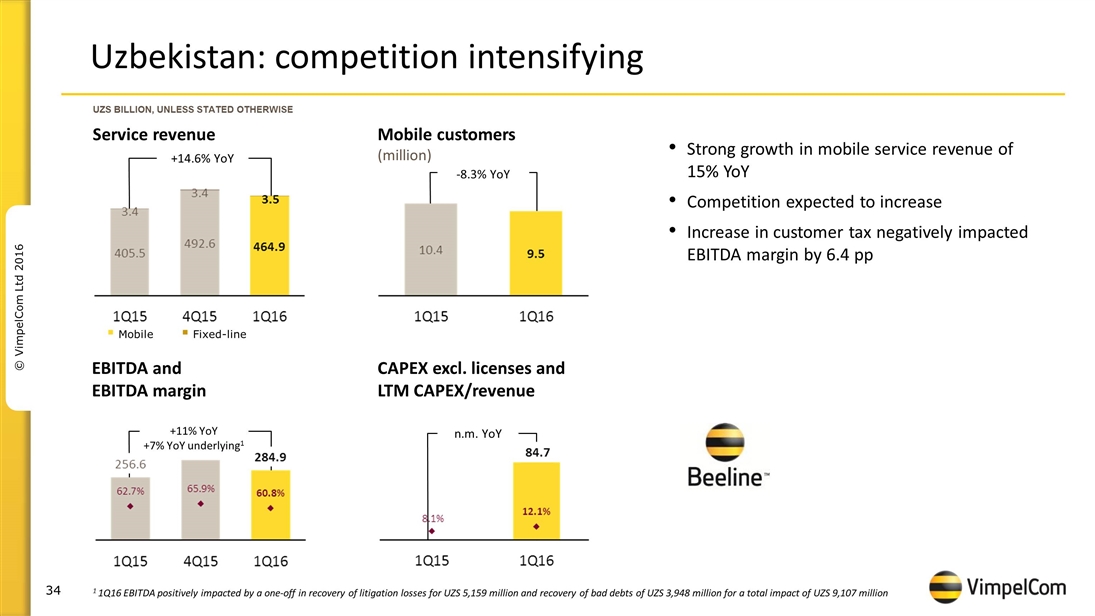
Uzbekistan: competition intensifying Strong growth in mobile service revenue of 15% YoY Competition expected to increase Increase in customer tax negatively impacted EBITDA margin by 6.4 pp UZS BILLION, UNLESS STATED OTHERWISE Mobile Fixed-line +14.6% YoY -8.3% YoY +11% YoY +7% YoY underlying1 n.m. YoY EBITDA and EBITDA margin CAPEX excl. licenses and LTM CAPEX/revenue Mobile customers (million) Service revenue 1 1Q16 EBITDA positively impacted by a one-off in recovery of litigation losses for UZS 5,159 million and recovery of bad debts of UZS 3,948 million for a total impact of UZS 9,107 million
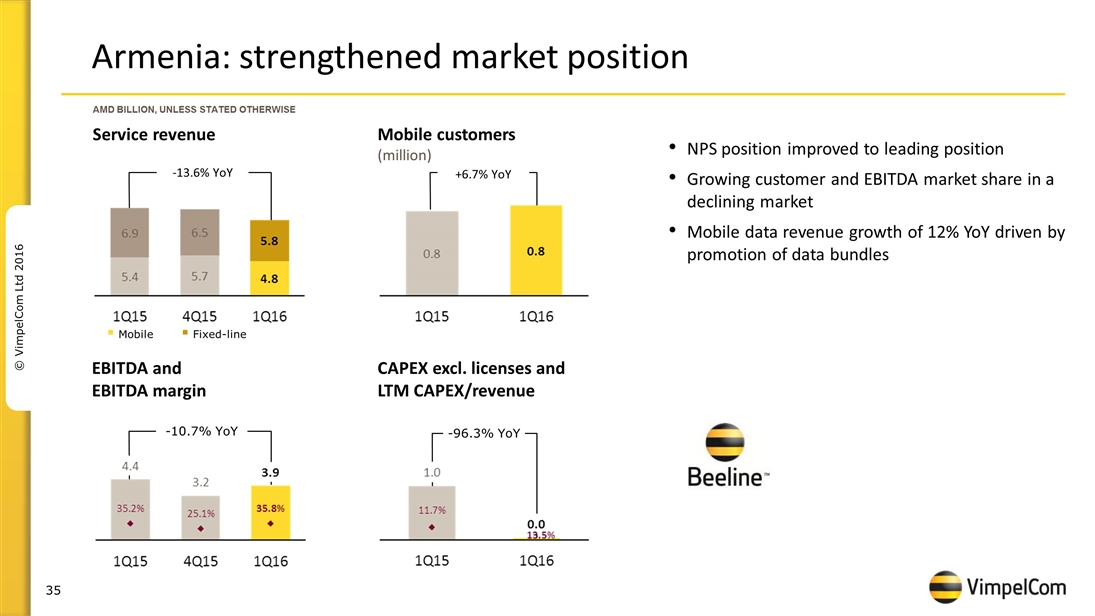
Armenia: strengthened market position NPS position improved to leading position Growing customer and EBITDA market share in a declining market Mobile data revenue growth of 12% YoY driven by promotion of data bundles AMD BILLION, UNLESS STATED OTHERWISE Mobile Fixed-line -13.6% YoY +6.7% YoY -10.7% YoY -96.3% YoY EBITDA and EBITDA margin CAPEX excl. licenses and LTM CAPEX/revenue Mobile customers (million) Service revenue
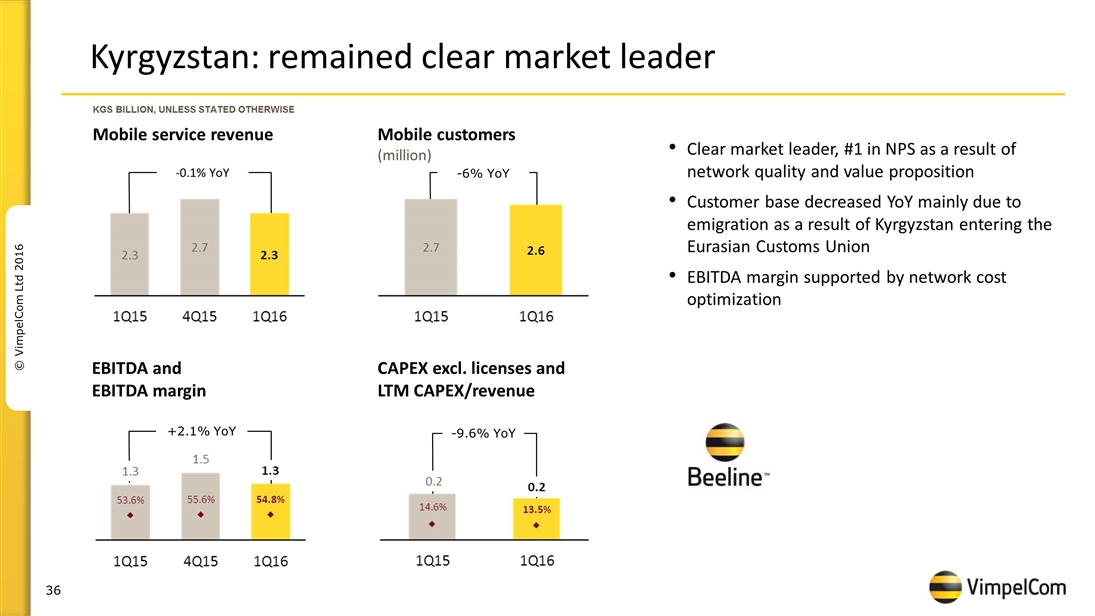
Kyrgyzstan: remained clear market leader Clear market leader, #1 in NPS as a result of network quality and value proposition Customer base decreased YoY mainly due to emigration as a result of Kyrgyzstan entering the Eurasian Customs Union EBITDA margin supported by network cost optimization KGS BILLION, UNLESS STATED OTHERWISE -0.1% YoY -6% YoY +2.1% YoY -9.6% YoY EBITDA and EBITDA margin CAPEX excl. licenses and LTM CAPEX/revenue Mobile customers (million) Mobile service revenue
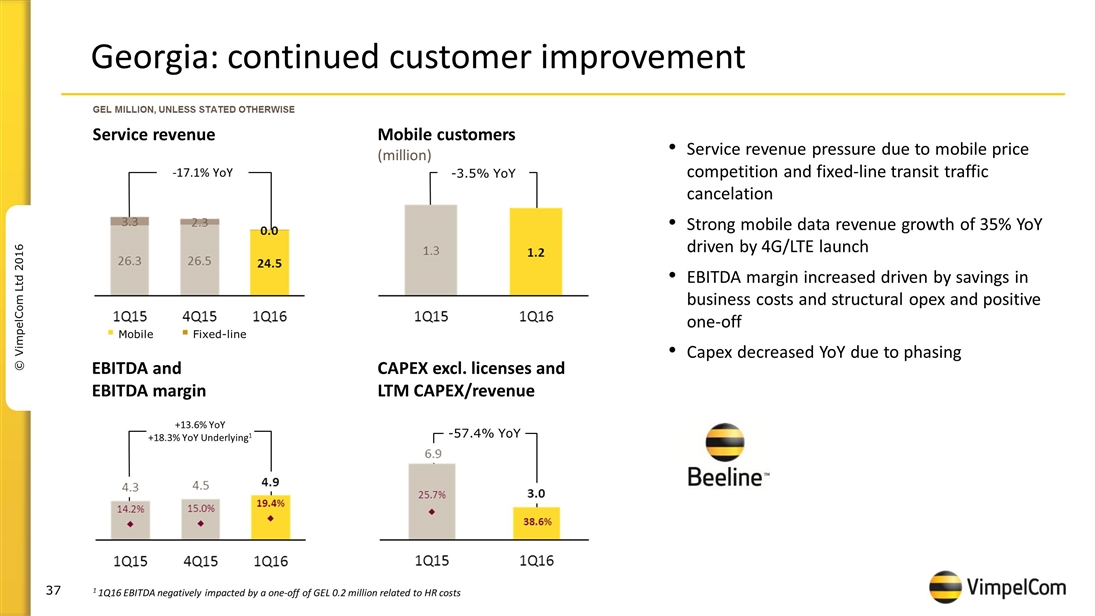
Georgia: continued customer improvement Service revenue pressure due to mobile price competition and fixed-line transit traffic cancelation Strong mobile data revenue growth of 35% YoY driven by 4G/LTE launch EBITDA margin increased driven by savings in business costs and structural opex and positive one-off Capex decreased YoY due to phasing GEL MILLION, UNLESS STATED OTHERWISE -3.5% YoY +13.6% YoY +18.3% YoY Underlying1 -57.4% YoY Mobile Fixed-line -17.1% YoY 1 1Q16 EBITDA negatively impacted by a one-off of GEL 0.2 million related to HR costs EBITDA and EBITDA margin CAPEX excl. licenses and LTM CAPEX/revenue Mobile customers (million) Service revenue
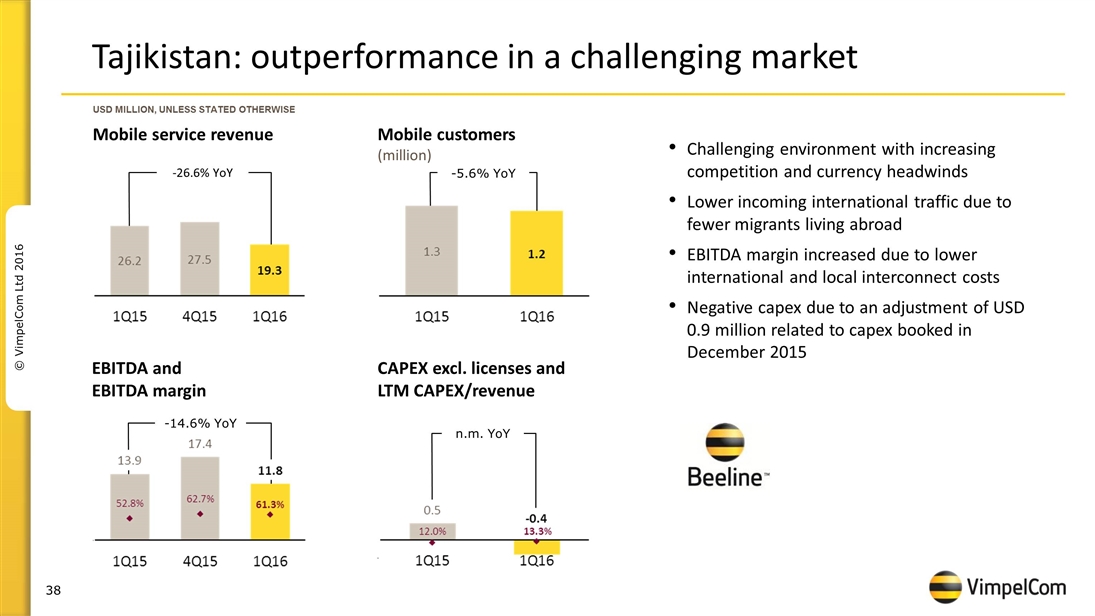
Tajikistan: outperformance in a challenging market Challenging environment with increasing competition and currency headwinds Lower incoming international traffic due to fewer migrants living abroad EBITDA margin increased due to lower international and local interconnect costs Negative capex due to an adjustment of USD 0.9 million related to capex booked in December 2015 USD MILLION, UNLESS STATED OTHERWISE -5.6% YoY -14.6% YoY n.m. YoY -26.6% YoY EBITDA and EBITDA margin CAPEX excl. licenses and LTM CAPEX/revenue Mobile customers (million) Mobile service revenue
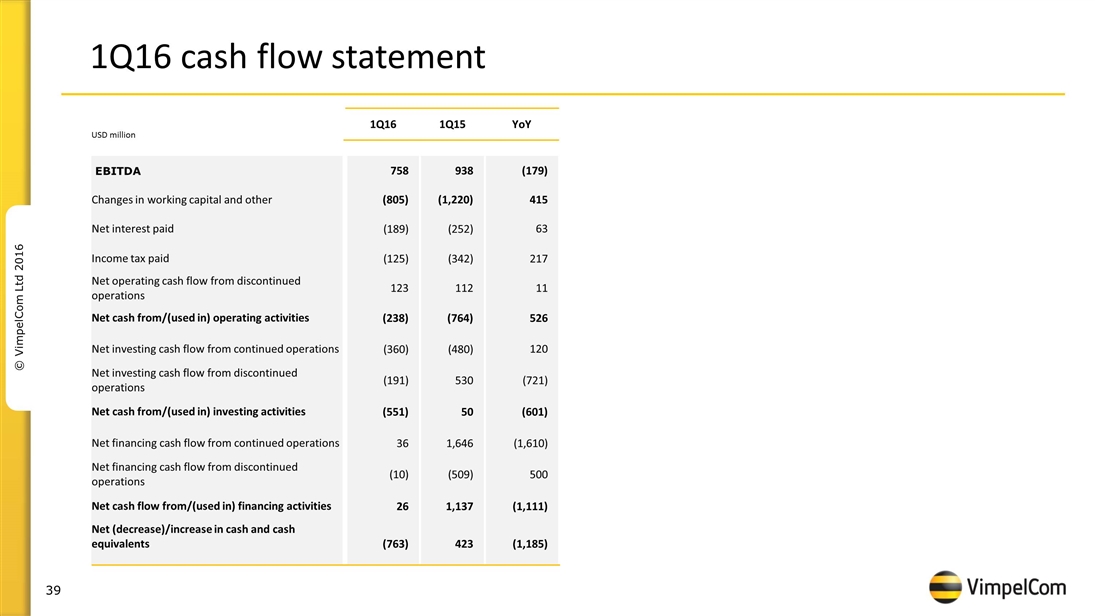
1Q16 cash flow statement USD million 1Q16 1Q15 YoY EBITDA 758 938 (179) Changes in working capital and other (805) (1,220) 415 Net interest paid (189) (252) 63 Income tax paid (125) (342) 217 Net operating cash flow from discontinued operations 123 112 11 Net cash from/(used in) operating activities (238) (764) 526 Net investing cash flow from continued operations (360) (480) 120 Net investing cash flow from discontinued operations (191) 530 (721) Net cash from/(used in) investing activities (551) 50 (601) Net financing cash flow from continued operations 36 1,646 (1,610) Net financing cash flow from discontinued operations (10) (509) 500 Net cash flow from/(used in) financing activities 26 1,137 (1,111) Net (decrease)/increase in cash and cash equivalents (763) 423 (1,185)
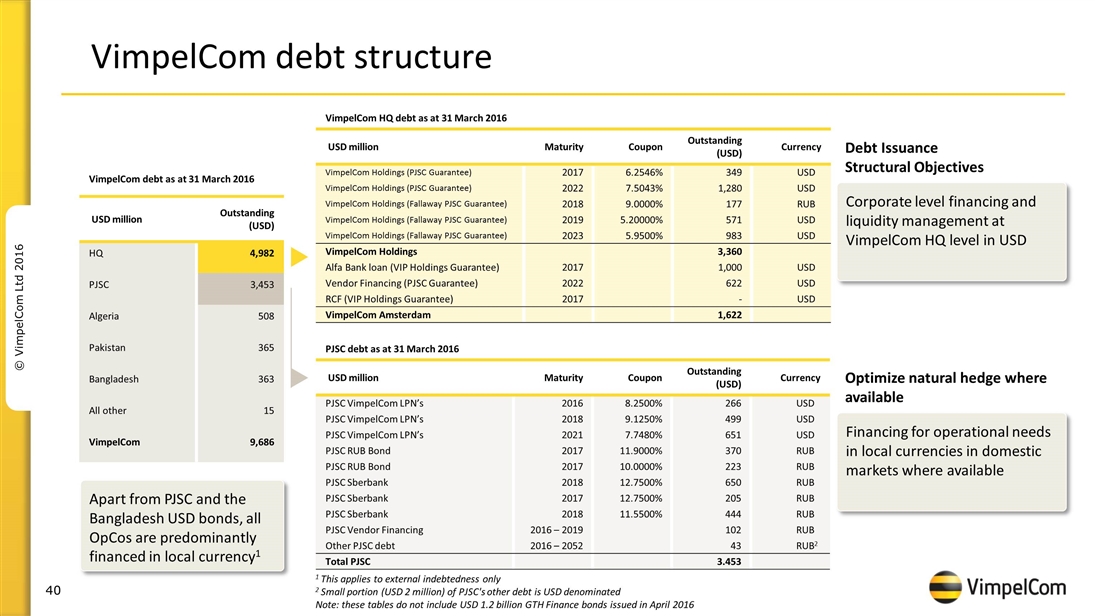
VimpelCom debt structure VimpelCom debt as at 31 March 2016 USD million Outstanding (USD) HQ 4,982 PJSC 3,453 Algeria 508 Pakistan 365 Bangladesh 363 All other 15 VimpelCom 9,686 Apart from PJSC and the Bangladesh USD bonds, all OpCos are predominantly financed in local currency1 VimpelCom HQ debt as at 31 March 2016 USD million Maturity Coupon Outstanding (USD) Currency VimpelCom Holdings (PJSC Guarantee) 2017 6.2546% 349 USD VimpelCom Holdings (PJSC Guarantee) 2022 7.5043% 1,280 USD VimpelCom Holdings (Fallaway PJSC Guarantee) 2018 9.0000% 177 RUB VimpelCom Holdings (Fallaway PJSC Guarantee) 2019 5.20000% 571 USD VimpelCom Holdings (Fallaway PJSC Guarantee) 2023 5.9500% 983 USD VimpelCom Holdings 3,360 Alfa Bank loan (VIP Holdings Guarantee) 2017 1,000 USD Vendor Financing (PJSC Guarantee) 2022 622 USD RCF (VIP Holdings Guarantee) 2017 - USD VimpelCom Amsterdam 1,622 1 This applies to external indebtedness only 2 Small portion (USD 2 million) of PJSC's other debt is USD denominated Note: these tables do not include USD 1.2 billion GTH Finance bonds issued in April 2016 PJSC debt as at 31 March 2016 USD million Maturity Coupon Outstanding (USD) Currency PJSC VimpelCom LPN’s 2016 8.2500% 266 USD PJSC VimpelCom LPN’s 2018 9.1250% 499 USD PJSC VimpelCom LPN’s 2021 7.7480% 651 USD PJSC RUB Bond 2017 11.9000% 370 RUB PJSC RUB Bond 2017 10.0000% 223 RUB PJSC Sberbank 2018 12.7500% 650 RUB PJSC Sberbank 2017 12.7500% 205 RUB PJSC Sberbank 2018 11.5500% 444 RUB PJSC Vendor Financing 2016 – 2019 102 RUB Other PJSC debt 2016 – 2052 43 RUB2 Total PJSC 3.453 Corporate level financing and liquidity management at VimpelCom HQ level in USD Debt Issuance Structural Objectives Financing for operational needs in local currencies in domestic markets where available Optimize natural hedge where available
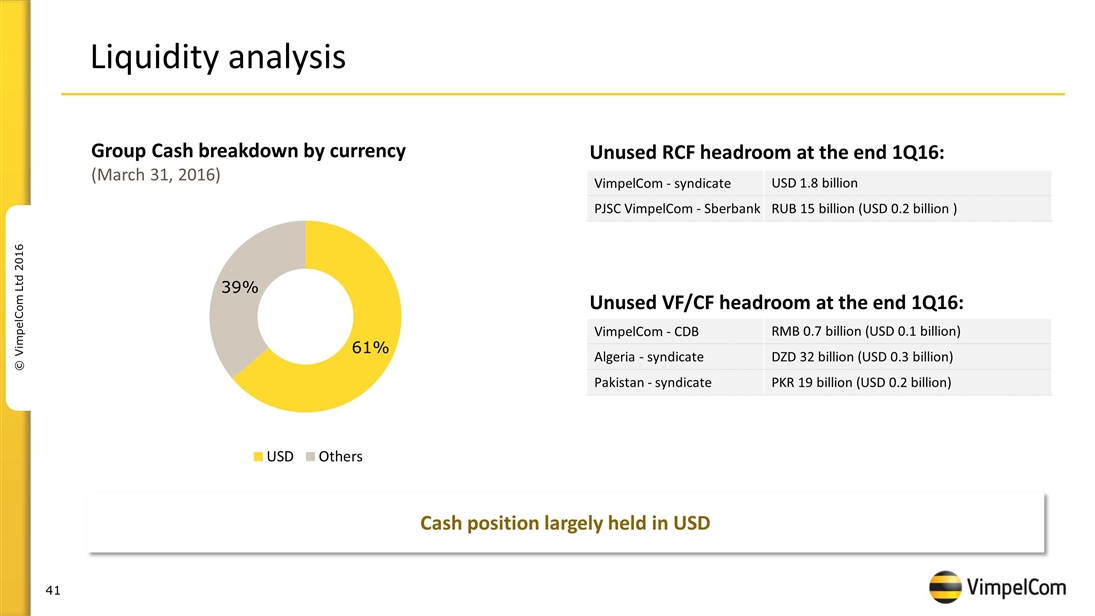
Liquidity analysis Group Cash breakdown by currency (March 31, 2016) Cash position largely held in USD Unused RCF headroom at the end 1Q16: VimpelCom - syndicate USD 1.8 billion PJSC VimpelCom - Sberbank RUB 15 billion (USD 0.2 billion ) Unused VF/CF headroom at the end 1Q16: VimpelCom - CDB RMB 0.7 billion (USD 0.1 billion) Algeria - syndicate DZD 32 billion (USD 0.3 billion) Pakistan - syndicate PKR 19 billion (USD 0.2 billion)
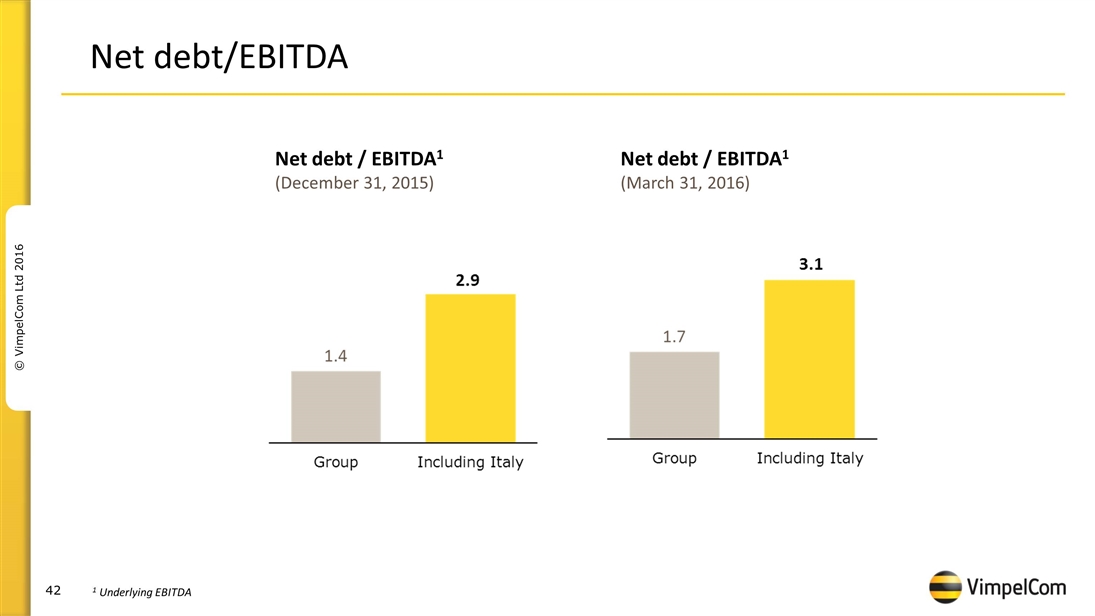
Net debt/EBITDA Net debt / EBITDA1 (December 31, 2015) Net debt / EBITDA1 (March 31, 2016) 1 Underlying EBITDA
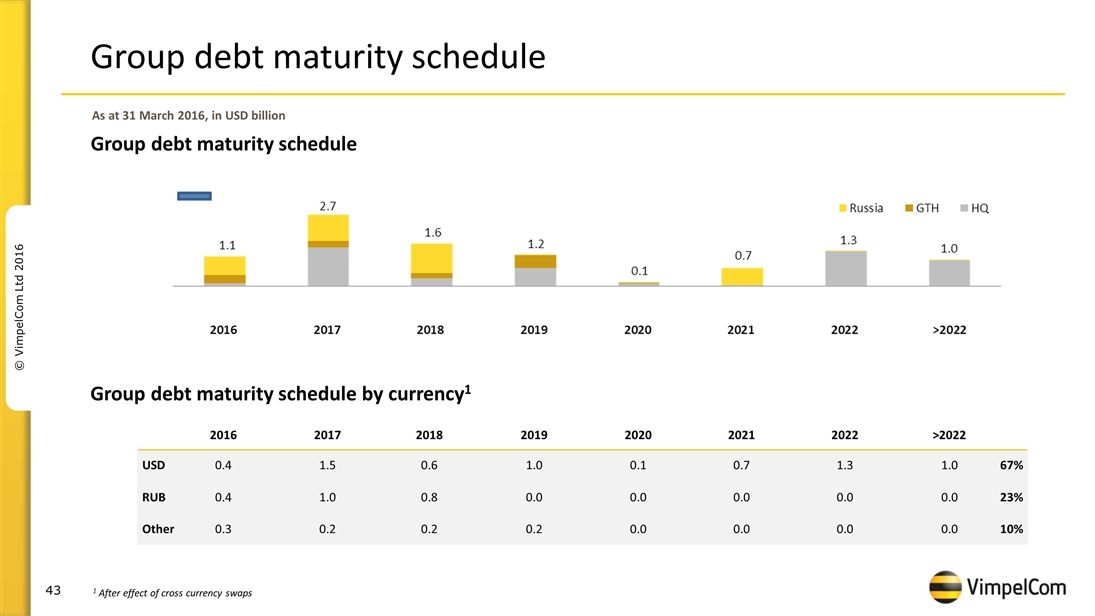
Group debt maturity schedule Group debt maturity schedule by currency1 As at 31 March 2016, in USD billion Group debt maturity schedule 1 After effect of cross currency swaps 2016 2017 2018 2019 2020 2021 2022 >2022 USD RUB Other 0.4 0.4 0.3 1.5 1.0 0.2 0.6 0.8 0.2 1.0 0.0 0.2 0.1 0.0 0.0 0.7 0.0 0.0 1.3 0.0 0.0 1.0 0.0 0.0 67% 23% 10%
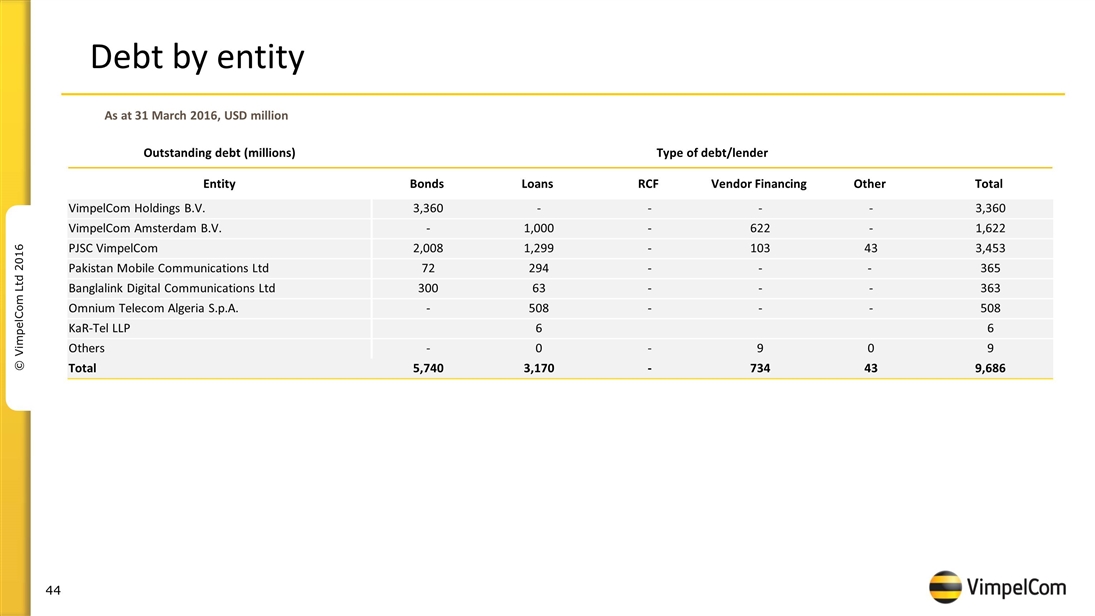
Debt by entity As at 31 March 2016, USD million Outstanding debt (millions) Type of debt/lender Entity Bonds Loans RCF Vendor Financing Other Total VimpelCom Holdings B.V. 3,360 - - - - 3,360 VimpelCom Amsterdam B.V. - 1,000 - 622 - 1,622 PJSC VimpelCom 2,008 1,299 - 103 43 3,453 Pakistan Mobile Communications Ltd 72 294 - - - 365 Banglalink Digital Communications Ltd 300 63 - - - 363 Omnium Telecom Algeria S.p.A. - 508 - - - 508 KaR-Tel LLP 6 6 Others - 0 - 9 0 9 Total 5,740 3,170 - 734 43 9,686
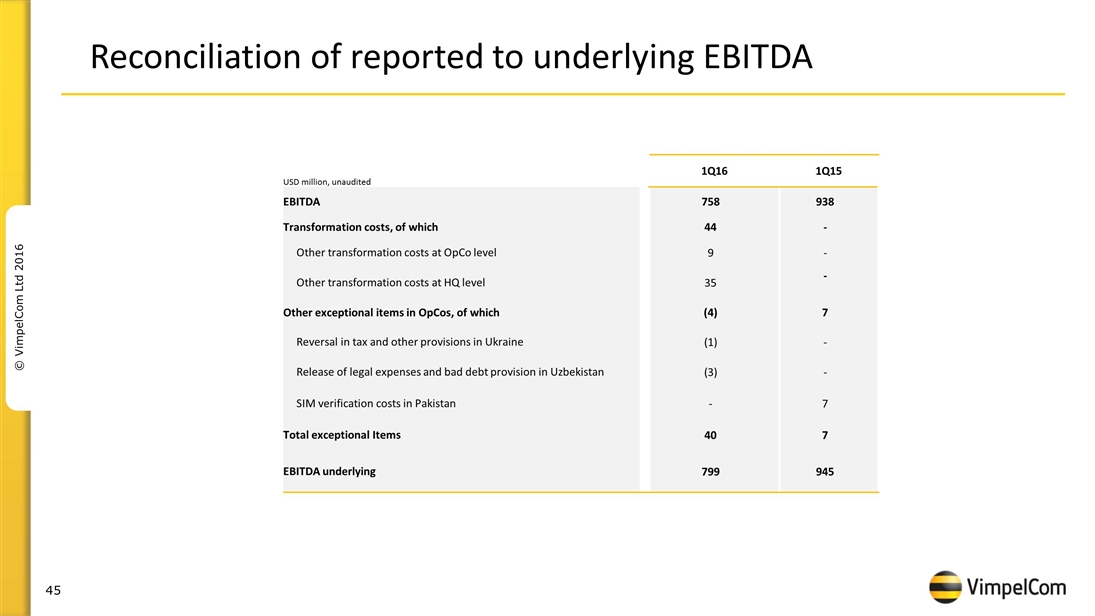
USD million, unaudited 1Q16 1Q15 EBITDA 758 938 Transformation costs, of which 44 - Other transformation costs at OpCo level 9 - Other transformation costs at HQ level 35 - Other exceptional items in OpCos, of which (4) 7 Reversal in tax and other provisions in Ukraine (1) - Release of legal expenses and bad debt provision in Uzbekistan (3) - SIM verification costs in Pakistan - 7 Total exceptional Items 40 7 EBITDA underlying 799 945 Reconciliation of reported to underlying EBITDA
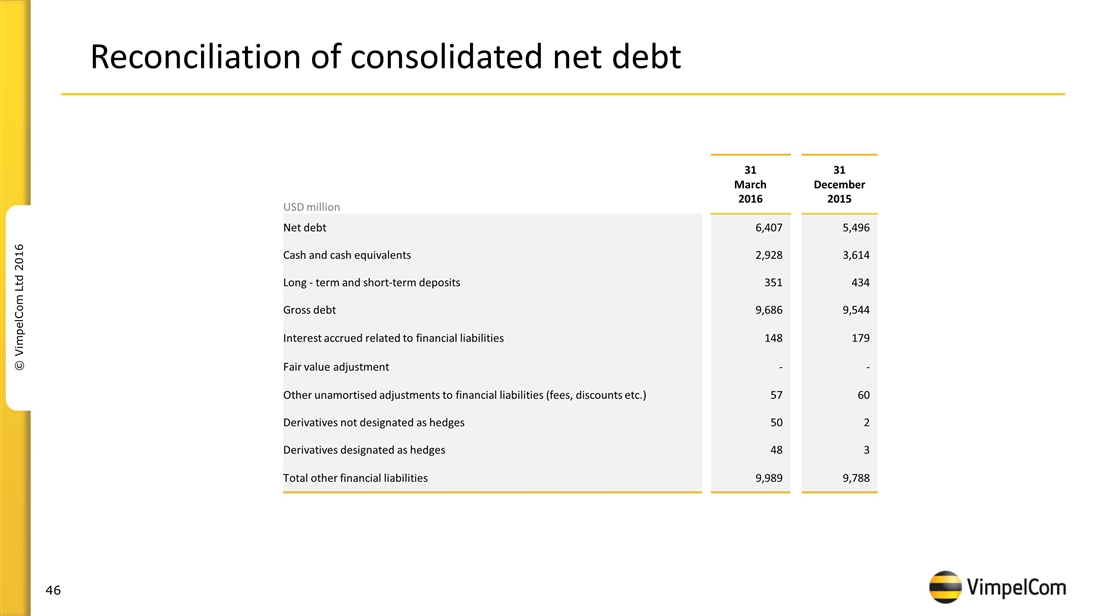
USD million 31 March 2016 31 December 2015 Net debt 6,407 5,496 Cash and cash equivalents 2,928 3,614 Long - term and short-term deposits 351 434 Gross debt 9,686 9,544 Interest accrued related to financial liabilities 148 179 Fair value adjustment - - Other unamortised adjustments to financial liabilities (fees, discounts etc.) 57 60 Derivatives not designated as hedges 50 2 Derivatives designated as hedges 48 3 Total other financial liabilities 9,989 9,788 Reconciliation of consolidated net debt
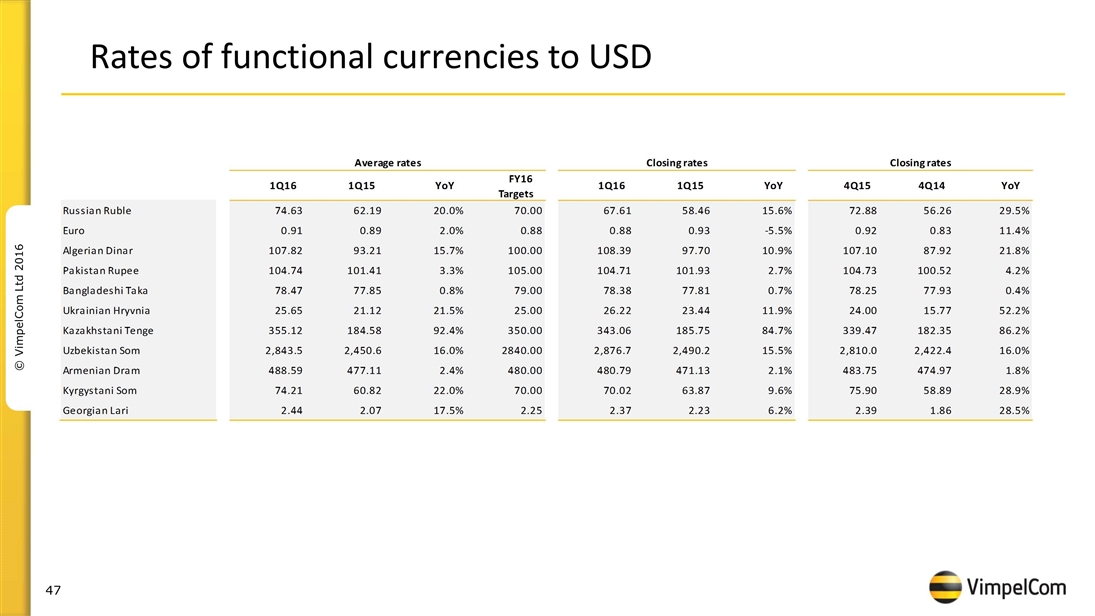
Rates of functional currencies to USD Average rates Closing rates Closing rates 1Q16 1Q15 YoY FY16 Targets 1Q16 1Q15 YoY 4Q15 4Q14 YoY Russian Ruble 74.628299999999996 62.191899999999997 0.19996816305660384 70 67.607600000000005 58.46 0.15647622305850151 72.8827 56.258400000000002 0.29549898326294377 Euro 0.90600000000000003 0.88849999999999996 1.9696117051209987 0.88 0.87870000000000004 0.93 -5.5% 0.92100000000000004 0.8266 0.11420275828695869 Algerian Dinar 107.81959999999999 93.213200000000001 0.15669883664545359 100 108.39360000000001 97.7 0.10945342886386911 107.1009 87.92 0.21816310282074602 Pakistan Rupee 104.7422 101.4063 3.3% 105 104.705 101.93 2.7% 104.73050000000001 100.52249999999999 4.2% Bangladeshi Taka 78.466899999999995 77.850399999999993 .8% 79 78.375 77.81 .7% 78.25 77.924999999999997 .4% Ukrainian Hryvnia 25.653700000000001 21.1157 0.21491117983301525 25 26.2181 23.44 0.11851962457337883 24.000699999999998 15.768599999999999 0.5220564920157782 Kazakhstani Tenge 355.11810000000003 184.5779 0.92394701640879018 350 343.06 185.75 0.84689098250336481 339.47 182.35 0.8616397038661916 Uzbekistan Som 2,843.5297 2,450.5747000000001 0.16035218187798964 2840 2,876.72 2,490.1999999999998 0.15521644847803384 2,809.98 2,422.4 0.15999834874504626 Armenian Dram 488.5942 477.11009999999999 2.4% 480 480.79 471.13 2.5% 483.75 474.97 1.8% Kyrgystani Som 74.212699999999998 60.823399999999999 0.22013402736446827 70 70.015799999999999 63.87 9.6% 75.899299999999997 58.886499999999998 0.28890832363954377 Georgian Lari 2.4350999999999998 2.0729000000000002 0.1747310531139947 2.25 2.3679000000000001 2.23 6.2% 2.3948999999999998 1.8635999999999999 0.28509336767546678
VimpelCom Ltd. with Italy classified as held for sale from 3Q15
index page
(in USD millions, unless stated otherwise, unaudited)
| Consolidated* |
1Q14 Pro Forma |
2Q14 Pro Forma |
3Q14 Pro Forma |
4Q14 Pro Forma |
1Q15 Pro Forma |
2Q15 Pro Forma |
3Q15 | 4Q15 | 1Q16 | FY14 | FY15 | |||||||||||||||||||||||||||||||||
| Total operating revenue |
3,465 | 3,507 | 3,544 | 3,000 | 2,312 | 2,570 | 2,442 | 2,301 | 2,023 | 13,517 | 9,625 | |||||||||||||||||||||||||||||||||
| Service revenue |
3,399 | 3,447 | 3,462 | 2,922 | 2,260 | 2,515 | 2,364 | 2,193 | 1,953 | 13,231 | 9,332 | |||||||||||||||||||||||||||||||||
| EBITDA |
1,496 | 1,470 | 1,520 | 1,074 | 938 | 1,069 | 58 | 811 | 758 | 5,560 | 2,857 | |||||||||||||||||||||||||||||||||
| EBITDA margin (%) |
43.2% | 41.9% | 42.9% | 35.8% | 40.6% | 41.6% | 41.7% | 35.2% | 37.5% | 41.1% | 29.7% | |||||||||||||||||||||||||||||||||
| EBIT |
770 | 766 | 873 | (536) | 308 | 530 | (480) | 166 | 304 | 1,873 | 506 | |||||||||||||||||||||||||||||||||
| Profit/(Loss) before tax |
378 | 503 | 427 | (933) | (8) | 329 | (834) | (100) | 155 | 375 | (613) | |||||||||||||||||||||||||||||||||
| Net income/(loss) |
38 | 102 | 105 | (890) | 184 | 108 | (1,005) | 58 | 189 | (647) | (691) | |||||||||||||||||||||||||||||||||
| Capital expenditures (CAPEX)(5) |
650 | 1,141 | 801 | 840 | 263 | 590 | 459 | 694 | 195 | 3,434 | 2,006 | |||||||||||||||||||||||||||||||||
| CAPEX excluding licenses(5) |
531 | 764 | 739 | 799 | 210 | 462 | 448 | 634 | 151 | 2,833 | 1,753 | |||||||||||||||||||||||||||||||||
| CAPEX excluding licenses / revenue |
15% | 22% | 21% | 27% | 9% | 18% | 18% | 28% | 7% | 21% | 18% | |||||||||||||||||||||||||||||||||
| Operating cash flow (EBITDA(5)-CAPEX excluding licenses) |
965 | 705 | 781 | 275 | 727 | 607 | 570 | 177 | 607 | 2,727 | 2,173 | |||||||||||||||||||||||||||||||||
| OCF margin (%) |
28% | 20% | 22% | 9% | 31% | 24% | 23% | 8% | 30% | 20% | 23% | |||||||||||||||||||||||||||||||||
VimpelCom Ltd. before Italy was classified as held for sale
(in USD millions, unless stated otherwise, unaudited)
| Consolidated* |
1Q13 | 2Q13 | 3Q13 | 4Q13* | 1Q14 | 2Q14 | 3Q14 | 4Q14 | 1Q15 | 2Q15 | FY12 | FY13* | FY14 | |||||||||||||||||||||||||||||||||||||||
| Total operating revenue |
5,591 | 5,718 | 5,685 | 5,552 | 5,024 | 5,067 | 5,145 | 4,391 | 3,515 | 3,759 | 23,061 | 22,546 | 19,627 | |||||||||||||||||||||||||||||||||||||||
| Service revenue |
5,313 | 5,449 | 5,477 | 5,290 | 4,810 | 4,861 | 4,847 | 4,207 | 3,358 | 3,610 | 22,122 | 21,531 | 18,725 | |||||||||||||||||||||||||||||||||||||||
| EBITDA |
2,348 | 2,425 | 2,474 | 1,013 | 2,088 | 2,076 | 2,205 | 1,600 | 1,396 | 1,511 | 9,768 | 8,260 | 7,970 | |||||||||||||||||||||||||||||||||||||||
| EBITDA margin (%) |
42.0% | 42.4% | 43.5% | 18.2% | 41.6% | 41.0% | 42.9% | 36.4% | 39.7% | 40.2% | 42.4% | 36.6% | 40.6% | |||||||||||||||||||||||||||||||||||||||
| EBIT |
1,107 | 1,224 | 1,233 | (3,218) | 924 | 938 | 1,143 | (421) | 879 | 646 | 4,171 | 346 | 2,586 | |||||||||||||||||||||||||||||||||||||||
| Profit/(Loss) before tax |
543 | 762 | 665 | (3,994) | 246 | 479 | 110 | (1,016) | 444 | 188 | 2,282 | (2,024) | (181) | |||||||||||||||||||||||||||||||||||||||
| Net income/(loss) |
408 | 573 | 255 | (3,861) | 38 | 100 | 104 | (935) | 184 | 108 | 1,539 | (2,625) | (691) | |||||||||||||||||||||||||||||||||||||||
| Capital expenditures (CAPEX) |
755 | 791 | 1,040 | 1,720 | 735 | 1,331 | 978 | 1,211 | 460 | 804 | 4,120 | 4,306 | 4,256 | |||||||||||||||||||||||||||||||||||||||
| CAPEX excluding licenses |
595 | 791 | 930 | 1,682 | 725 | 1,017 | 964 | 1,201 | 407 | 675 | 4,120 | 3,998 | 3,908 | |||||||||||||||||||||||||||||||||||||||
| CAPEX excluding licenses / revenue |
11% | 14% | 16% | 30% | 14% | 20% | 19% | 27% | 12% | 18% | 18% | 18% | 20% | |||||||||||||||||||||||||||||||||||||||
| Operating cash flow (EBITDA-CAPEX excluding licenses) |
1,753 | 1,634 | 1,544 | (669) | 1,363 | 1,059 | 1,241 | 399 | 989 | 836 | 5,648 | 4,262 | 4,062 | |||||||||||||||||||||||||||||||||||||||
| OCF margin (%) |
31% | 29% | 27% | (12%) | 27% | 21% | 24% | 9% | 28% | 22% | 24% | 19% | 21% | |||||||||||||||||||||||||||||||||||||||
* Notes:
| (1) | As a result of the succesful resolution in Algeria, adjustments to the following items were made: |
| (a) | 4Q13 EBITDA, EBITDA margin, EBIT and Loss before tax of USD 1.3 bln to reflect BofA claim |
| (b) | 4Q14 EBITDA, EBITDA margin, EBIT and Loss before tax of USD 50 mln to reflect Cevital settlement |
| (2) | 4Q13 EBITDA and CAPEX were affected by USD 72 mln as a result of fixed assets write off and accounted as operating expenses in Uzbekistan |
| (3) | 1Q13 and FY13 CAPEX excludes EUR 136 million of non-cash increase in Intangible Assets related to the contract with Terna in relation to the Right of Way of WIND’s backbone. |
| (4) | Previous periods were restated due to alignment with the Group definition. |
| (5) | Please refer to our EBITDA reconciliation table |
| (6) | EBITDA 4Q15 was restated due to late adjustments |
VimpelCom Ltd.
index page
(in millions)
| Mobile Customers* |
1Q15 | 2Q15 | 3Q15 | 4Q15 | 1Q16 | FY13 | FY14 | FY15 | ||||||||||||||||||||||||
| Russia |
55.7 | 57.2 | 59.0 | 59.8 | 57.7 | 56.5 | — | 59.8 | ||||||||||||||||||||||||
| Algeria |
17.1 | 17.1 | 17.0 | 17.0 | 16.7 | 17.6 | 16.5 | 17.0 | ||||||||||||||||||||||||
| Pakistan |
38.2 | 33.4 | 35.2 | 36.2 | 38.1 | 37.6 | 38.5 | 36.2 | ||||||||||||||||||||||||
| Bangladesh |
31.8 | 32.0 | 32.3 | 32.3 | 31.6 | 28.8 | 31.7 | 32.3 | ||||||||||||||||||||||||
| Ukraine |
26.1 | 26.1 | 25.7 | 25.4 | 25.3 | 25.8 | 25.3 | 25.4 | ||||||||||||||||||||||||
| Kazakhstan |
9.6 | 9.7 | 9.8 | 9.5 | 9.2 | 9.2 | 9.2 | 9.5 | ||||||||||||||||||||||||
| Uzbekistan |
10.4 | 10.3 | 10.2 | 9.9 | 9.5 | 10.5 | 9.4 | 9.9 | ||||||||||||||||||||||||
| Armenia |
0.8 | 0.8 | 0.8 | 0.8 | 0.8 | 0.7 | 0.8 | 0.8 | ||||||||||||||||||||||||
| Tajikistan |
1.3 | 1.2 | 1.2 | 1.2 | 1.2 | 1.3 | 1.2 | 1.2 | ||||||||||||||||||||||||
| Georgia |
1.3 | 1.3 | 1.4 | 1.3 | 1.2 | 1.1 | 1.2 | 1.3 | ||||||||||||||||||||||||
| Kyrgystan |
2.7 | 2.8 | 2.7 | 2.7 | 2.6 | 2.7 | 2.5 | 2.7 | ||||||||||||||||||||||||
| Laos |
0.2 | 0.2 | 0.2 | 0.2 | 0.2 | 0.3 | 0.2 | 0.2 | ||||||||||||||||||||||||
| Total without Italy** |
195.1 | 192.0 | 195.5 | 196.3 | 194.0 | 136.6 | 196.3 | |||||||||||||||||||||||||
| Italy |
21.4 | 21.4 | 21.3 | 21.1 | 20.9 | 22.3 | 20.9 | 21.1 | ||||||||||||||||||||||||
| Total on combined basis |
216.5 | 213.4 | 216.8 | 217.4 | 215.0 | 214.3 | 157.5 | 217.4 | ||||||||||||||||||||||||
| Fixed line Customers* |
1Q15 | 2Q15 | 3Q15 | 4Q15 | 1Q16 | FY13 | FY14 | FY15 | ||||||||||||||||||||||||
| Russia |
2.3 | 2.2 | 2.2 | 2.2 | 2.2 | — | ||||||||||||||||||||||||||
| Algeria |
— | — | — | — | — | — | ||||||||||||||||||||||||||
| Pakistan |
— | — | — | — | — | — | ||||||||||||||||||||||||||
| Bangladesh |
— | — | — | — | — | 0.8 | ||||||||||||||||||||||||||
| Ukraine |
0.8 | 0.8 | 0.8 | 0.8 | 0.8 | 0.2 | ||||||||||||||||||||||||||
| Kazakhstan |
0.2 | 0.2 | 0.2 | 0.2 | 0.2 | 0.0 | ||||||||||||||||||||||||||
| Uzbekistan |
0.0 | 0.0 | 0.0 | 0.0 | — | 0.2 | ||||||||||||||||||||||||||
| Armenia |
0.2 | 0.2 | 0.2 | 0.1 | 0.1 | — | ||||||||||||||||||||||||||
| Tajikistan |
— | — | — | — | — | — | ||||||||||||||||||||||||||
| Georgia |
— | — | — | — | — | — | ||||||||||||||||||||||||||
| Kyrgystan |
— | — | — | — | — | 2.2 | ||||||||||||||||||||||||||
| Laos |
— | — | — | — | 0.0 | — | ||||||||||||||||||||||||||
| Total without Italy** |
3.5 | 3.4 | 3.4 | 3.4 | 3.4 | — | — | 3.4 | ||||||||||||||||||||||||
| Italy |
2.2 | 2.2 | 2.2 | 2.3 | 2.3 | — | ||||||||||||||||||||||||||
| Total on combined basis |
5.7 | 5.6 | 5.6 | 5.7 | 5.7 | 3.4 | ||||||||||||||||||||||||||
| * | The numbers exclude customers of Wind Canada, CAR, Burundi and Zimbabwe, customers for Algeria have been restated |
| ** | Starting from 3Q15 Italian business is classified as held for sale |
Russia
index page
(in USD millions, unless stated otherwise, unaudited)
| CONSOLIDATED |
1Q13 | 2Q13 | 3Q13 | 4Q13 | 1Q14 | 2Q14 | 3Q14 | 4Q14 | 1Q15 | 2Q15 | 3Q15 | 4Q15 | 1Q16 | FY13 | FY14 | FY15 | ||||||||||||||||||||||||||||||||||||||||||||||||
| Total operating revenue |
2,304 | 2,334 | 2,298 | 2,173 | 1,893 | 1,964 | 2,021 | 1,580 | 1,067 | 1,292 | 1,154 | 1,089 | 890 | 9,109 | 7,459 | 4,602 | ||||||||||||||||||||||||||||||||||||||||||||||||
| EBITDA** |
963 | 997 | 980 | 876 | 760 | 813 | 827 | 580 | 421 | 524 | 455 | 424 | 324 | 3,815 | 2,980 | 1,824 | ||||||||||||||||||||||||||||||||||||||||||||||||
| EBITDA margin (%)** |
41.8% | 42.7% | 42.6% | 40.3% | 40.1% | 41.4% | 40.9% | 36.6% | 39.4% | 40.5% | 39.3% | 38.9% | 36.4% | 41.9% | 40.0% | 39.2% | ||||||||||||||||||||||||||||||||||||||||||||||||
| Capital expenditures (CAPEX) |
220 | 355 | 395 | 852 | 325 | 392 | 419 | 423 | 84 | 216 | 202 | 403 | 48 | 1,822 | 1,559 | 906 | ||||||||||||||||||||||||||||||||||||||||||||||||
| CAPEX excluding licenses |
220 | 355 | 395 | 852 | 315 | 378 | 405 | 416 | 80 | 212 | 198 | 343 | 43 | 1,822 | 1,514 | 833 | ||||||||||||||||||||||||||||||||||||||||||||||||
| Operating cash flow (EBITDA-CAPEX excluding licenses)** |
743 | 642 | 585 | 24 | 445 | 435 | 422 | 164 | 341 | 312 | 257 | 81 | 281 | 1,993 | 1,466 | 991 | ||||||||||||||||||||||||||||||||||||||||||||||||
| OCF margin (%)** |
32% | 27% | 25% | 1% | 23% | 22% | 21% | 10% | 32% | 24% | 22% | 7% | 32% | 22% | 20% | 22% | ||||||||||||||||||||||||||||||||||||||||||||||||
| MOBILE |
1Q13 | 2Q13 | 3Q13 | 4Q13 | 1Q14 | 2Q14 | 3Q14 | 4Q14 | 1Q15 | 2Q15 | 3Q15 | 4Q15 | 1Q16 | FY13 | FY14 | FY15 | ||||||||||||||||||||||||||||||||||||||||||||||||
| Total operating revenues |
1,911 | 1,937 | 1,902 | 1,786 | 1,540 | 1,604 | 1,651 | 1,275 | 870 | 1,078 | 973 | 915 | 743 | 7,536 | 6,070 | 3,836 | ||||||||||||||||||||||||||||||||||||||||||||||||
| Service Revenue (Mobile) |
1,776 | 1,833 | 1,854 | 1,730 | 1,500 | 1,569 | 1,600 | 1,208 | 839 | 1,043 | 930 | 859 | 706 | 7,193 | 5,877 | 3,672 | ||||||||||||||||||||||||||||||||||||||||||||||||
| Data Revenue (Mobile)* |
236 | 242 | 246 | 270 | 251 | 256 | 272 | 224 | 164 | 199 | 180 | 183 | 164 | 994 | 1,003 | 726 | ||||||||||||||||||||||||||||||||||||||||||||||||
| Customers (mln) |
55.7 | 57.1 | 58.1 | 56.5 | 55.0 | 56.3 | 57.3 | 57.2 | 55.7 | 57.2 | 59.0 | 59.8 | 57.7 | 56.5 | 57.2 | 59.8 | ||||||||||||||||||||||||||||||||||||||||||||||||
| Mobile data customers (mln)* |
n.a. | n.a. | n.a. | n.a. | n.a. | n.a. | n.a. | n.a. | 31.0 | 30.8 | 33.3 | 34.3 | 32.6 | n.a. | n.a. | 34.3 | ||||||||||||||||||||||||||||||||||||||||||||||||
| ARPU (USD)* |
10.6 | 10.8 | 10.6 | 10.1 | 8.9 | 9.3 | 9.3 | 7.0 | 4.8 | 6.0 | 5.2 | 4.7 | 3.9 | n.a. | n.a. | n.a. | ||||||||||||||||||||||||||||||||||||||||||||||||
| MOU, min |
277 | 294 | 290 | 293 | 287 | 310 | 311 | 316 | 303 | 320 | 319 | 319 | 315 | n.a. | n.a. | n.a. | ||||||||||||||||||||||||||||||||||||||||||||||||
| Churn 3 months active base (quarterly), % |
15% | 14% | 15% | 18% | 17.1% | 13.4% | 14.5% | 15.7% | 15.8% | 12.8% | 13.4% | 12.6% | 16% | n.a. | n.a. | n.a. | ||||||||||||||||||||||||||||||||||||||||||||||||
| MBOU* |
n.a. | n.a. | n.a. | n.a. | n.a. | n.a. | n.a. | n.a. | 1,483 | 1,490 | 1,607 | 1,790 | 1,931 | n.a. | n.a. | n.a. | ||||||||||||||||||||||||||||||||||||||||||||||||
| FIXED-LINE |
1Q13 | 2Q13 | 3Q13 | 4Q13 | 1Q14 | 2Q14 | 3Q14 | 4Q14 | 1Q15 | 2Q15 | 3Q15 | 4Q15 | 1Q16 | FY13 | FY14 | FY15 | ||||||||||||||||||||||||||||||||||||||||||||||||
| Total operating revenue |
393 | 397 | 395 | 387 | 353 | 360 | 370 | 305 | 197 | 214 | 181 | 174 | 147 | 1,572 | 1,388 | 766 | ||||||||||||||||||||||||||||||||||||||||||||||||
| Service revenue |
387 | 392 | 392 | 381 | 348 | 355 | 366 | 303 | 196 | 213 | 181 | 171 | 146 | 1,552 | 1,372 | 761 | ||||||||||||||||||||||||||||||||||||||||||||||||
| Broadband revenue |
105 | 100 | 95 | 97 | 91 | 93 | 86 | 69 | 51 | 58 | 46 | 41 | 40 | 397 | 339 | 196 | ||||||||||||||||||||||||||||||||||||||||||||||||
| Broadband customers (mln) |
2.4 | 2.3 | 2.3 | 2.3 | 2.3 | 2.2 | 2.2 | 2.3 | 2.3 | 2.2 | 2.2 | 2.2 | 2.2 | 2.3 | 2.3 | 2.2 | ||||||||||||||||||||||||||||||||||||||||||||||||
| Broadband ARPU (USD) |
14.5 | 14.0 | 13.5 | 13.9 | 13.1 | 13.5 | 12.5 | 10.2 | 7.4 | 8.6 | 6.8 | 6.2 | 6.0 | n.a. | n.a. | n.a. | ||||||||||||||||||||||||||||||||||||||||||||||||
| FTTB revenue |
101 | 98 | 92 | 94 | 88 | 90 | 83 | 69 | 50 | 57 | 45 | 41 | 39 | 385 | 330 | 193 | ||||||||||||||||||||||||||||||||||||||||||||||||
| FTTB customers (mln) |
2.3 | 2.3 | 2.3 | 2.3 | 2.2 | 2.2 | 2.2 | 2.3 | 2.2 | 2.2 | 2.2 | 2.2 | 2.2 | 2.3 | 2.3 | 2.2 | ||||||||||||||||||||||||||||||||||||||||||||||||
| FTTB ARPU (USD) |
14.6 | 14.1 | 13.5 | 13.9 | 13.1 | 13.5 | 12.5 | 10.3 | 7.4 | 8.6 | 6.8 | 6.2 | 6.0 | n.a. | n.a. | n.a. | ||||||||||||||||||||||||||||||||||||||||||||||||
| (in RUB millions, unless stated otherwise, unaudited) |
| |||||||||||||||||||||||||||||||||||||||||||||||||||||||||||||||
| CONSOLIDATED |
1Q13 | 2Q13 | 3Q13 | 4Q13 | 1Q14 | 2Q14 | 3Q14 | 4Q14 | 1Q15 | 2Q15 | 3Q15 | 4Q15 | 1Q16 | FY13 | FY14 | FY15 | ||||||||||||||||||||||||||||||||||||||||||||||||
| Total operating revenue |
70,080 | 73,816 | 75,354 | 70,660 | 66,148 | 68,722 | 73,082 | 73,947 | 66,276 | 68,035 | 72,369 | 71,747 | 66,297 | 289,910 | 281,898 | 278,427 | ||||||||||||||||||||||||||||||||||||||||||||||||
| EBITDA** |
29,292 | 31,519 | 32,131 | 28,479 | 26,548 | 28,468 | 29,878 | 27,042 | 26,130 | 27,536 | 28,466 | 28,012 | 24,159 | 121,421 | 111,935 | 110,145 | ||||||||||||||||||||||||||||||||||||||||||||||||
| EBITDA margin (%)** |
41.8% | 42.7% | 42.6% | 40.3% | 40.1% | 41.4% | 40.9% | 36.6% | 39.4% | 40.5% | 39.3% | 39.0% | 36.4% | 41.9% | 39.7% | 39.6% | ||||||||||||||||||||||||||||||||||||||||||||||||
| Capital expenditures (CAPEX) |
6,711 | 11,264 | 12,946 | 27,871 | 11,486 | 13,706 | 15,147 | 20,970 | 5,425 | 11,396 | 12,645 | 27,308 | 3,551 | 58,792 | 61,309 | 56,775 | ||||||||||||||||||||||||||||||||||||||||||||||||
| CAPEX excluding licenses* |
6,711 | 11,264 | 12,946 | 27,871 | 11,145 | 13,218 | 14,664 | 20,648 | 5,179 | 11,164 | 12,358 | 23,368 | 3,181 | 58,792 | 59,675 | 52,069 | ||||||||||||||||||||||||||||||||||||||||||||||||
| Operating cash flow (EBITDA-CAPEX excluding licenses)** |
22,581 | 20,255 | 19,185 | 608 | 15,403 | 15,250 | 15,214 | 6,394 | 20,951 | 16,372 | 16,108 | 4,644 | 20,978 | 62,629 | 52,261 | 58,076 | ||||||||||||||||||||||||||||||||||||||||||||||||
| OCF margin (%)** |
32% | 27% | 25% | 1% | 23% | 22% | 21% | 9% | 32% | 24% | 22% | 6% | 32% | 22% | 21% | 21% | ||||||||||||||||||||||||||||||||||||||||||||||||
| MOBILE |
1Q13 | 2Q13 | 3Q13 | 4Q13 | 1Q14 | 2Q14 | 3Q14 | 4Q14 | 1Q15 | 2Q15 | 3Q15 | 4Q15 | 1Q16 | FY13 | FY14 | FY15 | ||||||||||||||||||||||||||||||||||||||||||||||||
| Total operating revenues |
58,117 | 61,254 | 62,395 | 58,087 | 53,805 | 56,133 | 59,691 | 59,637 | 54,024 | 56,758 | 61,005 | 60,302 | 55,371 | 239,852 | 229,266 | 232,088 | ||||||||||||||||||||||||||||||||||||||||||||||||
| Service revenue |
54,003 | 57,959 | 60,804 | 56,253 | 52,385 | 54,883 | 57,810 | 56,360 | 52,148 | 54,926 | 58,307 | 56,543 | 52,620 | 229,020 | 221,438 | 221,925 | ||||||||||||||||||||||||||||||||||||||||||||||||
| Data Revenue* |
7,194 | 7,649 | 8,054 | 8,792 | 8,755 | 8,957 | 9,829 | 10,523 | 10,204 | 10,473 | 11,268 | 12,079 | 12,188 | 31,689 | 38,065 | 44,024 | ||||||||||||||||||||||||||||||||||||||||||||||||
| Customers (mln) |
55.7 | 57.1 | 58.1 | 56.5 | 55.0 | 56.3 | 57.3 | 57.2 | 55.7 | 57.2 | 59.0 | 59.8 | 57.7 | 56.5 | 57.2 | 59.8 | ||||||||||||||||||||||||||||||||||||||||||||||||
| Mobile data customers (mln)* |
n.a. | n.a. | n.a. | n.a. | n.a. | n.a. | n.a. | n.a. | 31.0 | 30.8 | 33.3 | 34.3 | 32.6 | n.a. | n.a. | 34 | ||||||||||||||||||||||||||||||||||||||||||||||||
| ARPU (RUB)* |
321 | 341 | 349 | 327 | 310 | 326 | 336 | 325 | 300 | 316 | 326 | 309 | 291 | n.a. | n.a. | n.a. | ||||||||||||||||||||||||||||||||||||||||||||||||
| MOU (min) |
277 | 294 | 290 | 293 | 287 | 310 | 311 | 316 | 303 | 320 | 319 | 319 | 314.8 | n.a. | n.a. | n.a. | ||||||||||||||||||||||||||||||||||||||||||||||||
| Churn 3 months active base (quarterly) (%) |
15% | 14% | 15% | 18% | 17% | 13% | 15% | 16% | 16% | 13% | 13% | 13% | 16% | n.a. | n.a. | n.a. | ||||||||||||||||||||||||||||||||||||||||||||||||
| MBOU* |
n.a. | n.a. | n.a. | n.a. | n.a. | n.a. | n.a. | n.a. | 1,483 | 1,490 | 1,607 | 1,790 | 1,931 | n.a. | n.a. | n.a. | ||||||||||||||||||||||||||||||||||||||||||||||||
| FIXED-LINE |
1Q13 | 2Q13 | 3Q13 | 4Q13 | 1Q14 | 2Q14 | 3Q14 | 4Q14 | 1Q15 | 2Q15 | 3Q15 | 4Q15 | 1Q16 | FY13 | FY14 | FY15 | ||||||||||||||||||||||||||||||||||||||||||||||||
| Total operating revenue |
11,963 | 12,561 | 12,960 | 12,574 | 12,343 | 12,589 | 13,391 | 14,309 | 12,252 | 11,278 | 11,364 | 11,445 | 10,926 | 50,058 | 52,632 | 46,339 | ||||||||||||||||||||||||||||||||||||||||||||||||
| Service revenue |
11,774 | 12,396 | 12,841 | 12,402 | 12,175 | 12,444 | 13,228 | 14,217 | 12,200 | 11,235 | 11,327 | 11,279 | 10,862 | 49,413 | 52,064 | 46,041 | ||||||||||||||||||||||||||||||||||||||||||||||||
| Broadband revenue |
3,187 | 3,173 | 3,119 | 3,152 | 3,187 | 3,251 | 3,103 | 3,230 | 3,168 | 3,060 | 2,869 | 2,886 | 2,811 | 12,632 | 12,771 | 11,983 | ||||||||||||||||||||||||||||||||||||||||||||||||
| Broadband customers (mln) |
2.4 | 2.3 | 2.3 | 2.3 | 2.3 | 2.2 | 2.2 | 2.3 | 2.3 | 2.2 | 2.2 | 2.2 | 2.2 | 2.3 | 2.3 | 2.2 | ||||||||||||||||||||||||||||||||||||||||||||||||
| Broadband ARPU (RUB) |
440 | 443 | 443 | 451 | 457 | 474 | 454 | 477 | 459 | 451 | 428 | 432 | 422 | n.a. | n.a. | n.a. | ||||||||||||||||||||||||||||||||||||||||||||||||
| FTTB revenue |
3,086 | 3,084 | 3,024 | 3,056 | 3,078 | 3,156 | 3,004 | 3,196 | 3,095 | 3,005 | 2,820 | 2,841 | 2,762 | 12,250 | 12,434 | 11,760 | ||||||||||||||||||||||||||||||||||||||||||||||||
| FTTB customers (mln) |
2.3 | 2.3 | 2.3 | 2.3 | 2.2 | 2.2 | 2.2 | 2.3 | 2.2 | 2.2 | 2.2 | 2.2 | 2.2 | 2.3 | 2.3 | 2.2 | ||||||||||||||||||||||||||||||||||||||||||||||||
| FTTB ARPU (RUB) |
443 | 446 | 443 | 450 | 457 | 473 | 454 | 477 | 459 | 451 | 428 | 432 | 423 | n.a. | n.a. | n.a. | ||||||||||||||||||||||||||||||||||||||||||||||||
| * | Previous periods were restated due to alignment with the Group definition. |
| ** | EBITDA for 4Q15 was restated due to the late adjustments after publication of 4Q15 Factbook |
Algeria
index page
(in USD millions, unless stated otherwise, unaudited)
| MOBILE |
1Q14 | 2Q14 | 3Q14 | 4Q14** | 1Q15 | 2Q15 | 3Q15 | 4Q15 | 1Q16 | FY13* | FY14*** | FY15 | ||||||||||||||||||||||||||||||||||||
| Total operating revenue |
429 | 437 | 429 | 396 | 323 | 328 | 325 | 299 | 279 | 1,796 | 1,690 | 1,273 | ||||||||||||||||||||||||||||||||||||
| Service revenue |
428 | 434 | 422 | 393 | 320 | 326 | 321 | 292 | 276 | 1,791 | 1,678 | 1,259 | ||||||||||||||||||||||||||||||||||||
| EBITDA |
247 | 238 | 225 | 198 | 169 | 175 | 178 | 162 | 158 | 1,054 | 907 | 684 | ||||||||||||||||||||||||||||||||||||
| EBITDA margin (%) |
57.6% | 54.5% | 52.5% | 49.8% | 52.3% | 53.4% | 54.8% | 54.3% | 56.8% | 59.1% | 53.5% | 53.7% | ||||||||||||||||||||||||||||||||||||
| Capital expenditures (CAPEX) |
60 | 162 | 84 | 109 | 45 | 46 | 33 | 69 | 27 | 122 | 415 | 192 | ||||||||||||||||||||||||||||||||||||
| CAPEX excluding licenses |
60 | 162 | 84 | 109 | 45 | 46 | 33 | 69 | 27 | 84 | 415 | 192 | ||||||||||||||||||||||||||||||||||||
| Data Revenue |
2.6 | 2.4 | 9.1 | 7.8 | 8.0 | 11.5 | 13.1 | 13.3 | 16.2 | 8.4 | 21.8 | 45.9 | ||||||||||||||||||||||||||||||||||||
| Customers (mln) |
17.4 | 17.1 | 17.6 | 17.7 | 17.1 | 17.1 | 17.0 | 17.0 | 16.7 | 17.6 | 17.7 | 17.0 | ||||||||||||||||||||||||||||||||||||
| ARPU (USD) |
8.1 | 8.3 | 7.9 | 7.4 | 6.1 | 6.3 | 6.1 | 5.7 | 5.4 | n.a. | n.a. | n.a. | ||||||||||||||||||||||||||||||||||||
| MOU (min)*** |
215 | 218 | 213 | 204 | 344 | 387 | 390 | 375 | 348 | n.a. | n.a. | n.a. | ||||||||||||||||||||||||||||||||||||
| Churn 3 months active base |
6.8% | 7.6% | 7.5% | 6.4% | 11.6% | 8.7% | 9.6% | 9.1% | 9.0% | n.a. | n.a. | n.a. | ||||||||||||||||||||||||||||||||||||
| MBOU* |
n.a. | n.a. | n.a. | n.a. | 208 | 273 | 255 | 288 | 295 | n.a. | n.a. | n.a. | ||||||||||||||||||||||||||||||||||||
| Operating cash flow (EBITDA-CAPEX excluding licenses) |
187 | 76 | 141 | 116 | 124 | 129 | 145 | 93 | 131 | 971 | 520 | 491 | ||||||||||||||||||||||||||||||||||||
| OCF margin (%) |
44% | 17% | 33% | 29% | 38% | 39% | 45% | 31% | 47% | 54% | 31% | 39% | ||||||||||||||||||||||||||||||||||||
| (in DZD billions, unless stated otherwise, unaudited) |
| |||||||||||||||||||||||||||||||||||||||||||||||
| MOBILE |
1Q14 | 2Q14 | 3Q14 | 4Q14 | 1Q15 | 2Q15 | 3Q15 | 4Q15 | 1Q16 | FY13 | FY14 | FY15 | ||||||||||||||||||||||||||||||||||||
| Total operating revenue |
33.5 | 34.5 | 34.4 | 33.7 | 30.0 | 32.2 | 33.4 | 31.9 | 30.0 | 142.8 | 136.2 | 127.6 | ||||||||||||||||||||||||||||||||||||
| Service revenue |
33.4 | 34.3 | 33.9 | 33.5 | 29.8 | 32.0 | 33.1 | 31.2 | 29.7 | 142.7 | 135.0 | 126.1 | ||||||||||||||||||||||||||||||||||||
| EBITDA |
19.2 | 18.8 | 18.1 | 16.8 | 15.7 | 17.2 | 18.3 | 17.3 | 17.1 | 85.0 | 72.6 | 68.6 | ||||||||||||||||||||||||||||||||||||
| EBITDA margin (%) |
57.4% | 54.3% | 52.5% | 49.8% | 52.3% | 53.4% | 54.8% | 54.3% | 56.8% | 59.1% | 53.5% | 53.7% | ||||||||||||||||||||||||||||||||||||
| Capital expenditures (CAPEX) |
n.a. | n.a. | n.a. | n.a. | 4.2 | 4.5 | 3.4 | 7.3 | 2.9 | n.a. | n.a. | 20 | ||||||||||||||||||||||||||||||||||||
| CAPEX excluding licenses |
n.a. | n.a. | n.a. | n.a. | 4.2 | 4.5 | 3.4 | 7.3 | 2.9 | n.a. | n.a. | 20 | ||||||||||||||||||||||||||||||||||||
| Data Revenue |
0.2 | 0.2 | 0.5 | 0.7 | 0.7 | 1.1 | 1.4 | 1.4 | 1.7 | 0.7 | 1.6 | 4.6 | ||||||||||||||||||||||||||||||||||||
| Customers (mln) |
17.4 | 17.1 | 17.6 | 17.7 | 17.1 | 17.1 | 17.0 | 17.0 | 16.7 | 17.6 | 17.7 | 17.0 | ||||||||||||||||||||||||||||||||||||
| ARPU (DZD) |
631 | 657 | 648 | 622 | 569 | 620 | 620 | 608 | 583 | n.a. | n.a. | n.a. | ||||||||||||||||||||||||||||||||||||
| MOU (min)*** |
215 | 205 | 213 | 204 | 344 | 387 | 390 | 375 | 348 | n.a. | n.a. | n.a. | ||||||||||||||||||||||||||||||||||||
| Churn 3 months active base (quarterly) (%) |
6.8% | 7.6% | 7.5% | 6.4% | 11.6% | 8.7% | 9.6% | 9.1% | 9% | n.a. | n.a. | n.a. | ||||||||||||||||||||||||||||||||||||
| MBOU* |
n.a. | n.a. | n.a. | n.a. | 208 | 273 | 255 | 288 | 295 | n.a. | n.a. | n.a. | ||||||||||||||||||||||||||||||||||||
| * | Number of data customers was restated due to technical reason. As the result of it MBOU was restated as well for periods 1Q15-4Q15 |
| ** | 4Q14 EBITDA excludes USD 50 mln (DZD 4 bln) one-off provisions related to the 51% sale in Algeria |
| *** | Starting from 1Q15 MOU is reported (not MOU billed) due to alingment with the Group policies. |
Pakistan
index page
(in USD millions, unless stated otherwise, unaudited)
| MOBILE |
1Q13 | 2Q13 | 3Q13 | 4Q13 | 1Q14 | 2Q14 | 3Q14 | 4Q14 | 1Q15 | 2Q15 | 3Q15 | 4Q15 | 1Q16 | FY13 | FY14 | FY15 | ||||||||||||||||||||||||||||||||||||||||||||||||
| Total operating revenue |
278 | 289 | 259 | 240 | 251 | 268 | 241 | 251 | 249 | 257 | 252 | 256 | 273 | 1,066 | 1,010 | 1,014 | ||||||||||||||||||||||||||||||||||||||||||||||||
| Service revenue |
268 | 280 | 250 | 231 | 241 | 256 | 230 | 239 | 236 | 244 | 238 | 241 | 257 | 1,029 | 966 | 960 | ||||||||||||||||||||||||||||||||||||||||||||||||
| EBITDA |
117 | 125 | 111 | 89 | 99 | 104 | 84 | 99 | 96 | 106 | 103 | 104 | 116 | 442 | 386 | 409 | ||||||||||||||||||||||||||||||||||||||||||||||||
| EBITDA margin (%) |
42.3% | 43.0% | 43.0% | 37.2% | 39.5% | 38.9% | 34.9% | 39.5% | 38.5% | 41.3% | 41.0% | 40.5% | 42.6% | 41.5% | 38.2% | 40.4% | ||||||||||||||||||||||||||||||||||||||||||||||||
| Capital expenditures (CAPEX) |
9 | 39 | 52 | 90 | 55 | 410 | 97 | 89 | 26 | 79 | 65 | 68 | 12 | 190 | 651 | 238 | ||||||||||||||||||||||||||||||||||||||||||||||||
| CAPEX excluding licenses |
9 | 39 | 52 | 90 | 55 | 110 | 97 | 89 | 26 | 79 | 65 | 68 | 12 | 190 | 351 | 238 | ||||||||||||||||||||||||||||||||||||||||||||||||
| Data Revenue |
6.8 | 7.8 | 8.7 | 8.6 | 9.8 | 12.2 | 12.5 | 14.2 | 18.7 | 20.6 | 21.6 | 24.8 | 32.7 | 31.9 | 48.7 | 85.6 | ||||||||||||||||||||||||||||||||||||||||||||||||
| Customers (mln) |
36.3 | 37.1 | 37.4 | 37.6 | 38.2 | 38.8 | 38.7 | 38.5 | 38.2 | 33.4 | 35.2 | 36.2 | 38.1 | 37.6 | 38.5 | 36.2 | ||||||||||||||||||||||||||||||||||||||||||||||||
| ARPU (USD) |
2.5 | 2.5 | 2.2 | 2.0 | 2.0 | 2.2 | 1.9 | 2.0 | 2.0 | 2.2 | 2.2 | 2.2 | 2.2 | n.a. | n.a. | n.a. | ||||||||||||||||||||||||||||||||||||||||||||||||
| MOU (min)* |
228 | 233 | 222 | 222 | 213 | 230 | 236 | 273 | 559 | 658 | 684 | 689 | 692 | n.a. | n.a. | n.a. | ||||||||||||||||||||||||||||||||||||||||||||||||
| Churn 3 months active base (quarterly) (%) |
3.9% | 5.3% | 6.5% | 7.3% | 5.7% | 6.4% | 6.8% | 7.0% | 3.8% | 21.6% | 3.7% | 5.5% | 4.0% | n.a. | n.a. | n.a. | ||||||||||||||||||||||||||||||||||||||||||||||||
| MBOU |
n.a. | n.a. | n.a. | n.a. | n.a. | n.a. | n.a. | n.a. | 297 | 298 | 350 | 341 | 297 | n.a. | n.a. | n.a. | ||||||||||||||||||||||||||||||||||||||||||||||||
| Operating cash flow (EBITDA-CAPEX excluding licenses) |
108 | 86 | 59 | (1) | 44 | (6) | (13) | 10 | 70 | 27 | 39 | 35 | 104 | 252 | 35 | 171 | ||||||||||||||||||||||||||||||||||||||||||||||||
| OCF margin (%) |
39% | 30% | 23% | 0% | 18% | (2%) | (5%) | 4% | 28% | 11% | 15% | 14% | 38% | 24% | 3% | 17% | ||||||||||||||||||||||||||||||||||||||||||||||||
(in PKR billions, unless stated otherwise, unaudited)
| MOBILE |
1Q13 | 2Q13 | 3Q13 | 4Q13 | 1Q14 | 2Q14 | 3Q14 | 4Q14 | 1Q15 | 2Q15 | 3Q15 | 4Q15 | 1Q16 | FY13 | FY14 | FY15 | ||||||||||||||||||||||||||||||||||||||||||||||||
| Total operating revenue |
27.0 | 28.5 | 26.7 | 25.7 | 26.0 | 26.3 | 24.2 | 25.5 | 25.3 | 26.2 | 25.9 | 26.8 | 28.6 | 108.0 | 102.1 | 104.2 | ||||||||||||||||||||||||||||||||||||||||||||||||
| Service revenue |
26.3 | 27.6 | 25.7 | 24.5 | 24.9 | 25.2 | 23.1 | 24.3 | 24.0 | 24.9 | 24.5 | 25.3 | 27.0 | 104.1 | 97.6 | 98.6 | ||||||||||||||||||||||||||||||||||||||||||||||||
| EBITDA |
11.5 | 12.3 | 11.5 | 9.6 | 10.0 | 10.2 | 8.5 | 10.1 | 9.7 | 10.8 | 10.6 | 10.9 | 12.2 | 44.5 | 39.0 | 42.0 | ||||||||||||||||||||||||||||||||||||||||||||||||
| EBITDA margin (%) |
42.3% | 43.0% | 43.1% | 37.2% | 39.5% | 38.9% | 34.9% | 39.5% | 38.5% | 41.3% | 41.0% | 40.5% | 42.6% | 41.5% | 38.2% | 40.4% | ||||||||||||||||||||||||||||||||||||||||||||||||
| Capital expenditures (CAPEX) |
n.a. | n.a. | n.a. | n.a. | n.a. | n.a. | n.a. | n.a. | 2.6 | 8.1 | 6.7 | 7.2 | 1.3 | n.a. | n.a. | 24.5 | ||||||||||||||||||||||||||||||||||||||||||||||||
| CAPEX excluding licenses |
n.a. | n.a. | n.a. | n.a. | n.a. | n.a. | n.a. | n.a. | 2.6 | 8.1 | 6.7 | 7.2 | 1.3 | n.a. | n.a. | 24.5 | ||||||||||||||||||||||||||||||||||||||||||||||||
| Data Revenue |
0.7 | 0.8 | 0.9 | 0.9 | 1.0 | 1.2 | 1.3 | 1.4 | 1.9 | 2.1 | 2.2 | 2.6 | 3.4 | 3.3 | 4.9 | 8.8 | ||||||||||||||||||||||||||||||||||||||||||||||||
| Customers (mln) |
36.3 | 37.1 | 37.4 | 37.6 | 38.2 | 38.8 | 38.7 | 38.5 | 38.2 | 33.4 | 35.2 | 36.2 | 38.1 | 37.6 | 38.5 | 36.2 | ||||||||||||||||||||||||||||||||||||||||||||||||
| ARPU (PKR) |
244 | 249 | 229 | 219 | 216 | 214 | 195 | 204 | 203 | 225 | 230 | 228 | 234 | n.a. | n.a. | n.a. | ||||||||||||||||||||||||||||||||||||||||||||||||
| MOU (min)* |
228 | 233 | 222 | 222 | 213 | 230 | 236 | 273 | 559 | 658 | 684 | 689 | 692 | n.a. | n.a. | n.a. | ||||||||||||||||||||||||||||||||||||||||||||||||
| Churn 3 months active base |
3.9% | 5.3% | 6.5% | 7.3% | 5.7% | 6.4% | 6.8% | 7.0% | 3.8% | 21.6% | 3.7% | 5.5% | 4.0% | n.a. | n.a. | n.a. | ||||||||||||||||||||||||||||||||||||||||||||||||
| MBOU |
n.a. | n.a. | n.a. | n.a. | n.a. | n.a. | n.a. | n.a. | 297 | 298 | 350 | 341 | 297 | n.a. | n.a. | n.a. | ||||||||||||||||||||||||||||||||||||||||||||||||
| * | Starting from 1Q15 MOU is total (not MOU billed) due to alingment with the Group policies. |
Bangladesh
index page
(in USD millions, unless stated otherwise, unaudited)
| MOBILE |
1Q13 | 2Q13 | 3Q13 | 4Q13 | 1Q14 | 2Q14 | 3Q14 | 4Q14 | 1Q15 | 2Q15 | 3Q15 | 4Q15 | 1Q16 | FY13 | FY14 | FY15 | ||||||||||||||||||||||||||||||||||||||||||||||||
| Total operating revenue |
118 | 129 | 129 | 128 | 134 | 141 | 142 | 146 | 147 | 151 | 154 | 153 | 155 | 504 | 563 | 604 | ||||||||||||||||||||||||||||||||||||||||||||||||
| Service revenue |
118 | 129 | 129 | 122 | 132 | 139 | 140 | 144 | 145 | 149 | 151 | 151 | 153 | 498 | 556 | 596 | ||||||||||||||||||||||||||||||||||||||||||||||||
| EBITDA |
49 | 48 | 47 | 43 | 49 | 54 | 56 | 60 | 60 | 63 | 69 | 51 | 70 | 187 | 219 | 242 | ||||||||||||||||||||||||||||||||||||||||||||||||
| EBITDA margin (%) |
41.4% | 37.2% | 36.3% | 33.7% | 37.4% | 38.2% | 39.7% | 40.8% | 40.6% | 41.9% | 44.7% | 33.1% | 45.3% | 37.1% | 38.9% | 40.1% | ||||||||||||||||||||||||||||||||||||||||||||||||
| Capital expenditures (CAPEX) |
12 | 13 | 127 | 131 | 27 | 43 | 50 | 59 | 12 | 32 | 49 | 42 | 17 | 282 | 178 | 134 | ||||||||||||||||||||||||||||||||||||||||||||||||
| CAPEX excluding licenses |
12 | 13 | 17 | 131 | 27 | 43 | 50 | 59 | 12 | 32 | 49 | 42 | 17 | 172 | 178 | 134 | ||||||||||||||||||||||||||||||||||||||||||||||||
| Data Revenue |
2.5 | 2.8 | 3.8 | 4.0 | 4.4 | 5.0 | 6.3 | 7.5 | 8.6 | 9.3 | 11.5 | 12.2 | 13.6 | 13.1 | 23.2 | 41.6 | ||||||||||||||||||||||||||||||||||||||||||||||||
| Customers (mln) |
25.9 | 27.1 | 28.1 | 28.8 | 29.4 | 29.8 | 30.2 | 30.8 | 31.8 | 32.0 | 32.3 | 32.3 | 31.6 | 28.8 | 30.8 | 32.3 | ||||||||||||||||||||||||||||||||||||||||||||||||
| ARPU (USD) |
1.5 | 1.6 | 1.5 | 1.4 | 1.5 | 1.6 | 1.5 | 1.6 | 1.5 | 1.5 | 1.6 | 1.5 | 1.6 | n.a. | n.a. | n.a. | ||||||||||||||||||||||||||||||||||||||||||||||||
| MOU (min)* |
175 | 198 | 189 | 183 | 188 | 201 | 200 | 186 | 295.2 | 300.5 | 308.7 | 305.2 | 311.4 | n.a. | n.a. | n.a. | ||||||||||||||||||||||||||||||||||||||||||||||||
| Churn 3 months active base (quarterly) (%) |
6.6% | 3.9% | 5.1% | 6.9% | 6.3% | 5.2% | 5.3% | 5.1% | 4.5% | 5.7% | 5.7% | 6.4% | 4.5% | n.a. | n.a. | n.a. | ||||||||||||||||||||||||||||||||||||||||||||||||
| MBOU |
n.a. | n.a. | n.a. | n.a. | n.a. | n.a. | n.a. | n.a. | 66 | 60 | 104 | 134 | 157 | n.a. | n.a. | n.a. | ||||||||||||||||||||||||||||||||||||||||||||||||
| Operating cash flow (EBITDA-CAPEX excluding licenses) |
37 | 36 | 30 | (88) | 23 | 11 | 7 | 1 | 48 | 31 | 20 | 9 | 53 | 15 | 41 | 108 | ||||||||||||||||||||||||||||||||||||||||||||||||
| OCF margin (%) |
31% | 28% | 23% | (69%) | 17% | 8% | 5% | 0% | 32% | 21% | 13% | 6% | 34% | 3% | 7% | 18% | ||||||||||||||||||||||||||||||||||||||||||||||||
| (in BDT billions, unless stated otherwise, unaudited) | ||||||||||||||||||||||||||||||||||||||||||||||||||||||||||||||||
| MOBILE |
1Q13 | 2Q13 | 3Q13 | 4Q13 | 1Q14 | 2Q14 | 3Q14 | 4Q14 | 1Q15 | 2Q15 | 3Q15 | 4Q15 | 1Q16 | FY13 | FY14 | FY15 | ||||||||||||||||||||||||||||||||||||||||||||||||
| Total operating revenue |
9.3 | 10.1 | 10.0 | 10.0 | 10.2 | 10.9 | 11.0 | 11.3 | 11.4 | 11.8 | 11.9 | 12.0 | 12.2 | 39.4 | 43.7 | 47.1 | ||||||||||||||||||||||||||||||||||||||||||||||||
| Service revenue |
9.3 | 10.0 | 10.0 | 9.5 | 10.2 | 10.8 | 10.9 | 11.2 | 11.3 | 11.6 | 11.8 | 11.8 | 12.0 | 38.8 | 43.1 | 46.4 | ||||||||||||||||||||||||||||||||||||||||||||||||
| EBITDA |
3.8 | 3.7 | 3.6 | 3.4 | 4.0 | 4.2 | 4.4 | 4.6 | 4.6 | 4.9 | 5.3 | 4.0 | 5.5 | 14.6 | 17.0 | 18.9 | ||||||||||||||||||||||||||||||||||||||||||||||||
| EBITDA margin (%) |
41.3% | 37.2% | 36.3% | 33.7% | 37.4% | 38.2% | 39.7% | 40.8% | 40.6% | 41.9% | 44.7% | 33.1% | 45.3% | 37.1% | 38.9% | 40.1% | ||||||||||||||||||||||||||||||||||||||||||||||||
| Capital expenditures (CAPEX) |
n.a. | n.a. | n.a. | n.a. | n.a. | n.a. | n.a. | n.a. | 0.9 | 2.5 | 3.8 | 3.3 | 1.3 | n.a. | n.a. | 10.5 | ||||||||||||||||||||||||||||||||||||||||||||||||
| CAPEX excluding licenses |
n.a. | n.a. | n.a. | n.a. | n.a. | n.a. | n.a. | n.a. | 0.9 | 2.5 | 3.8 | 3.3 | 1.3 | n.a. | n.a. | 10.5 | ||||||||||||||||||||||||||||||||||||||||||||||||
| Data Revenue |
0.20 | 0.22 | 0.29 | 0.31 | 0.30 | 0.39 | 0.49 | 0.58 | 0.67 | 0.73 | 0.89 | 0.96 | 1.07 | 1.02 | 1.76 | 3.25 | ||||||||||||||||||||||||||||||||||||||||||||||||
| Customers (mln) |
25.9 | 27.1 | 28.1 | 28.8 | 29.4 | 29.8 | 30.2 | 30.8 | 31.8 | 32.0 | 32.3 | 32.3 | 31.6 | 28.8 | 30.8 | 32.3 | ||||||||||||||||||||||||||||||||||||||||||||||||
| ARPU (BDT) |
119 | 126 | 121 | 110 | 117 | 121 | 120 | 122 | 119 | 120 | 121 | 121 | 124 | n.a. | n.a. | n.a. | ||||||||||||||||||||||||||||||||||||||||||||||||
| MOU (min)* |
175 | 198 | 189 | 183 | 188 | 201 | 200 | 186 | 295 | 300 | 309 | 305 | 311 | n.a. | n.a. | n.a. | ||||||||||||||||||||||||||||||||||||||||||||||||
| Churn 3 months active base (quarterly) (%) |
6.6% | 3.9% | 5.1% | 6.9% | 6.3% | 5.2% | 5.3% | 5.1% | 4.5% | 5.7% | 5.7% | 6.4% | 4.5% | n.a. | n.a. | n.a. | ||||||||||||||||||||||||||||||||||||||||||||||||
| MBOU |
n.a. | n.a. | n.a. | n.a. | n.a. | n.a. | n.a. | n.a. | 66 | 60 | 104 | 134 | 157 | n.a. | n.a. | n.a. | ||||||||||||||||||||||||||||||||||||||||||||||||
| * | Starting from 1Q15 MOU is total (not MOU billed) due to alingment with the Group policies. |
Ukraine
index page
(in USD millions, unless stated otherwise, unaudited)
| CONSOLIDATED |
1Q13 | 2Q13 | 3Q13 | 4Q13 | 1Q14 | 2Q14 | 3Q14 | 4Q14 | 1Q15 | 2Q15 | 3Q15 | 4Q15 | 1Q16 | FY13 | FY14 | FY15 | ||||||||||||||||||||||||||||||||||||||||||||||||
| Total operating revenue |
396 | 401 | 420 | 394 | 335 | 259 | 252 | 216 | 151 | 154 | 166 | 152 | 136 | 1,611 | 1,062 | 622 | ||||||||||||||||||||||||||||||||||||||||||||||||
| EBITDA |
194 | 192 | 208 | 186 | 162 | 115 | 114 | 92 | 63 | 70 | 84 | 75 | 71 | 781 | 483 | 292 | ||||||||||||||||||||||||||||||||||||||||||||||||
| EBITDA margin (%) |
49.0% | 48.0% | 49.6% | 47.2% | 48.6% | 44.5% | 45.4% | 42.7% | 41.3% | 45.6% | 51.0% | 49.1% | 52.6% | 48.5% | 45.2% | 47.0% | ||||||||||||||||||||||||||||||||||||||||||||||||
| Capital expenditures (CAPEX) |
42 | 48 | 66 | 56 | 35 | 30 | 35 | 37 | 45 | 178 | 38 | 38 | 10 | 212 | 137 | 298 | ||||||||||||||||||||||||||||||||||||||||||||||||
| CAPEX excluding licenses* |
42 | 48 | 66 | 56 | 35 | 30 | 35 | 37 | 32 | 54 | 36 | 38 | 9 | 212 | 137 | 160 | ||||||||||||||||||||||||||||||||||||||||||||||||
| Operating cash flow (EBITDA-CAPEX excluding licenses) |
152 | 144 | 143 | 130 | 127 | 85 | 79 | 55 | 31 | 16 | 48 | 37 | 62 | 569 | 346 | 133 | ||||||||||||||||||||||||||||||||||||||||||||||||
| OCF margin (%) |
38% | 36% | 34% | 33% | 38% | 33% | 31% | 24% | 20% | 10% | 29% | 24% | 46% | 35% | 32% | 21% | ||||||||||||||||||||||||||||||||||||||||||||||||
| MOBILE |
1Q13 | 2Q13 | 3Q13 | 4Q13 | 1Q14 | 2Q14 | 3Q14 | 4Q14 | 1Q15 | 2Q15 | 3Q15 | 4Q15 | 1Q16 | FY13 | FY14 | FY15 | ||||||||||||||||||||||||||||||||||||||||||||||||
| Total operating revenue |
362 | 367 | 384 | 359 | 305 | 236 | 232 | 200 | 140 | 143 | 155 | 141 | 126 | 1,473 | 973 | 578 | ||||||||||||||||||||||||||||||||||||||||||||||||
| Service revenue |
355 | 360 | 376 | 357 | 305 | 235 | 231 | 199 | 139 | 142 | 154 | 140 | 125 | 1,448 | 970 | 576 | ||||||||||||||||||||||||||||||||||||||||||||||||
| Data Revenue |
26.4 | 27.0 | 29.3 | 29.9 | 27.6 | 20.5 | 19.5 | 17.8 | 14.0 | 14.0 | 19.0 | 19.7 | 19.3 | 112.6 | 85 | 66 | ||||||||||||||||||||||||||||||||||||||||||||||||
| Customers (mln) |
26.3 | 25.6 | 25.9 | 25.8 | 25.6 | 25.4 | 26.3 | 26.2 | 26.1 | 26.1 | 25.7 | 25.4 | 25.3 | 25.8 | 26.2 | 25.4 | ||||||||||||||||||||||||||||||||||||||||||||||||
| ARPU (USD) |
4.6 | 4.6 | 4.8 | 4.6 | 3.9 | 3.1 | 3.0 | 2.5 | 1.8 | 1.8 | 1.9 | 1.8 | 1.6 | n.a. | n.a. | n.a. | ||||||||||||||||||||||||||||||||||||||||||||||||
| MOU (min) |
484 | 486 | 497 | 504 | 498 | 506 | 517 | 524 | 536 | 530 | 537 | 562 | 572 | n.a. | n.a. | n.a. | ||||||||||||||||||||||||||||||||||||||||||||||||
| Churn 3 months active base (quarterly) (%) |
6.9% | 11.4% | 8.0% | 8.4% | 7.3% | 6.4% | 4.8% | 6.7% | 5.4% | 5.0% | 6.6% | 6.4% | 5.0% | n.a. | n.a. | n.a. | ||||||||||||||||||||||||||||||||||||||||||||||||
| FIXED-LINE |
1Q13 | 2Q13 | 3Q13 | 4Q13 | 1Q14 | 2Q14 | 3Q14 | 4Q14 | 1Q15 | 2Q15 | 3Q15 | 4Q15 | 1Q16 | FY13 | FY14 | FY15 | ||||||||||||||||||||||||||||||||||||||||||||||||
| Total operating revenue |
33 | 33 | 36 | 35 | 30 | 24 | 20 | 16 | 11 | 11 | 11 | 11 | 10 | 137 | 90 | 45 | ||||||||||||||||||||||||||||||||||||||||||||||||
| Service revenue |
33 | 33 | 36 | 35 | 29 | 24 | 20 | 16 | 11 | 11 | 11 | 11 | 10 | 137 | 89 | 45 | ||||||||||||||||||||||||||||||||||||||||||||||||
| Broadband revenue |
12 | 13 | 13 | 13 | 13 | 10 | 9 | 8 | 6 | 6 | 6 | 6 | 6 | 51 | 40 | 24 | ||||||||||||||||||||||||||||||||||||||||||||||||
| Broadband customers (mln) |
0.7 | 0.7 | 0.7 | 0.8 | 0.8 | 0.8 | 0.8 | 0.8 | 0.8 | 0.8 | 0.8 | 0.8 | 1 | 0.8 | 0.8 | 0.8 | ||||||||||||||||||||||||||||||||||||||||||||||||
| Broadband ARPU (USD) |
6.3 | 6.2 | 6.1 | 6.0 | 5.6 | 4.0 | 3.6 | 3.2 | 2.3 | 2.5 | 2.5 | 2.5 | 2.3 | n.a. | n.a. | n.a. | ||||||||||||||||||||||||||||||||||||||||||||||||
| (in UAH millions, unless stated otherwise, unaudited) |
|
|||||||||||||||||||||||||||||||||||||||||||||||||||||||||||||||
| CONSOLIDATED |
1Q13 | 2Q13 | 3Q13 | 4Q13 | 1Q14 | 2Q14 | 3Q14 | 4Q14 | 1Q15 | 2Q15 | 3Q15 | 4Q15 | 1Q16 | FY13 | FY14 | FY15 | ||||||||||||||||||||||||||||||||||||||||||||||||
| Total operating revenue |
3,162 | 3,201 | 3,359 | 3,149 | 2,942 | 3,034 | 3,160 | 3,095 | 3,092 | 3,315 | 3,595 | 3,472 | 3,478 | 12,871 | 12,231 | 13,475 | ||||||||||||||||||||||||||||||||||||||||||||||||
| EBITDA |
1,550 | 1,536 | 1,666 | 1,487 | 1,430 | 1,349 | 1,436 | 1,311 | 1,278 | 1,512 | 1,835 | 1,706 | 1,830 | 6,239 | 5,526 | 6,332 | ||||||||||||||||||||||||||||||||||||||||||||||||
| EBITDA margin (%) |
49.0% | 48.0% | 49.6% | 47.2% | 48.6% | 44.5% | 45.5% | 42.3% | 41.3% | 45.6% | 51.0% | 49.1% | 52.6% | 48.5% | 45.2% | 47.0% | ||||||||||||||||||||||||||||||||||||||||||||||||
| Capital expenditures (CAPEX) |
336 | 383 | 525 | 447 | 305 | 354 | 445 | 554 | 1,033 | 3,999 | 833 | 875 | 264 | 1,690 | 1,658 | 6,740 | ||||||||||||||||||||||||||||||||||||||||||||||||
| CAPEX excluding licenses* |
336 | 383 | 525 | 447 | 305 | 350 | 444 | 554 | 742 | 1,176 | 778 | 869 | 249 | 1,690 | 1,652 | 3,566 | ||||||||||||||||||||||||||||||||||||||||||||||||
| Operating cash flow (EBITDA-CAPEX excluding licenses) |
1,215 | 1,153 | 1,141 | 1,040 | 1,125 | 999 | 991 | 757 | 535 | 336 | 1,057 | 837 | 1,582 | 4,549 | 3,874 | 2,766 | ||||||||||||||||||||||||||||||||||||||||||||||||
| OCF margin (%) |
38% | 36% | 34% | 33% | 38% | 33% | 31% | 24% | 17% | 10% | 29% | 24% | 45% | 35% | 32% | 21% | ||||||||||||||||||||||||||||||||||||||||||||||||
| MOBILE |
1Q13 | 2Q13 | 3Q13 | 4Q13 | 1Q14 | 2Q14 | 3Q14 | 4Q14 | 1Q15 | 2Q15 | 3Q15 | 4Q15 | 1Q16 | FY13 | FY14 | FY15 | ||||||||||||||||||||||||||||||||||||||||||||||||
| Total operating revenue |
2,897 | 2,936 | 3,069 | 2,866 | 2,682 | 2,754 | 2,906 | 2,870 | 2,859 | 3,077 | 3,357 | 3,215 | 3,220 | 11,768 | 11,212 | 12,508 | ||||||||||||||||||||||||||||||||||||||||||||||||
| Service revenue |
2,836 | 2,879 | 3,008 | 2,856 | 2,677 | 2,750 | 2,899 | 2,863 | 2,851 | 3,069 | 3,348 | 3,206 | 3,210 | 11,579 | 11,190 | 12,475 | ||||||||||||||||||||||||||||||||||||||||||||||||
| Data Revenue |
210.7 | 216.0 | 234.0 | 239.0 | 242.3 | 240.4 | 244.6 | 256.4 | 281.4 | 303.7 | 408.2 | 449.1 | 496 | 900 | 984 | 1,442 | ||||||||||||||||||||||||||||||||||||||||||||||||
| Customers (mln) |
26.3 | 25.6 | 25.9 | 25.8 | 25.6 | 25.4 | 26.3 | 26.2 | 26.1 | 26.1 | 25.7 | 25.4 | 25.3 | 25.8 | 26.2 | 25.4 | ||||||||||||||||||||||||||||||||||||||||||||||||
| ARPU (UAH) |
36.5 | 36.5 | 38.2 | 36.5 | 34.6 | 35.7 | 37.0 | 36.1 | 36.0 | 38.7 | 42.2 | 41.3 | 41.7 | n.a. | n.a. | n.a. | ||||||||||||||||||||||||||||||||||||||||||||||||
| MOU (min) |
484 | 486 | 497 | 504 | 498 | 506 | 517 | 524 | 536 | 530 | 537 | 562 | 572.4 | n.a. | n.a. | n.a. | ||||||||||||||||||||||||||||||||||||||||||||||||
| Churn 3 months active base (quarterly) (%) |
6.9% | 11.4% | 8.0% | 8.4% | 7.3% | 6.4% | 4.8% | 6.7% | 5.4% | 5.0% | 6.6% | 6.4% | 5.0% | n.a. | n.a. | n.a. | ||||||||||||||||||||||||||||||||||||||||||||||||
| FIXED-LINE |
1Q13 | 2Q13 | 3Q13 | 4Q13 | 1Q14 | 2Q14 | 3Q14 | 4Q14 | 1Q15 | 2Q15 | 3Q15 | 4Q15 | 1Q16 | FY13 | FY14 | FY15 | ||||||||||||||||||||||||||||||||||||||||||||||||
| Total operating revenue |
265 | 265 | 290 | 283 | 260 | 280 | 255 | 225 | 233 | 238 | 238 | 257 | 259 | 1,103 | 1,020 | 967 | ||||||||||||||||||||||||||||||||||||||||||||||||
| Service revenue |
265 | 265 | 290 | 282 | 259 | 279 | 254 | 225 | 233 | 238 | 238 | 257 | 259 | 1,102 | 1,017 | 967 | ||||||||||||||||||||||||||||||||||||||||||||||||
| Broadband revenue |
96 | 101 | 104 | 107 | 114 | 111 | 107 | 111 | 117 | 132 | 132 | 143 | 148 | 408 | 443 | 524 | ||||||||||||||||||||||||||||||||||||||||||||||||
| Broadband customers (mln) |
0.7 | 0.7 | 0.7 | 0.8 | 0.8 | 0.8 | 0.8 | 0.8 | 0.8 | 0.8 | 0.8 | 0.8 | 0.8 | 0.8 | 0.8 | 0.8 | ||||||||||||||||||||||||||||||||||||||||||||||||
| Broadband ARPU (UAH) |
50.0 | 49.7 | 48.8 | 48.1 | 49.1 | 47.1 | 44.6 | 45.5 | 47.7 | 53.4 | 54.2 | 59.0 | 60.6 | n.a. | n.a. | n.a. | ||||||||||||||||||||||||||||||||||||||||||||||||
| * | Previous periods were restated due to alignment with the Group definition. |
Kazakhstan
index page
(in USD millions, unless stated otherwise, unaudited)
| CONSOLIDATED |
1Q14 | 2Q14 | 3Q14 | 4Q14 | 1Q15 | 2Q15 | 3Q15 | 4Q15 | 1Q16 | FY13 | FY14 | FY15 | ||||||||||||||||||||||||||||||||||||
| Total operating revenue |
180 | 186 | 197 | 193 | 164 | 169 | 156 | 109 | 81 | 840 | 756 | 598 | ||||||||||||||||||||||||||||||||||||
| EBITDA |
86 | 90 | 95 | 78 | 81 | 82 | 66 | 46 | 31 | 391 | 349 | 276 | ||||||||||||||||||||||||||||||||||||
| EBITDA margin (%) |
47.8% | 48.7% | 48.2% | 40.2% | 49.5% | 48.6% | 42.5% | 41.9% | 38.7% | 46.5% | 46.2% | 45.5% | ||||||||||||||||||||||||||||||||||||
| Capital expenditures (CAPEX) |
9 | 17 | 26 | 57 | 7 | 22 | 18 | 25 | 50 | 159 | 109 | 71 | ||||||||||||||||||||||||||||||||||||
| CAPEX excluding licenses |
9 | 17 | 26 | 57 | 7 | 22 | 18 | 25 | 11 | 159 | 109 | 71 | ||||||||||||||||||||||||||||||||||||
| Operating cash flow (EBITDA-CAPEX excluding licenses) |
77 | 73 | 69 | 21 | 74 | 60 | 48 | 21 | 20 | 232 | 240 | 205 | ||||||||||||||||||||||||||||||||||||
| OCF margin (%) |
42% | 39% | 35% | 11% | 45% | 36% | 31% | 19% | 25% | 28% | 32% | 32% | ||||||||||||||||||||||||||||||||||||
| MOBILE |
1Q14 | 2Q14 | 3Q14 | 4Q14 | 1Q15 | 2Q15 | 3Q15 | 4Q15 | 1Q16 | FY13 | FY14 | FY15 | ||||||||||||||||||||||||||||||||||||
| Total operating revenue |
160 | 165 | 177 | 172 | 144 | 149 | 137 | 94 | 67 | 761 | 674 | 523 | ||||||||||||||||||||||||||||||||||||
| Service revenue |
159 | 165 | 177 | 172 | 144 | 148 | 135 | 91 | 66 | 761 | 673 | 518 | ||||||||||||||||||||||||||||||||||||
| Data Revenue |
23.4 | 21.5 | 26.8 | 30.9 | 30.0 | 28.0 | 26.0 | 18.3 | 16 | 91.1 | 103 | 102 | ||||||||||||||||||||||||||||||||||||
| Customers (mln) |
9.2 | 9.6 | 9.8 | 9.8 | 9.6 | 9.7 | 9.8 | 9.5 | 9.2 | 9.2 | 9.8 | 9.5 | ||||||||||||||||||||||||||||||||||||
| Mobile data customers (mln) |
5.2 | 5.3 | 5.4 | 5.4 | 5.2 | 5.1 | 5.2 | 5.0 | 4.8 | 5.2 | 5.4 | 5.0 | ||||||||||||||||||||||||||||||||||||
| ARPU (USD) |
6 | 6 | 6 | 6 | 5 | 5 | 4 | 3 | 2.3 | n.a. | n.a. | n.a. | ||||||||||||||||||||||||||||||||||||
| MOU (min) |
293 | 326 | 317 | 298 | 273 | 292 | 292 | 294 | 299 | n.a. | n.a. | n.a. | ||||||||||||||||||||||||||||||||||||
| Churn 3 months active base (quarterly) (%) |
13% | 11% | 13% | 14% | 13% | 12% | 13% | 15% | 15% | n.a. | n.a. | n.a. | ||||||||||||||||||||||||||||||||||||
| MBOU* |
n.a. | n.a. | n.a. | n.a. | 414 | 416 | 602 | 822 | 1,010 | n.a. | n.a. | n.a. | ||||||||||||||||||||||||||||||||||||
| FIXED-LINE |
1Q14 | 2Q14 | 3Q14 | 4Q14 | 1Q15 | 2Q15 | 3Q15 | 4Q15 | 1Q16 | FY13 | FY14 | FY15 | ||||||||||||||||||||||||||||||||||||
| Total operating revenue |
20 | 21 | 20 | 21 | 20 | 20 | 19 | 15 | 13 | 78 | 82 | 75 | ||||||||||||||||||||||||||||||||||||
| Service revenue |
20 | 21 | 20 | 21 | 20 | 20 | 19 | 15 | 13 | 77 | 82 | 75 | ||||||||||||||||||||||||||||||||||||
| Broadband revenue |
9 | 8 | 8 | 9 | 12 | 9 | 10 | 6 | 6 | 34 | 34 | 37 | ||||||||||||||||||||||||||||||||||||
| Broadband customers (mln) |
0.2 | 0.2 | 0.2 | 0.2 | 0.2 | 0.2 | 0.2 | 0.2 | 0.2 | 0.2 | 0.2 | 0.2 | ||||||||||||||||||||||||||||||||||||
| Broadband ARPU (USD) |
16 | 14 | 14 | 15 | 20 | 14 | 12 | 10 | 9 | n.a. | n.a. | n.a. | ||||||||||||||||||||||||||||||||||||
| (in KZT millions, unless stated otherwise, unaudited) | ||||||||||||||||||||||||||||||||||||||||||||||||
| CONSOLIDATED |
1Q14 | 2Q14 | 3Q14 | 4Q14 | 1Q15 | 2Q15 | 3Q15 | 4Q15 | 1Q16 | FY13 | FY14 | FY15 | ||||||||||||||||||||||||||||||||||||
| Total operating revenue |
30,453 | 33,920 | 35,928 | 34,966 | 30,284 | 31,408 | 33,232 | 32,694 | 28,723 | 127,748 | 135,267 | 127,618 | ||||||||||||||||||||||||||||||||||||
| EBITDA |
14,558 | 16,532 | 17,343 | 14,061 | 14,981 | 15,265 | 14,108 | 13,714 | 11,119 | 59,435 | 62,492 | 58,067 | ||||||||||||||||||||||||||||||||||||
| EBITDA margin (%) |
47.8% | 48.7% | 48.2% | 40.2% | 49.5% | 48.6% | 42.5% | 41.9% | 38.7% | 46.5% | 46.2% | 45.5% | ||||||||||||||||||||||||||||||||||||
| Capital expenditures (CAPEX) |
1,637 | 3,170 | 4,805 | 10,057 | 1,239 | 4,066 | 4,033 | 7,616 | 17,838 | 24,241 | 19,669 | 16,954 | ||||||||||||||||||||||||||||||||||||
| CAPEX excluding licenses |
1,637 | 3,170 | 4,805 | 10,057 | 1,239 | 4,066 | 4,033 | 7,616 | 3,838 | 24,241 | 19,669 | 16,954 | ||||||||||||||||||||||||||||||||||||
| Operating cash flow (EBITDA-CAPEX excluding licenses) |
12,921 | 13,362 | 12,517 | 4,004 | 13,742 | 11,200 | 10,075 | 6,097 | 7,281 | 35,194 | 42,823 | 41,113 | ||||||||||||||||||||||||||||||||||||
| OCF margin (%) |
42% | 39% | 35% | 11% | 45% | 36% | 30% | 19% | 25% | 28% | 32% | 32% | ||||||||||||||||||||||||||||||||||||
| MOBILE |
1Q14 | 2Q14 | 3Q14 | 4Q14 | 1Q15 | 2Q15 | 3Q15 | 4Q15 | 1Q16 | FY13 | FY14 | FY15 | ||||||||||||||||||||||||||||||||||||
| Total operating revenue |
27,009 | 30,167 | 32,284 | 31,183 | 26,564 | 27,617 | 29,166 | 28,093 | 23,931 | 115,956 | 120,643 | 111,440 | ||||||||||||||||||||||||||||||||||||
| Service revenue |
26,976 | 30,131 | 32,257 | 31,148 | 26,537 | 27,571 | 28,789 | 27,141 | 23,424 | 115,835 | 120,513 | 110,039 | ||||||||||||||||||||||||||||||||||||
| Data Revenue |
3,947 | 3,927 | 4,883 | 5,603 | 5,456 | 5,251 | 5,471 | 5,490 | 5,775 | 13,870 | 18,359 | 21,668 | ||||||||||||||||||||||||||||||||||||
| Customers (mln) |
9.2 | 9.6 | 9.8 | 9.8 | 9.6 | 9.7 | 9.8 | 9.5 | 9.2 | 9.2 | 9.2 | 9.5 | ||||||||||||||||||||||||||||||||||||
| Mobile data customers (mln) |
5.2 | 5.3 | 5.4 | 5.4 | 5.2 | 5.1 | 5.2 | 5.0 | 4.8 | 5.2 | 5.4 | 5.0 | ||||||||||||||||||||||||||||||||||||
| ARPU (KZT) |
975 | 1,058 | 1,098 | 1,041 | 898 | 934 | 954 | 907 | 806 | n.a. | n.a. | n.a. | ||||||||||||||||||||||||||||||||||||
| MOU (min) |
293 | 326 | 317 | 298 | 273 | 292 | 292 | 294 | 299 | n.a. | n.a. | n.a. | ||||||||||||||||||||||||||||||||||||
| Churn 3 months active base (quarterly) (%) |
13% | 11% | 13% | 14% | 14% | 12% | 13% | 15% | 15% | n.a. | n.a. | n.a. | ||||||||||||||||||||||||||||||||||||
| MBOU* |
n.a. | n.a. | n.a. | n.a. | 414 | 416 | 602 | 822 | 1010 | n.a. | n.a. | n.a. | ||||||||||||||||||||||||||||||||||||
| FIXED-LINE |
1Q14 | 2Q14 | 3Q14 | 4Q14 | 1Q15 | 2Q15 | 3Q15 | 4Q15 | 1Q16 | FY13 | FY14 | FY15 | ||||||||||||||||||||||||||||||||||||
| Total operating revenue |
3,444 | 3,753 | 3,644 | 3,783 | 3,720 | 3,791 | 4,067 | 4,601 | 4,792 | 11,842 | 14,624 | 16,179 | ||||||||||||||||||||||||||||||||||||
| Service revenue |
3,412 | 3,748 | 3,608 | 3,769 | 3,707 | 3,779 | 4,057 | 4,586 | 4,784 | 11,781 | 14,565 | 16,129 | ||||||||||||||||||||||||||||||||||||
| Broadband revenue |
1,514 | 1,502 | 1,445 | 1,844 | 1,865 | 1,831 | 1,773 | 1,943 | 2,099 | 5,323 | 6,880 | 7,412 | ||||||||||||||||||||||||||||||||||||
| Broadband customers (mln) |
0.2 | 0.2 | 0.2 | 0.2 | 0.2 | 0.2 | 0.2 | 0.2 | 0.2 | 0.2 | 0.2 | 0.2 | ||||||||||||||||||||||||||||||||||||
| Broadband ARPU (KZT) |
2,685 | 2,632 | 2,581 | 3,024 | 3,726 | 2,597 | 2,575 | 3,067 | 3,013 | n.a. | n.a. | n.a. | ||||||||||||||||||||||||||||||||||||
| * | Previous periods were restated due to alignment with the Group definition. |
Uzbekistan
index page
(in USD millions, unless stated otherwise, unaudited)
| CONSOLIDATED |
1Q14 | 2Q14 | 3Q14 | 4Q14 | 1Q15 | 2Q15 | 3Q15 | 4Q15 | 1Q16 | FY13* | FY14 | FY15 | ||||||||||||||||||||||||||||||||||||
| Total operating revenue |
163 | 179 | 190 | 186 | 167 | 175 | 186 | 183 | 165 | 672 | 718 | 711 | ||||||||||||||||||||||||||||||||||||
| EBITDA |
105 | 115 | 127 | 115 | 105 | 113 | 99 | 121 | 100 | 347 | 461 | 437 | ||||||||||||||||||||||||||||||||||||
| EBITDA margin (%) |
64.4% | 64.2% | 66.5% | 61.6% | 62.7% | 64.3% | 53.2% | 65.9% | 60.8% | 51.5% | 64.2% | 61.5% | ||||||||||||||||||||||||||||||||||||
| Capital expenditures (CAPEX) |
21 | 10 | 20 | 28 | 0 | 1 | 34 | 20 | 30 | 142 | 79 | 54 | ||||||||||||||||||||||||||||||||||||
| CAPEX excluding licenses |
21 | 10 | 20 | 28 | 0 | 1 | 34 | 20 | 30 | 142 | 79 | 54 | ||||||||||||||||||||||||||||||||||||
| Operating cash flow (EBITDA-CAPEX excluding licenses) |
84 | 104 | 106 | 87 | 105 | 111 | 65 | 101 | 71 | 205 | 381 | 383 | ||||||||||||||||||||||||||||||||||||
| OCF margin (%) |
52% | 58% | 56% | 47% | 63% | 64% | 35% | 55% | 43% | 31% | 53% | 54% | ||||||||||||||||||||||||||||||||||||
| MOBILE |
1Q14 | 2Q14 | 3Q14 | 4Q14 | 1Q15 | 2Q15 | 3Q15 | 4Q15 | 1Q16 | FY13 | FY14 | FY15 | ||||||||||||||||||||||||||||||||||||
| Total operating revenue |
161 | 177 | 189 | 184 | 166 | 174 | 184 | 182 | 164 | 665 | 711 | 706 | ||||||||||||||||||||||||||||||||||||
| Service revenue |
161 | 176 | 189 | 184 | 165 | 174 | 183 | 182 | 164 | 663 | 710 | 704 | ||||||||||||||||||||||||||||||||||||
| Data Revenue |
30.4 | 31.3 | 34.9 | 35.7 | 34.3 | 33.8 | 34.2 | 33.7 | 31.8 | 94.8 | 132.3 | 136.0 | ||||||||||||||||||||||||||||||||||||
| Customers (mln) |
10.4 | 10.4 | 10.5 | 10.6 | 10.4 | 10.3 | 10.2 | 9.9 | 9.5 | 10.5 | 10.6 | 9.9 | ||||||||||||||||||||||||||||||||||||
| Mobile data customers (mln) |
5.4 | 5.3 | 5.4 | 5.5 | 5.2 | 5.0 | 4.8 | 4.7 | 4.4 | 5.4 | 5.5 | 4.7 | ||||||||||||||||||||||||||||||||||||
| ARPU (USD) |
5.1 | 5.6 | 6.0 | 5.8 | 5.2 | 5.6 | 6.0 | 6.0 | 5.6 | n.a. | n.a. | n.a. | ||||||||||||||||||||||||||||||||||||
| MOU (min)* |
465 | 531 | 568 | 528 | 498 | 553 | 550 | 501 | 472 | n.a. | n.a. | n.a. | ||||||||||||||||||||||||||||||||||||
| Churn 3 months active base (quarterly) (%)* |
12% | 12% | 12% | 12% | 12% | 11% | 12% | 12% | 12% | n.a. | n.a. | n.a. | ||||||||||||||||||||||||||||||||||||
| FIXED-LINE |
1Q14 | 2Q14 | 3Q14 | 4Q14 | 1Q15 | 2Q15 | 3Q15 | 4Q15 | 1Q16 | FY13 | FY14 | FY15 | ||||||||||||||||||||||||||||||||||||
| Total operating revenue |
2.0 | 2.0 | 2.0 | 2.0 | 1.4 | 1.4 | 1.3 | 1.3 | 1.2 | 7.8 | 8.0 | 5.4 | ||||||||||||||||||||||||||||||||||||
| Service revenue |
1.8 | 2.0 | 2.0 | 2.0 | 1.4 | 1.3 | 1.3 | 1.2 | 1.2 | 7.5 | 7.8 | 5.3 | ||||||||||||||||||||||||||||||||||||
| Broadband revenue |
0.7 | 0.7 | 0.7 | 0.6 | 0.6 | 0.5 | 0.5 | 0.5 | 0.0 | 2.8 | 2.7 | 2.1 | ||||||||||||||||||||||||||||||||||||
| Broadband customers (mln) |
0.0 | 0.0 | 0.0 | 0.0 | 0.0 | 0.0 | 0.0 | 0.0 | 0.0 | 0.0 | 0.0 | 0.0 | ||||||||||||||||||||||||||||||||||||
| Broadband ARPU (USD) |
21.0 | 19.0 | 14.0 | 16.9 | 16.7 | 16.8 | 15.4 | 14.0 | 0.0 | n.a. | n.a. | n.a | ||||||||||||||||||||||||||||||||||||
| (in UZS billions, unless stated otherwise, unaudited) | ||||||||||||||||||||||||||||||||||||||||||||||||
| CONSOLIDATED |
1Q14 | 2Q14 | 3Q14 | 4Q14 | 1Q15 | 2Q15 | 3Q15 | 4Q15 | 1Q16 | FY13* | FY14 | FY15 | ||||||||||||||||||||||||||||||||||||
| Total operating revenue |
363 | 409 | 446 | 445 | 409 | 442 | 480 | 497 | 469 | 1,412 | 1,662 | 1,829 | ||||||||||||||||||||||||||||||||||||
| EBITDA |
234 | 262 | 296 | 274 | 257 | 284 | 255 | 328 | 285 | 719 | 1,066 | 1,124 | ||||||||||||||||||||||||||||||||||||
| EBITDA margin (%) |
64.4% | 64.2% | 66.5% | 61.6% | 62.7% | 64.3% | 53.1% | 65.9% | 60.8% | 51.5% | 64.2% | 61.5% | ||||||||||||||||||||||||||||||||||||
| Capital expenditures (CAPEX) |
46 | 23 | 47 | 67 | 0 | 3 | 87 | 53 | 85 | 289 | 184 | 143 | ||||||||||||||||||||||||||||||||||||
| CAPEX excluding licenses |
46 | 23 | 47 | 67 | 0 | 3 | 87 | 53 | 85 | 289 | 184 | 143 | ||||||||||||||||||||||||||||||||||||
| Operating cash flow (EBITDA-CAPEX excluding licenses) |
188 | 239 | 249 | 207 | 257 | 281 | 168 | 275 | 200 | 429 | 882 | 981 | ||||||||||||||||||||||||||||||||||||
| OCF margin (%) |
52% | 58% | 56% | 46% | 63% | 64% | 35% | 55% | 43% | 31% | 53% | 54% | ||||||||||||||||||||||||||||||||||||
| MOBILE |
1Q14 | 2Q14 | 3Q14 | 4Q14 | 1Q15 | 2Q15 | 3Q15 | 4Q15 | 1Q16 | FY13 | FY14 | FY15 | ||||||||||||||||||||||||||||||||||||
| Total operating revenue |
359 | 405 | 442 | 441 | 406 | 439 | 476 | 494 | 465 | 1,396 | 1,646 | 1,815 | ||||||||||||||||||||||||||||||||||||
| Service revenue |
358 | 404 | 441 | 441 | 405 | 439 | 475 | 493 | 465 | 1,392 | 1,643 | 1,811 | ||||||||||||||||||||||||||||||||||||
| Data Revenue |
67.7 | 71.7 | 81.7 | 85.4 | 84.1 | 85.3 | 88.5 | 91.4 | 90.3 | 199.3 | 306.4 | 349.2 | ||||||||||||||||||||||||||||||||||||
| Customers (mln) |
10.4 | 10.4 | 10.5 | 10.6 | 10.4 | 10.3 | 10.2 | 9.9 | 9.5 | 10.5 | 10.6 | 9.9 | ||||||||||||||||||||||||||||||||||||
| Mobile data customers (mln) |
5.4 | 5.3 | 5.4 | 5.5 | 5.2 | 5.0 | 4.8 | 4.7 | 4.4 | 5.4 | 5.5 | 4.7 | ||||||||||||||||||||||||||||||||||||
| ARPU (UZS) |
11,293 | 12,805 | 13,955 | 13,804 | 12,819 | 14,092 | 15,393 | 16,237 | 15,877 | n.a. | n.a. | n.a. | ||||||||||||||||||||||||||||||||||||
| MOU (min)* |
465 | 531 | 568 | 528 | 498 | 553 | 550 | 501 | 472 | n.a. | n.a. | n.a. | ||||||||||||||||||||||||||||||||||||
| Churn 3 months active base (quarterly) (%)* |
12% | 12% | 12% | 12% | 12% | 11% | 12% | 12% | 12% | n.a. | n.a. | n.a. | ||||||||||||||||||||||||||||||||||||
| FIXED-LINE |
1Q14 | 2Q14 | 3Q14 | 4Q14 | 1Q15 | 2Q15 | 3Q15 | 4Q15 | 1Q16 | FY13 | FY14 | FY15 | ||||||||||||||||||||||||||||||||||||
| Total operating revenue |
4.0 | 3.9 | 4.0 | 3.9 | 3.5 | 3.5 | 3.4 | 3.4 | 3.5 | 15.8 | 15.8 | 13.8 | ||||||||||||||||||||||||||||||||||||
| Service revenue |
4.0 | 3.9 | 3.9 | 3.8 | 3.4 | 3.4 | 3.4 | 3.4 | 3.5 | 15.7 | 15.6 | 13.4 | ||||||||||||||||||||||||||||||||||||
| Broadband revenue |
1.5 | 1.5 | 1.6 | 1.5 | 1.4 | 1.3 | 1.3 | 1.3 | 0.0 | 5.9 | 6.1 | 5.4 | ||||||||||||||||||||||||||||||||||||
| Broadband customers (mln) |
0.0 | 0.0 | 0.0 | 0.0 | 0.0 | 0.0 | 0.0 | 0.0 | 0.0 | 0.0 | 0.0 | 0.0 | ||||||||||||||||||||||||||||||||||||
| Broadband ARPU (UZS) |
46,631 | 43,076 | 43,970 | 40,462 | 45,518 | 42,404 | 40,215 | 38,858 | — | n.a. | n.a. | n.a. | ||||||||||||||||||||||||||||||||||||
| * | Previous periods were restated due to alignment with the Group definition. |
Armenia
index page
(in USD millions, unless stated otherwise, unaudited)
| CONSOLIDATED |
1Q14 | 2Q14 | 3Q14 | 4Q14 | 1Q15 | 2Q15 | 3Q15 | 4Q15 | 1Q16 | FY13 | FY14 | FY15 | ||||||||||||||||||||||||||||||||||||
| Total operating revenue |
33 | 34 | 39 | 32 | 26 | 28 | 30 | 27 | 23 | 145 | 138 | 111 | ||||||||||||||||||||||||||||||||||||
| EBITDA |
12 | 13 | 15 | 6 | 9 | 11 | 12 | 7 | 8 | 57 | 46 | 40 | ||||||||||||||||||||||||||||||||||||
| EBITDA margin (%) |
36.6% | 37.1% | 37.7% | 19.3% | 35.2% | 40.5% | 40.7% | 25.1% | 35.8% | 39.4% | 32.5% | 35.6% | ||||||||||||||||||||||||||||||||||||
| Capital expenditures (CAPEX) |
1 | 2 | 5 | 6 | 2 | 2 | 5 | 7 | 1 | 11 | 14 | 16 | ||||||||||||||||||||||||||||||||||||
| CAPEX excluding licenses |
1 | 2 | 5 | 6 | 2 | 2 | 5 | 7 | 1 | 11 | 14 | 16 | ||||||||||||||||||||||||||||||||||||
| Operating cash flow (EBITDA-CAPEX excluding licenses) |
11 | 11 | 10 | — | 7 | 9 | 7 | (1) | 8 | 46 | 32 | 23 | ||||||||||||||||||||||||||||||||||||
| OCF margin (%) |
33% | 30% | 26% | 0% | 27% | 32% | 23% | -2% | 34% | 32% | 22% | 21% | ||||||||||||||||||||||||||||||||||||
| MOBILE |
1Q14 | 2Q14 | 3Q14 | 4Q14 | 1Q15 | 2Q15 | 3Q15 | 4Q15 | 1Q16 | FY13 | FY14 | FY15 | ||||||||||||||||||||||||||||||||||||
| Total operating revenue |
14 | 15 | 18 | 15 | 12 | 13 | 15 | 13 | 11 | 64 | 62 | 53 | ||||||||||||||||||||||||||||||||||||
| Service revenue |
13 | 15 | 17 | 14 | 11 | 12 | 14 | 12 | 10 | 62 | 59 | 50 | ||||||||||||||||||||||||||||||||||||
| Data Revenue |
1.39 | 1.38 | 1.50 | 1.47 | 1.33 | 1.38 | 1.54 | 1.51 | 1.45 | 5.1 | 5.7 | 5.8 | ||||||||||||||||||||||||||||||||||||
| Customers (mln) |
0.7 | 0.7 | 0.8 | 0.8 | 0.8 | 0.8 | 0.8 | 0.8 | 0.8 | 0.7 | 0.8 | 0.8 | ||||||||||||||||||||||||||||||||||||
| Mobile data customers (mln) |
0.3 | 0.3 | 0.4 | 0.4 | 0.4 | 0.4 | 0.4 | 0.4 | 0.4 | 0.3 | 0.4 | 0.4 | ||||||||||||||||||||||||||||||||||||
| ARPU (USD) |
6.3 | 6.7 | 7.4 | 6.0 | 4.7 | 5.0 | 5.5 | 4.6 | 3.8 | n.a. | n.a. | n.a. | ||||||||||||||||||||||||||||||||||||
| MOU (min) |
365 | 382 | 377 | 371 | 341 | 366 | 354 | 350 | 335 | n.a. | n.a. | n.a. | ||||||||||||||||||||||||||||||||||||
| Churn 3 months active base (quarterly) (%) |
11.0% | 11.2% | 10.8% | 10.9% | 9.6% | 8.5% | 9.7% | 11.2% | 9.0% | n.a. | n.a. | n.a. | ||||||||||||||||||||||||||||||||||||
| FIXED-LINE |
1Q14 | 2Q14 | 3Q14 | 4Q14 | 1Q15 | 2Q15 | 3Q15 | 4Q15 | 1Q16 | FY13 | FY14 | FY15 | ||||||||||||||||||||||||||||||||||||
| Total operating revenue |
19 | 19 | 21 | 17 | 15 | 15 | 15 | 14 | 12 | 81 | 76 | 58 | ||||||||||||||||||||||||||||||||||||
| Service revenue |
19 | 19 | 21 | 17 | 15 | 15 | 15 | 13.6 | 12 | 80 | 76 | 58 | ||||||||||||||||||||||||||||||||||||
| Broadband revenue |
5.1 | 4.9 | 4.7 | 4.4 | 3.9 | 3.9 | 3.8 | 3.8 | 3.7 | 21.8 | 19 | 15 | ||||||||||||||||||||||||||||||||||||
| Broadband customers (mln) |
0.2 | 0.2 | 0.2 | 0.2 | 0.2 | 0.2 | 0.2 | 0.1 | 0.1 | 0.2 | 0.2 | 0.1 | ||||||||||||||||||||||||||||||||||||
| Broadband ARPU (USD) |
10.6 | 10.3 | 10.3 | 9.7 | 8.7 | 8.7 | 8.4 | 8.3 | 8.5 | n.a. | n.a. | n.a. | ||||||||||||||||||||||||||||||||||||
| (in AMD millions, unless stated otherwise, unaudited) |
| |||||||||||||||||||||||||||||||||||||||||||||||
| CONSOLIDATED |
1Q14 | 2Q14 | 3Q14 | 4Q14 | 1Q15 | 2Q15 | 3Q15 | 4Q15 | 1Q16 | FY13 | FY14 | FY15 | ||||||||||||||||||||||||||||||||||||
| Total operating revenue |
13,672 | 14,136 | 15,812 | 13,859 | 12,528 | 13,307 | 14,431 | 12,845 | 11,010 | 59,278 | 57,479 | 53,111 | ||||||||||||||||||||||||||||||||||||
| EBITDA |
4,997 | 5,239 | 5,956 | 2,478 | 4,415 | 5,388 | 5,870 | 3,223 | 3,942 | 23,340 | 18,670 | 18,896 | ||||||||||||||||||||||||||||||||||||
| EBITDA margin (%) |
36.6% | 37.1% | 37.7% | 17.9% | 35.2% | 40.5% | 40.7% | 25.1% | 35.8% | 39.4% | 32.5% | 35.6% | ||||||||||||||||||||||||||||||||||||
| Capital expenditures (CAPEX) |
501 | 1,025 | 1,977 | 2,605 | 975 | 1,183 | 2,179 | 3,493 | 247 | 4,636 | 6,108 | 7,830 | ||||||||||||||||||||||||||||||||||||
| CAPEX excluding licenses |
501 | 1,025 | 1,977 | 2,605 | 975 | 1,183 | 2,179 | 3,493 | 247 | 4,636 | 6,108 | 7,830 | ||||||||||||||||||||||||||||||||||||
| Operating cash flow (EBITDA-CAPEX excluding licenses) |
4,496 | 4,214 | 3,979 | (127) | 3,440 | 4,205 | 3,690 | (270) | 3,696 | 18,704 | 12,562 | 11,065 | ||||||||||||||||||||||||||||||||||||
| OCF margin (%) |
33% | 30% | 25% | -1% | 27% | 32% | 25% | -2% | 34% | 32% | 22% | 21% | ||||||||||||||||||||||||||||||||||||
| MOBILE |
1Q14 | 2Q14 | 3Q14 | 4Q14 | 1Q15 | 2Q15 | 3Q15 | 4Q15 | 1Q16 | FY13 | FY14 | FY15 | ||||||||||||||||||||||||||||||||||||
| Total operating revenue |
5,856 | 6,297 | 7,158 | 6,429 | 5,568 | 6,298 | 7,227 | 6,337 | 5,218 | 26,259 | 25,740 | 25,429 | ||||||||||||||||||||||||||||||||||||
| Service revenue |
5,519 | 6,033 | 6,935 | 6,155 | 5,355 | 5,918 | 6,718 | 5,669 | 4,847 | 25,587 | 24,642 | 23,659 | ||||||||||||||||||||||||||||||||||||
| Data Revenue |
572 | 570 | 614 | 634 | 633 | 656 | 740 | 735 | 709 | 2,122 | 2,389 | 2,764 | ||||||||||||||||||||||||||||||||||||
| Customers (mln) |
0.7 | 0.7 | 0.8 | 0.8 | 0.8 | 0.8 | 0.8 | 0.8 | 0.8 | 0.7 | 0.8 | 0.8 | ||||||||||||||||||||||||||||||||||||
| Mobile data customers (mln) |
0.3 | 0.3 | 0.4 | 0.4 | 0.4 | 0.4 | 0.4 | 0.4 | 0.4 | 0.3 | 0.4 | 0.4 | ||||||||||||||||||||||||||||||||||||
| ARPU (AMD) |
2,589 | 2,752 | 3,020 | 2,588 | 2,229 | 2,404 | 2,618 | 2,169 | 1,861 | n.a. | n.a. | n.a. | ||||||||||||||||||||||||||||||||||||
| MOU (min) |
365 | 382 | 377 | 371 | 341 | 366 | 354 | 350 | 334.5 | n.a. | n.a. | n.a. | ||||||||||||||||||||||||||||||||||||
| Churn 3 months active base (quarterly) (%) |
11.0% | 11.2% | 10.8% | 10.9% | 9.6% | 8.5% | 9.7% | 11.2% | 9.0% | n.a. | n.a. | n.a. | ||||||||||||||||||||||||||||||||||||
| FIXED |
1Q14 | 2Q14 | 3Q14 | 4Q14 | 1Q15 | 2Q15 | 3Q15 | 4Q15 | 1Q16 | FY13 | FY14 | FY15 | ||||||||||||||||||||||||||||||||||||
| Total operating revenue |
7,816 | 7,840 | 8,654 | 7,430 | 6,960 | 7,009 | 7,204 | 6,508 | 5,792 | 32,978 | 31,740 | 27,682 | ||||||||||||||||||||||||||||||||||||
| Service revenue |
7,766 | 7,811 | 8,638 | 7,407 | 6,943 | 6,988 | 7,182 | 6,490 | 5,774 | 32,759 | 31,622 | 27,602 | ||||||||||||||||||||||||||||||||||||
| Broadband revenue |
2,095 | 2,011 | 1,934 | 1,899 | 1,876 | 1,865 | 1,830 | 1,804 | 1,799 | 8,942 | 7,938 | 7,375 | ||||||||||||||||||||||||||||||||||||
| Broadband customers (mln) |
0.2 | 0.2 | 0.2 | 0.1 | 0.2 | 0.2 | 0.2 | 0.1 | 0.1 | 0.2 | 0.1 | 0.1 | ||||||||||||||||||||||||||||||||||||
| Broadband ARPU (AMD) |
4,369 | 4,260 | 4,189 | 4,174 | 4,136 | 4,150 | 4,038 | 4,032 | 4,136 | n.a. | n.a. | n.a. | ||||||||||||||||||||||||||||||||||||
Tajikistan
index page
(in USD millions, unless stated otherwise, unaudited)
| CONSOLIDATED |
1Q14 | 2Q14 | 3Q14 | 4Q14 | 1Q15 | 2Q15 | 3Q15 | 4Q15 | 1Q16 | FY13 | FY14 | FY15 | ||||||||||||||||||||||||||||||||||||
| Total operating revenue |
31 | 37 | 41 | 33 | 26 | 30 | 35 | 28 | 19 | 148 | 142 | 118 | ||||||||||||||||||||||||||||||||||||
| EBITDA |
14 | 14 | 20 | 13 | 14 | 18 | 25 | 17 | 12 | 74 | 62 | 75 | ||||||||||||||||||||||||||||||||||||
| EBITDA margin (%) |
46.6% | 38.5% | 49.9% | 38.5% | 52.8% | 61.0% | 72.7% | 62.7% | 61.3% | 49.7% | 43.5% | 63.0% | ||||||||||||||||||||||||||||||||||||
| Capital expenditures (CAPEX) |
2 | 4 | 1 | 11 | 0 | 4 | 2 | 10 | 0 | 16 | 18 | 16 | ||||||||||||||||||||||||||||||||||||
| CAPEX excluding licenses |
2 | 4 | 1 | 11 | 0 | 4 | 2 | 10 | 0 | 16 | 18 | 16 | ||||||||||||||||||||||||||||||||||||
| Operating cash flow (EBITDA-CAPEX excluding licenses) |
13 | 11 | 19 | 2 | 13 | 14 | 23 | 8 | 12 | 57 | 44 | 59 | ||||||||||||||||||||||||||||||||||||
| OCF margin (%) |
41% | 29% | 47% | 5% | 53% | 47% | 67% | 28% | 63% | 39% | 31% | 50% | ||||||||||||||||||||||||||||||||||||
| MOBILE |
1Q14 | 2Q14 | 3Q14 | 4Q14 | 1Q15 | 2Q15 | 3Q15 | 4Q15 | 1Q16 | FY13 | FY14 | FY15 | ||||||||||||||||||||||||||||||||||||
| Total operating revenue |
31 | 37 | 41 | 33 | 26 | 30 | 35 | 28 | 19 | 144 | 142 | 118 | ||||||||||||||||||||||||||||||||||||
| Service revenue |
31 | 37 | 41 | 33 | 26 | 30 | 35 | 28 | 19 | 145 | 142 | 118 | ||||||||||||||||||||||||||||||||||||
| Data Revenue |
1.15 | 1.04 | 0.92 | 0.90 | 0.82 | 0.63 | 0.64 | 0.59 | 0.56 | 3.34 | 4.01 | 2.68 | ||||||||||||||||||||||||||||||||||||
| Customers (mln) |
1.3 | 1.3 | 1.3 | 1.3 | 1.3 | 1.2 | 1.2 | 1.2 | 1.2 | 1.3 | 1.3 | 1.2 | ||||||||||||||||||||||||||||||||||||
| Mobile data customers (mln) |
0.6 | 0.6 | 0.6 | 0.5 | 0.5 | 0.5 | 0.4 | 0.4 | 0.5 | 0.5 | 0.5 | 0.4 | ||||||||||||||||||||||||||||||||||||
| ARPU (USD) |
7.9 | 9.6 | 10.7 | 8.6 | 6.8 | 8.0 | 9.7 | 7.8 | 5.4 | n.a. | n.a. | n.a. | ||||||||||||||||||||||||||||||||||||
| MOU (min) |
278 | 283 | 297 | 287 | 263 | 289 | 308 | 300 | 279 | n.a. | n.a. | n.a. | ||||||||||||||||||||||||||||||||||||
| Churn 3 months active base (quarterly) (%) |
18.0% | 20.5% | 20.5% | 18.2% | 19.6% | 19.5% | 20.6% | 17.0% | 18.8% | n.a. | n.a. | n.a. | ||||||||||||||||||||||||||||||||||||
| FIXED-LINE |
1Q14 | 2Q14 | 3Q14 | 4Q14 | 1Q15 | 2Q15 | 3Q15 | 4Q15 | 1Q16 | FY13 | FY14 | FY15 | ||||||||||||||||||||||||||||||||||||
| Total operating revenue |
0.0 | 0.2 | 0.1 | 0.0 | 0.0 | 0.0 | 0.0 | 0.0 | 0.0 | 2.7 | 0.3 | 0.0 | ||||||||||||||||||||||||||||||||||||
Georgia
index page
(in USD millions, unless stated otherwise, unaudited)
| CONSOLIDATED |
1Q14 | 2Q14 | 3Q14 | 4Q14 | 1Q15 | 2Q15 | 3Q15 | 4Q15 | 1Q16 | FY13 | FY14 | FY15 | ||||||||||||||||||||||||||||||||||||
| Total operating revenue |
19 | 18 | 21 | 21 | 15 | 15 | 15 | 12 | 10 | 88 | 79 | 56 | ||||||||||||||||||||||||||||||||||||
| EBITDA |
5 | 4 | 6 | 5 | 2 | 3 | 3 | 2 | 2 | 27 | 20 | 10 | ||||||||||||||||||||||||||||||||||||
| EBITDA margin (%) |
26.2% | 25.2% | 27.7% | 21.4% | 14.3% | 21.6% | 19.2% | 15.0% | 19.5% | 30.4% | 25.1% | 17.7% | ||||||||||||||||||||||||||||||||||||
| Capital expenditures (CAPEX) |
2 | 3 | 6 | 10 | 40 | 5 | 5 | 9 | 1 | 18 | 21 | 60 | ||||||||||||||||||||||||||||||||||||
| CAPEX excluding licenses |
2 | 3 | 6 | 8 | 4 | 5 | 5 | 9 | 1 | 18 | 18 | 23 | ||||||||||||||||||||||||||||||||||||
| Operating cash flow (EBITDA-CAPEX excluding licenses) |
3 | 1 | 0 | (3) | (1) | (2) | (2) | (8) | 1 | 8 | 1 | -13 | ||||||||||||||||||||||||||||||||||||
| OCF margin (%) |
18% | 10% | 2% | (15%) | (9%) | (13%) | (11%) | (60%) | 8% | 11% | 2% | -22% | ||||||||||||||||||||||||||||||||||||
| MOBILE |
1Q14 | 2Q14 | 3Q14 | 4Q14 | 1Q15 | 2Q15 | 3Q15 | 4Q15 | 1Q16 | FY13 | FY14 | FY15 | ||||||||||||||||||||||||||||||||||||
| Total operating revenue |
18 | 17 | 20 | 19 | 13 | 12 | 14 | 11 | 10 | 83 | 74 | 51 | ||||||||||||||||||||||||||||||||||||
| Service revenue |
17 | 17 | 20 | 19 | 13 | 12 | 13 | 11 | 10 | 79 | 73 | 49 | ||||||||||||||||||||||||||||||||||||
| Data Revenue |
0.6 | 0.6 | 0.7 | 0.6 | 0.5 | 0.5 | 0.6 | 0.6 | 0.6 | 2.6 | 2.5 | 2.3 | ||||||||||||||||||||||||||||||||||||
| Customers (mln) |
1.1 | 1.1 | 1.3 | 1.3 | 1.3 | 1.3 | 1.4 | 1.3 | 1.2 | 1.1 | 1.3 | 1.3 | ||||||||||||||||||||||||||||||||||||
| Mobile data customers (mln) |
0.4 | 0.4 | 0.4 | 0.4 | 0.5 | 0.5 | 0.5 | 0.5 | 0.4 | 0.4 | 0.4 | 0.5 | ||||||||||||||||||||||||||||||||||||
| ARPU (USD) |
5.0 | 4.9 | 5.3 | 4.5 | 3.2 | 3.0 | 3.1 | 2.7 | 2.5 | n.a. | n.a. | n.a. | ||||||||||||||||||||||||||||||||||||
| MOU (min) |
214 | 226 | 239 | 230 | 226 | 241 | 245 | 229 | 234 | n.a. | n.a. | n.a. | ||||||||||||||||||||||||||||||||||||
| Churn 3 months active base (quarterly) (%) |
16.1% | 16.4% | 15.9% | 21.3% | 16.7% | 16.1% | 15.8% | 20.4% | 19.5% | n.a. | n.a. | n.a. | ||||||||||||||||||||||||||||||||||||
| FIXED |
1Q14 | 2Q14 | 3Q14 | 4Q14 | 1Q15 | 2Q15 | 3Q15 | 4Q15 | 1Q16 | FY13 | FY14 | FY15 | ||||||||||||||||||||||||||||||||||||
| Total operating revenue |
1.0 | 0.4 | 1.2 | 1.8 | 1.6 | 2.7 | 1.7 | 1.0 | 0.0 | 4.6 | 4.4 | 7.0 | ||||||||||||||||||||||||||||||||||||
| Service revenue |
0.9 | 0.4 | 1.2 | 1.8 | 1.6 | 2.7 | 1.7 | 1.0 | 0.0 | 4.8 | 4.3 | 7.0 | ||||||||||||||||||||||||||||||||||||
| (in GEL millions, unless stated otherwise, unaudited) | ||||||||||||||||||||||||||||||||||||||||||||||||
| CONSOLIDATED |
1Q14 | 2Q14 | 3Q14 | 4Q14 | 1Q15 | 2Q15 | 3Q15 | 4Q15 | 1Q16 | FY13 | FY14 | FY15 | ||||||||||||||||||||||||||||||||||||
| Total operating revenue |
33 | 31 | 37 | 39 | 30 | 34 | 36 | 30 | 25 | 147 | 140 | 130 | ||||||||||||||||||||||||||||||||||||
| EBITDA |
9 | 8 | 10 | 8 | 4 | 7 | 7 | 4 | 5 | 45 | 35 | 23 | ||||||||||||||||||||||||||||||||||||
| EBITDA margin (%) |
26.2% | 25.2% | 27.7% | 21.4% | 14.2% | 21.6% | 19.2% | 15.0% | 19.4% | 30.4% | 25.1% | 17.7% | ||||||||||||||||||||||||||||||||||||
| Capital expenditures (CAPEX) |
3 | 5 | 10 | 19 | 83 | 12 | 11 | 23 | 3 | 29 | 37 | 129 | ||||||||||||||||||||||||||||||||||||
| CAPEX excluding licenses |
3 | 5 | 10 | 14 | 7 | 12 | 11 | 23 | 3 | 29 | 32 | 52 | ||||||||||||||||||||||||||||||||||||
| Operating cash flow (EBITDA-CAPEX excluding licenses) |
6 | 3 | 0 | (6) | (3) | (5) | (4) | (18) | 2 | 16 | 3 | -29 | ||||||||||||||||||||||||||||||||||||
| OCF margin (%) |
18% | 10% | 0% | (15%) | (10%) | (15%) | (11%) | (60%) | 8% | 11% | 2% | -22% | ||||||||||||||||||||||||||||||||||||
| MOBILE |
1Q14 | 2Q14 | 3Q14 | 4Q14 | 1Q15 | 2Q15 | 3Q15 | 4Q15 | 1Q16 | FY13 | FY14 | FY15 | ||||||||||||||||||||||||||||||||||||
| Total operating revenue |
31 | 31 | 35 | 35 | 27 | 28 | 32 | 28 | 25 | 138 | 132 | 114 | ||||||||||||||||||||||||||||||||||||
| Service revenue |
30 | 30 | 35 | 35 | 26 | 28 | 31 | 27 | 25 | 132 | 128 | 111 | ||||||||||||||||||||||||||||||||||||
| Data Revenue |
1.1 | 1.1 | 1.3 | 1.0 | 1.1 | 1.2 | 1.5 | 1.5 | 1.4 | 4.2 | 4.5 | 5.3 | ||||||||||||||||||||||||||||||||||||
| Customers (mln) |
1.11 | 1.15 | 1.25 | 1.25 | 1.28 | 1.30 | 1.37 | 1.30 | 1.2 | 1.1 | 1.3 | 1.3 | ||||||||||||||||||||||||||||||||||||
| Mobile data customers (mln) |
0.4 | 0.4 | 0.4 | 0.4 | 0.5 | 0.5 | 0.5 | 0.5 | 0.4 | 0.4 | 0.4 | 0.5 | ||||||||||||||||||||||||||||||||||||
| ARPU (GEL) |
8.7 | 8.5 | 9.2 | 8.2 | 6.7 | 6.9 | 7.2 | 6.4 | 6.2 | n.a. | n.a. | n.a. | ||||||||||||||||||||||||||||||||||||
| MOU (min) |
214 | 226 | 239 | 230 | 226 | 241 | 245 | 229 | 234 | n.a. | n.a. | n.a. | ||||||||||||||||||||||||||||||||||||
| Churn 3 months active base (quarterly) (%) |
16.1% | 16.4% | 15.9% | 21.3% | 16.7% | 16.1% | 15.8% | 20.4% | 19.5% | n.a. | n.a. | n.a. | ||||||||||||||||||||||||||||||||||||
| FIXED |
1Q14 | 2Q14 | 3Q14 | 4Q14 | 1Q15 | 2Q15 | 3Q15 | 4Q15 | 1Q16 | FY13 | FY14 | FY15 | ||||||||||||||||||||||||||||||||||||
| Total operating revenue |
2.0 | 0.7 | 2.2 | 3.3 | 3.3 | 6.2 | 4.0 | 2.3 | 0.0 | 8.1 | 8.2 | 15.8 | ||||||||||||||||||||||||||||||||||||
| Service revenue |
1.6 | 0.7 | 2.2 | 3.3 | 3.3 | 6.2 | 4.0 | 2.3 | 0.0 | 8.1 | 7.8 | 15.8 | ||||||||||||||||||||||||||||||||||||
Kyrgyzstan
(in USD millions, unless stated otherwise, unaudited)
| CONSOLIDATED |
1Q14 | 2Q14 | 3Q14 | 4Q14 | 1Q15 | 2Q15 | 3Q15 | 4Q15 | 1Q16 | FY13 | FY14 | FY15 | ||||||||||||||||||||||||||||||||||||
| Total operating revenue |
38 | 44 | 51 | 45 | 38 | 43 | 45 | 38 | 31 | 192 | 178 | 164 | ||||||||||||||||||||||||||||||||||||
| EBITDA |
17 | 23 | 27 | 23 | 21 | 24 | 26 | 21 | 17 | 97 | 90 | 91 | ||||||||||||||||||||||||||||||||||||
| EBITDA margin (%) |
45.2% | 53.0% | 52.9% | 52.0% | 53.5% | 56.0% | 57.0% | 55.6% | 54.8% | 50.5% | 51.1% | 55.6% | ||||||||||||||||||||||||||||||||||||
| Capital expenditures (CAPEX) |
3 | 6 | 8 | 10 | 3 | 3 | 10 | 9 | 2 | 23 | 27 | 26 | ||||||||||||||||||||||||||||||||||||
| CAPEX excluding licenses |
3 | 6 | 8 | 10 | 3 | 3 | 6 | 9 | 2 | 23 | 27 | 21 | ||||||||||||||||||||||||||||||||||||
| Operating cash flow (EBITDA-CAPEX excluding licenses) |
14 | 17 | 19 | 14 | 18 | 21 | 20 | 12 | 15 | 74 | 64 | 70 | ||||||||||||||||||||||||||||||||||||
| OCF margin (%) |
37% | 40% | 37% | 30% | 46% | 48% | 44% | 30% | 48% | 38% | 36% | 42% | ||||||||||||||||||||||||||||||||||||
| MOBILE |
1Q14 | 2Q14 | 3Q14 | 4Q14 | 1Q15 | 2Q15 | 3Q15 | 4Q15 | 1Q16 | FY13 | FY14 | FY15 | ||||||||||||||||||||||||||||||||||||
| Total operating revenue |
38 | 44 | 51 | 45 | 38 | 43 | 45 | 38 | 31 | 192 | 178 | 164 | ||||||||||||||||||||||||||||||||||||
| Service revenue |
38 | 44 | 51 | 45 | 38 | 42 | 45 | 38 | 31 | 192 | 178 | 163 | ||||||||||||||||||||||||||||||||||||
| Data Revenue |
4.3 | 4.3 | 5.1 | 4.8 | 4.6 | 4.8 | 5.5 | 4.5 | 4.1 | 14.2 | 18.5 | 19.4 | ||||||||||||||||||||||||||||||||||||
| Customers (mln) |
2.6 | 2.6 | 2.7 | 2.7 | 2.7 | 2.8 | 2.7 | 2.7 | 2.6 | 2.7 | 2.7 | 2.7 | ||||||||||||||||||||||||||||||||||||
| Mobile data customers (mln) |
1.5 | 1.5 | 1.5 | 1.6 | 1.6 | 1.5 | 1.6 | 1.6 | 1.5 | 1.5 | 1.6 | 1.6 | ||||||||||||||||||||||||||||||||||||
| ARPU (USD) |
4.7 | 5.6 | 6.3 | 5.4 | 4.6 | 5.1 | 5.3 | 4.6 | 3.9 | n.a. | n.a. | n.a. | ||||||||||||||||||||||||||||||||||||
| MOU (min) |
294 | 294 | 298 | 285 | 261 | 294 | 293 | 281 | 206 | n.a. | n.a. | n.a. | ||||||||||||||||||||||||||||||||||||
| Churn 3 months active base (quarterly) (%) |
19% | 16% | 15% | 16% | 15% | 14% | 19% | 19% | 19% | n.a. | n.a. | n.a. | ||||||||||||||||||||||||||||||||||||
| (in KGS millions, unless stated otherwise, unaudited) | ||||||||||||||||||||||||||||||||||||||||||||||||
| CONSOLIDATED |
1Q14 | 2Q14 | 3Q14 | 4Q14 | 1Q15 | 2Q15 | 3Q15 | 4Q15 | 1Q16 | FY13 | FY14 | FY15 | ||||||||||||||||||||||||||||||||||||
| Total operating revenue |
1,988 | 2,330 | 2,666 | 2,563 | 2,340 | 2,577 | 2,892 | 2,760 | 2,332 | 9,316 | 9,547 | 10,569 | ||||||||||||||||||||||||||||||||||||
| EBITDA |
899 | 1,234 | 1,410 | 1,333 | 1,253 | 1,445 | 1,647 | 1,534 | 1,279 | 4,702 | 4,877 | 5,879 | ||||||||||||||||||||||||||||||||||||
| EBITDA margin (%) |
45.2% | 53.0% | 52.9% | 52.0% | 53.6% | 56.1% | 56.9% | 55.6% | 54.8% | 50.5% | 51.1% | 55.6% | ||||||||||||||||||||||||||||||||||||
| Capital expenditures (CAPEX) |
159 | 305 | 412 | 562 | 168 | 194 | 666 | 711 | 152 | 1,137 | 1,438 | 1,739 | ||||||||||||||||||||||||||||||||||||
| CAPEX excluding licenses |
159 | 305 | 412 | 562 | 168 | 194 | 368 | 711 | 152 | 1,137 | 1,438 | 1,440 | ||||||||||||||||||||||||||||||||||||
| Operating cash flow (EBITDA-CAPEX excluding licenses) |
740 | 929 | 998 | 771 | 1,085 | 1,251 | 1,279 | 823 | 1,127 | 3,565 | 3,438 | 4,440 | ||||||||||||||||||||||||||||||||||||
| OCF margin (%) |
37% | 40% | 37% | 30% | 46% | 49% | 44% | 30% | 48% | 38% | 36% | 42% | ||||||||||||||||||||||||||||||||||||
| MOBILE |
1Q14 | 2Q14 | 3Q14 | 4Q14 | 1Q15 | 2Q15 | 3Q15 | 4Q15 | 1Q16 | FY13 | FY14 | FY15 | ||||||||||||||||||||||||||||||||||||
| Total operating revenue |
1,988 | 2,330 | 2,666 | 2,563 | 2,340 | 2,577 | 2,892 | 2,760 | 2,332 | 9,315 | 9,547 | 10,569 | ||||||||||||||||||||||||||||||||||||
| Service revenue |
1,975 | 2,322 | 2,658 | 2,549 | 2,318 | 2,556 | 2,865 | 2,722 | 2,316 | 9,254 | 9,504 | 10,460 | ||||||||||||||||||||||||||||||||||||
| Data Revenue |
221 | 229 | 266 | 272 | 282 | 293 | 350 | 323 | 304 | 686 | 988 | 1,248 | ||||||||||||||||||||||||||||||||||||
| Customers (mln) |
2.6 | 2.6 | 2.7 | 2.7 | 2.7 | 2.8 | 2.7 | 2.7 | 2.6 | 2.7 | 2.7 | 2.7 | ||||||||||||||||||||||||||||||||||||
| Mobile data customers (mln) |
1.5 | 1.5 | 1.5 | 1.6 | 1.6 | 1.5 | 1.6 | 1.6 | 1.5 | 1.5 | 1.6 | 1.6 | ||||||||||||||||||||||||||||||||||||
| ARPU, (KGS) |
248 | 297 | 330 | 310 | 282 | 309 | 343 | 332 | 289 | n.a. | n.a. | n.a. | ||||||||||||||||||||||||||||||||||||
| MOU (min) |
294 | 294 | 298 | 285 | 261 | 294 | 293 | 281 | 206 | n.a. | n.a. | n.a. | ||||||||||||||||||||||||||||||||||||
| Churn 3 months active base (quarterly) (%) |
19% | 16% | 15% | 16% | 15% | 14% | 19% | 19% | 19% | n.a. | n.a. | n.a. | ||||||||||||||||||||||||||||||||||||
Asia (Laos)
index page
(in USD millions, unless stated otherwise, unaudited)
| CONSOLIDATED |
1Q13 | 2Q13 | 3Q13 | 4Q13 | 1Q14 | 2Q14 | 3Q14 | 4Q14 | 1Q15 | 2Q15 | 3Q15 | 4Q15 | 1Q16 | FY13 | FY14 | FY15 | ||||||||||||||||||||||||||||||||||||||||||||||||
| Total operating revenue |
11.9 | 7.8 | 7.0 | 6.7 | 8.3 | 8.0 | 7.0 | 5.5 | 5.1 | 4.7 | 4.3 | 4.1 | 3.8 | 33.4 | 28.5 | 18.2 | ||||||||||||||||||||||||||||||||||||||||||||||||
| EBITDA |
(0.9) | 2.8 | 2.0 | 1.7 | 2.4 | 3.0 | 2.0 | 2.3 | 2.0 | 1.5 | 0.9 | 1.0 | 0.6 | 5.6 | 9.6 | 5.4 | ||||||||||||||||||||||||||||||||||||||||||||||||
| EBITDA margin (%) |
n.m. | 35.7% | 30.5% | 25.8% | 28.4% | 37.7% | 28.0% | 42.7% | 38.5% | 31.2% | 21.2% | 25.1% | 15.6% | 16.9% | 33.6% | 29.6% | ||||||||||||||||||||||||||||||||||||||||||||||||
| MOBILE |
1Q13 | 2Q13 | 3Q13 | 4Q13 | 1Q14 | 2Q14 | 3Q14 | 4Q14 | 1Q15 | 2Q15 | 3Q15 | 4Q15 | 1Q16 | FY13 | FY14 | FY15 | ||||||||||||||||||||||||||||||||||||||||||||||||
| Customers (mln) |
0.3 | 0.3 | 0.3 | 0.3 | 0.3 | 0.3 | 0.3 | 0.2 | 0.2 | 0.2 | 0.2 | 0.2 | 0.2 | 0.3 | 0.2 | 0.2 | ||||||||||||||||||||||||||||||||||||||||||||||||
| ARPU (USD) |
7.0 | 7.1 | 6.1 | 6.1 | 5.4 | 5.6 | 5.7 | 5.0 | 5.1 | 6.0 | 5.3 | 5.1 | 6.0 | n.a. | n.a. | n.a. | ||||||||||||||||||||||||||||||||||||||||||||||||
Italy
index page
(in EUR millions, unless stated otherwise, unaudited)
| CONSOLIDATED |
1Q13 | 2Q13 | 3Q13 | 4Q13 | 1Q14 | 2Q14 | 3Q14 | 4Q14 | 1Q15 | 2Q15 | 3Q15 | 4Q15 | 1Q16 | FY13 | FY14 | FY15 | ||||||||||||||||||||||||||||||||||||||||||||||||
| Total operating revenue |
1,229 | 1,266 | 1,250 | 1,237 | 1,144 | 1,147 | 1,220 | 1,123 | 1,078 | 1,082 | 1,090 | 1,178 | 1,064 | 4,983 | 4,633 | 4,428 | ||||||||||||||||||||||||||||||||||||||||||||||||
| EBITDA |
461 | 475 | 507 | 500 | 430 | 435 | 521 | 418 | 406 | 397 | 427 | 441 | 381 | 1,943 | 1,804 | 1,671 | ||||||||||||||||||||||||||||||||||||||||||||||||
| EBITDA margin (%) |
37.5% | 37.5% | 40.6% | 40.4% | 37.6% | 38.0% | 42.7% | 37.2% | 37.7% | 36.7% | 39.1% | 37.4% | 35.8% | 39.0% | 38.9% | 37.7% | ||||||||||||||||||||||||||||||||||||||||||||||||
| Capital expenditures (CAPEX) |
298 | 183 | 153 | 291 | 137 | 173 | 187 | 261 | 172 | 186 | 170 | 251 | 172 | 924 | 757 | 779 | ||||||||||||||||||||||||||||||||||||||||||||||||
| CAPEX excluding licenses |
298 | 183 | 153 | 291 | 137 | 173 | 187 | 261 | 172 | 186 | 170 | 251 | 172 | 924 | 757 | 779 | ||||||||||||||||||||||||||||||||||||||||||||||||
| Operating cash flow (EBITDA-CAPEX excluding licenses) |
299 | 292 | 354 | 209 | 293 | 262 | 334 | 157 | 234 | 212 | 256 | 190 | 209 | 1,154 | 1,046 | 892 | ||||||||||||||||||||||||||||||||||||||||||||||||
| OCF margin (%) |
24% | 23% | 28% | 17% | 26% | 23% | 27% | 14% | 22% | 20% | 24% | 16% | 20% | 23% | 23% | 20% | ||||||||||||||||||||||||||||||||||||||||||||||||
| MOBILE |
1Q13 | 2Q13 | 3Q13 | 4Q13 | 1Q14 | 2Q14 | 3Q14 | 4Q14 | 1Q15 | 2Q15 | 3Q15 | 4Q15 | 1Q16 | FY13 | FY14 | FY15 | ||||||||||||||||||||||||||||||||||||||||||||||||
| Total operating revenue |
888 | 927 | 926 | 907 | 827 | 832 | 848 | 820 | 781 | 800 | 818 | 880 | 796 | 3,648 | 3,328 | 3,278 | ||||||||||||||||||||||||||||||||||||||||||||||||
| Service revenue |
815 | 828 | 839 | 800 | 729 | 737 | 763 | 746 | 705 | 720 | 752 | 736 | 703 | 3,282 | 2,975 | 2,912 | ||||||||||||||||||||||||||||||||||||||||||||||||
| Data Revenue |
106 | 116 | 134 | 131 | 132 | 137 | 152 | 152 | 154 | 159 | 172 | 168 | 174 | 488 | 573 | 652 | ||||||||||||||||||||||||||||||||||||||||||||||||
| Customers (mln) |
22.0 | 22.3 | 22.4 | 22.3 | 22.0 | 21.9 | 21.8 | 21.6 | 21.4 | 21.4 | 21.3 | 21.1 | 20.9 | 22.3 | 21.6 | 21.1 | ||||||||||||||||||||||||||||||||||||||||||||||||
| Data customers (mln) |
6.7 | 7.6 | 8.2 | 8.8 | 9.3 | 9.7 | 10.2 | 10.2 | 10.9 | 11.0 | 11.3 | 11.6 | 11.6 | 8.8 | 10.2 | 11.6 | ||||||||||||||||||||||||||||||||||||||||||||||||
| ARPU (€) |
12.4 | 12.4 | 12.5 | 11.9 | 10.9 | 11.1 | 11.6 | 11.4 | 10.9 | 11.2 | 11.6 | 11.4 | 11.0 | n.a. | n.a. | n.a. | ||||||||||||||||||||||||||||||||||||||||||||||||
| of which: |
||||||||||||||||||||||||||||||||||||||||||||||||||||||||||||||||
| ARPU voice (€) |
8.3 | 8.2 | 7.8 | 7.5 | 6.7 | 6.8 | 7.0 | 6.9 | 6.3 | 6.6 | 6.7 | 6.6 | 6.2 | n.a. | n.a. | n.a. | ||||||||||||||||||||||||||||||||||||||||||||||||
| ARPU data (€) |
4.1 | 4.2 | 4.7 | 4.4 | 4.2 | 4.3 | 4.6 | 4.5 | 4.5 | 4.6 | 4.9 | 4.8 | 4.8 | n.a. | n.a. | n.a. | ||||||||||||||||||||||||||||||||||||||||||||||||
| MOU (min.) |
216 | 233 | 240 | 256 | 254 | 261 | 262 | 274 | 267 | 275 | 263 | 274 | 270 | n.a. | n.a. | n.a. | ||||||||||||||||||||||||||||||||||||||||||||||||
| Total traffic (mln. min.) |
14,166 | 15,512 | 16,093 | 17,142 | 16,895 | 17,486 | 17,150 | 17,819 | 17,188 | 17,538 | 16,853 | 17,448 | 17,026 | n.a. | n.a. | n.a. | ||||||||||||||||||||||||||||||||||||||||||||||||
| Churn, annualised rate (%) |
35.5% | 37.5% | 39.7% | 33.5% | 32.2% | 29.9% | 32.0% | 31.6% | 35.1% | 25.2% | 27.9% | 28.8% | 30.3% | n.a. | n.a. | n.a. | ||||||||||||||||||||||||||||||||||||||||||||||||
| MBOU |
n.a. | n.a. | n.a. | n.a. | n.a. | n.a. | n.a. | n.a. | 1,392 | 1,436 | 1,635 | 1,628 | 1,742 | n.a. | n.a. | n.a. | ||||||||||||||||||||||||||||||||||||||||||||||||
| FIXED-LINE |
1Q13 | 2Q13 | 3Q13 | 4Q13 | 1Q14 | 2Q14 | 3Q14 | 4Q14 | 1Q15 | 2Q15 | 3Q15 | 4Q15 | 1Q16 | FY13 | FY14 | FY15 | ||||||||||||||||||||||||||||||||||||||||||||||||
| Total operating revenue |
341 | 339 | 325 | 330 | 316 | 314 | 372 | 302 | 297 | 283 | 272 | 298 | 269 | 1,335 | 1,305 | 1,150 | ||||||||||||||||||||||||||||||||||||||||||||||||
| Service revenue |
332 | 330 | 312 | 320 | 306 | 303 | 291 | 292 | 278 | 277 | 272 | 268 | 263 | 1,295 | 1,192 | 1,096 | ||||||||||||||||||||||||||||||||||||||||||||||||
| Total voice customers (mln) |
3.1 | 3.0 | 3.0 | 3.0 | 3.0 | 2.9 | 2.9 | 2.8 | 2.8 | 2.8 | 2.8 | 2.8 | 2.8 | 3.0 | 2.8 | 2.8 | ||||||||||||||||||||||||||||||||||||||||||||||||
| of which: |
||||||||||||||||||||||||||||||||||||||||||||||||||||||||||||||||
| Total DIRECT voice customers (mln) |
2.5 | 2.5 | 2.4 | 2.4 | 2.4 | 2.4 | 2.4 | 2.4 | 2.4 | 2.4 | 2.4 | 2.4 | 2.5 | 2.4 | 2.4 | 2.4 | ||||||||||||||||||||||||||||||||||||||||||||||||
| Total INDIRECT voice customers (mln) |
0.6 | 0.6 | 0.6 | 0.5 | 0.5 | 0.5 | 0.5 | 0.4 | 0.4 | 0.4 | 0.4 | 0.4 | 0.3 | 0.5 | 0.4 | 0.4 | ||||||||||||||||||||||||||||||||||||||||||||||||
| Total fixed-line ARPU (€) |
31.3 | 31.2 | 30.0 | 30.3 | 29.8 | 29.9 | 29.0 | 28.7 | 27.9 | 27.9 | 27.8 | 28.0 | 27.3 | n.a. | n.a. | n.a. | ||||||||||||||||||||||||||||||||||||||||||||||||
| Total Traffic (mln. min.) |
4,449 | 4,036 | 3,209 | 3,888 | 3,627 | 3,410 | 2,616 | 3,292 | 3,137 | 2,819 | 2,357 | 2,763 | 2,633 | n.a. | n.a. | n.a. | ||||||||||||||||||||||||||||||||||||||||||||||||
| Total Internet customers (mln) |
2.3 | 2.2 | 2.2 | 2.2 | 2.2 | 2.2 | 2.2 | 2.2 | 2.2 | 2.2 | 2.3 | 2.3 | 2.3 | 2.2 | 2.2 | 2.3 | ||||||||||||||||||||||||||||||||||||||||||||||||
| of which : |
||||||||||||||||||||||||||||||||||||||||||||||||||||||||||||||||
| Broadband (mln) |
2.2 | 2.2 | 2.2 | 2.2 | 2.2 | 2.2 | 2.1 | 2.2 | 2.2 | 2.2 | 2.2 | 2.3 | 2.3 | 2.2 | 2.2 | 2.3 | ||||||||||||||||||||||||||||||||||||||||||||||||
| Broadband ARPU (€) |
20.2 | 20.2 | 20.4 | 20.5 | 20.8 | 21.3 | 21.4 | 21.6 | 21.1 | 21.2 | 21.1 | 20.9 | 20.5 | n.a. | n.a. | n.a. | ||||||||||||||||||||||||||||||||||||||||||||||||
| Dual-play customers (mln) |
1.9 | 1.9 | 1.9 | 1.9 | 1.9 | 1.9 | 1.9 | 1.9 | 2.0 | 2.0 | 2.0 | 2.0 | 2.1 | 1.9 | 1.9 | 2.0 | ||||||||||||||||||||||||||||||||||||||||||||||||
| * | Excluding impact of FOC CAPEX and including LTE |
| ** | Excluding impact of FOC and excluding LTE |
| *** | 1Q13 and FY13 CAPEX excludes EUR 136 million of non-cash increase in Intangible Assets related to the contract with Terna in relation to the Right of Way of WIND’s backbone |
| **** | Mobile data include customers that have performed at least one mobile Internet event in the previous month |
Italy (continued)
(in USD millions, unless stated otherwise, unaudited)
| CONSOLIDATED |
1Q13 | 2Q13 | 3Q13 | 4Q13 | 1Q14 | 2Q14 | 3Q14 | 4Q14 | 1Q15 | 2Q15 | 3Q15 | 4Q15 | 1Q16 | FY13 | FY14 | FY15 | ||||||||||||||||||||||||||||||||||||||||||||||||
| Total operating revenue |
n.a. | n.a. | n.a. | n.a. | n.a. | n.a. | n.a. | n.a. | 1,213 | 1,198 | 1,212 | 1,289 | 1,175 | n.a. | n.a. | 4,913 | ||||||||||||||||||||||||||||||||||||||||||||||||
| EBITDA |
n.a. | n.a. | n.a. | n.a. | n.a. | n.a. | n.a. | n.a. | 459 | 444 | 478 | 497 | 421 | n.a. | n.a. | 1,878 | ||||||||||||||||||||||||||||||||||||||||||||||||
| EBITDA margin (%) |
n.a. | n.a. | n.a. | n.a. | n.a. | n.a. | n.a. | n.a. | 37.7% | 36.7% | 39.1% | 38.5% | 35.8% | n.a. | n.a. | 38.2% | ||||||||||||||||||||||||||||||||||||||||||||||||
| Capital expenditures (CAPEX) |
n.a. | n.a. | n.a. | n.a. | n.a. | n.a. | n.a. | n.a. | 194 | 208 | 192 | 275 | 190 | n.a. | n.a. | 869 | ||||||||||||||||||||||||||||||||||||||||||||||||
| CAPEX excluding licenses |
n.a. | n.a. | n.a. | n.a. | n.a. | n.a. | n.a. | n.a. | 194 | 208 | 192 | 275 | 190 | n.a. | n.a. | 869 | ||||||||||||||||||||||||||||||||||||||||||||||||
| Operating cash flow (EBITDA-CAPEX excluding licenses) |
n.a. | n.a. | n.a. | n.a. | n.a. | n.a. | n.a. | n.a. | 265 | 237 | 286 | 222 | 230 | n.a. | n.a. | 1,009 | ||||||||||||||||||||||||||||||||||||||||||||||||
| OCF margin (%) |
n.a. | n.a. | n.a. | n.a. | n.a. | n.a. | n.a. | n.a. | 22% | 20% | 24% | 16% | 20% | n.a. | n.a. | 20% | ||||||||||||||||||||||||||||||||||||||||||||||||
| MOBILE |
1Q13 | 2Q13 | 3Q13 | 4Q13 | 1Q14 | 2Q14 | 3Q14 | 4Q14 | 1Q15 | 2Q15 | 3Q15 | 4Q15 | 1Q16 | FY13 | FY14 | FY15 | ||||||||||||||||||||||||||||||||||||||||||||||||
| Total operating revenue |
n.a. | n.a. | n.a. | n.a. | n.a. | n.a. | n.a. | n.a. | 794 | 797 | 910 | 963 | 878 | n.a. | n.a. | 3,464 | ||||||||||||||||||||||||||||||||||||||||||||||||
| Service revenue |
n.a. | n.a. | n.a. | n.a. | n.a. | n.a. | n.a. | n.a. | 794 | 797 | 836 | 806 | 776 | n.a. | n.a. | 3,233 | ||||||||||||||||||||||||||||||||||||||||||||||||
| Data Revenue |
n.a. | n.a. | n.a. | n.a. | n.a. | n.a. | n.a. | n.a. | 167 | 178 | 180 | 199 | 192 | n.a. | n.a. | 724 | ||||||||||||||||||||||||||||||||||||||||||||||||
| Customers (mln) |
n.a. | n.a. | n.a. | n.a. | n.a. | n.a. | n.a. | n.a. | 19.2 | 19.1 | 21.3 | 21.1 | 20.9 | n.a. | n.a. | 21.1 | ||||||||||||||||||||||||||||||||||||||||||||||||
| Data customers (mln) |
n.a. | n.a. | n.a. | n.a. | n.a. | n.a. | n.a. | n.a. | 10.9 | 11.0 | 11.3 | 11.6 | 11.6 | n.a. | n.a. | 11.6 | ||||||||||||||||||||||||||||||||||||||||||||||||
| ARPU (USD) |
n.a. | n.a. | n.a. | n.a. | n.a. | n.a. | n.a. | n.a. | 11.8 | 12.6 | 13.0 | 12.5 | 12 | n.a. | n.a. | n.a. | ||||||||||||||||||||||||||||||||||||||||||||||||
| of which: |
n.a. | n.a. | n.a. | n.a. | n.a. | n.a. | n.a. | n.a. | n.a. | n.a. | n.a. | |||||||||||||||||||||||||||||||||||||||||||||||||||||
| ARPU voice (USD) |
n.a. | n.a. | n.a. | n.a. | n.a. | n.a. | n.a. | n.a. | 6.9 | 7.4 | 7.5 | 7.2 | 7 | n.a. | n.a. | n.a. | ||||||||||||||||||||||||||||||||||||||||||||||||
| ARPU data (USD) |
n.a. | n.a. | n.a. | n.a. | n.a. | n.a. | n.a. | n.a. | 4.9 | 5.2 | 5.5 | 5.3 | 5 | n.a. | n.a. | n.a. | ||||||||||||||||||||||||||||||||||||||||||||||||
| MOU (min.) |
n.a. | n.a. | n.a. | n.a. | n.a. | n.a. | n.a. | n.a. | 267 | 275 | 263 | 274 | 270.0 | n.a. | n.a. | n.a. | ||||||||||||||||||||||||||||||||||||||||||||||||
| Total traffic (mln. min.) |
n.a. | n.a. | n.a. | n.a. | n.a. | n.a. | n.a. | n.a. | 17,188 | 17,538 | 16,853 | 17,448 | 17,025.5 | n.a. | n.a. | n.a. | ||||||||||||||||||||||||||||||||||||||||||||||||
| Churn, annualised rate (%) |
n.a. | n.a. | n.a. | n.a. | n.a. | n.a. | n.a. | n.a. | 35.1% | 25.2% | 27.9% | 28.8% | 30% | n.a. | n.a. | n.a. | ||||||||||||||||||||||||||||||||||||||||||||||||
| MBOU |
n.a. | n.a. | n.a. | n.a. | n.a. | n.a. | n.a. | n.a. | 1,392 | 1,436 | 1,635 | 1,628 | 1,741.7 | n.a. | n.a. | n.a. | ||||||||||||||||||||||||||||||||||||||||||||||||
| FIXED-LINE |
1Q13 | 2Q13 | 3Q13 | 4Q13 | 1Q14 | 2Q14 | 3Q14 | 4Q14 | 1Q15 | 2Q15 | 3Q15 | 4Q15 | 1Q16 | FY13 | FY14 | FY15 | ||||||||||||||||||||||||||||||||||||||||||||||||
| Total operating revenue |
n.a. | n.a. | n.a. | n.a. | n.a. | n.a. | n.a. | n.a. | 334 | 313 | 302 | 326 | 296 | n.a. | n.a. | 1,275 | ||||||||||||||||||||||||||||||||||||||||||||||||
| Service revenue |
n.a. | n.a. | n.a. | n.a. | n.a. | n.a. | n.a. | n.a. | 313 | 307 | 303 | 293 | 290 | n.a. | n.a. | 1,217 | ||||||||||||||||||||||||||||||||||||||||||||||||
| Total voice customers (mln) |
n.a. | n.a. | n.a. | n.a. | n.a. | n.a. | n.a. | n.a. | 2.8 | 2.8 | 2.8 | 2.8 | 2.8 | n.a. | n.a. | 2.8 | ||||||||||||||||||||||||||||||||||||||||||||||||
| of which: |
||||||||||||||||||||||||||||||||||||||||||||||||||||||||||||||||
| Total DIRECT voice customers (mln) |
n.a. | n.a. | n.a. | n.a. | n.a. | n.a. | n.a. | n.a. | 2.4 | 2.4 | 2.4 | 2.4 | 2.5 | n.a. | n.a. | 2.4 | ||||||||||||||||||||||||||||||||||||||||||||||||
| Total INDIRECT voice customers (mln) |
n.a. | n.a. | n.a. | n.a. | n.a. | n.a. | n.a. | n.a. | 0.4 | 0.4 | 0.4 | 0.4 | 0.3 | n.a. | n.a. | 0.4 | ||||||||||||||||||||||||||||||||||||||||||||||||
| Total fixed-line ARPU (USD) |
n.a. | n.a. | n.a. | n.a. | n.a. | n.a. | n.a. | n.a. | 30.2 | 31.4 | 31.3 | 30.6 | 30 | n.a. | n.a. | n.a. | ||||||||||||||||||||||||||||||||||||||||||||||||
| Total Traffic (mln. min.) |
n.a. | n.a. | n.a. | n.a. | n.a. | n.a. | n.a. | n.a. | 3,137 | 2,819 | 2,357 | 2,763 | 2,633 | n.a. | n.a. | n.a. | ||||||||||||||||||||||||||||||||||||||||||||||||
| Total Internet customers (mln) |
n.a. | n.a. | n.a. | n.a. | n.a. | n.a. | n.a. | n.a. | 2.2 | 2.2 | 2.3 | 2.3 | 2.3 | n.a. | n.a. | 2.3 | ||||||||||||||||||||||||||||||||||||||||||||||||
| of which : |
||||||||||||||||||||||||||||||||||||||||||||||||||||||||||||||||
| Broadband (mln) |
n.a. | n.a. | n.a. | n.a. | n.a. | n.a. | n.a. | n.a. | 2.2 | 2.2 | 2.2 | 2.3 | 2.3 | n.a. | n.a. | 2.3 | ||||||||||||||||||||||||||||||||||||||||||||||||
| Broadband ARPU (USD) |
n.a. | n.a. | n.a. | n.a. | n.a. | n.a. | n.a. | n.a. | 22.8 | 23.8 | 23.8 | 22.7 | 23 | n.a. | n.a. | n.a. | ||||||||||||||||||||||||||||||||||||||||||||||||
| Dual-play customers (mln) |
n.a. | n.a. | n.a. | n.a. | n.a. | n.a. | n.a. | n.a. | 2.0 | 2.0 | 2.0 | 2.0 | 2.1 | n.a. | n.a. | 2.0 | ||||||||||||||||||||||||||||||||||||||||||||||||
VimpelCom Ltd.
EBITDA Underlying Reconciliation
| (USD mln) | (LCCY mln) | |||||||||||||||||||||||||||||||||||||||||||||||
| 1Q15 | 2Q15 | 3Q15 | 4Q15 | FY15 | 1Q16 | 1Q15 | 2Q15 | 3Q15 | 4Q15 | FY15 | 1Q16 | |||||||||||||||||||||||||||||||||||||
| Russia |
||||||||||||||||||||||||||||||||||||||||||||||||
| EBITDA Reported |
421 | 524 | 455 | 424 | 1,824 | 324 | 26,130 | 27,536 | 28,466 | 28,012 | 110,145 | 24,159 | ||||||||||||||||||||||||||||||||||||
| Site capitalization |
(30 | ) | (30 | ) | (2,152 | ) | (2,152 | ) | ||||||||||||||||||||||||||||||||||||||||
| A/R inventory and provision |
2 | 2 | 132 | 132 | ||||||||||||||||||||||||||||||||||||||||||||
| PT Costs |
1 | 1 | 53 | 53 | ||||||||||||||||||||||||||||||||||||||||||||
| EBITDA Underlying |
421 | 524 | 455 | 396 | 1,796 | 325 | 26,130 | 27,536 | 28,466 | 25,992 | 108,177 | 24,212 | ||||||||||||||||||||||||||||||||||||
| Algeria |
||||||||||||||||||||||||||||||||||||||||||||||||
| EBITDA reported |
169 | 175 | 178 | 162 | 684 | 158 | 15,723 | 17,199 | 18,330 | 17,300 | 68,552 | 17,060 | ||||||||||||||||||||||||||||||||||||
| PT Costs |
6 | 6 | 677 | 677 | ||||||||||||||||||||||||||||||||||||||||||||
| A/R and inventory provision |
6 | 6 | 593 | 593 | ||||||||||||||||||||||||||||||||||||||||||||
| EBITDA Underlying |
169 | 175 | 178 | 174 | 696 | 158 | 15,723 | 17,199 | 18,330 | 18,570 | 69,822 | 17,060 | ||||||||||||||||||||||||||||||||||||
| Pakistan |
||||||||||||||||||||||||||||||||||||||||||||||||
| EBITDA reported |
96 | 106 | 103 | 104 | 409 | 116 | 9,725 | 10,828 | 10,620 | 10,900 | 42,072 | 12,166 | ||||||||||||||||||||||||||||||||||||
| SIM re-verification costs |
7 | 7 | 766 | 700 | ||||||||||||||||||||||||||||||||||||||||||||
| PT Costs |
2 | 2 | 3 | 188 | 188 | 339 | ||||||||||||||||||||||||||||||||||||||||||
| Other |
(9 | ) | (9 | ) | (971 | ) | (971 | ) | ||||||||||||||||||||||||||||||||||||||||
| EBITDA Underlying |
103 | 106 | 94 | 106 | 409 | 119 | 10,491 | 10,828 | 9,648 | 11,088 | 41,989 | 12,505 | ||||||||||||||||||||||||||||||||||||
| Bangladesh |
||||||||||||||||||||||||||||||||||||||||||||||||
| EBITDA Reported |
60 | 63 | 69 | 51 | 243 | 70 | 4,635 | 4,930 | 5,339 | 4,000 | 18,905 | 5,500 | ||||||||||||||||||||||||||||||||||||
| PT Costs |
4 | 4 | 4 | 333 | 333 | 351 | ||||||||||||||||||||||||||||||||||||||||||
| SIM tax provision |
2 | 12 | 14 | 156 | 923 | 1,079 | ||||||||||||||||||||||||||||||||||||||||||
| A/R and inventory provision |
7 | 7 | 526 | 526 | ||||||||||||||||||||||||||||||||||||||||||||
| EBITDA Underlying |
60 | 63 | 71 | 74 | 268 | 75 | 4,635 | 4,930 | 5,495 | 5,782 | 20,842 | 5,850 | ||||||||||||||||||||||||||||||||||||
| Ukraine |
||||||||||||||||||||||||||||||||||||||||||||||||
| EBITDA Reported |
63 | 70 | 84 | 75 | 292 | 71 | 1,278 | 1,512 | 1,835 | 1,706 | 6,331 | 1,830 | ||||||||||||||||||||||||||||||||||||
| PT Costs |
— | 0 | — | 1 | ||||||||||||||||||||||||||||||||||||||||||||
| Reversal of tax provisions |
— | (1 | ) | — | (22 | ) | ||||||||||||||||||||||||||||||||||||||||||
| EBITDA Underlying |
63 | 70 | 84 | 75 | 292 | 71 | 1,278 | 1,512 | 1,835 | 1,706 | 6,331 | 1,810 | ||||||||||||||||||||||||||||||||||||
| Kazakhstan |
||||||||||||||||||||||||||||||||||||||||||||||||
| EBITDA reported |
81 | 82 | 66 | 46 | 275 | 31 | 14,981 | 15,265 | 14,108 | 13,714 | 58,068 | 11,119 | ||||||||||||||||||||||||||||||||||||
| PT Costs |
1 | 1 | 1 | 213 | 213 | 324 | ||||||||||||||||||||||||||||||||||||||||||
| Other |
5 | 1,012 | ||||||||||||||||||||||||||||||||||||||||||||||
| EBITDA Underlying |
81 | 82 | 71 | 47 | 276 | 32 | 14,981 | 15,265 | 15,120 | 13,927 | 58,281 | 11,444 | ||||||||||||||||||||||||||||||||||||
| Uzbekistan |
||||||||||||||||||||||||||||||||||||||||||||||||
| EBITDA reported |
105 | 113 | 99 | 121 | 437 | 100 | 256,637 | 284,201 | 255,021 | 328,000 | 1,123,860 | 284,934 | ||||||||||||||||||||||||||||||||||||
| Legal provision |
16 | 16 | 43,066 | 43,066 | ||||||||||||||||||||||||||||||||||||||||||||
| Return of litigation losses |
— | (2 | ) | — | (5,159 | ) | ||||||||||||||||||||||||||||||||||||||||||
| Return of bad debt losses |
— | (1 | ) | — | (3,948 | ) | ||||||||||||||||||||||||||||||||||||||||||
| EBITDA Underlying |
105 | 113 | 115 | 121 | 453 | 97 | 256,637 | 284,201 | 298,087 | 328,000 | 1,166,926 | 275,827 | ||||||||||||||||||||||||||||||||||||
| Kyrgyzstan |
||||||||||||||||||||||||||||||||||||||||||||||||
| EBITDA reported |
21 | 24 | 26 | 21 | 92 | 17 | 1,253 | 1,445 | 1,647 | 1,534 | 5,879 | 1,279 | ||||||||||||||||||||||||||||||||||||
| EBITDA Underlying |
21 | 24 | 26 | 21 | 92 | 17 | 1,253 | 1,445 | 1,647 | 1,534 | 5,879 | 1,279 | ||||||||||||||||||||||||||||||||||||
| Armenia |
||||||||||||||||||||||||||||||||||||||||||||||||
| EBITDA reported |
9 | 11 | 12 | 7 | 39 | 8 | 4,415 | 5,388 | 5,870 | 3,223 | 18,896 | 3,942 | ||||||||||||||||||||||||||||||||||||
| EBITDA Underlying |
9 | 11 | 12 | 7 | 39 | 8 | 4,415 | 5,388 | 5,870 | 3,223 | 18,896 | 3,942 | ||||||||||||||||||||||||||||||||||||
| Tajikistan |
||||||||||||||||||||||||||||||||||||||||||||||||
| EBITDA reported |
14 | 18 | 25 | 17 | 74 | 12 | 14 | 18 | 25 | 17 | 74 | 12 | ||||||||||||||||||||||||||||||||||||
| EBITDA Underlying |
14 | 18 | 25 | 17 | 74 | 12 | 14 | 18 | 25 | 17 | 74 | 12 | ||||||||||||||||||||||||||||||||||||
| Georgia |
||||||||||||||||||||||||||||||||||||||||||||||||
| EBITDA reported |
2 | 3 | 3 | 2 | 10 | 2 | 4 | 7 | 7 | 4 | 22 | 5 | ||||||||||||||||||||||||||||||||||||
| HR |
0 | 0 | ||||||||||||||||||||||||||||||||||||||||||||||
| EBITDA Underlying |
2 | 3 | 3 | 2 | 10 | 2 | 4 | 7 | 7 | 4 | 22 | 5 | ||||||||||||||||||||||||||||||||||||
| HQ |
||||||||||||||||||||||||||||||||||||||||||||||||
| Uzbekistan Provision |
900 | 11 | 911 | |||||||||||||||||||||||||||||||||||||||||||||
| PT Costs |
44 | 65 | 109 | 35 | ||||||||||||||||||||||||||||||||||||||||||||
| Other |
||||||||||||||||||||||||||||||||||||||||||||||||
| VIP Group Reported |
938 | 1,069 | 58 | 811 | 2,875 | 758 | ||||||||||||||||||||||||||||||||||||||||||
| One-offs |
7 | — | 958 | 86 | 1,051 | 40 | ||||||||||||||||||||||||||||||||||||||||||
| VIP Group Underlying |
945 | 1,069 | 1,016 | 897 | 3,926 | 799 | ||||||||||||||||||||||||||||||||||||||||||
Serious News for Serious Traders! Try StreetInsider.com Premium Free!
You May Also Be Interested In
- Textron Aviation’s Company-Owned Service Centers Receive Recertification as a Green Aviation Business from NATA
- OKX Launches X Layer Public Mainnet to Bring its 50M Users On-Chain
- GridBeyond Closes €52M Series C Funding Round to Continue Its Platform Evolution and Invest in New & Existing Markets
Create E-mail Alert Related Categories
SEC FilingsSign up for StreetInsider Free!
Receive full access to all new and archived articles, unlimited portfolio tracking, e-mail alerts, custom newswires and RSS feeds - and more!


 Tweet
Tweet Share
Share