

Form 6-K VimpelCom Ltd. For: Feb 25
 Tweet
Tweet Share
ShareUNITED STATES
SECURITIES AND EXCHANGE COMMISSION
Washington, D.C. 20549
FORM 6-K
Report of Foreign Private Issuer
Pursuant to Rule 13a-16 or 15d-16
under the Securities Exchange Act of 1934
For the month of February 2015
Commission File Number 1-34694
VimpelCom Ltd.
(Translation of registrant’s name into English)
The Rock Building, Claude Debussylaan 88, 1082 MD, Amsterdam, the Netherlands
(Address of principal executive offices)
Indicate by check mark whether the registrant files or will file annual reports under cover Form 20-F or Form 40-F.
Form 20-F x Form 40-F ¨
Indicate by check mark if the registrant is submitting the Form 6-K in paper as permitted by Regulation S-T Rule 101(b)(1): ¨.
Indicate by check mark if the registrant is submitting the Form 6-K in paper as permitted by Regulation S-T Rule 101(b)(7): ¨.
Indicate by check mark whether the registrant by furnishing the information contained in this Form is also thereby furnishing the information to the Commission pursuant to Rule 12g3-2(b) under the Securities Exchange Act of 1934.
Yes ¨ No x
If “Yes” is marked, indicate below the file number assigned to the registrant in connection with Rule 12g3-2(b): 82- .
SIGNATURES
Pursuant to the requirements of the Securities Exchange Act of 1934, the registrant has duly caused this report to be signed on its behalf by the undersigned, thereunto duly authorized.
| VIMPELCOM LTD. | ||||||
| (Registrant) | ||||||
| Date: February 25, 2015 | ||||||
| By: | /s/ Scott Dresser | |||||
| Name: | Scott Dresser | |||||
| Title: | Group General Counsel | |||||
![]()
VIMPELCOM REPORTS 4Q14 AND FY14 RESULTS
KEY RESULTS AND DEVELOPMENTS
| • | Delivered on 2014 targets |
| • | Total revenue 4Q14 declined organically1 3% YoY; reported revenue declined 21% due to adverse currency movements |
| • | EBITDA2 4Q14 declined organically 8% YoY; reported EBITDA increased 58% YoY mainly due to the one-off charge in 4Q13 related to the fine from Bank of Algeria; EBITDA margin of 36.4% |
| • | Net loss FY14 of USD 0.7 billion impacted by USD 1.0 billion of non-cash impairments |
| • | Mobile customer base grew 4.7 million YoY3 in 4Q14 to 221.6 million |
| • | Operating cash flow 4Q14 improved USD 1.1 billion YoY; FY14 operating cash flow of USD 4.1 billion |
| • | 2015 targets: |
| • | Service revenue of flat to low single digit organic1 YoY decline; |
| • | EBITDA margin flat to minus one percentage point organically1 YoY; |
| • | EPS4 of USD 0.35-0.40; |
| • | Capex/revenue of 20%; |
| • | Net debt to EBITDA for the Group of ~3.2x, excluding Italy ~1.7x |
Amsterdam (February 25, 2015) - “VimpelCom Ltd.” (“VimpelCom”, “Company” or “Group”) (NASDAQ: VIP), a leading global provider of telecommunications services with operations in 14 countries and worldwide headquarters in Amsterdam, today announces financial and operating results for the quarter and year ended December 31, 2014.
JO LUNDER, CHIEF EXECUTIVE OFFICER, COMMENTS:
“The majority of our operating businesses have demonstrated good progress over the year, with substantial investments in high speed data networks leading to a better customer experience. We expect the operating environment to remain difficult in 2015, however I am confident that we have the right strategy to deliver on our targets.”
CONSOLIDATED FINANCIAL AND OPERATING HIGHLIGHTS
| USD mln | 4Q14 | 4Q13 | Reported YoY |
Organic1 YoY |
FY14 | FY13 | Reported YoY |
Organic1 YoY |
||||||||||||||||||||||||
| Total revenue |
4,391 | 5,552 | (21 | %) | (3 | %) | 19,627 | 22,546 | (13 | %) | (4 | %) | ||||||||||||||||||||
| Service revenue |
4,207 | 5,290 | (20 | %) | (2 | %) | 18,725 | 21,529 | (13 | %) | (4 | %) | ||||||||||||||||||||
| EBITDA2 |
1,600 | 1,013 | 58 | % | (8 | %) | 7,970 | 8,260 | (4 | %) | (6 | %) | ||||||||||||||||||||
| EBITDA margin2 |
36.4 | % | 18.2 | % | 18.2 | pp | 40.6 | % | 36.6 | % | 4.0 | pp | ||||||||||||||||||||
| EBIT |
(421 | ) | (3,218 | ) | n.m. | 2,586 | 346 | n.m. | ||||||||||||||||||||||||
| Net loss attributable to VimpelCom shareholders |
(935 | ) | (3,861 | ) | (76 | %) | (691 | ) | (2,625 | ) | (74 | %) | ||||||||||||||||||||
| EPS, basic (USD) |
(0.53 | ) | (2.21 | ) | (76 | %) | (0.40 | ) | (1.53 | ) | (74 | %) | ||||||||||||||||||||
| Capital expenditures excluding licenses5 |
1,201 | 1,682 | (29 | %) | 3,907 | 3,998 | (2 | %) | ||||||||||||||||||||||||
| Operating cash flow (EBITDA less CAPEX) |
399 | (669 | ) | n.m. | 4,063 | 4,262 | (5 | %) | ||||||||||||||||||||||||
| Net debt / LTM EBITDA6 |
2.5 | 2.4 | 5 | % | 2.5 | 2.4 | 5 | % | ||||||||||||||||||||||||
| Total mobile customers (millions)3 |
221.6 | 216.9 | 2 | % | 221.6 | 216.9 | 2 | % | ||||||||||||||||||||||||
| 1) | Revenue and EBITDA organic growth are non-GAAP financial measures that exclude the effect of foreign currency translation, certain items such as liquidations and disposals and settlements as a result of closing of transaction in Algeria |
| 2) | EBITDA and EBITDA margin are non-GAAP financial measures. For reconciliations see Attachment C |
| 3) | Following the sale of the interest in Wind Canada, CAR and Burundi the numbers exclude respective customers in 4Q13 and FY13 |
| 4) | EPS at constant currency and stable fair value of derivatives, excluding exceptional charges such as impairment charges, restructuring charges, litigation and settlements, impact of M&A transactions, other one-off charges and constant number of shares |
| 5) | FY13 excludes EUR 136 million of non-cash increase in intangible assets related to the contract with Terna for the right of way of WIND’s backbone |
| 6) | Normalized LTM EBITDA excluding one-off charges related to the closing of transaction in Algeria For all definitions please see Attachment F |
VimpelCom Ltd. 4Q 2014 | 1
![]()
CONTENTS
| CEO statement |
3 | |||
| Strategic update and main events |
5 | |||
| Vimpelcom Group – Financial and Operating Results 4Q14 |
4 | |||
| Vimpelcom Group – Financial and Operating Results FY14 |
6 | |||
| Business Unites Performance in 4Q14 |
||||
| Russia |
14 | |||
| Italy |
16 | |||
| Africa & Asia |
18 | |||
| Ukraine |
21 | |||
| CIS |
23 | |||
| Conference Call Information |
26 | |||
| Content of the Attachments |
28 |
ORGANIC GROWTH REVENUE AND EBITDA
| 4Q14 vs 4Q13 | ||||||||||||||||||||||||
| Revenue | EBITDA | |||||||||||||||||||||||
| Business Units | Organic | FX and others |
Reported | Organic | FX and others |
Reported | ||||||||||||||||||
| Russia |
3 | % | (30 | %) | (27 | %) | 0 | % | (34 | %) | (34 | %) | ||||||||||||
| Italy |
(9 | %) | (8 | %) | (17 | %) | (16 | %) | (7 | %) | (23 | %) | ||||||||||||
| Africa & Asia |
(5 | %) | (4 | %) | (9 | %) | (19 | %) | (2 | %) | (21 | %) | ||||||||||||
| Ukraine |
(2 | %) | (43 | %) | (45 | %) | (12 | %) | (39 | %) | (51 | %) | ||||||||||||
| CIS |
4 | % | (9 | %) | (5 | %) | 52 | % | (12 | %) | 40 | % | ||||||||||||
| Total |
(3 | %) | (18 | %) | (21 | %) | (8 | %) | 66 | % | 58 | % | ||||||||||||
| FY14 vs FY13 | ||||||||||||||||||||||||
| Revenue | EBITDA | |||||||||||||||||||||||
| Business Units | Organic | FX and others |
Reported | Organic | FX and others |
Reported | ||||||||||||||||||
| Russia |
(4 | %) | (14 | %) | (18 | %) | (6 | %) | (16 | %) | (22 | %) | ||||||||||||
| Italy |
(7 | %) | 0 | % | (7 | %) | (7 | %) | 0 | % | (7 | %) | ||||||||||||
| Africa & Asia |
(4 | %) | 0 | % | (4 | %) | (11 | %) | (1 | %) | (12 | %) | ||||||||||||
| Ukraine |
(5 | %) | (29 | %) | (34 | %) | (11 | %) | (26 | %) | (38 | %) | ||||||||||||
| CIS |
4 | % | (8 | %) | (4 | %) | 15 | % | (9 | %) | 6 | % | ||||||||||||
| Total |
(4 | %) | (9 | %) | (13 | %) | (6 | %) | 2 | % | (4 | %) | ||||||||||||
MOBILE CUSTOMERS1
| million | 4Q14 | 4Q13 | YoY | |||||||||
| Russia |
57.2 | 56.5 | 1 | % | ||||||||
| Italy |
21.6 | 22.3 | (3 | %) | ||||||||
| Algeria |
18.4 | 17.6 | 5 | % | ||||||||
| Pakistan |
38.5 | 37.6 | 2 | % | ||||||||
| Bangladesh |
30.8 | 28.8 | 7 | % | ||||||||
| Ukraine |
26.2 | 25.8 | 2 | % | ||||||||
| Kazakhstan |
9.8 | 9.2 | 7 | % | ||||||||
| Uzbekistan |
10.6 | 10.5 | 1 | % | ||||||||
| Other |
8.5 | 8.6 | (1 | %) | ||||||||
| Total |
221.6 | 216.9 | 2 | % | ||||||||
| 1 | Following the sale of the interest in Wind Canada, CAR and Burundi the numbers exclude respective customers in 4Q13 |
PRESENTATION OF FINANCIAL RESULTS
VimpelCom results presented in this earnings release are based on IFRS and have not been audited. Please note that audited financials will be filed in the Company’s annual report on Form 20-F, and may require adjustments due to subsequent events or for other reasons. Certain amounts and percentages that appear in this earnings release have been subject to rounding adjustments. As a result, certain numerical figures shown as totals, including in tables may not be an exact arithmetic aggregation of the figures that precede or follow them.
VimpelCom Ltd. 4Q 2014 | 2
![]()
JO LUNDER, CHIEF EXECUTIVE OFFICER, COMMENTS:
VimpelCom Ltd. 4Q 2014 | 3
![]()

| VimpelCom Ltd. 4Q 2014 | 4 |
![]()
STRATEGIC UPDATE AND MAIN EVENTS
| • | Successful closing of Algeria transaction |
| • | 4G/LTE network sharing initiative with MTS launched in Russia |
| • | 3G license awarded in Ukraine |
| • | 4G/LTE launched in Georgia |
| • | Additional credit facility of USD 1 billion put in place |
| • | Update on Uzbekistan investigation |
| VimpelCom Ltd. 4Q 2014 | 5 |
![]()
VimpelCom Ltd. 4Q 2014 | 6
![]()
VIMPELCOM GROUP – FINANCIAL AND OPERATING RESULTS 4Q14
| • | Revenue of USD 4.4 billion declined organically 3% YoY |
| • | EBITDA of USD 1.6 billion decreased organically 8% YoY due to the pressure on revenue and cost increases |
| • | EBITDA margin of 36.4% |
| • | Customer base grew 4.7 million YoY |
| • | Operating cash flow improved USD 1.1 billion YoY |
| • | Net debt / EBITDA stable QoQ at 2.5x, excluding Italy 1.2x |
OPERATING FINANCIALS PER BUSINESS UNIT
| USD mln | 4Q14 | 4Q13 | Reported YoY |
Organic YoY |
FY14 | FY13 | Reported YoY |
Organic YoY |
||||||||||||||||||||||||
| Total revenue |
4,391 | 5,552 | (21 | %) | (3 | %) | 19,627 | 22,546 | (13 | %) | (4 | %) | ||||||||||||||||||||
| of which: |
||||||||||||||||||||||||||||||||
| Russia |
1,580 | 2,173 | (27 | %) | 3 | % | 7,459 | 9,109 | (18 | %) | (4 | %) | ||||||||||||||||||||
| Italy |
1,401 | 1,685 | (17 | %) | (9 | %) | 6,155 | 6,618 | (7 | %) | (7 | %) | ||||||||||||||||||||
| Africa & Asia |
788 | 863 | (9 | %) | (5 | %) | 3,360 | 3,506 | (4 | %) | (4 | %) | ||||||||||||||||||||
| Ukraine |
216 | 394 | (45 | %) | (2 | %) | 1,062 | 1,610 | (34 | %) | (5 | %) | ||||||||||||||||||||
| CIS |
477 | 502 | (5 | %) | 4 | % | 1,873 | 1,947 | (4 | %) | 4 | % | ||||||||||||||||||||
| other |
(71 | ) | (65 | ) | (282 | ) | (244 | ) | ||||||||||||||||||||||||
| EBITDA |
1,600 | 1,013 | 58 | % | (8 | %) | 7,970 | 8,260 | (4 | %) | (6 | %) | ||||||||||||||||||||
| of which: |
||||||||||||||||||||||||||||||||
| Russia |
580 | 876 | (34 | %) | 0 | % | 2,980 | 3,815 | (22 | %) | (6 | %) | ||||||||||||||||||||
| Italy |
529 | 687 | (23 | %) | (16 | %) | 2,408 | 2,592 | (7 | %) | (7 | %) | ||||||||||||||||||||
| Africa & Asia |
326 | 411 | (21 | %) | (19 | %) | 1,486 | 1,679 | (12 | %) | (11 | %) | ||||||||||||||||||||
| Ukraine |
92 | 186 | (51 | %) | (12 | %) | 484 | 781 | (38 | %) | (11 | %) | ||||||||||||||||||||
| CIS |
210 | 152 | 40 | % | 52 | % | 912 | 858 | 6 | % | 15 | % | ||||||||||||||||||||
| other1 |
(137 | ) | (1,299 | ) | (300 | ) | (1,465 | ) | ||||||||||||||||||||||||
| EBITDA margin |
36.4 | % | 18.2 | % | 18.2 | pp | 40.6 | % | 36.6 | % | 4.0 | pp | ||||||||||||||||||||
| 1 | Including Algeria adjustments |
FINANCIAL AND OPERATING PERFORMANCE OVERVIEW 4Q14
| VimpelCom Ltd. 4Q 2014 | 7 |
![]()
| 1) | net of the impact of the non-recurring items accounted for in 3Q14 but commercially related to 4Q14 |
VimpelCom Ltd. 4Q 2014 | 8
![]()
INCOME STATEMENT ELEMENTS & CAPITAL EXPENDITURES 4Q14
| USD mln | 4Q14 | 4Q13 | YoY | Organic YoY |
||||||||||||
| Total revenue |
4,391 | 5,552 | (21 | %) | (3 | %) | ||||||||||
| Mobile service revenue |
3,565 | 4,455 | (20 | %) | (2 | %) | ||||||||||
| EBITDA |
1,600 | 1,013 | 58 | % | (8 | %) | ||||||||||
| EBITDA margin |
36.4 | % | 18.2 | % | 18.2 | pp | ||||||||||
| EBIT |
(421 | ) | (3,218 | ) | n.m. | |||||||||||
| Financial income and expenses |
(410 | ) | (511 | ) | (20 | %) | ||||||||||
| Net foreign exchange (loss)/gain and others |
(185 | ) | (265 | ) | (30 | %) | ||||||||||
| Profit before tax |
(1,016 | ) | (3,994 | ) | 75 | % | ||||||||||
| Income tax expense |
(41 | ) | (1,257 | ) | (97 | %) | ||||||||||
| Profit for the period |
(1,057 | ) | (5,251 | ) | 80 | % | ||||||||||
| Net income attributable to VimpelCom shareholders |
(935 | ) | (3,861 | ) | 76 | % | ||||||||||
| USD mln | 4Q14 | 4Q13 | YoY | |||||||||||||
| Capital expenditures1 |
1,211 | 1,721 | (30 | %) | ||||||||||||
| Capital expenditures1 excluding licenses |
1,201 | 1,683 | (29 | %) | ||||||||||||
| Capex1 excl licenses/Revenue |
27 | % | 30 | % | ||||||||||||
VimpelCom Ltd. 4Q 2014 | 9
![]()
STATEMENT OF FINANCIAL POSITION & CASH FLOW 4Q14
| USD mln | 4Q14 | 3Q14 | QoQ | |||||||||
| Total assets |
40,997 | 45,833 | (11 | %) | ||||||||
| Shareholders’ equity |
4,893 | 7,868 | (38 | %) | ||||||||
| Gross debt |
26,443 | 27,714 | (5 | %) | ||||||||
| Net debt |
19,992 | 21,736 | (8 | %) | ||||||||
| Gross debt / LTM EBITDA1 |
3.3 | 3.2 | ||||||||||
| Net debt / LTM EBITDA1 |
2.5 | 2.5 | ||||||||||
| USD mln | 4Q14 | 4Q13 | YoY | FY14 | FY13 | YoY | ||||||||||||||||||
| Net cash from operating activities |
1,398 | 2,010 | (30 | %) | 5,279 | 6,351 | (17 | %) | ||||||||||||||||
| Net cash used in investing activities |
(906 | ) | (1,503 | ) | (40 | %) | (3,977 | ) | (4,213 | ) | (6 | %) | ||||||||||||
| Net cash from/(used in) financing activities |
261 | (1,030 | ) | n.m. | 1,329 | (2,575 | ) | n.m. | ||||||||||||||||
| 1) | Normalized LTM EBITDA excluding one-off charges related to the Algeria resolution |
VimpelCom Ltd. 4Q 2014 | 10
![]()
VIMPELCOM GROUP – FINANCIAL AND OPERATING RESULTS FY14
| • | Revenue of USD 19.6 billion declined organically 4% YoY, in-line with 2014 target |
| • | EBITDA of USD 8.0 billion declined organically 6% YoY, in-line with 2014 target |
| • | Solid EBITDA margin of 40.6% |
| • | CAPEX to revenue of 20% |
| • | Operating cash flow of USD 4.1 billion |
VimpelCom Ltd. 4Q 2014 | 11
![]()
INCOME STATEMENT ELEMENTS & CAPITAL EXPENDITURES FY14
| USD mln | FY14 | FY13 | YoY | Organic YoY |
||||||||||||
| Total revenue |
19,627 | 22,546 | (13 | %) | (4 | %) | ||||||||||
| Mobile service revenue |
15,810 | 18,152 | (13 | %) | (4 | %) | ||||||||||
| EBITDA |
7,970 | 8,260 | (4 | %) | (6 | %) | ||||||||||
| EBITDA margin |
40.6 | % | 36.6 | % | 4.0 | pp | ||||||||||
| EBIT |
2,586 | 346 | n.m. | |||||||||||||
| Financial income and expenses |
(1,972 | ) | (2,059 | ) | (4 | %) | ||||||||||
| Net foreign exchange (loss)/gain and others |
(795 | ) | (311 | ) | n.m. | |||||||||||
| Profit before tax |
(181 | ) | (2,024 | ) | 91 | % | ||||||||||
| Income tax expense |
(722 | ) | (2,064 | ) | (65 | %) | ||||||||||
| Profit for the period |
(903 | ) | (4,088 | ) | 78 | % | ||||||||||
| Net income attributable to VimpelCom shareholders |
(691 | ) | (2,625 | ) | 74 | % | ||||||||||
| USD mln | FY14 | FY13 | YoY | |||||||||
| Capital expenditures |
4,255 | 4,309 | (1 | %) | ||||||||
| Capital expenditures excluding licenses |
3,907 | 4,001 | (2 | %) | ||||||||
| Capex excl licenses/Revenue |
20 | % | 18 | % | ||||||||
VimpelCom Ltd. 4Q 2014 | 12
![]()
BUSINESS UNITS PERFORMANCE IN 4Q14
| • | Russia |
| • | Italy |
| • | Africa & Asia |
| • | Ukraine |
| • | CIS |
VimpelCom Ltd. 4Q 2014 | 13
![]()
RUSSIA – 4Q14
| • | Continued focus on Customer Excellence led to increasing NPS and improving churn |
| • | Service revenue grew 3% YoY, the first increase in service revenue since 3Q13 |
| • | Stable mobile service revenue YoY; solid mobile data revenue growth of 20% YoY |
| • | Mobile customers increased 0.7 million YoY, reaching 57.2 million |
| • | EBITDA decreased 5% YoY mainly driven by increased service costs due to FOREX, leading to an EBITDA margin of 36.6% |
VimpelCom Ltd. 4Q 2014 | 14
![]()
RUSSIA KEY INDICATORS
| RUB mln | 4Q14 | 4Q13 | YoY | FY14 | FY13 | YoY | ||||||||||||||||||
| Total revenue |
73,947 | 70,660 | 5 | % | 281,898 | 289,910 | (3 | %) | ||||||||||||||||
| Mobile service revenue |
56,360 | 56,253 | 0 | % | 221,438 | 229,020 | (3 | %) | ||||||||||||||||
| Fixed-line service revenue |
14,217 | 12,402 | 15 | % | 52,064 | 49,413 | 5 | % | ||||||||||||||||
| EBITDA |
27,042 | 28,479 | (5 | %) | 111,935 | 121,422 | (8 | %) | ||||||||||||||||
| EBITDA margin |
36.6 | % | 40.3 | % | (3.7 | pp) | 39.7 | % | 41.9 | % | (2.2 | pp) | ||||||||||||
| Capex |
20,970 | 27,871 | (25 | %) | 61,310 | 58,792 | 4 | % | ||||||||||||||||
| Capex/Revenue |
28 | % | 39 | % | 22 | % | 20 | % | ||||||||||||||||
| Mobile |
||||||||||||||||||||||||
| Total operating revenue |
59,637 | 58,087 | 3 | % | 229,266 | 239,852 | (4 | %) | ||||||||||||||||
| - of which mobile data |
10,523 | 8,792 | 20 | % | 38,065 | 31,688 | 20 | % | ||||||||||||||||
| Customers (mln) |
57.2 | 56.5 | 1 | % | ||||||||||||||||||||
| - of which broadband (mln) |
3.7 | 3.1 | 16 | % | ||||||||||||||||||||
| ARPU (RUB) |
325 | 327 | (1 | %) | ||||||||||||||||||||
| MOU (min) |
316 | 293 | 8 | % | ||||||||||||||||||||
| Fixed-line |
||||||||||||||||||||||||
| Total operating revenue |
14,309 | 12,574 | 14 | % | 52,632 | 50,058 | 5 | % | ||||||||||||||||
| Broadband revenue |
3,230 | 3,152 | 2 | % | 12,771 | 12,632 | 1 | % | ||||||||||||||||
| Broadband customers (mln) |
2.3 | 2.3 | 0 | % | ||||||||||||||||||||
| Broadband ARPU (RUB) |
477 | 451 | 6 | % | ||||||||||||||||||||
VimpelCom Ltd. 4Q 2014 | 15
![]()
ITALY – 4Q14
| • | Solid performance with improving trend in a challenging market |
| • | Further improvement in mobile service revenue YoY trend versus 3Q14 |
| • | Solid data revenue growth: mobile broadband up 16% YoY and fixed broadband up 4% YoY |
| • | Total revenue of EUR 1.1 billion, down 9% YoY; underlying1 decline of 5% YoY |
| • | EBITDA at EUR 418 million down 6.5% YoY on an underlying basis, improving sequentially |
| 1) | net of the impact of the non-recurring items accounted for in 3Q14 but commercially related to 4Q14 |
VimpelCom Ltd. 4Q 2014 | 16
![]()
ITALY KEY INDICATORS
| EUR mln | 4Q14 | 4Q13 | YoY | FY14 | FY13 | YoY | ||||||||||||||||||
| Total revenue |
1,123 | 1,237 | (9 | %) | 4,633 | 4,983 | (7 | %) | ||||||||||||||||
| Mobile service revenue |
746 | 800 | (7 | %) | 2,975 | 3,282 | (9 | %) | ||||||||||||||||
| Fixed-line service revenue |
292 | 320 | (9 | %) | 1,192 | 1,295 | (8 | %) | ||||||||||||||||
| EBITDA |
418 | 500 | (16 | %) | 1,804 | 1,944 | (7 | %) | ||||||||||||||||
| EBITDA margin |
37.3 | % | 40.4 | % | (3.1 | pp) | 39.0 | % | 39.1 | % | (0.1 | pp) | ||||||||||||
| C apex1 |
261 | 291 | (10 | %) | 757 | 789 | (4 | %) | ||||||||||||||||
| C apex1/Revenue |
23 | % | 23 | % | 16 | % | 16 | % | ||||||||||||||||
| Mobile |
||||||||||||||||||||||||
| Total revenue |
820 | 907 | (10 | %) | 3,328 | 3,648 | (9 | %) | ||||||||||||||||
| C ustomers (mln) |
21.6 | 22.3 | (3 | %) | ||||||||||||||||||||
| - of which broadband (mln) 2 |
10.2 | 8.8 | 16 | % | ||||||||||||||||||||
| ARPU (€ ) |
11.4 | 11.9 | (4 | %) | ||||||||||||||||||||
| MOU (min) |
274 | 256 | 7 | % | ||||||||||||||||||||
| Fixed |
||||||||||||||||||||||||
| Total revenue |
302 | 330 | (8 | %) | 1,305 | 1,335 | (2 | %) | ||||||||||||||||
| Total voice customers (mln) |
2.8 | 3.0 | (5 | %) | ||||||||||||||||||||
| ARPU (€ ) |
29 | 30 | (5 | %) | ||||||||||||||||||||
| Broadband customers (mln) |
2.2 | 2.2 | (0 | %) | ||||||||||||||||||||
| Broadband ARPU (€ ) |
22 | 21 | 5 | % | ||||||||||||||||||||
| Dual-play customers (mln) |
1.9 | 1.9 | 2 | % | ||||||||||||||||||||
| 1) | CAPEX in FY13 excludes EUR 136 million of non-cash increase in intangible assets related to the contract with Terna for the right of way of WIND’s backbone; excluding FOC assets |
| 2) | Mobile broadband include customers that have performed at least one mobile Internet event in the previous month |
VimpelCom Ltd. 4Q 2014 | 17
![]()
AFRICA & ASIA – 4Q14
| • | Successful closing of the transaction in Algeria strengthens Djezzy’s position and prospects for growth |
| • | Double-digit revenue growth in Bangladesh and improving trend in Pakistan more than offset by the competitive pressure in Algeria resulting in a revenue decrease of 5% YoY to USD 788 million |
| • | EBITDA decreased organically 19% YoY to USD 326 million; EBITDA margin was 41.4% |
| • | Customer base grew 4% YoY to reach 90 million |
| VimpelCom Ltd. 4Q 2014 | 18 |
![]()
VimpelCom Ltd. 4Q 2014 | 19
![]()
AFRICA & ASIA KEY INDICATORS
| USD mln | 4Q14 | 4Q13 | YoY | Organic YoY |
FY14 | FY13 | YoY | Organic YoY |
||||||||||||||||||||||||
| Total revenue |
788 | 863 | (9 | %) | (5 | %) | 3,360 | 3,506 | (4 | %) | (4 | %) | ||||||||||||||||||||
| Mobile service revenue |
781 | 830 | (6 | %) | (4 | %) | 3,297 | 3,435 | (4 | %) | (4 | %) | ||||||||||||||||||||
| EBITDA |
326 | 411 | (21 | %) | (19 | %) | 1,486 | 1,679 | (12 | %) | (11 | %) | ||||||||||||||||||||
| EBITDA margin |
41.4 | % | 47.6 | % | (6.2 | pp) | 44.2 | % | 47.9 | % | (3.7 | pp) | ||||||||||||||||||||
| Capex |
258 | 330 | (22 | %) | 1,253 | 610 | 105 | % | ||||||||||||||||||||||||
| Capex1/Revenue |
33 | % | 34 | % | (3 | %) | 28 | % | 13 | % | 115 | % | ||||||||||||||||||||
| Mobile customers (mln) |
90.0 | 86.9 | 4 | % | ||||||||||||||||||||||||||||
| AFRICA & ASIA BUSINESS UNIT: COUNTRY DETAIL | ||||||||||||||||||||||||
| ALGERIA | ||||||||||||||||||||||||
| DZD bln | 4Q14 | 4Q13 | YoY | FY14 | FY13 | YoY | ||||||||||||||||||
| Total revenue |
34 | 36 | (6 | %) | 136 | 143 | (5 | %) | ||||||||||||||||
| Mobile service revenue |
33 | 36 | (7 | %) | 135 | 143 | (5 | %) | ||||||||||||||||
| EBITDA |
17 | 22 | (22 | %) | 73 | 85 | (14 | %) | ||||||||||||||||
| EBITDA margin |
49.8 | % | 60.1 | % | (10.3 | pp) | 53.5 | % | 59.1 | % | (5.6 | pp) | ||||||||||||
| CAPEX (USD mln)1 |
109 | 51 | 114 | % | 415 | 84 | n.m. | |||||||||||||||||
| CAPEX/Revenue |
28 | % | 11 | % | 25 | % | 5 | % | ||||||||||||||||
| PAKISTAN | ||||||||||||||||||||||||
| PKR bln | 4Q14 | 4Q13 | YoY | FY14 | FY13 | YoY | ||||||||||||||||||
| Total revenue |
26 | 26 | (1 | %) | 102 | 108 | (6 | %) | ||||||||||||||||
| Mobile service revenue |
24 | 25 | (2 | %) | 98 | 104 | (6 | %) | ||||||||||||||||
| EBITDA |
10 | 9 | 6 | % | 39 | 45 | (13 | %) | ||||||||||||||||
| EBITDA margin |
41.5 | % | 38.5 | % | 3.0 | pp | 40.0 | % | 42.8 | % | (2.8 | pp) | ||||||||||||
| CAPEX (USD mln)1 |
89 | 90 | (1 | %) | 352 | 190 | 85 | % | ||||||||||||||||
| CAPEX/Revenue |
36 | % | 37 | % | 35 | % | 18 | % | ||||||||||||||||
| BANGLADESH | ||||||||||||||||||||||||
| BDT bln | 4Q14 | 4Q13 | YoY | FY14 | FY13 | YoY | ||||||||||||||||||
| Total revenue |
11 | 10 | 14 | % | 44 | 39 | 11 | % | ||||||||||||||||
| Mobile service revenue |
11 | 9 | 18 | % | 43 | 39 | 11 | % | ||||||||||||||||
| EBITDA |
5 | 3 | 38 | % | 17 | 15 | 17 | % | ||||||||||||||||
| EBITDA margin |
40.8 | % | 33.7 | % | 7.1 | pp | 38.9 | % | 37.1 | % | 1.8 | pp | ||||||||||||
| CAPEX (USD mln)1 |
59 | 94 | (37 | %) | 178 | 133 | 34 | % | ||||||||||||||||
| CAPEX/Revenue |
40 | % | 73 | % | 32 | % | 26 | % | ||||||||||||||||
| 1) | CAPEX excl. licenses |
VimpelCom Ltd. 4Q 2014 | 20
![]()
UKRAINE – 4Q14
| • | Good progress on transformation program in Ukraine, which led to continued improvements in NPS, churn and market position |
| • | Mobile customer base increased 2% YoY to 26.2 million |
| • | Mobile service revenue stable at UAH 2.9 billion |
| • | EBITDA declined 12% YoY to UAH 1.3 billion; EBITDA margin of 42.3% |
VimpelCom Ltd. 4Q 2014 | 21
![]()
UKRAINE KEY INDICATORS
| UAH mln | 4Q14 | 4Q13 | YoY | FY14 | FY13 | YoY | ||||||||||||||||||
| Total revenue |
3,095 | 3,149 | (2 | %) | 12,231 | 12,871 | (5 | %) | ||||||||||||||||
| Mobile service revenue |
2,863 | 2,856 | 0 | % | 11,190 | 11,579 | (3 | %) | ||||||||||||||||
| Fixed-line service revenue |
225 | 282 | (20 | %) | 1,017 | 1,102 | (8 | %) | ||||||||||||||||
| EBITDA |
1,311 | 1,487 | (12 | %) | 5,526 | 6,239 | (11 | %) | ||||||||||||||||
| EBITDA margin |
42.3 | % | 47.2 | % | (4.9 | pp) | 45.2 | % | 48.5 | % | (3.3 | pp) | ||||||||||||
| Capex |
554 | 447 | 24 | % | 1,657 | 1,690 | (2 | %) | ||||||||||||||||
| Capex/Revenue |
18 | % | 14 | % | 14 | % | 13 | % | ||||||||||||||||
| Mobile |
||||||||||||||||||||||||
| Total operating revenue |
2,870 | 2,866 | 0 | % | 11,212 | 11,768 | (5 | %) | ||||||||||||||||
| Customers (mln) |
26.2 | 25.8 | 2 | % | ||||||||||||||||||||
| ARPU (UAH) |
36.1 | 36.5 | (1 | %) | ||||||||||||||||||||
| MOU (min) |
524 | 504 | 4 | % | ||||||||||||||||||||
| Fixed-line |
||||||||||||||||||||||||
| Total operating revenue |
225 | 283 | (20 | %) | 1,020 | 1,103 | (8 | %) | ||||||||||||||||
| Broadband revenue |
110.8 | 107.0 | 4 | % | 443.4 | 407.6 | 9 | % | ||||||||||||||||
| Broadband customers (mln) |
0.8 | 0.8 | 7 | % | ||||||||||||||||||||
| Broadband ARPU (UAH) |
45.5 | 48.1 | (5 | %) | ||||||||||||||||||||
VimpelCom Ltd. 4Q 2014 | 22
![]()
CIS – 4Q14
| • | Solid results, total revenue increased organically by 4% YoY |
| • | Mobile customers increased 4% YoY to 26.5 million; customer growth in all CIS markets |
| • | Strong mobile data revenue growth of 24% YoY |
| • | EBITDA reached USD 210 million with organic increase of 3% YoY adjusted for one-offs; EBITDA margin of 44.0% |
| • | Continued robust results in Kazakhstan |
VimpelCom Ltd. 4Q 2014 | 23
![]()
VimpelCom Ltd. 4Q 2014 | 24
![]()
CIS KEY INDICATORS
| USD mln | 4Q14 | 4Q13 | YoY | Organic YoY |
FY14 | FY13 | YoY | Organic YoY |
||||||||||||||||||||||||
| Total revenue |
477 | 501 | (5 | %) | 4 | % | 1,873 | 1,946 | (4 | %) | 4 | % | ||||||||||||||||||||
| Mobile service revenue |
434 | 455 | (5 | %) | 4 | % | 1,700 | 1,773 | (4 | %) | 4 | % | ||||||||||||||||||||
| Fixed-line service revenue |
41 | 42 | (3 | %) | 10 | % | 165 | 162 | 2 | % | 11 | % | ||||||||||||||||||||
| EBITDA |
210 | 150 | 40 | % | 52 | % | 912 | 856 | 6 | % | 15 | % | ||||||||||||||||||||
| EBITDA margin |
44.0 | % | 30.0 | % | 14.0 | pp | 48.7 | % | 44.0 | % | 4.7 | pp | ||||||||||||||||||||
| Capex |
121 | 62 | 81 | % | 268 | 370 | (30 | %) | ||||||||||||||||||||||||
| Capex/Revenue |
25 | % | 12 | % | 14 | % | 19 | % | ||||||||||||||||||||||||
| Mobile |
||||||||||||||||||||||||||||||||
| Customers (mln) |
26.5 | 25.4 | 4 | % | ||||||||||||||||||||||||||||
| - of which broadband (mln) |
14 | 13 | 4 | % | ||||||||||||||||||||||||||||
| Fixed |
||||||||||||||||||||||||||||||||
| Broadband customers (mln) |
0.4 | 0.4 | 7 | % | ||||||||||||||||||||||||||||
| Broadband revenue |
14.1 | 15.4 | (8 | %) | 56.1 | 59.4 | (5 | %) | ||||||||||||||||||||||||
For details per country unit please see Attachment B
CIS BUSINESS UNIT: COUNTRY DETAIL
KAZAKHSTAN
| KZT mln | 4Q14 | 4Q13 | YoY | FY14 | FY13 | YoY | ||||||||||||||||||
| Total revenue |
34,965 | 33,730 | 4 | % | 135,266 | 127,748 | 6 | % | ||||||||||||||||
| Mobile service revenue |
31,148 | 30,482 | 2 | % | 120,513 | 115,835 | 4 | % | ||||||||||||||||
| Fixed-line service revenue |
3,769 | 3,214 | 17 | % | 14,565 | 11,781 | 24 | % | ||||||||||||||||
| EBITDA |
14,061 | 16,101 | (13 | %) | 62,492 | 59,427 | 5 | % | ||||||||||||||||
| EBITDA margin |
40.2 | % | 47.7 | % | (7.5 | pp) | 46.2 | % | 46.5 | % | (0.3 | pp) | ||||||||||||
| Capex (USD mln) |
57 | 58 | (1 | %) | 109 | 159 | (32 | %) | ||||||||||||||||
| Capex / Revenue |
30 | % | 26 | % | 14 | % | 19 | % | ||||||||||||||||
UZBEKISTAN
| USD mln | 4Q14 | 4Q13 | YoY | FY14 | FY13 | YoY | ||||||||||||||||||
| Total revenue |
186 | 173 | 7 | % | 718 | 673 | 7 | % | ||||||||||||||||
| Mobile service revenue |
184 | 171 | 8 | % | 710 | 664 | 7 | % | ||||||||||||||||
| Fixed-line service revenue |
2 | 2 | (10 | %) | 7 | 8 | (10 | %) | ||||||||||||||||
| EBITDA |
115 | 21 | n.m. | 461 | 347 | 33 | % | |||||||||||||||||
| EBITDA margin |
61.6 | % | 11.9 | % | 49.7 | pp | 64.2 | % | 51.5 | % | 12.7 | pp | ||||||||||||
| Capex (USD mln) |
28 | (17 | ) | n.m. | 79 | 142 | (44 | %) | ||||||||||||||||
| Capex / Revenue |
15 | % | (10 | %) | 11 | % | 21 | % | ||||||||||||||||
VimpelCom Ltd. 4Q 2014 | 25
![]()
CONFERENCE CALL INFORMATION
On February 25, 2015, the Company will host an analyst & investor presentation in London on its fourth quarter and full year 2014 results at 2:00 pm CET (1:00 pm GMT), which can be followed via Internet or conference call.
The call and slide presentation may be accessed at http://www.vimpelcom.com.
2:00 pm CET investor and analyst conference call
US call-in number: +1 (877) 616-4476
Confirmation Code: 80666172
International call-in number: + 1 (402) 875-4763
Confirmation Code: 80666172
The conference call replay and the slide presentations webcast will be available until March 15, 2015. The slide presentation will also be available for download on the Company’s website.
Investor and analyst call replay
US Replay Number: +1 (855) 859-2056
Confirmation Code: 80666172
International Replay Number: +1 (404) 537-3406
Confirmation Code: 80666172
CONTACT INFORMATION
| INVESTOR RELATIONS
|
MEDIA AND PUBLIC RELATIONS
| |
| Gerbrand Nijman / Remco Vergeer | Bobby Leach / Artem Minaev | |
| [email protected] | [email protected] | |
| Tel: +31 20 79 77 200 (Amsterdam) | Tel: +31 20 79 77 200 (Amsterdam) |
VimpelCom Ltd. 4Q 2014 | 26
![]()
DISCLAIMER
This press release contains “forward-looking statements”, as the phrase is defined in Section 27A of the Securities Act of 1933 and Section 21E of the Securities Exchange Act of 1934. These statements relate to, among other things, the Company’s anticipated performance, future market developments and trends, its intended use of proceeds from the Algeria transaction, anticipated interest cost savings, operational and network development and anticipated benefits from network investment, expectations regarding its 4G/LTE agreement with MTS, anticipated benefits from 3G services in Ukraine and 4G/LTE services in Georgia, expectations regarding ongoing investigations of the SEC, the DOJ and the Dutch public prosecutor’s office, and the Company’s ability to realize its strategic initiatives in the various countries of operation. The forward-looking statements included in this presentation are based on management’s best assessment of the Company’s strategic and financial position and of future market conditions and trends. These discussions involve risks and uncertainties. The actual outcome may differ materially from these statements as a result of continued volatility in the economies in our markets, unforeseen developments from competition, governmental regulation of the telecommunications industries, general political uncertainties in our markets and/or litigation with third parties. Certain factors that could cause actual results to differ materially from those discussed in any forward-looking statements include the risk factors described in the Company’s Annual Report on Form 20-F for the year ended December 31, 2013 filed with the U.S. Securities and Exchange Commission (the “SEC”) and other public filings made by the Company with the SEC, which risk factors are incorporated herein by reference. The Company disclaims forward looking statements speak only as of the date hereof, and the obligation to update them or to announce publicly any revision to any of the forward-looking statements contained in this release, or to make corrections to reflect future events or developments.
ABOUT VIMPELCOM LTD
VimpelCom, headquartered in Amsterdam, is one of the world’s largest integrated telecommunications services operators providing voice and data services through a range of traditional and broadband mobile and fixed technologies in Russia, Italy, Ukraine, Kazakhstan, Uzbekistan, Tajikistan, Armenia, Georgia, Kyrgyzstan, Laos, Algeria, Bangladesh, Pakistan and Zimbabwe. VimpelCom’s operations around the globe cover territory with a total population of approximately 739 million people. VimpelCom provides services under the “Beeline”, “Kyivstar”, “WIND”, “Infostrada” “Mobilink”, “banglalink”, “Telecel”, and “Djezzy” brands. As of December 31, 2014 VimpelCom had 222 million mobile customers on a combined basis. VimpelCom is traded on the NASDAQ Global Stock Market under the symbol (VIP). For more information visit: http://www.vimpelcom.com.
VimpelCom Ltd. 4Q 2014 | 27
![]()
CONTENT OF THE ATTACHMENTS
| Attachment A | Financial Schedules | 29 | ||||
| Attachment B |
Debt Overview | 32 | ||||
| Attachment C |
Country units key indicators CIS and Africa & Asia | 35 | ||||
| Attachment D |
Reconciliation Tables | 38 | ||||
| Average Rates of Functional Currencies to USD (EBITDA) | ||||||
| Attachment E |
WIND Telecomunicazioni group condensed financial statement of income | 40 | ||||
| Attachment F |
Definitions | 41 | ||||
For more information on financial and operating data for specific countries, please refer to the supplementary file
Factbook4Q2014.xls on VimpelCom’s website at http://vimpelcom.com/ir/financials/results.wbp
VimpelCom Ltd. 4Q 2014 | 28
![]()
ATTACHMENT A: FINANCIAL SCHEDULES
VIMPELCOM LTD UNAUDITED CONSOLIDATED STATEMENTS OF INCOME
| USD mln | 4Q14 | 4Q13 | FY14 | FY13 | ||||||||||||
| Total operating revenue |
4,391 | 5,552 | 19,627 | 22,546 | ||||||||||||
| of which other revenue |
32 | 120 | 383 | 292 | ||||||||||||
| Operating expenses |
||||||||||||||||
| Service costs, equipment and accessories |
1,144 | 1,416 | 4,932 | 5,913 | ||||||||||||
| Selling, general and administrative expenses |
1,647 | 3,123 | 6,725 | 8,373 | ||||||||||||
| Depreciation |
623 | 810 | 2,839 | 3,050 | ||||||||||||
| Amortization |
324 | 458 | 1,479 | 1,791 | ||||||||||||
| Impairment loss |
1,051 | 2,906 | 992 | 2,973 | ||||||||||||
| Loss on disposals of non-current assets |
23 | 57 | 74 | 100 | ||||||||||||
| Total operating expenses |
4,812 | 8,770 | 17,041 | 22,200 | ||||||||||||
| Operating profit |
(421 | ) | (3,218 | ) | 2,586 | 346 | ||||||||||
| Finance costs |
415 | 532 | 2,026 | 2,150 | ||||||||||||
| Finance income |
(5 | ) | (21 | ) | (54 | ) | (91 | ) | ||||||||
| Other non-operating losses/(gains) |
(139 | ) | 194 | 152 | 172 | |||||||||||
| Shares of loss of associates and joint ventures accounted for using the equity method |
(4 | ) | 47 | 38 | 159 | |||||||||||
| Net foreign exchange (gain)/ loss |
328 | 24 | 605 | (20 | ) | |||||||||||
| Profit before tax |
(1,016 | ) | (3,994 | ) | (181 | ) | (2,024 | ) | ||||||||
| Income tax expense |
41 | 1,257 | 722 | 2,064 | ||||||||||||
| Profit for the period |
(1,057 | ) | (5,251 | ) | (903 | ) | (4,088 | ) | ||||||||
| Non-controlling interest |
(122 | ) | (1,390 | ) | (212 | ) | (1,463 | ) | ||||||||
| Net income attributable to VimpelCom shareholders |
(935 | ) | (3,861 | ) | (691 | ) | (2,625 | ) | ||||||||
VimpelCom Ltd. 4Q 2014 | 29
![]()
ATTACHMENT A: FINANCIAL SCHEDULES
VIMPELCOM LTD UNAUDITED CONSOLIDATED STATEMENT OF FINANCIAL POSITION
| USD mln | 31 December 2014 | 31 December 2013 | ||||||
| Assets |
||||||||
| Non-current assets |
||||||||
| Property and equipment |
11,849 | 15,493 | ||||||
| Intangible assets |
7,717 | 9,837 | ||||||
| Goodwill |
10,285 | 14,709 | ||||||
| Investments in associates and joint ventures |
265 | 449 | ||||||
| Deferred tax asset |
575 | 295 | ||||||
| Income Tax advances, non-current |
91 | 53 | ||||||
| Financial assets |
602 | 262 | ||||||
| Other non-financial assets |
26 | 16 | ||||||
| Total non-current assets |
31,410 | 41,114 | ||||||
| Current assets |
||||||||
| Inventories |
117 | 192 | ||||||
| Trade and other receivables |
1,841 | 2,407 | ||||||
| Other non-financial assets |
797 | 789 | ||||||
| Current income tax asset |
219 | 335 | ||||||
| Other financial assets |
266 | 441 | ||||||
| Cash and cash equivalents |
6,342 | 4,454 | ||||||
| Total current assets |
9,582 | 8,618 | ||||||
| Assets classified as held for sale |
5 | 144 | ||||||
| Total assets |
40,997 | 49,876 | ||||||
| Equity and liabilities |
||||||||
| Equity |
||||||||
| Equity attributable to equity owners of the parent |
4,893 | 9,733 | ||||||
| Non-controlling interests |
(952 | ) | (655 | ) | ||||
| Total equity |
3,941 | 9,078 | ||||||
| Non-current liabilities |
||||||||
| Debt |
23,654 | 25,557 | ||||||
| Other financial liabilities |
282 | 1,245 | ||||||
| Provisions |
527 | 418 | ||||||
| Other non-financial liabilities |
401 | 432 | ||||||
| Deferred tax liability |
1,637 | 1,639 | ||||||
| Total non-current liabilities |
26,501 | 29,291 | ||||||
| Current liabilities |
||||||||
| Trade and other payables |
3,998 | 4,862 | ||||||
| Debt |
2,789 | 1,897 | ||||||
| Other financial liabilities |
399 | 529 | ||||||
| Other non-financial liabilities |
1,929 | 2,106 | ||||||
| Current income tax payable |
72 | 166 | ||||||
| Provisions |
1,368 | 1,877 | ||||||
| Total current liabilities |
10,555 | 11,437 | ||||||
| Liabilities associated with assets held for sale |
70 | |||||||
| Total equity and liabilities |
40,997 | 49,876 | ||||||
VimpelCom Ltd. 4Q 2014 | 30
![]()
ATTACHMENT A: FINANCIAL SCHEDULES
VIMPELCOM LTD UNAUDITED CONSOLIDATED STATEMENTS OF CASH FLOWS
| USD mln | 4Q14 | 4Q13 | FY14 | FY13 | ||||||||||||
| Operating activities |
||||||||||||||||
| Profit after tax |
(1,057 | ) | (5,251 | ) | (903 | ) | (4,088 | ) | ||||||||
| Income Tax Expenses |
41 | 1,257 | 722 | 2,064 | ||||||||||||
| Profit before tax |
(1,016 | ) | (3,994 | ) | (181 | ) | (2,024 | ) | ||||||||
| Non-cash adjustment to reconcile profit before tax to net operating cash flows: |
||||||||||||||||
| Depreciation |
623 | 810 | 2,839 | 3,050 | ||||||||||||
| Amortization |
324 | 458 | 1,479 | 1,791 | ||||||||||||
| Impairment loss |
1,051 | 2,906 | 992 | 2,973 | ||||||||||||
| Loss From Disposal Of Non Current Assets |
23 | 57 | 74 | 100 | ||||||||||||
| Finance income |
(5 | ) | (21 | ) | (54 | ) | (91 | ) | ||||||||
| Finance cost |
415 | 532 | 2,026 | 2,150 | ||||||||||||
| Other Non Operating Losses / (Gains) |
(139 | ) | 194 | 152 | 172 | |||||||||||
| Net Foreign Exchange Loss / (Gain) |
328 | 24 | 605 | (20 | ) | |||||||||||
| Share Of Loss Of Associates And Joint Ventures |
(4 | ) | 47 | 38 | 159 | |||||||||||
| Movements in provisions and pensions |
60 | 1,380 | 169 | 1,463 | ||||||||||||
| Changes in working capital |
243 | 409 | (20 | ) | (60 | ) | ||||||||||
| Net interest paid |
(442 | ) | (397 | ) | (2,157 | ) | (2,084 | ) | ||||||||
| Net interest received |
10 | 9 | 47 | 37 | ||||||||||||
| Income tax paid |
(73 | ) | (404 | ) | (730 | ) | (1,265 | ) | ||||||||
| Net cash from operating activities |
1,398 | 2,010 | 5,279 | 6,351 | ||||||||||||
| Proceeds from sale of property and equipment |
8 | 4 | 19 | 40 | ||||||||||||
| Proceeds from sale of intangible assets |
0 | — | 2 | — | ||||||||||||
| Purchase of property, plant and equipment |
(869 | ) | (1,342 | ) | (3,560 | ) | (3,955 | ) | ||||||||
| Purchase of Licenses |
(24 | ) | — | (423 | ) | — | ||||||||||
| Purchase of Other intangible assets |
(141 | ) | — | (506 | ) | — | ||||||||||
| Outflow for loan granted |
(0 | ) | (118 | ) | (23 | ) | (118 | ) | ||||||||
| Inflow from loan granted |
0 | — | 110 | — | ||||||||||||
| Inflows/(outflows) from financial assets |
37 | — | 42 | — | ||||||||||||
| Inflows/(outflows) from deposits |
16 | (97 | ) | 290 | (316 | ) | ||||||||||
| Receipts from / Payment for associates and JCE |
(0 | ) | 3 | (0 | ) | 2 | ||||||||||
| Proceeds from sales of share in subsidiaries, net of cash |
68 | (4 | ) | 69 | 83 | |||||||||||
| Receipt of dividends |
(1 | ) | 51 | 3 | 51 | |||||||||||
| Net cash used in investing activities |
(906 | ) | (1,503 | ) | (3,977 | ) | (4,213 | ) | ||||||||
| Gross proceeds from borrowings |
1,197 | 1,421 | 17,464 | 5,587 | ||||||||||||
| Fees paid for the borrowings |
(7 | ) | — | (727 | ) | — | ||||||||||
| Repayment of borrowings |
(853 | ) | (1,677 | ) | (15,322 | ) | (5,487 | ) | ||||||||
| Purchase of own shares |
— | — | — | (12 | ) | |||||||||||
| Dividends paid to equity holders |
(60 | ) | (774 | ) | (71 | ) | (4,055 | ) | ||||||||
| Dividends paid to non-controlling interests |
(18 | ) | — | (19 | ) | — | ||||||||||
| Proceeds from sale of treasury stock |
2 | — | 4 | — | ||||||||||||
| Share capital issued and paid |
— | — | — | 1,392 | ||||||||||||
| Net cash from financing activities |
261 | (1,030 | ) | 1,329 | (2,575 | ) | ||||||||||
| Net increase in cash and cash equivalents |
753 | (523 | ) | 2,631 | (437 | ) | ||||||||||
| Net foreign exchange difference |
(292 | ) | 87 | (743 | ) | (58 | ) | |||||||||
| Cash and cash equivalent at beginning of period |
5,852 | 4,890 | 4,454 | 4,949 | ||||||||||||
| Cash and cash equivalent reclassified as Held for Sale |
29 | — | — | — | ||||||||||||
| Cash and cash equivalent at end of period |
6,342 | 4,454 | 6,342 | 4,454 | ||||||||||||
VimpelCom Ltd. 4Q 2014 | 31
![]()
ATTACHMENT B: DEBT OVERVIEW
| as at 31 December 2014 | Type of debt | Interest rate | Outstanding debt (mln) |
Maturity date |
Guarantor | |||||
| VimpelCom Holdings B.V. |
Notes |
6.25%(1) | USD 500 | March 1, 2017 | OJSC VimpelCom | |||||
| VimpelCom Holdings B.V. |
Notes |
7.50%(2) | USD 1,500 | March 1, 2022 | OJSC VimpelCom | |||||
| VimpelCom Holdings B.V. |
Notes |
9.00% | USD 213.3 (RUB 12,000) |
February 13, 2018 | OJSC VimpelCom | |||||
| VimpelCom Holdings B.V. |
Notes |
5.20% | USD 600 | February 13, 2019 | OJSC VimpelCom | |||||
| VimpelCom Holdings B.V. |
Notes |
5.95% | USD 1,000 | February 13, 2023 | OJSC VimpelCom | |||||
| VimpelCom Amsterdam B.V. |
Loan from China Development Bank Corp. |
6 month LIBOR plus 3.30% |
USD 498.3 | December 21, 2020 | OJSC VimpelCom | |||||
| VimpelCom Amsterdam B.V. |
Loan from HSBC Bank plc |
1.72% | USD 254.1 | July 31, 2022 | EKN, OJSC VimpelCom | |||||
| VimpelCom Amsterdam B.V. |
Revolving Credit Facility |
6 month LIBOR plus 2.95% |
USD 500 | April 7, 2017 | None | |||||
| VimpelCom Amsterdam B.V. |
Loan from OAO “Alfa-Bank” |
6 month LIBOR plus 3.25% |
USD 500 | April 17, 2017 | None | |||||
| VimpelCom Amsterdam B.V. |
Loan from OAO “Alfa-Bank” |
6 month LIBOR plus 3.25% |
USD 500 | May 3, 2017 | None | |||||
| OJSC VimpelCom |
Loan from UBS (Luxembourg) S.A. (funded by the issuance of loan participation notes by UBS (Luxembourg) S.A.) |
8.25% | USD 600 | May 23, 2016 | None | |||||
| OJSC VimpelCom |
Loan from VIP Finance Ireland (funded by the issuance of loan participation notes by VIP Finance Ireland) |
9.13% | USD 1,000 | April 30, 2018 | None | |||||
| OJSC VimpelCom |
Loan from VIP Finance Ireland (funded by the issuance of loan participation notes by VIP Finance Ireland) |
6.49% | USD 500 | February 2, 2016 | None | |||||
| OJSC VimpelCom |
Loan from VIP Finance Ireland Limited (funded by the issuance of loan participation notes by VIP Finance Ireland) |
7.75% | USD 1,000 | February 2, 2021 | None | |||||
| OJSC VimpelCom |
RUB denominated bonds |
8.85% | USD 444.4 (RUB 25,000) |
March 8, 2022(3) | None | |||||
| OJSC VimpelCom |
RUB denominated bonds |
8.85% | USD 177.8 (RUB 10,000) |
March 14, 2022(4) | None |
VimpelCom Ltd. 4Q 2014 | 32
![]()
ATTACHMENT B: DEBT OVERVIEW (CONTINUED)
| as at 31 December 2014 | Type of debt | Interest rate | Outstanding debt (mln) |
Maturity date |
Guarantor | |||||
| OJSC VimpelCom |
Loan from VC-Invest (funded by the RUB denominated bonds by VC-Invest) |
8.30% | USD 355.5 (RUB 20,000) |
October 13, 2015 | OJSC VimpelCom | |||||
| OJSC VimpelCom |
Loan from Sberbank |
9.00% | USD 1,093.2 (RUB 61,500) |
April 11, 2018 | None | |||||
| OJSC VimpelCom |
Loan from Sberbank |
8.75% | USD 45.5 (RUB 2,559.9) |
December 16, 2015 | None | |||||
| OJSC VimpelCom |
Loan from Sberbank |
10,75% | USD 444.4 (RUB 25,000) |
May 29, 2017 | None | |||||
| OJSC VimpelCom |
Loans from HSBC Bank PLC |
3 month MosPRIME plus 1.05% |
USD 44 (RUB 2,474.7) |
November 30, 2017 | EKN | |||||
| OJSC VimpelCom |
Loans from Unicredit Bank AG |
AB SEK Rate plus 0.75% |
USD 30.6 | June 15, 2016 | EKN | |||||
| OJSC VimpelCom |
Loan from HSBC Bank PLC and Nordea Bank AB (publ) |
3 month MosPRIME plus 1.00% |
USD 72.9 (RUB 4,100.8) |
April 30, 2019 | EKN | |||||
| WIND Telecomunicazioni S.p.A. |
Senior facilities |
All tranches: | ||||||||
| Deutsche Bank A.G., Credit Suisse A.G., Banca IMI S.p.A, BNP Paribas, the Royal Bank of Scotland, Citigroup, Crédit Agricole Corporate and Investment Bank, Goldman Sachs International, J.P. Morgan plc, Morgan Stanley Bank International Limited, Natixis, S.A. and UniCredit S.p.A. With Banca Nazionale del Lavora S.p.A., Gruppo BNP Paribas, Crédit Agricole Corporate and Investment Bank, Milan Branch, and The Royal Bank of Scotland plc, Milan Branch, as Original Lenders |
EURIBOR +4.25%(5)
EURIBOR + 4.50%
EURIBOR + 4.75% |
USD 210.7 (EUR 174.2)
USD 1,347.6 (EUR 1,113.9)
USD 597.2 (EUR 493.6) |
November 26, 2018
November 26, 2019
November 26, 2019 |
WIND Telecomunicazioni S.p.A. | ||||||
| WIND Telecomunicazioni S.p.A. |
Debt vs Italian Government (4G/LTE) |
Rendistato+1.0% | USD 196 (EUR 162) |
October 3, 2016 | ||||||
| WIND Telecomunicazioni S.p.A. |
Annuity loans several lender unwound swaps |
3.39%-5.53% | USD 44.9 (EUR 37.1) |
September 26, 2016 | None | |||||
| WIND Telecomunicazioni S.p.A. |
Revolving Credit Facility |
EURIBOR + 4.25% | USD 121 (EUR 100) |
November 26, 2018 | Wind Telecomunicazioni S.p.A. | |||||
| WIND Telecomunicazioni S.p.A. |
Terna Debt |
10.05% | USD 159.2 (EUR 131.6) |
December 31, 2035 | None | |||||
| WIND Acquisition Finance S.A. |
Senior Secured Notes |
3 month EURIBOR plus 5.25% |
USD 181.5 (EUR 150) |
April 30, 2019 | Wind Telecomunicazioni S.p.A. | |||||
| WIND Acquisition Finance S.A. |
Senior Secured Notes |
6.50% | USD 550 | April 30, 2020 | Wind Telecomunicazioni |
VimpelCom Ltd. 4Q 2014 | 33
![]()
ATTACHMENT B: DEBT OVERVIEW (CONTINUED)
| as at 31 December 2014 | Type of debt | Interest rate | Outstanding debt (mln) |
Maturity date |
Guarantor | |||||
| WIND Acquisition Finance S.A. |
Senior Notes |
7.00% | USD 2,117.1 (EUR 1,750) |
April 23, 2021 | Wind Telecomunicazioni S.p.A. | |||||
| WIND Acquisition Finance S.A. |
Senior Notes |
7.38% | USD 2,800 | April 23, 2021 | Wind Telecomunicazioni S.p.A. | |||||
| WIND Acquisition Finance S.A. |
Senior Secured Notes |
4.00% | USD 2,540.5 (EUR 2,100) |
July 15, 2020 | Wind Telecomunicazioni S.p.A. | |||||
| WIND Acquisition Finance S.A. |
Senior Secured Notes |
4.75% | USD 1,900 | July 15, 2020 | Wind Telecomunicazioni S.p.A. | |||||
| WIND Acquisition Finance S.A. |
Senior Secured Notes |
3 month EURIBOR plus 4.00% |
USD 695,6 (EUR 575) |
July 15, 2020 | Wind Telecomunicazioni S.p.A. | |||||
| Pakistan Mobile Communications Limited (“PMCL”) |
Syndicated loan via MCB Bank Limited |
6 month KIBOR plus 1.25% |
USD 59.7 (PKR6,000) |
November 28, 2017 | None | |||||
| PMCL |
Syndicated loan via MCB Bank Limited |
6 month KIBOR plus 1.25% |
USD 69.6 (PKR7,000) |
May 16, 2019 | None | |||||
| PMCL |
Loan from Habib Bank Limited |
6 month KIBOR plus 1.15% |
USD 44.8 (PKR4,500) |
May 16, 2019 | None | |||||
| PMCL |
Loan from United Bank Limited |
6 month KIBOR plus 1.10% |
USD 39.8 (PKR4,000) |
May 16, 2021 | None | |||||
| Banglalink Digital Communications Ltd. (“Banglalink”) |
Senior Notes |
8.63% | USD 300 | May 6, 2019 | None | |||||
| Banglalink |
Facility Eastern Bank Limited |
9.00%-10.00% | USD 32.1 (BDT2,500) |
May 31, 2016 | None | |||||
| Banglalink |
Facility Standard Chartered Bank |
8.25%-8.50% | USD 44.9 (BDT3,500) |
April 29, 2016 | None | |||||
| OTA |
Loan from Hermes |
3 months LIBOR + 0.9% |
USD 46.6 | January 30, 2015 | VimpelCom Amsterdam B.V. | |||||
| Other loans, equipment financing and capital lease obligations |
— |
— | USD 469 | — | — |
| (1) | Effective from June 29, 2011, this fixed interest rate was subject to interest rate swap arrangements to effectively swap the fixed interest rate for a floating interest rate based on three-month U.S. dollar LIBOR. The weighted average spread over LIBOR for the notes was 4.187%. In August 2012, we unwound our interest rate swaps related to these notes, resulting in a reduction of the effective interest rate on the notes due March 2017 of approximately 1.5%. As a result of the unwind, the company received a cash amount of approximately US$35 million including accrued interest |
| (2) | Effective from June 29, 2011, this fixed interest rate was subject to interest rate swap arrangements to effectively swap the fixed interest rate for a floating interest rate based on three-month U.S. dollar LIBOR. The weighted average spread over LIBOR for the notes was 4.375%. In August 2012, we unwound our interest rate swaps related to a principal amount of US$1,300 million of these notes, and in November 2012 we unwound the interest rate swaps related to the remaining US$200 million principal amount, resulting in a reduction of the effective interest rate on these notes of approximately 2.0%. As a result of the unwinds, the company received a cash amount of approximately US$218 million including accrued interest. |
| (3) | These bonds are subject to an investor put option at March 17, 2015. |
| (4) | These bonds are subject to an investor put option at March 23, 2015. |
| (5) | Interest on the all tranches of the senior facility is based on EURIBOR for loans in Euros and LIBOR for loans in any other currency. Also interest rate margins may be reduced based on specified improvement in leverage ratios. |
VimpelCom Ltd. 4Q 2014 | 34
![]()
ATTACHMENT C: COUNTRY UNITS KEY INDICATORS
AFRICA & ASIA BUSINESS UNIT: COUNTRY DETAIL
ALGERIA
| DZD bln | 4Q14 | 4Q13 | YoY | FY14 | FY13 | YoY | ||||||||||||||||||
| Total revenue |
34 | 36 | (6 | %) | 136 | 143 | (5 | %) | ||||||||||||||||
| Mobile service revenue |
33 | 36 | (7 | %) | 135 | 143 | (5 | %) | ||||||||||||||||
| EBITDA |
17 | 22 | (22 | %) | 73 | 85 | (14 | %) | ||||||||||||||||
| EBITDA margin |
49.8 | % | 60.1 | % | (10.3 | pp) | 53.5 | % | 59.1 | % | (5.6 | pp) | ||||||||||||
| Capex1 (USD mln) |
109 | 51 | 114 | % | 415 | 84 | n.m. | |||||||||||||||||
| Capex / Revenue |
28 | % | 11 | % | 25 | % | 5 | % | ||||||||||||||||
| Mobile |
||||||||||||||||||||||||
| Customers (mln) |
18.4 | 17.6 | 5 | % | ||||||||||||||||||||
| ARPU (DZD) |
610 | 689 | (12 | %) | ||||||||||||||||||||
| MOU (min) |
182 | 211 | (13 | %) | ||||||||||||||||||||
PAKISTAN
| PKR bln | 4Q14 | 4Q13 | YoY | FY14 | FY13 | YoY | ||||||||||||||||||
| Total revenue |
26 | 26 | (1 | %) | 102 | 108 | (6 | %) | ||||||||||||||||
| Mobile service revenue |
24 | 25 | (2 | %) | 98 | 104 | (6 | %) | ||||||||||||||||
| EBITDA |
10 | 9 | 6 | % | 39 | 45 | (13 | %) | ||||||||||||||||
| EBITDA margin |
41.5 | % | 38.5 | % | 3.0 | pp | 40.0 | % | 42.8 | % | (2.8 | pp) | ||||||||||||
| Capex1 (USD mln) |
89 | 90 | (1 | %) | 352 | 190 | 85 | % | ||||||||||||||||
| Capex / Revenue |
36 | % | 37 | % | 35 | % | 18 | % | ||||||||||||||||
| Mobile |
||||||||||||||||||||||||
| Customers (mln) |
38.5 | 37.6 | 2 | % | ||||||||||||||||||||
| ARPU (PKR) |
204 | 219 | (7 | %) | ||||||||||||||||||||
| MOU (min) |
273 | 222 | 23 | % | ||||||||||||||||||||
BANGLADESH
| BDT bln | 4Q14 | 4Q13 | YoY | FY14 | FY13 | YoY | ||||||||||||||||||
| Total revenue |
11 | 10 | 14 | % | 44 | 39 | 11 | % | ||||||||||||||||
| Mobile service revenue |
11 | 9 | 18 | % | 43 | 39 | 11 | % | ||||||||||||||||
| EBITDA |
5 | 3 | 38 | % | 17 | 15 | 17 | % | ||||||||||||||||
| EBITDA margin |
40.8 | % | 33.7 | % | 7.1 | pp | 38.9 | % | 37.1 | % | 1.8 | pp | ||||||||||||
| Capex1 (USD mln) |
59 | 94 | (37 | %) | 178 | 133 | 34 | % | ||||||||||||||||
| Capex / Revenue |
40 | % | 73 | % | 32 | % | 26 | % | ||||||||||||||||
| Mobile |
||||||||||||||||||||||||
| Customers (mln) |
30.8 | 28.8 | 7 | % | ||||||||||||||||||||
| ARPU (BDT) |
122 | 110 | 10 | % | ||||||||||||||||||||
| MOU (min) |
186 | 183 | 2 | % | ||||||||||||||||||||
SEA (CONSOLIDATED)
| USD mln | 4Q14 | 4Q13 | YoY | FY14 | FY13 | YoY | ||||||||||||||||||
| Total revenue |
5 | 7 | (18 | %) | 29 | 33 | (14 | %) | ||||||||||||||||
| EBITDA |
2 | 2 | 35 | % | 10 | 6 | 74 | % | ||||||||||||||||
| EBITDA margin |
42.7 | % | 25.8 | % | 16.9 | pp | 33.6 | % | 16.7 | % | 16.9 | pp | ||||||||||||
| Mobile |
||||||||||||||||||||||||
| Customers (mln) |
0.2 | 0.3 | (25 | %) | ||||||||||||||||||||
| 1) | CAPEX excluding licenses |
VimpelCom Ltd. 4Q 2014 | 35
![]()
CIS BUSINESS UNIT: COUNTRY DETAIL
KAZAKHSTAN
| KZT mln | 4Q14 | 4Q13 | YoY | FY14 | FY13 | YoY | ||||||||||||||||||
| Total revenue |
34,965 | 33,730 | 4 | % | 135,266 | 127,748 | 6 | % | ||||||||||||||||
| Mobile service revenue |
31,148 | 30,482 | 2 | % | 120,513 | 115,835 | 4 | % | ||||||||||||||||
| Fixed-line service revenue |
3,769 | 3,214 | 17 | % | 14,565 | 11,781 | 24 | % | ||||||||||||||||
| EBITDA |
14,061 | 16,101 | (13 | %) | 62,492 | 59,427 | 5 | % | ||||||||||||||||
| EBITDA margin |
40.2 | % | 47.7 | % | (7.5 | pp) | 46.2 | % | 46.5 | % | (0.3 | pp) | ||||||||||||
| Capex (USD mln) |
55 | 58 | (4 | %) | 109 | 159 | (32 | %) | ||||||||||||||||
| Capex / Revenue |
29 | % | 26 | % | 14 | % | 19 | % | ||||||||||||||||
| Mobile |
||||||||||||||||||||||||
| Customers (mln) |
9.8 | 9.2 | 7 | % | ||||||||||||||||||||
| ARPU (KZT) |
1,041 | 1,109 | (6 | %) | ||||||||||||||||||||
| MOU (min) |
298 | 301 | (1 | %) | ||||||||||||||||||||
| UZBEKISTAN | ||||||||||||||||||||||||
| USD mln | 4Q14 | 4Q13 | YoY | FY14 | FY13 | YoY | ||||||||||||||||||
| Total revenue |
186 | 173 | 7 | % | 718 | 673 | 7 | % | ||||||||||||||||
| Mobile service revenue |
184 | 171 | 8 | % | 710 | 664 | 7 | % | ||||||||||||||||
| Fixed-line service revenue |
2 | 2 | (10 | %) | 7 | 8 | (10 | %) | ||||||||||||||||
| EBITDA |
115 | 21 | 457 | % | 461 | 347 | 33 | % | ||||||||||||||||
| EBITDA margin |
61.6 | % | 11.9 | % | 49.7 | pp | 64.2 | % | 51.5 | % | 12.7 | pp | ||||||||||||
| Capex (USD mln) |
28 | -17 | 262 | % | 79 | 142 | (44 | %) | ||||||||||||||||
| Capex / Revenue |
15 | % | -10 | % | 11 | % | 21 | % | ||||||||||||||||
| Mobile |
||||||||||||||||||||||||
| Customers (mln) |
10.6 | 10.5 | 1 | % | ||||||||||||||||||||
| ARPU (USD) |
6 | 5 | 6 | % | ||||||||||||||||||||
| MOU (min) |
528 | 493 | 7 | % | ||||||||||||||||||||
| ARMENIA | ||||||||||||||||||||||||
| AMD mln | 4Q14 | 4Q13 | YoY | FY14 | FY13 | YoY | ||||||||||||||||||
| Total revenue |
13,859 | 15,378 | (10 | %) | 57,479 | 59,278 | (3 | %) | ||||||||||||||||
| Mobile service revenue |
6,155 | 6,573 | (6 | %) | 24,642 | 25,587 | (4 | %) | ||||||||||||||||
| Fixed-line service revenue |
7,407 | 8,510 | (13 | %) | 31,622 | 32,760 | (3 | %) | ||||||||||||||||
| EBITDA |
2,478 | 5,421 | (54 | %) | 18,671 | 23,340 | (20 | %) | ||||||||||||||||
| EBITDA margin |
17.9 | % | 35.2 | % | (17.3 | pp) | 32.5 | % | 39.4 | % | (6.9 | pp) | ||||||||||||
| Capex (USD mln) |
6 | 4 | 39 | % | 15 | 12 | 27 | % | ||||||||||||||||
| Capex / Revenue |
19 | % | 11 | % | 11 | % | 8 | % | ||||||||||||||||
| Mobile |
||||||||||||||||||||||||
| Customers (mln) |
0.8 | 0.7 | 12 | % | ||||||||||||||||||||
| ARPU (AMD) |
2,588 | 3,093 | (16 | %) | ||||||||||||||||||||
| MOU (min) |
371 | 388 | (4 | %) | ||||||||||||||||||||
| TAJIKISTAN | ||||||||||||||||||||||||
| USD mln | 4Q14 | 4Q13 | YoY | FY14 | FY13 | YoY | ||||||||||||||||||
| Total revenue |
33 | 37 | (9 | %) | 142 | 148 | (4 | %) | ||||||||||||||||
| Mobile service revenue |
33 | 36 | (8 | %) | 142 | 145 | (2 | %) | ||||||||||||||||
| EBITDA |
13 | 18 | (27 | %) | 62 | 74 | (16 | %) | ||||||||||||||||
| EBITDA margin |
38.5 | % | 48.2 | % | (9.7 | pp) | 43.5 | % | 49.7 | % | (6.2 | pp) | ||||||||||||
| Capex |
11 | 5 | 122 | % | 18 | 16 | 8 | % | ||||||||||||||||
| Capex / Revenue |
34 | % | 14 | % | 12 | % | 11 | % | ||||||||||||||||
| Mobile |
||||||||||||||||||||||||
| Customers (mln) |
1.3 | 1.3 | 2 | % | ||||||||||||||||||||
| ARPU (USD) |
9 | 10 | (10 | %) | ||||||||||||||||||||
| MOU (min) |
287 | 307 | (6 | %) | ||||||||||||||||||||
VimpelCom Ltd. 4Q 2014 | 36
![]()
GEORGIA
| GEL mln | 4Q14 | 4Q13 | YoY | FY14 | FY13 | YoY | ||||||||||||||||||
| Total revenue |
39 | 38 | 2 | % | 140 | 147 | (5 | %) | ||||||||||||||||
| Mobile service revenue |
35 | 33 | 4 | % | 128 | 132 | (3 | %) | ||||||||||||||||
| Fixed-line service revenue |
3 | 2 | 56 | % | 8 | 8 | (4 | %) | ||||||||||||||||
| EBITDA |
8 | 11 | (23 | %) | 35 | 45 | (21 | %) | ||||||||||||||||
| EBITDA margin |
21.4 | % | 28.6 | % | (7.2 | pp) | 25.1 | % | 30.4 | % | (5.3 | pp) | ||||||||||||
| Capex (USD mln) |
10 | 4 | 182 | % | 20 | 18 | 15 | % | ||||||||||||||||
| Capex / Revenue |
48 | % | 16 | % | 26 | % | 20 | % | ||||||||||||||||
| Mobile |
||||||||||||||||||||||||
| Customers (mln) |
1.3 | 1.1 | 15 | % | ||||||||||||||||||||
| ARPU (GEL) |
8 | 10 | (18 | %) | ||||||||||||||||||||
| MOU (min) |
230 | 226 | 2 | % | ||||||||||||||||||||
| KYRGYZSTAN | ||||||||||||||||||||||||
| KGZ mln | 4Q14 | 4Q13 | YoY | FY14 | FY13 | YoY | ||||||||||||||||||
| Total revenue |
2,563 | 2,165 | 18 | % | 9,547 | 9,316 | 2 | % | ||||||||||||||||
| Mobile service revenue |
2,549 | 2,151 | 19 | % | 9,504 | 9,254 | 3 | % | ||||||||||||||||
| EBITDA |
1,333 | 927 | 44 | % | 4,877 | 4,702 | 4 | % | ||||||||||||||||
| EBITDA margin |
52.0 | % | 42.8 | % | 9.2 | pp | 51.1 | % | 50.5 | % | 0.6 | pp | ||||||||||||
| Capex (USD mln) |
10 | 8 | 22 | % | 26 | 23 | 13 | % | ||||||||||||||||
| Capex / Revenue |
22 | % | 18 | % | 15 | % | 12 | % | ||||||||||||||||
| Mobile |
||||||||||||||||||||||||
| Customers (mln) |
2.7 | 2.7 | 3 | % | ||||||||||||||||||||
| ARPU (KGZ) |
310 | 274 | 13 | % | ||||||||||||||||||||
| MOU (min) |
285 | 311 | (8 | %) | ||||||||||||||||||||
VimpelCom Ltd. 4Q 2014 | 37
![]()
ATTACHMENT D: RECONCILIATION TABLES
RECONCILIATION OF CONSOLIDATED EBITDA OF VIMPELCOM
| USD mln | 4Q14 | 4Q13 | FY14 | FY13 | ||||||||||||
| Unaudited |
||||||||||||||||
| EBITDA |
1,600 | 1,013 | 7,970 | 8,260 | ||||||||||||
| Depreciation |
(623 | ) | (810 | ) | (2,839 | ) | (3,050 | ) | ||||||||
| Amortization |
(324 | ) | (458 | ) | (1,479 | ) | (1,791 | ) | ||||||||
| Impairment loss |
(1,051 | ) | (2,906 | ) | (992 | ) | (2,973 | ) | ||||||||
| Loss on disposals of non-current assets |
(23 | ) | (57 | ) | (74 | ) | (100 | ) | ||||||||
| EBIT |
(421 | ) | (3,218 | ) | 2,586 | 346 | ||||||||||
| Financial Income and Expenses |
(410 | ) | (511 | ) | (1,972 | ) | (2,059 | ) | ||||||||
| - including finance income |
5 | 21 | 54 | 91 | ||||||||||||
| - including finance costs |
(415 | ) | (532 | ) | (2,026 | ) | (2,150 | ) | ||||||||
| Net foreign exchange gain / (loss) and others |
(185 | ) | (265 | ) | (795 | ) | (311 | ) | ||||||||
| - including Other non-operating gains / (losses) |
139 | (194 | ) | (152 | ) | (172 | ) | |||||||||
| - including Shares of loss of associates and joint ventures accounted for using the equity method |
4 | (47 | ) | (38 | ) | (159 | ) | |||||||||
| - including Net foreign exchange gain / (losses) |
(328 | ) | (24 | ) | (605 | ) | 20 | |||||||||
| EBT |
(1,016 | ) | (3,994 | ) | (181 | ) | (2,024 | ) | ||||||||
| Income tax expense |
(41 | ) | (1,257 | ) | (722 | ) | (2,064 | ) | ||||||||
| Profit for the year |
(1,057 | ) | (5,251 | ) | (903 | ) | (4,088 | ) | ||||||||
| Profit/(loss) for the year attributable to non-controlling interest |
(122 | ) | (1,390 | ) | (212 | ) | (1,463 | ) | ||||||||
| Profit for the year attributable to the owners of the parent |
(935 | ) | (3,861 | ) | (691 | ) | (2,625 | ) | ||||||||
VimpelCom Ltd. 4Q 2014 | 38
![]()
ATTACHMENT D: RECONCILIATION TABLES
RECONCILIATION OF VIMPELCOM CONSOLIDATED NET DEBT
| USD mln | 4Q13 | 3Q14 | 4Q14 | |||||||||
| Net debt |
22,604 | 21,736 | 19,992 | |||||||||
| Cash and cash equivalents |
4,454 | 5,852 | 6,342 | |||||||||
| Long-term and short-term deposits |
396 | 126 | 109 | |||||||||
| Gross debt |
27,454 | 27,714 | 26,443 | |||||||||
| Interest accrued related to financial liabilities |
605 | 402 | 410 | |||||||||
| Fair Value adjustment |
— | 8 | 29 | |||||||||
| Unamortised fair value adjustment under acquisition method of accounting |
665 | — | — | |||||||||
| Other unamortised adjustments to financial liabilities (fees, discounts etc.) |
29 | (104 | ) | (106 | ) | |||||||
| Derivatives not designated as hedges |
204 | 249 | 259 | |||||||||
| Derivatives designated as hedges |
271 | 106 | 89 | |||||||||
| Total other financial liabilities |
29,229 | 28,375 | 27,124 | |||||||||
RECONCILIATION OF CONSOLIDATED LTM EBITDA ADJUSTED
| USD mln | FY14 | FY13 | ||||||
| Unaudited |
||||||||
| EBITDA |
7,970 | 8,260 | ||||||
| Add back provisions related to the 51% sale in Algeria |
50 | 1,266 | ||||||
| LTM EBITDA adjusted |
8,020 | 9,526 | ||||||
OPERATING CASH FLOW (EBITDA – CAPEX EXCL. LICENSES) RECONCILIATION
| USD mln | 4Q14 | 4Q13 | FY14 | FY13 | ||||||||||||
| Unaudited |
||||||||||||||||
| Operating cash flow (EBITDA - CAPEX) |
399 | (669 | ) | 4,063 | 4,262 | |||||||||||
| CAPEX excl. licenses |
1,201 | 1,682 | 3,907 | 3,998 | ||||||||||||
| EBITDA |
1,600 | 1,013 | 7,970 | 8,260 | ||||||||||||
| Changes in working capital and other |
303 | 1,789 | 149 | 1,403 | ||||||||||||
| Net interest paid |
(432 | ) | (388 | ) | (2,110 | ) | (2,047 | ) | ||||||||
| Income tax paid |
(73 | ) | (404 | ) | (730 | ) | (1,265 | ) | ||||||||
| Net cash from operating activities |
1,398 | 2,010 | 5,279 | 6,351 | ||||||||||||
RATES OF FUNCTIONAL CURRENCIES TO USD1
| Average rates | Closing rates | |||||||||||||||||||||||
| 4Q14 | 4Q13 | YoY | FY14 | FY13 | YoY | |||||||||||||||||||
| Russian Ruble |
47.42 | 32.53 | (45.8 | %) | 56.26 | 32.73 | (71.9 | %) | ||||||||||||||||
| Euro |
0.80 | 0.73 | (9.6 | %) | 0.83 | 0.73 | (13.7 | %) | ||||||||||||||||
| Algerian Dinar |
85.11 | 80.18 | (6.1 | %) | 87.92 | 78.38 | (12.2 | %) | ||||||||||||||||
| Pakistan Rupee |
101.89 | 106.93 | 4.7 | % | 100.52 | 105.33 | 4.6 | % | ||||||||||||||||
| Bangladeshi Taka |
77.52 | 77.67 | 0.2 | % | 77.93 | 77.67 | (0.3 | %) | ||||||||||||||||
| Ukrainian Hryvnia |
14.43 | 7.99 | (80.6 | %) | 15.77 | 7.99 | (97.4 | %) | ||||||||||||||||
| Kazakh Tenge |
181.39 | 153.80 | (17.9 | %) | 182.35 | 153.61 | (18.7 | %) | ||||||||||||||||
| Uzbekistan Som |
2,393.50 | 2,181.0 | (9.7 | %) | 2,422.40 | 2,202.2 | (10.0 | %) | ||||||||||||||||
| Armenian Dram |
430.64 | 405.56 | (6.2 | %) | 474.97 | 405.64 | (17.1 | %) | ||||||||||||||||
| Kyrgyz Som |
56.99 | 48.89 | (16.6 | %) | 58.89 | 49.25 | (19.6 | %) | ||||||||||||||||
| Georgian Lari |
1.81 | 1.69 | (7.1 | %) | 1.86 | 1.74 | (6.9 | %) | ||||||||||||||||
| 1) | Functional currency in Tajikistan is USD |
VimpelCom Ltd. 4Q 2014 | 39
![]()
ATTACHMENT E: WIND TELECOMUNICAZIONI GROUP CONDENSED STATEMENTS OF INCOME
| EUR mln | FY14 | FY13 | YoY | |||||||||||||
| Total Revenue |
4,633 | 4,983 | (7 | %) | ||||||||||||
| EBITDA |
1,804 | 1,944 | (7 | %) | ||||||||||||
| D&A |
(1,231 | ) | (1,276 | ) | (4 | %) | ||||||||||
| EBIT |
573 | 667 | (14 | %) | ||||||||||||
| Financial Income and expenses |
(1,386 | ) | (999 | ) | 39 | % | ||||||||||
| EBT |
(812 | ) | (332 | ) | 144 | % | ||||||||||
| Income Tax |
103 | (149 | ) | (169 | %) | |||||||||||
| Net loss |
(709 | ) | (481 | ) | 47 | % | ||||||||||
VimpelCom Ltd. 4Q 2014 | 40
![]()
ATTACHMENT F: DEFINITIONS
ARPU (Average Revenue per User) is calculated by dividing service revenue for the relevant period, including revenue from voice-, roaming-, interconnect-, and value added services (including mobile data, SMS, MMS), but excluding revenue from visitors roaming, connection fees, sales of handsets and accessories and other non-service revenue, by the average number of customers during the period and dividing by the number of months in that period. For Business Unit Italy visitors roaming revenue is included into service revenue for ARPU calculation.
Broadband customers are the customer contracts that served as a basis for revenue generating activity in the three months prior to the measurement date, as a result of activities including monthly Internet access using FTTB and xDSL technologies as well as mobile Internet access via WiFi and USB modems using 2.5G/3G/4G/HSPA+ technologies. Italian Business Unit measure fixed broadband customers based on the number of active contracts signed, mobile broadband include customers that have performed at least one mobile Internet event in the previous month. Russian Business Unit includes IPTV activities. For CIS subsidiaries mobile broadband customers are those who have performed at least one mobile Internet event in the three-month period prior to the measurement date.
Capital expenditures (CAPEX), purchases of new equipment, new construction, upgrades, software, other long lived assets and related reasonable costs incurred prior to intended use of the non-current asset, accounted at the earliest event of advance payment or delivery. Long-lived assets acquired in business combinations are not included in capital expenditures.
EBIT is a non-GAAP measure and is calculated as EBITDA plus depreciation, amortization and impairment loss. Our management uses EBIT as a supplemental performance measure and believes that it provides useful information of earnings of the Company before making accruals for financial income and expenses and Net foreign exchange (loss)/gain and others. Reconciliation of EBIT to net income attributable to VimpelCom Ltd., the most directly comparable IFRS financial measure, is presented above.
EBITDA is a non-GAAP financial measure. EBITDA is defined as earnings before interest, tax, depreciation and amortization. VimpelCom calculates EBITDA as operating income before depreciation, amortization, loss from disposal of non-current assets and impairment loss and includes certain non-operating losses and gains mainly represented by litigation provisions for all of its Business Units except for its Russia Business Unit. The Russia Business Unit’s EBITDA is calculated as operating income before depreciation, amortization, loss from disposal of non-current assets and impairment loss. EBITDA should not be considered in isolation or as a substitute for analyses of the results as reported under IFRS. Historically our management used OIBDA (defined as operating income before depreciation, amortization and impairment losses) instead of EBITDA. Following the acquisition of WIND Telecom, our management concluded that EBITDA is a more appropriate measure because it is more widely used amongst European-based analysts and investors to assess the performance of an entity and compare it with other market players. Our management uses EBITDA and EBITDA margin as supplemental performance measures and believes that EBITDA and EBITDA margin provide useful information to investors because they are indicators of the strength and performance of the Company’s business operations, including its ability to fund discretionary spending, such as capital expenditures, acquisitions and other investments, as well as indicating its ability to incur and service debt. In addition, the components of EBITDA include the key revenue and expense items for which the Company’s operating managers are responsible and upon which their performance is evaluated. EBITDA also assists management and investors by increasing the comparability of the Company’s performance against the performance of other telecommunications companies that provide EBITDA information. This increased comparability is achieved by excluding the potentially inconsistent effects between periods or companies of depreciation, amortization and impairment losses, which items may significantly affect operating income between periods. However, our EBITDA results may not be directly comparable to other companies’ reported EBITDA results due to variances and adjustments in the components of EBITDA (including our calculation of EBITDA) or calculation measures. Additionally, a limitation of EBITDA’s use as a performance measure is that it does not reflect the periodic costs of certain capitalized tangible and intangible assets used in generating revenue or the need to replace capital equipment over time. Reconciliation of EBITDA to net income attributable to VimpelCom Ltd., the most directly comparable IFRS financial measure, is presented above.
EBITDA margin is calculated as EBITDA divided by total revenue, expressed as a percentage.
Households passed are households located within buildings, in which indoor installation of all the FTTB equipment necessary to install terminal residential equipment has been completed.
LLU (local loop unbundling), in Italy, this is the regulatory process of allowing multiple telecommunications operators to use connections from Telecom Italia’s local exchanges to the customer’s premises.
VimpelCom Ltd. 4Q 2014 | 41
![]()
MFS (Mobile financial services): mobile commerce or m-commerce, encapsulates a variety of innovative services that use a mobile phone as the primary payment user interface. With this technology mobile customers can conduct money transfers to pay for goods at an online store, make utility payments, pay fines and state fees, loan repayments, domestic and international remittances, pay mobile insurance and purchase tickets for air and rail travel, all via their mobile phone.
MNP (Mobile number portability) is a facility provided by telecommunications operators which enables customers to keep their telephone numbers when they change operators.
Mobile customers are SIM-cards registered in the system as of a measurement date, users of which generated revenue at any time during the three months prior to the measurement date. This includes revenue coming from any incoming and outgoing calls, subscription fee accruals, debits related to service, outgoing SMS, Multimedia Messaging Service (referred to as MMS), data transmission and receipt sessions, but does not include incoming SMS and MMS sent by VimpelCom or abandoned calls. VimpelCom’s total number of mobile customers also includes SIM-cards for use of mobile Internet service via USB modems and customers for WiFi. The number for Italy is based on SIM-cards, users of which generated revenue at any time during the twelve months prior to the measurement date. For the purpose of this earnings release, we include all customers of Zimbabwe, which is accounted for as investment at cost, into Business Unit Africa & Asia and customers of all our Canada equity investee into Business Unit Europe and North America, both of which are included into total customers of VimpelCom.
MOU (Monthly Average Minutes of Use per User) is generally calculated by dividing the total number of minutes of usage for incoming and outgoing calls during the relevant period (excluding guest roamers) by the average number of mobile customers during the period and dividing by the number of months in that period. Africa & Asia Business Unit measures MOU based on billed minutes
Net debt is a non-GAAP financial measure and is calculated as the sum of interest bearing long-term debt and short-term debt minus cash and cash equivalents, long-term and short-term deposits and fair value hedges. The Company believes that net debt provides useful information to investors because it shows the amount of debt outstanding to be paid after using available cash and cash equivalent and long-term and short-term deposits. Net debt should not be considered in isolation as an alternative to long-term debt and short-term debt, or any other measure of the company financial position. Reconciliation of net debt to long-term debt and short-term debt, the most directly comparable IFRS financial measures, is presented above in the reconciliation tables section.
Net foreign exchange (loss)/gain and others represents the sum of Net foreign exchange (loss)/gain, Equity in net (loss)/gain of associates and Other (expense)/income, net (primarily losses from derivative instruments), and is adjusted for certain non-operating losses and gains mainly represented by litigation provisions. Our management uses Net foreign exchange (loss)/gain and others as a supplemental performance measure and believes that it provides useful information about the impact of our debt denominated in foreign currencies on our results of operations due to fluctuations in exchange rates, the performance of our equity investees and other losses and gains the Company needs to manage to run the business.
OPEX, operational expenses, represents service costs and selling, general and administrative expenses.
Organic growth in revenue and EBITDA are non-GAAP financial measures that reflect changes in Revenue and EBITDA excluding foreign currency movements and other factors, such as businesses under liquidation, disposals, mergers and acquisitions.
Underlying growth Revenue and EBITDA also excludes MTR reductions and one-offs. We believe investors should consider these measures as they are more indicative of our ongoing performance and management uses these measures to evaluate the Company’s operational results and trends.
Reportable segments: the Company identified Russia, Italy, Africa & Asia, Ukraine and CIS based on the business activities in different geographical areas. Although Georgia is no longer a member of the CIS, consistent with VimpelCom’s historic reporting practice VimpelCom continues to include Georgia in its CIS reporting segment. Intersegment revenue is eliminated in consolidation.
Service costs represent costs directly associated with revenue generating activity such as traffic related expenses, cost of content and sim-cards as well as cost of handsets, telephone equipment and accessories sold.
Selling, general and administrative expenses represent expenses associated with customer acquisition and retention activities, network and IT maintenance, regular frequency payment, professional and consulting support, rent of premises, utilities, personnel and outsourcing as well as other general and administrative expenses. These expenses do not include personnel costs that have been capitalized as part of long-lived assets.
VimpelCom Ltd. 4Q 2014 | 42

© VimpelCom Ltd 2015
4Q14 and FY14 Earnings Presentation
London – February 25, 2015
Jo Lunder – CEO Andrew Davies – CFO
1
VimpelCom
Focusing Loyalty
Empowering People
Connecting Globally
© VimpelCom Ltd 2015
Disclaimer
This presentation contains “forward-looking statements”,
as the phrase is defined in Section 27A of the Securities Act of 1933 and Section 21E of the Securities Exchange Act of 1934. These statements relate to, among other things, the Company’s anticipated performance, future market developments and
trends, its intended use of proceeds from the Algeria transaction, anticipated interest cost savings, operational and network development and anticipated benefits from network investment, expectations regarding its 4G/LTE agreement with MTS,
anticipated benefits from 3G services in Ukraine and 4G/LTE services in Georgia, expectations regarding ongoing investigations of the SEC, the DOJ and the Dutch public prosecutor’s office, and the Company’s ability to realize its strategic
initiatives in the various countries of operation. The forward-looking statements included in this presentation are based on management’s best assessment of the Company’s strategic and financial position and of future market conditions and
trends. These discussions involve risks and uncertainties. The actual outcome may differ materially from these statements as a result of continued volatility in the economies in our markets, unforeseen developments from competition, governmental
regulation of the telecommunications industries, general political uncertainties in our markets and/or litigation with third parties. Certain factors that could cause actual results to differ materially from those discussed in any forward-looking
statements include the risk factors described in the Company’s Annual Report on Form 20-F for the year ended December 31, 2013 filed with the U.S. Securities and Exchange Commission (the “SEC”) and other public filings made by the
Company with the SEC, which risk factors are incorporated herein by reference. The Company disclaims forward looking statements speak only as of the date hereof, and the obligation to update them or to announce publicly any revision to any of the
forward-looking statements contained in this release, or to make corrections to reflect future events or developments.
2
VimpelCom
Focusing Loyalty
Empowering People
Connecting Globally
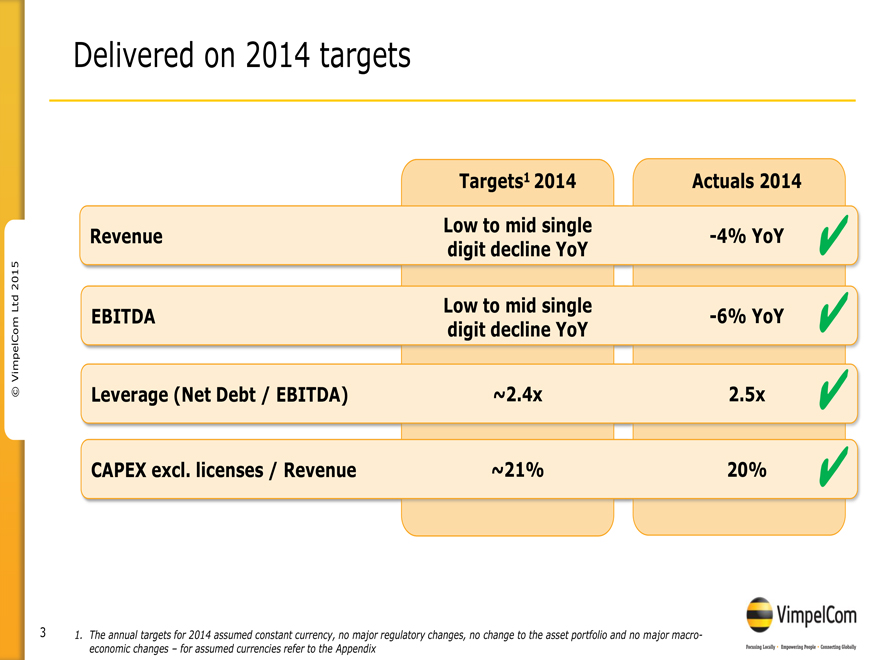
© VimpelCom Ltd 2015
Delivered on 2014 targets
Targets1 2014 Actuals 2014
Revenue Low to mid single digit decline YoY -4% YoY
EBITDA Low to mid single digit decline YoY
-6% YoY
Leverage (Net Debt / EBITDA) ~2.4x 2.5x
CAPEX excl. licenses /
Revenue ~21% 20%
1. The annual targets for 2014 assumed constant currency, no major regulatory changes, no change to the asset portfolio and no major macro-
economic changes – for assumed currencies refer to the Appendix
3
VimpelCom
Focusing Loyalty
Empowering People
Connecting Globally
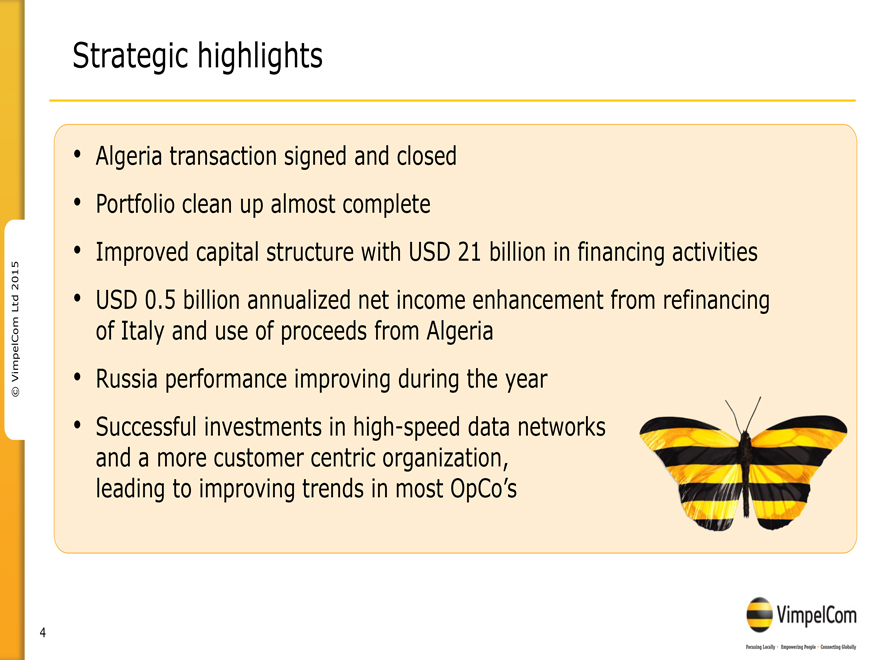
© VimpelCom Ltd 2015
Strategic highlights
Algeria transaction signed and closed
Portfolio clean up almost complete
Improved capital structure with USD 21 billion in financing
activities
USD 0.5 billion annualized net income enhancement from refinancing of Italy and use of proceeds from Algeria
Russia performance improving during the year
Successful investments in high-speed data
networks and a more customer centric organization, leading to improving trends in most OpCo’s
4
VimpelCom
Focusing Loyalty
Empowering People
Connecting Globally
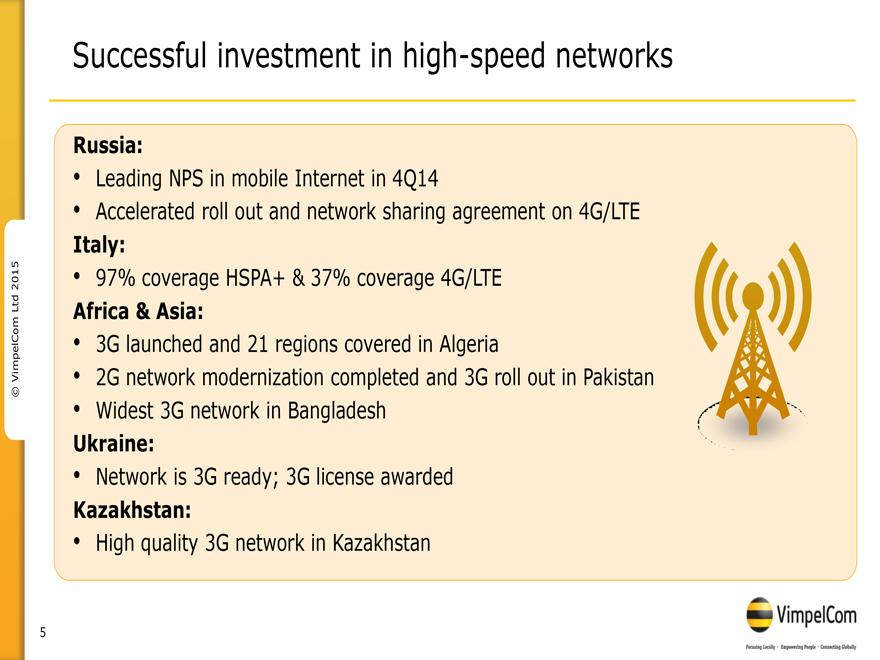
© VimpelCom Ltd 2015
Successful investment in high-speed networks
Russia:
Leading NPS in mobile Internet in 4Q14
Accelerated roll out and network sharing agreement on
4G/LTE
Italy:
97% coverage HSPA+ & 37% coverage 4G/LTE
Africa & Asia:
3G launched and 21 regions covered in Algeria
2G network modernization completed and 3G roll out in Pakistan
Widest 3G network in Bangladesh
Ukraine:
Network is 3G ready; 3G license awarded
Kazakhstan:
High quality 3G network in Kazakhstan
5
VimpelCom
Focusing Loyalty
Empowering People
Connecting Globally

© VimpelCom Ltd 2015
Leading in customer experience
#1 Co-leader Improving
Bangladesh
Kazakhstan Algeria Pakistan
Kyrgyzstan Italy Russia
Ukraine
Uzbekistan
Beeline banglalink DJEZZY MOBILINK
KYIVSTAR WIND Beeline TM
NOTE: Independent agency research
6
VimpelCom
Focusing Loyalty
Empowering People
Connecting Globally
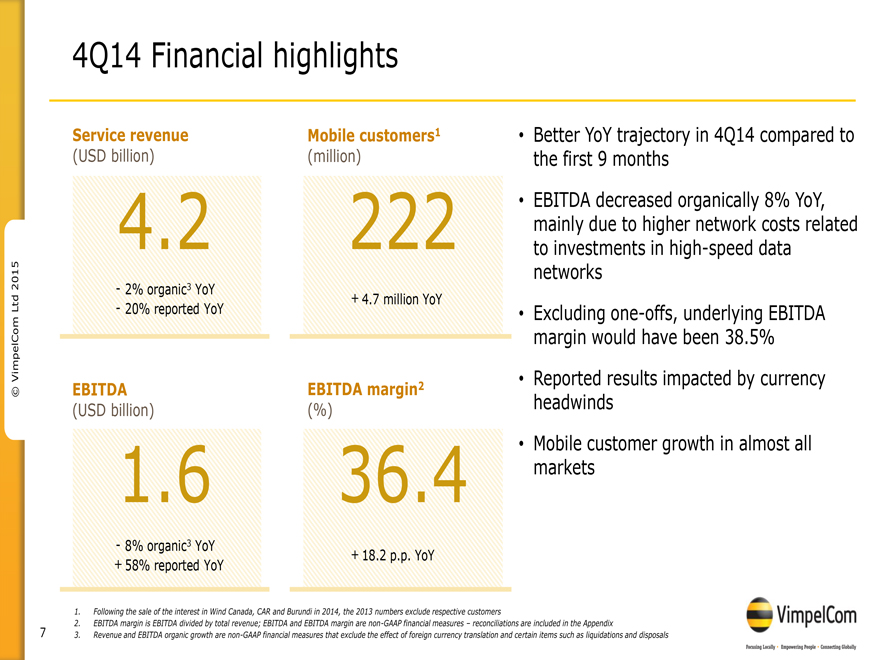
© VimpelCom Ltd 2015
4Q14 Financial highlights
Service revenue Mobile customers1
(USD billion) (million)
4.2 222
-2% organic3 YoY
-20% reported YoY + 4.7 million YoY
EBITDA EBITDA margin2
(USD billion) (%)
1.6 36.4
-8% organic3 YoY + 18.2 p.p. YoY
+ 58% reported YoY
Better YoY trajectory in 4Q14 compared to the first 9 months
EBITDA decreased organically 8% YoY, mainly due to higher network costs related to investments in high-speed data networks
Excluding one-offs, underlying EBITDA margin would have been 38.5%
Reported results impacted
by currency headwinds
Mobile customer growth in almost all markets
1.
Following the sale of the interest in Wind Canada, CAR and Burundi in 2014, the 2013 numbers exclude respective customers
2. EBITDA margin is EBITDA divided by
total revenue; EBITDA and EBITDA margin are non-GAAP financial measures – reconciliations are included in the Appendix
3. Revenue and EBITDA organic growth
are non-GAAP financial measures that exclude the effect of foreign currency translation and certain items such as liquidations and disposals
7
VimpelCom
Focusing Loyalty
Empowering People
Connecting Globally
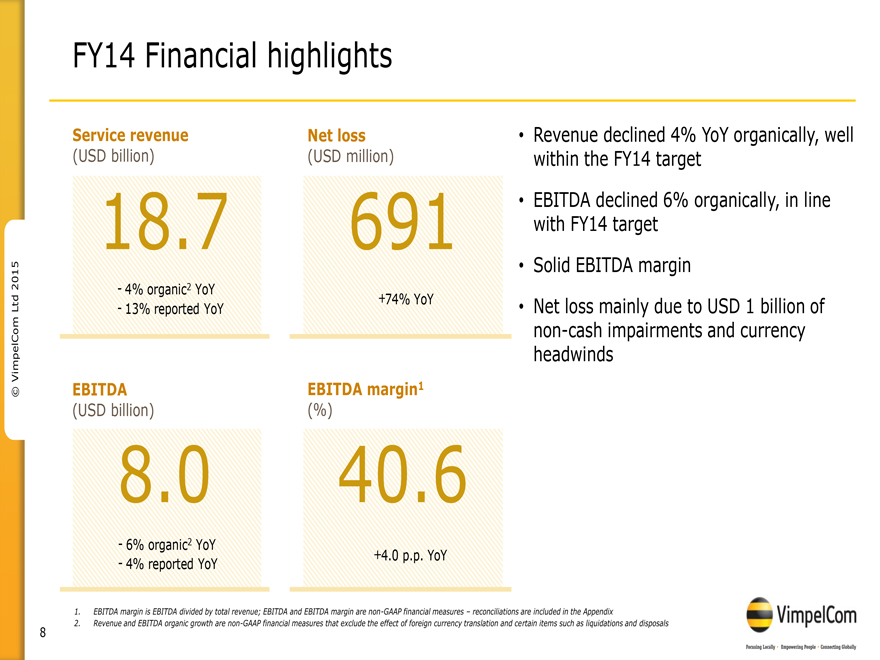
© VimpelCom Ltd 2015
FY14 Financial highlights
Service revenue Net loss
(USD billion) (USD million)
18.7 691
- 4% organic2 YoY
- 13% reported YoY +74% YoY
EBITDA EBITDA margin1
(USD billion) (%)
8.0 40.6
- 6% organic2 YoY
- 4% reported YoY +4.0 p.p. YoY
Revenue declined 4% YoY organically, well within the FY14
target
EBITDA declined 6% organically, in line with FY14 target
Solid EBITDA
margin
Net loss mainly due to USD 1 billion of non-cash impairments and currency headwinds
1. EBITDA margin is EBITDA divided by total revenue; EBITDA and EBITDA margin are non-GAAP financial measures – reconciliations are included in the Appendix
2. Revenue and EBITDA organic growth are non-GAAP financial measures that exclude the effect of foreign currency translation and certain items such as liquidations and disposals
8
VimpelCom
Focusing Loyalty
Empowering People
Connecting Globally
© VimpelCom Ltd 2015
Business Units Performance 4Q14
9
VimpelCom
Focusing Loyalty
Empowering People
Connecting Globally
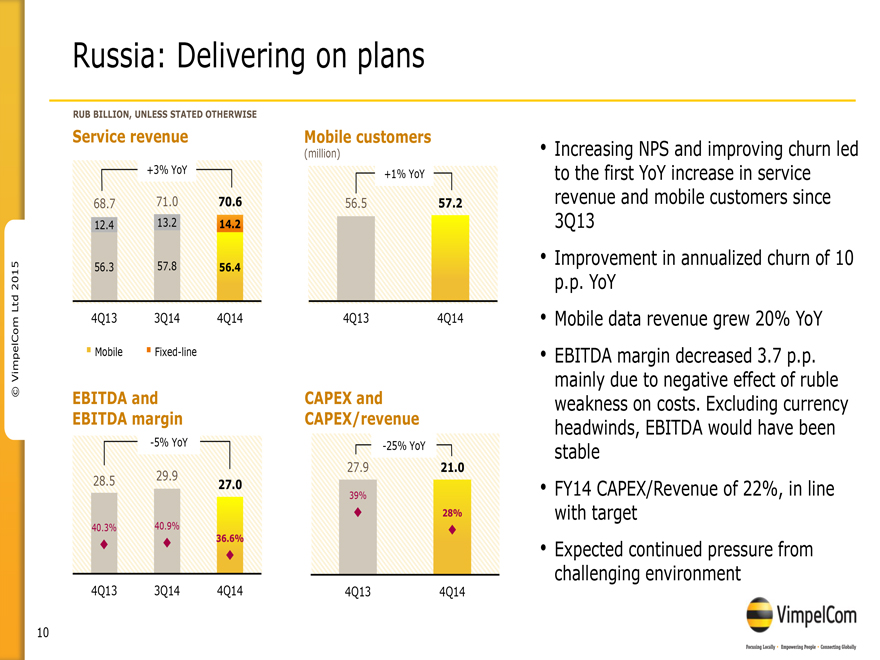
© VimpelCom Ltd 2015
Russia: Delivering on plans
RUB BILLION, UNLESS STATED OTHERWISE
Service revenue Mobile customers (million)
+3% YoY +1% YoY
68.7 71.0 70.6 56.5 57.2
12.4 13.2 14.2
56.3 57.8 56.4
4Q13 3Q14 4Q14 4Q13 4Q14
Mobile Fixed-line
EBITDA and CAPEX and
EBITDA margin CAPEX/revenue
-5% YoY -25% YoY
29.9 27.9 21.0
28.5 27.0
39%
28%
40.3% 40.9%
36.6%
4Q13 3Q14 4Q14 4Q13 4Q14
Increasing NPS and improving churn led to the first YoY increase in
service revenue and mobile customers since 3Q13
Improvement in annualized churn of 10 p.p. YoY
Mobile data revenue grew 20% YoY
EBITDA margin decreased 3.7 p.p. mainly due to negative
effect of ruble weakness on costs. Excluding currency headwinds, EBITDA would have been stable
FY14 CAPEX/Revenue of 22%, in line with target
Expected continued pressure from challenging environment
10
VimpelCom
Focusing Loyalty
Empowering People
Connecting Globally
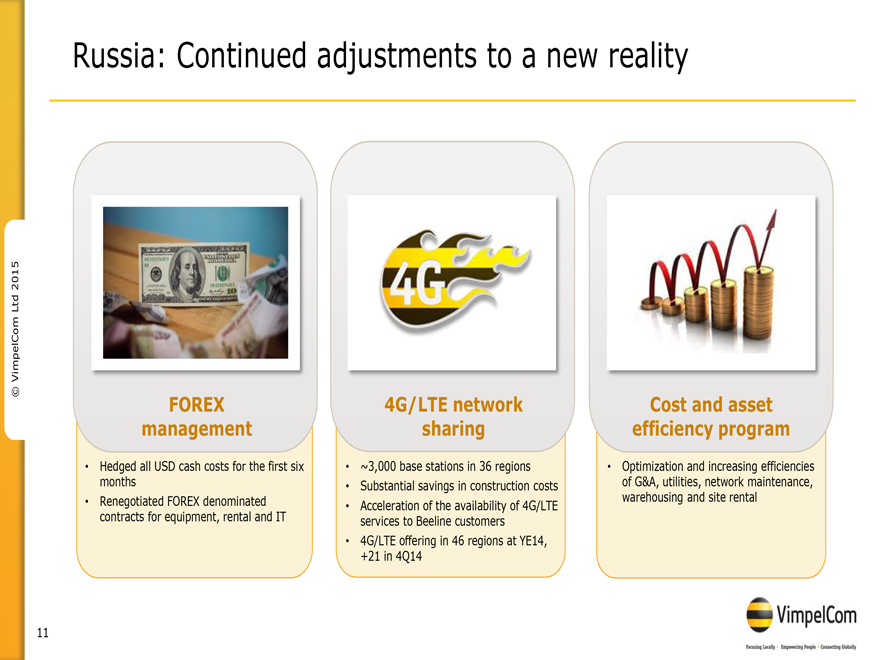
© VimpelCom Ltd 2015
Russia: Continued adjustments to a new reality
FOREX management
Hedged all USD cash costs for the first six months
Renegotiated FOREX denominated contracts
for equipment, rental and IT
4G
4G/LTE network sharing
~3,000 base stations in 36 regions
Substantial savings in construction costs
Acceleration of the availability of 4G/LTE services to Beeline customers
4G/LTE offering in 46
regions at YE14, +21 in 4Q14
Cost and asset efficiency program
Optimization
and increasing efficiencies of G&A, utilities, network maintenance, warehousing and site rental
11
VimpelCom
Focusing Loyalty
Empowering People
Connecting Globally
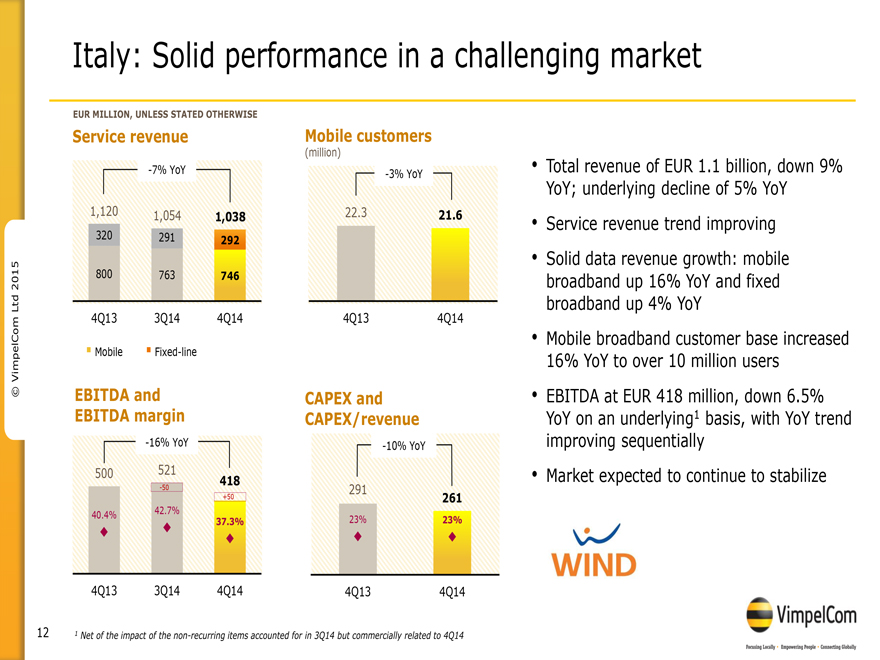
© VimpelCom Ltd 2015
Italy: Solid performance in a challenging market
EUR MILLION, UNLESS STATED
OTHERWISE
Service revenue Mobile customers
(million)
-7% YoY -3% YoY
1,120 1,054 1,038 22.3 21.6
320 291 292
800 763 746
4Q13 3Q14 4Q14 4Q13 4Q14
Mobile Fixed-line
EBITDA and CAPEX and
EBITDA margin CAPEX/revenue
-16% YoY -10% YoY
500 521 418
-50 291
+50 261
42.7%
40.4% 37.3% 23% 23%
4Q13 3Q14 4Q14 4Q13 4Q14
Total revenue of EUR 1.1 billion, down 9% YoY; underlying decline of
5% YoY
Service revenue trend improving
Solid data revenue growth: mobile
broadband up 16% YoY and fixed broadband up 4% YoY
Mobile broadband customer base increased 16% YoY to over 10 million users
EBITDA at EUR 418 million, down 6.5% YoY on an underlying1 basis, with YoY trend improving sequentially
Market expected to continue to stabilize
WIND
1 Net of the impact of the non-recurring items accounted for in 3Q14 but commercially related to 4Q14
12
VimpelCom
Focusing Loyalty
Empowering People
Connecting Globally
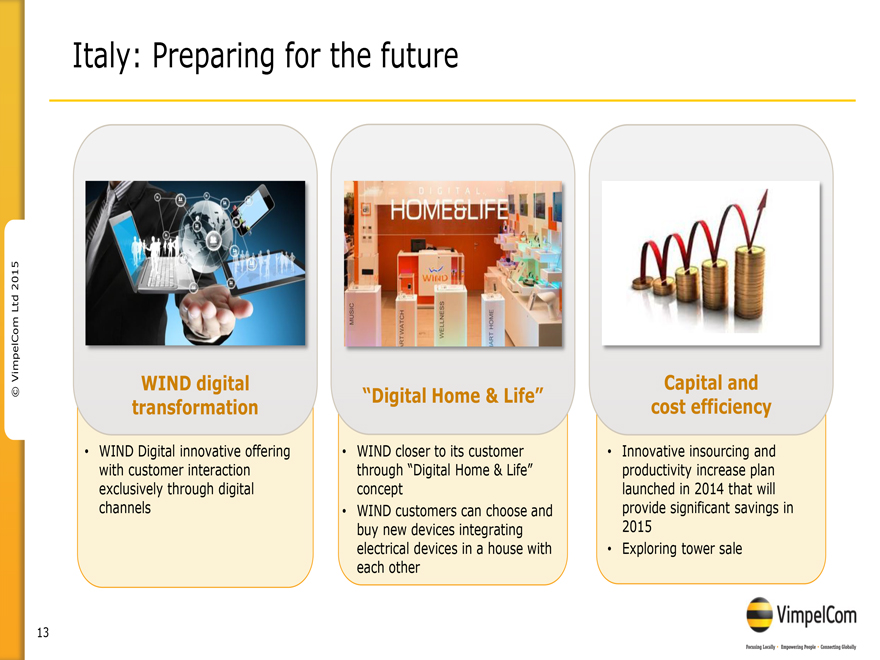
© VimpelCom Ltd 2015
Italy: Preparing for the future
WIND digital transformation
WIND Digital innovative offering with customer interaction exclusively through digital channels
DIGITAL
HOME&LIFE
“Digital Home & Life”
WIND closer to its customer through “Digital Home
& Life” concept
WIND customers can choose and buy new devices integrating electrical devices in a house with each other
Capital and cost efficiency
Innovative insourcing and productivity increase plan launched in
2014 that will provide significant savings in 2015
Exploring tower sale
13
VimpelCom
Focusing Loyalty
Empowering People
Connecting Globally
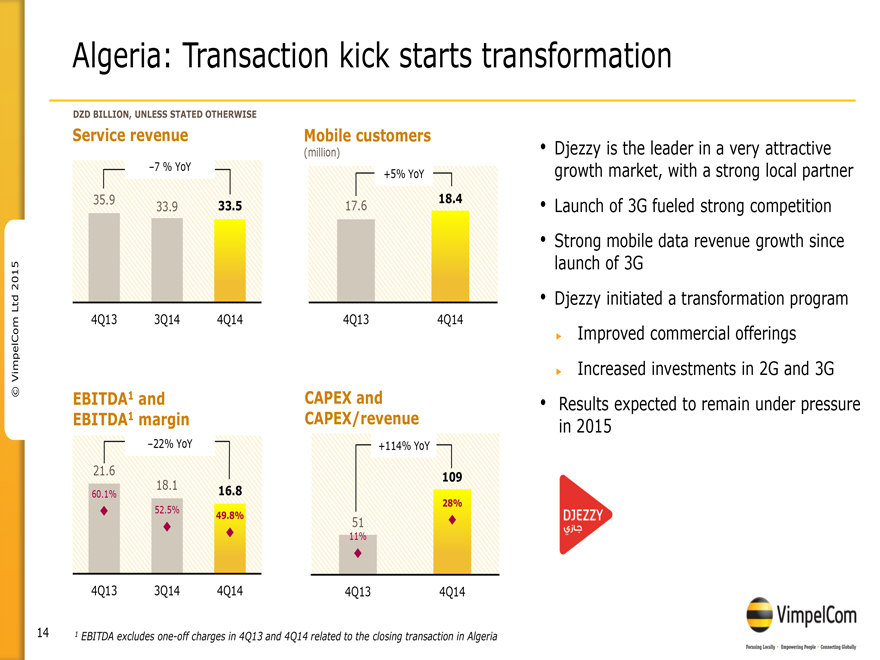
© VimpelCom Ltd 2015
Algeria: Transaction kick starts transformation
DZD BILLION, UNLESS STATED
OTHERWISE
Service revenue Mobile customers (million)
–7 % YoY +5% YoY
35.9 33.9 33.5 17.6 18.4
4Q13 3Q14 4Q14 4Q13 4Q14
EBITDA1 and CAPEX and
EBITDA1 margin CAPEX/revenue
–22% YoY +114% YoY
21.6 109
60.1% 18.1 16.8
28%
52.5% 49.8% 51
11%
4Q13 3Q14 4Q14 4Q13 4Q14
Djezzy is the leader in a very attractive growth market, with a
strong local partner
Launch of 3G fueled strong competition
Strong mobile
data revenue growth since launch of 3G
Djezzy initiated a transformation program
Improved commercial offerings
Increased investments in 2G and 3G
Results expected to remain under pressure in 2015
DJEZZY
1 EBITDA excludes one-off charges in 4Q13 and 4Q14 related to the closing transaction in Algeria
14
VimpelCom
Focusing Loyalty
Empowering People
Connecting Globally
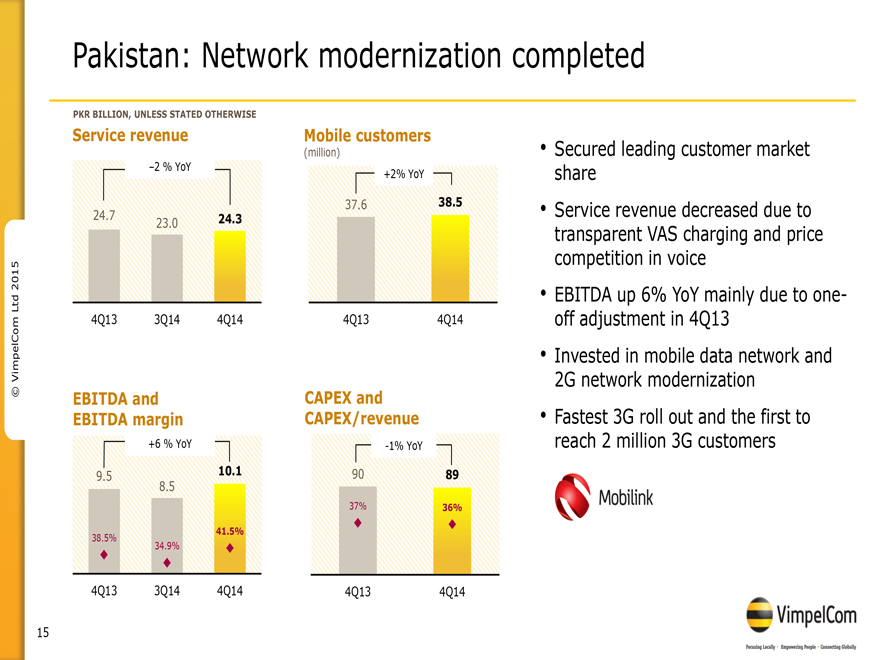
© VimpelCom Ltd 2015
Pakistan: Network modernization completed
PKR BILLION, UNLESS STATED
OTHERWISE
Service revenue Mobile customers (million)
–2 % YoY +2% YoY
37.6 38.5
24.7 23.0 24.3
4Q13 3Q14 4Q14 4Q13 4Q14
EBITDA and CAPEX and
EBITDA margin CAPEX/revenue
+6 % YoY -1% YoY
9.5 10.1 90 89
8.5
37% 36%
38.5% 41.5%
34.9%
4Q13 3Q14 4Q14 4Q13 4Q14
Secured leading customer market share
Service revenue decreased due to transparent VAS
charging and price competition in voice
EBITDA up 6% YoY mainly due to one-off adjustment in 4Q13
Invested in mobile data network and 2G network modernization
Fastest 3G roll out and the first
to reach 2 million 3G customers
Mobilink
15
VimpelCom
Focusing Loyalty
Empowering People
Connecting Globally
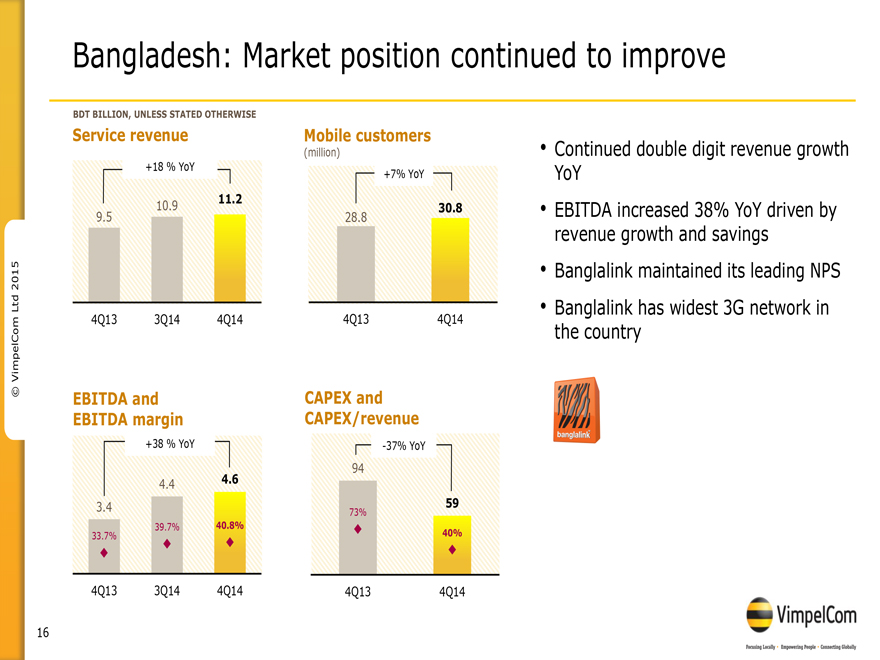
© VimpelCom Ltd 2015
Bangladesh: Market position continued to improve
BDT BILLION, UNLESS STATED
OTHERWISE
Service revenue Mobile customers (million)
+18 % YoY +7% YoY
11.2
10.9 30.8
9.5 28.8
4Q13 3Q14 4Q14 4Q13 4Q14
EBITDA and CAPEX and
EBITDA margin CAPEX/revenue
+38 % YoY -37% YoY
94
4.4 4.6
3.4 73% 59
39.7% 40.8%
33.7% 40%
4Q13 3Q14 4Q14 4Q13 4Q14
Continued double digit revenue growth YoY
EBITDA increased 38% YoY driven by revenue growth and savings
Banglalink maintained its
leading NPS
Banglalink has widest 3G network in the country
banhlalink
16
VimpelCom
Focusing Loyalty
Empowering People
Connecting Globally
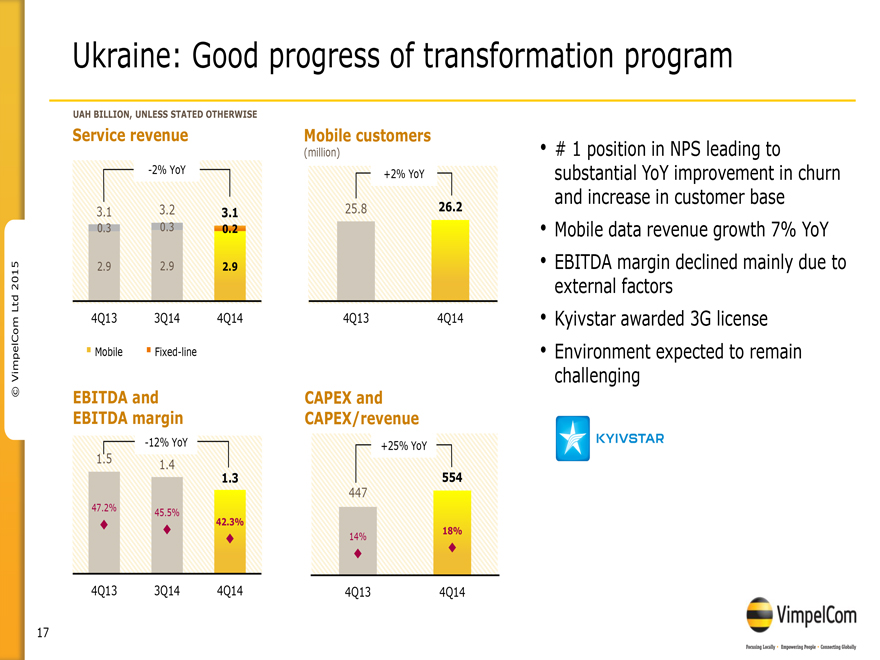
© VimpelCom Ltd 2015
Ukraine: Good progress of transformation program
UAH BILLION, UNLESS STATED
OTHERWISE
Service revenue Mobile customers (million)
-2% YoY +2% YoY
3.1 3.2 3.1 25.8 26.2
0.3 0.3 0.2
2.9 2.9 2.9
4Q13 3Q14 4Q14 4Q13 4Q14
Mobile Fixed-line
EBITDA and CAPEX and
EBITDA margin CAPEX/revenue
-12% YoY +25% YoY
1.5 1.4
1.3 554
447
47.2% 45.5%
42.3%
14% 18%
4Q13 3Q14 4Q14 4Q13 4Q14
# 1 position in NPS leading to substantial YoY improvement in churn
and increase in customer base
Mobile data revenue growth 7% YoY
EBITDA margin
declined mainly due to external factors
Kyivstar awarded 3G license
Environment expected to remain challenging
KYIVSTAR
17
VimpelCom
Focusing Loyalty
Empowering People
Connecting Globally

© VimpelCom Ltd 2015
CIS1: Continued solid results
USD MILLION, UNLESS STATED OTHERWISE
Service revenue Mobile customers (million)
Reported Organic +4% -4% YoY YoY
+4% YoY
497 494 475 25.4 26.5
42 42 41
455 452 434
4Q13 3Q14 4Q14 4Q13 4Q14
Mobile Fixed-line
EBITDA2 and CAPEX and
EBITDA2 margin CAPEX/revenue
Reported +40% YoY +81% YoY
Organic +52% YoY
254 121
210
150 51.2%
44.0% 62 25%
30.0% 12%
4Q13 3Q14 4Q14 4Q13 4Q14
Increased YoY market shares in 5 countries
Mobile service revenue increased organically 4% YoY due to strong growth in Uzbekistan and solid growth in Kazakhstan
Mobile data revenue growth of 24% YoY
Mobile customers increased by 1.1 million YoY, growing
in all operations
EBITDA impacted by one-off charges. Underlying organic growth 3% YoY; EBITDA margin excluding one-off charges would have been 48.8%
1 This segment includes our operations in Kazakhstan, Uzbekistan, Armenia, Kyrgyzstan, Tajikistan and Georgia
2 EBITDA, EBITDA Margin and CAPEX for 4Q13 include USD 72 million as a result of fixed assets write off and accounted as operating expenses
18
VimpelCom
Focusing Loyalty
Empowering People
Connecting Globally

© VimpelCom Ltd 2015
Financial Highlights
19
VimpelCom
Focusing Loyalty
Empowering People
Connecting Globally
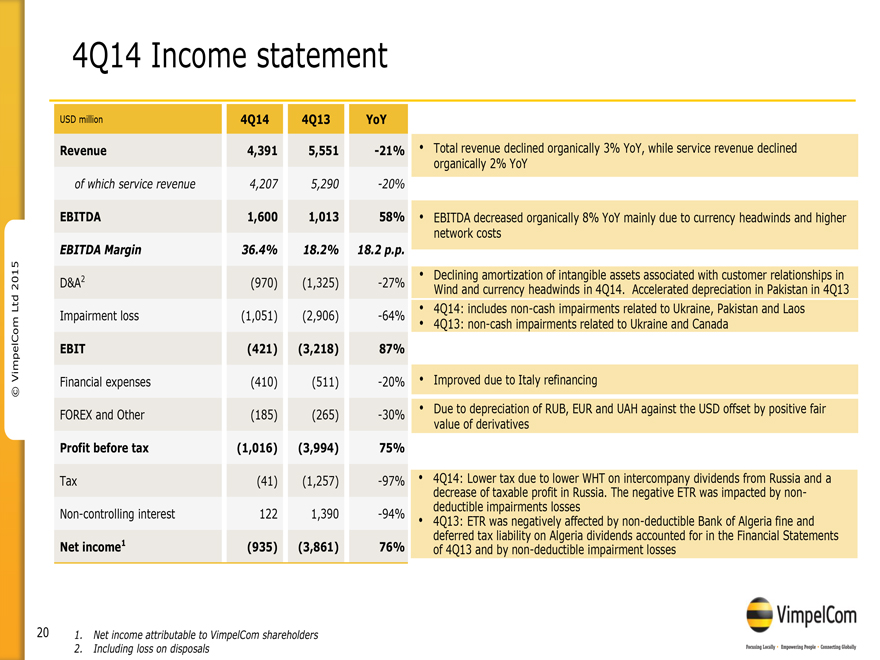
© VimpelCom Ltd 2015
4Q14 Income statement
USD million 4Q14 4Q13 YoY
Revenue 4,391 5,551 -21%
of which service revenue 4,207 5,290 -20%
EBITDA 1,600 1,013 58%
EBITDA Margin 36.4% 18.2% 18.2 p.p.
D&A2 (970) (1,325) -27%
Impairment loss (1,051) (2,906) -64%
EBIT (421) (3,218) 87%
Financial expenses (410) (511) -20%
FOREX and Other (185) (265) -30%
Profit before tax (1,016) (3,994) 75%
Tax (41) (1,257) -97%
Non-controlling interest 122 1,390 -94%
Net income1 (935) (3,861) 76%
Total revenue declined organically 3% YoY, while service revenue
declined organically 2% YoY
EBITDA decreased organically 8% YoY mainly due to currency headwinds and higher network costs
Declining amortization of intangible assets associated with customer relationships in Wind and currency headwinds in 4Q14. Accelerated depreciation in Pakistan in 4Q13
4Q14: includes non-cash impairments related to Ukraine, Pakistan and Laos
4Q13: non-cash
impairments related to Ukraine and Canada
Improved due to Italy refinancing
Due to depreciation of RUB, EUR and UAH against the USD offset by positive fair value of derivatives
4Q14: Lower tax due to lower WHT on intercompany dividends from Russia and a decrease of taxable profit in Russia. The negative ETR was impacted by non-deductible impairments
losses
4Q13: ETR was negatively affected by non-deductible Bank of Algeria fine and deferred tax liability on Algeria dividends accounted for in the Financial
Statements of 4Q13 and by non-deductible impairment losses
1. Net income attributable to VimpelCom shareholders
2. Including loss on disposals
20
VimpelCom
Focusing Loyalty
Empowering People
Connecting Globally
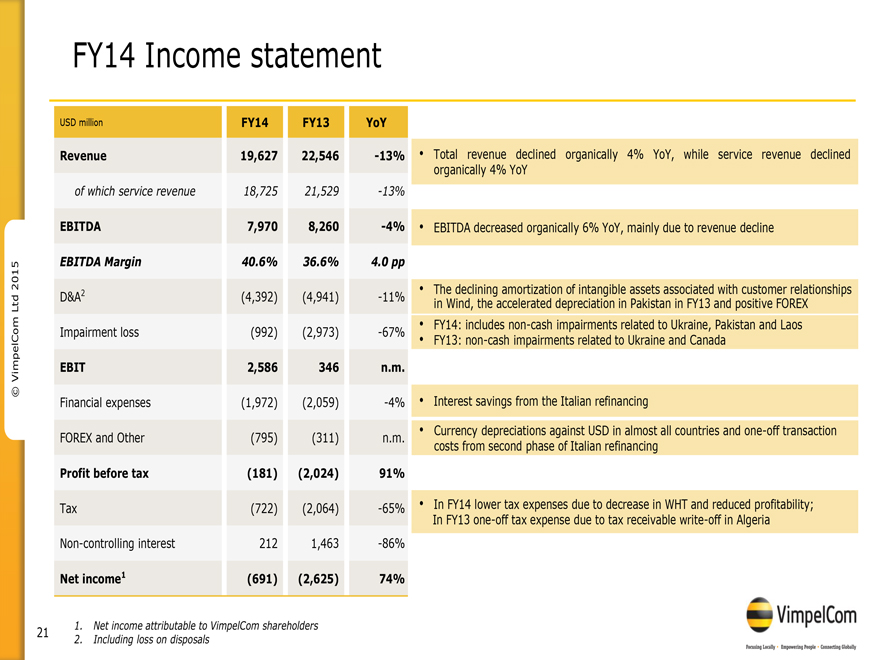
© VimpelCom Ltd 2015
FY14 Income statement
USD million FY14 FY13 YoY
Revenue 19,627 22,546 -13%
of which service revenue 18,725 21,529 -13%
EBITDA 7,970 8,260 -4%
EBITDA Margin 40.6% 36.6% 4.0 pp
D&A2 (4,392) (4,941) -11%
Impairment loss (992) (2,973) -67%
EBIT 2,586 346 n.m.
Financial expenses (1,972) (2,059) -4%
FOREX and Other (795) (311) n.m.
Profit before tax (181) (2,024) 91%
Tax (722) (2,064) -65%
Non-controlling interest 212 1,463 -86%
Net income1 (691) (2,625) 74%
Total revenue declined organically 4% YoY, while service revenue
declined organically 4% YoY
EBITDA decreased organically 6% YoY, mainly due to revenue decline
The declining amortization of intangible assets associated with customer relationships in Wind, the accelerated depreciation in Pakistan in FY13 and positive FOREX
FY14: includes non-cash impairments related to Ukraine, Pakistan and Laos
FY13: non-cash
impairments related to Ukraine and Canada
Interest savings from the Italian refinancing
Currency depreciations against USD in almost all countries and one-off transaction costs from second phase of Italian refinancing
In FY14 lower tax expenses due to decrease in WHT and reduced profitability; In FY13 one-off tax expense due to tax receivable write-off in Algeria
1. Net income attributable to VimpelCom shareholders
2. Including loss on disposals
21
VimpelCom
Focusing Loyalty
Empowering People
Connecting Globally
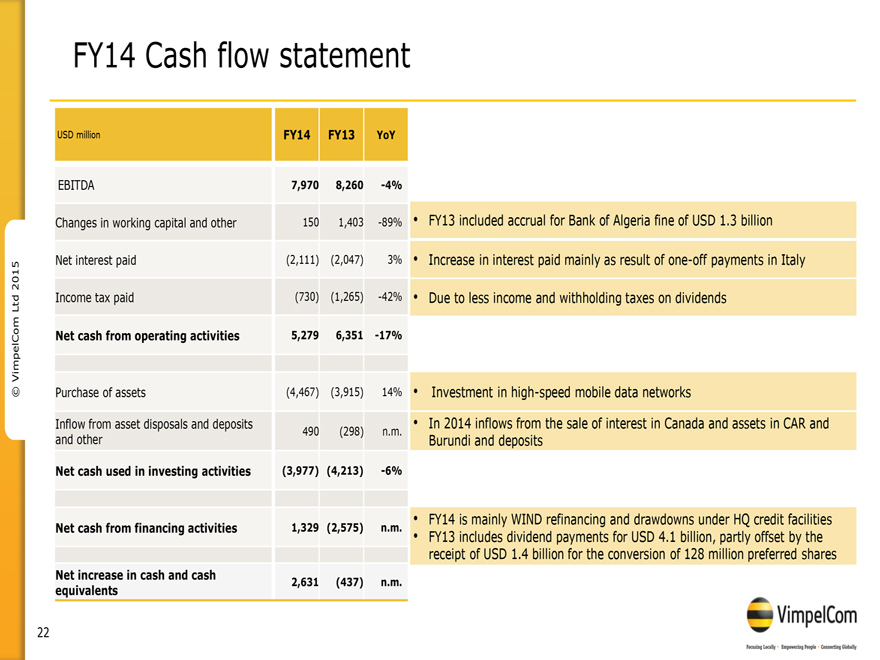
© VimpelCom Ltd 2015
FY14 Cash flow statement
USD million FY14 FY13 YoY
EBITDA 7,970 8,260 -4%
Changes in working capital and other 150 1,403 -89%
Net interest paid (2,111) (2,047) 3%
Income tax paid (730) (1,265) -42%
Net cash from operating activities 5,279 6,351 -17%
Purchase of assets (4,467) (3,915) 14%
Inflow from asset disposals and deposits 490 (298) n.m.
and other
Net cash used in investing activities (3,977) (4,213) -6%
Net cash from financing activities
1,329 (2,575) n.m.
Net increase in cash and cash 2,631 (437) n.m.
equivalents
FY13 included accrual for Bank of Algeria fine of USD 1.3 billion
Increase in
interest paid mainly as result of one-off payments in Italy
Due to less income and withholding taxes on dividends
Investment in high-speed mobile data networks
In 2014 inflows from the sale of interest in
Canada and assets in CAR and Burundi and deposits
FY14 is mainly WIND refinancing and drawdowns under HQ credit facilities
FY13 includes dividend payments for USD 4.1 billion, partly offset by the receipt of USD 1.4 billion for the conversion of 128 million preferred shares
22
VimpelCom
Focusing Loyalty
Empowering People
Connecting Globally

© VimpelCom Ltd 2015
Capital Structure Optimization
23
VimpelCom
Focusing Loyalty
Empowering People
Connecting Globally
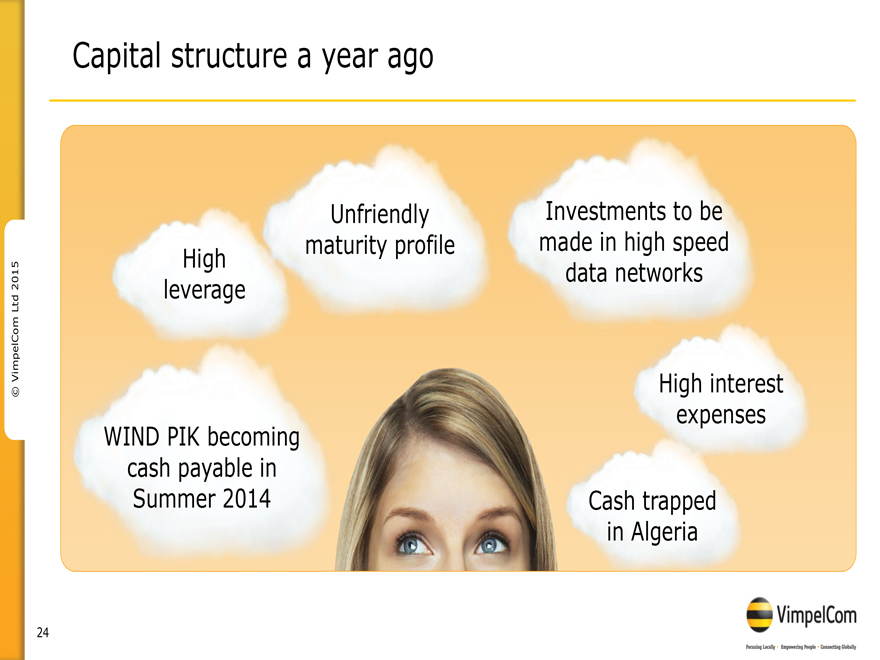
© VimpelCom Ltd 2015
Capital structure a year ago
WIND PIK becoming cash payable in
Summer 2014
High leverage
Unfriendly maturity profile
Investments to be made in high speed data networks
High interest expenses
Cash trapped in Algeria
24
VimpelCom
Focusing Loyalty
Empowering People
Connecting Globally
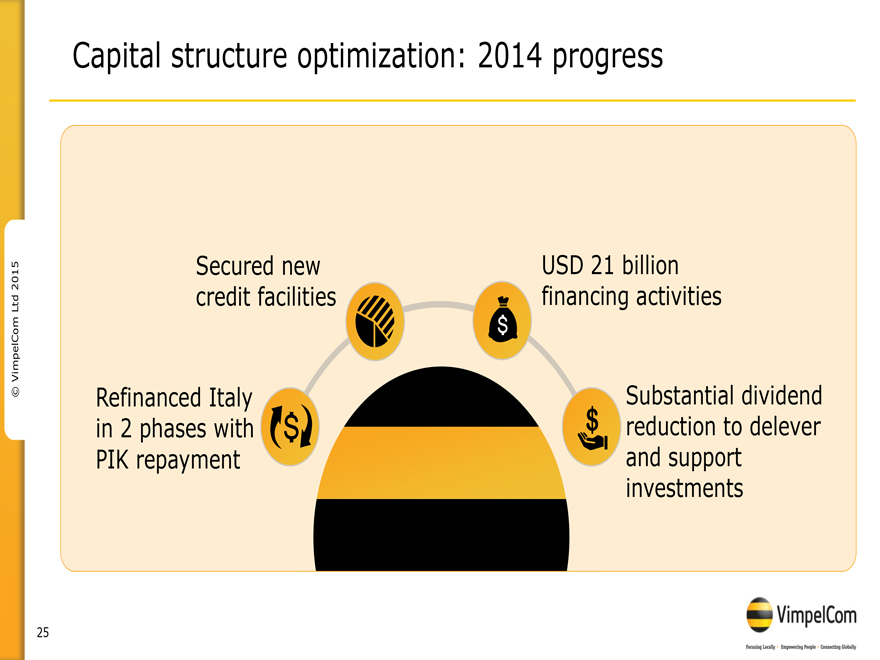
C VimpelCom Ltd 2015
Capital structure optimization: 2014 progress
Refinanced Italy in 2 phases
with PIK repayment
$$$
Secured new credit facilities
USD 21 billion financing activities
Substantial dividend reduction to delever and support
investments
25
VimpelCom
Focusing Locally
Empowering People
Connecting Globally
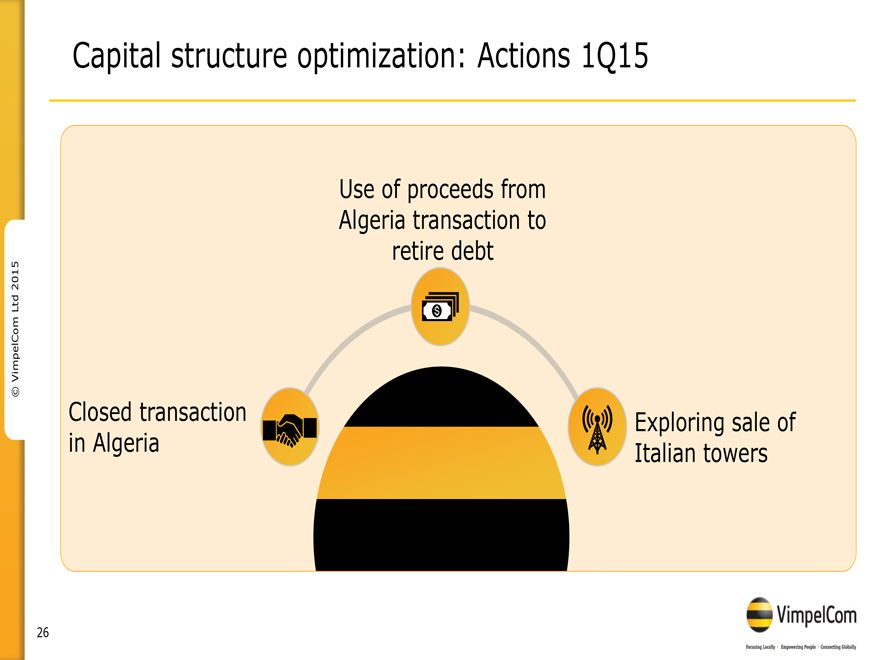
C VimpelCom Ltd 2015
Capital structure optimization: Actions 1Q15
Closed transaction in Algeria
Use of proceeds from Algeria transaction to retire debt
$
Exploring sale of Italian towers
26
VimpelCom
Focusing Locally
Empowering People
Connecting Globally

C VimpelCom Ltd 2015
Capital structure optimization:
Significantly improved debt maturity schedule
As at December 31, 2014 (in USD billion)
Group debt maturity schedule
2.2 2.0 2.7 1.9 3.2 5.8 6.0 1.5 1.1
2015 2016 2017 2018 2019 2020 2021 2022
>2022
27
VimpelCom
Focusing Locally
Empowering People
Connecting Globally
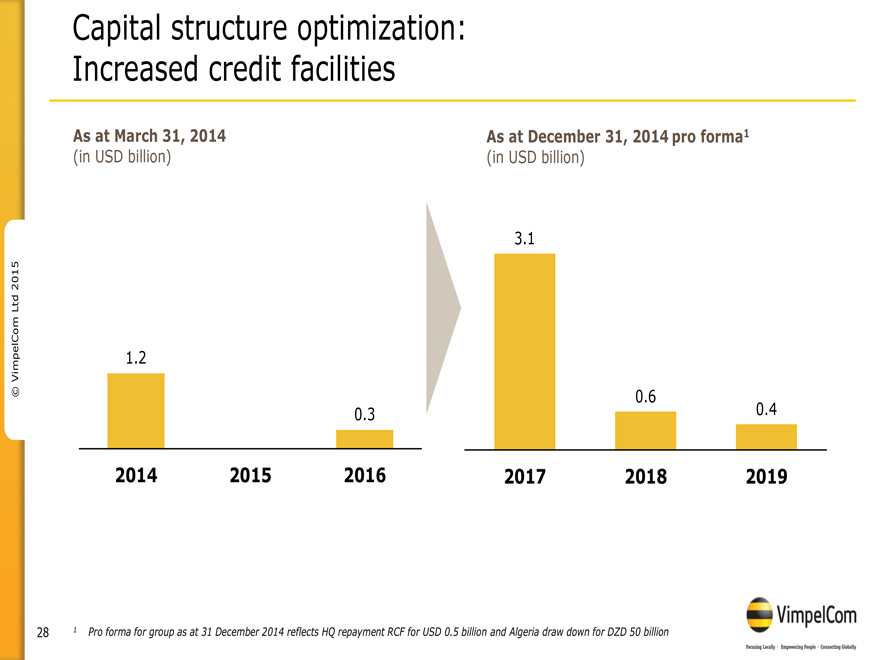
C VimpelCom Ltd 2015
Capital structure optimization: Increased credit facilities
As at March 31,
2014
(in USD billion)
1.2 0.3
2014 2015 2016
As at December 31, 2014 pro forma1
(in USD billion)
3.1 0.6 0.4
2017 2018 2019
1 Pro forma for group as at 31 December 2014 reflects HQ repayment RCF for USD
0.5 billion and Algeria draw down for DZD 50 billion
28
VimpelCom
Focusing Locally
Empowering People
Connecting Globally
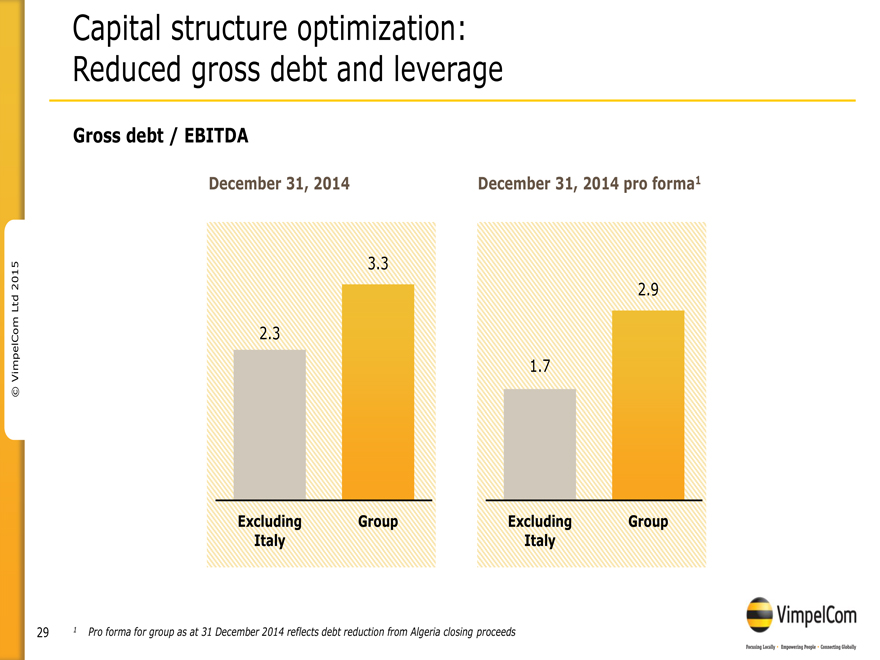
C VimpelCom Ltd 2015
Capital structure optimization: Reduced gross debt and leverage
Gross debt /
EBITDA
December 31, 2014
2.3 3.3
Excluding Italy
Group
December 31, 2014 pro forma1
1.7 2.9
Excluding Italy
Group
1 Pro forma for group as at 31 December 2014 reflects debt reduction from Algeria closing proceeds
29
VimpelCom
Focusing Locally
Empowering People
Connecting Globally
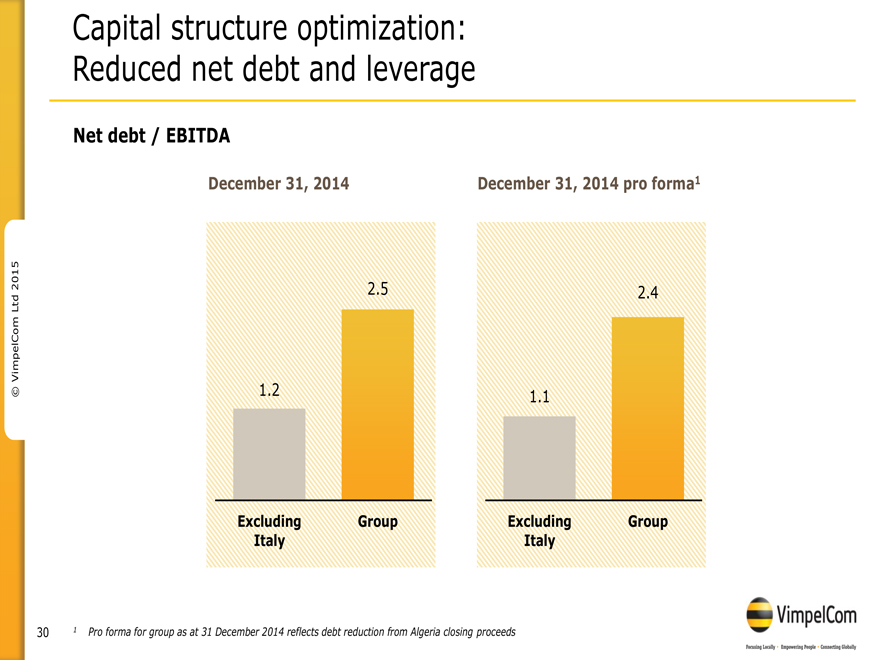
C VimpelCom Ltd 2015
Capital structure optimization: Reduced net debt and leverage
Net debt /
EBITDA
December 31, 2014
1.2 2.5
Excluding Italy
Group
December 31, 2014 pro forma1
1.1 2.4
Excluding Italy
Group
1 Pro forma for group as at 31 December 2014 reflects debt reduction from Algeria closing proceeds
30
VimpelCom
Focusing Locally
Empowering People
Connecting Globally
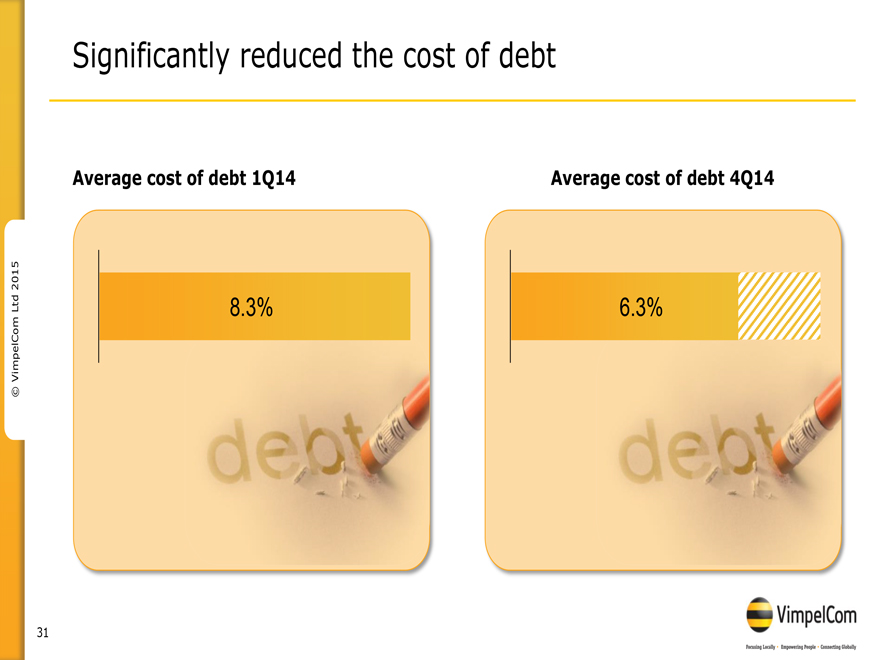
C VimpelCom Ltd 2015
Significantly reduced the cost of debt
Average cost of debt 1Q14
8.3%
debt
Average cost of debt 4Q14
6.3%
debt
31
VimpelCom
Focusing Locally
Empowering People
Connecting Globally
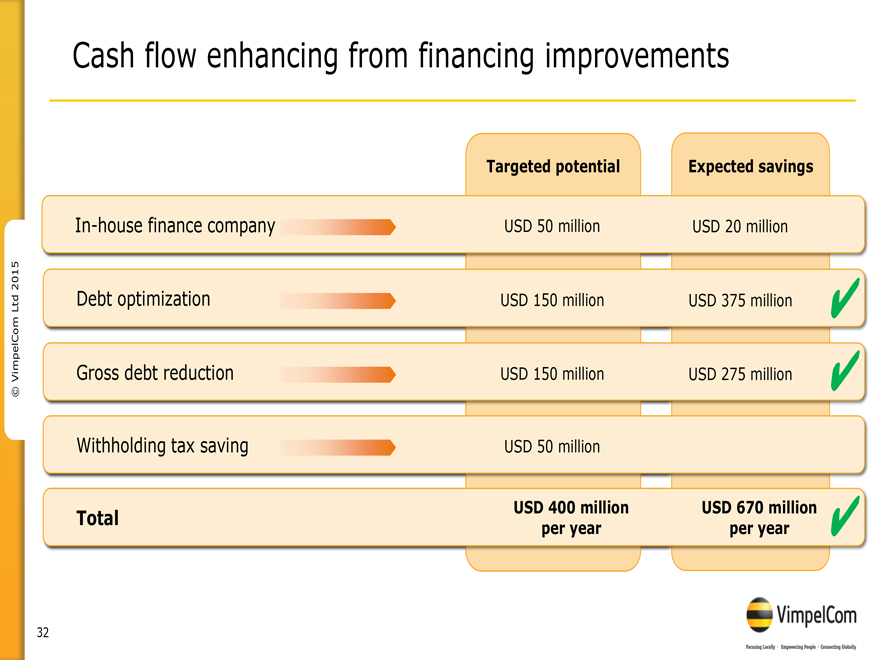
C VimpelCom Ltd 2015
Cash
flow enhancing from financing improvements
In-house finance company
Debt
optimization
Gross debt reduction
Withholding tax saving
Total
Targeted potential Expected savings
USD 50 million USD 150 million USD 150 million USD 50 million USD 400 million per year
USD 20
million USD 375 million USD 275 million USD 670 million per year
32
VimpelCom
Focusing Locally
Empowering People
Connecting Globally
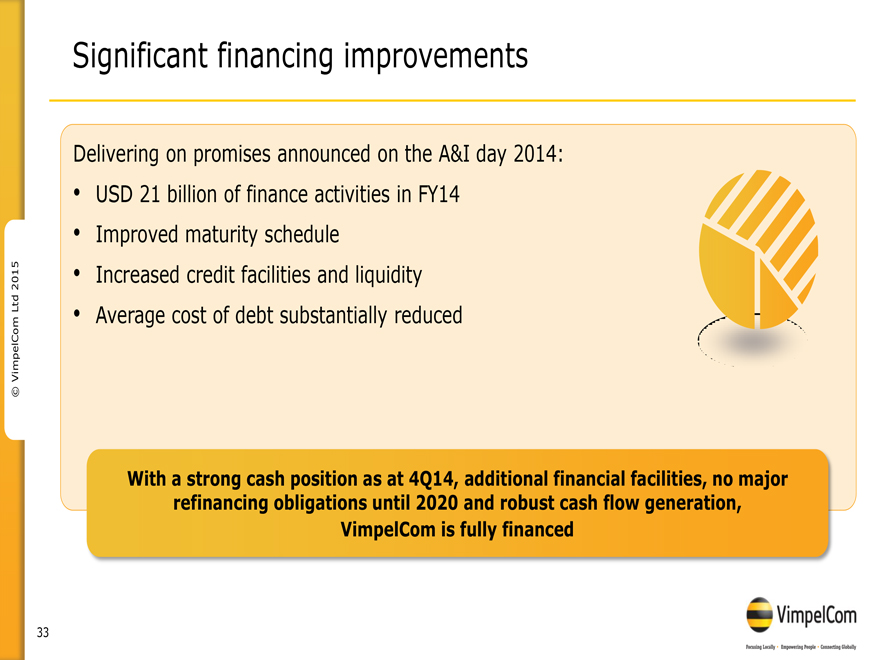
C VimpelCom Ltd 2015
Significant financing improvements
Delivering on promises announced on the
A&I day 2014:
USD 21 billion of finance activities in FY14
Improved
maturity schedule
Increased credit facilities and liquidity
Average cost of
debt substantially reduced
With a strong cash position as at 4Q14, additional financial facilities, no major refinancing obligations until 2020 and robust cash
flow generation, VimpelCom is fully financed
33
VimpelCom
Focusing Locally
Empowering People
Connecting Globally
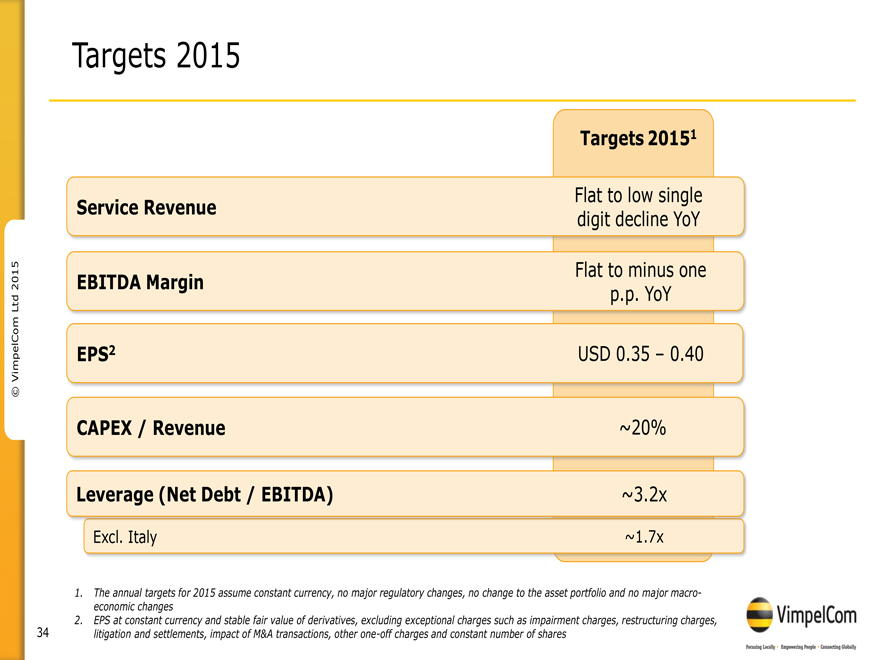
C VimpelCom Ltd 2015
Targets 2015
Service Revenue
EBITDA Margin
EPS2
CAPEX / Revenue
Leverage (Net Debt / EBITDA)
Excl. Italy
Targets 20151
Flat to low single digit decline YoY
Flat to minus one p.p. YoY
USD 0.35 – 0.40
~20%
~3.2x
~1.7x
1. The annual targets for 2015 assume constant currency, no major regulatory changes, no change to the asset portfolio and no major macro-economic changes
2. EPS at constant currency and stable fair value of derivatives, excluding exceptional charges such as impairment charges, restructuring charges, litigation and settlements,
impact of M&A transactions, other one-off charges and constant number of shares
34
VimpelCom
Focusing Locally
Empowering People
Connecting Globally

C VimpelCom Ltd 2015
Conclusion
35
VimpelCom
Focusing Locally
Empowering People
Connecting Globally

C VimpelCom Ltd 2015
Conclusion
Delivered on targets in a challenging environment
Reported results impacted by currency headwinds
Closed Algeria
Significantly improved capital structure
Successful investments in high speed networks
Building a more customer centric organization
Solid mobile customer growth
36
VimpelCom
Focusing Locally
Empowering People
Connecting Globally

C VimpelCom Ltd 2015
Q&A
37
VimpelCom
Focusing Locally
Empowering People
Connecting Globally

© VimpelCom Ltd 2015
VimpelCom Analyst & Investor site visit
Georgia and Kazakhstan
March 31, 2015
Tbilisi, Georgia
Presentations by Head of BU CIS and local management
April 1, 2015
Almaty, Kazakhstan
Presentations by local management
VimpelCom
A&l Site Visit
Georgia
Kazakhstan
38
VimpelCom
Focusing Loyalty
Empowering People
Connecting Globally
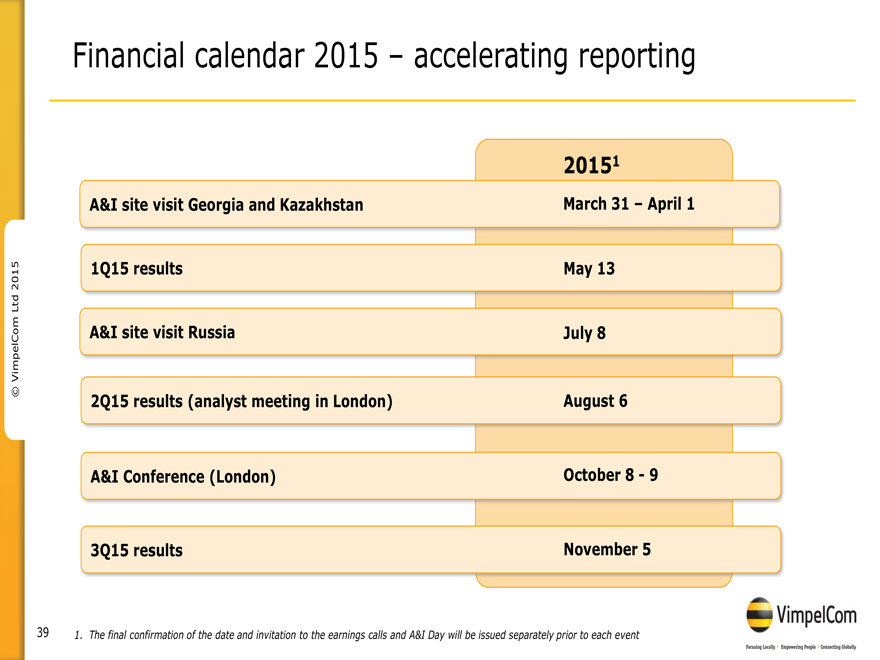
© VimpelCom Ltd 2015
Financial calendar 2015 - accelerating reporting
20151
A&I site visit Georgia and Kazakhstan March 31 - April 1
1Q15 results
May 13 A&I site visit Russia July 8
2Q15 results (analyst meeting in London) August 6
A&I Conference (London) October 8 - 9
3Q15 results November 5
1. The final confirmation of the date and invitation to the earnings calls and A&I Day will be issued separately prior to each event
39
VimpelCom
Focusing Loyalty
Empowering People
Connecting Globally
© VimpelCom Ltd 2015
Further information
Investor Relations
Claude Debussylaan 88
1082 MD Amsterdam
The Netherlands
T: +31 20 79 77 234
E: [email protected]
Visit our awards winning website
www.vimpelcom.com
Install VimpelCom’s App
iPadApp
40
VimpelCom
Focusing Loyalty
Empowering People
Connecting Globally

© VimpelCom Ltd 2015
Thank you!
41
VimpelCom
Focusing Loyalty
Empowering People
Connecting Globally

© VimpelCom Ltd 2015
Appendices
42
VimpelCom
Focusing Loyalty
Empowering People
Connecting Globally
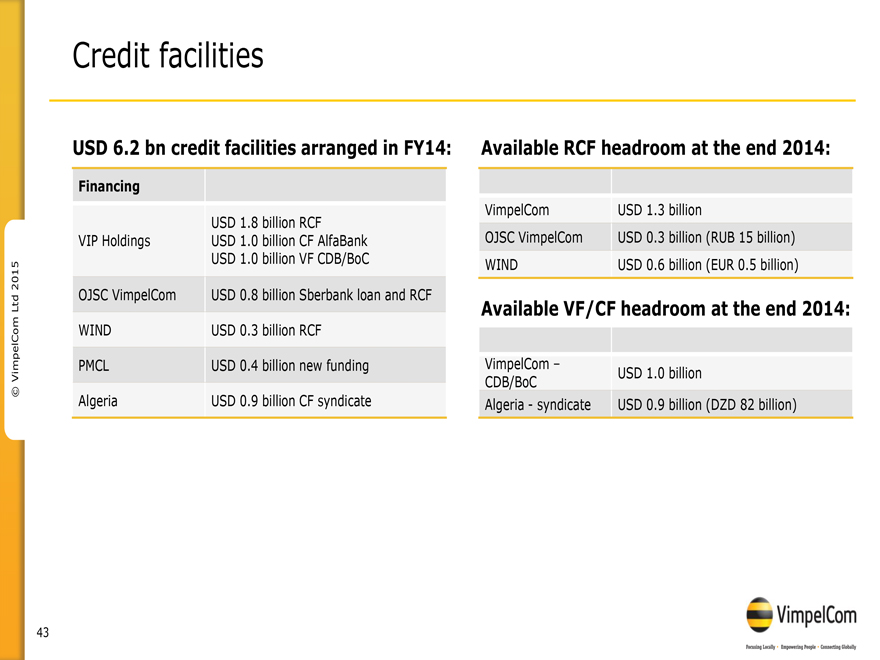
© VimpelCom Ltd 2015
Credit facilities
USD 6.2 bn credit facilities arranged in FY14:
Financing
USD 1.8 billion RCF
VIP Holdings USD 1.0 billion CF AlfaBank
USD 1.0 billion VF CDB/BoC
OJSC VimpelCom USD 0.8 billion Sberbank loan and RCF
WIND USD 0.3 billion RCF
PMCL USD 0.4 billion new funding
Algeria USD 0.9 billion CF syndicate
Available RCF headroom at the end 2014:
VimpelCom USD 1.3 billion
OJSC VimpelCom USD 0.3 billion (RUB 15 billion)
WIND USD 0.6 billion (EUR 0.5 billion)
Available VF/CF headroom at the end 2014:
VimpelCom - USD 1.0 billion
CDB/BoC
Algeria - syndicate USD 0.9 billion (DZD 82 billion)
43
VimpelCom
Focusing Loyalty
Empowering People
Connecting Globally
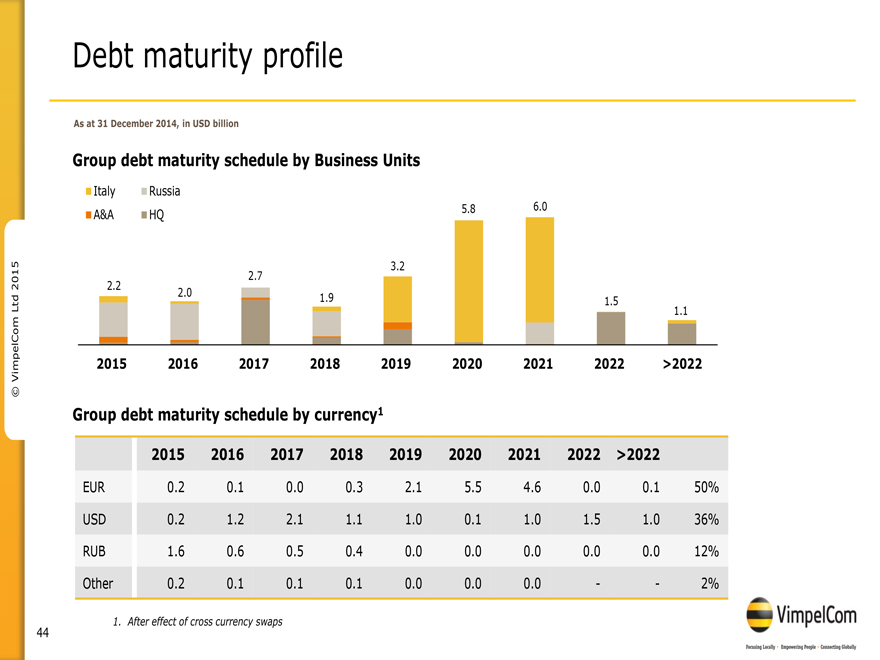
© VimpelCom Ltd 2015
Debt maturity profile
As at 31 December 2014, in USD billion
Group debt maturity schedule by Business Units
Italy Russia
A&A HQ
5.8 6.0
3.2
2.7
2.2
2.0 1.9 1.5
1.1
2015 2016 2017 2018 2019 2020 2021 2022 >2022
Group debt maturity schedule by currency1
2015 2016 2017 2018 2019 2020 2021 2022 >2022
EUR 0.2 0.1 0.0 0.3 2.1 5.5 4.6 0.0 0.1 50%
USD 0.2 1.2 2.1 1.1 1.0 0.1 1.0
1.5 1.0 36%
RUB 1.6 0.6 0.5 0.4 0.0 0.0 0.0 0.0 0.0 12%
Other 0.2 0.1 0.1 0.1
0.0 0.0 0.0 - - 2%
1. After effect of cross currency swaps
44
VimpelCom
Focusing Loyalty
Empowering People
Connecting Globally
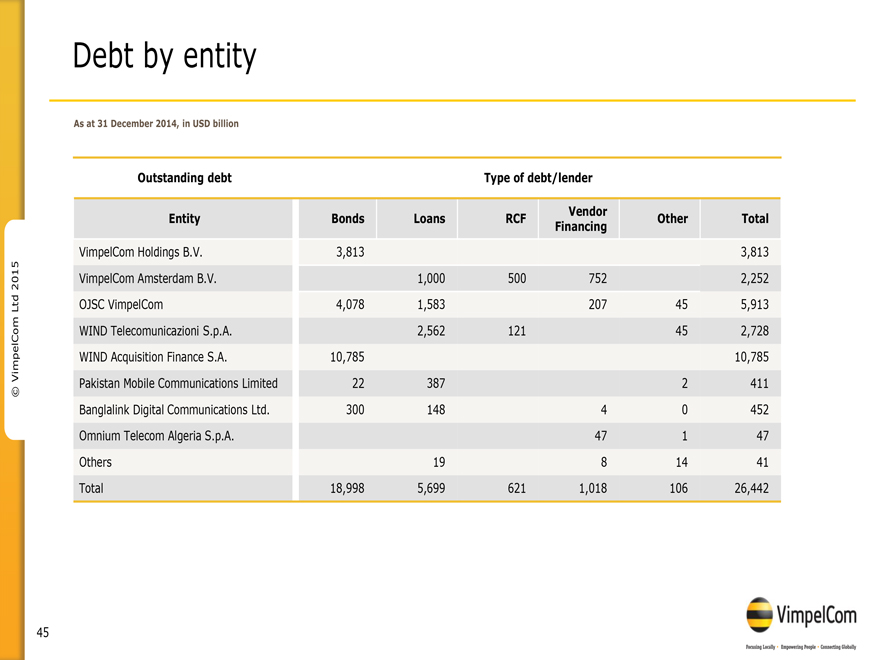
© VimpelCom Ltd 2015
Debt by entity
As at 31 December 2014, in USD billion
Outstanding debt Type of debt/lender
Entity Bonds Loans RCF Vendor Financing Other Total
VimpelCom Holdings B.V. 3,813 3,813
VimpelCom Amsterdam B.V. 1,000 500 752
2,252
OJSC VimpelCom 4,078 1,583 207 45 5,913
WIND Telecomunicazioni S.p.A.
2,562 121 45 2,728
WIND Acquisition Finance S.A. 10,785 10,785
Pakistan
Mobile Communications Limited 22 387 2 411
Banglalink Digital Communications Ltd. 300 148 4 0 452
Omnium Telecom Algeria S.p.A. 47 1 47
Others 19 8 14 41
Total 18,998 5,699 621 1,018 106 26,442
45
VimpelCom
Focusing Loyalty
Empowering People
Connecting Globally
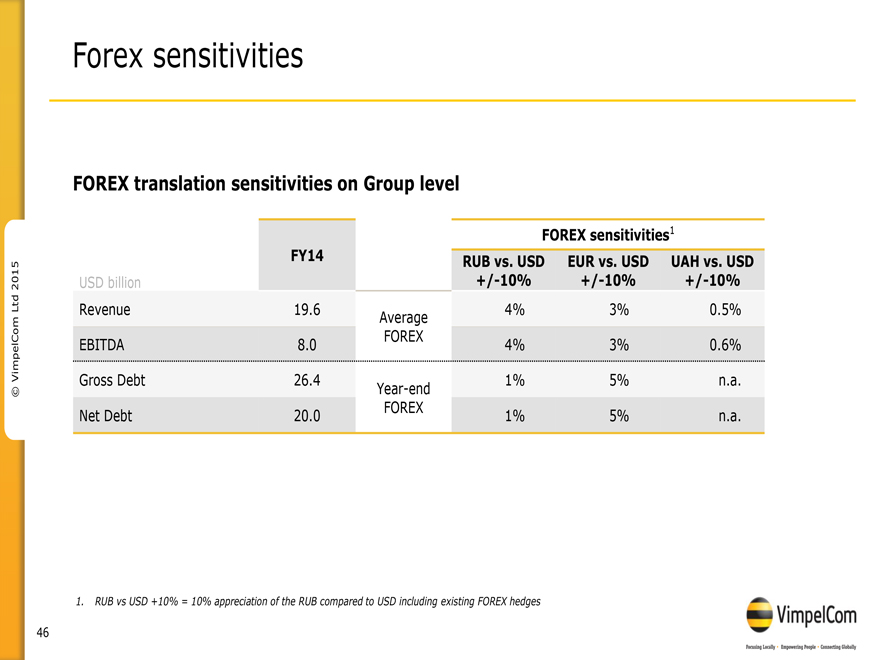
© VimpelCom Ltd 2015
Forex sensitivities
FOREX translation sensitivities on Group level
FOREX sensitivities1
FY14 RUB vs. USD EUR vs. USD UAH vs. USD
USD billion +/-10% +/-10% +/-10%
Revenue 19.6 Average 4% 3% 0.5%
FOREX
EBITDA 8.0 4% 3% 0.6%
Gross Debt 26.4 1% 5% n.a.
Year-end
FOREX
Net Debt 20.0 1% 5% n.a.
1. RUB vs USD +10% = 10% appreciation of the RUB compared to USD including existing FOREX hedges
46
VimpelCom
Focusing Loyalty
Empowering People
Connecting Globally
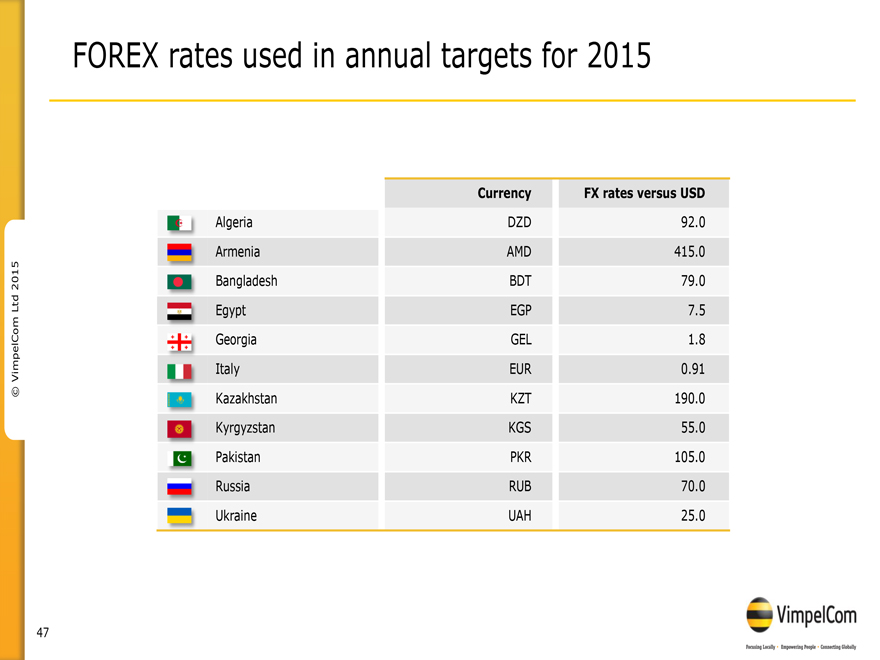
© VimpelCom Ltd 2015
FOREX rates used in annual targets for 2015
Currency FX rates versus USD
Algeria DZD 92.0
Armenia AMD 415.0
Bangladesh BDT 79.0
Egypt EGP 7.5
Georgia GEL 1.8
Italy EUR 0.91
Kazakhstan KZT 190.0
Kyrgyzstan KGS 55.0
Pakistan PKR 105.0
Russia RUB 70.0
Ukraine UAH 25.0
47
VimpelCom
Focusing Loyalty
Empowering People
Connecting Globally
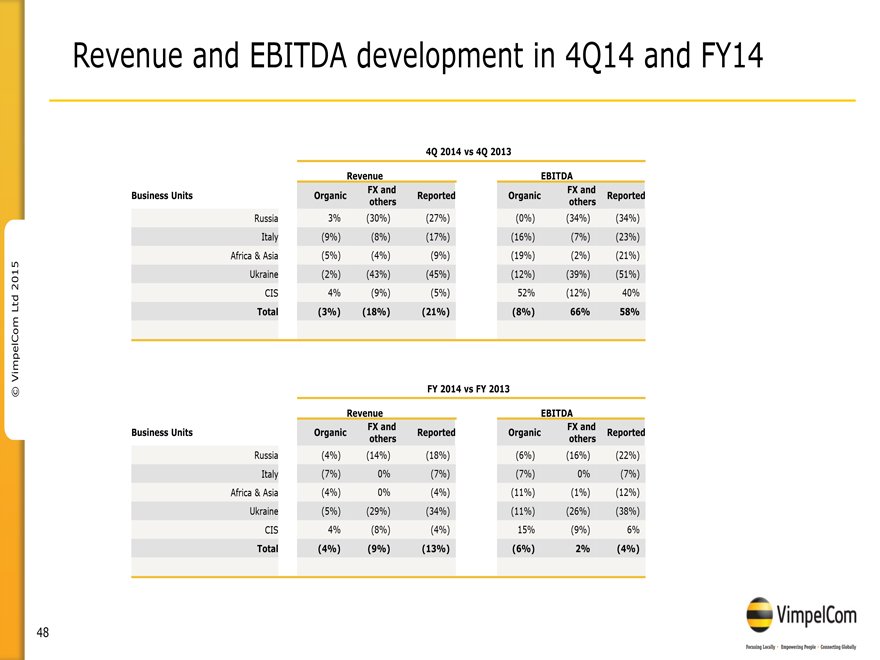
© VimpelCom Ltd 2015
Revenue and EBITDA development in 4Q14 and FY14
4Q 2014 vs 4Q 2013
Revenue EBITDA
Business Units Organic Reported Organic Reported
FX and others FX and others
Russia 3% (30%) (27%) (0%) (34%) (34%)
Italy (9%) (8%) (17%) (16%) (7%) (23%)
Africa & Asia (5%) (4%) (9%) (19%) (2%) (21%)
Ukraine (2%) (43%) (45%) (12%) (39%) (51%)
CIS 4% (9%) (5%) 52% (12%) 40%
Total (3%) (18%) (21%) (8%) 66% 58%
FY 2014 vs FY 2013
Revenue EBITDA
Business Units Organic Reported Organic Reported
FX and others FX and others
Russia (4%) (14%) (18%) (6%) (16%) (22%)
Italy (7%) 0% (7%) (7%) 0% (7%)
Africa & Asia (4%) 0% (4%) (11%) (1%) (12%)
Ukraine (5%) (29%) (34%) (11%) (26%) (38%)
CIS 4% (8%) (4%) 15% (9%) 6%
Total (4%) (9%) (13%) (6%) 2% (4%)
48
VimpelCom
Focusing Loyalty
Empowering People
Connecting Globally
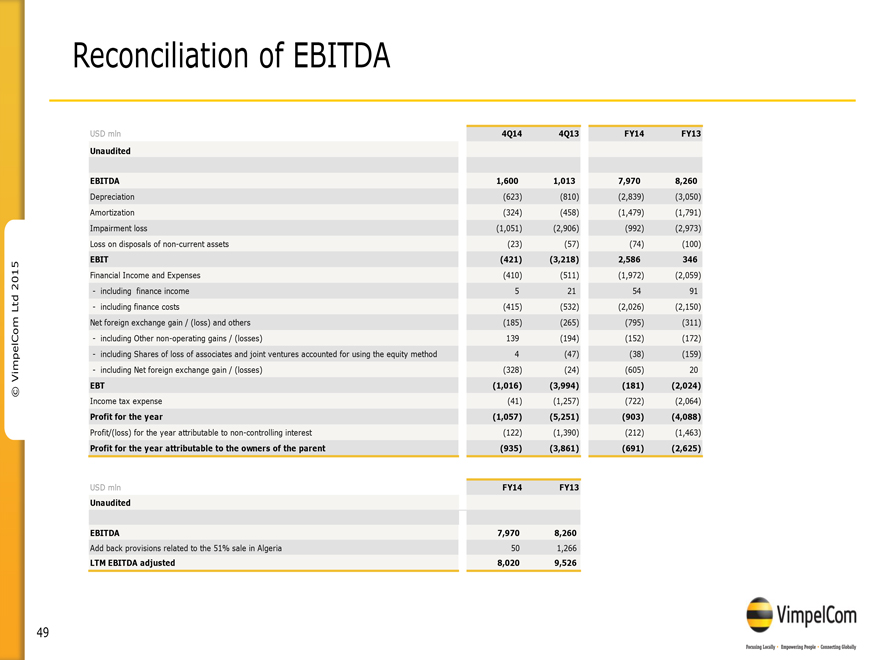
© VimpelCom Ltd 2015
Reconciliation of EBITDA
USD mln 4Q14 4Q13 FY14 FY13
Unaudited
EBITDA 1,600 1,013 7,970 8,260
Depreciation (623) (810) (2,839) (3,050)
Amortization (324) (458) (1,479) (1,791)
Impairment loss (1,051) (2,906) (992) (2,973)
Loss on disposals of non-current assets (23)
(57) (74) (100)
EBIT (421) (3,218) 2,586 346
Financial Income and Expenses
(410) (511) (1,972) (2,059)
- including finance income 5 21 54 91
- including
finance costs (415) (532) (2,026) (2,150)
Net foreign exchange gain / (loss) and others (185) (265) (795) (311)
- including Other non-operating gains / (losses) 139 (194) (152) (172)
- including Shares of
loss of associates and joint ventures accounted for using the equity method 4 (47) (38) (159)
- including Net foreign exchange gain / (losses) (328) (24) (605) 20
EBT (1,016) (3,994) (181) (2,024)
Income tax expense (41) (1,257) (722)
(2,064)
Profit for the year (1,057) (5,251) (903) (4,088)
Profit/(loss) for
the year attributable to non-controlling interest (122) (1,390) (212) (1,463)
Profit for the year attributable to the owners of the parent (935) (3,861) (691)
(2,625)
USD mln FY14 FY13
Unaudited
EBITDA 7,970 8,260
Add back provisions related to the 51% sale in Algeria 50 1,266
LTM EBITDA adjusted 8,020 9,526
49
VimpelCom
Focusing Loyalty
Empowering People
Connecting Globally
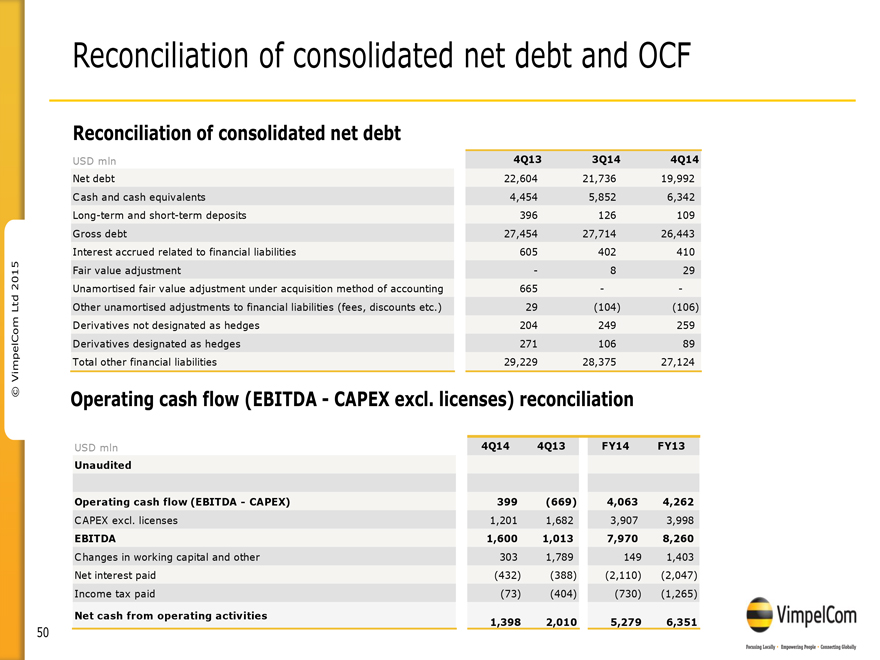
© VimpelCom Ltd 2015
Reconciliation of consolidated net debt and OCF
Reconciliation of
consolidated net debt
USD mln 4Q13 3Q14 4Q14
Net debt 22,604 21,736 19,992
Cash and cash equivalents 4,454 5,852 6,342
Long-term and short-term deposits
396 126 109
Gross debt 27,454 27,714 26,443
Interest accrued related to
financial liabilities 605 402 410
Fair value adjustment - 8 29
Unamortised
fair value adjustment under acquisition method of accounting 665 - -
Other unamortised adjustments to financial liabilities (fees, discounts etc.) 29 (104) (106)
Derivatives not designated as hedges 204 249 259
Derivatives designated as
hedges 271 106 89
Total other financial liabilities 29,229 28,375 27,124
Operating cash flow (EBITDA - CAPEX excl. licenses) reconciliation
USD mln
4Q14 4Q13 FY14 FY13
Unaudited
Operating cash flow (EBITDA - CAPEX)
399 (669) 4,063 4,262
CAPEX excl. licenses 1,201 1,682 3,907 3,998
EBITDA 1,600 1,013 7,970 8,260
Changs in working capital and other 303 1,789
149 1,403
Net interest paid (432) (388) (2,110) (2,047)
Income tax paid (73)
(404) (730) (1,265)
Net cash from operating activities 1,398 2,010 5,279 6,351
50
VimpelCom
Focusing Loyalty
Empowering People
Connecting Globally
VimpelCom Ltd.
index page
(in USD millions, unless stated otherwise, unaudited)
| Consolidated |
1Q12 | 2Q12 | 3Q12 | 4Q12 | 1Q13 | 2Q13 | 3Q13 | 4Q13 | 1Q14 | 2Q14 | 3Q14 | 4Q14 | FY12 | FY13 | FY14 | |||||||||||||||||||||||||||||||||||||||||||||
| Total operating revenue |
5,619 | 5,745 | 5,747 | 5,950 | 5,591 | 5,718 | 5,685 | 5,552 | 5,024 | 5,067 | 5,145 | 4,391 | 23,061 | 22,546 | 19,627 | |||||||||||||||||||||||||||||||||||||||||||||
| Service revenue |
5,436 | 5,534 | 5,547 | 5,605 | 5,313 | 5,449 | 5,477 | 5,290 | 4,810 | 4,861 | 4,847 | 4,207 | 22,122 | 21,531 | 18,725 | |||||||||||||||||||||||||||||||||||||||||||||
| EBITDA |
2,311 | 2,481 | 2,530 | 2,446 | 2,348 | 2,425 | 2,474 | 1,013 | 2,088 | 2,076 | 2,205 | 1,600 | 9,768 | 8,260 | 7,970 | |||||||||||||||||||||||||||||||||||||||||||||
| EBITDA margin (%) |
41.1 | % | 43.2 | % | 44.0 | % | 41.1 | % | 42.0 | % | 42.4 | % | 43.5 | % | 18.2 | % | 41.6 | % | 41.0 | % | 42.9 | % | 36.4 | % | 42.4 | % | 36.6 | % | 40.6 | % | ||||||||||||||||||||||||||||||
| EBIT |
1,015 | 1,192 | 1,255 | 709 | 1,107 | 1,224 | 1,233 | (3,218 | ) | 925 | 938 | 1,143 | (421 | ) | 4,171 | 346 | 2,586 | |||||||||||||||||||||||||||||||||||||||||||
| Profit/(Loss) before tax |
593 | 729 | 802 | 158 | 543 | 762 | 665 | (3,994 | ) | 246 | 479 | 110 | (1,016 | ) | 2,282 | (2,024 | ) | (181 | ) | |||||||||||||||||||||||||||||||||||||||||
| Net income/(loss) |
318 | 488 | 538 | 195 | 408 | 573 | 255 | (3,861 | ) | 39 | 100 | 104 | (935 | ) | 1,539 | (2,625 | ) | (691 | ) | |||||||||||||||||||||||||||||||||||||||||
| Capital expenditures (CAPEX) |
632 | 1,028 | 829 | 1,631 | 755 | 791 | 1,040 | 1,720 | 736 | 1,331 | 978 | 1,211 | 4,120 | 4,306 | 4,256 | |||||||||||||||||||||||||||||||||||||||||||||
| CAPEX excluding licenses |
632 | 1,028 | 829 | 1,631 | 595 | 791 | 930 | 1,682 | 726 | 1,017 | 964 | 1,201 | 4,120 | 3,998 | 3,908 | |||||||||||||||||||||||||||||||||||||||||||||
| CAPEX excluding licenses / revenue |
11 | % | 18 | % | 14 | % | 27 | % | 11 | % | 14 | % | 16 | % | 30 | % | 14 | % | 20 | % | 19 | % | 27 | % | 18 | % | 18 | % | 20 | % | ||||||||||||||||||||||||||||||
| Operating cash flow (EBITDA-CAPEX excluding licenses) |
1,679 | 1,453 | 1,701 | 815 | 1,753 | 1,634 | 1,544 | (669 | ) | 1,362 | 1,059 | 1,241 | 399 | 5,648 | 4,262 | 4,062 | ||||||||||||||||||||||||||||||||||||||||||||
| OCF margin (%) |
30 | % | 25 | % | 30 | % | 14 | % | 31 | % | 29 | % | 27 | % | (12 | %) | 27 | % | 21 | % | 24 | % | 9 | % | 24 | % | 19 | % | 21 | % | ||||||||||||||||||||||||||||||
Notes:
| (1) | As a result of the succesful resolution in Algeria, adjustments to the following items were made: |
| (a) | 4Q13 EBITDA, EBITDA margin, EBIT and Loss before tax of USD 1.3 bln to reflect BofA claim |
| (b) | 4Q14 EBITDA, EBITDA margin, EBIT and Loss before tax of USD 50 mln to reflect Cevital settlement |
| (2) | 4Q13 EBITDA and CAPEX were affected by USD 72 mln as a result of fixed assets write off and accounted as operating expenses in Uzbekistan |
| (3) | The FY12 Financial Statements have been restated for the Euroset fair value adjustment of USD 606 million |
| (4) | The customer numbers for 2012, 2013 and 2014 have been adjusted to remove customers in operations that have been sold and to reflect revised customer numbers in Algeria, due to the reported technical issue, and Ukraine where the definition of customers has been aligned to the group definition |
| (5) | 1Q13 and FY13 CAPEX excludes EUR 136 million of non-cash increase in Intangible Assets related to the contract with Terna in relation to the Right of Way of WIND’s backbone. |
| Customers (mln) |
1Q12 | 2Q12 | 3Q12 | 4Q12 | 1Q13 | 2Q13 | 3Q13 | 4Q13 | 1Q14 | 2Q14 | 3Q14 | 4Q14 | FY12 | FY13 | FY14 | |||||||||||||||||||||||||||||||||||||||||||||
| Russia |
55.6 | 55.7 | 56.2 | 56.1 | 55.7 | 57.1 | 58.1 | 56.5 | 55.0 | 56.3 | 57.3 | 57.2 | 56.1 | 56.5 | 57.2 | |||||||||||||||||||||||||||||||||||||||||||||
| Italy |
21.1 | 21.2 | 21.5 | 21.7 | 22.0 | 22.3 | 22.4 | 22.3 | 22.0 | 21.9 | 21.8 | 21.6 | 21.7 | 22.3 | 21.6 | |||||||||||||||||||||||||||||||||||||||||||||
| Algeria |
17.1 | 17.0 | 16.8 | 16.7 | 16.6 | 16.8 | 17.0 | 17.574 | 17.6 | 17.5 | 18.2 | 18.4 | 16.7 | 17.6 | 18.4 | |||||||||||||||||||||||||||||||||||||||||||||
| Pakistan |
35.8 | 36.0 | 36.1 | 36.1 | 36.3 | 37.1 | 37.4 | 37.638 | 38.2 | 38.8 | 38.7 | 38.5 | 36.1 | 37.6 | 38.5 | |||||||||||||||||||||||||||||||||||||||||||||
| Bangladesh |
24.7 | 25.5 | 26.8 | 25.9 | 25.9 | 27.1 | 28.1 | 28.838 | 29.4 | 29.8 | 30.2 | 30.8 | 25.9 | 28.8 | 30.8 | |||||||||||||||||||||||||||||||||||||||||||||
| Ukraine |
23.8 | 24.1 | 24.5 | 25.1 | 26.3 | 25.6 | 25.9 | 25.8 | 25.6 | 25.4 | 26.3 | 26.2 | 25.1 | 25.8 | 26.2 | |||||||||||||||||||||||||||||||||||||||||||||
| Kazakhstan |
8.4 | 8.5 | 8.6 | 8.6 | 8.5 | 8.8 | 9.0 | 9.2 | 9.2 | 9.6 | 9.8 | 9.8 | 8.6 | 9.2 | 9.8 | |||||||||||||||||||||||||||||||||||||||||||||
| Uzbekistan |
7.3 | 7.0 | 9.2 | 10.2 | 10.3 | 10.2 | 10.3 | 10.5 | 10.4 | 10.4 | 10.5 | 10.6 | 10.2 | 10.5 | 10.6 | |||||||||||||||||||||||||||||||||||||||||||||
| Armenia |
0.8 | 0.8 | 0.8 | 0.8 | 0.8 | 0.7 | 0.7 | 0.7 | 0.7 | 0.7 | 0.8 | 0.8 | 0.8 | 0.7 | 0.8 | |||||||||||||||||||||||||||||||||||||||||||||
| Tajikistan |
1.0 | 1.0 | 0.9 | 1.1 | 1.2 | 1.2 | 1.2 | 1.3 | 1.3 | 1.3 | 1.3 | 1.3 | 1.1 | 1.3 | 1.3 | |||||||||||||||||||||||||||||||||||||||||||||
| Georgia |
0.9 | 0.9 | 1.0 | 1.0 | 1.0 | 1.0 | 1.1 | 1.1 | 1.1 | 1.1 | 1.3 | 1.3 | 1.0 | 1.1 | 1.3 | |||||||||||||||||||||||||||||||||||||||||||||
| Kyrgystan |
2.4 | 2.4 | 2.4 | 2.5 | 2.2 | 2.3 | 2.5 | 2.7 | 2.6 | 2.6 | 2.7 | 2.7 | 2.5 | 2.7 | 2.7 | |||||||||||||||||||||||||||||||||||||||||||||
| SSA |
1.8 | 2.0 | 2.4 | 2.6 | 2.4 | 2.4 | 2.5 | 2.6 | 2.5 | 2.3 | 2.2 | 2.2 | 2.6 | 2.6 | 2.2 | |||||||||||||||||||||||||||||||||||||||||||||
| SEA |
0.5 | 0.4 | 0.3 | 0.3 | 0.3 | 0.3 | 0.3 | 0.325 | 0.3 | 0.3 | 0.3 | 0.2 | 0.9 | 0.3 | 0.2 | |||||||||||||||||||||||||||||||||||||||||||||
| Total |
201.3 | 202.4 | 207.5 | 208.6 | 209.5 | 213.0 | 216.7 | 216.9 | 215.7 | 217.9 | 221.4 | 221.6 | 209.2 | 216.9 | 221.6 | |||||||||||||||||||||||||||||||||||||||||||||
Russia
index page
(in USD millions, unless stated otherwise, unaudited)
| CONSOLIDATED |
1Q12 | 2Q12 | 3Q12 | 4Q12 | 1Q13 | 2Q13 | 3Q13 | 4Q13 | 1Q14 | 2Q14 | 3Q14 | 4Q14 | FY12 | FY13 | FY14 | |||||||||||||||||||||||||||||||||||||||||||||
| Total operating revenue |
2,225 | 2,267 | 2,326 | 2,371 | 2,304 | 2,334 | 2,298 | 2,173 | 1,893 | 1,964 | 2,021 | 1,580 | 9,190 | 9,109 | 7,458 | |||||||||||||||||||||||||||||||||||||||||||||
| EBITDA |
918 | 977 | 1,005 | 978 | 963 | 997 | 980 | 876 | 760 | 813 | 827 | 580 | 3,878 | 3,815 | 2,980 | |||||||||||||||||||||||||||||||||||||||||||||
| EBITDA margin (%) |
41.3 | % | 43.1 | % | 43.2 | % | 41.2 | % | 41.8 | % | 42.7 | % | 42.6 | % | 40.3 | % | 40.1 | % | 41.4 | % | 40.9 | % | 36.6 | % | 42.2 | % | 41.9 | % | 40.0 | % | ||||||||||||||||||||||||||||||
| Capital expenditures (CAPEX) |
204 | 294 | 321 | 811 | 220 | 355 | 395 | 852 | 325 | 392 | 419 | 423 | 1,630 | 1,822 | 1,559 | |||||||||||||||||||||||||||||||||||||||||||||
| CAPEX excluding licenses |
204 | 294 | 321 | 811 | 220 | 355 | 395 | 852 | 315 | 378 | 405 | 416 | 1,630 | 1,822 | 1,514 | |||||||||||||||||||||||||||||||||||||||||||||
| Operating cash flow (EBITDA-CAPEX excluding licenses) |
714 | 683 | 684 | 167 | 743 | 642 | 585 | 24 | 445 | 435 | 422 | 164 | 2,248 | 1,993 | 1,466 | |||||||||||||||||||||||||||||||||||||||||||||
| OCF margin (%) |
32 | % | 30 | % | 29 | % | 7 | % | 32 | % | 27 | % | 25 | % | 1 | % | 23 | % | 22 | % | 21 | % | 10 | % | 24 | % | 22 | % | 20 | % | ||||||||||||||||||||||||||||||
| MOBILE |
1Q12 | 2Q12 | 3Q12 | 4Q12 | 1Q13 | 2Q13 | 3Q13 | 4Q13 | 1Q14 | 2Q14 | 3Q14 | 4Q14 | FY12 | FY13 | FY14 | |||||||||||||||||||||||||||||||||||||||||||||
| Total operating revenue |
1,845 | 1,870 | 1,932 | 1,983 | 1,911 | 1,937 | 1,902 | 1,786 | 1,540 | 1,604 | 1,651 | 1,275 | 7,630 | 7,536 | 6,070 | |||||||||||||||||||||||||||||||||||||||||||||
| Service revenue |
1,768 | 1,805 | 1,853 | 1,852 | 1,776 | 1,833 | 1,854 | 1,730 | 1,500 | 1,569 | 1,600 | 1,208 | 7,278 | 7,193 | 5,877 | |||||||||||||||||||||||||||||||||||||||||||||
| Data Revenue |
183 | 180 | 194 | 226 | 236 | 242 | 246 | 270 | 251 | 256 | 272 | 224 | 783 | 994 | 1,003 | |||||||||||||||||||||||||||||||||||||||||||||
| Customers (mln) |
55.6 | 55.7 | 56.2 | 56.1 | 55.7 | 57.1 | 58.1 | 56.5 | 55.0 | 56.3 | 57.3 | 57.2 | 56.1 | 56.5 | 57.2 | |||||||||||||||||||||||||||||||||||||||||||||
| ARPU (USD) |
10.5 | 10.8 | 11.0 | 11.0 | 10.6 | 10.8 | 10.6 | 10.1 | 8.9 | 9.3 | 9.3 | 7.0 | n.a. | n.a. | n.a. | |||||||||||||||||||||||||||||||||||||||||||||
| Broadband customers using USB modems (mln) |
2.6 | 2.5 | 2.5 | 2.7 | 2.7 | 2.7 | 3.0 | 3.1 | 3.2 | 3.3 | 3.5 | 3.7 | 2.7 | 3.1 | 3.7 | |||||||||||||||||||||||||||||||||||||||||||||
| Broadband ARPU (USD) |
7.8 | 7.1 | 7.0 | 8.0 | 7.7 | 7.4 | 7.3 | 7.1 | 6.7 | 6.7 | 6.5 | 5.1 | n.a. | n.a. | n.a. | |||||||||||||||||||||||||||||||||||||||||||||
| MOU (min) |
254 | 279 | 282 | 290 | 277 | 294 | 290 | 293 | 287 | 310 | 311 | 316 | n.a. | n.a. | n.a. | |||||||||||||||||||||||||||||||||||||||||||||
| Churn 3 months active base (quarterly) (%) |
17 | % | 15 | % | 15 | % | 16 | % | 15 | % | 14 | % | 15 | % | 18 | % | 17 | % | 13 | % | 15 | % | 16 | % | n.a. | n.a. | n.a. | |||||||||||||||||||||||||||||||||
| FIXED-LINE |
1Q12 | 2Q12 | 3Q12 | 4Q12 | 1Q13 | 2Q13 | 3Q13 | 4Q13 | 1Q14 | 2Q14 | 3Q14 | 4Q14 | FY12 | FY13 | FY14 | |||||||||||||||||||||||||||||||||||||||||||||
| Total operating revenue |
380 | 398 | 394 | 388 | 393 | 397 | 395 | 387 | 353 | 360 | 370 | 305 | 1,560 | 1,572 | 1,388 | |||||||||||||||||||||||||||||||||||||||||||||
| Service revenue |
375 | 393 | 390 | 381 | 387 | 392 | 392 | 381 | 348 | 355 | 366 | 303 | 1,539 | 1,552 | 1,372 | |||||||||||||||||||||||||||||||||||||||||||||
| Broadband revenue |
93 | 93 | 90 | 101 | 105 | 100 | 95 | 97 | 91 | 93 | 86 | 69 | 377 | 397 | 339 | |||||||||||||||||||||||||||||||||||||||||||||
| Broadband customers (mln) |
2.2 | 2.3 | 2.3 | 2.4 | 2.4 | 2.3 | 2.3 | 2.3 | 2.3 | 2.2 | 2.2 | 2.3 | 2.4 | 2.3 | 2.3 | |||||||||||||||||||||||||||||||||||||||||||||
| Broadband ARPU (USD) |
13.9 | 13.8 | 13.2 | 14.3 | 14.5 | 14.0 | 13.5 | 13.9 | 13.1 | 13.5 | 12.5 | 10.2 | n.a. | n.a. | n.a. | |||||||||||||||||||||||||||||||||||||||||||||
| FTTB revenue |
91 | 91 | 88 | 99 | 101 | 98 | 92 | 94 | 88 | 90 | 83 | 69 | 369 | 385 | 330 | |||||||||||||||||||||||||||||||||||||||||||||
| FTTB customers (mln) |
2.1 | 2.2 | 2.2 | 2.3 | 2.3 | 2.3 | 2.3 | 2.3 | 2.2 | 2.2 | 2.2 | 2.3 | 2.3 | 2.3 | 2.3 | |||||||||||||||||||||||||||||||||||||||||||||
| FTTB ARPU (USD) |
14.3 | 13.8 | 13.2 | 14.4 | 14.6 | 14.1 | 13.5 | 13.9 | 13.1 | 13.5 | 12.5 | 10.3 | n.a. | n.a. | n.a. | |||||||||||||||||||||||||||||||||||||||||||||
|
(in RUB millions, unless stated otherwise, unaudited)
|
|
|||||||||||||||||||||||||||||||||||||||||||||||||||||||||||
| CONSOLIDATED |
1Q12 | 2Q12 | 3Q12 | 4Q12 | 1Q13 | 2Q13 | 3Q13 | 4Q13 | 1Q14 | 2Q14 | 3Q14 | 4Q14 | FY12 | FY13 | FY14 | |||||||||||||||||||||||||||||||||||||||||||||
| Total operating revenue |
67,022 | 70,258 | 74,458 | 73,637 | 70,080 | 73,816 | 75,354 | 70,660 | 66,148 | 68,722 | 73,082 | 73,947 | 285,375 | 289,910 | 281,899 | |||||||||||||||||||||||||||||||||||||||||||||
| EBITDA |
27,654 | 30,266 | 32,180 | 30,378 | 29,292 | 31,519 | 32,131 | 28,479 | 26,548 | 28,468 | 29,878 | 27,042 | 120,478 | 121,421 | 111,936 | |||||||||||||||||||||||||||||||||||||||||||||
| EBITDA margin (%) |
41.3 | % | 43.1 | % | 43.2 | % | 41.3 | % | 41.8 | % | 42.7 | % | 42.6 | % | 40.3 | % | 40.1 | % | 41.4 | % | 40.9 | % | 36.6 | % | 42.2 | % | 41.9 | % | 39.7 | % | ||||||||||||||||||||||||||||||
| Capital expenditures (CAPEX) |
6,140 | 9,195 | 10,288 | 25,076 | 6,711 | 11,264 | 12,946 | 27,871 | 11,486 | 13,706 | 15,147 | 20,970 | 50,699 | 58,792 | 61,309 | |||||||||||||||||||||||||||||||||||||||||||||
| CAPEX excluding licenses |
6,140 | 9,195 | 10,288 | 25,076 | 6,711 | 11,264 | 12,946 | 27,871 | 11,145 | 13,218 | 14,631 | 20,494 | 50,699 | 58,792 | 59,488 | |||||||||||||||||||||||||||||||||||||||||||||
| Operating cash flow (EBITDA-CAPEX excluding licenses) |
21,514 | 21,071 | 21,892 | 5,302 | 22,581 | 20,255 | 19,185 | 608 | 15,403 | 15,250 | 15,247 | 6,548 | 69,779 | 62,629 | 52,448 | |||||||||||||||||||||||||||||||||||||||||||||
| OCF margin (%) |
32 | % | 30 | % | 29 | % | 7 | % | 32 | % | 27 | % | 25 | % | 1 | % | 23 | % | 22 | % | 21 | % | 9 | % | 24 | % | 22 | % | 19 | % | ||||||||||||||||||||||||||||||
| MOBILE |
1Q12 | 2Q12 | 3Q12 | 4Q12 | 1Q13 | 2Q13 | 3Q13 | 4Q13 | 1Q14 | 2Q14 | 3Q14 | 4Q14 | FY12 | FY13 | FY14 | |||||||||||||||||||||||||||||||||||||||||||||
| Total operating revenue |
55,576 | 57,925 | 61,842 | 61,579 | 58,117 | 61,254 | 62,395 | 58,087 | 53,805 | 56,133 | 59,691 | 59,637 | 236,922 | 239,852 | 229,266 | |||||||||||||||||||||||||||||||||||||||||||||
| Service revenue |
53,238 | 55,923 | 59,311 | 57,516 | 54,003 | 57,959 | 60,804 | 56,253 | 52,385 | 54,883 | 57,810 | 56,360 | 225,988 | 229,020 | 221,438 | |||||||||||||||||||||||||||||||||||||||||||||
| Data Revenue |
5,510 | 5,574 | 6,210 | 7,036 | 7,194 | 7,649 | 8,054 | 8,792 | 8,755 | 8,957 | 9,829 | 10,523 | 24,330 | 31,689 | 38,064 | |||||||||||||||||||||||||||||||||||||||||||||
| Customers (mln) |
55.6 | 55.7 | 56.2 | 56.1 | 55.7 | 57.1 | 58.1 | 56.5 | 55.0 | 56.3 | 57.3 | 57.2 | 56.1 | 56.5 | 57.2 | |||||||||||||||||||||||||||||||||||||||||||||
| ARPU (RUB) |
314 | 336 | 352 | 343 | 321 | 341 | 349 | 327 | 310 | 326 | 336 | 325 | n.a. | n.a. | n.a. | |||||||||||||||||||||||||||||||||||||||||||||
| Broadband customers using USB modems (mln) |
2.6 | 2.5 | 2.5 | 2.7 | 2.7 | 2.7 | 3.0 | 3.1 | 3.2 | 3.3 | 3.5 | 3.7 | 2.7 | 3.1 | 3.7 | |||||||||||||||||||||||||||||||||||||||||||||
| Broadband ARPU (RUB) |
235 | 220 | 224 | 248 | 234 | 234 | 239 | 231 | 232 | 234 | 236 | 238 | n.a. | n.a. | n.a. | |||||||||||||||||||||||||||||||||||||||||||||
| MOU (min) |
254 | 279 | 282 | 290 | 277 | 294 | 290 | 293 | 287 | 310 | 311 | 316 | n.a. | n.a. | n.a. | |||||||||||||||||||||||||||||||||||||||||||||
| Churn 3 months active base (quarterly) (%) |
17 | % | 15 | % | 15 | % | 16 | % | 15 | % | 14 | % | 15 | % | 18 | % | 17 | % | 13 | % | 15 | % | 16 | % | n.a. | n.a. | n.a. | |||||||||||||||||||||||||||||||||
| FIXED-LINE |
1Q12 | 2Q12 | 3Q12 | 4Q12 | 1Q13 | 2Q13 | 3Q13 | 4Q13 | 1Q14 | 2Q14 | 3Q14 | 4Q14 | FY12 | FY13 | FY14 | |||||||||||||||||||||||||||||||||||||||||||||
| Total operating revenue |
11,445 | 12,333 | 12,617 | 12,058 | 11,963 | 12,561 | 12,960 | 12,574 | 12,343 | 12,589 | 13,391 | 14,309 | 48,453 | 50,058 | 52,632 | |||||||||||||||||||||||||||||||||||||||||||||
| Service revenue |
11,308 | 12,188 | 12,482 | 11,836 | 11,774 | 12,396 | 12,841 | 12,402 | 12,175 | 12,444 | 13,228 | 14,217 | 47,814 | 49,413 | 52,064 | |||||||||||||||||||||||||||||||||||||||||||||
| Broadband revenue |
2,795 | 2,885 | 2,891 | 3,148 | 3,187 | 3,173 | 3,119 | 3,152 | 3,187 | 3,251 | 3,103 | 3,230 | 11,719 | 12,632 | 12,771 | |||||||||||||||||||||||||||||||||||||||||||||
| Broadband customers (mln) |
2.2 | 2.3 | 2.3 | 2.4 | 2.4 | 2.3 | 2.3 | 2.3 | 2.3 | 2.2 | 2.2 | 2.3 | 2.4 | 2.3 | 2.3 | |||||||||||||||||||||||||||||||||||||||||||||
| Broadband ARPU (RUB) |
426 | 427 | 421 | 445 | 440 | 443 | 443 | 451 | 457 | 474 | 454 | 477 | n.a. | n.a. | n.a. | |||||||||||||||||||||||||||||||||||||||||||||
| FTTB revenue |
2,724 | 2,817 | 2,823 | 3,082 | 3,086 | 3,084 | 3,024 | 3,056 | 3,078 | 3,156 | 3,004 | 3,196 | 11,446 | 12,250 | 12,434 | |||||||||||||||||||||||||||||||||||||||||||||
| FTTB customers (mln) |
2.1 | 2.2 | 2.2 | 2.3 | 2.3 | 2.3 | 2.3 | 2.3 | 2.2 | 2.2 | 2.2 | 2.3 | 2.3 | 2.3 | 2.3 | |||||||||||||||||||||||||||||||||||||||||||||
| FTTB ARPU (RUB) |
431 | 427 | 422 | 447 | 443 | 446 | 443 | 450 | 457 | 473 | 454 | 477 | n.a. | n.a. | n.a. | |||||||||||||||||||||||||||||||||||||||||||||
Italy
index page
(in EUR millions, unless stated otherwise, unaudited)
| CONSOLIDATED |
1Q12 | 2Q12 | 3Q12 | 4Q12 | 1Q13 | 2Q13 | 3Q13 | 4Q13 | 1Q14 | 2Q14 | 3Q14 | 4Q14 | FY12 | FY13 | FY14 | |||||||||||||||||||||||||||||||||||||||||||||
| Total operating revenue |
1,346 | 1,383 | 1,329 | 1,369 | 1,229 | 1,266 | 1,250 | 1,237 | 1,144 | 1,147 | 1,220 | 1,123 | 5,427 | 4,983 | 4,634 | |||||||||||||||||||||||||||||||||||||||||||||
| EBITDA |
487 | 524 | 537 | 514 | 461 | 475 | 507 | 500 | 430 | 435 | 521 | 418 | 2,062 | 1,943 | 1,804 | |||||||||||||||||||||||||||||||||||||||||||||
| EBITDA margin (%) |
36.2 | % | 37.9 | % | 40.4 | % | 37.5 | % | 37.5 | % | 37.5 | % | 40.6 | % | 40.4 | % | 37.6 | % | 38.0 | % | 42.7 | % | 37.2 | % | 38.0 | % | 39.0 | % | 38.9 | % | ||||||||||||||||||||||||||||||
| Capital expenditures (CAPEX)* |
193 | 243 | 222 | 342 | 298 | 183 | 153 | 291 | 137 | 173 | 187 | 261 | 1,000 | 924 | 758 | |||||||||||||||||||||||||||||||||||||||||||||
| CAPEX excluding licenses** |
165 | 217 | 197 | 326 | 298 | 183 | 153 | 291 | 137 | 173 | 187 | 261 | 905 | 924 | 757 | |||||||||||||||||||||||||||||||||||||||||||||
| Operating cash flow (EBITDA-CAPEX excluding licenses)*** |
322 | 307 | 340 | 188 | 299 | 292 | 354 | 209 | 293 | 262 | 334 | 157 | 1,157 | 1,019 | 1,046 | |||||||||||||||||||||||||||||||||||||||||||||
| OCF margin (%) |
24 | % | 22 | % | 26 | % | 14 | % | 24 | % | 23 | % | 28 | % | 17 | % | 26 | % | 23 | % | 27 | % | 14 | % | 21 | % | 20 | % | 23 | % | ||||||||||||||||||||||||||||||
| MOBILE |
1Q12 | 2Q12 | 3Q12 | 4Q12 | 1Q13 | 2Q13 | 3Q13 | 4Q13 | 1Q14 | 2Q14 | 3Q14 | 4Q14 | FY12 | FY13 | FY14 | |||||||||||||||||||||||||||||||||||||||||||||
| Total operating revenue |
983 | 1,015 | 959 | 1,001 | 888 | 927 | 926 | 907 | 827 | 832 | 848 | 820 | 3,958 | 3,648 | 3,328 | |||||||||||||||||||||||||||||||||||||||||||||
| Service revenue |
934 | 954 | 899 | 890 | 815 | 828 | 839 | 800 | 729 | 737 | 763 | 746 | 3,677 | 3,282 | 2,975 | |||||||||||||||||||||||||||||||||||||||||||||
| Data Revenue |
82 | 85 | 93 | 101 | 106 | 116 | 134 | 131 | 132 | 137 | 152 | 152 | 361 | 488 | 574 | |||||||||||||||||||||||||||||||||||||||||||||
| Customers (mln) |
21.1 | 21.2 | 21.5 | 21.7 | 22.0 | 22.3 | 22.4 | 22.3 | 22.0 | 21.9 | 21.8 | 21.6 | 21.7 | 22.3 | 21.6 | |||||||||||||||||||||||||||||||||||||||||||||
| Broadband customers (mln)**** |
4.7 | 4.7 | 5.0 | 5.8 | 6.7 | 7.6 | 8.2 | 8.8 | 9.3 | 9.7 | 10.2 | 10.2 | 5.8 | 8.8 | 10.2 | |||||||||||||||||||||||||||||||||||||||||||||
| ARPU (€) |
14.7 | 15.0 | 14.0 | 13.7 | 12.4 | 12.4 | 12.5 | 11.9 | 10.9 | 11.1 | 11.6 | 11.4 | n.a. | n.a. | n.a. | |||||||||||||||||||||||||||||||||||||||||||||
| of which : |
||||||||||||||||||||||||||||||||||||||||||||||||||||||||||||
| ARPU voice (€) |
10.9 | 11.2 | 10.0 | 9.6 | 8.3 | 8.2 | 7.8 | 7.5 | 6.7 | 6.8 | 7.0 | 6.9 | n.a. | n.a. | n.a. | |||||||||||||||||||||||||||||||||||||||||||||
| ARPU data (€) |
3.8 | 3.8 | 4.0 | 4.1 | 4.1 | 4.2 | 4.7 | 4.4 | 4.2 | 4.3 | 4.6 | 4.5 | n.a. | n.a. | n.a. | |||||||||||||||||||||||||||||||||||||||||||||
| MOU (min.) |
205 | 209 | 202 | 212 | 216 | 233 | 240 | 256 | 254 | 265 | 262 | 274 | n.a. | n.a. | n.a. | |||||||||||||||||||||||||||||||||||||||||||||
| Total traffic (mln. min.) |
12,954 | 13,240 | 12,919 | 13,690 | 14,166 | 15,512 | 16,093 | 17,142 | 16,895 | 17,486 | 17,150 | 17,819 | n.a. | n.a. | n.a. | |||||||||||||||||||||||||||||||||||||||||||||
| Churn, annualised rate (%) |
31.7 | % | 33.6 | % | 36.5 | % | 39.1 | % | 35.5 | % | 37.5 | % | 39.7 | % | 33.5 | % | 32.2 | % | 29.9 | % | 32.0 | % | 31.6 | % | n.a. | n.a. | n.a. | |||||||||||||||||||||||||||||||||
| FIXED-LINE |
1Q12 | 2Q12 | 3Q12 | 4Q12 | 1Q13 | 2Q13 | 3Q13 | 4Q13 | 1Q14 | 2Q14 | 3Q14 | 4Q14 | FY12 | FY13 | FY14 | |||||||||||||||||||||||||||||||||||||||||||||
| Total operating revenue |
363 | 368 | 370 | 369 | 341 | 339 | 325 | 330 | 316 | 314 | 372 | 302 | 1,470 | 1,335 | 1,305 | |||||||||||||||||||||||||||||||||||||||||||||
| Service revenue |
348 | 344 | 336 | 348 | 332 | 330 | 312 | 320 | 306 | 303 | 291 | 292 | 1,376 | 1,295 | 1,192 | |||||||||||||||||||||||||||||||||||||||||||||
| Total voice customers (mln) |
3.2 | 3.2 | 3.1 | 3.1 | 3.1 | 3.0 | 3.0 | 3.0 | 3.0 | 2.9 | 2.9 | 2.8 | 3.1 | 3.0 | 2.8 | |||||||||||||||||||||||||||||||||||||||||||||
| of which : |
||||||||||||||||||||||||||||||||||||||||||||||||||||||||||||
| Total DIRECT voice customers (mln) |
2.4 | 2.5 | 2.5 | 2.5 | 2.5 | 2.5 | 2.4 | 2.4 | 2.4 | 2.4 | 2.4 | 2.4 | 2.5 | 2.4 | 2.4 | |||||||||||||||||||||||||||||||||||||||||||||
| Total INDIRECT voice customers (mln) |
0.7 | 0.7 | 0.7 | 0.6 | 0.6 | 0.6 | 0.6 | 0.5 | 0.5 | 0.5 | 0.5 | 0.4 | 0.6 | 0.5 | 0.4 | |||||||||||||||||||||||||||||||||||||||||||||
| Total fixed-line ARPU (€) |
32.3 | 31.2 | 30.7 | 30.7 | 31.3 | 31.2 | 30.0 | 30.3 | 29.8 | 29.9 | 29.0 | 28.7 | n.a. | n.a. | n.a. | |||||||||||||||||||||||||||||||||||||||||||||
| Total Traffic (mln. min.) |
4,960 | 4,674 | 3,807 | 4,637 | 4,449 | 4,036 | 3,209 | 3,888 | 3,627 | 3,410 | 2,616 | 3,292 | n.a. | n.a. | n.a. | |||||||||||||||||||||||||||||||||||||||||||||
| Total Internet customers (mln) |
2.3 | 2.3 | 2.3 | 2.3 | 2.3 | 2.2 | 2.2 | 2.2 | 2.2 | 2.2 | 2.2 | 2.2 | 2.3 | 2.2 | 2.2 | |||||||||||||||||||||||||||||||||||||||||||||
| of which : |
||||||||||||||||||||||||||||||||||||||||||||||||||||||||||||
| Broadband (mln) |
2.2 | 2.2 | 2.2 | 2.2 | 2.2 | 2.2 | 2.2 | 2.2 | 2.2 | 2.2 | 2.1 | 2.2 | 2.2 | 2.2 | 2.2 | |||||||||||||||||||||||||||||||||||||||||||||
| Broadband ARPU (€) |
18.9 | 18.5 | 18.7 | 19.1 | 20.2 | 20.2 | 20.4 | 20.5 | 20.8 | 21.3 | 21.4 | 21.6 | n.a. | n.a. | n.a. | |||||||||||||||||||||||||||||||||||||||||||||
| Dual-play customers (mln) |
1.8 | 1.9 | 1.9 | 1.8 | 1.9 | 1.9 | 1.9 | 1.9 | 1.9 | 1.9 | 1.9 | 1.9 | 1.8 | 1.9 | 1.9 | |||||||||||||||||||||||||||||||||||||||||||||
| * | Excluding impact of FOC CAPEX and including LTE |
| ** | Excluding impact of FOC and excluding LTE |
| *** | 1Q13 and FY13 CAPEX excludes EUR 136 million of non-cash increase in Intangible Assets related to the contract with Terna in relation to the Right of Way of WIND’s backbone |
| **** | Mobile broadband include customers that have performed at least one mobile Internet event in the previous month |
Algeria
index page
(in USD millions, unless stated otherwise, unaudited)
| MOBILE |
1Q12 | 2Q12 | 3Q12 | 4Q12 | 1Q13 | 2Q13 | 3Q13 | 4Q13* | 1Q14 | 2Q14 | 3Q14 | 4Q14*** | FY12 | FY13* | FY14*** | |||||||||||||||||||||||||||||||||||||||||||||
| Total operating revenue |
457 | 471 | 447 | 466 | 434 | 464 | 450 | 448 | 429 | 437 | 429 | 396 | 1,841 | 1,796 | 1,690 | |||||||||||||||||||||||||||||||||||||||||||||
| Service revenue |
457 | 471 | 447 | 466 | 432 | 463 | 449 | 447 | 428 | 434 | 422 | 393 | 1,841 | 1,791 | 1,678 | |||||||||||||||||||||||||||||||||||||||||||||
| EBITDA |
274 | 284 | 262 | 274 | 256 | 279 | 258 | 261 | 247 | 238 | 225 | 198 | 1,094 | 1,054 | 907 | |||||||||||||||||||||||||||||||||||||||||||||
| EBITDA margin (%) |
60.0 | % | 60.3 | % | 58.6 | % | 58.9 | % | 59.1 | % | 60.1 | % | 57.2 | % | 58.3 | % | 57.6 | % | 54.5 | % | 52.5 | % | 49.9 | % | 59.5 | % | 58.7 | % | 53.7 | % | ||||||||||||||||||||||||||||||
| Capital expenditures (CAPEX) |
3 | 9 | 5 | 30 | 9 | 17 | 7 | 89 | 60 | 162 | 84 | 82 | 47 | 122 | 388 | |||||||||||||||||||||||||||||||||||||||||||||
| CAPEX excluding licenses |
3 | 9 | 5 | 30 | 9 | 17 | 7 | 51 | 60 | 162 | 84 | 82 | 47 | 84 | 388 | |||||||||||||||||||||||||||||||||||||||||||||
| Data Revenue |
1.4 | 1.3 | 1.7 | 1.4 | 1.8 | 2.0 | 2.5 | 2.1 | 2.6 | 2.4 | 9.1 | 7.8 | 5.8 | 8.4 | 22 | |||||||||||||||||||||||||||||||||||||||||||||
| Customers (mln)** |
17.1 | 17.0 | 16.8 | 16.7 | 16.6 | 16.8 | 17.0 | 17.6 | 17.6 | 17.5 | 18.2 | 18.4 | 16.7 | 17.6 | 18.4 | |||||||||||||||||||||||||||||||||||||||||||||
| ARPU (USD) |
8.9 | 9.2 | 8.8 | 9.2 | 8.6 | 9.2 | 8.4 | 8.6 | 8.1 | 8.2 | 7.7 | 7.2 | n.a. | n.a. | n.a. | |||||||||||||||||||||||||||||||||||||||||||||
| MOU (min) |
277 | 277 | 271 | 270 | 263 | 278 | 216 | 211 | 201 | 202 | 200 | 182 | n.a. | n.a. | n.a. | |||||||||||||||||||||||||||||||||||||||||||||
| Churn 3 months active base (quarterly) (%) |
6.3 | % | 7.0 | % | 8.3 | % | 7.9 | % | 7.6 | % | 6.9 | % | 13.7 | % | 6.1 | % | 6.0 | % | 6.1 | % | 6.0 | % | 5.7 | % | n.a. | n.a. | n.a. | |||||||||||||||||||||||||||||||||
| Operating cash flow (EBITDA-CAPEX excluding licenses) |
264 | 274 | 256 | 244 | 248 | 262 | 251 | 210 | 187 | 76 | 141 | 116 | 1,047 | 971 | 520 | |||||||||||||||||||||||||||||||||||||||||||||
| OCF margin (%) |
58 | % | 58 | % | 57 | % | 52 | % | 57 | % | 56 | % | 56 | % | 47 | % | 44 | % | 17 | % | 33 | % | 29 | % | 57 | % | 54 | % | 31 | % | ||||||||||||||||||||||||||||||
(in DZD billions, unless stated otherwise, unaudited)
| MOBILE |
1Q12 | 2Q12 | 3Q12 | 4Q12 | 1Q13 | 2Q13 | 3Q13 | 4Q13* | 1Q14 | 2Q14 | 3Q14 | 4Q14 | FY12 | FY13 | FY14 | |||||||||||||||||||||||||||||||||||||||||||||
| Total operating revenue |
34.3 | 35.8 | 36.0 | 37.0 | 34.1 | 36.7 | 36.0 | 35.9 | 33.5 | 34.5 | 34.4 | 33.7 | 143.1 | 142.7 | 136 | |||||||||||||||||||||||||||||||||||||||||||||
| Service revenue |
34.3 | 35.8 | 36.1 | 37.0 | 34.0 | 36.6 | 36.2 | 36.0 | 33.4 | 34.3 | 33.9 | 33.5 | 143.2 | 142.8 | 135 | |||||||||||||||||||||||||||||||||||||||||||||
| EBITDA |
19.0 | 21.6 | 21.0 | 21.8 | 20.2 | 22.0 | 21.0 | 21.0 | 19.0 | 18.8 | 18.1 | 16.8 | 84.0 | 84.0 | 73 | |||||||||||||||||||||||||||||||||||||||||||||
| EBITDA margin (%) |
59.4 | % | 60.3 | % | 58.6 | % | 58.9 | % | 59.2 | % | 60.1 | % | 57.2 | % | 58.3 | % | 57.6 | % | 54.5 | % | 52.5 | % | 49.8 | % | 59.5 | % | 58.7 | % | 53.7 | % | ||||||||||||||||||||||||||||||
| Data Revenue |
0.1 | 0.1 | 0.1 | 0.1 | 0.1 | 0.2 | 0.2 | 0.2 | 0.2 | 0.2 | 0.5 | 0.7 | 0.5 | 0.7 | 1.6 | |||||||||||||||||||||||||||||||||||||||||||||
| Customers (mln)** |
17.1 | 17.0 | 16.8 | 16.7 | 16.6 | 16.8 | 17.0 | 17.6 | 17.6 | 17.5 | 18.2 | 18.4 | 16.7 | 17.6 | 18.4 | |||||||||||||||||||||||||||||||||||||||||||||
| ARPU (DZD) |
690 | 694 | 710 | 733 | 677 | 727 | 680 | 689 | 628 | 648 | 629 | 610 | n.a. | n.a. | n.a. | |||||||||||||||||||||||||||||||||||||||||||||
| MOU (min) |
277 | 277 | 271 | 270 | 263 | 278 | 216 | 211 | 201 | 202 | 200 | 182 | n.a. | n.a. | n.a. | |||||||||||||||||||||||||||||||||||||||||||||
| Churn 3 months active base (quarterly) (%) |
6.3 | % | 7.0 | % | 8.3 | % | 7.9 | % | 7.6 | % | 6.9 | % | 13.7 | % | 6.1 | % | 6.0 | % | 6.1 | % | 6.0 | % | 5.7 | % | n.a. | n.a. | n.a. | |||||||||||||||||||||||||||||||||
| * | 4Q13 EBITDA excludes USD 1.3 bln (DZD 99 bln) one-off provisions related to the 51% sale in Algeria |
| ** | Subscriber base has been adjusted by 1.4 million customers in 1Q13 because of a technical issue. |
This event does not impact historical reported revenue or EBITDA, but positively affects MOU and ARPU.
| *** | 4Q14 EBITDA excludes USD 50 mln (DZD 4 bln) one-off provisions related to the 51% sale in Algeria |
Pakistan
index page
(in USD millions, unless stated otherwise, unaudited)
| MOBILE |
1Q12 | 2Q12 | 3Q12 | 4Q12 | 1Q13 | 2Q13 | 3Q13 | 4Q13 | 1Q14 | 2Q14 | 3Q14 | 4Q14 | FY12 | FY13 | FY14 | |||||||||||||||||||||||||||||||||||||||||||||
| Total operating revenue |
286 | 295 | 269 | 282 | 278 | 289 | 259 | 240 | 251 | 268 | 241 | 251 | 1,132 | 1,066 | 1,010 | |||||||||||||||||||||||||||||||||||||||||||||
| Service revenue |
282 | 293 | 267 | 281 | 268 | 280 | 250 | 231 | 241 | 256 | 230 | 239 | 1,123 | 1,029 | 966 | |||||||||||||||||||||||||||||||||||||||||||||
| EBITDA |
121 | 130 | 116 | 121 | 117 | 125 | 111 | 89 | 99 | 104 | 84 | 99 | 488 | 442 | 386 | |||||||||||||||||||||||||||||||||||||||||||||
| EBITDA margin (%) |
42.3 | % | 44.1 | % | 43.0 | % | 43.0 | % | 42.3 | % | 43.0 | % | 43.0 | % | 37.2 | % | 39.5 | % | 38.9 | % | 34.9 | % | 39.5 | % | 43.1 | % | 41.5 | % | 38.2 | % | ||||||||||||||||||||||||||||||
| Capital expenditures (CAPEX) |
24 | 31 | 29 | 89 | 9 | 39 | 52 | 90 | 55 | 410 | 97 | 89 | 173 | 190 | 651 | |||||||||||||||||||||||||||||||||||||||||||||
| CAPEX excluding licenses |
24 | 31 | 29 | 89 | 9 | 39 | 52 | 90 | 55 | 110 | 97 | 89 | 173 | 190 | 351 | |||||||||||||||||||||||||||||||||||||||||||||
| Data Revenue |
5.8 | 6.2 | 6.1 | 6.4 | 6.8 | 7.8 | 8.7 | 8.6 | 9.8 | 12.2 | 12.5 | 14.2 | 24.5 | 31.9 | 49 | |||||||||||||||||||||||||||||||||||||||||||||
| Customers (mln) |
35.8 | 36.0 | 36.1 | 36.1 | 36.3 | 37.1 | 37.4 | 37.6 | 38.2 | 38.8 | 38.7 | 38.5 | 36.1 | 37.6 | 38.5 | |||||||||||||||||||||||||||||||||||||||||||||
| ARPU (USD) |
2.6 | 2.7 | 2.4 | 2.5 | 2.5 | 2.5 | 2.2 | 2.0 | 2.0 | 2.2 | 1.9 | 2.0 | n.a. | n.a. | n.a. | |||||||||||||||||||||||||||||||||||||||||||||
| MOU (min) |
215 | 214 | 212 | 215 | 228 | 233 | 222 | 222 | 213 | 230 | 236 | 273 | n.a. | n.a. | n.a. | |||||||||||||||||||||||||||||||||||||||||||||
| Churn 3 months active base (quarterly) (%) |
5.8 | % | 7.1 | % | 7.1 | % | 5.2 | % | 3.9 | % | 5.3 | % | 6.5 | % | 7.3 | % | 5.7 | % | 6.4 | % | 6.8 | % | 7.0 | % | n.a. | n.a. | n.a. | |||||||||||||||||||||||||||||||||
| Operating cash flow (EBITDA-CAPEX excluding licenses) |
97 | 99 | 87 | 32 | 108 | 86 | 59 | (1 | ) | 44 | (6 | ) | (13 | ) | 10 | 315 | 252 | 35 | ||||||||||||||||||||||||||||||||||||||||||
| OCF margin (%) |
34 | % | 34 | % | 32 | % | 11 | % | 39 | % | 30 | % | 23 | % | 0 | % | 18 | % | (2 | %) | (5 | %) | 4 | % | 28 | % | 24 | % | 3 | % | ||||||||||||||||||||||||||||||
(in PKR billions, unless stated otherwise, unaudited)
| MOBILE |
1Q12 | 2Q12 | 3Q12 | 4Q12 | 1Q13 | 2Q13 | 3Q13 | 4Q13 | 1Q14 | 2Q14 | 3Q14 | 4Q14 | FY12 | FY13 | FY14 | |||||||||||||||||||||||||||||||||||||||||||||
| Total operating revenue |
25.9 | 27.2 | 26.0 | 27.2 | 27.0 | 28.5 | 26.7 | 25.7 | 26.0 | 26.3 | 24.2 | 25.5 | 106.3 | 108.0 | 102.1 | |||||||||||||||||||||||||||||||||||||||||||||
| Service revenue |
25.5 | 27.0 | 25.3 | 27.0 | 26.3 | 27.6 | 25.7 | 24.5 | 24.9 | 25.2 | 23.1 | 24.3 | 104.8 | 104.1 | 97.5 | |||||||||||||||||||||||||||||||||||||||||||||
| EBITDA |
10.9 | 12.0 | 11.0 | 11.7 | 11.5 | 12.3 | 11.5 | 9.6 | 10.0 | 10.2 | 8.5 | 10.1 | 45.6 | 44.5 | 38.8 | |||||||||||||||||||||||||||||||||||||||||||||
| EBITDA margin (%) |
42.2 | % | 44.1 | % | 43.0 | % | 43.0 | % | 42.3 | % | 43.0 | % | 43.1 | % | 37.2 | % | 39.5 | % | 38.9 | % | 34.9 | % | 39.5 | % | 43.1 | % | 41.5 | % | 38.2 | % | ||||||||||||||||||||||||||||||
| Data Revenue |
0.5 | 0.6 | 0.6 | 0.6 | 0.7 | 0.8 | 0.9 | 0.9 | 1.0 | 1.2 | 1.3 | 1.4 | 2.3 | 3.3 | 4.9 | |||||||||||||||||||||||||||||||||||||||||||||
| Customers (mln) |
35.8 | 36.0 | 36.1 | 36.1 | 36.3 | 37.1 | 37.4 | 37.6 | 38.2 | 38.8 | 38.7 | 38.5 | 36.1 | 37.6 | 38.5 | |||||||||||||||||||||||||||||||||||||||||||||
| ARPU (PKR) |
239 | 246 | 231 | 243 | 244 | 249 | 229 | 219 | 216 | 214 | 195 | 204 | n.a. | n.a. | n.a. | |||||||||||||||||||||||||||||||||||||||||||||
| MOU (min) |
215 | 214 | 212 | 215 | 228 | 233 | 222 | 222 | 213 | 230 | 236 | 273 | n.a. | n.a. | n.a. | |||||||||||||||||||||||||||||||||||||||||||||
| Churn 3 months active base (quarterly) (%) |
5.8 | % | 7.1 | % | 7.1 | % | 5.2 | % | 3.9 | % | 5.3 | % | 6.5 | % | 7.3 | % | 5.7 | % | 6.4 | % | 6.8 | % | 7.0 | % | n.a. | n.a. | n.a. | |||||||||||||||||||||||||||||||||
Bangladesh
index page
(in USD millions, unless stated otherwise, unaudited)
| MOBILE |
1Q12 | 2Q12 | 3Q12 | 4Q12 | 1Q13 | 2Q13 | 3Q13 | 4Q13 | 1Q14 | 2Q14 | 3Q14 | 4Q14 | FY12 | FY13 | FY14 | |||||||||||||||||||||||||||||||||||||||||||||
| Total operating revenue |
130 | 142 | 144 | 138 | 118 | 129 | 129 | 128 | 134 | 141 | 142 | 146 | 554 | 504 | 563 | |||||||||||||||||||||||||||||||||||||||||||||
| Service revenue |
130 | 142 | 144 | 138 | 118 | 129 | 129 | 122 | 132 | 139 | 140 | 144 | 554 | 498 | 556 | |||||||||||||||||||||||||||||||||||||||||||||
| EBITDA |
44 | 54 | 42 | 52 | 49 | 48 | 47 | 43 | 49 | 54 | 56 | 60 | 192 | 187 | 219 | |||||||||||||||||||||||||||||||||||||||||||||
| EBITDA margin (%) |
33.8 | % | 38.0 | % | 29.3 | % | 37.4 | % | 41.4 | % | 37.2 | % | 36.3 | % | 33.7 | % | 37.4 | % | 38.2 | % | 39.7 | % | 40.8 | % | 34.7 | % | 37.1 | % | 38.9 | % | ||||||||||||||||||||||||||||||
| Capital expenditures (CAPEX) |
29 | 35 | 20 | 43 | 12 | 13 | 127 | 131 | 27 | 43 | 50 | 59 | 126 | 282 | 178 | |||||||||||||||||||||||||||||||||||||||||||||
| CAPEX excluding licenses |
29 | 35 | 20 | 43 | 12 | 13 | 17 | 131 | 27 | 43 | 50 | 59 | 126 | 172 | 178 | |||||||||||||||||||||||||||||||||||||||||||||
| Data Revenue |
1 | 1 | 2 | 2 | 2.5 | 2.8 | 3.8 | 4.0 | 4.4 | 5.0 | 6.3 | 7.5 | 6.8 | 13.1 | 23 | |||||||||||||||||||||||||||||||||||||||||||||
| Customers (mln) |
24.7 | 25.5 | 26.8 | 25.9 | 25.9 | 27.1 | 28.1 | 28.8 | 29.4 | 29.8 | 30.2 | 30.8 | 25.9 | 28.8 | 30.8 | |||||||||||||||||||||||||||||||||||||||||||||
| ARPU (USD) |
1.8 | 1.9 | 1.8 | 1.7 | 1.5 | 1.6 | 1.5 | 1.4 | 1.5 | 1.6 | 1.5 | 1.6 | n.a. | n.a. | n.a. | |||||||||||||||||||||||||||||||||||||||||||||
| MOU (min) |
217 | 231 | 225 | 191 | 175 | 198 | 189 | 183 | 188 | 201 | 200 | 186 | n.a. | n.a. | n.a. | |||||||||||||||||||||||||||||||||||||||||||||
| Churn 3 months active base (quarterly) (%) |
6.1 | % | 5.1 | % | 6.6 | % | 7.4 | % | 6.6 | % | 3.9 | % | 5.1 | % | 6.9 | % | 6.3 | % | 5.2 | % | 5.3 | % | 5.1 | % | n.a. | n.a. | n.a. | |||||||||||||||||||||||||||||||||
| Operating cash flow (EBITDA-CAPEX excluding licenses) |
15 | 20 | 23 | 8 | 37 | 36 | 30 | (88 | ) | 23 | 11 | 7 | 1 | 65 | 15 | 41 | ||||||||||||||||||||||||||||||||||||||||||||
| OCF margin (%) |
11 | % | 14 | % | 16 | % | 6 | % | 31 | % | 28 | % | 23 | % | (69 | %) | 17 | % | 8 | % | 5 | % | 0 | % | 12 | % | 3 | % | 7 | % | ||||||||||||||||||||||||||||||
(in BDT billions, unless stated otherwise, unaudited)
| MOBILE |
1Q12 | 2Q12 | 3Q12 | 4Q12 | 1Q13 | 2Q13 | 3Q13 | 4Q13 | 1Q14 | 2Q14 | 3Q14 | 4Q14 | FY12 | FY13 | FY14 | |||||||||||||||||||||||||||||||||||||||||||||
| Total operating revenue |
10.7 | 11.7 | 12.0 | 11.2 | 9.3 | 10.1 | 10.0 | 10.0 | 10.2 | 10.9 | 11.0 | 11.3 | 45.6 | 39.4 | 43 | |||||||||||||||||||||||||||||||||||||||||||||
| Service revenue |
10.7 | 11.7 | 12.0 | 11.2 | 9.3 | 10.0 | 10.0 | 9.5 | 10.2 | 10.8 | 10.9 | 11.2 | 45.6 | 38.8 | 43 | |||||||||||||||||||||||||||||||||||||||||||||
| EBITDA |
3.7 | 4.5 | 3.0 | 4.2 | 3.8 | 3.7 | 3.6 | 3.4 | 4.0 | 4.2 | 4.4 | 4.6 | 16.0 | 14.6 | 17 | |||||||||||||||||||||||||||||||||||||||||||||
| EBITDA margin (%) |
34.0 | % | 38.0 | % | 29.3 | % | 37.4 | % | 41.3 | % | 37.2 | % | 36.3 | % | 33.7 | % | 37.4 | % | 38.2 | % | 39.7 | % | 40.8 | % | 34.7 | % | 37.1 | % | 38.9 | % | ||||||||||||||||||||||||||||||
| Data Revenue |
0.08 | 0.12 | 0.18 | 0.17 | 0.20 | 0.22 | 0.29 | 0.31 | 0.30 | 0.39 | 0.49 | 0.58 | 0.55 | 1.02 | 2 | |||||||||||||||||||||||||||||||||||||||||||||
| Customers (mln) |
24.7 | 25.5 | 26.8 | 25.9 | 25.9 | 27.1 | 28.1 | 28.8 | 29.4 | 29.8 | 30.2 | 30.8 | 25.9 | 28.8 | 30.8 | |||||||||||||||||||||||||||||||||||||||||||||
| ARPU (BDT) |
145 | 151 | 149 | 138 | 119 | 126 | 121 | 110 | 117 | 121 | 120 | 122 | n.a. | n.a. | n.a. | |||||||||||||||||||||||||||||||||||||||||||||
| MOU (min) |
217 | 231 | 225 | 191 | 175 | 198 | 189 | 183 | 188 | 201 | 200 | 186 | n.a. | n.a. | n.a. | |||||||||||||||||||||||||||||||||||||||||||||
| Churn 3 months active base (quarterly) (%) |
6.1 | % | 5.1 | % | 6.6 | % | 7.4 | % | 6.6 | % | 3.9 | % | 5.1 | % | 6.9 | % | 6.3 | % | 5.2 | % | 5.3 | % | 5.1 | % | n.a. | n.a. | n.a. | |||||||||||||||||||||||||||||||||
Ukraine
index page
(in USD millions, unless stated otherwise, unaudited)
| CONSOLIDATED |
1Q12 | 2Q12 | 3Q12 | 4Q12 | 1Q13 | 2Q13 | 3Q13 | 4Q13 | 1Q14 | 2Q14 | 3Q14 | 4Q14 | FY12 | FY13 | FY14 | |||||||||||||||||||||||||||||||||||||||||||||
| Total operating revenue |
385 | 406 | 452 | 432 | 396 | 401 | 420 | 394 | 335 | 259 | 252 | 216 | 1,676 | 1,611 | 1,062 | |||||||||||||||||||||||||||||||||||||||||||||
| EBITDA |
197 | 204 | 231 | 227 | 194 | 192 | 208 | 186 | 162 | 115 | 114 | 92 | 859 | 781 | 483 | |||||||||||||||||||||||||||||||||||||||||||||
| EBITDA margin (%) |
51.1 | % | 50.2 | % | 51.2 | % | 52.5 | % | 49.0 | % | 48.0 | % | 49.6 | % | 47.2 | % | 48.6 | % | 44.5 | % | 45.4 | % | 42.7 | % | 51.3 | % | 48.5 | % | 45.2 | % | ||||||||||||||||||||||||||||||
| Capital expenditures (CAPEX) |
45 | 58 | 54 | 75 | 42 | 48 | 66 | 56 | 35 | 30 | 35 | 37 | 231 | 212 | 137 | |||||||||||||||||||||||||||||||||||||||||||||
| CAPEX excluding licenses |
45 | 58 | 54 | 75 | 42 | 48 | 66 | 56 | 35 | 30 | 35 | 37 | 231 | 212 | 137 | |||||||||||||||||||||||||||||||||||||||||||||
| Operating cash flow (EBITDA-CAPEX excluding licenses) |
152 | 146 | 178 | 152 | 152 | 144 | 143 | 130 | 127 | 85 | 79 | 55 | 628 | 569 | 346 | |||||||||||||||||||||||||||||||||||||||||||||
| OCF margin (%) |
40 | % | 36 | % | 39 | % | 35 | % | 38 | % | 36 | % | 34 | % | 33 | % | 38 | % | 33 | % | 31 | % | 24 | % | 37 | % | 35 | % | 32 | % | ||||||||||||||||||||||||||||||
| MOBILE |
1Q12 | 2Q12 | 3Q12 | 4Q12 | 1Q13 | 2Q13 | 3Q13 | 4Q13 | 1Q14 | 2Q14 | 3Q14 | 4Q14 | FY12 | FY13 | FY14 | |||||||||||||||||||||||||||||||||||||||||||||
| Total operating revenue |
356 | 375 | 419 | 401 | 362 | 367 | 384 | 359 | 305 | 236 | 232 | 200 | 1,551 | 1,473 | 973 | |||||||||||||||||||||||||||||||||||||||||||||
| Service revenue |
354 | 371 | 404 | 393 | 355 | 360 | 376 | 357 | 305 | 235 | 231 | 199 | 1,522 | 1,448 | 970 | |||||||||||||||||||||||||||||||||||||||||||||
| Data Revenue |
24.4 | 24.6 | 26.4 | 26.6 | 26.4 | 27.0 | 29.3 | 29.9 | 27.6 | 20.5 | 19.5 | 17.8 | 102.0 | 112.6 | 85 | |||||||||||||||||||||||||||||||||||||||||||||
| Customers (mln)* |
23.8 | 24.1 | 24.5 | 25.1 | 26.3 | 25.6 | 25.9 | 25.8 | 25.6 | 25.4 | 26.3 | 26.2 | 25.1 | 25.8 | 26.2 | |||||||||||||||||||||||||||||||||||||||||||||
| ARPU (USD) |
5.0 | 5.1 | 5.4 | 5.2 | 4.6 | 4.6 | 4.8 | 4.6 | 3.9 | 3.1 | 3.0 | 2.5 | n.a. | n.a. | n.a. | |||||||||||||||||||||||||||||||||||||||||||||
| MOU (min) |
509 | 515 | 514 | 512 | 484 | 486 | 497 | 504 | 498 | 506 | 517 | 524 | n.a. | n.a. | n.a. | |||||||||||||||||||||||||||||||||||||||||||||
| Churn 3 months active base (quarterly) (%) |
6.1 | % | 7.9 | % | 7.7 | % | 8.0 | % | 6.9 | % | 11.4 | % | 8.0 | % | 8.4 | % | 7.3 | % | 6.4 | % | 4.8 | % | 6.7 | % | n.a. | n.a. | n.a. | |||||||||||||||||||||||||||||||||
| FIXED-LINE |
1Q12 | 2Q12 | 3Q12 | 4Q12 | 1Q13 | 2Q13 | 3Q13 | 4Q13 | 1Q14 | 2Q14 | 3Q14 | 4Q14 | FY12 | FY13 | FY14 | |||||||||||||||||||||||||||||||||||||||||||||
| Total operating revenue |
29 | 31 | 33 | 31 | 33 | 33 | 36 | 35 | 30 | 24 | 20 | 16 | 125 | 137 | 90 | |||||||||||||||||||||||||||||||||||||||||||||
| Service revenue |
29 | 31 | 33 | 31 | 33 | 33 | 36 | 35 | 29 | 24 | 20 | 16 | 124 | 137 | 89 | |||||||||||||||||||||||||||||||||||||||||||||
| Broadband revenue |
7 | 8 | 9 | 10 | 12 | 13 | 13 | 13 | 13 | 10 | 9 | 8 | 34 | 51 | 40 | |||||||||||||||||||||||||||||||||||||||||||||
| Broadband customers (mln) |
0.5 | 0.5 | 0.6 | 0.6 | 0.7 | 0.7 | 0.7 | 0.8 | 0.8 | 0.8 | 0.8 | 0.8 | 0.6 | 0.8 | 0.8 | |||||||||||||||||||||||||||||||||||||||||||||
| Broadband ARPU (USD) |
5.6 | 5.7 | 5.5 | 5.9 | 6.3 | 6.2 | 6.1 | 6.0 | 5.6 | 4.0 | 3.6 | 3.2 | n.a. | n.a. | n.a. | |||||||||||||||||||||||||||||||||||||||||||||
| (in UAH millions, unless stated otherwise, unaudited) |
|
|||||||||||||||||||||||||||||||||||||||||||||||||||||||||||
| CONSOLIDATED |
1Q12 | 2Q12 | 3Q12 | 4Q12 | 1Q13 | 2Q13 | 3Q13 | 4Q13 | 1Q14 | 2Q14 | 3Q14 | 4Q14 | FY12 | FY13 | FY14 | |||||||||||||||||||||||||||||||||||||||||||||
| Total operating revenue |
3,079 | 3,247 | 3,613 | 3,453 | 3,162 | 3,201 | 3,359 | 3,149 | 2,942 | 3,034 | 3,160 | 3,095 | 13,392 | 12,871 | 12,231 | |||||||||||||||||||||||||||||||||||||||||||||
| EBITDA |
1,574 | 1,630 | 1,849 | 1,814 | 1,550 | 1,536 | 1,666 | 1,487 | 1,430 | 1,349 | 1,436 | 1,311 | 6,867 | 6,239 | 5,526 | |||||||||||||||||||||||||||||||||||||||||||||
| EBITDA margin (%) |
51.1 | % | 50.2 | % | 51.2 | % | 52.5 | % | 49.0 | % | 48.0 | % | 49.6 | % | 47.2 | % | 48.6 | % | 44.5 | % | 45.5 | % | 42.3 | % | 51.3 | % | 48.5 | % | 45.2 | % | ||||||||||||||||||||||||||||||
| Capital expenditures (CAPEX) |
356 | 462 | 428 | 602 | 336 | 383 | 525 | 447 | 305 | 354 | 445 | 554 | 1,848 | 1,690 | 1,658 | |||||||||||||||||||||||||||||||||||||||||||||
| CAPEX excluding licenses |
356 | 462 | 428 | 602 | 336 | 383 | 525 | 447 | 305 | 354 | 445 | 554 | 1,848 | 1,690 | 1,658 | |||||||||||||||||||||||||||||||||||||||||||||
| Operating cash flow (EBITDA-CAPEX excluding licenses) |
1,218 | 1,168 | 1,421 | 1,212 | 1,215 | 1,153 | 1,141 | 1,040 | 1,125 | 995 | 991 | 757 | 5,019 | 4,549 | 3,868 | |||||||||||||||||||||||||||||||||||||||||||||
| OCF margin (%) |
40 | % | 36 | % | 39 | % | 35 | % | 38 | % | 36 | % | 34 | % | 33 | % | 38 | % | 33 | % | 31 | % | 24 | % | 37 | % | 35 | % | 32 | % | ||||||||||||||||||||||||||||||
| MOBILE |
1Q12 | 2Q12 | 3Q12 | 4Q12 | 1Q13 | 2Q13 | 3Q13 | 4Q13 | 1Q14 | 2Q14 | 3Q14 | 4Q14 | FY12 | FY13 | FY14 | |||||||||||||||||||||||||||||||||||||||||||||
| Total operating revenue |
2,844 | 2,999 | 3,346 | 3,207 | 2,897 | 2,936 | 3,069 | 2,866 | 2,682 | 2,754 | 2,906 | 2,870 | 12,397 | 11,768 | 11,212 | |||||||||||||||||||||||||||||||||||||||||||||
| Service revenue |
2,825 | 2,963 | 3,226 | 3,139 | 2,836 | 2,879 | 3,008 | 2,856 | 2,677 | 2,750 | 2,899 | 2,863 | 12,152 | 11,579 | 11,189 | |||||||||||||||||||||||||||||||||||||||||||||
| Data Revenue |
195.2 | 196.9 | 211.2 | 212.9 | 210.7 | 216.0 | 234.0 | 239.0 | 242.3 | 240.4 | 244.6 | 256.4 | 816 | 900 | 984 | |||||||||||||||||||||||||||||||||||||||||||||
| Customers (mln)* |
23.8 | 24.1 | 24.5 | 25.1 | 26.3 | 25.6 | 25.9 | 25.8 | 25.6 | 25.4 | 26.3 | 26.2 | 25.1 | 25.8 | 26.2 | |||||||||||||||||||||||||||||||||||||||||||||
| ARPU (UAH) |
39.5 | 40.5 | 43.4 | 41.7 | 36.5 | 36.5 | 38.2 | 36.5 | 34.6 | 35.7 | 37.0 | 36.1 | n.a. | n.a. | n.a. | |||||||||||||||||||||||||||||||||||||||||||||
| MOU (min) |
509 | 515 | 514 | 512 | 484 | 486 | 497 | 504 | 498 | 506 | 517 | 524 | n.a. | n.a. | n.a. | |||||||||||||||||||||||||||||||||||||||||||||
| Churn 3 months active base (quarterly) (%) |
6.1 | % | 7.9 | % | 7.7 | % | 8.0 | % | 6.9 | % | 11.4 | % | 8.0 | % | 8.4 | % | 7.3 | % | 6.4 | % | 4.8 | % | 6.7 | % | n.a. | n.a. | n.a. | |||||||||||||||||||||||||||||||||
| FIXED-LINE |
1Q12 | 2Q12 | 3Q12 | 4Q12 | 1Q13 | 2Q13 | 3Q13 | 4Q13 | 1Q14 | 2Q14 | 3Q14 | 4Q14 | FY12 | FY13 | FY14 | |||||||||||||||||||||||||||||||||||||||||||||
| Total operating revenue |
235 | 247 | 267 | 247 | 265 | 265 | 290 | 283 | 260 | 280 | 255 | 225 | 996 | 1,103 | 1,020 | |||||||||||||||||||||||||||||||||||||||||||||
| Service revenue |
235 | 247 | 267 | 246 | 265 | 265 | 290 | 282 | 259 | 279 | 254 | 225 | 995 | 1,102 | 1,017 | |||||||||||||||||||||||||||||||||||||||||||||
| Broadband revenue |
58 | 65 | 69 | 82 | 96 | 101 | 104 | 107 | 114 | 111 | 107 | 111 | 275 | 408 | 443 | |||||||||||||||||||||||||||||||||||||||||||||
| Broadband customers (mln) |
0.5 | 0.5 | 0.6 | 0.6 | 0.7 | 0.7 | 0.7 | 0.8 | 0.8 | 0.8 | 0.8 | 0.8 | 0.6 | 0.8 | 0.8 | |||||||||||||||||||||||||||||||||||||||||||||
| Broadband ARPU (UAH) |
45.2 | 45.2 | 43.8 | 47.2 | 50.0 | 49.7 | 48.8 | 48.1 | 49.1 | 47.1 | 44.6 | 45.5 | n.a. | n.a. | n.a. | |||||||||||||||||||||||||||||||||||||||||||||
| * | The 2012 customer base has been adjusted for the alignment of the active customer base definition |
Kazakhstan
index page
(in USD millions, unless stated otherwise, unaudited)
| CONSOLIDATED |
1Q12 | 2Q12 | 3Q12 | 4Q12 | 1Q13 | 2Q13 | 3Q13 | 4Q13 | 1Q14 | 2Q14 | 3Q14 | 4Q14 | FY12 | FY13 | FY14 | |||||||||||||||||||||||||||||||||||||||||||||
| Total operating revenue |
191 | 208 | 218 | 213 | 190 | 207 | 223 | 219 | 180 | 186 | 197 | 193 | 829 | 840 | 756 | |||||||||||||||||||||||||||||||||||||||||||||
| EBITDA |
86 | 98 | 113 | 99 | 89 | 99 | 98 | 105 | 86 | 90 | 95 | 78 | 394 | 391 | 756 | |||||||||||||||||||||||||||||||||||||||||||||
| EBITDA margin (%) |
45.0 | % | 47.0 | % | 51.6 | % | 46.2 | % | 46.7 | % | 47.9 | % | 43.9 | % | 47.7 | % | 47.8 | % | 48.7 | % | 48.2 | % | 40.2 | % | 47.6 | % | 46.5 | % | 46.2 | % | ||||||||||||||||||||||||||||||
| Capital expenditures (CAPEX) |
13 | 45 | 52 | 57 | 25 | 37 | 39 | 58 | 9 | 17 | 26 | 57 | 166 | 159 | 109 | |||||||||||||||||||||||||||||||||||||||||||||
| CAPEX excluding licenses |
13 | 45 | 52 | 57 | 25 | 37 | 39 | 58 | 9 | 17 | 26 | 57 | 166 | 159 | 109 | |||||||||||||||||||||||||||||||||||||||||||||
| Operating cash flow (EBITDA-CAPEX excluding licenses) |
73 | 53 | 61 | 41 | 64 | 62 | 59 | 47 | 77 | 73 | 69 | 21 | 228 | 232 | 240 | |||||||||||||||||||||||||||||||||||||||||||||
| OCF margin (%) |
39 | % | 25 | % | 28 | % | 19 | % | 34 | % | 30 | % | 26 | % | 21 | % | 42 | % | 39 | % | 35 | % | 11 | % | 27 | % | 28 | % | 32 | % | ||||||||||||||||||||||||||||||
| MOBILE |
1Q12 | 2Q12 | 3Q12 | 4Q12 | 1Q13 | 2Q13 | 3Q13 | 4Q13 | 1Q14 | 2Q14 | 3Q14 | 4Q14 | FY12 | FY13 | FY14 | |||||||||||||||||||||||||||||||||||||||||||||
| Total operating revenue |
179 | 194 | 204 | 198 | 174 | 188 | 202 | 198 | 160 | 165 | 177 | 172 | 775 | 761 | 674 | |||||||||||||||||||||||||||||||||||||||||||||
| Service revenue |
179 | 194 | 204 | 198 | 173 | 188 | 202 | 198 | 159 | 165 | 177 | 172 | 775 | 761 | 673 | |||||||||||||||||||||||||||||||||||||||||||||
| Data Revenue |
15.8 | 14.0 | 16.4 | 20.6 | 21.5 | 21.3 | 22.6 | 25.7 | 23.4 | 21.5 | 26.8 | 30.9 | 66.8 | 91.1 | 103 | |||||||||||||||||||||||||||||||||||||||||||||
| Customers (mln) |
8.4 | 8.5 | 8.6 | 8.6 | 8.5 | 8.8 | 9.0 | 9.2 | 9.2 | 9.6 | 9.8 | 9.8 | 8.6 | 9.2 | 9.8 | |||||||||||||||||||||||||||||||||||||||||||||
| Broadband customers using USB modems (mln) * |
4.6 | 4.4 | 4.6 | 4.7 | 4.8 | 4.9 | 5.1 | 5.2 | 5.2 | 5.3 | 5.4 | 5.4 | 4.7 | 5.2 | 5.4 | |||||||||||||||||||||||||||||||||||||||||||||
| ARPU (USD) |
7 | 8 | 8 | 8 | 7 | 7 | 7 | 7 | 6 | 6 | 6 | 6 | n.a. | n.a. | n.a. | |||||||||||||||||||||||||||||||||||||||||||||
| MOU (min) |
180 | 211 | 222 | 237 | 254 | 300 | 311 | 301 | 293 | 326 | 317 | 298 | n.a. | n.a. | n.a. | |||||||||||||||||||||||||||||||||||||||||||||
| Churn 3 months active base (quarterly) (%) |
14.2 | % | 12.9 | % | 14.2 | % | 14.5 | % | 13.2 | % | 10.8 | % | 12.0 | % | 12.9 | % | 12.9 | % | 10.9 | % | 12.9 | % | 13.8 | % | n.a. | n.a. | n.a. | |||||||||||||||||||||||||||||||||
| FIXED-LINE |
1Q12 | 2Q12 | 3Q12 | 4Q12 | 1Q13 | 2Q13 | 3Q13 | 4Q13 | 1Q14 | 2Q14 | 3Q14 | 4Q14 | FY12 | FY13 | FY14 | |||||||||||||||||||||||||||||||||||||||||||||
| Total operating revenue |
12 | 14 | 14 | 15 | 17 | 19 | 21 | 21 | 20 | 21 | 20 | 21 | 55 | 78 | 82 | |||||||||||||||||||||||||||||||||||||||||||||
| Service revenue |
12 | 13 | 14 | 15 | 16 | 19 | 21 | 21 | 20 | 21 | 20 | 21 | 54 | 77 | 82 | |||||||||||||||||||||||||||||||||||||||||||||
| Broadband revenue |
4 | 5 | 5 | 7 | 9 | 9 | 8 | 9 | 9 | 8 | 8 | 9 | 20 | 34 | 34 | |||||||||||||||||||||||||||||||||||||||||||||
| Broadband customers (mln) |
0.1 | 0.1 | 0.1 | 0.2 | 0.2 | 0.2 | 0.2 | 0.2 | 0.2 | 0.2 | 0.2 | 0.2 | 0.2 | 0.2 | 0.2 | |||||||||||||||||||||||||||||||||||||||||||||
| Broadband ARPU (USD) |
16 | 16 | 16 | 17 | 18 | 17 | 17 | 18 | 16 | 14 | 14 | 15 | n.a. | n.a. | n.a. | |||||||||||||||||||||||||||||||||||||||||||||
| (in KZT millions, unless stated otherwise, unaudited) | ||||||||||||||||||||||||||||||||||||||||||||||||||||||||||||
| CONSOLIDATED |
1Q12 | 2Q12 | 3Q12 | 4Q12 | 1Q13 | 2Q13 | 3Q13 | 4Q13 | 1Q14 | 2Q14 | 3Q14 | 4Q14 | FY12 | FY13 | FY14 | |||||||||||||||||||||||||||||||||||||||||||||
| Total operating revenue |
28,237 | 30,746 | 32,626 | 32,055 | 28,650 | 31,300 | 34,068 | 33,730 | 30,453 | 33,920 | 35,928 | 34,965 | 123,665 | 127,748 | 135,266 | |||||||||||||||||||||||||||||||||||||||||||||
| EBITDA |
12,706 | 14,456 | 16,828 | 14,822 | 13,373 | 14,991 | 14,966 | 16,105 | 14,558 | 16,532 | 17,322 | 14,061 | 58,814 | 59,435 | 62,473 | |||||||||||||||||||||||||||||||||||||||||||||
| EBITDA margin (%) |
45.0 | % | 47.0 | % | 51.6 | % | 46.2 | % | 46.7 | % | 47.9 | % | 43.9 | % | 47.7 | % | 47.8 | % | 48.7 | % | 48.2 | % | 40.2 | % | 47.6 | % | 46.5 | % | 46.2 | % | ||||||||||||||||||||||||||||||
| Capital expenditures (CAPEX) |
1,826 | 6,617 | 7,724 | 8,639 | 3,698 | 5,626 | 6,017 | 8,900 | 1,637 | 3,170 | 4,805 | 10,057 | 24,806 | 24,241 | 19,669 | |||||||||||||||||||||||||||||||||||||||||||||
| CAPEX excluding licenses |
1,826 | 6,617 | 7,724 | 8,639 | 3,698 | 5,626 | 6,017 | 8,900 | 1,637 | 3,170 | 4,805 | 10,057 | 24,806 | 24,241 | 19,669 | |||||||||||||||||||||||||||||||||||||||||||||
| Operating cash flow (EBITDA-CAPEX excluding licenses) |
10,880 | 7,839 | 9,104 | 6,183 | 9,676 | 9,364 | 8,949 | 7,205 | 12,921 | 13,362 | 12,517 | 4,004 | 34,006 | 35,194 | 42,804 | |||||||||||||||||||||||||||||||||||||||||||||
| OCF margin (%) |
39 | % | 25 | % | 28 | % | 19 | % | 34 | % | 30 | % | 26 | % | 21 | % | 42 | % | 39 | % | 35 | % | 11 | % | 27 | % | 28 | % | 32 | % | ||||||||||||||||||||||||||||||
| MOBILE |
1Q12 | 2Q12 | 3Q12 | 4Q12 | 1Q13 | 2Q13 | 3Q13 | 4Q13 | 1Q14 | 2Q14 | 3Q14 | 4Q14 | FY12 | FY13 | FY14 | |||||||||||||||||||||||||||||||||||||||||||||
| Total operating revenue |
26,459 | 28,748 | 30,566 | 29,770 | 26,149 | 28,383 | 30,911 | 30,513 | 27,009 | 30,167 | 32,284 | 31,183 | 115,543 | 115,956 | 120,643 | |||||||||||||||||||||||||||||||||||||||||||||
| Service revenue |
26,453 | 28,733 | 30,488 | 29,763 | 26,129 | 28,343 | 30,882 | 30,482 | 26,976 | 30,131 | 32,257 | 31,148 | 115,438 | 115,835 | 120,512 | |||||||||||||||||||||||||||||||||||||||||||||
| Data Revenue |
2,348 | 2,079 | 2,448 | 3,100 | 3,232 | 3,219 | 3,463 | 3,956 | 3,947 | 3,927 | 4,883 | 5,603 | 9,975 | 13,870 | 18,359 | |||||||||||||||||||||||||||||||||||||||||||||
| Customers (mln) |
8.4 | 8.5 | 8.6 | 8.6 | 8.5 | 8.8 | 9.0 | 9.2 | 9.2 | 9.6 | 9.8 | 9.8 | 8.6 | 9.2 | 9.2 | |||||||||||||||||||||||||||||||||||||||||||||
| Broadband customers using USB modems (mln) * |
4.6 | 4.4 | 4.6 | 4.7 | 4.8 | 4.9 | 5.1 | 5.2 | 5.2 | 5.3 | 5.4 | 5.4 | 4.7 | 5.2 | 5.4 | |||||||||||||||||||||||||||||||||||||||||||||
| ARPU (KZT) |
1,049 | 1,137 | 1,187 | 1,156 | 1,012 | 1,101 | 1,141 | 1,110 | 975 | 1,058 | 1,098 | 1,041 | n.a. | n.a. | n.a. | |||||||||||||||||||||||||||||||||||||||||||||
| MOU (min) |
180 | 211 | 222 | 237 | 254 | 300 | 311 | 301 | 293 | 326 | 317 | 298 | n.a. | n.a. | n.a. | |||||||||||||||||||||||||||||||||||||||||||||
| Churn 3 months active base (quarterly) (%) |
14.2 | % | 12.9 | % | 14.2 | % | 14.5 | % | 13.2 | % | 10.8 | % | 12.0 | % | 12.9 | % | 12.9 | % | 10.9 | % | 12.9 | % | 13.8 | % | n.a. | n.a. | n.a. | |||||||||||||||||||||||||||||||||
| FIXED-LINE |
1Q12 | 2Q12 | 3Q12 | 4Q12 | 1Q13 | 2Q13 | 3Q13 | 4Q13 | 1Q14 | 2Q14 | 3Q14 | 4Q14 | FY12 | FY13 | FY14 | |||||||||||||||||||||||||||||||||||||||||||||
| Total operating revenue |
1,778 | 2,000 | 2,065 | 2,286 | 2,500 | 2,917 | 3,208 | 3,217 | 3,444 | 3,753 | 3,644 | 3,782 | 8,129 | 11,842 | 14,623 | |||||||||||||||||||||||||||||||||||||||||||||
| Service revenue |
1,763 | 1,982 | 2,040 | 2,265 | 2,480 | 2,940 | 3,147 | 3,214 | 3,440 | 3,748 | 3,608 | 3,769 | 8,050 | 11,781 | 14,565 | |||||||||||||||||||||||||||||||||||||||||||||
| Broadband revenue |
533 | 667 | 733 | 1,008 | 1,280 | 1,315 | 1,289 | 1,439 | 1,514 | 1,502 | 1,445 | 1,643 | 2,941 | 5,323 | 6,104 | |||||||||||||||||||||||||||||||||||||||||||||
| Broadband customers (mln) |
0.1 | 0.1 | 0.1 | 0.2 | 0.2 | 0.2 | 0.2 | 0.2 | 0.2 | 0.2 | 0.2 | 0.2 | 0.2 | 0.2 | 0.2 | |||||||||||||||||||||||||||||||||||||||||||||
| Broadband ARPU (KZT) |
2,296 | 2,341 | 2,395 | 2,617 | 2,651 | 2,600 | 2,597 | 2,707 | 2,685 | 2,632 | 2,581 | 2,740 | n.a. | n.a. | n.a. | |||||||||||||||||||||||||||||||||||||||||||||
| * | Broadband customers are the customer contracts that served as a basis for revenue generating activity in the three months prior to the measurement date, as a result of activities including monthly internet access using FTTB and xDSL technologies as well as mobile internet access using 2.5G/3G/HSPA+ technologies. |
Uzbekistan
index page
(in USD millions, unless stated otherwise, unaudited)
| CONSOLIDATED |
1Q12 | 2Q12 | 3Q12 | 4Q12 | 1Q13 | 2Q13 | 3Q13 | 4Q13* | 1Q14 | 2Q14 | 3Q14 | 4Q14 | FY12 | FY13* | FY14 | |||||||||||||||||||||||||||||||||||||||||||||
| Total operating revenue |
79 | 89 | 137 | 158 | 157 | 167 | 176 | 173 | 163 | 179 | 190 | 186 | 463 | 672 | 718 | |||||||||||||||||||||||||||||||||||||||||||||
| EBITDA |
35 | 45 | 77 | 95 | 102 | 108 | 116 | 21 | 105 | 115 | 127 | 115 | 253 | 347 | 462 | |||||||||||||||||||||||||||||||||||||||||||||
| EBITDA margin (%) |
44.6 | % | 50.6 | % | 56.2 | % | 60.3 | % | 65.2 | % | 64.7 | % | 66.0 | % | 11.9 | % | 64.4 | % | 64.2 | % | 66.5 | % | 61.6 | % | 54.6 | % | 51.5 | % | 64.2 | % | ||||||||||||||||||||||||||||||
| Capital expenditures (CAPEX) |
38 | 36 | 20 | 43 | 59 | 35 | 65 | -17 | 21 | 10 | 20 | 28 | 137 | 142 | 79 | |||||||||||||||||||||||||||||||||||||||||||||
| CAPEX excluding licenses |
38 | 36 | 20 | 43 | 59 | 35 | 65 | -17 | 21 | 10 | 20 | 28 | 137 | 142 | 79 | |||||||||||||||||||||||||||||||||||||||||||||
| Operating cash flow (EBITDA-CAPEX excluding licenses) |
(3 | ) | 9 | 57 | 53 | 44 | 73 | 51 | 38 | 84 | 104 | 106 | 87 | 116 | 205 | 381 | ||||||||||||||||||||||||||||||||||||||||||||
| OCF margin (%) |
-4 | % | 10 | % | 42 | % | 33 | % | 28 | % | 44 | % | 29 | % | 22 | % | 52 | % | 58 | % | 56 | % | 47 | % | 25 | % | 31 | % | 53 | % | ||||||||||||||||||||||||||||||
| MOBILE |
1Q12 | 2Q12 | 3Q12 | 4Q12 | 1Q13 | 2Q13 | 3Q13 | 4Q13 | 1Q14 | 2Q14 | 3Q14 | 4Q14 | FY12 | FY13 | FY14 | |||||||||||||||||||||||||||||||||||||||||||||
| Total operating revenue |
77 | 87 | 135 | 156 | 155 | 165 | 174 | 171 | 161 | 177 | 189 | 184 | 455 | 665 | 711 | |||||||||||||||||||||||||||||||||||||||||||||
| Service revenue |
75 | 86 | 134 | 155 | 154 | 164 | 174 | 171 | 161 | 176 | 189 | 184 | 451 | 663 | 710 | |||||||||||||||||||||||||||||||||||||||||||||
| Data Revenue |
8.1 | 8.5 | 13.5 | 16.9 | 20.2 | 21.5 | 25.7 | 27.3 | 30.4 | 31.3 | 34.9 | 35.7 | 47.1 | 94.8 | 132.3 | |||||||||||||||||||||||||||||||||||||||||||||
| Customers (mln) |
7.3 | 7.0 | 9.2 | 10.2 | 10.3 | 10.2 | 10.3 | 10.5 | 10.4 | 10.4 | 10.5 | 10.6 | 10.2 | 10.5 | 10.6 | |||||||||||||||||||||||||||||||||||||||||||||
| Broadband customers using USB modems (mln) ** |
2.9 | 2.9 | 4.2 | 4.8 | 5.0 | 5.0 | 5.3 | 5.4 | 5.4 | 5.3 | 5.4 | 5.5 | 4.8 | 5.4 | 5.5 | |||||||||||||||||||||||||||||||||||||||||||||
| ARPU (USD) |
3.5 | 4.1 | 5.3 | 5.3 | 5.0 | 5.3 | 5.6 | 5.0 | 5.1 | 5.6 | 6.0 | 5.8 | n.a. | n.a. | n.a. | |||||||||||||||||||||||||||||||||||||||||||||
| MOU (min) |
376 | 433 | 543 | 516 | 425 | 472 | 504 | 493 | 465 | 531 | 568 | 528 | n.a. | n.a. | n.a. | |||||||||||||||||||||||||||||||||||||||||||||
| Churn 3 months active base (quarterly) (%) |
6.1 | % | 23.4 | % | 15.5 | % | 10.9 | % | 12.7 | % | 14.5 | % | 13.9 | % | 12.6 | % | 12.2 | % | 11.5 | % | 12.2 | % | 12.1 | % | n.a. | n.a. | n.a. | |||||||||||||||||||||||||||||||||
| FIXED-LINE |
1Q12 | 2Q12 | 3Q12 | 4Q12 | 1Q13 | 2Q13 | 3Q13 | 4Q13 | 1Q14 | 2Q14 | 3Q14 | 4Q14 | FY12 | FY13 | FY14 | |||||||||||||||||||||||||||||||||||||||||||||
| Total operating revenue |
2.1 | 2.2 | 2.0 | 2.0 | 1.9 | 1.9 | 2.0 | 2.0 | 2.0 | 2.0 | 2.0 | 2.0 | 8.3 | 7.8 | 8.0 | |||||||||||||||||||||||||||||||||||||||||||||
| Service revenue |
2.1 | 2.2 | 2.0 | 2.0 | 1.9 | 1.9 | 1.9 | 1.8 | 1.8 | 2.0 | 2.0 | 2.0 | 8.3 | 7.5 | 7.8 | |||||||||||||||||||||||||||||||||||||||||||||
| Broadband revenue |
0.8 | 0.8 | 0.7 | 0.7 | 0.7 | 0.7 | 0.7 | 0.7 | 0.7 | 0.7 | 0.7 | 0.6 | 3.0 | 2.8 | 2.7 | |||||||||||||||||||||||||||||||||||||||||||||
| Broadband customers (mln) |
0.0 | 0.0 | 0.0 | 0.0 | 0.0 | 0.0 | 0.0 | 0.0 | 0.0 | 0.0 | 0.0 | 0.0 | 0.0 | 0.0 | 0.0 | |||||||||||||||||||||||||||||||||||||||||||||
| Broadband ARPU (USD) |
15.2 | 13.6 | 11.0 | 11.3 | 13.3 | 12.8 | 12.3 | 13.0 | 21.0 | 19.0 | 14.0 | 16.9 | n.a. | n.a. | n.a. | |||||||||||||||||||||||||||||||||||||||||||||
| * | EBITDA and CAPEX were restated as fixed assets that should not have been capitalized in 2012 and 2011 were written off and accounted for as operating expenses |
| ** | Broadband customers are the customer contracts that served as a basis for revenue generating activity in the three months prior to the measurement date, as a result of activities including monthly internet access using FTTB and xDSL technologies as well as mobile internet access using 2.5G/3G/HSPA+ technologies. |
Armenia
index page
(in USD millions, unless stated otherwise, unaudited)
| CONSOLIDATED |
1Q12 | 2Q12 | 3Q12 | 4Q12 | 1Q13 | 2Q13 | 3Q13 | 4Q13 | 1Q14 | 2Q14 | 3Q14 | 4Q14 | FY12 | FY13 | FY14 | |||||||||||||||||||||||||||||||||||||||||||||
| Total operating revenue |
39 | 40 | 40 | 39 | 35 | 35 | 37 | 38 | 33 | 34 | 39 | 32 | 158 | 145 | 138 | |||||||||||||||||||||||||||||||||||||||||||||
| EBITDA |
15 | 15 | 18 | 15 | 14 | 14 | 16 | 13 | 12 | 13 | 15 | 6 | 63 | 57 | 46 | |||||||||||||||||||||||||||||||||||||||||||||
| EBITDA margin (%) |
38.0 | % | 37.5 | % | 43.5 | % | 39.5 | % | 39.1 | % | 40.7 | % | 42.4 | % | 35.2 | % | 36.6 | % | 37.1 | % | 37.7 | % | 19.3 | % | 39.8 | % | 39.4 | % | 32.5 | % | ||||||||||||||||||||||||||||||
| Capital expenditures (CAPEX) |
3 | 4 | 4 | 3 | 1 | 2 | 4 | 4 | 1 | 2 | 5 | 6 | 15 | 11 | 14 | |||||||||||||||||||||||||||||||||||||||||||||
| CAPEX excluding licenses |
3 | 4 | 4 | 3 | 1 | 2 | 4 | 4 | 1 | 2 | 5 | 6 | 15 | 11 | 14 | |||||||||||||||||||||||||||||||||||||||||||||
| Operating cash flow (EBITDA-CAPEX excluding licenses) |
12 | 11 | 13 | 12 | 12 | 12 | 12 | 9 | 11 | 11 | 10 | — | 48 | 46 | 32 | |||||||||||||||||||||||||||||||||||||||||||||
| OCF margin (%) |
30 | % | 27 | % | 33 | % | 31 | % | 35 | % | 35 | % | 32 | % | 24 | % | 33 | % | 30 | % | 26 | % | 0 | % | 30 | % | 32 | % | 22 | % | ||||||||||||||||||||||||||||||
| MOBILE |
1Q12 | 2Q12 | 3Q12 | 4Q12 | 1Q13 | 2Q13 | 3Q13 | 4Q13 | 1Q14 | 2Q14 | 3Q14 | 4Q14 | FY12 | FY13 | FY14 | |||||||||||||||||||||||||||||||||||||||||||||
| Total operating revenue |
17 | 18 | 19 | 18 | 15 | 15 | 17 | 17 | 14 | 15 | 18 | 15 | 71 | 64 | 62 | |||||||||||||||||||||||||||||||||||||||||||||
| Service revenue |
15 | 16 | 17 | 16 | 14 | 15 | 17 | 16 | 13 | 15 | 17 | 14 | 64 | 62 | 59 | |||||||||||||||||||||||||||||||||||||||||||||
| Data Revenue |
1.02 | 0.94 | 1.08 | 1.22 | 1.29 | 1.24 | 1.29 | 1.36 | 1.39 | 1.38 | 1.50 | 1.47 | 4.3 | 5.1 | 6 | |||||||||||||||||||||||||||||||||||||||||||||
| Customers (mln) |
0.8 | 0.8 | 0.8 | 0.8 | 0.8 | 0.7 | 0.7 | 0.7 | 0.7 | 0.7 | 0.8 | 0.8 | 0.8 | 0.7 | 0.8 | |||||||||||||||||||||||||||||||||||||||||||||
| Broadband customers using USB modems (mln) * |
0.3 | 0.3 | 0.4 | 0.4 | 0.3 | 0.3 | 0.3 | 0.3 | 0.3 | 0.3 | 0.4 | 0.4 | 0.4 | 0.3 | 0.4 | |||||||||||||||||||||||||||||||||||||||||||||
| ARPU (USD) |
6.5 | 6.8 | 7.3 | 6.6 | 6.0 | 6.7 | 6.9 | 7.7 | 6.3 | 6.7 | 7.4 | 6.0 | n.a. | n.a. | n.a. | |||||||||||||||||||||||||||||||||||||||||||||
| MOU (min) |
252 | 279 | 271 | 273 | 295 | 353 | 377 | 388 | 365 | 382 | 377 | 371 | n.a. | n.a. | n.a. | |||||||||||||||||||||||||||||||||||||||||||||
| Churn 3 months active base (quarterly) (%) |
21.9 | % | 20.2 | % | 19.7 | % | 22.2 | % | 20.4 | % | 17.9 | % | 13.5 | % | 12.4 | % | 11.0 | % | 11.2 | % | 10.8 | % | 10.9 | % | n.a. | n.a. | n.a. | |||||||||||||||||||||||||||||||||
| FIXED-LINE |
1Q12 | 2Q12 | 3Q12 | 4Q12 | 1Q13 | 2Q13 | 3Q13 | Q4 2013 |
1Q14 | 2Q14 | 3Q14 | 4Q14 | FY12 | FY13 | FY14 | |||||||||||||||||||||||||||||||||||||||||||||
| Total operating revenue |
22 | 22 | 21 | 21 | 20 | 20 | 20 | 21 | 19 | 19 | 21 | 17 | 87 | 81 | 76 | |||||||||||||||||||||||||||||||||||||||||||||
| Service revenue |
22 | 22 | 21 | 21 | 20 | 20 | 19 | 21 | 19 | 19 | 21 | 17 | 86 | 80 | 76 | |||||||||||||||||||||||||||||||||||||||||||||
| Broadband revenue |
5.7 | 5.7 | 5.5 | 5.7 | 5.6 | 5.4 | 5.4 | 5.4 | 5.1 | 4.9 | 4.7 | 4.4 | 22.6 | 21.8 | 19 | |||||||||||||||||||||||||||||||||||||||||||||
| Broadband customers (mln) |
0.1 | 0.1 | 0.1 | 0.2 | 0.2 | 0.2 | 0.2 | 0.2 | 0.2 | 0.2 | 0.2 | 0.2 | 0.2 | 0.2 | 0.2 | |||||||||||||||||||||||||||||||||||||||||||||
| Broadband ARPU (USD) |
14.9 | 13.8 | 12.9 | 12.6 | 11.9 | 11.3 | 11.2 | 11.0 | 10.6 | 10.3 | 10.3 | 9.7 | n.a. | n.a. | n.a. | |||||||||||||||||||||||||||||||||||||||||||||
| (in AMD millions, unless stated otherwise, unaudited) |
|
|||||||||||||||||||||||||||||||||||||||||||||||||||||||||||
| CONSOLIDATED |
1Q12 | 2Q12 | 3Q12 | 4Q12 | 1Q13 | 2Q13 | 3Q13 | 4Q13 | 1Q14 | 2Q14 | 3Q14 | 4Q14 | FY12 | FY13 | FY14 | |||||||||||||||||||||||||||||||||||||||||||||
| Total operating revenue |
15,104 | 16,021 | 16,611 | 15,706 | 14,179 | 14,485 | 15,237 | 15,378 | 13,672 | 14,136 | 15,812 | 13,859 | 63,441 | 59,278 | 57,479 | |||||||||||||||||||||||||||||||||||||||||||||
| EBITDA |
5,766 | 6,065 | 7,225 | 6,202 | 5,551 | 5,901 | 6,468 | 5,421 | 4,997 | 5,239 | 5,956 | 2,478 | 25,257 | 23,340 | 18,670 | |||||||||||||||||||||||||||||||||||||||||||||
| EBITDA margin (%) |
38.2 | % | 37.9 | % | 43.5 | % | 39.5 | % | 39.1 | % | 40.7 | % | 42.4 | % | 35.2 | % | 36.6 | % | 37.1 | % | 37.7 | % | 17.9 | % | 39.8 | % | 39.4 | % | 32.5 | % | ||||||||||||||||||||||||||||||
| Capital expenditures (CAPEX) |
1,275 | 1,762 | 1,730 | 1,333 | 525 | 776 | 1,576 | 1,759 | 501 | 1,025 | 1,977 | 2,605 | 6,100 | 4,636 | 6,108 | |||||||||||||||||||||||||||||||||||||||||||||
| CAPEX excluding licenses |
1,275 | 1,762 | 1,730 | 1,333 | 525 | 776 | 1,576 | 1,759 | 501 | 1,025 | 1,977 | 2,605 | 6,100 | 4,636 | 6,108 | |||||||||||||||||||||||||||||||||||||||||||||
| Operating cash flow (EBITDA-CAPEX excluding licenses) |
4,491 | 4,303 | 5,495 | 4,869 | 5,025 | 5,125 | 4,892 | 3,662 | 4,496 | 4,214 | 3,979 | (127 | ) | 19,157 | 18,704 | 12,562 | ||||||||||||||||||||||||||||||||||||||||||||
| OCF margin (%) |
30 | % | 27 | % | 33 | % | 31 | % | 35 | % | 35 | % | 32 | % | 24 | % | 33 | % | 30 | % | 25 | % | -1 | % | 30 | % | 32 | % | 22 | % | ||||||||||||||||||||||||||||||
| MOBILE |
1Q12 | 2Q12 | 3Q12 | 4Q12 | 1Q13 | 2Q13 | 3Q13 | 4Q13 | 1Q14 | 2Q14 | 3Q14 | 4Q14 | FY12 | FY13 | FY14 | |||||||||||||||||||||||||||||||||||||||||||||
| Total operating revenue |
6,523 | 7,067 | 7,894 | 7,121 | 5,966 | 6,267 | 7,214 | 6,812 | 5,856 | 6,297 | 7158 | 6429 | 28,605 | 26,259 | 25,740 | |||||||||||||||||||||||||||||||||||||||||||||
| Service revenue |
5,727 | 6,233 | 7,105 | 6,437 | 5,739 | 6,189 | 7,086 | 6,573 | 5,519 | 6,033 | 6,935 | 6,155 | 25,502 | 25,587 | 24,642 | |||||||||||||||||||||||||||||||||||||||||||||
| Data Revenue |
396 | 379 | 443 | 497 | 527 | 514 | 528 | 553 | 572 | 570 | 614 | 634 | 1,715 | 2,122 | 2,389 | |||||||||||||||||||||||||||||||||||||||||||||
| Customers (mln) |
0.8 | 0.8 | 0.8 | 0.8 | 0.8 | 0.7 | 0.7 | 0.7 | 0.7 | 0.7 | 0.8 | 0.8 | 0.8 | 0.7 | 0.8 | |||||||||||||||||||||||||||||||||||||||||||||
| Broadband customers using USB modems (mln) * |
0.3 | 0.3 | 0.4 | 0.4 | 0.3 | 0.3 | 0.3 | 0.3 | 0.3 | 0.3 | 0.4 | 0.4 | 0.4 | 0.3 | 0.4 | |||||||||||||||||||||||||||||||||||||||||||||
| ARPU (AMD) |
2508.0 | 2741.0 | 2994.0 | 2678.0 | 2446.2 | 2781.0 | 3292.1 | 3093.4 | 2589.4 | 2752.2 | 3020.4 | 2587.6 | n.a. | n.a. | n.a. | |||||||||||||||||||||||||||||||||||||||||||||
| MOU (min) |
252 | 279 | 271 | 273 | 295 | 353 | 377 | 388 | 365 | 382 | 377 | 371 | n.a. | n.a. | n.a. | |||||||||||||||||||||||||||||||||||||||||||||
| Churn 3 months active base (quarterly) (%) |
21.9 | % | 20.2 | % | 19.7 | % | 22.2 | % | 20.4 | % | 17.9 | % | 13.5 | % | 12.4 | % | 11.0 | % | 11.2 | % | 10.8 | % | 10.9 | % | n.a. | n.a. | n.a. | |||||||||||||||||||||||||||||||||
| FIXED |
1Q12 | 2Q12 | 3Q12 | 4Q12 | 1Q13 | 2Q13 | 3Q13 | 4Q13 | 1Q14 | 2Q14 | 3Q14 | 4Q14 | FY12 | FY13 | FY14 | |||||||||||||||||||||||||||||||||||||||||||||
| Total operating revenue |
8,581 | 8,954 | 8,717 | 8,585 | 8,172 | 8,218 | 8,022 | 8,566 | 7,816 | 7,840 | 8,654 | 7,430 | 34,837 | 32,978 | 31,740 | |||||||||||||||||||||||||||||||||||||||||||||
| Service revenue |
8,383 | 8,775 | 8,586 | 8,495 | 8,122 | 8,173 | 7,954 | 8,510 | 7,766 | 7,811 | 8,638 | 7,407 | 34,239 | 32,759 | 31,622 | |||||||||||||||||||||||||||||||||||||||||||||
| Broadband revenue |
2,213 | 2,289 | 2,261 | 2,319 | 2,288 | 2,241 | 2,224 | 2,189 | 2,095 | 2,011 | 1,934 | 1,899 | 9,082 | 8,942 | 7,938 | |||||||||||||||||||||||||||||||||||||||||||||
| Broadband customers (mln) |
0.1 | 0.1 | 0.1 | 0.2 | 0.2 | 0.2 | 0.2 | 0.2 | 0.2 | 0.2 | 0.2 | 0.2 | 0.2 | 0.2 | 0.2 | |||||||||||||||||||||||||||||||||||||||||||||
| Broadband ARPU (AMD) |
5,785 | 5,541 | 5,304 | 5,127 | 4,863 | 4,690 | 4,612 | 4,461 | 4,369 | 4,260 | 4,189 | 4,174 | n.a. | n.a. | n.a. | |||||||||||||||||||||||||||||||||||||||||||||
| * | Broadband customers are the customer contracts that served as a basis for revenue generating activity in the three months prior to the measurement date, as a result of activities including monthly internet access using FTTB and xDSL technologies as well as mobile internet access using 2.5G/3G/HSPA+ technologies. |
Tajikistan
index page
(in USD millions, unless stated otherwise, unaudited)
| CONSOLIDATED |
1Q12 | 2Q12 | 3Q12 | 4Q12 | 1Q13 | 2Q13 | 3Q13 | 4Q13 | 1Q14 | 2Q14 | 3Q14 | 4Q14 | FY12 | FY13 | FY14 | |||||||||||||||||||||||||||||||||||||||||||||
| Total operating revenue |
21 | 26 | 31 | 29 | 29 | 38 | 44 | 37 | 31 | 37 | 41 | 33 | 107 | 148 | 142 | |||||||||||||||||||||||||||||||||||||||||||||
| EBITDA |
9 | 13 | 16 | 13 | 12 | 20 | 24 | 18 | 14 | 14 | 20 | 13 | 51 | 74 | 61 | |||||||||||||||||||||||||||||||||||||||||||||
| EBITDA margin (%) |
42.0 | % | 49.6 | % | 52.2 | % | 45.9 | % | 42.5 | % | 52.0 | % | 53.8 | % | 48.2 | % | 46.6 | % | 38.5 | % | 49.9 | % | 38.5 | % | 47.9 | % | 49.7 | % | 43.5 | % | ||||||||||||||||||||||||||||||
| Capital expenditures (CAPEX) |
3 | 7 | 5 | 6 | 4 | 5 | 3 | 5 | 2 | 4 | 1 | 11 | 20 | 16 | 18 | |||||||||||||||||||||||||||||||||||||||||||||
| CAPEX excluding licenses |
3 | 7 | 5 | 6 | 4 | 5 | 3 | 5 | 2 | 4 | 1 | 11 | 20 | 16 | 18 | |||||||||||||||||||||||||||||||||||||||||||||
| Operating cash flow (EBITDA-CAPEX excluding licenses) |
6 | 6 | 12 | 8 | 9 | 15 | 21 | 13 | 13 | 11 | 19 | 2 | 31 | 57 | 44 | |||||||||||||||||||||||||||||||||||||||||||||
| OCF margin (%) |
29 | % | 22 | % | 37 | % | 26 | % | 30 | % | 40 | % | 48 | % | 34 | % | 41 | % | 29 | % | 47 | % | 5 | % | 29 | % | 39 | % | 31 | % | ||||||||||||||||||||||||||||||
| MOBILE |
1Q12 | 2Q12 | 3Q12 | 4Q12 | 1Q13 | 2Q13 | 3Q13 | 4Q13 | 1Q14 | 2Q14 | 3Q14 | 4Q14 | FY12 | FY13 | FY14 | |||||||||||||||||||||||||||||||||||||||||||||
| Total operating revenue |
21 | 25 | 29 | 28 | 28 | 37 | 43 | 36 | 31 | 37 | 41 | 33 | 103 | 144 | 142 | |||||||||||||||||||||||||||||||||||||||||||||
| Service revenue |
20 | 25 | 28 | 28 | 29 | 37 | 43 | 36 | 31 | 37 | 41 | 33 | 102 | 145 | 142 | |||||||||||||||||||||||||||||||||||||||||||||
| Data Revenue |
0.56 | 0.62 | 0.66 | 0.70 | 0.78 | 0.69 | 0.86 | 1.01 | 1.15 | 1.04 | 0.92 | 0.90 | 2.54 | 3.34 | 4.01 | |||||||||||||||||||||||||||||||||||||||||||||
| Customers (mln) |
1.0 | 1.0 | 0.9 | 1.1 | 1.2 | 1.2 | 1.2 | 1.3 | 1.3 | 1.3 | 1.3 | 1.3 | 1.1 | 1.3 | 1.3 | |||||||||||||||||||||||||||||||||||||||||||||
| Broadband customers using USB modems (mln) * |
0.4 | 0.4 | 0.4 | 0.4 | 0.5 | 0.4 | 0.5 | 0.5 | 0.6 | 0.6 | 0.6 | 0.5 | 0.4 | 0.5 | 0.5 | |||||||||||||||||||||||||||||||||||||||||||||
| ARPU (USD) |
6.7 | 8.5 | 10.1 | 8.9 | 8.2 | 10.4 | 11.7 | 9.6 | 7.9 | 9.6 | 10.7 | 8.6 | n.a. | n.a. | n.a. | |||||||||||||||||||||||||||||||||||||||||||||
| MOU (min) |
219 | 246 | 242 | 256 | 235 | 263 | 277 | 307 | 278 | 283 | 297 | 287 | n.a. | n.a. | n.a. | |||||||||||||||||||||||||||||||||||||||||||||
| Churn 3 months active base (quarterly) (%) |
13.6 | % | 22.9 | % | 19.3 | % | 17.1 | % | 20.4 | % | 19.8 | % | 20.7 | % | 17.4 | % | 18.0 | % | 20.5 | % | 20.5 | % | 18.2 | % | n.a. | n.a. | n.a. | |||||||||||||||||||||||||||||||||
| FIXED-LINE |
1Q12 | 2Q12 | 3Q12 | 4Q12 | 1Q13 | 2Q13 | 3Q13 | 4Q13 | 1Q14 | 2Q14 | 3Q14 | 4Q14 | FY12 | FY13 | FY14 | |||||||||||||||||||||||||||||||||||||||||||||
| Total operating revenue |
1.0 | 1.4 | 1.7 | 1.2 | 0.7 | 0.9 | 1.0 | 0.1 | 0.0 | 0.2 | 0.1 | 0.0 | 4.3 | 2.7 | 0.3 | |||||||||||||||||||||||||||||||||||||||||||||
| * | Broadband customers are the customer contracts that served as a basis for revenue generating activity in the three months prior to the measurement date, as a result of activities including monthly internet access using FTTB and xDSL technologies as well as mobile internet access using 2.5G/3G/HSDPA technologies. |
Georgia
index page
(in USD millions, unless stated otherwise, unaudited)
| CONSOLIDATED |
1Q12 | 2Q12 | 3Q12 | 4Q12 | 1Q13 | 2Q13 | 3Q13 | 4Q13 | 1Q14 | 2Q14 | 3Q14 | 4Q14 | FY12 | FY13 | FY14 | |||||||||||||||||||||||||||||||||||||||||||||
| Total operating revenue |
16 | 18 | 23 | 21 | 20 | 22 | 24 | 22 | 19 | 18 | 21 | 21 | 78 | 88 | 79 | |||||||||||||||||||||||||||||||||||||||||||||
| EBITDA |
4 | 5 | 7 | 6 | 6 | 7 | 8 | 6 | 5 | 4 | 6 | 5 | 21 | 27 | 20 | |||||||||||||||||||||||||||||||||||||||||||||
| EBITDA margin (%) |
22.4 | % | 27.3 | % | 29.8 | % | 28.8 | % | 27.9 | % | 31.0 | % | 33.6 | % | 28.6 | % | 26.2 | % | 25.2 | % | 27.7 | % | 21.4 | % | 27.3 | % | 30.4 | % | 25.1 | % | ||||||||||||||||||||||||||||||
| Capital expenditures (CAPEX) |
3 | 4 | 2 | 3 | 1 | 2 | 12 | 4 | 2 | 3 | 6 | 10 | 13 | 18 | 21 | |||||||||||||||||||||||||||||||||||||||||||||
| CAPEX excluding licenses |
3 | 4 | 2 | 3 | 1 | 2 | 12 | 4 | 2 | 3 | 6 | 8 | 13 | 18 | 18 | |||||||||||||||||||||||||||||||||||||||||||||
| Operating cash flow (EBITDA-CAPEX excluding licenses) |
1 | 1 | 5 | 3 | 5 | 5 | (4 | ) | 2 | 3 | 1 | 0 | -3 | 9 | 8 | 1 | ||||||||||||||||||||||||||||||||||||||||||||
| OCF margin (%) |
7 | % | 3 | % | 18 | % | 11 | % | 24 | % | 22 | % | (13 | %) | 13 | % | 18 | % | 10 | % | 2 | % | -15 | % | 11 | % | 11 | % | 2 | % | ||||||||||||||||||||||||||||||
| MOBILE |
1Q12 | 2Q12 | 3Q12 | 4Q12 | 1Q13 | 2Q13 | 3Q13 | 4Q13 | 1Q14 | 2Q14 | 3Q14 | 4Q14 | FY12 | FY13 | FY14 | |||||||||||||||||||||||||||||||||||||||||||||
| Total operating revenue |
16 | 18 | 22 | 20 | 19 | 20 | 23 | 21 | 18 | 17 | 20 | 19 | 77 | 83 | 74 | |||||||||||||||||||||||||||||||||||||||||||||
| Service revenue |
15 | 18 | 21 | 19 | 18 | 19 | 22 | 20 | 17 | 17 | 20 | 19 | 73 | 79 | 73 | |||||||||||||||||||||||||||||||||||||||||||||
| Data Revenue |
0.5 | 0.6 | 0.7 | 0.7 | 0.6 | 0.6 | 0.7 | 0.7 | 0.6 | 0.6 | 0.7 | 0.6 | 2.3 | 2.6 | 2.5 | |||||||||||||||||||||||||||||||||||||||||||||
| Customers (mln) |
0.9 | 0.9 | 1.0 | 1.0 | 1.0 | 1.0 | 1.1 | 1.1 | 1.1 | 1.1 | 1.3 | 1.3 | 1.0 | 1.1 | 1.3 | |||||||||||||||||||||||||||||||||||||||||||||
| Broadband customers using USB modems (mln) * |
0.4 | 0.4 | 0.4 | 0.4 | 0.4 | 0.4 | 0.4 | 0.4 | 0.4 | 0.4 | 0.4 | 0.4 | 0.4 | 0.4 | 0.4 | |||||||||||||||||||||||||||||||||||||||||||||
| ARPU (USD) |
5.9 | 6.6 | 7.4 | 6.6 | 6.3 | 6.4 | 6.4 | 5.9 | 5.0 | 4.9 | 5.3 | 4.5 | n.a. | n.a. | n.a. | |||||||||||||||||||||||||||||||||||||||||||||
| MOU (min) |
216 | 234 | 251 | 244 | 253 | 251 | 250 | 226 | 214 | 226 | 239 | 230 | n.a. | n.a. | n.a. | |||||||||||||||||||||||||||||||||||||||||||||
| Churn 3 months active base (quarterly) (%) |
17.9 | % | 20.1 | % | 17.8 | % | 23.0 | % | 19.4 | % | 16.5 | % | 16.7 | % | 21.4 | % | 16.1 | % | 16.4 | % | 15.9 | % | 21.3 | % | n.a. | n.a. | n.a. | |||||||||||||||||||||||||||||||||
| FIXED |
1Q12 | 2Q12 | 3Q12 | 4Q12 | 1Q13 | 2Q13 | 3Q13 | 4Q13 | 1Q14 | 2Q14 | 3Q14 | 4Q14 | FY12 | FY13 | FY14 | |||||||||||||||||||||||||||||||||||||||||||||
| Total operating revenue |
0.0 | 0.0 | 0.5 | 1.0 | 1.1 | 1.3 | 1.2 | 1.0 | 1.0 | 0.4 | 1.2 | 1.8 | 1.6 | 4.6 | 4.4 | |||||||||||||||||||||||||||||||||||||||||||||
| Service revenue |
0.0 | 0.0 | 0.5 | 1.0 | 1.1 | 1.3 | 1.2 | 1.2 | 0.9 | 0.4 | 1.2 | 1.8 | 1.5 | 4.8 | 4.3 | |||||||||||||||||||||||||||||||||||||||||||||
(in GEL millions, unless stated otherwise, unaudited)
| CONSOLIDATED |
1Q12 | 2Q12 | 3Q12 | 4Q12 | 1Q13 | 2Q13 | 3Q13 | 4Q13 | 1Q14 | 2Q14 | 3Q14 | 4Q14 | FY12 | FY13 | FY14 | |||||||||||||||||||||||||||||||||||||||||||||
| Total operating revenue |
27 | 30 | 38 | 35 | 33 | 36 | 40 | 38 | 33 | 31 | 37 | 39 | 129 | 147 | 140 | |||||||||||||||||||||||||||||||||||||||||||||
| EBITDA |
6 | 8 | 11 | 10 | 9 | 11 | 14 | 11 | 9 | 8 | 10 | 8 | 35 | 45 | 35 | |||||||||||||||||||||||||||||||||||||||||||||
| EBITDA margin (%) |
22.1 | % | 27.1 | % | 29.8 | % | 28.9 | % | 27.9 | % | 31.0 | % | 33.6 | % | 28.6 | % | 26.2 | % | 25.2 | % | 27.7 | % | 21.4 | % | 27.3 | % | 30.4 | % | 25.1 | % | ||||||||||||||||||||||||||||||
| Capital expenditures (CAPEX) |
4 | 7 | 4 | 6 | 1 | 3 | 19 | 6 | 3 | 5 | 10 | 19 | 21 | 29 | 37 | |||||||||||||||||||||||||||||||||||||||||||||
| CAPEX excluding licenses |
4 | 7 | 4 | 6 | 1 | 3 | 19 | 6 | 3 | 5 | 10 | 14 | 21 | 29 | 32 | |||||||||||||||||||||||||||||||||||||||||||||
| Operating cash flow (EBITDA-CAPEX excluding licenses) |
2 | 1 | 7 | 4 | 8 | 8 | (5 | ) | 5 | 6 | 3 | 0 | -6 | 14 | 16 | 3 | ||||||||||||||||||||||||||||||||||||||||||||
| OCF margin (%) |
7 | % | 3 | % | 18 | % | 11 | % | 24 | % | 22 | % | (13 | %) | 13 | % | 18 | % | 10 | % | 0 | % | -15 | % | 11 | % | 11 | % | 2 | % | ||||||||||||||||||||||||||||||
| MOBILE |
1Q12 | 2Q12 | 3Q12 | 4Q12 | 1Q13 | 2Q13 | 3Q13 | 4Q13 | 1Q14 | 2Q14 | 3Q14 | 4Q14 | FY12 | FY13 | FY14 | |||||||||||||||||||||||||||||||||||||||||||||
| Total operating revenue |
27 | 30 | 37 | 33 | 31 | 33 | 38 | 36 | 31 | 31 | 35 | 35 | 127 | 138 | 132 | |||||||||||||||||||||||||||||||||||||||||||||
| Service revenue |
25 | 29 | 35 | 32 | 30 | 32 | 37 | 33 | 30 | 30 | 35 | 35 | 121 | 132 | 130 | |||||||||||||||||||||||||||||||||||||||||||||
| Data Revenue |
0.8 | 0.9 | 1.1 | 1.1 | 1.0 | 0.9 | 1.1 | 1.1 | 1.1 | 1.1 | 1.3 | 1.0 | 3.9 | 4.2 | 4.5 | |||||||||||||||||||||||||||||||||||||||||||||
| Customers (mln) |
0.9 | 0.9 | 1.0 | 1.0 | 1.0 | 1.0 | 1.1 | 1.1 | 1.1 | 1.1 | 1.3 | 1.3 | 1.0 | 1.1 | 1.3 | |||||||||||||||||||||||||||||||||||||||||||||
| Broadband customers using USB modems (mln) * |
0.4 | 0.4 | 0.4 | 0.4 | 0.4 | 0.4 | 0.4 | 0.4 | 0.4 | 0.4 | 0.4 | 0.4 | 0.4 | 0.4 | 0.4 | |||||||||||||||||||||||||||||||||||||||||||||
| ARPU (GEL) |
10 | 11 | 12 | 11 | 10 | 11 | 11 | 10 | 9 | 9 | 9 | 8 | n.a. | n.a. | n.a. | |||||||||||||||||||||||||||||||||||||||||||||
| MOU (min) |
216 | 234 | 251 | 244 | 253 | 251 | 250 | 226 | 214 | 226 | 239 | 230 | n.a. | n.a. | n.a. | |||||||||||||||||||||||||||||||||||||||||||||
| Churn 3 months active base (quarterly) (%) |
17.9 | % | 20.1 | % | 17.8 | % | 23.0 | % | 19.4 | % | 16.5 | % | 16.7 | % | 21.4 | % | 16.1 | % | 16.4 | % | 15.9 | % | 21.3 | % | n.a. | n.a. | n.a. | |||||||||||||||||||||||||||||||||
| FIXED |
1Q12 | 2Q12 | 3Q12 | 4Q12 | 1Q13 | 2Q13 | 3Q13 | 4Q13 | 1Q14 | 2Q14 | 3Q14 | 4Q14 | FY12 | FY13 | FY14 | |||||||||||||||||||||||||||||||||||||||||||||
| Total operating revenue |
0.1 | 0.0 | 0.8 | 1.7 | 1.8 | 2.2 | 2.0 | 2.1 | 2.0 | 0.7 | 2.2 | 3.3 | 2.6 | 8.1 | 8.2 | |||||||||||||||||||||||||||||||||||||||||||||
| Service revenue |
0.0 | 0.0 | 0.8 | 1.7 | 1.8 | 2.2 | 2.0 | 2.1 | 1.6 | 0.7 | 2.2 | 3.3 | 2.5 | 8.1 | 7.8 | |||||||||||||||||||||||||||||||||||||||||||||
| * | Broadband customers are the customer contracts that served as a basis for revenue generating activity in the three months prior to the measurement date, as a result of activities including monthly internet access using FTTB and xDSL technologies as well as mobile internet access using 2.5G/3G/HSDPA technologies. |
Kyrgyzstan
index page
(in USD millions, unless stated otherwise, unaudited)
| CONSOLIDATED |
1Q12 | 2Q12 | 3Q12 | 4Q12 | 1Q13 | 2Q13 | 3Q13 | 4Q13 | 1Q14 | 2Q14 | 3Q14 | 4Q14 | FY12 | FY13 | FY14 | |||||||||||||||||||||||||||||||||||||||||||||
| Total operating revenue |
34 | 40 | 44 | 43 | 44 | 51 | 53 | 44 | 38 | 44 | 51 | 45 | 161 | 192 | 178 | |||||||||||||||||||||||||||||||||||||||||||||
| EBITDA |
19 | 22 | 25 | 25 | 22 | 29 | 27 | 19 | 17 | 23 | 27 | 23 | 91 | 97 | 90 | |||||||||||||||||||||||||||||||||||||||||||||
| EBITDA margin (%) |
55.4 | % | 55.0 | % | 55.7 | % | 58.3 | % | 51.1 | % | 56.1 | % | 51.0 | % | 42.8 | % | 45.2 | % | 53.0 | % | 52.9 | % | 52.0 | % | 56.3 | % | 50.5 | % | 51.1 | % | ||||||||||||||||||||||||||||||
| Capital expenditures (CAPEX) |
2 | 8 | 7 | 15 | 1 | 8 | 6 | 8 | 3 | 6 | 8 | 10 | 31 | 23 | 27 | |||||||||||||||||||||||||||||||||||||||||||||
| CAPEX excluding licenses |
2 | 8 | 7 | 15 | 1 | 8 | 6 | 8 | 3 | 6 | 8 | 10 | 31 | 23 | 27 | |||||||||||||||||||||||||||||||||||||||||||||
| Operating cash flow (EBITDA-CAPEX excluding licenses) |
17 | 14 | 18 | 10 | 21 | 21 | 21 | 11 | 14 | 17 | 19 | 14 | 60 | 74 | 64 | |||||||||||||||||||||||||||||||||||||||||||||
| OCF margin (%) |
51 | % | 37 | % | 40 | % | 23 | % | 48 | % | 40 | % | 40 | % | 25 | % | 37 | % | 40 | % | 37 | % | 30 | % | 37 | % | 38 | % | 36 | % | ||||||||||||||||||||||||||||||
| MOBILE |
1Q12 | 2Q12 | 3Q12 | 4Q12 | 1Q13 | 2Q13 | 3Q13 | 4Q13 | 1Q14 | 2Q14 | 3Q14 | 4Q14 | FY12 | FY13 | FY14 | |||||||||||||||||||||||||||||||||||||||||||||
| Total operating revenue |
34 | 40 | 44 | 43 | 44 | 51 | 53 | 44 | 38 | 44 | 51 | 45 | 161 | 192 | 178 | |||||||||||||||||||||||||||||||||||||||||||||
| Service revenue |
34 | 40 | 44 | 42 | 44 | 51 | 53 | 44 | 38 | 44 | 51 | 45 | 160 | 192 | 178 | |||||||||||||||||||||||||||||||||||||||||||||
| Data Revenue |
2.4 | 2.4 | 2.7 | 3.1 | 3.2 | 3.2 | 3.6 | 4.1 | 4.3 | 4.3 | 5.1 | 4.8 | 10.6 | 14.2 | 18.5 | |||||||||||||||||||||||||||||||||||||||||||||
| Customers (mln) |
2.4 | 2.4 | 2.4 | 2.5 | 2.2 | 2.3 | 2.5 | 2.7 | 2.6 | 2.6 | 2.7 | 2.7 | 2.5 | 2.7 | 2.7 | |||||||||||||||||||||||||||||||||||||||||||||
| Broadband customers using USB modems (mln) * |
1.2 | 1.3 | 1.3 | 1.3 | 1.6 | 1.3 | 1.4 | 1.5 | 1.5 | 1.5 | 1.5 | 1.6 | 1.3 | 1.5 | 1.6 | |||||||||||||||||||||||||||||||||||||||||||||
| ARPU (USD) |
4.8 | 5.6 | 6.1 | 5.7 | 6.2 | 7.4 | 7.0 | 5.6 | 4.7 | 5.6 | 6.3 | 5.4 | n.a. | n.a. | n.a. | |||||||||||||||||||||||||||||||||||||||||||||
| MOU (min) |
272 | 289 | 273 | 253 | 228 | 280 | 310 | 311 | 294 | 294 | 298 | 285 | n.a. | n.a. | n.a. | |||||||||||||||||||||||||||||||||||||||||||||
| Churn 3 months active base (quarterly) (%) |
14.5 | % | 16.4 | % | 17.4 | % | 13.9 | % | 23.5 | % | 15.2 | % | 14.1 | % | 17.2 | % | 19.1 | % | 15.7 | % | 14.9 | % | 15.9 | % | n.a. | n.a. | n.a. | |||||||||||||||||||||||||||||||||
| (in KGS millions, unless stated otherwise, unaudited) | ||||||||||||||||||||||||||||||||||||||||||||||||||||||||||||
| CONSOLIDATED |
1Q12 | 2Q12 | 3Q12 | 4Q12 | 1Q13 | 2Q13 | 3Q13 | 4Q13 | 1Q14 | 2Q14 | 3Q14 | 4Q14 | FY12 | FY13 | FY14 | |||||||||||||||||||||||||||||||||||||||||||||
| Total operating revenue |
1,602 | 1,896 | 2,076 | 2,009 | 2,093 | 2,458 | 2,599 | 2,165 | 1,988 | 2,330 | 2,666 | 2,563 | 7,582 | 9,316 | 9,547 | |||||||||||||||||||||||||||||||||||||||||||||
| EBITDA |
889 | 1,050 | 1,156 | 1,171 | 1,069 | 1,380 | 1,326 | 927 | 899 | 1,234 | 1,410 | 1,333 | 4,266 | 4,702 | 4,876 | |||||||||||||||||||||||||||||||||||||||||||||
| EBITDA margin (%) |
55.5 | % | 55.4 | % | 55.7 | % | 58.3 | % | 51.1 | % | 56.1 | % | 51.0 | % | 42.8 | % | 45.2 | % | 53.0 | % | 52.9 | % | 52.0 | % | 56.3 | % | 50.5 | % | 51.1 | % | ||||||||||||||||||||||||||||||
| Capital expenditures (CAPEX) |
77 | 355 | 328 | 701 | 55 | 403 | 284 | 395 | 159 | 305 | 412 | 562 | 1,461 | 1,137 | 1,438 | |||||||||||||||||||||||||||||||||||||||||||||
| CAPEX excluding licenses |
77 | 355 | 328 | 701 | 55 | 403 | 284 | 395 | 159 | 305 | 412 | 562 | 1,461 | 1,137 | 1,438 | |||||||||||||||||||||||||||||||||||||||||||||
| Operating cash flow (EBITDA-CAPEX excluding licenses) |
812 | 695 | 828 | 470 | 1,014 | 977 | 1,042 | 532 | 740 | 929 | 998 | 771 | 2,805 | 3,565 | 3,438 | |||||||||||||||||||||||||||||||||||||||||||||
| OCF margin (%) |
51 | % | 37 | % | 40 | % | 23 | % | 48 | % | 40 | % | 40 | % | 25 | % | 37 | % | 40 | % | 37 | % | 30 | % | 37 | % | 38 | % | 36 | % | ||||||||||||||||||||||||||||||
| MOBILE |
1Q12 | 2Q12 | 3Q12 | 4Q12 | 1Q13 | 2Q13 | 3Q13 | 4Q13 | 1Q14 | 2Q14 | 3Q14 | 4Q14 | FY12 | FY13 | FY14 | |||||||||||||||||||||||||||||||||||||||||||||
| Total operating revenue |
1,602 | 1,896 | 2,076 | 2,009 | 2,093 | 2,458 | 2,599 | 2,165 | 1,988 | 2,330 | 2,666 | 2,563 | 7,583 | 9,315 | 9,547 | |||||||||||||||||||||||||||||||||||||||||||||
| Service revenue |
1,585 | 1,882 | 2,062 | 1,988 | 2,077 | 2,443 | 2,583 | 2,151 | 1,975 | 2,322 | 2,658 | 2,549 | 7,517 | 9,254 | 9,504 | |||||||||||||||||||||||||||||||||||||||||||||
| Data Revenue |
114 | 111 | 127 | 147 | 153 | 155 | 178 | 200 | 221 | 229 | 266 | 272 | 499 | 686 | 988 | |||||||||||||||||||||||||||||||||||||||||||||
| Customers (mln) |
2.4 | 2.4 | 2.4 | 2.5 | 2.2 | 2.3 | 2.5 | 2.7 | 2.6 | 2.6 | 2.7 | 2.7 | 2.5 | 2.7 | 2.7 | |||||||||||||||||||||||||||||||||||||||||||||
| Broadband customers using USB modems (mln) * |
1.2 | 1.3 | 1.3 | 1.3 | 1.6 | 1.3 | 1.4 | 1.5 | 1.5 | 1.5 | 1.5 | 1.6 | 1.3 | 1.5 | 1.6 | |||||||||||||||||||||||||||||||||||||||||||||
| ARPU, (KGS) |
223 | 264 | 285 | 270 | 294 | 355 | 353 | 274 | 248 | 297 | 330 | 310 | n.a. | n.a. | n.a. | |||||||||||||||||||||||||||||||||||||||||||||
| MOU (min) |
272 | 289 | 273 | 253 | 228 | 280 | 310 | 311 | 294 | 294 | 298 | 285 | n.a. | n.a. | n.a. | |||||||||||||||||||||||||||||||||||||||||||||
| Churn 3 months active base (quarterly) (%) |
14.5 | % | 16.4 | % | 17.4 | % | 13.9 | % | 23.5 | % | 15.2 | % | 14.1 | % | 17.2 | % | 19.1 | % | 15.7 | % | 14.9 | % | 15.9 | % | n.a. | n.a. | n.a. | |||||||||||||||||||||||||||||||||
| * | Broadband customers are the customer contracts that served as a basis for revenue generating activity in the three months prior to the measurement date, as a result of activities including monthly internet access using FTTB and xDSL technologies as well as mobile internet access using 2.5G/3G/HSDPA technologies. |
SEA
index page
(in USD millions, unless stated otherwise, unaudited)
| CONSOLIDATED |
1Q13 | 2Q13 | 3Q13 | 4Q13 | 1Q14 | 2Q14 | 3Q14 | 4Q14 | FY12 | FY13 | FY14 | |||||||||||||||||||||||||||||||||
| Total operating revenue* |
11.9 | 7.8 | 7.0 | 6.7 | 8.3 | 8.0 | 7.0 | 5.5 | 60.8 | 33.4 | 28.5 | |||||||||||||||||||||||||||||||||
| EBITDA* |
(0.9 | ) | 2.8 | 2.0 | 1.7 | 2.4 | 3.0 | 2.0 | 2.3 | (9.9 | ) | 5.6 | 9.6 | |||||||||||||||||||||||||||||||
| EBITDA margin (%)* |
n.m. | 35.7 | % | 30.5 | % | 25.8 | % | 28.4 | % | 37.7 | % | 28.0 | % | 42.7 | % | n.a. | 16.9 | % | 33.6 | % | ||||||||||||||||||||||||
| MOBILE |
1Q13 | 2Q13 | 3Q13 | 4Q13 | 1Q14 | 2Q14 | 3Q14 | 4Q14 | FY12 | FY13 | FY14 | |||||||||||||||||||||||||||||||||
| Customers (mln), Laos |
0.3 | 0.3 | 0.3 | 0.3 | 0.3 | 0.3 | 0.3 | 0.2 | 0.3 | 0.3 | 0.2 | |||||||||||||||||||||||||||||||||
| ARPU (USD), Laos |
7.0 | 7.1 | 6.1 | 6.1 | 5.4 | 5.6 | 5.7 | 5.0 | n.a. | n.a. | n.a. | |||||||||||||||||||||||||||||||||
Serious News for Serious Traders! Try StreetInsider.com Premium Free!
You May Also Be Interested In
- Suzano Ventures invests up to US$5 million into Bioform Technologies to further develop bio-based plastic alternatives
- Title correction: EXEL Industries : Second quarter 2023–2024 sales down 1.8%
- Precision oncology company Flindr Therapeutics announces €20 million Series A financing to advance first-in-class small molecule inhibitors
Create E-mail Alert Related Categories
SEC FilingsSign up for StreetInsider Free!
Receive full access to all new and archived articles, unlimited portfolio tracking, e-mail alerts, custom newswires and RSS feeds - and more!
