

Form 6-K Vale S.A. For: Jul 28
 Tweet
Tweet Share
Share
United States
Securities and Exchange Commission
Washington, D.C. 20549
FORM 6-K
Report of Foreign Private Issuer
Pursuant to Rule 13a-16 or 15d-16
of the
Securities Exchange Act of 1934
For the month of
July 2016
Vale S.A.
Avenida das Américas, No. 700 – Bloco 8, Sala 218
22640-100 Rio de Janeiro, RJ, Brazil
(Address of principal executive office)
(Indicate by check mark whether the registrant files or will file annual reports under cover of Form 20-F or Form 40-F.)
(Check One) Form 20-F x Form 40-F o
(Indicate by check mark if the registrant is submitting the Form 6-K in paper as permitted by Regulation S-T Rule 101(b)(1))
(Check One) Yes o No x
(Indicate by check mark if the registrant is submitting the Form 6-K in paper as permitted by Regulation S-T Rule 101(b)(7))
(Check One) Yes o No x
(Indicate by check mark whether the registrant by furnishing the information contained in this Form is also thereby furnishing information to the Commission pursuant to Rule 12g3-2(b) under the Securities Exchange Act of 1934.)
(Check One) Yes o No x
(If “Yes” is marked, indicate below the file number assigned to the registrant in connection with Rule 12g3-2(b). 82- .)

www.vale.com
App Vale Investors & Media
iOS: https://itunes.apple.com/us/app/vale-investor-media-english/id1087126847?ls=1&mt=8
Android: https://play.google.com/store/apps/details?id=com.theirapp.valeeg
Tel.: (55 21) 3485-3900
Investor Relations Department
André Figueiredo
Carla Albano Miller
Fernando Mascarenhas
Andrea Gutman
Bruno Siqueira
Claudia Rodrigues
Denise Caruncho
Mariano Szachtman
Renata Capanema
BM&F BOVESPA: VALE3, VALE5
NYSE: VALE, VALE.P
EURONEXT PARIS: VALE3, VALE5
LATIBEX: XVALO, XVALP
Except where otherwise indicated the operational and financial information in this release is based on the consolidated figures in accordance with IFRS and, with the exception of information on investments and behavior of markets, quarterly financial statements are reviewed by the company’s independent auditors. The main subsidiaries that are consolidated are the following: Companhia Portuária da Baía de Sepetiba, Compañia Minera Miski Mayo S.A.C., Mineração Corumbaense Reunida S.A., Minerações Brasileiras Reunidas S.A., Salobo Metais S.A., Vale International Holdings GmbH, Vale Canada Holdings Inc., Vale Canada Limited, Vale Fertilizantes S.A., Vale International S.A., Vale Malaysia Minerals Sdn. Bhd., Vale Manganês S.A., Vale Moçambique S.A., Vale Nouvelle-Calédonie S.A.S. and Vale Shipping Holding Pte. Ltd.
Contents
|
4 | |
|
|
|
|
9 | |
|
|
|
|
11 | |
|
|
|
|
Adjusted earnings before interest, taxes, depreciation and amortization |
14 |
|
|
|
|
15 | |
|
|
|
|
23 | |
|
|
|
|
29 | |
|
|
|
|
30 | |
|
|
|
|
32 | |
|
|
|
|
33 | |
|
|
|
|
45 | |
|
|
|
|
55 | |
|
|
|
|
59 | |
|
|
|
|
62 |
Rio de Janeiro, July 28, 2016 — Vale S.A. (Vale) delivered a sound operational performance in 2Q16, reaching several production records for a second quarter, namely: (i) Carajás iron ore production of 36.5 Mt; (ii) nickel production of 78.5 kt, (iii) copper production of 105.6 kt; and (iv) gold production of 109,000 oz.
Net revenues totaled US$ 6.626 billion in 2Q16, increasing US$ 907 million vs. 1Q16 as a result of higher sales volumes of iron ore fines (US$ 462 million) and higher sales prices for iron ore fines (US$ 129 million) and pellets (US$ 98 million).
Costs and expenses increased to US$ 5.287 billion in 2Q16 from the US$ 4.565 billion recorded in 1Q16, mainly due to the impact of higher sales volumes (US$ 457 million) and exchange rate (US$ 283 million), being partially offset by cost reduction initiatives (US$ 165 million).
Adjusted EBITDA was US$ 2.383 billion in 2Q16, 18.9% higher than in 1Q16 mainly driven by Ferrous Minerals (US$ 398 million) and Base Metals (US$ 47 million). Adjusted EBITDA margin was 36.0% in 2Q16, increasing from the 35.1% recorded in 1Q16.
Adjusted EBITDA amounted to US$ 4.388 billion in 1H16 against US$ 3.585 billion(1) in 1H15, increasing US$ 803 million, despite the US$ 860 million decrease in net operating revenues driven by lower sales prices (US$ 1.533 billion). The increase in adjusted EBITDA was mainly driven by our efforts to reduce costs(2) (US$ 1.193 billion) and expenses¹² (US$ 564 million).
Capital expenditures totaled US$ 1.368 billion in 2Q16, decreasing by US$ 81 million vs. 1Q16. Investments in project execution totaled US$ 905 million in 2Q16, with expenditures associated with the S11D project accounting for US$ 540 million. Sustaining capex totaled US$ 463 million in 2Q16, decreasing US$ 66 million from the US$ 529 million recorded in 1Q16.
Net income totaled US$ 1.106 billion in 2Q16 vs. US$ 1.776 billion in 1Q16, decreasing US$ 670 million mostly as a result of a US$ 1.038 billion Samarco related provision(3). Underlying earnings (after adjusting net income for one-off effects) were US$ 709 million in 2Q16, mainly after the adjustments for exchange rate (US$ 1.960 billion), provision for Samarco liabilities (US$ 1.038 billion) and currencies and interest rate swaps (US$ 483 million).
(1) Net of US$ 230 million of the goldstream transaction in 1H15.
(2) Net of depreciation
(3) For more information on the Samarco related provision, please see the section “Update on Samarco Mineração S.A.” of this release.
Gross debt totaled US$ 31.814 billion as of June 30th, 2016, increasing slightly from the US$ 31.470 billion as of March 31st, 2016, mainly as a result of the impact of the appreciation of the Brazilian Real (BRL) on the translation of the BRL denominated debt into USD(4), which was partially offset by net debt payments of US$ 375 million in 2Q16.
Net debt decreased to US$ 27.508 billion as of June 30th, 2016 from US$ 27.661 billion as of March 31st, 2016, with a cash balance of US$ 4.306 billion. The decrease in net debt was mainly driven by the positive free cash flow of US$ 761 million in 2Q16, which was partially offset by the exchange rate impact on the translation of the BRL denominated debt into USD.
EBITDA from the Ferrous Minerals business segment increased 23% in 2Q16 vs. 1Q16 driven by higher realized prices and higher sales volumes
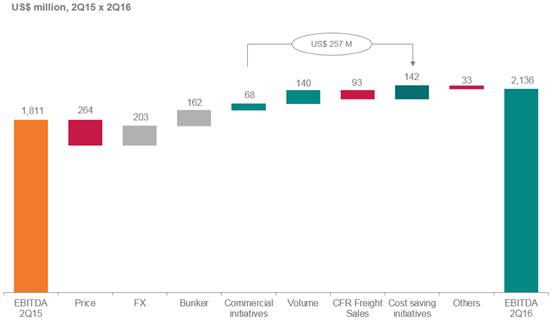
· Adjusted EBITDA for Ferrous Minerals was US$ 2.136 billion in 2Q16, US$ 398 million higher than the US$ 1.738 billion achieved in 1Q16, mainly as a result of higher realized sales prices (US$ 262 million) and higher sales volumes (US$ 246 million), which were partially offset by exchange rate variations (US$ 147 million).
· Cash flow generation, simplified by measuring adjusted EBITDA less sustaining and growth capex, was US$ 1.367 billion in 2Q16, increasing US$ 538 million (65%) from the US$ 829 million recorded in 1Q16.
· CFR dmt reference price for iron ore fines (ex-ROM) increased by US$ 1.6/t from US$ 54.7/t in 1Q16 to US$ 56.3/t in 2Q16, equivalent to a price realization of 101% of the average Platts IODEX 62% of US$ 55.7/t in 2Q16, whereas the combined CFR/FOB wmt price for iron ore fines (ex-ROM)(5) increased by US$ 1.8/t from US$ 46.5/t in 1Q16 to US$ 48.3/t in 2Q16.
· Average Fe content of iron ore fines production decreased slightly, as planned, from 64.3% in 1Q16 to 63.6% in 2Q16, mainly in response to market demand for higher silica ores.
· C1 cash cost FOB port per metric ton for iron ore fines ex-royalties totaled US$ 13.2/t in 2Q16, US$ 0.9/t higher than the US$ 12.3/t recorded in 1Q16, due to the impact of the BRL appreciation against the USD.
· C1 cash cost FOB port per metric ton of iron ore fines in BRL was R$ 46.1/t in 2Q16, R$ 1.4/t lower than the R$ 47.5/t recorded in 1Q16, mainly due to improved
(4) In 2Q16, from end to end, the BRL appreciated 9.8% against the USD.
(5) After adjusting for moisture and the effects of FOB sales on 34% of the total sales volumes
operational performance, ongoing cost-cutting initiatives and increased fixed-costs dilution on seasonally higher production volumes.
· Unit maritime freight cost per iron ore metric ton was US$ 11.8/t in 2Q16, US$ 0.5/t higher than the US$ 11.3/t recorded in 1Q16, mainly driven by the negative impact of higher bunker oil prices in our chartering contracts.
· Iron ore fines and pellets EBITDA break-even, measured by unit cash costs and expenses on a landed-in-China basis (and adjusted for quality, pellets margins differential and moisture, excluding ROM), increased from US$ 28.0/dmt in 1Q16 to US$ 28.5/dmt in 2Q16, mainly driven by (i) the impact on C1 cash cost of the appreciation of BRL against the USD (US$ 1.2/t); (ii) higher bunker oil prices (US$ 0.4/t); and (iii) higher royalties (US$ 0.5/t), due to higher iron ore prices; and were partially offset by higher pellet premiums (US$ 0.3/t) and by the dividends received from the pelletizing plants (US$ 0.7/t)(6).
· Iron ore and pellets cash break-even on a landed-in-China basis, including sustaining capex per ton of US$ 1.8/t, decreased from US$ 30.9/ dmt in 1Q16 to US$ 30.3/ dmt in 2Q16.
· Physical progress reached 90% at the S11D mine and plant, 70% at the S11D logistic sites and 92% at the S11D railway spur.
EBITDA from the Base Metals business segment increased 14% in 2Q16 vs. 1Q16 as operational improvements more than offset negative exchange rate impacts
· Nickel realized prices were positively impacted by improving premiums over the LME, increasing 4.5% in 2Q16 vs. 1Q16 vs. the 3.8% increase of LME nickel prices in the same period.
· Adjusted EBITDA was US$ 376 million in 2Q16, US$ 47 million higher than in 1Q16, as a result of lower costs (US$ 50 million) and higher prices (US$ 48 million), which offset the negative exchange rate impacts (US$ 56 million).
· Adjusted EBITDA for VNC totaled negative US$ 50 million in 2Q16, in line with the previous quarter and US$ 28 million better than in 2Q15 as VNC’s unit costs net of by-product credits reached US$ 12,208/t in 2Q16, decreasing from the US$ 20,471/t in 2Q15 and the US$ 12,711/t in 1Q16.
(6) Dividends usually paid every 6 months (at second and fourth quarters).
· Salobo’s EBITDA totaled US$ 122 million in 2Q16, decreasing US$ 9 million from the US$ 131 million recorded in 1Q16, mainly as a result of the negative impact of the appreciation of the BRL (US$ 13 million).
· Salobo achieved a monthly production record of 14.6 kt of copper in concentrates in May and is expected to reach its full production capacity on a monthly basis during 2H16.
EBITDA from Coal was positively impacted by lower costs in Mozambique with the ramp-up of the Nacala Logistics Corridor
· Adjusted EBITDA was negative US$ 110 million in 2Q16 vs. negative US$ 93 million in 1Q16, having decreased US$ 17 million mainly as a result of geological instability issues at Carborough Downs (US$ 29 million).
· Production cost per ton at Nacala Port in Mozambique decreased by 39% to US$ 103/t in 2Q16 from US$ 168/t in 1Q16, and should further improve in the coming quarters as Nacala ramp ups and Moatize II starts up in early August.
· Total mine movement in Mozambique reached a new monthly record of 12.7 Mt in June due to higher equipment productivity and the development of new mining areas to supply the Moatize II coal handling and processing plant.
EBITDA from the Fertilizers business segment decreased, mainly driven by lower prices and the appreciation of the BRL
· Adjusted EBITDA for Fertilizers decreased to US$ 32 million in 2Q16 from US$ 70 million in 1Q16, mainly driven by the negative effect of the appreciation of the BRL, which impacted costs, expenses and revenues (US$ 13 million), and by lower prices (US$ 11 million).
· Realized prices for fertilizer nutrients decreased in 2Q16 vs 1Q16 for almost all of our products, with prices decreasing by 6.7% for Potash, 1.8% for MAP, 0.4% for TSP, 9.5% for SSP and 14.5% for phosphate rock.
The S11D project — the most important project in our history — is being commissioned and, meanwhile, we remain committed to our divestment program, having sold three very large ore carriers of 400,000 deadweight tons to ICBC Financial Leasing in 2Q16. The transaction totaled US$ 269 million and the amount will be received in August.
Looking forward, we remain fully focused on improving our operations, maintaining our capex discipline and strengthening our balance sheet.
Selected financial indicators
|
|
|
2Q16 |
|
1Q16 |
|
2Q15 |
|
% |
|
% |
|
|
US$ million |
|
(A) |
|
(B) |
|
(C) |
|
(A/B) |
|
(A/C) |
|
|
Net operating revenues |
|
6,626 |
|
5,719 |
|
6,965 |
|
16 |
|
(5 |
) |
|
Adjusted EBIT |
|
1,339 |
|
1,154 |
|
1,040 |
|
16 |
|
29 |
|
|
Adjusted EBIT margin (%) |
|
20.2 |
|
20.2 |
|
14.9 |
|
— |
|
— |
|
|
Adjusted EBITDA |
|
2,383 |
|
2,005 |
|
2,213 |
|
19 |
|
8 |
|
|
Adjusted EBITDA margin (%) |
|
36.0 |
|
35.1 |
|
31.8 |
|
— |
|
— |
|
|
Net income (loss) |
|
1,106 |
|
1,776 |
|
1,675 |
|
(38 |
) |
(34 |
) |
|
Underlying earnings |
|
709 |
|
514 |
|
973 |
|
38 |
|
(27 |
) |
|
Underlying earnings per share on a fully diluted basis (US$ / share) |
|
0.14 |
|
0.10 |
|
0.19 |
|
— |
|
— |
|
|
Total gross debt |
|
31,814 |
|
31,470 |
|
29,773 |
|
1 |
|
7 |
|
|
Cash and cash equivalent |
|
4,306 |
|
3,809 |
|
3,264 |
|
13 |
|
32 |
|
|
Total Net Debt |
|
27,508 |
|
27,661 |
|
26,509 |
|
(1 |
) |
4 |
|
|
Total gross debt/ adjusted EBITDA (x) |
|
4.2 |
|
4.2 |
|
3.3 |
|
— |
|
— |
|
|
Capital expenditures |
|
1,368 |
|
1,449 |
|
2,119 |
|
(6 |
) |
(35 |
) |
|
|
|
1H16 |
|
1H15 |
|
% |
|
|
US$ million |
|
(A) |
|
(B) |
|
(A/B) |
|
|
Net operating revenues |
|
12,345 |
|
13,205 |
|
(7 |
) |
|
Adjusted EBIT |
|
2,493 |
|
1,580 |
|
58 |
|
|
Adjusted EBIT margin (%) |
|
20.2 |
|
12.0 |
|
— |
|
|
Adjusted EBITDA |
|
4,388 |
|
3,815 |
|
15 |
|
|
Adjusted EBITDA margin (%) |
|
35.5 |
|
28.9 |
|
— |
|
|
Adjusted EBITDA net of the goldstream transaction in 1H15 |
|
4,388 |
|
3,585 |
|
22 |
|
|
Underlying earnings |
|
1,223 |
|
294 |
|
316 |
|
|
Underlying earnings per share on a fully diluted basis (US$ / share) |
|
0.24 |
|
0.06 |
|
— |
|
|
Capital expenditures |
|
2,817 |
|
4,328 |
|
(35 |
) |
Net operating revenues in 2Q16 were US$ 6.626 billion, 15.9% higher than in 1Q16. The increase in sales revenues was mainly due to higher sales volumes in iron ore fines (US$ 462 million), and higher sales prices for iron ore fines (US$ 129 million) and for pellets (US$ 98 million).
The tables below show net operating revenues by destination and by business areas, with the following highlights:
· Net revenue by destination was marked by: (i) the decrease in sales to Asia from 57.4% in 1Q16 to 55.4% in 2Q16, as revenues from other regions increased more than revenues from Asia, and (ii) the increase in sales to the Middle East from 2.7% in 1Q16 to 3.6% in 2Q16.
· Contribution by business segments in 2Q16 was generally in line with 1Q16, with the Ferrous Minerals business segment representing 68.5% of Vale’s total net revenues.
Net operating revenue by destination
|
US$ million |
|
2Q16 |
|
% |
|
1Q16 |
|
% |
|
2Q15 |
|
% |
|
|
North America |
|
511 |
|
7.7 |
|
496 |
|
8.7 |
|
574 |
|
8.2 |
|
|
USA |
|
230 |
|
3.5 |
|
209 |
|
3.7 |
|
241 |
|
3.5 |
|
|
Canada |
|
281 |
|
4.2 |
|
278 |
|
4.9 |
|
332 |
|
4.8 |
|
|
Mexico |
|
— |
|
— |
|
9 |
|
0.2 |
|
— |
|
— |
|
|
South America |
|
994 |
|
15.0 |
|
814 |
|
14.2 |
|
1,163 |
|
16.7 |
|
|
Brazil |
|
903 |
|
13.6 |
|
719 |
|
12.6 |
|
1,040 |
|
14.9 |
|
|
Others |
|
91 |
|
1.4 |
|
95 |
|
1.7 |
|
123 |
|
1.8 |
|
|
Asia |
|
3,668 |
|
55.4 |
|
3,281 |
|
57.4 |
|
3,618 |
|
51.9 |
|
|
China |
|
2,700 |
|
40.7 |
|
2,454 |
|
42.9 |
|
2,584 |
|
37.1 |
|
|
Japan |
|
405 |
|
6.1 |
|
340 |
|
5.9 |
|
417 |
|
6.0 |
|
|
South Korea |
|
188 |
|
2.8 |
|
199 |
|
3.5 |
|
184 |
|
2.6 |
|
|
Others |
|
376 |
|
5.7 |
|
288 |
|
5.0 |
|
433 |
|
6.2 |
|
|
Europe |
|
1,137 |
|
17.2 |
|
936 |
|
16.4 |
|
1,277 |
|
18.3 |
|
|
Germany |
|
358 |
|
5.4 |
|
280 |
|
4.9 |
|
381 |
|
5.5 |
|
|
Italy |
|
125 |
|
1.9 |
|
115 |
|
2.0 |
|
115 |
|
1.6 |
|
|
Others |
|
654 |
|
9.9 |
|
542 |
|
9.5 |
|
781 |
|
11.2 |
|
|
Middle East |
|
240 |
|
3.6 |
|
152 |
|
2.7 |
|
286 |
|
4.1 |
|
|
Rest of the World |
|
76 |
|
1.2 |
|
40 |
|
0.7 |
|
47 |
|
0.7 |
|
|
Total |
|
6,626 |
|
100.0 |
|
5,719 |
|
100.0 |
|
6,965 |
|
100.0 |
|
Net operating revenues by destination

Net operating revenue by business areas
|
US$ million |
|
2Q16 |
|
% |
|
1Q16 |
|
% |
|
2Q15 |
|
% |
|
|
Ferrous minerals |
|
4,541 |
|
68.5 |
|
3,804 |
|
66.5 |
|
4,552 |
|
65.4 |
|
|
Iron ore fines |
|
3,508 |
|
52.9 |
|
2,917 |
|
51.0 |
|
3,391 |
|
48.7 |
|
|
ROM |
|
5 |
|
0.1 |
|
4 |
|
0.1 |
|
33 |
|
0.5 |
|
|
Pellets |
|
868 |
|
13.1 |
|
753 |
|
13.2 |
|
972 |
|
14.0 |
|
|
Manganese ore |
|
36 |
|
0.5 |
|
31 |
|
0.5 |
|
32 |
|
0.5 |
|
|
Ferroalloys |
|
25 |
|
0.4 |
|
16 |
|
0.3 |
|
21 |
|
0.3 |
|
|
Others |
|
99 |
|
1.5 |
|
83 |
|
1.5 |
|
103 |
|
1.5 |
|
|
Coal |
|
145 |
|
2.2 |
|
154 |
|
2.7 |
|
146 |
|
2.1 |
|
|
Metallurgical coal |
|
77 |
|
1.2 |
|
104 |
|
1.8 |
|
137 |
|
2.0 |
|
|
Thermal coal |
|
68 |
|
1.0 |
|
50 |
|
0.9 |
|
9 |
|
0.1 |
|
|
Base metals |
|
1,447 |
|
21.8 |
|
1,353 |
|
23.7 |
|
1,648 |
|
23.7 |
|
|
Nickel |
|
710 |
|
10.7 |
|
650 |
|
11.4 |
|
874 |
|
12.5 |
|
|
Copper |
|
443 |
|
6.7 |
|
435 |
|
7.6 |
|
483 |
|
6.9 |
|
|
PGMs |
|
99 |
|
1.5 |
|
96 |
|
1.7 |
|
125 |
|
1.8 |
|
|
Gold |
|
154 |
|
2.3 |
|
130 |
|
2.3 |
|
128 |
|
1.8 |
|
|
Silver |
|
10 |
|
0.2 |
|
9 |
|
0.2 |
|
7 |
|
0.1 |
|
|
Others |
|
31 |
|
0.5 |
|
33 |
|
0.6 |
|
31 |
|
0.4 |
|
|
Fertilizer nutrients |
|
464 |
|
7.0 |
|
384 |
|
6.7 |
|
568 |
|
8.2 |
|
|
Potash |
|
22 |
|
0.3 |
|
23 |
|
0.4 |
|
31 |
|
0.4 |
|
|
Phosphates |
|
363 |
|
5.5 |
|
290 |
|
5.1 |
|
445 |
|
6.4 |
|
|
Nitrogen |
|
60 |
|
0.9 |
|
58 |
|
1.0 |
|
78 |
|
1.1 |
|
|
Others |
|
19 |
|
0.3 |
|
13 |
|
0.2 |
|
14 |
|
0.2 |
|
|
Others |
|
29 |
|
0.4 |
|
24 |
|
0.4 |
|
51 |
|
0.7 |
|
|
Total |
|
6,626 |
|
100.0 |
|
5,719 |
|
100.0 |
|
6,965 |
|
100.0 |
|
Costs and expenses increased to US$ 5.287 billion in 2Q16 from the US$ 4.565 billion recorded in 1Q16, representing an increase of 15.8%, mainly due to the impact of higher sales volumes (US$ 457 million) and exchange rate variations (US$ 283 million), partially offset by cost reduction initiatives (US$ 165 million).
Costs and expenses
|
US$ million |
|
2Q16 |
|
1Q16 |
|
2Q15 |
|
|
Costs |
|
4,795 |
|
4,249 |
|
5,186 |
|
|
Expenses |
|
492 |
|
316 |
|
739 |
|
|
Total costs and expenses |
|
5,287 |
|
4,565 |
|
5,925 |
|
|
Depreciation |
|
927 |
|
850 |
|
988 |
|
|
Costs and expenses ex-depreciation |
|
4,360 |
|
3,715 |
|
4,937 |
|
COST OF GOODS SOLD (COGS)
COGS totaled US$ 4.795 billion(7) in 2Q16, increasing US$ 546 million from the US$ 4.249 billion recorded in 1Q16, as a result of higher sales volumes (US$ 457 million) and exchange rate variations (US$ 254 million), which were partially offset by cost reduction initiatives (US$ 165 million).
COGS totaled US$ 9.044 billion in 1H16, decreasing US$ 1.310 billion from the US$ 10.354 billion recorded in 1H15, despite the increase in volumes in most of the business segments.
Further details on cost performance are provided in the “Performance of the Business Segments” section.
COGS by business segment
|
US$ million |
|
2Q16 |
|
% |
|
1Q16 |
|
% |
|
2Q15 |
|
% |
|
|
Ferrous minerals |
|
2,579 |
|
53.8 |
|
2,169 |
|
51.1 |
|
3,035 |
|
58.5 |
|
|
Base metals |
|
1,424 |
|
29.7 |
|
1,346 |
|
31.7 |
|
1,442 |
|
27.8 |
|
|
Coal |
|
250 |
|
5.2 |
|
325 |
|
7.6 |
|
233 |
|
4.5 |
|
|
Fertilizers |
|
482 |
|
10.1 |
|
360 |
|
8.5 |
|
441 |
|
8.5 |
|
|
Other products |
|
60 |
|
1.2 |
|
49 |
|
1.2 |
|
35 |
|
0.7 |
|
|
Total COGS |
|
4,795 |
|
100.00 |
|
4,249 |
|
100.0 |
|
5,186 |
|
100.0 |
|
|
Depreciation |
|
866 |
|
|
|
810 |
|
|
|
882 |
|
|
|
|
COGS, ex-depreciation |
|
3,929 |
|
|
|
3,439 |
|
|
|
4,304 |
|
|
|
(7) COGS currency exposure in 2Q16 was as follows: 53% Brazilian Reais, 29% US dollar, 14% Canadian dollar, 3% Euros and 1% other currencies.
EXPENSES
Total expenses increased 55.7% to US$ 492 million in 2Q16 from the US$ 316 million recorded in 1Q16, due to the increase in other expenses (US$ 125 million), SG&A (US$ 21 million), R&D (US$ 18 million), and pre-operating and stoppage expenses (US$ 12 million).
SG&A totaled US$ 140 million in 2Q16, representing a 17.6% increase from the US$ 119 million recorded in 1Q16, and an 11.9% decrease from the US$ 159 million recorded in 2Q15. SG&A, net of depreciation, increased by US$ 11 million in 2Q16 vs. 1Q16, mainly as a result of the impact of: (i) exchange rate variations (US$ 6 million); (ii) higher personnel expenses (US$ 3 million); (iii) higher selling expenses (US$ 2 million) and (iv) higher services expenses (US$ 1 million).
R&D expenses totaled US$ 78 million in 2Q16, representing a 30.0% increase from the US$ 60 million recorded in 1Q16 and a 33.9% decrease from the US$ 118 million recorded in 2Q15. R&D expenses stem mostly from nickel (US$ 21 million) and iron ore and pellets (US$ 20 million).
Pre-operating and stoppage expenses totaled US$ 114 million in 2Q16, representing an 11.8% increase from the US$ 102 million recorded in 1Q16 mainly driven by the Nacala Logistic Corridor and the S11D project expenses. Pre-operating and stoppage expenses decreased 56.0% from the US$ 259 million recorded in 2Q15.
Other operating expenses totaled US$ 160 million in 2Q16, increasing US$ 125 million in comparison with the US$ 35 million recorded in 1Q16, mainly due to contingencies increase (US$ 32 million), higher disposals and write-off of assets (US$ 21 million), and insurance claims and externalities (US$ 13 million). Other expenses decreased US$ 43 million vs. 2Q15.
Total expenses decreased to US$ 808 million in 1H16, from the US$ 1.271 billion recorded in 1H15. After deducting the positive one-off effect of US$ 230 million from the goldstream transaction recorded in 1Q15, expenses decreased 46.2%.
Expenses
|
US$ million |
|
2Q16 |
|
% |
|
1Q16 |
|
% |
|
2Q15 |
|
% |
|
|
SG&A ex-depreciation |
|
107 |
|
— |
|
96 |
|
— |
|
125 |
|
— |
|
|
SG&A |
|
140 |
|
28 |
|
119 |
|
38 |
|
159 |
|
22 |
|
|
Administrative |
|
126 |
|
26 |
|
107 |
|
34 |
|
151 |
|
20 |
|
|
Personnel |
|
58 |
|
12 |
|
51 |
|
16 |
|
74 |
|
10 |
|
|
Services |
|
18 |
|
4 |
|
16 |
|
5 |
|
26 |
|
4 |
|
|
Depreciation |
|
33 |
|
7 |
|
23 |
|
7 |
|
34 |
|
5 |
|
|
Others |
|
17 |
|
3 |
|
17 |
|
5 |
|
17 |
|
2 |
|
|
Selling |
|
14 |
|
3 |
|
12 |
|
4 |
|
8 |
|
1 |
|
|
R&D |
|
78 |
|
16 |
|
60 |
|
19 |
|
118 |
|
16 |
|
|
Pre-operating and stoppage expenses (1) |
|
114 |
|
23 |
|
102 |
|
32 |
|
259 |
|
35 |
|
|
VNC |
|
— |
|
— |
|
— |
|
— |
|
116 |
|
16 |
|
|
Long Harbour |
|
45 |
|
9 |
|
49 |
|
16 |
|
68 |
|
9 |
|
|
S11D |
|
19 |
|
4 |
|
15 |
|
5 |
|
14 |
|
2 |
|
|
Moatize |
|
9 |
|
2 |
|
1 |
|
— |
|
11 |
|
1 |
|
|
Others |
|
41 |
|
8 |
|
37 |
|
12 |
|
50 |
|
7 |
|
|
Other operating expenses |
|
160 |
|
33 |
|
35 |
|
11 |
|
203 |
|
27 |
|
|
Total Expenses |
|
492 |
|
100 |
|
316 |
|
100 |
|
739 |
|
100 |
|
|
Depreciation |
|
61 |
|
— |
|
40 |
|
— |
|
106 |
|
— |
|
|
Expenses ex-depreciation |
|
431 |
|
— |
|
276 |
|
— |
|
633 |
|
— |
|
(1) Includes US$ 29 million of depreciation charges in 2Q16, US$ 26 million in 1Q16 and US$ 72 million in 2Q15
Adjusted earnings before interest, taxes, depreciation and amortization(8)
Adjusted EBITDA was US$ 2.383 billion in 2Q16, 18.9% higher than in 1Q16 mainly as a result of the improvement in the Ferrous Minerals EBITDA (US$ 398 million). Adjusted EBITDA margin was 36.0% in 2Q16, improving from the 35.1% recorded in 1Q16.
Adjusted EBIT was US$ 1.339 billion in 2Q16, 16.0% higher than in 1Q16.
Adjusted EBITDA
|
US$ million |
|
2Q16 |
|
1Q16 |
|
2Q15 |
|
|
Net operating revenues |
|
6,626 |
|
5,719 |
|
6,965 |
|
|
COGS |
|
(4,795 |
) |
(4,249 |
) |
(5,186 |
) |
|
SG&A |
|
(140 |
) |
(119 |
) |
(159 |
) |
|
Research and development |
|
(78 |
) |
(60 |
) |
(118 |
) |
|
Pre-operating and stoppage expenses |
|
(114 |
) |
(102 |
) |
(259 |
) |
|
Other operational expenses |
|
(160 |
) |
(35 |
) |
(203 |
) |
|
Adjusted EBIT |
|
1,339 |
|
1,154 |
|
1,040 |
|
|
Depreciation, amortization & depletion |
|
927 |
|
850 |
|
988 |
|
|
Dividends received |
|
117 |
|
1 |
|
185 |
|
|
Adjusted EBITDA |
|
2,383 |
|
2,005 |
|
2,213 |
|
Adjusted EBITDA by business area
|
US$ million |
|
2Q16 |
|
1Q16 |
|
2Q15 |
|
|
Ferrous minerals |
|
2,136 |
|
1,738 |
|
1,811 |
|
|
Coal |
|
(110 |
) |
(93 |
) |
(102 |
) |
|
Base metals |
|
376 |
|
329 |
|
406 |
|
|
Fertilizer nutrients |
|
32 |
|
70 |
|
163 |
|
|
Others |
|
(51 |
) |
(39 |
) |
(65 |
) |
|
Total |
|
2,383 |
|
2,005 |
|
2,213 |
|
(8) Net revenues less costs and expenses net of depreciation plus dividends received.
Net income totaled US$ 1.106 billion in 2Q16 vs. US$ 1.776 billion in 1Q16. The US$ 670 million decrease was mostly driven by a Samarco related provision (US$ 1.038 billion), which was partly offset by the improvement in the EBITDA in 2Q16 vs. 1Q16 (US$ 378 million).
Underlying earnings (after adjusting for one-off effects) were US$ 709 million in 2Q16, mainly after the adjustments for: (i) exchange rate variation (US$ 1.960 billion); (ii) Samarco related provisions (US$ 1.038 billion) and currencies and interest rate swaps (US$ 483 million).
For more information on the Samarco related provision, please see the section “Update on Samarco Mineração S.A.” of this release.
Underlying earnings
|
US$ million |
|
2Q16 |
|
1Q16 |
|
2Q15 |
|
|
Underlying earnings |
|
709 |
|
514 |
|
973 |
|
|
Items excluded from basic earnings |
|
|
|
|
|
|
|
|
Gain (loss) on fair value on non-current assets |
|
(66 |
) |
— |
|
(55 |
) |
|
Shareholders Debentures |
|
(86 |
) |
(116 |
) |
361 |
|
|
Foreign Exchange |
|
1,960 |
|
1,611 |
|
521 |
|
|
Monetary variation |
|
(51 |
) |
(56 |
) |
(39 |
) |
|
Currency and interest rate swaps |
|
483 |
|
486 |
|
243 |
|
|
Fair value on financial instruments |
|
(31 |
) |
(13 |
) |
(18 |
) |
|
Gain (loss) on sale of investments |
|
— |
|
— |
|
79 |
|
|
Other provisions for losses on investments |
|
(1,038 |
) |
— |
|
— |
|
|
Income tax over excluded items |
|
(774 |
) |
(650 |
) |
(390 |
) |
|
Net Income (loss) |
|
1,106 |
|
1,776 |
|
1,675 |
|
Net financial results showed a gain of US$ 2.091 billion vs. a gain of US$ 1.425 billion in 1Q16. The main components of the 2Q16 net financial results are: (i) financial expenses (-US$ 611 million); (ii) financial revenues (US$ 34 million); (iii) foreign exchange and monetary gains (US$ 1.909 billion); (iv) currency and interest rate swap gains (US$ 483 million); and (v) gains on other derivatives (US$ 276 million), composed mainly of bunker oil derivatives gains of US$ 148 million.
Financial results
|
US$ million |
|
2Q16 |
|
1Q16 |
|
2Q15 |
|
|
Financial expenses |
|
(611 |
) |
(630 |
) |
(215 |
) |
|
Gross interest |
|
(452 |
) |
(412 |
) |
(405 |
) |
|
Capitalization of interest |
|
213 |
|
177 |
|
177 |
|
|
Tax and labour contingencies |
|
— |
|
(21 |
) |
(17 |
) |
|
Shareholder debentures |
|
(86 |
) |
(116 |
) |
361 |
|
|
Others |
|
(157 |
) |
(144 |
) |
(187 |
) |
|
Financial expenses (REFIS) |
|
(129 |
) |
(114 |
) |
(144 |
) |
|
Financial income |
|
34 |
|
60 |
|
30 |
|
|
Derivatives(1) |
|
759 |
|
440 |
|
235 |
|
|
Currency and interest rate swaps |
|
483 |
|
486 |
|
243 |
|
|
Others(2) (bunker oil, commodities, etc) |
|
276 |
|
(46 |
) |
(8 |
) |
|
Foreign Exchange |
|
1,960 |
|
1,611 |
|
521 |
|
|
Monetary variation |
|
(51 |
) |
(56 |
) |
(39 |
) |
|
Financial result, net |
|
2,091 |
|
1,425 |
|
532 |
|
(1) The net derivatives gains of US$ 759 million in 2Q16 are comprised of settlement losses of US$ 353 million and market-to-market gains of US$ 1.112 billion.
(2) Other derivatives includes mainly bunker oil derivatives gains of US$ 148 million
Equity income from affiliated companies
Equity income from affiliated companies was US$ 190 million in 2Q16 vs. US$ 156 million in 1Q16. The main contributors to equity income were CSP (US$ 116 million), VLI (US$ 21 million) and Aliança Geração Energia (US$ 18 million).
THE IMPACT OF BUNKER OIL HEDGING ON VALE’S FINANCIAL PERFORMANCE
Vale’s financial performance has been impacted by the bunker oil hedge previously contracted. The outstanding bunker oil hedge position is marked-to-market and recorded as financial results, as a proxy for future cash flow. The outstanding hedge position will be settled at the end of 2016(9).

The impact on the financial statements can be summarized as follows:
(i) In 2Q16: a positive impact of US$ 148 million recognized in 2Q16 as financial results due to the net position of: (i) the positive impact of the mark-to-market of the open positions on June 30th, 2016; and (ii) the negative impact of the realized loss on the settlements which occurred in the quarter.
(ii) In 3Q16 and 4Q16: financial results will be impacted by the changes in the mark-to-market of the outstanding derivative position at the end of each quarter and by the gains or losses related to the settlements recorded in each quarter.
(9) Costs are no longer impacted in 2016, since all outstanding bunker oil hedge position recorded under hedge accounting program was settled up to 4Q15.
(iii) In 1Q17 and subsequent quarters: financial results will no longer be impacted since all outstanding bunker oil hedge position will be settled up to 4Q16.
Impact of bunker oil hedging on Vale’s financial performance
|
|
|
Concept |
|
Current |
|
Drivers of future impact |
| ||||||
|
Freight |
|
Hedge |
|
Impact of |
|
Impact incurred |
|
Type of |
|
Bunker oil derivative |
|
Average strike |
|
|
FOB |
|
No |
|
Impact on financial results |
|
US$ 148 million increase in financial results |
|
Forward |
|
705 |
|
511 |
|
|
|
|
|
|
Zero Cost Collar |
|
1,080 |
|
300 - 380 |
| ||||
EFFECTS OF CURRENCY PRICE VOLATILITY ON VALE’S FINANCIAL PERFORMANCE
In 2Q16, from end to end, the Brazilian Real (BRL) appreciated 9.8% against the US Dollar (USD) from BRL 3.56/ USD as of March 31st, 2016 to BRL 3.21/ USD as of June 30th, 2016. On a quarterly average, the BRL appreciated 10.1%, from an average BRL 3.90/ USD in 1Q16 to an average BRL 3.51/ USD in 2Q16.
The end-to-end appreciation of the BRL against the USD and other currencies caused mainly non-cash gains of US$ 2.443 billion on our earnings before taxes in 2Q16, driven by its impact on:
· The net position of the USD and other currency denominated liabilities and the USD and other currency denominated assets (accounts receivable and others) — which amounted to a gain of US$ 1.960 billion in 2Q16, recorded in the financial statements as “Foreign exchange”.
· The changes in fair value and the settlements of the currency swaps from the BRL and other currencies to the USD, which caused one-off gains of US$ 483 million.
The BRL appreciation on a quarterly average brought negative impacts to Vale’s cash flows. In 2Q16 most of our revenues were denominated in USD, while our COGS were 53% denominated in BRL, 29% in USD and 14% in Canadian dollars (CAD) and about 60% of our capital expenditures were denominated in BRL. The appreciation of the BRL and of other currencies in 2Q16 increased our costs and expenses by US$ 283 million.
Update on Samarco Mineração S.A. (Samarco)
Historical Events
Following the Samarco dam failure on November 5th, 2015, the Brazilian mining authority (DNPM) and the State Department for Environment and Sustainable Development of Minas Gerais (SEMAD) ordered the suspension of Samarco’s operations.
On March 2nd, 2016, Samarco and its shareholders, Vale and BHP Billiton Brasil Ltda. (BHPB), entered into an agreement in connection with the R$ 20.2 billion lawsuit (Agreement) with the Federal Government, the States of Espírito Santo and Minas Gerais and other governmental authorities (Brazilian Authorities) for the implementation of remediation and compensation programs for the areas and communities impacted by the Samarco dam failure. The Agreement does not establish assumption of civil, criminal or administrative responsibilities related to Samarco dam failure.
Under the Agreement, Samarco, Vale and BHPB agreed to establish a Foundation to develop and execute the abovementioned programs, to be funded by Samarco as follows: R$ 2.0 billion (US$ 623 million) in 2016, R$ 1.2 billion (US$ 374 million) in 2017 and R$ 1.2 billion (US$ 374 million) in 2018. Amounts that Samarco already spent on remediation and compensation will be deducted from its funding obligations. From 2019 to 2021, annual contributions to the Foundation will range from R$ 800 million (US$ 249 million) to R$ 1.6 billion (US$ 498 million), and will be set based on the programs approved for each year. From 2022 onwards, Samarco will provide the necessary funds in order to complete the remaining remediation and compensation programs approved for each relevant year. The Foundation will allocate an annual amount of R$ 240 million (US$ 75 million) for a period of 15 years to implement the compensation and remediation programs, with these annual amounts already included in the abovementioned annual contributions for the first six years. Through the end of 2018, the Foundation will also set aside R$ 500 million (US$ 156 million) for basic sanitation programs in the affected areas, as follows: R$ 50 million in 2016, R$ 200 million in 2017 and R$ 250 million in 2018.
The term of the Agreement is 15 years, renewable for successive one-year periods until all its obligations have been fulfilled.
Under the terms of the Agreement, in the event of Samarco not meeting its funding obligations with the Foundation, both Vale and BHPB will provide funds to the Foundation in proportion to their current shareholding stakes in Samarco (50%).
On June 28th, 2016, the Foundation was established by Samarco and its shareholders, with commencement date planned for August 1st, 2016.
The Agreement is already effective among the parties, though its judicial ratification is suspended. There is no assurance as to whether or when the court will ratify the Agreement. Vale understands that the Agreement establishes effective long-term programs to remediate and compensate for the impacts of the Samarco dam failure.
Potential resumption of Samarco’s operation
Samarco is currently unable to conduct its mining and processing activities. On June 23, 2016, Samarco filed the Environmental Impact Study and the Environment Impact Report (EIA / RIMA) in the State Department for Environment and Sustainable Development of Minas Gerais (SEMAD). These studies are part of the licensing process for the use of exhausted pits for tailings disposal.
Given the current status of the licensing process, Samarco cannot make a reliable estimation of how and when its operations will be resumed. Nonetheless, Samarco’s current assessment is that the probability of resuming operations in 2016 is highly unlikely.
Samarco’s free cash flow projection and its impact on Vale’s Financial Statements
Due to the reduced likelihood of resuming operations in 2016 changed substantially Samarco’s future cash flow projections. Nonetheless, Samarco and its shareholders still expect Samarco to generate a significant portion of the funds required to meet its obligations as per the Agreement.
Due to current uncertainties on the licensing process, Vale provisioned an amount of R$ 3.733 billion (US$ 1.163 billion), equivalent to the present value of its estimated secondary responsibility under the Agreement, in its interim financial statements as of June 30 2016 under “Other results in associates and joint ventures”. Given Samarco’s current cash flow projections, it is likely that its shareholders will be called upon to fulfill its obligations under the Agreement and, therefore, Vale expects to contribute about US$ 150 million to the Foundation in 2H16, with this amount offset against the abovementioned R$ 3.7 billion provision.
In addition, Vale intends to make available short-term facilities of up to US$ 100 million to Samarco to support its operations, without undertaking an obligation to Samarco. Funds will be released on an as-needed basis and will be subject to Samarco achieving certain milestones. Likewise, BHPB will make available similar short-term facilities.
Vale will carry out frequent reassessment of the key assumptions used by Samarco and revise the abovementioned provision in a timely manner to reflect new facts and circumstances in its financial statements.
Contingencies related to Samarco dam failure
Vale and certain of its officers have been named as defendants in putative securities class action suits in federal court in New York brought by holders of Vale’s American Depositary Receipts under U.S. federal securities laws. The lawsuits allege that Vale made false and misleading statements or omitted to make disclosures concerning the risks and dangers of the operations of Samarco’s Fundão dam and the adequacy of its related programs and procedures. The plaintiffs have not specified an amount of alleged damages in these actions. Vale intends to vigorously mount a full defense against the allegations.
On May 3, 2016, the Federal Prosecution Office filed a public civil action against Samarco and its shareholders, presenting several demands such as the: (i) adoption of measures for mitigating the social, economic and environmental impacts resulting from the Fundão dam failure and other emergency measures; (ii) payment of compensation to the community; and (iii) payment for collective moral damage. The initial action value claimed by the Federal Prosecution Office is R$ 155 billion (US$ 48 billion).
In addition, Samarco and its shareholders were named as a defendant in several other lawsuits brought by individuals, corporations and governmental entities seeking damages for material or personnel damages.
All lawsuits and petitions are at very early stages, thus it is not possible to determine a range of outcomes and/or reliable estimates of the potential exposure at this time. No contingent liability was quantified and no provision was recognized.
Capital expenditures totaled US$ 1.368 billion in 2Q16 with US$ 905 million in project execution and US$ 463 million in sustaining capital. Capital expenditures decreased US$ 81 million vs. the U$ 1.449 billion spent in 1Q16.
Project Execution and Sustaining by business area
|
US$ million |
|
2Q16 |
|
% |
|
1Q16 |
|
% |
|
2Q15 |
|
% |
|
|
Ferrous minerals |
|
767 |
|
56.1 |
|
917 |
|
63.3 |
|
1,277 |
|
60.3 |
|
|
Coal |
|
159 |
|
11.6 |
|
133 |
|
9.1 |
|
389 |
|
18.3 |
|
|
Base metals |
|
232 |
|
17.0 |
|
269 |
|
18.6 |
|
372 |
|
17.5 |
|
|
Fertilizer nutrients |
|
68 |
|
4.9 |
|
39 |
|
2.7 |
|
49 |
|
2.3 |
|
|
Power generation |
|
16 |
|
1.2 |
|
26 |
|
1.8 |
|
24 |
|
1.1 |
|
|
Steel |
|
126 |
|
9.2 |
|
65 |
|
4.5 |
|
6 |
|
0.3 |
|
|
Others |
|
— |
|
— |
|
— |
|
— |
|
1 |
|
— |
|
|
Total |
|
1,368 |
|
100.0 |
|
1,449 |
|
100.0 |
|
2,119 |
|
100.0 |
|
Evolution of capital expenditures
(US$ million)

Project execution
The Ferrous Minerals and the Coal business segments accounted for about 67% and 16%, respectively, of the total investment in project execution in 2Q16. CSP accounted for 14% of the project execution capex.
Project execution by business area
|
US$ million |
|
2Q16 |
|
% |
|
1Q16 |
|
% |
|
2Q15 |
|
% |
|
|
Ferrous minerals |
|
608 |
|
67.1 |
|
701 |
|
76.2 |
|
1,001 |
|
69.9 |
|
|
Coal |
|
140 |
|
15.5 |
|
118 |
|
12.9 |
|
384 |
|
26.8 |
|
|
Base metals |
|
1 |
|
0.1 |
|
2 |
|
0.3 |
|
11 |
|
0.8 |
|
|
Fertilizer nutrients |
|
14 |
|
1.6 |
|
7 |
|
0.8 |
|
7 |
|
0.5 |
|
|
Power generation |
|
16 |
|
1.7 |
|
26 |
|
2.8 |
|
24 |
|
1.7 |
|
|
Steel |
|
126 |
|
13.9 |
|
65 |
|
7.1 |
|
6 |
|
0.4 |
|
|
Total |
|
905 |
|
100.0 |
|
920 |
|
100.0 |
|
1,434 |
|
100.0 |
|
FERROUS MINERALS
About 89% of the US$ 608 million invested in Ferrous Minerals in 2Q16 relates to the S11D project and the expansion of its associated infrastructure (US$ 540 million).
S11D Plant — Screening, crushing and patios

S11D (including mine, plant and associated logistics — CLN S11D) achieved combined physical progress of 79% in 2Q16 with 90% progress at the mine site and 70% at the logistic infrastructure sites. The duplication of the railway reached 54% physical progress with 243 Km delivered. The railway spur reached 92% physical progress and the on-shore port started up.
S11D Logistics — Port offshore

COAL
Investments in the Moatize II project totaled US$ 37 million in 2Q16. Moatize II showed physical progress of 99% in 2Q16 with the hot commissioning of the handling system being completed. Start-up is expected by early August.
Description and status of main projects
|
Project |
|
Description |
|
Capacity |
|
Status |
|
Ferrous Minerals projects |
|
|
|
|
|
|
|
Carajás Serra Sul S11D |
|
· Development of a mine and processing plant, located in the Southern range of Carajás, Pará, Brazil. |
|
90 |
|
· Cold commissioning on the mine site initiated
· Cold commissioning of the long distance conveyor belt and plant in progress
· Delivery of the electrocenters of the mine 79% completed
· Pre stripping of Systems 3 and 4 concluded |
|
CLN S11D |
|
· Duplication of 570 km railway, with construction of rail spur of 101 km. Acquisition of wagons, locomotives, and onshore and offshore expansions at PDM maritime terminal. |
|
(80) |
(a) |
· Duplication of the railway reached 54% physical progress, totaling 243 Km delivered
· Railway spur connection to EFC Railway concluded
· Onshore port start up initiated
·Offshore expansion achieved 89% physical progress |
|
Coal Projects |
|
|
|
|
|
|
|
Moatize II |
|
· New pit and duplication of the Moatize CHPP, as well as of all related infrastructure in Tete, Mozambique. |
|
11 |
|
· Hot commissioning of the handling system ongoing |
(a) Net additional capacity
Progress indicators(10)
|
|
|
Capacity |
|
Estimated |
|
Executed capex |
|
Estimated capex |
|
Physical |
| ||||
|
Project |
|
(Mtpy) |
|
start-up |
|
2016 |
|
Total |
|
2016 |
|
Total |
|
progress |
|
|
Ferrous minerals projects |
|
|
|
|
|
|
|
|
|
|
|
|
|
|
|
|
Carajás Serra Sul S11D |
|
90 |
|
2H16 |
|
495 |
|
4,908 |
|
890 |
|
6,405 |
(b) |
90 |
% |
|
CLN S11D |
|
230 (80 |
)(a) |
1H14 to 2H18 |
|
682 |
|
4,851 |
|
1,154 |
|
7,850 |
(c) |
70 |
% |
|
Coal projects |
|
|
|
|
|
|
|
|
|
|
|
|
|
|
|
|
Moatize II |
|
11 |
|
2H16 |
|
66 |
|
1,971 |
|
134 |
(d) |
2,068 |
(e) |
99 |
% |
(a) Net additional capacity.
(b) Original capex budget of US$ 8.089 billion.
(c) Original capex budget of US$ 11.582 billion .
(d) There was an increase of US$ 29 million in the 2016 budget.
(e) Original capex of U$ 2.068 billion plus US$ 0.45 billion of rolling stock.
(10) Pre-operating expenses were not included in the estimated capex for the year, although included in the total estimated capex column, in line with Vale’s Board of Directors approvals. Estimated capex for the year is only reviewed once a year.
CSP, Vale’s co-investment in partnership with Dongkuk and Posco in a steel slab plant project with nominal capacity of 3.0 Mtpy(11), started its ramp-up in 2Q16. Vale’s share of the total executed capex is US$ 1.241 billion, with US$ 123 million spent in 2Q16 and no further capital will be disbursement expected from shareholders. Vale will deliver all iron ore required for CSP steel production.
Sustaining capex
Sustaining capital decreased from US$ 529 million in 1Q16 to US$ 463 million in 2Q16. The Base Metals and Ferrous Minerals business segment accounted for 50% and 34%, respectively, of the total sustaining capex in 2Q16.
Sustaining capital for the Ferrous Minerals business segment included, among others: (i) the replacement and acquisition of new equipment (US$ 90 million), (ii) operational enhancements (US$ 20 million); (iii) improvement in the current standards of health and safety and environmental protection (US$ 19 million), (iv) maintenance, improvement and expansion of tailing dams (US$ 16 million). Maintenance of railways and ports in Brazil and Malaysia accounted for US$ 58 million.
Sustaining investments in iron ore fines (excluding sustaining investments in pellets plants) amounted to US$ 122 million, equivalent to US$ 1.8/dmt of iron ore fines in 2Q16, representing a 41% decrease vs. the US$ 2.9/dmt in 1Q16, due to: (i) the carryover of payments from 4Q15, which impacted 1Q16; (ii) the shape of the disbursement curve of sustaining investments, which is concentrated in the second half of the year; and (iii) the dilution of investments due to higher volumes. Sustaining investments for Pellets totaled US$ 32 million, equivalent to US$ 2.9/dmt.
Sustaining capex in the Base Metals business segment was mainly dedicated to: (i) operational enhancement (US$ 144 million), (ii) improvement in the current standards of health and safety and environmental protection (US$ 61 million); (iii) replacement and acquisition of new equipment (US$ 18 million), (iv) maintenance improvements and expansion of tailing dams (US$ 6 million).
Base Metals sustaining capex includes the ongoing investments in the Sudbury smelting unit to reduce SO2 and particulate emissions, the Clean AER project.
(11) Vale’s attributable capacity of 1.5 Mtpy.
Sustaining capex by type - 2Q16
|
US$ million |
|
Ferrous |
|
Coal |
|
Base |
|
Fertilizer |
|
TOTAL |
|
|
Operations |
|
113 |
|
13 |
|
162 |
|
33 |
|
321 |
|
|
Waste dumps and tailing dams |
|
16 |
|
1 |
|
6 |
|
5 |
|
28 |
|
|
Health and Safety |
|
15 |
|
4 |
|
14 |
|
2 |
|
35 |
|
|
CSR - Corporate Social Responsibility |
|
5 |
|
— |
|
47 |
|
11 |
|
63 |
|
|
Administrative & Others |
|
10 |
|
1 |
|
2 |
|
3 |
|
16 |
|
|
Total |
|
159 |
|
19 |
|
231 |
|
54 |
|
463 |
|
Sustaining capex by business area
|
US$ million |
|
2Q16 |
|
% |
|
1Q16 |
|
% |
|
2Q15 |
|
% |
|
|
Ferrous minerals |
|
159 |
|
34.4 |
|
216 |
|
40.7 |
|
276 |
|
40.3 |
|
|
Coal |
|
19 |
|
4.0 |
|
14 |
|
2.7 |
|
4 |
|
0.6 |
|
|
Base metals |
|
231 |
|
50.0 |
|
267 |
|
50.5 |
|
361 |
|
52.7 |
|
|
Fertilizer nutrients |
|
54 |
|
11.6 |
|
32 |
|
6.0 |
|
42 |
|
6.2 |
|
|
Power generation |
|
— |
|
— |
|
— |
|
— |
|
— |
|
— |
|
|
Others |
|
— |
|
— |
|
— |
|
0.1 |
|
1 |
|
0.1 |
|
|
Total |
|
463 |
|
100.00 |
|
529 |
|
100.0 |
|
685 |
|
100.0 |
|
Corporate social responsibility
Investments in corporate social responsibility totaled US$ 75 million in 2Q16, of which US$ 51 million dedicated to environmental protection and conservation and US$ 24 million dedicated to social projects.
Portfolio Management
Three very large ore carriers of 400,000 deadweight tons were sold to ICBC Financial Leasing in 2Q16 for US$ 269 million with sales proceeds expected by August 2016.
Free cash flow was US$ 761 million in 2Q16.
Cash generated from operations was US$ 3.115 billion in 2Q16, with non-operational uses of cash flow stemming mainly from: (i) interest on loans (US$ 362 million); (ii) income taxes and REFIS installments (US$ 213 million); (iii) settlement of derivatives in the quarter (US$ 353 million), of which US$ 294 million related to bunker oil; and (iv) investments (US$ 1.232 billion).
Net additions and repayments of loans were negative US$ 375 million, with debt repayments exceeding debt additions in 2Q16.
Free Cash Flow
US$ million

Gross debt totaled US$ 31.814 billion as of June 30th, 2016, increasing slightly from the US$ 31.470 billion as of March 31st, 2016, mainly as a result of the impact of appreciation of the BRL(12) on the translation of BRL denominated debt into USD. The exchange rate impact was partially offset by net debt repayments(13) of US$ 375 million in 2Q16.
On June 7th, 2016 Vale issued, through its wholly owned subsidiary Vale Overseas Limited, US$ 1.250 billion of Guaranteed Notes due in 2021 bearing a coupon of 5.875% per annum. On June 20th, 2016 Vale repaid US$ 1.000 billion of the US$ 3.000 billion disbursed from its Revolving Credit Lines in January 2016.
Net debt decreased by US$ 153 million compared to the end of the previous quarter, totaling US$ 27.508 billion based on a cash position of US$ 4.306 billion as of June 30th, 2016. The decrease in net debt was mainly driven by the positive free cash flow of US$ 761 million in 2Q16, and was partially offset by the impact of the exchange rate on the translation of BRL denominated debt into USD.
Debt position

Gross debt after currency and interest rates swaps was 90% denominated in USD, being 31% based on floating and 69% based on fixed interest rates as of June 30th, 2016.
(12) In 2Q16, from end to end, the BRL appreciated 9.8% against the USD.
(13) Debt repayments less debt additions.
Average debt maturity was 7.6 years and average cost of debt, after the above-mentioned currency and interest rates swaps, increased to 4.23% per annum on June 30th, 2016, against 4.03% per annum on March 31st, 2016. The increase of the average cost of debt was mainly driven by the partial repayment of the Revolving Credit Lines which have a cost of debt lower than Vale’s average.
Interest coverage, measured by the ratio of the LTM(14) adjusted EBITDA to LTM interest payment, remained practically stable at 5.1x in 2Q16 vs. 5.2x in 1Q16.
Gross debt to LTM adjusted EBITDA remained stable at 4.2x as of June 30th, 2016 compared to March 31st, 2016.
Debt indicators
|
US$ million |
|
2Q16 |
|
1Q16 |
|
2Q15 |
|
|
Total debt |
|
31,814 |
|
31,470 |
|
29,773 |
|
|
Net debt |
|
27,508 |
|
27,661 |
|
26,509 |
|
|
Total debt / adjusted LTM EBITDA (x) |
|
4.2 |
|
4.2 |
|
3.3 |
|
|
Adjusted LTM EBITDA / LTM interest expenses (x) |
|
5.1 |
|
5.2 |
|
5.9 |
|
(14) Last twelve months.
Performance of the business segments
The Ferrous Minerals business segment accounted for 89.6% of Vale’s adjusted EBITDA in 2Q16, followed by 15.8% from the Base Metals business segment, 1.3% from the Fertilizers business segment, -4.6% from the Coal business segment and -2.1% from Others.
Segment information — 2Q16, as per note of financial statements
|
|
|
|
|
|
|
Expenses |
|
|
|
|
| ||||
|
US$ million |
|
Net |
|
Cost(1) |
|
SG&A and |
|
R&D |
|
Pre operating |
|
Dividends |
|
Adjusted |
|
|
Ferrous minerals |
|
4,541 |
|
(2,228 |
) |
(171 |
) |
(20 |
) |
(46 |
) |
60 |
|
2,136 |
|
|
Iron ore fines |
|
3,508 |
|
(1,652 |
) |
(150 |
) |
(16 |
) |
(34 |
) |
— |
|
1,656 |
|
|
ROM |
|
5 |
|
— |
|
— |
|
— |
|
— |
|
— |
|
5 |
|
|
Pellets |
|
868 |
|
(459 |
) |
(19 |
) |
(4 |
) |
(9 |
) |
60 |
|
437 |
|
|
Others ferrous |
|
99 |
|
(64 |
) |
(3 |
) |
— |
|
— |
|
— |
|
32 |
|
|
Mn & Alloys |
|
61 |
|
(53 |
) |
1 |
|
— |
|
(3 |
) |
— |
|
6 |
|
|
Coal |
|
145 |
|
(237 |
) |
(6 |
) |
(3 |
) |
(9 |
) |
— |
|
(110 |
) |
|
Base metals |
|
1,447 |
|
(1,013 |
) |
(11 |
) |
(22 |
) |
(25 |
) |
— |
|
376 |
|
|
Nickel(3) |
|
1,050 |
|
(776 |
) |
(2 |
) |
(21 |
) |
(25 |
) |
— |
|
226 |
|
|
Copper(4) |
|
397 |
|
(237 |
) |
(9 |
) |
(1 |
) |
— |
|
— |
|
150 |
|
|
Fertilizer nutrients |
|
464 |
|
(396 |
) |
(29 |
) |
(6 |
) |
(4 |
) |
3 |
|
32 |
|
|
Others |
|
29 |
|
(55 |
) |
(52 |
) |
(26 |
) |
— |
|
54 |
|
(51 |
) |
|
Total |
|
6,626 |
|
(3,929 |
) |
(269 |
) |
(78 |
) |
(84 |
) |
117 |
|
2,383 |
|
(1) Excluding depreciation and amortization
(2) Excluding non-recurring effects
(3) Including copper and by products from our nickel operations
(4) Including by products from our copper operations
Adjusted EBITDA of the Ferrous Minerals business segment was US$ 2.136 billion in 2Q16, US$ 325 million higher than in 2Q15, despite the negative impact of lower sales prices (US$ 264 million), which were offset by exchange rate (US$ 203 million), the positive impacts of lower bunker oil prices (US$ 162 million) and real gains in competitiveness (US$ 257 million).
Gains in competitiveness were based mainly on: (i) marketing and commercial initiatives (US$ 68 million); (ii) higher sales volumes (US$ 47 million); and (iii) ongoing cost reduction initiatives(15) (US$ 142 million).
Year-on-year EBITDA variation 2Q16 vs. 2Q15 — Ferrous Minerals business segment
Iron ore
EBITDA
Adjusted EBITDA of iron ore fines was US$ 1.656 billion in 2Q16, 17.5% higher than in 1Q16, mainly as a result of higher sales volumes (US$ 241 million) and higher realized sales prices (US$ 129 million), which were partially offset by the negative impacts of the appreciation of the BRL against the USD (US$ 106 million) and higher costs(16) (US$ 36 million).
(15) Including the positive impact of renegotiations of chartering freight contracts
(16) After excluding the effects of higher volumes and exchange rate variations.
SALES REVENUES AND VOLUME
Net sales revenues of iron ore fines, excluding pellets and Run of Mine (ROM), amounted to US$ 3.508 billion in 2Q16 vs. US$ 2.917 billion in 1Q16, as a result of higher sales volumes (US$ 462 million) and higher iron ore fines sales prices (US$ 129 million) in 2Q16 vs. 1Q16.
Production, including third party purchases and excluding Samarco’s attributable production, reached 86.8 Mt in 2Q16, 9.3 Mt higher than in 1Q16, mainly due to the good performance at the Northern System and weather related seasonality.
Sales volumes of iron ore fines reached 72.7 Mt in 2Q16 vs. 62.7 Mt in 1Q16, 15.9% and 8.1% higher than in 1Q16 and 2Q15, respectively, with iron ore inventory increasing by 1.4 Mt as a result of: (i) production and acquisition of ore from third parties of 86.8 Mt; (ii) deduction of 11.0 Mt of iron ore fines used for the production of pellets; (iii) adjustment of iron ore inventories(17) of 1.3 Mt; (iv) sales of iron ore fines of 72.7 Mt; and (v) deduction of 0.4 Mt of ROM sales.
CFR sales of iron ore fines increased from 43.7 Mt in 1Q16 to 48.0 Mt in 2Q16, representing 66% of all iron ore fines sales volumes in 2Q16 and staying in line with the share of CFR sales in 1Q16. The increase was mainly due to the effects of seasonally higher production volumes in 2Q16.
ROM sales totaled 0.4 Mt in 2Q16, remaining in line with the 0.5 Mt recorded in 1Q16.
Net operating revenue by product
|
US$ million |
|
2Q16 |
|
1Q16 |
|
2Q15 |
|
|
Iron ore fines |
|
3,508 |
|
2,917 |
|
3,391 |
|
|
ROM |
|
5 |
|
4 |
|
33 |
|
|
Pellets |
|
868 |
|
753 |
|
972 |
|
|
Manganese & Ferroalloys |
|
61 |
|
47 |
|
53 |
|
|
Others |
|
99 |
|
83 |
|
103 |
|
|
Total |
|
4,541 |
|
3,804 |
|
4,552 |
|
Volume sold
|
‘000 metric tons |
|
2Q16 |
|
1Q16 |
|
2Q15 |
|
|
Iron ore fines |
|
72,678 |
|
62,744 |
|
67,230 |
|
|
ROM |
|
405 |
|
520 |
|
4,181 |
|
|
Pellets |
|
11,388 |
|
11,130 |
|
12,231 |
|
|
Manganese ore |
|
354 |
|
515 |
|
385 |
|
|
Ferroalloys |
|
36 |
|
25 |
|
23 |
|
(17) Iron ore inventories are periodically adjusted downwards due to moisture and handling during its processing phases.
REALIZED PRICES
Iron ore sales in 2Q16 were distributed across three pricing systems: (i) 52% based on the current quarter, month and daily spot prices, including provisional price sales that were settled within the quarter; (ii) 34% based on provisional prices with settlement price based on the market price defined on the delivery date, in which case prices had not yet been settled at the end of the quarter; and (iii) 14% linked to past prices (quarter-lagged).
Vale’s CFR dmt reference price for iron ore fines (ex-ROM) increased by US$ 1.6/t from US$ 54.7/t in 1Q16 to US$ 56.3/t in 2Q16, equivalent to a price realization of 101% of the average Platts IODEX 62% of US$ 55.7/t in 2Q16.
Vale’s CFR/FOB wmt price for iron ore fines (ex-ROM) increased by US$ 1.8/t from US$ 46.5/t in 1Q16 to US$ 48.3/t in 2Q16, after adjusting for moisture and the effect of FOB sales, which accounted for 34% of the total sales volumes in 2Q16.
Price realization in 2Q16 was impacted by:
· Provisional prices set at the end of 1Q16 at US$ 51.7/t, which were later adjusted based on the price of delivery in 2Q16, positively impacted prices in 2Q16 by US$ 2.0/t compared to US$ 2.3/t in 1Q16, as a result of the higher realized prices in the beginning of 2Q16.
· Provisional prices set at the end of 2Q16 at US$ 52.7/t vs. the IODEX average of US$ 55.7/t in 2Q16 negatively impacted prices in 2Q16 by US$ 1.0/t compared to a positive impact of US$ 1.5/t in 1Q16.
· Quarter-lagged contracts, priced at US$ 46.4/t based on the average prices for Dec-Jan-Feb negatively impacted prices in 2Q16 by US$ 1.2/t compared to a positive impact of US$ 0.4/t in 1Q16.
Iron ore sales of 24.9 Mt, or 34% of Vale’s sales mix, were recorded under the provisional pricing system, which was set at the end of 2Q16 at US$ 52.7/t. The final prices of these sales and the required adjustment to sales revenues will be determined and recorded in 3Q16.
Price realization — iron ore fines
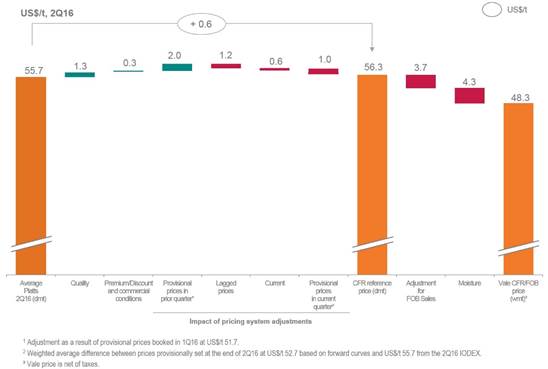
Average prices
|
US$/ metric ton |
|
2Q16 |
|
1Q16 |
|
2Q15 |
|
|
Iron ore - Metal Bulletin 65% index |
|
59.99 |
|
50.96 |
|
66.02 |
|
|
Iron ore - Platts’s 62% IODEX |
|
55.70 |
|
48.30 |
|
58.45 |
|
|
Iron ore fines CFR reference price (dmt) |
|
56.30 |
|
54.67 |
|
61.50 |
|
|
Iron ore fines CFR/FOB realized price (wmt) |
|
48.30 |
|
46.50 |
|
50.44 |
|
|
ROM |
|
12.35 |
|
8.02 |
|
7.89 |
|
|
Pellets CFR/FOB (wmt) |
|
76.20 |
|
67.65 |
|
79.47 |
|
|
Manganese ore |
|
103.13 |
|
60.56 |
|
82.24 |
|
|
Ferroalloys |
|
690.36 |
|
648.96 |
|
951.61 |
|
COSTS
Costs for iron ore fines amounted to US$ 1.652 billion (or US$ 1.902 billion with depreciation charges) in 2Q16. Costs increased by US$ 36 million vs. 1Q16, after adjustments for the effects of higher sales volumes (US$ 221 million) and exchange rate variations (US$ 86 million). The increase was mainly driven by higher bunker oil prices (US$ 37 million) and royalties (US$ 32 million), which were partly offset by savings in C1 cash costs.
IRON ORE COGS - 1Q16 x 2Q16
|
|
|
|
|
Variance drivers |
|
|
|
|
| ||||
|
US$ million |
|
1Q16 |
|
Volume |
|
Exchange |
|
Others |
|
Total Variation |
|
2Q16 |
|
|
Personnel |
|
145 |
|
26 |
|
17 |
|
(34 |
) |
9 |
|
154 |
|
|
Outsourced services and Materials |
|
199 |
|
35 |
|
23 |
|
(34 |
) |
24 |
|
223 |
|
|
Energy (Electricity, diesel & gas) |
|
99 |
|
18 |
|
12 |
|
(2 |
) |
28 |
|
127 |
|
|
Maintenance |
|
231 |
|
41 |
|
27 |
|
11 |
|
79 |
|
310 |
|
|
Maritime freight |
|
461 |
|
73 |
|
— |
|
37 |
|
110 |
|
571 |
|
|
Other operational |
|
174 |
|
28 |
|
7 |
|
58 |
|
93 |
|
267 |
|
|
Total costs before depreciation and amortization |
|
1,309 |
|
221 |
|
86 |
|
36 |
|
343 |
|
1,652 |
|
|
Depreciation |
|
220 |
|
38 |
|
21 |
|
(29 |
) |
30 |
|
250 |
|
|
Total |
|
1,529 |
|
259 |
|
107 |
|
7 |
|
373 |
|
1,902 |
|
Maritime freight costs, which are fully accrued as cost of goods sold, totaled US$ 571 million in 2Q16, having increased US$ 37 million vs. 1Q16 after adjustments for higher volumes (US$ 73 million). There was no negative impact from the bunker oil hedge position as the hedge accounting program terminated in 2015.
Unit maritime freight cost per iron ore metric ton was US$ 11.8/t in 2Q16, US$ 0.5/t higher than the US$ 11.3/t recorded in 1Q16. The increase was mainly driven by the negative impact of higher bunker oil prices in our chartering contracts, which was partly offset by the renegotiation of freight contracts. Vale’s average bunker oil price increased from US$ 178.0/t in 1Q16 to US$ 197.0/t in 2Q16.
Other operational costs for iron ore fines net of depreciation, amounted to US$ 267 million, increasing by US$ 58 million vs. 1Q16, after adjustments for the effects of higher sales volumes (US$ 28 million) and exchange rate variations (US$ 7 million). The increase was mainly driven by the impact of higher iron ore prices on royalties and acquisitions from third party ore.
C1 CASH COST
Total iron ore fines C1 cash cost at the port (mine, plant, railroad and port, ex-royalties) was US$ 1.051 billion after deducting depreciation of US$ 250 million, iron ore maritime freight costs of US$ 571 million and distribution costs of US$ 30 million.
C1 cash cost FOB port per metric ton for iron ore fines ex-royalties totaled US$ 13.2/t in 2Q16, US$ 0.9/t higher than the US$ 12.3/t recorded in 1Q16, mostly due to the impact of the BRL appreciation against the USD (US$1.2/t), which was partly offset by cost saving initiatives.
C1 cash cost FOB port per metric ton of iron ore fines in BRL was R$ 46.1/t in 2Q16, R$ 1.4/t lower than the R$ 47.5/t recorded in 1Q16, despite the inflationary pressures in Brazil. The
reduction in costs was mainly due to improvements in operational productivity, cost-cutting initiatives and the increased fixed-costs dilution on seasonally higher production volumes.
Iron Ore Fines Costs and Expenses in BRL
|
R$/t |
|
2Q16 |
|
1Q16 |
|
2Q15 |
|
|
Costs(1) |
|
46.1 |
|
47.5 |
|
50.0 |
|
|
Expenses(1) |
|
9.7 |
|
12.2 |
|
11.4 |
|
|
Total |
|
55.8 |
|
59.7 |
|
61.4 |
|
|
(1) Net of depreciation |
|
|
|
|
|
|
|
Evolution of C1 Cash Cost(1) per ton in BRL

EXPENSES
Iron ore expenses, net of depreciation, amounted to US$ 200 million in 2Q16, remaining in line with the US$ 199 million recorded in 1Q16. SG&A and other expenses totaled US$ 150 million in 2Q16, remaining in line with the US$ 156 million recorded in 1Q16. R&D amounted to US$ 16 million, increasing US$ 5 million vs. 1Q16, following the regular seasonality of expenditures. Pre-operating and stoppage expenses, net of depreciation, amounted to US$ 34 million and remained in line with the US$ 32 million recorded in 1Q16.
Iron ore fines cash cost and freight
|
|
|
2Q16 |
|
1Q16 |
|
2Q15¹ |
|
|
Costs (US$ million) |
|
|
|
|
|
|
|
|
COGS, less depreciation and amortization |
|
1,652 |
|
1,309 |
|
1,944 |
|
|
Distribution costs |
|
30 |
|
22 |
|
22 |
|
|
Maritime freight costs |
|
571 |
|
461 |
|
703 |
|
|
Bunker oil hedge |
|
— |
|
— |
|
86 |
|
|
FOB at port costs (ex-ROM) |
|
1,051 |
|
826 |
|
1,133 |
|
|
FOB at port costs (ex-ROM and ex-royalties) |
|
958 |
|
774 |
|
1,054 |
|
|
|
|
|
|
|
|
|
|
|
Sales volumes (Mt) |
|
|
|
|
|
|
|
|
Total iron ore volume sold |
|
73.1 |
|
63.3 |
|
71.4 |
|
|
Total ROM volume sold |
|
0.4 |
|
0.5 |
|
4.2 |
|
|
Volume sold (ex-ROM) |
|
72.7 |
|
62.7 |
|
67.2 |
|
|
% of CFR sales |
|
66.0 |
% |
65.0 |
% |
58.7 |
% |
|
% of FOB sales |
|
34.0 |
% |
35.0 |
% |
41.3 |
% |
|
Vale’s iron ore cash cost (ex-ROM, ex-royalties), FOB (US$ /t) |
|
13.2 |
|
12.3 |
|
16.2 |
|
|
Freight |
|
|
|
|
|
|
|
|
Volume CFR (Mt) |
|
48.2 |
|
40.9 |
|
41.9 |
|
|
Vale’s iron ore unit freight cost (US$/t) |
|
11.8 |
|
11.3 |
|
18.8 |
|
|
Vale’s iron ore unit freight cost (ex- bunker oil hedge) (US$/t) |
|
11.8 |
|
11.3 |
|
16.8 |
|
(1) US$ 16.2/t is equivalent to US$15.8/t reported in 2Q15 after adjusting for the new allocation criteria for ICMS (US$ 0.6/t) and Distribution Costs (-US$ 0.4/t) as described in the box “Managerial Allocation Changes” in pages 45-46 of the 4Q15 Earnings Release. Additional adjustment was made to include the cost of Third Party Ore Purchases (US$ 0.2/t) to our C1 costs.
Evolution of iron ore fines cash cost, freight and expenses

Evolution of iron ore fines sustaining per ton
US$/dmt

Iron ore pellets
Adjusted EBITDA for pellets in 2Q16 was US$ 437 million, 47.6% higher than in 1Q16, mainly as a result of the positive impacts of higher sales prices (US$ 98 million) and higher dividends received from the leased pelletizing plants (US$ 60 million), which were partially offset by the negative impact of exchange rate variations (US$ 31 million) and higher expenses (US$ 10 million).
Dividends received from the leased pelletizing plants are an integral part of the business and are usually paid every 6 months (at second and fourth quarters). The volatility of iron ores prices and pellet premiums influences the dividends received, as dividends are based on a predetermined formula varying according to market prices.
Dividends received from pelletizing plants (excluding Samarco)
|
US$ million |
|
2Q14 |
|
4Q14 |
|
2Q15 |
|
4Q15 |
|
2Q16 |
|
|
Dividends received |
|
42.0 |
|
27.0 |
|
30.3 |
|
22.0 |
|
60.0 |
|
Net sales revenues for pellets amounted to US$ 868 million in 2Q16, increasing US$ 115 million from the US$ 753 million recorded in 1Q16 as a result of higher sales prices, which increased from US$ 67.7 per ton in 1Q16 to US$ 76.2 per ton in 2Q16, and higher sales volumes, which increased from the 11.1 Mt recorded in 1Q16 to 11.4 Mt in 2Q16.
Production reached 10.0 Mt in 2Q16, 1.5 Mt lower than in 1Q16 mainly as a result of: (i) the halt of the Fábrica pelletizing plant, due to delays in obtaining environmental permits for the expansion of adjacent mines, which were granted on July 2nd, 2016; and (ii) the scheduled maintenance stoppages at the Tubarão plants in 2Q16.
CFR pellet sales of 1.9 Mt in 2Q16 represented 17% of total pellets sales and were 0.1 Mt higher than in 1Q16. FOB pellet sales increased from 9.3 Mt in 1Q16 to 9.5 Mt in 2Q16.
Pellet CFR/FOB prices increased by US$ 8.6/t, whereas the Platt’s IODEX iron ore reference price (CFR China) increased by US$ 7.4/t in the quarter, as a result of better quality and higher premiums in the quarter.
Pellet costs totaled US$ 459 million (or US$ 539 million with depreciation charges) in 2Q16. Costs decreased by US$ 18 million vs. 1Q16 after adjusting for the effects of higher volumes (US$ 11 million) and exchange rate variations (US$ 29 million).
The decrease in pellets costs was mainly a result of lower fuel and natural gas costs (US$ 13 million) and personnel costs (US$ 4 million).
Pre-operating and stoppage expenses for pellets were US$ 9 million in 2Q16, being US$ 5 million higher than in 1Q16 mainly due to higher stoppage expenses at the Fábrica pelletizing plant.
EBITDA unit margin for pellets ex-Samarco was US$ 38.4/t in 2Q16, US$ 11.8/t higher than in 1Q16.
Pellets - EBITDA ex-Samarco
|
|
|
2Q16 |
|
1Q16 |
| ||||
|
|
|
US$ million |
|
US$/wmt |
|
US$ million |
|
US$/wmt |
|
|
Net Revenues / Realized Price |
|
868 |
|
76.2 |
|
753 |
|
67.7 |
|
|
Dividends Received (leased pelletizing plants) ex-Samarco |
|
60 |
|
5.3 |
|
— |
|
— |
|
|
Cash Costs (iron ore, leasing, freight, overhead, energy and other) |
|
-459 |
|
-40.3 |
|
-437 |
|
-39.3 |
|
|
Expenses (SG&A, R&D and other) |
|
-32 |
|
-2.8 |
|
-20 |
|
-1.8 |
|
|
EBITDA ex-Samarco |
|
437 |
|
38.4 |
|
296 |
|
26.6 |
|
Iron ore fines and pellets cash breakeven
Iron ore fines and pellets EBITDA break-even, measured by unit cash costs and expenses on a landed-in-China basis (and adjusted for quality, pellets margins differential and moisture, excluding ROM), increased from US$ 28.0/t in 1Q16 to US$ 28.5/t in 2Q16 on a dry metric ton (dmt) basis, mainly driven by: (i) the impact of the appreciation of the BRL against the USD in C1 cash costs (US$ 1.2/t); (ii) the higher bunker oil prices (US$ 0.4/t); and (iii) higher royalties (US$ 0.5/t), with the increase in iron ore prices. The increase was partially offset by higher pellet premiums (US$ 0.3/t) and by the dividends received from the pelletizing plants (US$ 0.7/t), which are usually paid every six months.
Iron ore and Pellets cash break-even on a landed-in-China basis, including sustaining capex per ton of US$ 1.8/t, decreased from US$ 30.9/t in 1Q16 to US$ 30.3/t in 2Q16 on a dmt basis.
Iron ore and pellets cash breakeven landed in China(1)
|
US$/t |
|
2Q16 |
|
1Q16 |
|
2Q15 |
|
|
Vale’s iron ore cash cost (ex-ROM, ex-royalties), FOB (US$/t) |
|
13.2 |
|
12.3 |
|
16.2 |
|
|
Iron ore fines freight cost (ex-bunker oil hedge) |
|
11.8 |
|
11.3 |
|
16.8 |
|
|
Iron ore fines distribution cost |
|
0.6 |
|
0.5 |
|
0.5 |
|
|
Iron ore fines expenses(2) & royalties |
|
4.0 |
|
4.0 |
|
4.0 |
|
|
Iron ore fines moisture adjustment |
|
2.6 |
|
2.5 |
|
3.3 |
|
|
Iron ore fines quality adjustment |
|
-1.6 |
|
-1.5 |
|
-1.8 |
|
|
Iron ore fines EBITDA breakeven (US$/dmt) |
|
30.7 |
|
29.2 |
|
39.0 |
|
|
Iron ore fines pellet adjustment(3) |
|
-2.2 |
|
-1.2 |
|
-2.2 |
|
|
Iron ore fines and pellets EBITDA breakeven (US$/dmt) |
|
28.5 |
|
28.0 |
|
36.9 |
|
|
Iron ore fines sustaining investments |
|
1.8 |
|
2.9 |
|
3.5 |
|
|
Iron ore fines and pellets cash breakeven landed in China(3) (US$/dmt) |
|
30.3 |
|
30.9 |
|
40.4 |
|
(1) Measured by unit cost + expenses + sustaining investment adjusted for quality
(2) Net of depreciation
(3) US$ 0.7/t relates to the dividends received from the pelletizing plants, which are usually paid every six months.
Iron ore and pellets cash break-even on a landed-in-China basis

Manganese and ferroalloys
Adjusted EBITDA of manganese ore and ferroalloys was US$ 6 million in 2Q16, US$ 5 million higher than the US$ 1 million in 1Q16, mainly due the positive impact of higher prices (US$ 17 million), which were partially offset by the negative impact of higher costs (US$ 6 million) and exchange rate variation (US$ 4 million).
Net sales revenues for manganese increased to US$ 36 million in 2Q16 from US$ 31 million in 1Q16 mainly due to higher sales prices in 2Q16. Production of manganese ore reached 553,000 t in 2Q16 vs. 596,000 t in 1Q16 and 554,000 t in 2Q15.
Net sales revenues for ferroalloys amounted to US$ 25 million in 2Q16, increasing US$ 9 million from the US$ 16 million in 1Q16, due to higher sales volumes. Ferroalloys production increased to 29,000 t in 2Q16 from the 25,000 t recorded in 1Q16.
Manganese ore and ferroalloys costs totaled US$ 53 million (or US$ 58 million with depreciation charges) in 2Q16. Costs increased by US$ 6 million vs. 1Q16 after adjusting for the effects of lower volumes (US$ 3 million) and exchange rate variations (US$ 4 million), due to higher costs in services and materials for the ferroalloys operations.
Market outlook — iron ore
Iron ore Platts IODEX 62% averaged US$ 55.7/dmt in 2Q16, decreasing 4.8% year-on-year, but increasing 15.2% quarter-on-quarter. The rebound in prices was driven by stronger Chinese downstream demand combined with low steel inventory in the supply chain.
Steel demand improved in China supported by the credit easing started in 2H15. Investments in the housing sector increased while investments in infrastructure remained stable in 1H16.
The higher steel demand boosted prices and encouraged worldwide production. Global steel production grew 6.1% quarter-on-quarter in 2Q16, supported by the 9.2% growth in Chinese steel production. Steel exports from China increased 9% in 1H16 vs. 1H15 despite the anti-dumping measures adopted by several countries.
The rise in steel production in China pushed iron ore prices upward and encouraged seaborne supply.
In 2H16, iron ore supply should be relatively higher as we move into a traditionally stronger supply period.
Volume sold by destination — Iron ore and pellets
|
‘000 metric tons |
|
2Q16 |
|
% |
|
1Q16 |
|
% |
|
2Q15 |
|
% |
|
|
Americas |
|
8,054 |
|
9.5 |
|
8,339 |
|
11.2 |
|
11,714 |
|
14.0 |
|
|
Brazil |
|
6,291 |
|
7.4 |
|
6,536 |
|
8.8 |
|
10,167 |
|
12.2 |
|
|
Others |
|
1,763 |
|
2.1 |
|
1,803 |
|
2.4 |
|
1,547 |
|
1.8 |
|
|
Asia |
|
60,568 |
|
71.7 |
|
52,310 |
|
70.4 |
|
55,512 |
|
66.4 |
|
|
China |
|
48,176 |
|
57.0 |
|
42,930 |
|
57.8 |
|
43,181 |
|
51.6 |
|
|
Japan |
|
7,778 |
|
9.2 |
|
5,856 |
|
7.9 |
|
6,597 |
|
7.9 |
|
|
Others |
|
4,614 |
|
5.5 |
|
3,524 |
|
4.7 |
|
5,734 |
|
6.9 |
|
|
Europe |
|
12,893 |
|
15.3 |
|
11,488 |
|
15.5 |
|
13,360 |
|
16.0 |
|
|
Germany |
|
5,160 |
|
6.1 |
|
4,791 |
|
6.5 |
|
5,926 |
|
7.1 |
|
|
France |
|
1,799 |
|
2.1 |
|
1,410 |
|
1.9 |
|
1,455 |
|
1.7 |
|
|
Others |
|
5,934 |
|
7.0 |
|
5,287 |
|
7.1 |
|
5,979 |
|
7.1 |
|
|
Middle East |
|
2,231 |
|
2.6 |
|
1,699 |
|
2.3 |
|
2,797 |
|
3.3 |
|
|
Rest of the World |
|
725 |
|
0.9 |
|
441 |
|
0.6 |
|
259 |
|
0.3 |
|
|
Total |
|
84,471 |
|
100.0 |
|
74,277 |
|
100.0 |
|
83,642 |
|
100.0 |
|
Selected financial indicators — Ferrous minerals
|
US$ million |
|
2Q16 |
|
1Q16 |
|
2Q15 |
|
|
Net Revenues |
|
4,541 |
|
3,804 |
|
4,552 |
|
|
Costs(1) |
|
(2,228 |
) |
(1,851 |
) |
(2,661 |
) |
|
Expenses(1) |
|
(171 |
) |
(165 |
) |
(189 |
) |
|
Pre-operating and stoppage expenses(1) |
|
(46 |
) |
(39 |
) |
(38 |
) |
|
R&D expenses |
|
(20 |
) |
(11 |
) |
(38 |
) |
|
Dividends received |
|
60 |
|
— |
|
185 |
|
|
Adjusted EBITDA |
|
2,136 |
|
1,738 |
|
1,811 |
|
|
Depreciation and amortization |
|
(381 |
) |
(347 |
) |
(409 |
) |
|
Adjusted EBIT |
|
1,695 |
|
1,391 |
|
1,217 |
|
|
Adjusted EBIT margin (%) |
|
37.3 |
|
36.6 |
|
26.7 |
|
(1) Net of depreciation and amortization
Selected financial indicators — Iron ore fines
|
|
|
2Q16 |
|
1Q16 |
|
2Q15 |
|
|
Adjusted EBITDA (US$ million) |
|
1,656 |
|
1,409 |
|
1,221 |
|
|
Volume Sold (Mt) |
|
72.678 |
|
62.744 |
|
67.230 |
|
|
Adjusted EBITDA (US$/t) |
|
22.79 |
|
22.46 |
|
18.16 |
|
Selected financial indicators — Pellets (excluding Samarco)
|
|
|
2Q16 |
|
1Q16 |
|
2Q15 |
|
|
Adjusted EBITDA (US$ million) |
|
437 |
|
296 |
|
424 |
|
|
Volume Sold (Mt) |
|
11.388 |
|
11.130 |
|
12.231 |
|
|
Adjusted EBITDA (US$/t) |
|
38.37 |
|
26.59 |
|
34.64 |
|
Selected financial indicators — Iron ore fines and Pellets
|
|
|
2Q16 |
|
1Q16 |
|
2Q15 |
|
|
Adjusted EBITDA (US$ million) |
|
2,093 |
|
1,705 |
|
1,645 |
|
|
Volume Sold (Mt) |
|
84.066 |
|
73.874 |
|
79.461 |
|
|
Adjusted EBITDA (US$/t) |
|
24.90 |
|
23.08 |
|
20.70 |
|
Adjusted EBITDA totaled US$ 376 million in 2Q16, increasing US$ 47 million vs. 1Q16 mainly as a result of the positive impacts of lower costs(18) (US$ 50 million) and higher prices (US$ 48 million), which more than offset the negative impact of exchange rate variation (US$ 56 million).
SALES REVENUES AND VOLUMES
Nickel sales revenues totaled US$ 710 million in 2Q16, increasing US$ 60 million vs. 1Q16 as a result of the positive impact of higher realized nickel prices in 2Q16 (US$ 29 million) and higher sales volumes (US$ 31 million). Sales volumes were 77 kt in 2Q16, 3 kt higher than in 1Q16.
Copper sales revenues totaled US$ 443 million in 2Q16, increasing US$ 8 million vs. 1Q16 as a result of higher copper sales volumes (US$ 27 million) and being partially offset by the negative impact of lower realized copper prices in 2Q16 (US$ 19 million). Sales volumes were 107 kt in 2Q16, 6 kt higher than in 1Q16.
PGMs (platinum group metals) sales revenues totaled US$ 99 million in 2Q16, increasing US$ 3 million vs. 1Q16. Sales volumes were 151,000 oz in 2Q16 vs. 153,000 oz in 1Q16. PGMs sales volumes decreased mainly due to lower production of palladium.
Gold sales revenues totaled US$ 154 million in 2Q16, increasing US$ 24 million vs. 1Q16 as a result of higher gold realized prices (US$ 15 million) and higher sales volumes (US$ 9 million). Sales volumes were 122,000 oz in 2Q16, 7,000 oz higher than in 1Q16.
Net operating revenue by product
|
US$ million |
|
2Q16 |
|
1Q16 |
|
2Q15 |
|
|
Nickel |
|
710 |
|
650 |
|
874 |
|
|
Copper |
|
443 |
|
435 |
|
483 |
|
|
PGMs |
|
99 |
|
96 |
|
125 |
|
|
Gold |
|
154 |
|
130 |
|
128 |
|
|
Silver |
|
10 |
|
9 |
|
7 |
|
|
Others |
|
31 |
|
33 |
|
31 |
|
|
Total |
|
1,447 |
|
1,353 |
|
1,648 |
|
NICKEL REALIZED PRICES
Nickel realized price was US$ 9,180/t, US$ 357/t higher than the average nickel LME price of US$ 8,823/t in 2Q16.
(18) After adjusting for impacts of volumes.
Vale’s nickel products are divided in two categories, refined nickel (pellets, powder, cathode, FeNi, Utility Nickel™ and Tonimet™) and intermediates (concentrates, matte, NiO and NHC).
Refined nickel products have greater nickel content, typically commanding a premium over the average LME nickel price, whereas nickel intermediates are less pure as they are only partially processed. Due to this difference, intermediate products are sold at a discount. The amount of the discount will vary depending on the amount of processing still required, product forms and level of impurities. The sales product mix is an important driver of nickel price realization.
Refined nickel sales accounted for 88% of total nickel sales in 2Q16 vs. 90% in 1Q16. Sales of intermediate products accounted for the balance.
The realized nickel price differed from the average LME price in 2Q16 due to the following impacts:
· Premium for refined finished nickel products averaging US$ 612/t, with an impact on the aggregate realized nickel price of US$ 538/t;
· Discount for intermediate nickel products averaging US$ 1,519/t, with an impact on the aggregate realized nickel price of -US$ 181/t.
Price realization — nickel

COPPER REALIZED PRICES
Copper realized price was US$ 4,144/t, US$ 585/t lower than the average copper LME price of US$ 4,729/t in 2Q16. Vale’s copper products are mostly intermediate forms of copper,
predominately in the form of concentrate, which is sold at a discount to the LME. These products are sold on a provisional pricing basis during the quarter with final prices determined at a future period, generally one to four months forward(19).
The realized copper price differed from the average LME price in 2Q16 due to the following impacts:
· Current period price adjustments: mark-to-market of invoices still open in the quarter based on the copper price forward curve(20) at the end of the quarter (-US$ 22/t).
· Prior period price adjustment: variance between the price used in final invoices (and in the mark-to-market of invoices from previous quarters still open at the end of the quarter) and the provisional prices used for sales in previous quarters (-US$ 66/t).
· TC/RCs, penalties, premiums and discounts for intermediate products (-US$ 497/t).
Excluding the effects of prior period price adjustments and the discounts for copper intermediate products, including TC/RCs, the copper gross realized price(21) was US$ 4,707/t in 2Q16.
Price realization — copper
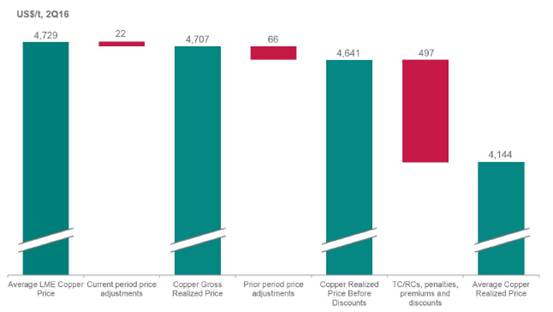
(19) On June 30, 2016, Vale had provisionally priced copper sales totaling 104,714 tons valued at a LME forward price of US$ 4,800/t, subject to final pricing over the next several months.
(20) Includes a small amount of final invoices that were provisionally priced and settled within the quarter.
(21) Price to be used when comparing with other copper producers’ realized price.
The total negative impact of the provisional pricing system (mark-to-market of open invoices and differences between provisional and final prices) on sales revenues was -US$ 9 million as the net result of: (i) current period price adjustment for the mark-to-market of invoices still open in the quarter based on the copper price forward curve (-US$ 22/t on 107 kt(22) of copper sales volumes, resulting in -US$ 2 million); and (ii) prior period price adjustment based on the variance between the price used in final invoices (and in the mark-to-market of invoices from previous quarters still open at the end of the quarter) and provisional prices used in previous quarters (-US$ 66/t on 107 kt of copper sales volumes, resulting in -US$ 7 million).
Copper realized prices decreased 4.1% in 2Q16 vs. 1Q16, despite the increase of 1.2% in LME copper prices in the same period, mainly due to the negative impact of the provisional pricing system on sales revenues whose impact was a negative US$ 9 million in 2Q16 vs. a positive US$ 14 million in 1Q16.
Average prices
|
US$/ metric ton |
|
2Q16 |
|
1Q16 |
|
2Q15 |
|
|
Nickel - LME |
|
8,823 |
|
8,499 |
|
13,008 |
|
|
Copper - LME |
|
4,729 |
|
4,672 |
|
6,043 |
|
|
Nickel |
|
9,180 |
|
8,787 |
|
13,045 |
|
|
Copper |
|
4,144 |
|
4,323 |
|
4,979 |
|
|
Platinum (US$/oz) |
|
909 |
|
898 |
|
1,109 |
|
|
Gold (US$/oz) |
|
1,266 |
|
1,132 |
|
1,174 |
|
|
Silver (US$/oz) |
|
16.66 |
|
14.14 |
|
14.79 |
|
|
Cobalt (US$/lb) |
|
10.41 |
|
8.61 |
|
10.73 |
|
SALES VOLUME PERFORMANCE
Sales volumes of nickel achieved a record for a second quarter of 77 kt in 2Q16, 3 kt higher than in 1Q16 and 10 kt higher than in 2Q15.
Sales volumes of copper achieved a record for a second quarter of 107 kt in 2Q16, 7 kt higher than in 1Q16 due to higher sales volumes from Sossego and Salobo, and 10 kt higher than in 2Q15 due to the ramp-up of Salobo and higher sales of copper from our North Atlantic nickel operations.
Sales volumes of gold achieved a record of 122,000 oz in 2Q16, 7,000 oz higher than in 1Q16 and 13,000 oz higher than in 2Q15 as a result of the ongoing ramp-up of Salobo.
(22) Copper deliveries include 41,000 t in North Atlantic nickel operations and 66,000 t in South Atlantic copper operations.
Volume sold
|
‘000 metric tons |
|
2Q16 |
|
1Q16 |
|
2Q15 |
|
|
Nickel operations & by products |
|
|
|
|
|
|
|
|
Nickel |
|
77 |
|
74 |
|
67 |
|
|
Copper |
|
41 |
|
44 |
|
34 |
|
|
Gold (‘000 oz) |
|
23 |
|
23 |
|
26 |
|
|
Silver (‘000 oz) |
|
480 |
|
459 |
|
247 |
|
|
PGMs (‘000 oz) |
|
151 |
|
153 |
|
149 |
|
|
Cobalt (metric ton) |
|
1,000 |
|
1,178 |
|
930 |
|
|
Copper operations & by products |
|
|
|
|
|
|
|
|
Copper |
|
66 |
|
56 |
|
63 |
|
|
Gold (‘000 oz) |
|
99 |
|
92 |
|
83 |
|
|
Silver (‘000 oz) |
|
139 |
|
165 |
|
157 |
|
Costs and expenses
Costs and expenses increased to US$ 1.071 billion in 2Q16 from US$ 1.024 billion in 1Q16, representing an increase of 4.6%, mainly due to the impact of higher sales volumes (US$ 55 million) and exchange rate variation (US$ 56 million), partially offset by lower costs (US$ 50 million) and lower expenses (US$ 12 million).
COSTS OF GOODS SOLD (COGS)
Costs totaled US$ 1.013 million in 2Q16 (or US$ 1.424 billion including depreciation). After adjusting for the effects of higher sales volumes (US$ 54 million) and exchange rate variations (US$ 53 million), costs decreased by US$ 50 million vs. 1Q16, mainly due to lower costs at our Ontario operations (US$ 42 million) and at Onça Puma (US$ 7 million).
BASE METALS COGS - 1Q16 x 2Q16
|
|
|
|
|
Variance drivers |
|
|
|
|
| ||||
|
US$ million |
|
1Q16(1) |
|
Volume |
|
Exchange |
|
Others |
|
Total Variation |
|
2Q16 |
|
|
Personnel |
|
198 |
|
12 |
|
12 |
|
17 |
|
40 |
|
239 |
|
|
Outsourced services and Materials |
|
325 |
|
12 |
|
12 |
|
(29 |
) |
11 |
|
336 |
|
|
Energy (Electricity, diesel & gas) |
|
134 |
|
8 |
|
8 |
|
(38 |
) |
(22 |
) |
112 |
|
|
Third-party purchases |
|
50 |
|
— |
|
— |
|
18 |
|
36 |
|
86 |
|
|
Maintenance |
|
186 |
|
14 |
|
13 |
|
(12 |
) |
15 |
|
201 |
|
|
Maritime freight |
|
9 |
|
— |
|
— |
|
(1 |
) |
(1 |
) |
8 |
|
|
Other operational |
|
54 |
|
8 |
|
8 |
|
(5 |
) |
(23 |
) |
31 |
|
|
Total costs before depreciation and amortization |
|
956 |
|
54 |
|
53 |
|
(50 |
) |
57 |
|
1,013 |
|
|
Depreciation |
|
390 |
|
10 |
|
28 |
|
(17 |
) |
21 |
|
411 |
|
|
Total |
|
1,346 |
|
64 |
|
81 |
|
(67 |
) |
78 |
|
1,424 |
|
(1) 1Q16 distribution of costs among categories was adjusted.
UNIT CASH COST
Unit cash cost in the North Atlantic Operations increased in 2Q16 due to lower copper deliveries associated with lower production and the negative impact of the exchange rate variation. Onça Puma unit cost decreased mainly due to higher production volumes despite
the negative impact of exchange rates in the quarter. VNC unit costs net of by-product credits decreased from US$ 12,711/t recorded in 1Q16 to US$ 12,208/t recorded in 2Q16.
Sossego and Salobo unit costs increased mainly due to the negative impact of the exchange rate which was partially offset by higher gold by-product prices and volumes..
Base Metals — unit cash cost of sales, net of by-product credits(1)
|
US$ / t |
|
2Q16 |
|
1Q16 |
|
2Q15 |
|
|
NICKEL |
|
|
|
|
|
|
|
|
North Atlantic Operations (nickel) |
|
3,582 |
|
3,218 |
|
3,280 |
|
|
PTVI (nickel) |
|
5,825 |
|
5,806 |
|
7,159 |
|
|
VNC(2) (nickel) |
|
12,208 |
|
12,711 |
|
20,471 |
|
|
Onça Puma (nickel) |
|
7,804 |
|
8,064 |
|
9,499 |
|
|
COPPER |
|
|
|
|
|
|
|
|
Sossego (copper) |
|
2,809 |
|
2,692 |
|
2,353 |
|
|
Salobo (copper) |
|
954 |
|
923 |
|
1,616 |
|
(1) North Atlantic figures include Clydach and Acton refining costs while PTVI and VNC only include standalone operations.
(2) Unit cash cost of sales include pre-operating expenses for periods prior to 1Q16.
EXPENSES
SG&A and other expenses, excluding depreciation, totalled US$ 11 million in 2Q16, US$ 10 million lower than in 1Q16, mainly due to the positive one-off effect of insurance proceeds from Onça Puma (US$ 30 million), which was partially offset by higher expenses of VNC (US$ 9 million) and Salobo (US$ 8 million).
Pre-operating and stoppage expenses, net of depreciation, totaled US$ 25 million, US$ 7 million lower than in 1Q16, reflecting lower expenses at Long Harbour (US$ 7 million). VNC costs are now fully allocated to COGS, no longer impacting pre-operating and operating expenses as of 1Q16.
Performance by operation
The breakdown of the Base Metals EBITDA components per operation is detailed below.
Base Metals EBITDA overview — 2Q16
|
US$ million |
|
North |
|
PTVI |
|
VNC |
|
Sossego |
|
Salobo |
|
Onça |
|
Other(1) |
|
Total Base |
|
|
Net Revenues |
|
751 |
|
138 |
|
59 |
|
129 |
|
268 |
|
54 |
|
48 |
|
1,447 |
|
|
Costs |
|
(482 |
) |
(107 |
) |
(99 |
) |
(96 |
) |
(141 |
) |
(47 |
) |
(42 |
) |
(1,013 |
) |
|
SG&A and others |
|
2 |
|
(3 |
) |
(7 |
) |
(2 |
) |
(5 |
) |
24 |
|
(21 |
) |
(11 |
) |
|
R&D |
|
(13 |
) |
(2 |
) |
(3 |
) |
(1 |
) |
— |
|
— |
|
(3 |
) |
(22 |
) |
|
Pre-operating & stoppage |
|
(25 |
) |
— |
|
— |
|
— |
|
— |
|
— |
|
— |
|
(25 |
) |
|
EBITDA |
|
233 |
|
26 |
|
(50 |
) |
30 |
|
122 |
|
31 |
|
(16 |
) |
376 |
|
|
Ni deliveries (kt) |
|
43 |
|
20 |
|
6 |
|
— |
|
— |
|
6 |
|
2 |
|
77 |
|
|
Cu deliveries (kt) |
|
41 |
|
— |
|
— |
|
25 |
|
41 |
|
— |
|
— |
|
107 |
|
(1) Includes the PTVI and VNC off-takes, intercompany sales and purchase of finished nickel and corporate center allocated for base metals.
EBITDA
Details of Base Metals’ adjusted EBITDA by operations are as follows:
(i) The North Atlantic operations EBITDA was US$ 233 million, increasing US$ 42 million vs. 1Q16 mainly as a result of the positive impacts of lower costs and expenses net of volume effects (US$ 36 million) and favorable prices (US$ 33 million), which were partially offset by the negative impact of exchange rate variation (US$ 27 million).
(ii) PTVI’s EBITDA was US$ 26 million, increasing US$ 17 million vs. 1Q16 mainly as a result of lower costs and expenses (US$ 10 million), higher prices (US$ 4 million) and higher delivery volumes (US$ 3 million).
(iii) VNC’s EBITDA was -US$ 50 million, in line with the previous quarter of -US$ 48 million.
(iv) Onça Puma’s EBITDA was US$ 31 million, increasing US$ 24 million vs. 1Q16 mainly as a result of the positive one-off effect of insurance proceeds (US$ 30 million) and also the positive impact of lower COGS (US$ 7 million).
(v) Sossego’s EBITDA was US$ 30 million, decreasing US$ 4 million vs. 1Q16 mainly as a result of the negative impact of exchange rate variation (US$ 8 million).
(vi) Salobo’s EBITDA was US$ 122 million, decreasing US$ 9 million vs. 1Q16 mainly as a result of the negative impact of exchange rate variation (US$ 13 million).
Base metals — EBITDA by operation
|
US$ million |
|
2Q16 |
|
1Q16 |
|
2Q15 |
|
|
North Atlantic operation(1) |
|
233 |
|
191 |
|
261 |
|
|
PTVI |
|
26 |
|
9 |
|
58 |
|
|
VNC |
|
(50 |
) |
(48 |
) |
(78 |
) |
|
Onça Puma |
|
31 |
|
7 |
|
21 |
|
|
Sossego |
|
30 |
|
34 |
|
50 |
|
|
Salobo |
|
122 |
|
131 |
|
119 |
|
|
Other(2) |
|
(16 |
) |
5 |
|
(25 |
) |
|
Total |
|
376 |
|
329 |
|
406 |
|
(1) Includes the operations in Canada and in the United Kingdom.
(2) Includes the PTVI and VNC off-takes, intercompany sales and purchase of finished nickel and corporate center allocation for base metals.
Base metals — EBITDA per ton by operation
|
US$ million |
|
2Q16 |
|
1Q16 |
|
2Q15 |
|
|
North Atlantic operation(1) |
|
5,431 |
|
4,808 |
|
6,662 |
|
|
PTVI |
|
1,326 |
|
541 |
|
3,100 |
|
|
VNC |
|
(7,786 |
) |
(5,393 |
) |
(10,987 |
) |
|
Onça Puma |
|
5,165 |
|
1,220 |
|
3,231 |
|
|
Sossego |
|
1,216 |
|
1,767 |
|
1,946 |
|
|
Salobo |
|
2,995 |
|
3,488 |
|
3,218 |
|
(1) Includes the operations in Canada and in the United Kingdom. Figures divided by nickel tonnage.
Market outlook — base metals
NICKEL
LME nickel prices improved over the second quarter of 2016 to a quarterly average of US$ 8,823/t Ni, from US$ 8,499/t Ni in the first quarter of 2016.
Demand for nickel in 2Q16 was bolstered by Chinese stainless steel production, particularly 300-series stainless which contains 8-10% Ni. Furthermore, tight scrap markets in US and Europe have increased demand for primary nickel units despite weaker stainless steel production. Demand for nickel in non-stainless applications remained robust particularly in the automotive and aerospace sectors, however, oil and gas applications continued to be affected by the low Brent oil price.
On the supply side, Chinese NPI production recovered in 2Q16 but continues to be down year-to-date versus 2015. Likewise, nickel ore imports into China, which feed NPI production, were down year-to-date by 26% from 2015. Imports of FeNi into China have also increased year-to-date to 62.4 kt Ni in 2016 vs. 56.3 kt in 2015 largely as a result of Indonesian nickel smelter production ramp-up. Moreover, refined nickel imports into China continued to grow
January through May with 192.6 kt imported in 2016 vs. 65.2 kt in 2015. Supply outside of China remains relatively unchanged with minor production disruptions.
Exchange inventories declined during the quarter. LME inventories at the end of June stood at 379 kt declining 52 kt since end of 1Q16. Meanwhile, inventories on SHFE increased by 25 kt from 1Q16 to 98 kt by the end of June. The net impact on global exchange inventories was a decline of 27 kt from end of 1Q16 to end of 2Q16.
The market has shifted into a deficit after several years of consecutive surplus. Inventories are trending down while premiums for non-exchange deliverable metal are improving. The nickel price is slowly recovering but is expected to remain well below the costs of much of the nickel industry, continuing to exert pressure on the cash flows of many operations.
Longer term outlook for nickel continues to be positive as the market shifts deeper into deficit and capital investment for new projects and replacement volumes is deferred within the context of declining grades. Demand is expected to pick up as global economies stabilize and continue to grow. Furthermore, increased demand from batteries for electric vehicles, which continue to see increasing and significant capital allocation from major automotive manufacturers, will likely bolster Class I nickel consumption. Class I nickel is expected to be the majority source for the production of the nickel sulphate that is used to make cathode materials for battery manufacture. Nickel based battery formulations are expected to be the predominant choice for electric vehicles over other battery formulations due to nickel’s inherent high energy density properties.
COPPER
LME copper prices improved over the second quarter of 2016 to a quarterly average of US$ 4,729/t Cu, from US$ 4,672/t Cu in the first quarter of 2016.
Demand for copper remained relatively weak as growth in copper consuming sectors continued to be negatively impacted by the global economy, particularly the deceleration of growth in China.
On the supply side, production of Chinese refined copper is rising resulting in a pickup in copper concentrate imports and a slowing of refined imports (+4% and -30% May vs. March, respectively). There have been limited cuts to mine production since the beginning of the year.
Chinese copper smelter spot TC/RCs increased 30% from the end of 1Q16 through to end of 2Q16 due to an ample supply of new concentrates on the market. Clean concentrates reportedly commanded lower premiums during the quarter relative to last year due to less demand for blending with impure concentrates.
Shanghai inventories declined 58% during the second quarter after experiencing a steady climb in Q1 2016. LME inventories were relatively flat in Q2 until 59.6 kt was added the week of June 6th, primarily to Singapore. Since this large addition, LME stocks have fallen by just under 22 kt with inventories up 32% over the quarter.
Outlook for key sectors such as property sales, air conditioner production and grid spending is expected to be a drag on the market in the second half of 2016. Ongoing tightness in scrap supply is providing some support to refined copper demand. However, lack of cuts to mine supply and a weak demand picture is expected to result in a small surplus for 2016.
The long-term outlook is expected to improve as future supply is constrained by declining ore grades and deferred capital investment.
Selected financial indicators - Base Metals
|
US$ million |
|
2Q16 |
|
1Q16 |
|
2Q15 |
|
|
Net Revenues |
|
1,447 |
|
1,353 |
|
1,648 |
|
|
Costs(1) |
|
(1,013 |
) |
(956 |
) |
(1,056 |
) |
|
Expenses(1) |
|
(11 |
) |
(21 |
) |
(41 |
) |
|
Pre-operating and stoppage expenses(1) |
|
(25 |
) |
(32 |
) |
(120 |
) |
|
R&D expenses |
|
(22 |
) |
(15 |
) |
(25 |
) |
|
Adjusted EBITDA |
|
376 |
|
329 |
|
406 |
|
|
Depreciation and amortization |
|
(438 |
) |
(407 |
) |
(449 |
) |
|
Adjusted EBIT |
|
(62 |
) |
(78 |
) |
(43 |
) |
|
Adjusted EBIT margin (%) |
|
(4.3 |
) |
(5.8 |
) |
(2.6 |
) |
(1) Net of depreciation and amortization
Adjusted EBITDA for the Coal business segment was negative US$ 110 million in 2Q16, compared to negative US$ 93 million in 1Q16. The EBITDA decrease of US$ 17 million was mainly driven by the decrease in the Carborough Downs EBITDA (US$ 29 million) which faced geological instability issues in 2Q16.
Net sales revenues of metallurgical coal decreased to US$ 77 million in 2Q16 from US$ 104 million in 1Q16, as a result of lower sales volumes (US$ 27 million). Net sales revenues of thermal coal increased to US$ 68 million in 2Q16 from US$ 50 million in 1Q16 as a result of higher sales volumes (US$ 18 million).
Sales volumes of metallurgical coal totaled 1.001 Mt in 2Q16, decreasing by 366 kt vs. 1Q16, due to lower production in Carborough Downs which experienced roof fall events in May 2016, after the completion of the longwall move. Underground mining in Carborough Downs stopped as roof consolidation and overall recovery works are underway. Sales volumes of thermal coal reached 1.767 Mt in 2Q16, 468 kt higher than in 1Q16 as a result of higher sales of thermal coal stockpiled in previous quarters with the ramp-up of the Nacala Logistics Corridor.
Realized price of metallurgical coal was US$ 77.48/t in 2Q16, increasing by 2.0% against US$ 75.93/t in 1Q16, below the reference prices average increase in 2Q16 vs. 1Q16. Realized prices were impacted by sales contract types which are predominantly based on lagged prices. As the average of reference prices was lower in 1Q16 compared to 2Q16, the lagged price system impacted negatively the realized prices in 2Q16. In 3Q16, the realized prices should capture the reference prices increase occurred in 2Q16. Realized price of thermal coal was US$ 38.38/t in 2Q16, remaining in line with the US$ 38.57/t recorded in 1Q16.
Coal costs and expenses, net of depreciation, totaled US$ 255 million in 2Q16, increasing slightly against the US$ 247 million recorded in 1Q16. After adjusting for the effects of higher volumes (US$ 44 million) and exchange rate variation (US$ 1 million), costs and expenses decreased by US$ 37 million in 2Q16 vs. 1Q16, driven by lower costs and expenses in Mozambique (US$ 58 million), partly offset by higher costs and expenses in Carborough Downs (US$ 21 million) due to the roof fall events.
Quarterly performance by operation
Highlights by operation are:
Australia
· Adjusted EBITDA for the Australian operations(23) was negative US$ 10 million in 2Q16, compared to the positive US$ 19 million in 1Q16. The decrease of US$ 29 million vs. 1Q16 was mainly a result of the negative impacts of higher costs and expenses(24) (US$ 21 million) and lower sales volumes (US$ 8 million), due to the production issues in Carborough Downs.
· Costs and expenses, net of depreciation, for Carborough Downs totaled US$ 40 million in 2Q16, increasing by US$ 6 million vs. 1Q16. After adjusting for the effects of lower volumes and exchange rate variation (US$ 15 million), costs and expenses increased US$ 21 million in 2Q16 vs. 1Q16.
Mozambique
· Adjusted EBITDA for the operations in Mozambique was negative US$ 100 million in 2Q16 compared to the negative US$ 112 million in 1Q16. The increase of US$ 12 million vs. 1Q16 was mainly driven by the positive impact of lower costs and expenses(25) (US$ 58 million).
· Production cost per ton at the Nacala port decreased by 39% to US$ 103/t in 2Q16 from US$ 168/t in 1Q16, and should further improve in the coming quarters as Nacala and Moatize II ramp up.
· Mozambique costs and expenses, net of depreciation, amounted to US$ 215 million in 2Q16, compared to US$ 213 million in 1Q16. After adjusting for the impact of higher volumes (US$ 60 million), costs and expenses decreased US$ 58 million in 2Q16 vs. 1Q16 mainly as a result of the ramp-up of the Nacala Logistic Corridor.
· The ramp-up of the Nacala Logistics Corridor continued as planned, with 1.655 Mt being transported on the railway in 2Q16 against 761 Kt in 1Q16. Nineteen shipments (1.567 Mt) were concluded in 2Q16 compared to thirteen shipments (982 Kt) in 1Q16.
· The force majeure in the Sena-Beira railway is no longer in place as activities at the Beira Sena corridor resumed recently.
(23) Include Carborough Downs operations; Broadlea and Eagle Downs are currently in care and maintenance.
(24) After adjusting for the impacts of volumes and exchange rate variation.
(25) After adjusting for the impact of volumes.
Market outlook — coal
Prices for the low volatility premium hard coking coal quarterly benchmark FOB Australia increased by 3.7% from US$ 81/t in 1Q16 to US$ 84/t in 2Q16. PCI benchmark prices also increased by 5.8% from US$ 69/t to US$ 73/t. Spot prices for low volatility premium hard coking coal averaged US$ 91/t in 2Q16, up from US$79/t in 1Q16.
The recent increase in coking coal prices was mainly driven by an improvement in China’s import demand and constraints on global supply.
Demand was boosted by the growth in China’s steel production in 2Q16 and the need to import coal possibly due to the effects of a policy enacted in April to reduce coal miners’ working days from 330 to 276 per annum. In particular, there has also been more demand for lower ash/lower sulphur coals. From January to May, metallurgical coal imports from China on an annualized basis reached 62.4 Mt compared to 55.4 Mt in the same period of last year, an increase of 12.6% year-on-year.
Global supply continued to face challenges. In China, the central government continued to reinforce the need to consolidate industries operating in overcapacity already leading to mine closures as part of a plan to close more than 1,000 coal mines in 2016. From January to May coking coal production was reported at 174 Mt, down 12.2% year-on-year. In Australia, supply continued to be affected by wet weather and stoppages at some underground mines. Throughout the quarter, the coking coal spot market developed further in Australia with the decline of exports from the US and better demand from Asian markets.
Confidence in continued price strengthening in the coming quarters gained momentum, as price indices for premium hard coking coal were strong in the beginning of July, in excess of US$ 92/t, and forward curves were in contango. The sustainability of this scenario will largely depend on the production cuts at Chinese domestic mines.
Coal business performance
Net operating revenue by product
|
US$ million |
|
2Q16 |
|
1Q16 |
|
2Q15 |
|
|
Metallurgical coal |
|
77 |
|
104 |
|
137 |
|
|
Thermal coal |
|
68 |
|
50 |
|
9 |
|
|
Total |
|
145 |
|
154 |
|
146 |
|
Average prices
|
US$/ metric ton |
|
2Q16 |
|
1Q16 |
|
2Q15 |
|
|
Metallurgical coal |
|
77.48 |
|
75.93 |
|
88.27 |
|
|
Thermal coal |
|
38.38 |
|
38.57 |
|
54.55 |
|
Volume sold
|
‘000 metric tons |
|
2Q16 |
|
1Q16 |
|
2Q15 |
|
|
Metallurgical coal |
|
1,001 |
|
1,367 |
|
1,552 |
|
|
Thermal coal |
|
1,767 |
|
1,299 |
|
165 |
|
|
Total |
|
2,768 |
|
2,666 |
|
1,717 |
|
Selected financial indicators - Coal
|
US$ million |
|
2Q16 |
|
1Q16 |
|
2Q15 |
|
|
Net Revenues |
|
145 |
|
154 |
|
146 |
|
|
Costs(1) |
|
(237 |
) |
(293 |
) |
(186 |
) |
|
Expenses(1) |
|
(6 |
) |
49 |
|
(44 |
) |
|
Pre-operating and stoppage expenses(1) |
|
(9 |
) |
(1 |
) |
(12 |
) |
|
R&D expenses |
|
(3 |
) |
(2 |
) |
(6 |
) |
|
Adjusted EBITDA |
|
(110 |
) |
(93 |
) |
(102 |
) |
|
Depreciation and amortization |
|
(15 |
) |
(23 |
) |
(48 |
) |
|
Adjusted EBIT |
|
(125 |
) |
(116 |
) |
(150 |
) |
|
Adjusted EBIT margin (%) |
|
(86 |
) |
(75 |
) |
(103 |
) |
(1) Net of depreciation and amortization
Adjusted EBITDA for the Fertilizer business segment decreased to US$ 32 million in 2Q16 from US$ 70 million in 1Q16. The decrease of US$ 38 million from 1Q16 was mainly driven by the negative impacts of higher costs (US$ 21 million), lower prices (US$ 11 million), higher expenses (US$ 19 million) and exchange rate variations impacting costs and prices (US$ 10 million), being partly offset by the positive impact of higher sales volumes (US$ 21 million).
Potash net sales revenues totaled US$ 22 million in 2Q16, US$ 1 million lower than in 1Q16. Sales volumes decreased slightly from 104 kt in 1Q16 to 103 kt in 2Q16. Realized prices decreased from US$ 223/t in 1Q16 to US$ 208/t in 2Q16, alongside the reduction in international potash prices.
Phosphate products net sales revenues totaled US$ 363 million in 2Q16, US$ 73 million higher than in 1Q16 as a result of higher sales volumes (US$ 77 million), which were partially offset by lower prices (US$ 3 million). Sales volumes increased from 1,458 kt in 1Q16 to 1,880 kt in 2Q16.
Nitrogen fertilizers net sales revenues totaled US$ 60 million in 2Q16 vs. US$ 58 million in 1Q16, as a result of higher sales volumes (US$ 2 million).
Realized prices for fertilizer nutrients decreased in 2Q16 vs 1Q16 for almost all of our products: potash prices by -6.7%, MAP by -1.8%, TSP by -0.4%, SSP by -9.5% and phosphate rock by -14.5%.
Fertilizer costs, net of depreciation, totaled US$ 396 million in 2Q16 (or US$ 482 million with depreciation charges), increasing US$ 102 million vs. 1Q16. After excluding the effects of higher volumes (US$ 63 million) and exchange rate variations (US$ 18 million), costs increased US$ 21 million basically as a result of higher costs with corrective maintenance in some plants and higher rentals of mining equipment, which are more economically attractive than investing to replace the fleet.
SG&A and Other expenses, net of depreciation, totaled US$ 29 million in 2Q16, increasing US$ 18 million vs. 1Q16 mainly due to higher contingencies (US$ 8 million) recorded in 2Q16 and a positive reversal of contingencies (US$ 5 million) in 1Q16 which decreased expenses in that quarter. R&D expenses totaled US$ 6 million in 2Q16, increasing US$ 1 million vs. 1Q16. Pre-operating and stoppage expenses totaled US$ 4 million in 2Q16, remaining stable vs. 1Q16.
Market outlook — fertilizer nutrients
In 2Q16, prices of fertilizers products remained pressured, despite a more favorable market condition for agricultural commodities. Supply increased driven by the addition of new capacity and by the devaluation of the currency of some big producing countries such as the Russian ruble.
The global phosphate market remained weak. Demand from big consumers, such as Brazil, was firm, however supply outstripped demand due to the abovementioned facts, which weighted on prices.
The potash market continued to undergo production cuts, mainly from European producers. Nonetheless, supply remained high and pressured prices.
The nitrogen market remained oversupplied. Some North American producers of ammonia, as well as Chinese producers of urea have been reducing production, which may help to rebalance the market of nitrogen products.
In the short to medium term, more production cuts are expected as a result of unfavorable market conditions and demand should remain firm supported by global economic growth.
FERTILIZERS COGS - 1Q16 x 2Q16
|
|
|
|
|
|
|
Variance drivers |
|
|
|
Total Variation |
|
|
|
|
US$ million |
|
1Q16 |
|
Volume |
|
Rate |
|
Others |
|
1Q16 x 2Q16 |
|
2Q16 |
|
|
Personnel |
|
47 |
|
16 |
|
4 |
|
3 |
|
23 |
|
70 |
|
|
Outsourced services and Materials |
|
168 |
|
35 |
|
8 |
|
9 |
|
52 |
|
220 |
|
|
Energy (Electricity, diesel & gas) |
|
36 |
|
10 |
|
3 |
|
2 |
|
15 |
|
51 |
|
|
Maintenance |
|
15 |
|
1 |
|
1 |
|
6 |
|
8 |
|
23 |
|
|
Other operational |
|
28 |
|
1 |
|
2 |
|
1 |
|
6 |
|
32 |
|
|
Total costs before depreciation and amortization |
|
294 |
|
63 |
|
18 |
|
21 |
|
102 |
|
396 |
|
|
Depreciation |
|
66 |
|
14 |
|
6 |
|
— |
|
20 |
|
86 |
|
|
Total |
|
360 |
|
77 |
|
24 |
|
21 |
|
122 |
|
482 |
|
Fertilizer nutrients business performance
Net operating revenue by product
|
US$ million |
|
2Q16 |
|
1Q16 |
|
2Q15 |
|
|
Potash |
|
22 |
|
23 |
|
31 |
|
|
Phosphates |
|
363 |
|
290 |
|
445 |
|
|
Nitrogen |
|
60 |
|
58 |
|
78 |
|
|
Others |
|
19 |
|
13 |
|
14 |
|
|
Total |
|
464 |
|
384 |
|
568 |
|
Average prices
|
US$/ metric ton |
|
2Q16 |
|
1Q16 |
|
2Q15 |
|
|
Potash |
|
208.45 |
|
223.36 |
|
302.59 |
|
|
Phosphates |
|
|
|
|
|
|
|
|
MAP |
|
384.83 |
|
391.88 |
|
521.14 |
|
|
TSP |
|
306.67 |
|
305.48 |
|
380.57 |
|
|
SSP |
|
186.97 |
|
170.82 |
|
202.19 |
|
|
DCP |
|
475.73 |
|
465.54 |
|
533.29 |
|
|
Phosphate rock |
|
70.94 |
|
83.06 |
|
80.55 |
|
|
Nitrogen |
|
409.19 |
|
400.02 |
|
523.39 |
|
Volume sold
|
‘000 metric tons |
|
2Q16 |
|
1Q16 |
|
2Q15 |
|
|
Potash |
|
103 |
|
104 |
|
102 |
|
|
Phosphates |
|
|
|
|
|
|
|
|
MAP |
|
210 |
|
259 |
|
207 |
|
|
TSP |
|
201 |
|
92 |
|
230 |
|
|
SSP |
|
512 |
|
262 |
|
523 |
|
|
DCP |
|
128 |
|
109 |
|
98 |
|
|
Phosphate rock |
|
734 |
|
690 |
|
881 |
|
|
Others phosphates |
|
95 |
|
46 |
|
104 |
|
|
Nitrogen |
|
145 |
|
146 |
|
150 |
|
Selected financial indicators - Fertilizers
|
US$ million |
|
2Q16 |
|
1Q16 |
|
2Q15 |
|
|
Net Revenues |
|
464 |
|
384 |
|
568 |
|
|
Costs(1) |
|
(396 |
) |
(294 |
) |
(369 |
) |
|
Expenses(1) |
|
(29 |
) |
(11 |
) |
2 |
|
|
Pre-operating and stoppage expenses(1) |
|
(4 |
) |
(4 |
) |
(18 |
) |
|
R&D expenses |
|
(6 |
) |
(5 |
) |
(20 |
) |
|
Dividends received |
|
3 |
|
— |
|
— |
|
|
Adjusted EBITDA |
|
32 |
|
70 |
|
163 |
|
|
Depreciation and amortization |
|
(88 |
) |
(67 |
) |
(77 |
) |
|
Adjusted EBIT |
|
(59.0 |
) |
3.0 |
|
86.0 |
|
|
Adjusted EBIT margin (%) |
|
(12.7 |
) |
0.8 |
|
15.1 |
|
(1) Net of depreciation and amortization
FINANCIAL INDICATORS OF NON-CONSOLIDATED COMPANIES
For selected financial indicators of the main non-consolidated companies, see our quarterly financial statements on www.vale.com / Investors / Information for the market / Financial statements.
Vale will host two conference calls and webcasts on Thursday, July 28, 2016. The first, in Portuguese (non-translated), will begin at 10:00 a.m. Rio de Janeiro time. The second, in English, at 12:00 p.m. Rio de Janeiro time (11:00 a.m. US Eastern Standard Time, 4:00 p.m. British Standard Time).
Dial in to conference calls/webcasts:
In Portuguese:
Participants from Brazil: (55 11) 3193-1001 or (55 11) 2820-4001
Participants from the US: (1 888) 700-0802
Participants from other countries: (1 786) 924-6977
Access code: VALE
In English:
Participants from Brazil: (55 11) 3193-1001 or (55 11) 2820-4001
Participants from the U.S.: (1 866) 262-4553
Participants from other countries: (1 412) 317-6029
Access code: VALE
Instructions for participation will be available on the website: www.vale.com/Investors. A podcast will be available on Vale’s website.
This press release may include statements that present Vale’s expectations about future events or results. All statements, when based upon expectations about the future and not on historical facts, involve various risks and uncertainties. Vale cannot guarantee that such statements will prove correct. These risks and uncertainties include factors related to the following: (a) the countries where we operate, especially Brazil and Canada; (b) the global economy; (c) the capital markets; (d) the mining and metals prices and their dependence on global industrial production, which is cyclical by nature; and (e) global competition in the markets in which Vale operates. To obtain further information on factors that may lead to results different from those forecast by Vale, please consult the reports Vale files with the U.S. Securities and Exchange Commission (SEC), the Brazilian Comissão de Valores Mobiliários (CVM) and the French Autorité des Marchés Financiers (AMF, and in particular the factors discussed under “Forward-Looking Statements” and “Risk Factors” in Vale’s annual report on Form 20-F.
ANNEX 1 — SIMPLIFIED FINANCIAL STATEMENTS
Income statement
|
US$ million |
|
2Q16 |
|
1Q16 |
|
2Q15 |
|
|
Net operating revenue |
|
6,626 |
|
5,719 |
|
6,965 |
|
|
Cost of goods sold |
|
(4,795 |
) |
(4,249 |
) |
(5,186 |
) |
|
Gross profit |
|
1,831 |
|
1,470 |
|
1,779 |
|
|
Gross margin (%) |
|
27.6 |
|
25.7 |
|
25.5 |
|
|
Selling, general and administrative expenses |
|
(140 |
) |
(119 |
) |
(159 |
) |
|
Research and development expenses |
|
(78 |
) |
(60 |
) |
(118 |
) |
|
Pre-operating and stoppage expenses |
|
(114 |
) |
(102 |
) |
(259 |
) |
|
Other operational expenses |
|
(160 |
) |
(35 |
) |
(203 |
) |
|
Gain (loss) from sale of assets |
|
(66 |
) |
— |
|
(55 |
) |
|
Operating profit |
|
1,273 |
|
1,154 |
|
985 |
|
|
Financial revenues |
|
34 |
|
60 |
|
30 |
|
|
Financial expenses |
|
(611 |
) |
(630 |
) |
(215 |
) |
|
Gains (losses) on derivatives, net |
|
759 |
|
440 |
|
235 |
|
|
Monetary and exchange variation |
|
1,909 |
|
1,555 |
|
482 |
|
|
Equity income |
|
190 |
|
156 |
|
218 |
|
|
Other results on sale or write-off of investments from associates and joint ventures |
|
(1,113 |
) |
— |
|
79 |
|
|
Income (loss) before taxes |
|
2,441 |
|
2,735 |
|
1,814 |
|
|
Current tax |
|
(413 |
) |
(345 |
) |
(67 |
) |
|
Deferred tax |
|
(907 |
) |
(610 |
) |
(118 |
) |
|
Net Earnings (loss) from continuing operations |
|
1,121 |
|
1,780 |
|
1,629 |
|
|
Loss attributable to noncontrolling interest |
|
(15 |
) |
(4 |
) |
46 |
|
|
Net earnings (attributable to the Company’s stockholders) |
|
1,106 |
|
1,776 |
|
1,675 |
|
|
Earnings (loss) per share (attributable to the Company’s stockholders - US$) |
|
0.21 |
|
0.34 |
|
0.33 |
|
|
Diluted earnings (loss) per share (attributable to the Company’s stockholders - US$) |
|
0.21 |
|
0.34 |
|
0.33 |
|
Equity income (loss) by business segment
|
US$ million |
|
2Q16 |
|
% |
|
1Q16 |
|
% |
|
2Q15 |
|
% |
|
|
Ferrous minerals |
|
37 |
|
19.5 |
|
39 |
|
25.0 |
|
189 |
|
86.7 |
|
|
Coal |
|
— |
|
— |
|
(10 |
) |
(6.4 |
) |
3 |
|
1.4 |
|
|
Fertilizers |
|
1 |
|
0.5 |
|
1 |
|
0.6 |
|
2 |
|
0.9 |
|
|
Base metals |
|
— |
|
— |
|
(2 |
) |
(1.3 |
) |
(18 |
) |
(8.3 |
) |
|
Steel |
|
121 |
|
63.7 |
|
111 |
|
71.2 |
|
14 |
|
6.4 |
|
|
Others |
|
31 |
|
16.3 |
|
17 |
|
10.9 |
|
28 |
|
12.8 |
|
|
Total |
|
190 |
|
100.0 |
|
156 |
|
100.00 |
|
218 |
|
100.00 |
|
Balance sheet
|
US$ million |
|
6/30/2016 |
|
3/31/2016 |
|
6/30/2015 |
|
|
Assets |
|
|
|
|
|
|
|
|
Current assets |
|
18,274 |
|
17,225 |
|
18,067 |
|
|
Cash and cash equivalents |
|
4,168 |
|
3,782 |
|
3,158 |
|
|
Financial investments |
|
138 |
|
27 |
|
106 |
|
|
Derivative financial instruments |
|
136 |
|
141 |
|
244 |
|
|
Accounts receivable |
|
2,452 |
|
2,553 |
|
2,788 |
|
|
Related parties |
|
68 |
|
100 |
|
392 |
|
|
Inventories |
|
3,866 |
|
3,801 |
|
4,429 |
|
|
Prepaid income taxes |
|
299 |
|
625 |
|
1,147 |
|
|
Recoverable taxes |
|
1,781 |
|
1,523 |
|
1,554 |
|
|
Others |
|
708 |
|
582 |
|
642 |
|
|
Non-current assets held for sale and discontinued operation |
|
4,658 |
|
4,091 |
|
3,607 |
|
|
Non-current assets |
|
10,861 |
|
10,707 |
|
7,456 |
|
|
Related parties |
|
3 |
|
— |
|
21 |
|
|
Loans and financing agreements receivable |
|
179 |
|
194 |
|
220 |
|
|
Judicial deposits |
|
1,090 |
|
984 |
|
1,063 |
|
|
Recoverable income taxes |
|
513 |
|
517 |
|
422 |
|
|
Deferred income taxes |
|
7,289 |
|
7,675 |
|
4,300 |
|
|
Recoverable taxes |
|
619 |
|
544 |
|
669 |
|
|
Derivative financial instruments |
|
497 |
|
170 |
|
25 |
|
|
Others |
|
671 |
|
623 |
|
736 |
|
|
Fixed assets |
|
71,835 |
|
67,340 |
|
81,825 |
|
|
Total assets |
|
100,970 |
|
95,272 |
|
107,348 |
|
|
Liabilities |
|
|
|
|
|
|
|
|
Current liabilities |
|
11,546 |
|
11,399 |
|
10,359 |
|
|
Suppliers and contractors |
|
3,891 |
|
3,147 |
|
3,832 |
|
|
Payroll and related charges |
|
493 |
|
413 |
|
526 |
|
|
Derivative financial instruments |
|
1,010 |
|
1,629 |
|
837 |
|
|
Loans and financing |
|
3,153 |
|
3,255 |
|
3,190 |
|
|
Related parties |
|
600 |
|
732 |
|
194 |
|
|
Income taxes settlement program |
|
442 |
|
389 |
|
411 |
|
|
Taxes payable and royalties |
|
262 |
|
223 |
|
391 |
|
|
Provision for income taxes |
|
120 |
|
167 |
|
178 |
|
|
Employee postretirement obligations |
|
77 |
|
71 |
|
77 |
|
|
Asset retirement obligations |
|
81 |
|
88 |
|
114 |
|
|
Redeemable noncontrolling interest |
|
— |
|
— |
|
140 |
|
|
Other results on sale or write-off of investments from associates and joint ventures |
|
289 |
|
— |
|
— |
|
|
Others |
|
1,048 |
|
1,191 |
|
315 |
|
|
Liabilities directly associated with non-current assets held for sale and discontinued operations |
|
80 |
|
94 |
|
154 |
|
|
Non-current liabilities |
|
47,941 |
|
45,101 |
|
47,118 |
|
|
Derivative financial instruments |
|
1,201 |
|
1,225 |
|
2,285 |
|
|
Loans and financing |
|
28,661 |
|
28,215 |
|
26,583 |
|
|
Related parties |
|
144 |
|
123 |
|
94 |
|
|
Employee postretirement obligations |
|
2,150 |
|
1,957 |
|
2,061 |
|
|
Provisions for litigation |
|
924 |
|
851 |
|
1,147 |
|
|
Income taxes settlement program |
|
5,013 |
|
4,502 |
|
5,071 |
|
|
Deferred income taxes |
|
1,739 |
|
1,817 |
|
3,089 |
|
|
Asset retirement obligations |
|
2,759 |
|
2,622 |
|
3,033 |
|
|
Participative stockholders’ debentures |
|
617 |
|
502 |
|
852 |
|
|
Gold stream transaction |
|
1,666 |
|
1,715 |
|
1,806 |
|
|
Other results on sale or write-off of investments from associates and joint ventures |
|
874 |
|
— |
|
— |
|
|
Others |
|
2,193 |
|
1,572 |
|
1,097 |
|
|
Total liabilities |
|
59,487 |
|
56,500 |
|
57,477 |
|
|
Stockholders’ equity |
|
41,483 |
|
38,772 |
|
49,871 |
|
|
Total liabilities and stockholders’ equity |
|
100,970 |
|
95,272 |
|
107,348 |
|
Cash flow
|
US$ million |
|
2Q16 |
|
1Q16 |
|
2Q15 |
|
|
Cash flows from operating activities: |
|
|
|
|
|
|
|
|
Net income (loss) before taxes on income |
|
2,441 |
|
2,735 |
|
1,814 |
|
|
Adjustments to reconcile |
|
|
|
|
|
|
|
|
Depreciation, depletion and amortization |
|
927 |
|
850 |
|
988 |
|
|
Equity Income |
|
(190 |
) |
(156 |
) |
(218 |
) |
|
Other items from non-current assets |
|
1,209 |
|
9 |
|
(39 |
) |
|
Items of the financial result |
|
(2,091 |
) |
(1,425 |
) |
(532 |
) |
|
Variation of assets and liabilities |
|
|
|
|
|
|
|
|
Accounts receivable |
|
108 |
|
(1,016 |
) |
(474 |
) |
|
Inventories |
|
78 |
|
(62 |
) |
(89 |
) |
|
Suppliers and contractors |
|
364 |
|
(383 |
) |
214 |
|
|
Payroll and related charges |
|
45 |
|
— |
|
(10 |
) |
|
Tax assets and liabilities, net |
|
(4 |
) |
(47 |
) |
(379 |
) |
|
Others |
|
228 |
|
191 |
|
305 |
|
|
Net cash provided by operations |
|
3,115 |
|
696 |
|
1,580 |
|
|
Interest on loans and financing |
|
(362 |
) |
(460 |
) |
(305 |
) |
|
Derivatives received (paid), net |
|
(353 |
) |
(510 |
) |
(102 |
) |
|
Remuneration paid to debentures |
|
(37 |
) |
— |
|
— |
|
|
Income taxes |
|
(113 |
) |
(146 |
) |
(74 |
) |
|
Income taxes - settlement program |
|
(100 |
) |
(88 |
) |
(103 |
) |
|
Net cash provided by operating activities |
|
2,150 |
|
(508 |
) |
996 |
|
|
Cash flows from investing activities: |
|
|
|
|
|
|
|
|
Additions to investments |
|
(136 |
) |
(90 |
) |
(36 |
) |
|
Acquisition of subsidiary |
|
— |
|
5 |
|
— |
|
|
Additions to property, plant and equipment |
|
(1,232 |
) |
(1,366 |
) |
(2,111 |
) |
|
Proceeds from disposal of assets and investments |
|
12 |
|
12 |
|
454 |
|
|
Dividends and interest on capital received from joint ventures and associates |
|
117 |
|
1 |
|
185 |
|
|
Others |
|
(126 |
) |
48 |
|
72 |
|
|
Net cash used in investing activities |
|
(1,365 |
) |
(1,390 |
) |
(1,436 |
) |
|
Cash flows from financing activities: |
|
|
|
|
|
|
|
|
Loans and financing |
|
|
|
|
|
|
|
|
Additions |
|
1,433 |
|
3,200 |
|
1,542 |
|
|
Repayments |
|
(1,808 |
) |
(1,158 |
) |
(585 |
) |
|
Payments to shareholders: |
|
|
|
|
|
|
|
|
Dividends and interest on capital attributed to shareholders |
|
— |
|
— |
|
(1,000 |
) |
|
Dividends and interest on capital attributed to noncontrolling interest |
|
(71 |
) |
(4 |
) |
(9 |
) |
|
Other transactions with noncontrolling interest |
|
— |
|
(17 |
) |
(40 |
) |
|
Net cash provided by (used in) financing activities |
|
(446 |
) |
2,021 |
|
(92 |
) |
|
Increase (decrease) in cash and cash equivalents |
|
339 |
|
123 |
|
(532 |
) |
|
Cash and cash equivalents in the beginning of the period |
|
3,782 |
|
3,591 |
|
3,684 |
|
|
Effect of exchange rate changes on cash and cash equivalents |
|
47 |
|
68 |
|
6 |
|
|
Cash and cash equivalents, end of period |
|
4,168 |
|
3,782 |
|
3,158 |
|
|
|
|
|
|
|
|
|
|
|
Non-cash transactions: |
|
|
|
|
|
|
|
|
Additions to property, plant and equipment - interest capitalization |
|
213 |
|
177 |
|
177 |
|
ANNEX 2 — VOLUMES SOLD, PRICES AND MARGINS
Volume sold - Minerals and metals
|
‘000 metric tons |
|
2Q16 |
|
1Q16 |
|
2Q15 |
|
|
Iron ore fines |
|
72,678 |
|
62,744 |
|
67,230 |
|
|
ROM |
|
405 |
|
520 |
|
4,181 |
|
|
Pellets |
|
11,388 |
|
11,130 |
|
12,231 |
|
|
Manganese ore |
|
354 |
|
515 |
|
385 |
|
|
Ferroalloys |
|
36 |
|
25 |
|
23 |
|
|
Thermal coal |
|
1,767 |
|
1,299 |
|
165 |
|
|
Metallurgical coal |
|
1,001 |
|
1,367 |
|
1,552 |
|
|
Nickel |
|
77 |
|
74 |
|
67 |
|
|
Copper |
|
107 |
|
101 |
|
97 |
|
|
Gold (‘000 oz) |
|
122 |
|
115 |
|
109 |
|
|
Silver (‘000 oz) |
|
619 |
|
623 |
|
405 |
|
|
PGMs (‘000 oz) |
|
151 |
|
153 |
|
149 |
|
|
Cobalt (metric ton) |
|
1,000 |
|
1,178 |
|
930 |
|
|
Potash |
|
103 |
|
104 |
|
102 |
|
|
Phosphates |
|
|
|
|
|
|
|
|
MAP |
|
210 |
|
259 |
|
207 |
|
|
TSP |
|
201 |
|
92 |
|
230 |
|
|
SSP |
|
512 |
|
262 |
|
523 |
|
|
DCP |
|
128 |
|
109 |
|
98 |
|
|
Phosphate rock |
|
734 |
|
690 |
|
881 |
|
|
Others phosphates |
|
95 |
|
46 |
|
104 |
|
|
Nitrogen |
|
145 |
|
146 |
|
150 |
|
Average prices
|
US$/ton |
|
2Q16 |
|
1Q16 |
|
2Q15 |
|
|
Iron ore fines CFR reference price (dmt) |
|
56.30 |
|
54.67 |
|
61.50 |
|
|
Iron ore fines CFR/FOB realized price |
|
48.30 |
|
46.50 |
|
50.44 |
|
|
ROM |
|
12.35 |
|
8.02 |
|
7.89 |
|
|
Pellets CFR/FOB (wmt) |
|
76.20 |
|
67.65 |
|
79.47 |
|
|
Manganese ore |
|
103.13 |
|
60.56 |
|
82.24 |
|
|
Ferroalloys |
|
690.36 |
|
648.96 |
|
951.61 |
|
|
Thermal coal |
|
38.38 |
|
38.57 |
|
54.55 |
|
|
Metallurgical coal |
|
77.48 |
|
75.93 |
|
88.27 |
|
|
Nickel |
|
9,180.00 |
|
8,787.00 |
|
13,044.78 |
|
|
Copper |
|
4,144.00 |
|
4,323.00 |
|
4,978.97 |
|
|
Platinum (US$/oz) |
|
908.64 |
|
898.41 |
|
1,109.16 |
|
|
Gold (US$/oz) |
|
1,265.93 |
|
1,131.60 |
|
1,174.49 |
|
|
Silver (US$/oz) |
|
16.66 |
|
14.14 |
|
14.79 |
|
|
Cobalt (US$/lb) |
|
10.41 |
|
8.61 |
|
— |
|
|
Potash |
|
208.45 |
|
223.36 |
|
302.59 |
|
|
Phosphates |
|
|
|
|
|
|
|
|
MAP |
|
384.83 |
|
391.88 |
|
521.14 |
|
|
TSP |
|
306.67 |
|
305.48 |
|
380.57 |
|
|
SSP |
|
186.97 |
|
170.82 |
|
202.19 |
|
|
DCP |
|
475.73 |
|
465.54 |
|
533.29 |
|
|
Phosphate rock |
|
70.94 |
|
83.06 |
|
80.55 |
|
Operating margin by segment (EBIT adjusted margin)
|
% |
|
2Q16 |
|
1Q16 |
|
2Q15 |
|
|
Ferrous minerals |
|
37.3 |
|
36.6 |
|
26.7 |
|
|
Coal |
|
(86.2 |
) |
(75.3 |
) |
(102.7 |
) |
|
Base metals |
|
(4.4 |
) |
(5.8 |
) |
(2.6 |
) |
|
Fertilizer nutrients |
|
(12.7 |
) |
0.8 |
|
15.1 |
|
|
Total(1) |
|
20.2 |
|
20.2 |
|
14.9 |
|
(1) Excluding non-recurring effects
Annex 3 — reconciliation of IFRS and “NON-GAAP” information
(a) Adjusted EBIT(1)
|
US$ million |
|
2Q16 |
|
1Q16 |
|
2Q15 |
|
|
Net operating revenues |
|
6,626 |
|
5,719 |
|
6,965 |
|
|
COGS |
|
(4,795 |
) |
(4,249 |
) |
(5,186 |
) |
|
SG&A |
|
(140 |
) |
(119 |
) |
(159 |
) |
|
Research and development |
|
(78 |
) |
(60 |
) |
(118 |
) |
|
Pre-operating and stoppage expenses |
|
(114 |
) |
(102 |
) |
(259 |
) |
|
Other operational expenses |
|
(160 |
) |
(35 |
) |
(203 |
) |
|
Adjusted EBIT |
|
1,339 |
|
1,154 |
|
1,040 |
|
(1) Excluding non-recurring effects.
(b) Adjusted EBITDA
EBITDA defines profit or loss before interest, tax, depreciation and amortization. Vale uses the term adjusted EBITDA to reflect exclusion of gains and/or losses on sale of assets, non-recurring expenses and the inclusion of dividends received from non-consolidated affiliates. However our adjusted EBITDA is not the measure defined as EBITDA under IFRS, and may possibly not be comparable with indicators with the same name reported by other companies. Adjusted EBITDA should not be considered as a substitute for operational profit or as a better measure of liquidity than operational cash flow, which are calculated in accordance with IFRS. Vale provides its adjusted EBITDA to give additional information about its capacity to pay debt, carry out investments and cover working capital needs. The following table shows the reconciliation between adjusted EBITDA and operational cash flow, in accordance with its statement of changes in financial position:
Reconciliation between adjusted EBITDA and operational cash flow
|
US$ million |
|
2Q16 |
|
1Q16 |
|
2Q15 |
|
|
Adjusted EBITDA |
|
2,383 |
|
2,005 |
|
2,213 |
|
|
Working capital: |
|
|
|
|
|
|
|
|
Accounts receivable |
|
108 |
|
(532 |
) |
(474 |
) |
|
Inventories |
|
78 |
|
(62 |
) |
(89 |
) |
|
Suppliers |
|
364 |
|
(383 |
) |
214 |
|
|
Payroll and related charges |
|
45 |
|
— |
|
(10 |
) |
|
Others |
|
224 |
|
12 |
|
(145 |
) |
|
Adjustment for non-recurring items and other effects |
|
(87 |
) |
696 |
|
1,580 |
|
|
Cash provided from operations |
|
3,115 |
|
696 |
|
1,580 |
|
|
Income taxes paid - current |
|
(362 |
) |
(146 |
) |
(74 |
) |
|
Income taxes paid - settlement program |
|
(353 |
) |
(88 |
) |
(103 |
) |
|
Interest paid for third parties |
|
(37 |
) |
(460 |
) |
(305 |
) |
|
Participative stockholders’ debentures paid |
|
(113 |
) |
— |
|
— |
|
|
Derivatives received (paid), net |
|
(100 |
) |
(510 |
) |
(102 |
) |
|
Net cash provided by (used in) operating activities |
|
2,150 |
|
(508 |
) |
996 |
|
(c) Net debt
|
US$ million |
|
2Q16 |
|
1Q16 |
|
2Q15 |
|
|
Total debt |
|
31,814 |
|
31,470 |
|
29,773 |
|
|
Cash and cash equivalents(1) |
|
4,306 |
|
3,809 |
|
3,264 |
|
|
Net debt |
|
27,508 |
|
27,661 |
|
26,509 |
|
(1) Including financial investments
(d) Total debt / LTM Adjusted EBITDA
|
US$ million |
|
2Q16 |
|
1Q16 |
|
2Q15 |
|
|
Total debt / LTM Adjusted EBITDA (x) |
|
4.2 |
|
4.2 |
|
3.3 |
|
|
Total debt / LTM operational cash flow (x) |
|
6.9 |
|
9.1 |
|
16.4 |
|
(e) LTM Adjusted EBITDA / LTM interest payments
|
US$ million |
|
2Q16 |
|
1Q16 |
|
2Q15 |
|
|
LTM adjusted EBITDA / LTM interest payments (x) |
|
5.1 |
|
5.2 |
|
5.9 |
|
|
LTM operational profit / LTM interest payments (x) |
|
(3.7 |
) |
(4.1 |
) |
2.5 |
|
Pursuant to the requirements of the Securities Exchange Act of 1934, the registrant has duly caused this report to be signed on its behalf by the undersigned, thereunto duly authorized.
|
|
|
Vale S.A. |
|
|
|
(Registrant) |
|
|
|
|
|
|
By: |
/s/ André Figueiredo |
|
Date: July 28, 2016 |
|
Director of Investor Relations |
Serious News for Serious Traders! Try StreetInsider.com Premium Free!
You May Also Be Interested In
- BMO Capital Reiterates Outperform Rating on Vale S.A. (VALE3:BZ) (VALE)
- ZEN IN THE CITY: PENTHOUSE AT I.M. PEI & PEI PARTNERSHIP ARCHITECTS CONDO MARRIES EAST AND WEST
- Dependable Refrigeration & Appliance Repair Service Offers Expert Appliance Repairs At-Home with Transparent Pricing in Oro Valley, AZ
Create E-mail Alert Related Categories
SEC FilingsSign up for StreetInsider Free!
Receive full access to all new and archived articles, unlimited portfolio tracking, e-mail alerts, custom newswires and RSS feeds - and more!
