

Form 6-K Vale S.A. For: Apr 30
 Tweet
Tweet Share
Share
United States
Securities and Exchange Commission
Washington, D.C. 20549
FORM 6-K
Report of Foreign Private Issuer
Pursuant to Rule 13a-16 or 15d-16
of the
Securities Exchange Act of 1934
For the month of
April 2015
Vale S.A.
Avenida Graça Aranha, No. 26
20030-900 Rio de Janeiro, RJ, Brazil
(Address of principal executive office)
(Indicate by check mark whether the registrant files or will file annual reports under cover of Form 20-F or Form 40-F.)
(Check One) Form 20-F X Form 40-F
(Indicate by check mark if the registrant is submitting the Form 6-K in paper as permitted by Regulation S-T Rule 101(b)(1))
(Check One) Yes No X
(Indicate by check mark if the registrant is submitting the Form 6-K in paper as permitted by Regulation S-T Rule 101(b)(7))
(Check One) Yes No X
(Indicate by check mark whether the registrant by furnishing the information contained in this Form is also thereby furnishing information to the Commission pursuant to Rule 12g3-2(b) under the Securities Exchange Act of 1934.)
(Check One) Yes No X
(If “Yes” is marked, indicate below the file number assigned to the registrant in connection with Rule 12g3-2(b). 82- .)
|
|
1 IFRS 1Q15 VALE’S PERFORMANCE IN 1Q15 STABLE DEBT ON LOWER COSTS AND TIGHT CAPITAL AND PORTFOLIO MANAGEMENT Rio de Janeiro, April 30, 2015 – Vale S.A. (Vale) reached iron ore production of 74.5 Mt in 1Q15, the highest output for a first quarter in Vale’s history. Carajás production reached 27.5 Mt, a new record for a first quarter. Production of nickel reached 69,200 t in 1Q15, the best performance for a first quarter while copper and gold output reached 107,200 t and 103,000 oz, respectively, marking another production record for Vale. Gross revenues reached US$ 6.358 billion in 1Q15, decreasing US$ 2.868 billion vs. 4Q14. Seasonally lower sales volumes caused revenues to decrease by US$ 1.307 billion and lower commodities prices caused revenues to decrease by US$ 1.561 billion. Revenues were negatively impacted by an adjustment of US$ 160 million related to the 4Q14 provisional iron ore prices and by the provisional pricing of 45% of the 1Q15 iron ore sales at US$ 51.4/t, against an average IODEX of US$ 62.4/t for the period. Costs and expenses, net of depreciation charges, decreased by US$ 2.195 billion1 in 1Q15 vs. 4Q14 and by US$ 561 million in 1Q15 vs. 1Q14. Costs2 were reduced by US$ 1.513 billion and US$ 392 million when compared to 4Q14 and 1Q14, respectively. SG&A2 decreased by US$ 73 million (30.7%), R&D decreased by US$ 26 million (17.9%) and preoperating and stoppage expenses3 decreased by US$ 38 million (18.3%) in 1Q15 vs. 1Q14. Iron ore FOB cash costs reached US$ 19.8/t (US$ 18.3/t ex-royalties) as a result of the cost reduction initiatives. Adjusted EBITDA was US$ 1.602 billion4, 26.7% lower than in 4Q14 mainly as a result of lower prices and seasonally lower volumes which had a negative impact on EBITDA of US$ 1.524 billion and US$ 480 million, respectively. EBITDA was positively impacted by US$ 230 million from the goldstream transaction but negatively impacted by the: (i) US$ 160 million price adjustments resulting from the provisional iron ore prices recorded in 4Q14; (ii) US$ 288 million lower revenues resulting from the of 45% of the 1Q15 iron ore sales recorded at a provisional price of US$ 51.4/t, against the average IODEX of US$ 62.4/t for the quarter; (iii) US$ 84 million resulting from the settlement of bunker oil hedge transactions recorded under hedge account that directly impacted freight costs. Capital expenditures amounted to US$ 2.210 billion in 1Q15, equivalent to a decrease of US$ 377 million when compared to 1Q14. Vale’s investments in project execution totaled US$ 1.516 billion, representing a decrease of US$ 318 million in 1Q15 vs. 1Q14 while disbursements for sustaining capex totaled US$ 694 million, representing a decrease of US$ 59 million in 1Q15 vs. 1Q14. Capital expenditures measured on an accrual basis amounted to US$ 1.910 billion (US$ 300 million lower), better indicating the capex trend for the coming quarters. Divestments and partnerships accounted for US$ 1.017 billion5 in cash proceeds in 1Q15, with US$ 900 million received as a result of the sale of an additional 25% of the gold byproduct stream from the Salobo copper mine for the life of the mine and US$ 97 million received as a result of the sale of 49% of our stake in the hydroelectric plant of Belo Monte. 1 Amount is net of depreciation. Reduction calculated after adjusting for the US$ 230 million one-off positive impact from the goldstream transaction in 1Q15 and the insurance payment of US$ 116 million received in 4Q14. 2 Net of depreciation. 3 Net of depreciation. 4 Including US$ 230 million of the goldstream transaction. 5 Including the US$ 532 million accounted for as “deferred revenues”. BM&F BOVESPA: VALE3, VALE5 NYSE: VALE, VALE.P HKEx: 6210, 6230 EURONEXT PARIS: VALE3, VALE5 LATIBEX: XVALO, XVALP www.vale.com [email protected] Investor Relations Department Rogério T. Nogueira André Figueiredo Carla Albano Miller Fernando Mascarenhas Andrea Gutman Bruno Siqueira Claudia Rodrigues Marcio Loures Penna Mariano Szachtman Tel: (55 21) 3814-4540 |

|
|
2 IFRS 1Q15 Net loss was US$ 3.118 billion in 1Q15, mainly driven by the non-cash impact stemming from the 20.8% quarter-on-quarter depreciation of the Brazilian Real (BRL) against the US dollar (USD), from 2.66 to 3.21 BRL / USD. This quarter-on-quarter depreciation caused a US$ 3.019 billion loss on the net of the US$ 21.474 billion6 of USD denominated debt and USD denominated assets and a US$ 1.263 billion loss on the US$ 7.600 billion of debt and future interest obligations swapped into US Dollars through forward and swap derivatives. Conversely, the average depreciation of the BRL, from 2.54 to 2.87 BRL / USD, which positively impacted cash flows, was only 12.8%. Gross debt decreased by US$ 320 million from the debt position on December 31st, 2014, reaching US$ 28.487 billion on March 31st, 2015, supported by divestitures of US$ 1.017 billion. Net debt totaled US$ 24.802 billion with a cash position of US$ 3.685 billion prior to the distribution of US$ 1 billion in dividends scheduled to be paid on April 30th, 2015. Average debt maturity was 8.7 years with an average cost of debt of 4.46% per annum. The ferrous minerals business EBITDA was impacted by lower commodity prices and price adjustments but iron ore cash costs and freight cost have reduced significantly • Adjusted EBITDA for ferrous minerals reached US$ 1.027 billion in 1Q15, representing a decrease of US$ 675 million from the US$ 1.702 billion recorded in 4Q14, mainly as a result of a US$ 1.071 billion reduction in sales prices. • Realized prices for iron ore fines (ex-ROM) decreased from US$ 61.6/t in 4Q14 to US$ 46.0/t in 1Q15, negatively impacted by a US$ 2.8/t adjustment on prices provisioned at the end of 4Q14 (US$ 160 million deducted from revenues) and by a US$ 4.9/t impact on prices driven by the difference between the average Platt's IODEX 62% CFR China of US$ 62.4/t in 1Q15 and the US$ 51.4/t provisionally priced for 45% of our sales by the end of 1Q15 (US$ 288 million lower revenues). • Cash costs for iron ore fines decreased to US$ 19.87/t (US$ 18.3/t ex-royalties) vs. US$ 23.2 /t in 4Q14, mainly as a result of the average quarter-on-quarter depreciation of the Brazilian Real of 12.8% from 2.54 to 2.87 BRL / USD and of cost reductions initiatives. • Unit freight cost for iron ore was US$ 17.28/t in 1Q15 vs. US$ 21.7/t in 4Q14, mainly as a result of the positive impact of lower bunker oil prices in our medium and long term chartering contracts and of lower spot freight costs. • Expenses for iron ore fines9, including SG&A, R&D and pre-operating and stoppage expenses, reduced by US$ 5.2/t from US$ 9.2/t in 4Q14 to US$ 4.0/t in 1Q15. • Total costs and expenses9 for iron ore fines, including freight costs8, decreased by US$ 13.1/t in 1Q15 vs. 4Q14 whilst After adjusting for the effects of lower volumes (-US$ 577 million) and exchange rates (-US$ 242 million) total costs and expenses of iron ore fines decreased by US$ 349 million (US$ 6.1/t) in 1Q15 vs. 4Q14.Sustaining capex decreased by US$ 4.5/t in quarter vs. 4Q14. The base metals business EBITDA was impacted by lower prices but costs and expenses were further reduced • Adjusted EBITDA reached US$ 678 million in 1Q1510, an increase of US$ 96 million from the US$ 582 million in 4Q14, positively impacted by the goldstream transaction (US$ 230 million) and by lower costs (US$ 134 million) while partially offset by the effect of lower prices (US$ 242 million). • Sales revenues totaled US$ 1.710 billion, US$ 238 million lower than in 4Q14 due to lower sales prices. • Costs11 decreased by US$ 134 million and expenses12 by US$ 91 million in 1Q15, representing a costs and expenses reduction of US$ 225 million vs. 4Q14. 6 Composed of USD denominated debt of US$ 21.415 billion plus interest. 7 Excluding ROM and iron ore acquired from third parties. 8 Excluding the US$ 2.3/t impact from the bunker oil hedge in 1Q15. 9 Net of depreciation. 10 Including US$ 230 million of the goldstream transaction. 11 Net of depreciation. |
|
|
3 IFRS 1Q15 • Salobo’s EBITDA reached a record US$ 100 million for a quarter despite lower than planned production volumes for 1Q15. The coal and fertilizers businesses EBITDA were positively impacted by expense reductions despite the lower prices and volumes • Adjusted EBITDA for coal was negative US$ 128 million in 1Q15 against a negative US$ 204 million in 4Q14, despite the lower coal prices and lower volumes mainly as a result of further reductions in expenses. • Moatize II reached 86% of physical progress in 1Q15 with a capital expenditure of US$ 117 million in the quarter. • The Nacala Corridor reached 99% of physical progress in its greenfield sections while the Nacala Port reached 97% • Adjusted EBITDA for the fertilizer business increased to US$ 90 million in 1Q15 from US$ 75 million in 4Q14, despite lower prices (US$ 16 million) and lower volumes (US$ 20 million), mainly as a result of lower expenses (US$ 32 million). 2015 will be a year for laying the foundations of an even more competitive and profitable company as we intensify and consolidate our cost cutting efforts, deliver productivity improvements, grow our production volumes and increase the quality of our products with the completion of several projects and the operation of the N4WS mine. Meanwhile, we remain confident that we will be able to keep absolute debt levels stable through the successful execution of our divestment program and further capital discipline. 12 After adjusting for the US$ 230 million one-off effect of the goldstream transaction in 1Q15 and the insurance payment of US$ 116 million received in 4Q14. |
|
|
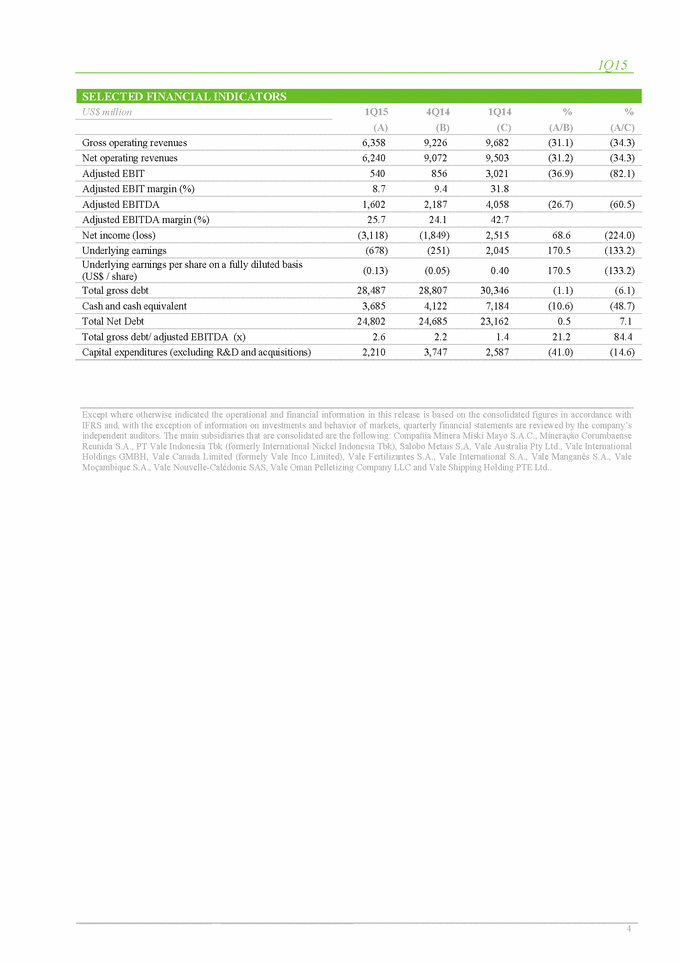
1Q15 4 SELECTED FINANCIAL INDICATORS US$ million 1Q15 4Q14 1Q14 % % (A) (B) (C) (A/B) (A/C) Gross operating revenues 6,358 9,226 9,682 (31.1) (34.3) Net operating revenues 6,240 9,072 9,503 (31.2) (34.3) Adjusted EBIT 540 856 3,021 (36.9) (82.1) Adjusted EBIT margin (%) 8.7 9.4 31.8 Adjusted EBITDA 1,602 2,187 4,058 (26.7) (60.5) Adjusted EBITDA margin (%) 25.7 24.1 42.7 Net income (loss) (3,118) (1,849) 2,515 68.6 (224.0) Underlying earnings (678) (251) 2,045 170.5 (133.2) Underlying earnings per share on a fully diluted basis (US$ / share) (0.13) (0.05) 0.40 170.5 (133.2) Total gross debt 28,487 28,807 30,346 (1.1) (6.1) Cash and cash equivalent 3,685 4,122 7,184 (10.6) (48.7) Total Net Debt 24,802 24,685 23,162 0.5 7.1 Total gross debt/ adjusted EBITDA (x) 2.6 2.2 1.4 21.2 84.4 Capital expenditures (excluding R&D and acquisitions) 2,210 3,747 2,587 (41.0) (14.6) Except where otherwise indicated the operational and financial information in this release is based on the consolidated figures in accordance with IFRS and, with the exception of information on investments and behavior of markets, quarterly financial statements are reviewed by the company’s independent auditors. The main subsidiaries that are consolidated are the following: Compañia Minera Miski Mayo S.A.C., Mineração Corumbaense Reunida S.A., PT Vale Indonesia Tbk (formerly International Nickel Indonesia Tbk), Salobo Metais S.A, Vale Australia Pty Ltd., Vale International Holdings GMBH, Vale Canada Limited (formely Vale Inco Limited), Vale Fertilizantes S.A., Vale International S.A., Vale Manganês S.A., Vale Moçambique S.A., Vale Nouvelle-Calédonie SAS, Vale Oman Pelletizing Company LLC and Vale Shipping Holding PTE Ltd |
|
|
1Q15 5 OPERATING REVENUES Gross operating revenues in 1Q15 were US$ 6.358 billion, 31.1% lower than in 4Q14. The decrease in sales revenues was mainly due to lower prices of iron ore fines (US$ 924 million) and pellets (US$ 161 million) and lower volumes of iron ore fines (US$ 935 million) and pellets (US$ 148 million). Lower prices of base metals also contributed to the decrease in sales revenues by US$ 237 million. The ferrous minerals business segment accounted for 62.1% of our gross operating revenues in 1Q15, compared to 67.3% in 4Q14. The decrease was mainly driven by the lower iron ore and pellets sales prices and volumes. The base metals business segment increased its share in gross revenues to 26.9% in 1Q15 from 21.1% in 4Q14 while fertilizers increased its share to 8.1% in 1Q15 from 6.6% in 4Q14 and coal maintained its share at the same level of 2.3%. Sales to Asia represented 47.4% of total gross revenues in 1Q15, decreasing from the 52.0% share of sales revenues recorded in 4Q14. Sales to the Americas represented 29.0% of total sales, while sales to Europe represented 17.7% and sales to the Middle East 4.5%. Sales to China represented 27.9% of total gross revenues in 1Q15, while Brazil represented 18.5%, Japan 9.2%, Germany 5.8%, Canada 4.8%, United States 4.0% and South Korea 3.9%. GROSS OPERATING REVENUE BY DESTINATION US$ million 1Q15 % 4Q14 % 1Q14 % North America 566 8.9 642 7.0 740 7.6 USA 257 4.0 278 3.0 388 4.0 Canada 305 4.8 361 3.9 348 3.6 Mexico 4 0.1 3 - 4 - South America 1,280 20.1 1,769 19.2 1,797 18.6 Brazil 1,175 18.5 1,645 17.8 1,588 16.4 Others 106 1.7 124 1.3 209 2.2 Asia 3,013 47.4 4,798 52.0 4,853 50.1 China 1,776 27.9 3,091 33.5 3,213 33.2 Japan 582 9.2 848 9.2 880 9.1 South Korea 249 3.9 300 3.3 436 4.5 Others 406 6.4 559 6.1 324 3.4 Europe 1,127 17.7 1,556 16.9 1,808 18.7 Germany 368 5.8 442 4.8 587 6.1 Italy 130 2.1 130 1.4 294 3.0 Others 629 9.9 985 10.7 927 9.6 Middle East 286 4.5 288 3.1 338 3.5 Rest of the World 86 1.4 173 1.9 146 1.5 Total 6,358 100.0 9,226 100.0 9,682 100.0 |

|
|
1Q15 6 GROSS OPERATING REVENUE BY BUSINESS AREAS US$ million 1Q15 % 4Q14 % 1Q14 % Ferrous minerals 3,947 62.1 6,213 67.3 6,939 71.7 Iron ore fines 2,734 43.0 4,593 49.8 5,168 53.4 ROM 32 0.5 42 0.5 68 0.7 Pellets 999 15.7 1,308 14.2 1,471 15.2 Manganese ore 41 0.6 92 1.0 21 0.2 Ferroalloys 39 0.6 51 0.6 61 0.6 Others 102 1.6 127 1.4 150 1.5 Coal 145 2.3 201 2.2 137 1.4 Metallurgical coal 129 2.0 181 2.0 101 1.0 Thermal coal 16 0.3 20 0.2 36 0.4 Base metals 1,710 26.9 1,948 21.1 1,728 17.8 Nickel 971 15.3 1,064 11.5 928 9.6 Copper 464 7.3 556 6.0 505 5.2 PGMs 125 2.0 152 1.6 156 1.6 Gold 113 1.8 115 1.2 101 1.0 Silver 8 0.1 11 0.1 12 0.1 Others 29 0.5 50 0.5 26 0.3 Fertilizer nutrients 513 8.1 607 6.6 570 5.9 Potash 33 0.5 45 0.5 39 0.4 Phosphates 373 5.9 432 4.7 420 4.3 Nitrogen 93 1.5 108 1.2 92 1.0 Others 14 0.2 22 0.2 19 0.2 Others 43 0.7 257 2.8 308 3.2 Total 6,358 100.0 9,226 100.0 9,682 100.0 COSTS AND EXPENSES Cost of Goods Sold (COGS) COGS13 totaled US$ 5.168 billion in 1Q15, representing a decrease of US$ 1.724 billion when compared to the US$ 6.892 billion recorded in 4Q14. Ferrous minerals costs decreased by US$ 1.214 billion, base metals decreased by US$ 253 million, fertilizers decreased by US$ 93 million and coal decreased by US$ 77 million in 1Q15 versus 4Q14. Costs reductions in 1Q15 versus 4Q14 were mostly driven by the depreciation of the Brazilian Real and the Canadian dollar, by lower sales volumes in most of the business segments and by cost reduction initiatives, especially in the Iron Ore operations. Year-on-year COGS decreased 7.6%, despite the volumes increase in most of the business. Further details on cost performance are provided in the “Performance of the Business Segments” section. 13 COGS currency exposure in 1Q15 was made up as follows: 52% Brazilian Reais, 29% US dollar, 16% Canadian dollar,2% Australian dollar and 1% other currencies. |

|
|
1Q15 7 COGS BY BUSINESS US$ million 1Q15 % 4Q14 % 1Q14 % Ferrous minerals 3,065 59.3 4,278 62.1 3,202 57.3 Base metals 1,465 28.3 1,718 24.9 1,399 25.0 Coal 209 4.0 285 4.1 276 4.9 Fertilizers 399 7.7 492 7.1 521 9.3 Other products 31 0.6 119 1.7 192 3.4 Total COGS 5,168 100.0 6,892 100.0 5,590 100.0 Depreciation 912 1,122 941 COGS ex-depreciation 4,257 5,770 4,649 Expenses Total expenses decreased to US$ 532 million in 1Q15, positively impacted by the one-off effect of US$ 230 million from the goldstream transaction. Total expenses decreased by 59.8% from the US$ 1.324 billion recorded in 4Q14, and 40.3% from the US$ 892 million recorded in 1Q14. Nonetheless, even after deducting this positive one-off effect in 1Q15, expenses were down 47.1%14 and 14.5% in comparison to 4Q14 and 1Q14, respectively. SG&A decreased to US$ 195 million in 1Q15, representing a 36.3% decrease from the US$ 306 million recorded in 4Q14, and a 30.9% decrease from the US$ 282 million recorded in 1Q14. SG&A expenses decreased across the board, except for selling expenses, which increased by US$ 11 million, as a result of the reversal of an allowance for doubtful accounts recorded in 4Q14. R&D expenses decreased to US$ 119 million in 1Q15, representing a 49.4% decrease from the US$ 235 million recorded in 4Q14, and a 17.9% decrease from the US$ 145 million recorded in 1Q14. R&D expenses were mostly concentrated on iron ore and pellets (US$ 35 million) and nickel (US$ 27 million). Pre-operating and stoppage expenses decreased to US$ 264 million in 1Q15, representing a 9.6% decrease from the US$ 292 million registered in 4Q14, and a 6.5% increase from the US$ 248 million recorded in 1Q14. (i) Pre-operating expenses decreased to US$ 241 million in 1Q15 from the US$ 258 million recorded in 4Q14, as a result of lower pre-operating expenses in Vale New Caledonia (-US$ 53 million), Vargem Grande Itabiritos (-US$ 5 million) and others (-US$ 15 million). These reductions were partly offset by higher expenses in Long Harbour (US$ 56 million), resulting from the ramp-up of the project and the consequent increase in depreciation (US$ 34 million). Long Harbour was the main factor in the 4.8% increase in year-on year pre-operating expenses. (ii) Stoppage expenses decreased to US$ 23 million in 1Q15 from the US$ 34 million recorded in 4Q14, mainly as a result of the lower expenses associated with the Potássio Rio Colorado (PRC) project (-US$ 13 million) and the Tubarão pelletizing plants I and II expenses (-US$ 8 million). These reductions were partly offset by the one-off effect of the temporarily stoppage of the Cauê beneficiation plant for the connection of the new process stages of the Cauê Itabiritos project (US$ 10 million). Cauê was the main factor in the 27.8% increase in year-on year stoppage expenses. Other operating expenses, after deducting the above-mentioned one-off positive effect of the goldstream transaction, decreased to US$ 184 million in 1Q15, from US$ 607 million14in 4Q14 and US$ 217 million in 1Q14. 14 After adjusting for the positive impact of the insurance payment of US$ 116 million received in 4Q14. |

|
|
1Q15 8 EXPENSES US$ million 1Q15 % 4Q14 % 1Q14 % SG&A ex-depreciation 165 247 238 SG&A 195 36.6 306 23.1 282 31.6 Administrative 170 31.9 292 22.1 240 26.9 Personnel 82 15.4 118 8.9 110 12.3 Services 28 5.3 53 4.0 44 4.9 Depreciation 30 5.6 59 4.5 44 4.9 Others 30 5.6 62 4.7 42 4.7 Selling 25 4.7 14 1.1 42 4.7 R&D 119 22.4 235 17.7 145 16.3 Pre-operating and stoppage expenses¹ 264 49.6 292 22.1 248 27.8 VNC 88 16.5 141 10.6 121 13.6 Long Harbour 98 18.4 42 3.2 19 2.1 S11D 13 2.4 15 1.1 14 1.6 Moatize 12 2.3 10 0.8 6 0.7 Others 53 10.0 84 6.3 88 9.9 Other operating expenses² (46) (8.6) 491 37.1 217 24.3 Total Expenses 532 100.0 1,324 100.0 892 100.0 Depreciation 124 120 85 Expenses ex-depreciation 408 1,204 807 ¹ Includes U$ 94 million of depreciation charges in 1Q15, US$ 61 million in 4Q14 and US$ 40 million in 1Q14. ² Includes one-off effects of US$ 230 million from the goldstream transaction in 1Q15 and of US$ 116 million from the insurance payment in 4Q14, which reduced other expenses. COSTS AND EXPENSES US$ million 1Q15 4Q14 1Q14 Costs 5,168 6,892 5,590 Expenses 532 1,324 892 Total costs and expenses 5,700 8,216 6,482 Depreciation 1,035 1,242 1,026 Costs and expenses ex-depreciation 4,665 6,974 5,456 ADJUSTED EARNINGS BEFORE INTEREST, TAXES DEPRECIATION AND AMORTIZATION Adjusted EBITDA was US$ 1.602 billion, 26.7% lower than in 4Q14 mainly as a result of lower prices and seasonally lower volumes which had a negative impact of US$ 1.524 billion and US$ 480 million, respectively. EBITDA was positively impacted in US$ 230 million from the goldstream transaction but was negatively impacted by: (i) US$ 160 million in price adjustments resulting from iron ore provisional prices in 4Q14; (ii) US$ 288 million in lower revenues resulting from the 45% of the 1Q15 iron ore sales recorded at a provisional price of US$ 51.4/t, against the average IODEX of US$ 62.4/t for the quarter; (iii) US$ 84 million resulting from the settlement of the bunker oil hedge transactions accounted for as hedge account that directly impacted freight costs. In March 2015, we entered into an agreement with Silver Wheaton to sell an additional 25% of the payable goldstream from the Salobo copper mine for the life of the mine. This transaction had a positive impact in the 1Q15 adjusted EBITDA and was accounted for as gain of US$ 230 million under “other operational expenses”. The US$ 230 million gain represents the amount paid by Silver Wheaton in excess of the book value of the asset15 (US$ 138 million) and the net present value of the estimated costs and margins16 (US$ 532 million) to deliver the goldstream to Silver Wheaton. The US$ 532 million, accounted for as “deferred revenues”, will be recognized in the base metals EBITDA over time. 15 Asset value calculated by allocating the share of book value to produce and sell 25% of the gold produced from the Salobo mine over life of the mine. 16 Margins were estimated based on Vale’s cost of capital and the book equity allocated to the goldstream transaction |

|
|
1Q15 9 Operating income, measured by adjusted EBIT, was US$ 540 million in 1Q15, lower than the US$ 856 million in 4Q14. Adjusted EBIT margin was 8.7% in 1Q15. ADJUSTED EBITDA US$ million 1Q15 4Q14 1Q14 Gross operating revenues 6,358 9,226 9,682 Net operating revenues 6,240 9,072 9,503 COGS (5,168) (6,892) (5,590) SG&A (195) (306) (282) Research and development (119) (235) (145) Pre-operating and stoppage expenses (264) (292) (248) Other operational expenses 46 (491) (217) Adjusted EBIT 540 856 3,021 Depreciation, amortization & depletion 1,035 1,242 1,026 Dividends received 27 89 11 Adjusted EBITDA 1,602 2,187 4,058 ADJUSTED EBITDA BY BUSINESS AREA US$ million 1Q15 4Q14 1Q14 Ferrous minerals 1,027 1,702 3,604 Coal (128) (204) (162) Base metals 678 582 549 Fertilizer nutrients 90 75 35 Others (65) 32 32 Total 1,602 2,187 4,058 NET INCOME Vale posted a net loss of US$ 3.118 billion in 1Q15 compared to a net loss of US$ 1.849 billion in 4Q14. The net loss in 1Q15 was mainly driven by the non-cash impact stemming from the 20.8% quarter-on-quarter depreciation of the BRL against the USD, from 2.66 to 3.21 BRL / USD. This quarter-on-quarter depreciation caused a US$ 3.019 billion loss on the net of the US$ 21.474 billion of USD denominated debt and USD denominated assets and a US$ 1.263 billion loss on the US$ 7.600 billion of debt and future interest obligations swapped into US Dollars through forward and swap derivatives. Conversely, the average depreciation of the BRL, from 2.54 to 2.87 BRL / USD, which positively impacted cash flows, was only 12.8%. Underlying earnings were a negative US$ 678 million after excluding the following one-off effects: (i) foreign exchange and monetary variation losses (-US$ 3.019 billion)17; (ii) currency and interest rate swap losses (-US$ 1.263 billion); (iii) mark-to-market of shareholder debentures (US$ 275 million); (iv) gain on the transaction of the energy generation assets with the creation of Aliança Geração de Energia S/A18 (US$ 193 million); (v) gain on the sale of 49% of our participation in Belo Monte (US$ 18 million); and (vi) tax adjustments (US$ 1.356 billion). Net financial results showed a loss of US$ 4.510 billion in 1Q15, compared to a loss of US$ 2.791 billion in 4Q14. The main components of net financial results include: (i) financial expenses (-US$ 219 million), (ii) financial revenues (US$ 68 million), (iii) foreign exchange and monetary losses (-US$ 3.019 billion) and (iv) losses on derivatives (- US$ 1.340 billion), composed mainly of a loss of US$ 1.263 billion due to currency swap losses and a loss of US$ 49 million due to the bunker oil derivatives19. 17 As result of the BRL depreciation of 20.8% against the USD in 1Q15 and its impact on Vale’s net debt position in US dollars. For more information please see the box “Effects of currency price volatility on Vale’s financial performance”. 18 The conclusion of the transaction with Cemig Geração e Transmissão S.A. (Cemig GT) on February 2015 to create the joint venture Aliança Geração de Energia S/A had a positive impact in net income of US$ 193 million. 19 Refers to bunker oil derivatives related to FOB sales, not recognized as hedge accounting. Further details on the impact of the bunker oil hedge can be found in the box “The impact of bunker hedging on Vale’s financial performance”. |

|
|
1Q15 10 EFFECTS OF CURRENCY PRICE VOLATILITY ON VALE’S FINANCIAL PERFORMANCE In 1Q15, the Brazilian Real (BRL) depreciated 20.8% against the US Dollar (USD) from BRL 2.66/ USD as of December 31st, 2014 to BRL 3.21/ USD as of March 31st, 2015. As a quarterly average, the depreciation of the BRL was 12.8%, from an average BRL 2.54/USD in 4Q14 to an average BRL 2.87/USD in 1Q15. Although Vale reports its financial performance in USD, the BRL depreciation impacts its results since the functional currency of Vale’s parent company, Vale S. A., is the BRL. The depreciation of the BRL against the USD and other currencies produced mainly non-cash impacts on our earnings before taxes in 1Q15, driven by its impact on: (i) The net of the USD denominated debt and the USD denominated assets (accounts receivable, cash etc) – which amounted to a loss of US$ 3.019 billion in 1Q15, recorded in the financial statements as "Foreign exchange and monetary variation". (ii) The forward and swaps derivatives that are used to minimize the volatility of our cash flows in USD. In 1Q15, the fair value variations and settlements of the currency swaps from BRL and other currencies to USD caused one-off losses of US$ 1.263 billion. The BRL depreciation also has positive impacts on our cash flows. In 1Q15 most of our revenues were USDdenominated, while our COGS were 52% denominated in BRL, 29% in USD and 16% in Canadian dollars (CAD) and about 75% of our capital expenditures were denominated in BRL. The depreciation of the BRL and of other currencies in 1Q15 reduced our COGS by US$ 482 million. Equity income from affiliated companies Equity income from affiliated companies was a negative US$ 271 million in 1Q15, lower than the US$ 31 million in 4Q14. The main positive contributors to equity income were the leased pelletizing companies in Tubarão (US$ 24 million) and MRS (US$ 9 million). Samarco had a negative contribution to equity income of US$ 173 million while CSP had a negative contribution of US$ 120 million due to the impact of the BRL depreciation on their USDdenominated debt. UNDERLYING EARNINGS US$ million 1Q15 4Q14 1Q14 Underlying earnings (678) (251) 2,045 Items excluded from basic earnings Impairment on assets - (378) - Gain (loss) on fair value on non-current assets 193 (167) - Shareholders Debentures 275 62 (22) Foreign exchange and monetary variation (3,019) (1,257) 516 Currency and interest rate swaps (1,263) (524) 218 Fair value on financial instruments - 17 - Gain (loss) on sale of investments 18 - - Tax effects of Impairment - 70 - Income tax over excluded items 1,356 579 (242) Net Income (loss) (3,118) (1,849) 2,515 |

|
|
1Q15 11 FINANCIAL RESULTS US$ million 1Q15 4Q14 1Q14 Gross interest¹ (195) (259) (384) Tax and labour contingencies (34) (22) (7) Others² 154 (56) (128) Financial expenses (REFIS) (144) (165) (163) Financial expenses (219) (502) (682) Financial income 68 55 103 Currency and interest rate swaps (1,263) (524) 218 Others (bunker oil, commodities, etc) (77) (563) (6) Derivatives (1,340) (1,087) 212 Foreign exchange and monetary variation (3,019) (1,257) 516 Financial result, net (4,510) (2,791) 149 ¹ The capitalization of interest over assets under construction amounted to US$ 195 million in 1Q15 and US$ 167 million in 4Q14. ² Other financial expenses include the mark-to-market of shareholder debentures which amounted to US$ 275 million in 1Q15, US$ 62 million in 4Q14 and -US$ 22 million in 1Q14. INVESTMENTS Capital expenditures amounted to US$ 2.210 billion, comprised of US$ 1.516 billion in project execution and US$ 694 million in sustaining capex. This represents a decrease of US$ 377 million when compared to the US$ 2.587 billion invested in 1Q14. INVESTMENTS BY BUSINESS AREA - 1Q15 US$ million Projects % Sustaining capex % Total % Ferrous minerals 1,104 72.8 360 51.9 1,465 66.3 Coal 346 22.8 7 1.1 354 16.0 Base metals 17 1.1 263 37.9 280 12.7 Fertilizer nutrients 13 0.9 43 6.1 56 2.5 Power generation 28 1.8 1 0.1 29 1.3 Steel 7 0.5 - - 7 0.3 Others - - 19 2.8 19 0.9 Total 1,516 100.0 694 100.0 2,210 100.0 PROJECT EXECUTION Vale´s investments in project execution decreased from US$ 1.834 billion in 1Q14 to US$ 1.516 billion in 1Q15. Ferrous minerals accounted for about 73% and coal accounted for 23% of the total investments in projects. PROJECT EXECUTION BY BUSINESS AREA US$ million 1Q15 % 4Q14 % 1Q14 % Ferrous minerals 1,104 72.8 1,523 66.8 1,066 58.1 Coal 346 22.8 510 22.4 451 24.6 Base metals 17 1.1 149 6.5 156 8.5 Fertilizer nutrients 13 0.9 27 1.2 8 0.4 Power generation 28 1.8 56 2.5 36 2.0 Steel 7 0.5 15 0.6 118 6.4 Total 1,516 100.0 2,279 100.0 1,834 100.0 |

|
|
1Q15 12 Ferrous minerals About 82% of the US$ 1.104 billion invested in ferrous minerals in 1Q15 relates to growth initiatives in iron ore, namely the: (i) Carajás and related infrastructure expansion (US$ 739 million); (ii) Itabiritos projects (US$ 135 million); and (iii) global distribution network (US$ 31 million). S11D (including mine, plant and associated logistics – CLN S11D) is advancing as planned and reached combined physical progress of 47% in 1Q15 (60% at the mine and 36% at the logistic sites). In the mine site, the assembly of the long-distance conveyor belts progressed positively and the assembly of the machinery for the stockyard equipment was initiated. With the logistics infrastructure, the railway spur reached 51% physical progress and the pile driving in the off-shore north berth reached 59% physical progress. Capital expenditures for the Itabiritos projects totaled US$ 135 million in 1Q15. The assembly of the primary crushing system was initiated for the Cauê Itabiritos project with completion scheduled for 2Q15. The Cauê beneficiation plant interrupted production in 1Q15 for an overhaul of the screening system and of the conveyors belt of the existing plant. The Conceição Itabiritos II project achieved physical progress of 97% with the hematite circuit tie-ins completed and the testing of the itabirites circuit initiated in 1Q15. The project start-up is scheduled for the end of 2Q15. Coal Vale invested US$ 117 million in the Moatize II project and US$ 225 million in the Nacala Logistics Corridor in 1Q15. Moatize II achieved 86% physical progress with 70% physical progress in the electromechanical assembly and the commissioning of the water supply system. The brownfield sections of the railway are still being revamped with 57% physical progress, with start-up scheduled for 3Q15. The port expansion at Nacala-à-Velha reached 97% physical progress with the commissioning of the loading system. DESCRIPTION AND STATUS OF MAIN PROJECTS Project Description Capacity Mtpy Status Ferrous minerals projects Carajás Serra Sul S11D • Development of a mine and processing plant, located in the Southern range of Carajás, Pará, Brazil 90 • Transportation of the modules to the plant area reached 35% completion • Assembly of the long distance conveyor belts ongoing • Assembly of the equipment for the regulation and products yards initiated CLN S11D • Duplication of 570 km railway, with construction of rail spur of 101 km • Acquisition of wagons, locomotives, and onshore and offshore expansions at PDM maritime terminal (80)b • Foundation work on the PDM port expansion ongoing – pile driving in the off-shore north berth reached 59% physical progress • Onshore expansion – assembly of the cars dumpers ongoing • Railway spur reached 51% physical progress Conceição Itabiritos II • Adaptation of the existing plant to process lower grade itabirites from the Conceição mine, located in the Southeastern System, Minas Gerais, Brazil 19 (0)b • Testing of the hematite circuit concluded • Testing of the itabirites circuit initiated Cauê Itabiritos • Adaptation of the plant to process low-grade itabirites from the Minas do Meio, located in the Southeastern System, Minas Gerais, Brazil 24 (4)b • Assembly of the primary crushing system initiated • Operational stoppage for the overhaul of the screening and the conveyor belts of the existing plant concluded |

|
|
1Q15 13 DESCRIPTION AND STATUS OF MAIN PROJECTS Project Description Capacity Mtpy Status CSPa • Development of a steel slab plant in partnership with Dongkuk and Posco, located in Ceará, Brazil. 1.5 • Assembly of the steel structure reached 67% physical progress a Net additional capacity b Relative to Vale’s stake in the project Project Description Capacity Mtpy Status Coal projects Moatize II • New pit and duplication of the Moatize CHPP, as well as all related infrastructure, located in Tete, Mozambique 11 • Electromechanical assembly reached 70% physical progress • Commissioning of the water supply system initiated • Energizing of the main substation and four more secondary substations completed Nacala corridor • Railway and port infrastructure connecting the Moatize site to the Nacala-à-Velha maritime terminal, located in Nacala, Mozambique 18 • Electromechanical assembly of the coal loading coal system (unloading from the railway to loading of the ships) completed and cold commissioning of the first loading line completed. PROGRESS INDICATORS20 Project Capacity Mtpy Estimated start-up Executed capex US$ million 2015 Total Estimated capex US$ million 2015 Total Physical progress Ferrous minerals projects Carajás Serra Sul S11D 90 2H16 255 3,747 1,321 6,878c 60% CLN S11D 230 (80)b 1H14 to 2H18 484 3,137 2,375 9,484d 36% Conceição Itabiritos II 19 (0)b 1H15 54 917 179 1,137e 97% Cauê Itabiritos 24 (4)b 2H15 81 767 350 1,317f 82% CSPa 1.5 2H15 - 1,055 185 2,734 82% a Relative to Vale’s stake in the project b Net additional capacity c Original capex budget of US$ 8.089 billion d Original capex budget of US$ 11.582 billion e Original capex budget of US$ 1.189 billion f Original capex budget of US$ 1.504 billion 20 In this table we do not include pre-operating expenses in the estimated capex for the year, although these expenses are included in the total estimated capex column, in line with our Board of Directors approval process. Moreover, our estimated capex for the year is only reviewed once a year. |

|
|
1Q15 14 Project Capacity Mtpy Estimated start-up Executed capex US$ million 2015 Total Estimated capex US$ million 2015 Total Physical progress Coal projects Moatize II 11 2H15 117 1,501 629 2,068 86% Nacala corridorg 18 2H14 225 3,117 648 4,444 85% g The greenfield sections of the project started up but there are some brownfield sections still being upgraded. SUSTAINING CAPEX Sustaining capital expenditures amounted to US$ 694 million in 1Q15, a decrease of US$ 59 million when compared to 1Q14. Ferrous minerals accounted for 52% and base metals 38% of the total. Vale measures and reports sustaining capex on a cash flow basis, however, if measured on an accrual basis, sustaining capex for the quarter would only be US$ 586 million (vs. the US$ 694 million reported), which better indicates the sustaining capex disbursements trend in the following quarters. Sustaining capital expenditures for ferrous minerals included among others: (i) improvement in the current standards of health and safety and environmental protection (US$ 78 million), (ii) replacement and acquisition of new equipment (US$ 164 million), (iii) expansion of tailing dams (US$ 42 million) and (iv) operational enhancement (US$ 33 million). Out of the total sustaining capex for ferrous minerals, maintenance of railways and ports serving our mining operations in Brazil totaled US$ 117 million. Sustaining investments in iron ore fines amounted to US$ 346 million in 1Q15, equivalent to US$ 4.64/t produced; this represents a decrease of 49.1% and 22.1% when compared to 4Q14 and 1Q14, respectively. Sustaining capex in the base metals operations was mainly dedicated to: (i) operational enhancement (US$ 183 million), (ii) improvement in the current standards of health and safety and environmental protection (US$ 35 million), (iii) replacement and acquisition of new equipment (US$ 27 million) and (iv) expansion of tailing dams (US$ 10 million), SUSTAINING CAPEX BY TYPE - 1Q15 US$ million Ferrous Minerals Coal Base Metals Fertilizer Others TOTAL Operations 198 3 210 27 2 439 Waste dumps and tailing dams 42 - 10 6 - 58 Health and Safety 63 - 24 2 1 90 CSR - Corporate Social Responsibility 17 - 13 5 - 35 Administrative & Others 41 5 7 3 17 72 Total 360 7 263 43 20 694 SUSTAINING CAPEX BY BUSINESS AREA US$ million 1Q15 % 4Q14 % 1Q14 % Ferrous minerals 360 51.9 802 54.7 456 60.5 Coal 7 1.1 46 3.1 31 4.1 Base metals 263 37.9 443 30.2 186 24.6 Fertilizer nutrients 43 6.1 95 6.5 33 4.4 Power generation 1 0.1 3 0.2 1 0.1 Others 19 2.8 78 5.3 47 6.2 Total 694 100.0 1,467 100.0 753 100.0 EXCHANGE RATE VARIATIONS Our capex budget is subject to exchange rate variations as a high percentage of our investments are denominated in Brazilian Reais. In the table below we provide capex scenarios at different exchange rates, solely based on the |

|
|
1Q15 15 depreciation of the BRL vs. the original 2.60 BRL/USD in which we based our capital budget, without accounting for our other capex reduction initiatives. EXCHANGE RATE SENSITIVITY FX Rates BRL / US$ CAPEX¹ (US$ billion) 2015 2016 2017 2018 2.60 10.2 7.6 6.0 4.9 2.90 9.4 7.0 5.5 4.5 3.00 9.2 6.9 5.4 4.4 3.10 9.0 6.7 5.3 4.3 3.20 8.8 6.5 5.2 4.2 3.30 8.6 6.4 5.1 4.1 1 Approved projects only. PORTFOLIO MANAGEMENT Vale entered into an agreement with Silver Wheaton, a Canadian company traded on the Toronto Stock Exchange (TSX) and the New York Stock Exchange (NYSE), to sell an additional 25% of the gold produced from the Salobo copper mine for the life of mine. Vale received an initial cash payment of US$ 900 million and will receive future cash payments for each ounce (oz) of gold delivered to Silver Wheaton. Please refer to the Adjusted EBITDA section of this report for details about the accounting treatment of this transaction. Vale concluded the transaction with Cemig Geração e Transmissão S.A. (Cemig GT) to create Aliança Geração de Energia S/A (Aliança Geração), a joint venture between Vale and Cemig GT. After receiving all regulatory approvals and satisfying all other conditions precedent related to the transaction, Vale and Cemig GT increased capital in Aliança Geração by the incorporation of energy generation assets from both companies, taking Vale’s share in the total capital of the new company to 55%. Vale also concluded the transaction with Cemig GT to sell 49% of its participation in the Belo Monte (UHE Belo Monte) hydroelectric plant project. Vale transferred its 9% participation in the Belo Monte project to its subsidiary Aliança Norte and afterwards, Cemig GT acquired 49% of the shares of Aliança Norte. The acquisition was made through a cash payment of approximately US$ 97 million. CSP concluded a US$ 3 billion long term financing arrangement which will contribute for the fulfillment of the project main funding needs onwards. This loan will be taken out directly by CSP and shall not be consolidated in Vale’s total debt. CORPORATE SOCIAL RESPONSIBILITY Investments in corporate social responsibility reached US$ 176 million in 1Q15, out of which US$ 131 million was for environmental protection and conservation and US$ 45 million dedicated for social projects. |

|
|
1Q15 16 DEBT INDICATORS Gross debt was US$ 28.487 billion as of March 31, 2015, with a decrease of US$ 320 million from the US$ 28.807 billion as of December 31, 2014. Our net debt was US$ 24.802 billion based on a cash position of US$ 3.685 billion as of March 31, 2015. After interest and currency swaps, Vale’s gross debt on March 31, 2015, was composed of 29% of floating interest rates and 71% of fixed interest rate-linked debt and our debt was 97% denominated in US dollars. Average debt maturity remained practically stable at 8.7 years. The average cost of debt, after the above-mentioned hedge transactions, decreased slightly to 4.46% per annum, against 4.54% on December 31, 2014. Interest coverage, measured by the ratio of the LTM21 adjusted EBITDA to LTM interest payment, was 6.9x against 8.6x on December 31, 2014. Debt leverage, measured by gross debt to LTM adjusted EBITDA, was 2.6x as of March 31, 2015. DEBT INDICATORS US$ million 1Q15 4Q14 1Q14 Total debt 28,487 28,807 30,346 Net debt 24,802 24,685 23,162 Total debt / LTM adjusted EBITDA (x) 2.6 2.2 1.4 LTM adjusted EBITDA / LTM interest expenses (x) 6.9 8.6 13.8 21 LTM = last twelve months |

|
|
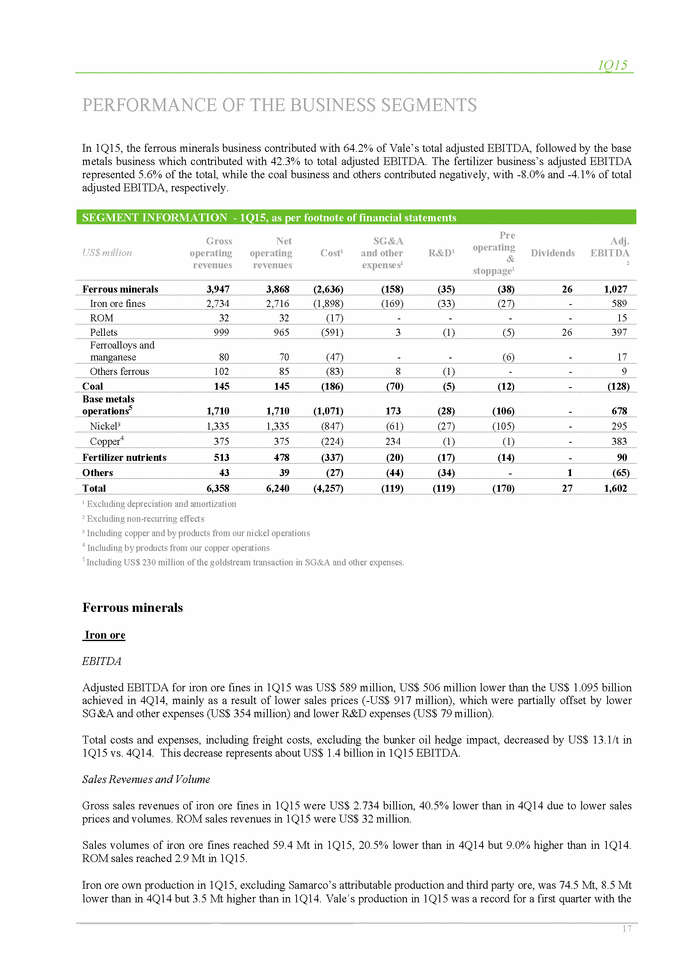
1Q15 17 PERFORMANCE OF THE BUSINESS SEGMENTS In 1Q15, the ferrous minerals business contributed with 64.2% of Vale’s total adjusted EBITDA, followed by the base metals business which contributed with 42.3% to total adjusted EBITDA. The fertilizer business’s adjusted EBITDA represented 5.6% of the total, while the coal business and others contributed negatively, with -8.0% and -4.1% of total adjusted EBITDA, respectively. SEGMENT INFORMATION - 1Q15, as per footnote of financial statements US$ million Gross operating revenues Net operating revenues Cost¹ SG&A and other expenses¹ R&D¹ Pre operating & stoppage¹ Dividends Adj. EBITDA ² Ferrous minerals 3,947 3,868 (2,636) (158) (35) (38) 26 1,027 Iron ore fines 2,734 2,716 (1,898) (169) (33) (27) - 589 ROM 32 32 (17) - - - - 15 Pellets 999 965 (591) 3 (1) (5) 26 397 Ferroalloys and manganese 80 70 (47) - - (6) - 17 Others ferrous 102 85 (83) 8 (1) - - 9 Coal 145 145 (186) (70) (5) (12) - (128) Base metals operations5 1,710 1,710 (1,071) 173 (28) (106) - 678 Nickel³ 1,335 1,335 (847) (61) (27) (105) - 295 Copper4 375 375 (224) 234 (1) (1) - 383 Fertilizer nutrients 513 478 (337) (20) (17) (14) - 90 Others 43 39 (27) (44) (34) - 1 (65) Total 6,358 6,240 (4,257) (119) (119) (170) 27 1,602 ¹ Excluding depreciation and amortization ² Excluding non-recurring effects ³ Including copper and by products from our nickel operations 4 Including by products from our copper operations 5 Including US$ 230 million of the goldstream transaction in SG&A and other expenses. Ferrous minerals Iron ore EBITDA Adjusted EBITDA for iron ore fines in 1Q15 was US$ 589 million, US$ 506 million lower than the US$ 1.095 billion achieved in 4Q14, mainly as a result of lower sales prices (-US$ 917 million), which were partially offset by lower SG&A and other expenses (US$ 354 million) and lower R&D expenses (US$ 79 million). Total costs and expenses, including freight costs, excluding the bunker oil hedge impact, decreased by US$ 13.1/t in 1Q15 vs. 4Q14. This decrease represents about US$ 1.4 billion in 1Q15 EBITDA. Sales Revenues and Volume Gross sales revenues of iron ore fines in 1Q15 were US$ 2.734 billion, 40.5% lower than in 4Q14 due to lower sales prices and volumes. ROM sales revenues in 1Q15 were US$ 32 million. Sales volumes of iron ore fines reached 59.4 Mt in 1Q15, 20.5% lower than in 4Q14 but 9.0% higher than in 1Q14. ROM sales reached 2.9 Mt in 1Q15. Iron ore own production in 1Q15, excluding Samarco’s attributable production and third party ore, was 74.5 Mt, 8.5 Mt lower than in 4Q14 but 3.5 Mt higher than in 1Q14. Vale´s production in 1Q15 was a record for a first quarter with the |
|
|
1Q15 18 production in Carajás at 27.5 Mt, supported by the ramp-up of the N4WS mine, a world-class ore body, with 1.346 billion metric tons of proven and probable reserves and an average Fe content of 66.5%. Sales of iron ore fines amounted to 59.4 Mt on the back of: (i) production of 74,5 Mt; (ii) acquisition of 2.9 Mt of iron ore from third parties; (iii) deduction of 12.7 Mt of iron ore fines used for the production of pellets; (iv) deduction of the build-up of 2.4 Mt of inventories and (v) deduction of 2.9 Mt of ROM sales. CFR sales of iron ore fines were 36.6 Mt, representing 62% of 1Q15 sales, being slightly lower than the 64% of CFR sales reported in 4Q14. Realized Prices Iron ore sales in 1Q15 were distributed across three pricing systems: (i) 41% based on the current quarter, monthly and daily spot prices, including provisional price sales that were settled within the quarter; (ii) 45% based on provisional prices with price settlement based on the market price defined on the delivery date, in which case prices had not yet been settled at the end of the quarter; and (iii) 14% linked to past prices (quarter-lagged). Vale’s average realized price for iron ore fines (ex-ROM) decreased by US$ 15.6/t from US$ 61.6/t per metric ton in 4Q14 to US$ 46.0/t in 1Q15. This US$ 15.6/t decrease was higher than the US$ 11.9/t decrease in the average Platts IODEX 62% which came down from US$ 74.3 per dry metric ton (CFR China) in 4Q14 to US$ 62.4/t in 1Q15. On a purely CFR basis, estimated realized price for iron ore fines (ex-ROM) decreased from US$ 69.2/t in 4Q14 to US$ 53.2/t in 1Q15. CFR based realized prices are estimated by adding back a theoretical freight cost per metric ton to our FOB sales prices. The main reasons for the relatively worst performance in Vale’s realized price versus the average Platts IODEX in 1Q15 were the higher impact of the provisional pricing system compared to 4Q14 and the decrease in CFR sales in the sales mix. Price realization was impacted in 1Q15 as follows: (i) Provisional prices set at the end of 4Q14 at US$ 72.0/t, which were later adjusted based on the price of delivery in 1Q15, negatively impacted prices in 1Q15 by US$ 2.8/t compared to a negative US$ 0.5/t in 4Q14. (ii) Provisional prices set at the end of 1Q15 at US$ 51.4/t vs. the IODEX average of US$ 62.4/t in 1Q15, negatively impacted prices in 1Q15 by US$ 4.9/t compared to a negative impact of US$ 0.8/t in 4Q14. (iii) Quarter-lagged contracts, priced at US$ 78.9/t based on the average prices for Sep-Oct-Nov, positively impacted prices in 1Q15 by US$ 2.2/t compared to a positive impact of US$ 2.3/t in 4Q14. In 1Q15, iron ore sales of 26.2 Mt, or 45% of Vale’s sales mix, were recorded under the provisional pricing system, which was set at the end of 1Q15 at US$ 51.4/t22. The final prices of these sales and the required adjustment to sales revenues will be determined and recorded in 2Q15. The reduction of bunker oil prices positively impacted prices in 1Q15 by US$ 2.9/t compared to a positive impact of US$ 2.4/t in 4Q14. Bunker oil prices impacted FOB sales prices as the decrease in bunker oil prices contributed to a lower freight deduction to the IODEX CFR reference price used to determine the FOB price. Costs and Expenses Costs for iron ore fines amounted US$ 1.898 billion (or US$ 2.223 billion with depreciation charges) in 1Q15. After adjusting for the effects of lower volumes (-US$ 577 million) and exchange rates variations (-US$ 175 million), costs decreased by US$ 180 million when compared to 4Q14. The decrease was mainly due to lower freight costs (-US$ 161 million), lower maintenance costs (-US$ 42 million), lower personnel costs (-US$ 32 million), and lower services and materials costs (-US$ 15 million), which were partly offset by the negative impact of the outstanding hedge accounting position (US$ 84 million). For further details, please refer to the ‘The Impact of Bunker Hedging on Vale’s Financial Performance’ box on page 24. The decrease in maintenance costs was primarily due to the conclusion of the refurbishment and maintenance of trucks in preparation for production volume increases at the N4WS mine and the reduction in personnel costs related to main maintenance works. 22 The reference for determining the provisional price is SBB Steel Markets Daily forward curve IODEX 62% Fe CFR North China OTC, March 30th, 2015 page 5. |

|
|
1Q15 19 Oil costs in the form of diesel for our operations amounted to US$ 94 million in 1Q15 against US$ 141 million in 4Q14. After adjusting for lower volumes (-US$ 26 million) and exchange rates variations (-US$ 15 million), costs decreased by US$ 6 million when compared to 4Q14. Falling oil prices had a limited positive impact on our fuel costs, since prices of diesel in Brazil are not directly correlated to international oil prices. Maritime freight costs, which are fully accrued as cost of goods sold, totaled US$ 628 million in 1Q15, showing a decrease of US$ 409 million when compared to 4Q14 as a result of: (i) the lower sales volumes when compared to 4Q14, (ii) the positive impact of lower bunker oil prices and (iii) the positive impact of lower spot charter freight rates. Unit freight cost per iron ore metric ton on a recurrent basis23 was US$ 17.2/t in 1Q15, US$ 4.5/t lower than the US$ 21.7/t recorded in 4Q14. This US$ 4.5/t decrease is explained by the lower spot charter freight costs (US$ 1.0/t) and the positive impact of lower bunker oil prices in our medium and long term chartering contracts (US$ 3.16/t), which contain a freight rate adjustment factor based on the variation of the bunker oil prices. The impact of the outstanding bunker oil hedge position accounted for as “hedge accounting” in Vale´s unit freight cost was US$ 2.3/t with the settlement of 465,000 tons of bunker oil derivative contracts from the 1,950,000 tons of contracts that were outstanding at the end of 2014. After adjusting for the effects of the hedge accounting, Vale’s iron ore unit freight cost per metric ton was US$ 19.5/t, a decrease of US$ 2.2/t in 1Q15 vs. 4Q14. For further details, please refer to the ‘The Impact of Bunker Hedging on Vale’s Financial Performance’ box on page 24. The cost of ore acquired from third parties amounted to US$ 58 million against US$ 89 million in 4Q14, on sales of third parties’ ore of 2.5 Mt in 1Q15, a reduction of 0.7 Mt vs. to 4Q14. On a per-ton basis, cost of ore acquired from third parties decreased from US$ 27.7/t in 4Q14 to US$ 22.9/t in 1Q15. Other operational costs amounted to US$ 268 million, decreasing from the US$ 371 million in 4Q14. The TFRM24 was US$ 42 million in 1Q15 compared to US$ 55 million in 4Q14. The CFEM, Brazil’s federal mining royalty, was US$ 44 million in 1Q15 compared to US$ 68 million in 4Q14. Total cash cost at the port (mine, plant, railroad and port, after royalties) was US$ 1.128 billion after deducting depreciation of US$ 325 million, iron ore acquired from third parties of US$ 58 million, iron ore freight costs of US$ 628 million and bunker oil hedge accounting effects of US$ 84 million. Cash cost25 per metric ton of iron ore fines was US$ 19.8/t 26 (US$ 18.3/t ex-royalties) in 1Q15 vs. US$ 23.2/t in 4Q14, a reduction of US$ 3.4/t mainly due to the depreciation of the Brazilian Real and the fall in costs denominated in Brazilian Reais. Cash cost per metric ton of iron ore fines fell in Brazilian Reais from R$ 58.9/t in 4Q14 to R$ 57.7/t, a decrease of R$ 1.26/t due to a decrease in maintenance and personnel costs. Iron ore expenses, net of depreciation, amounted to US$ 229 million in 1Q15 vs.US$ 662 million recorded in 4Q14. After adjusting for the effects of exchange rates variations (-US$ 67 million), expenses decreased by US$ 169 million when compared to 4Q14. SG&A and other expenses decreased by US$ 341 million to US$ 169 million due to one-off expenses of US$ 197 million recorded in 4Q14. R&D expenses decreased by US$ 79 million. Pre-operating expenses amounted to US$ 27 million, US$ 13 million lower than the US$ 40 million in 4Q14. This reduction was mainly due to the ramp up of Vargem Grande Itabiritos. Iron ore pellets Adjusted EBITDA for pellets in 1Q15 was US$ 397 million, compared to the US$ 526 million in 4Q14. The decrease in sales prices (-US$ 157 million) and volumes (-US$ 46 million) were partly offset by lower costs (US$ 16 million), and exchange rate variations (US$ 66 million). 23 Assuming current market conditions for bunker oil prices, spot freight rates and transportation routes 24 TFRM - State of Minas Gerais and state of Pará tariff for control, monitoring, and supervision of activities related to research, exploration, production, profiting from mineral resources 25 Excluding ROM and iron ore from third parties. 26 As per segment reporting notes to the financial statements: US$ 1.898 billion in costs net of depreciation and amortization, less US$ 628 million in iron ore freight, US$ 58 million in iron ore acquired from third parties, US$ 84 million of the hedge banker oil on iron ore sales of 62.3 Mt, sales of third party ore of 2.5 Mt, and sales volume of ROM of 2.9 Mt. |

|
|
1Q15 20 Gross sales revenues for pellets amounted to US$ 999 million in 1Q15, decreasing US$ 309 million from the US$ 1.308 billion recorded in 4Q14. The decrease against 4Q14 was due to lower pellets sales prices of US$ 88.76 per ton in 1Q15 vs. US$ 103.11/t in 4Q14 and lower sales volumes of 11.255 Mt in 1Q15 vs. 12.686 Mt in 4Q14. Sales volumes increased by 1.3 Mt in 1Q15 vs. 1Q14. Production reached 11.4Mt in 1Q15, in line with production in 4Q14 and 1.5Mt higher than in 1Q14 due to the ramp-up of the Tubarão VIII pellet plant. Pellet prices decreased by US$ 14.3/t, from US$ 103.11/t in 4Q14 to US$ 88.76/t per metric ton in 1Q15, whereas the Platt’s IODEX iron ore reference price (CFR China) decreased by US$ 11.9/t in the quarter. The relatively worst performance in Vale’s realized price versus the average Platts IODEX in 1Q15 was mainly a result of: (i) the decrease in CFR sales in the mix, (ii) the decrease in direct reduction pellets sales in 1Q15, and (iii) lower 1% Fe differential (Platts). Pellet premiums remained relatively stable in 1Q15 when compared to 4Q14. CFR sales decreased from 3.8 Mt in 4Q14 to 2.7 Mt in 1Q15, representing 24% of pellets sales. Sales on a FOB basis, were 8.6 Mt in 1Q15, representing 76% of all pellets sales. Production at the Oman pellet plant amounted to 1.9 Mt of direct reduction pellets in 1Q15, a decrease of 20.8% when compared to 4Q14, due to a scheduled maintenance stoppage. The lower production at the Oman pellet plant affected our sales of direct reduction pellets which decreased from 36% in 4Q14 to 32% in 1Q15, thus negatively impacting price realization since direct reduction pellets command better prices than blast furnace pellets. The value of Platts 1% Fe differential decreased from US$ 1.4 in 4Q14 to US$ 1.2 in 1Q15, impacting price realization by US$ 0.8/t. Pellet costs totaled US$ 591 million (or US$ 672 million with depreciation charges) in 1Q15. Costs decreased by US$ 16 million when compared to 4Q14 after adjusting for the effects of lower volumes (-US$ 102 million) and exchange rates variations (-US$ 66 million). This decrease is mainly due to lower material and service costs (-US$ 17 million) and lower maintenance costs (-US$ 7 million). Pellet costs decreased by US$ 6 million when compared to 1Q14. Preoperating and stoppage expenses for pellets were US$ 5 million in 1Q15 compared to the US$ 3 million in 4Q14. EBITDA margins for pellets were US$ 35.3/t in 1Q15. EBITDA in 1Q15 including dividends received from the leased pelletizing plants in Tubarão of US$ 26 million. Cash costs include costs of iron ore, transformation costs (energy, labour, etc), leasing fees for the pelletizing plants and freight. PELLETS – EBITDA ex-Samarco 1Q15 4Q14 US$ million US$ / wmt US$ million US$ / wmt Gross Revenues / Realized Price 999 88.8 1,308 103.1 Net Revenues / Realized Price 965 85.7 1,270 100.1 Dividends Received (Leased pelletizing plants) ex-Samarco 26 2.3 27 2.1 Cash Costs (Iron ore, leasing, freight, overhead, energy and other) (591) (52.5) (775) (61.1) Expenses (SG&A, R&D and other) (3.0) (0.3) 4.0 0.3 EBITDA ex-Samarco 397 35.3 526 41.4 Manganese and ferroalloys Adjusted EBITDA of manganese ore and ferroalloys in 1Q15 was US$ 17 million, US$ 33 million lower than the US$ 50 million in 4Q14, mainly due to lower sales volumes (US$ 35 million), which were partially offset by exchange rate variations (US$ 8 million). Gross sales revenues for manganese decreased to US$ 41 million from US$ 92 million in 4Q14 due to lower sales volumes. In 1Q15, production of manganese ore reached 592,000 t, compared with 723,000 t in 4Q14 and 470,000 t in 1Q14. Gross sales revenues for ferroalloys amounted to US$ 39 million, decreasing from US$ 51 million in 4Q14, due to lower sales volumes. Ferroalloys production decreased to 27,000 t in 1Q15 from the 41,000 t recorded in 4Q14. |

|
|
1Q15 21 The ferroalloys plant in Ouro Preto, Minas Gerais, was shutdown in 1Q15, as existing energy contracts expired and energy costs increased impairing the economic viability of the operation. Consequently, the production of our manganese ore operations in Morro da Mina was affected. The ferroalloys plants in Barbacena, Minas Gerais, and in Simões Filho, Bahia, are operating at a reduced capacity. Market outlook – Iron Ore Iron ore prices dropped by 16% in the first quarter of the year, from US$ 74.3/t in 4Q14 to US$ 62.40/t in 1Q15. Weak market fundamentals continued to undermine prices, with soft demand from Chinese steel mills and strong seaborne supply. Demand for iron ore reduced in 1Q15 as global crude steel production decelerated by 1.7% vs. 1Q14, reaching 400 Mt. The slowdown was mostly driven by lower steel production in China, as a result of a lackluster property market despite solid infrastructure investments. Besides China, Japan, US and South Korea also recorded a small contraction in steel production in 1Q15. With reduced demand for iron ore, prices remained at low levels impacting production capacity. Since January 2014, more than 80 Mt of high cost seaborne production capacity shut down or were suspended according to companies’ own announcements. Even some state-owned enterprises (SOE’s) cut down on production levels in China and capacity may not increase back despite the Chinese government recently announced tax reduction on mining activities. Looking forward, we expect some improvements in the Chinese steel demand as the property sector responds to the ongoing and possibly upcoming government’s easing measures. Besides China, other emerging markets ex-China are expected to increase their steel use in the short term. All in all, in the medium term the steel demand prospects look better. IRON ORE COGS - 4Q14 x 1Q15 Variance drivers US$ million 4Q14 Volume Exchange Rate Others Total Variation 4Q14 x 1Q15 1Q15 Personnel 283 (51) (31) (32) (115) 169 Outsourced services and Materials 428 (79) (40) (15) (134) 295 Energy (Electricity, fuel & gas) 167 (31) (17) (4) (52) 115 Acquisition of products 89 (18) - (13) (31) 58 Maintenance 455 (83) (49) (42) (173) 282 Freight 1,037 (247) 0 (161) (409) 628 Bunker oil hedge 0 0 0 84 84 84 Others 371 (68) (37) 3 (103) 268 Total costs before depreciation and amortization 2,831 (577) (175) (180) (932) 1,898 Depreciation 363 (67) (33) 62 (38) 325 Total 3,194 (644) (208) (118) (970) 2,223 |

|
|
1Q15 22 IRON ORE FINES CASH COST AND FREIGHT 1Q15 4Q14 1Q14 Costs (US$ million) COGS, less depreciation and amortization 1,898 2,831 1,939 Costs of ore acquired from third parties 58 89 129 Maritime freight costs 628 1,037 642 Bunker oil hedge 84 - - One-off items - 48 - FOB at port costs (ex-ROM and ex-third party ores)¹ 1,128 1,657 1,168 Royalties 86 123 154 FOB at port costs (ex-ROM, ex-third party ores and ex-royalties) 1,042 1,534 1,014 Sales volumes (Mt) Total iron ore volume sold 62.3 78.2 57.8 Volume acquired from third parties 2.5 3.2 3.0 Total ROM volume sold 2.9 3.6 3.3 Volume sold of Vale's own ore (ex-ROM) 56.9 71.4 51.5 Vale's iron ore cash cost (ex-ROM, ex-royalties), FOB (US$/t) 18.3 21.5 19.7 Vale's iron ore cash cost (ex-ROM), FOB (US$/t)¹ 19.8 23.2 22.7 Freight Volume CFR (Mt) 36.6 47.9 26.8 Vale's iron ore unit freight cost (US$/t) 19.5 21.7 23.9 Vale's iron ore unit freight cost (ex-bunker oil hedge) (US$/t) 17.2 21.7 23.9 ¹ Including royalties IRON ORE FINES UNIT COST + EXPENSES LANDED IN CHINA US$/t 1Q15 4Q14 1Q14 Iron ore fines cash cost (ex-ROM), FOB¹ 19.8 23.2 22.7 Iron ore fines freight cost (ex-bunker oil hedge)2 17.2 21.7 23.9 Iron ore fines expenses3 4.0 9.3 7.9 Iron ore fines unit cost + expenses landed in China (US$/wmt) 41.0 54.1 54.5 ¹ Including royalties ² Vale’s total freight costs used as a proxy for the freight costs to China. ³ Net of depreciation FERROUS MINERALS BUSINESS PERFORMANCE GROSS OPERATING REVENUE BY PRODUCT US$ million 1Q15 4Q14 1Q14 Iron ore fines 2,734 4,593 5,168 ROM 32 42 68 Pellets 999 1,308 1,471 Manganese ore 41 92 21 Ferroalloys 39 51 61 Others 102 127 150 Total 3,947 6,213 6,939 |

|
|
1Q15 23 AVERAGE SALE PRICE US$/ metric ton 1Q15 4Q14 1Q14 Iron ore - Platts's 62% IODEX¹ 62.40 74.28 120.38 Iron ore - Metal Bulletin 65% index 70.26 82.90 n/a Iron ore fines 46.01 61.57 94.79 ROM 10.98 11.82 20.48 Pellets 88.76 103.11 147.31 Manganese ore 112.95 111.11 169.35 Ferroalloys 1,300.00 1,416.67 1,196.08 VOLUME SOLD ‘000 metric tons 1Q15 4Q14 1Q14 Iron ore fines 59,420 74,603 54,523 ROM 2,915 3,552 3,320 Pellets 11,255 12,686 9,986 Manganese ore 363 828 124 Ferroalloys 30 36 51 VOLUME SOLD BY DESTINATION – IRON ORE AND PELLETS ‘000 metric tons 1Q15 % 4Q14 % 1Q14 % Americas 10,164 13.8 11,590 12.8 9,741 14.4 Brazil 8,789 11.9 10,078 11.1 8,358 12.3 Others 1,375 1.9 1,512 1.7 1,383 2.0 Asia 48,585 66.0 62,563 68.9 43,425 64.0 China 36,879 50.1 46,411 51.1 32,012 47.2 Japan 6,572 8.9 7,505 8.3 6,427 9.5 Others 5,134 7.0 8,648 9.5 4,987 7.4 Europe 12,005 16.3 13,209 14.5 11,901 17.5 Germany 5,375 7.3 4,660 5.1 4,855 7.2 France 1,388 1.9 2,103 2.3 1,077 1.6 Others 5,242 7.1 6,446 7.1 5,970 8.8 Middle East 2,452 3.3 2,337 2.6 2,089 3.1 Rest of the World 383 0.5 1,141 1.3 673 1.0 Total 73,590 100.0 90,841 100.0 67,829 100.0 SELECTED FINANCIAL INDICATORS US$ million 1Q15 4Q14 1Q14 Net Revenues 3,868 6,116 6,818 Costs² (2,636) (3,792) (2,785) Expenses² (158) (504) (328) Pre-operating and stoppage expenses² (38) (48) (51) R&D expenses (35) (117) (61) Dividends received 26 47 11 Adjusted EBITDA 1,027 1,702 3,604 Adjusted EBITDA margin for iron ore (US$/t) 9.87 14.84 51.56 Depreciation and amortization (470) (548) (453) Adjusted EBIT 531 1,107 3,140 Adjusted EBIT margin (%) 13.7 18.1 46.1 ¹ Iron ore reference price - Platts's 62% IODEX CFR China (US$/dry metric ton) ² Net of depreciation and amortization |

|
|
1Q15 24 THE IMPACT OF BUNKER HEDGING ON VALE’S FINANCIAL PERFORMANCE The total effect of bunker oil prices is dependent on the bunker oil hedge taken out by Vale as discussed in our 4Q14 financial results (please see page 24). Bunker oil hedges are recorded as follows: (i) The hedge of the bunker oil exposure associated with our FOB and domestics sales is accounted for as financial expenses and is marked-to-market every quarter and recorded as financial expenses. (ii) The hedge of the bunker oil exposure associated with our CFR sales is recorded as hedge accounting and, therefore, impacts costs of goods sold, according to the actual settlement dates. IMPACT OF BUNKER OIL HEDGING IN VALE'S FINANCIAL PERFORMANCE Concept Current impact Drivers of future impact Freight Contract Type Hedge Accounting Impact of open derivative positions in P/L statement Impact incurred in 1Q15 P/L statement Bunker oil derivative open positions (million tons) Average Strike Price (US$/t) CFR Yes Impact on COGS US$ 2.3 / t (US$ 84 million) increase on COGS 1.485 505 FOB No Impact on financial expenses -US$ 49 million increase on financial expenses 3.204 434 More specifically, the impact of the hedged positions in Vale’s results can be summarized as follows: (i) Impact on the financial statements related to the derivatives under Vale’s hedge accounting program: a. In 1Q15: (i) Freight costs increased by US$ 2.3 / t with the settlement of derivatives contracts in 1Q15, causing COGS to increase. (ii) Open hedge positions on the 31st of March, 2015, had no impact in 1Q15 P&L statement. b. In 2Q15 and subsequent quarters: derivatives settlement will impact costs on a monthly basis and can be estimated by the following proxy27: 1,485,000 t * (Actual bunker oil price – US$ 505 / t) / 9 (ii) Impact on the financial statements related to the trades that are not under Vale´s hedge accounting program: a. In 1Q15: a negative impact of US$ 49 million recognized in the 1Q15 financial expenses due to the realized loss on the settlements occurred in the quarter and the mark-to-market of the open positions on March 31st, 2015. b. In 2Q15 and subsequent quarters: financial expenses will be impacted by the changes in the mark-tomarket of the open derivative positions at the end of each quarter and by the gains or losses related to the settlements recorded in each quarter. 27 The actual settlement is based on the specific conditions (executed volumes and prices) of each derivative instrument. The above referred proxy assumes the average price of these instruments and evenly spread bunker tonnage throughout the year. |

|
|
1Q15 25 Base Metals EBITDA Adjusted EBITDA of base metals increased by 16.5% to US$ 678 million in 1Q15 compared to the US$ 582 million recorded in 4Q14, mainly due to the proceeds from the goldstream transaction (US$ 230 million) and lower costs and expenses (US$ 109 million). These positive impacts were partially offset by lower prices (US$ 242 million). Sales revenues and volumes Nickel gross sales revenues totaled US$ 971 million in 1Q15, recording a 8.7% decrease when compared to 4Q14, mainly due to the lower average realized prices of US$ 14,279 per metric ton in 1Q15 versus US$ 15,420 in 4Q14 (US$ 77 million) and also due to lower sales volumes of 68,000 t against 69,000 t in 4Q14 (US$ 16 million). Sales volumes in 1Q15 were 4.6% higher than the 65,000 t sold in 1Q14. The LME average nickel price in 1Q15 was US$ 14,338/t, in line with Vale’s realized price. Vale realizes a premium over the LME on the sale of high purity nickel products (pellets, cathode and powder) and a discount on the sale of intermediate nickel products such as matte from PTVI and nickel hydroxide cake (NHC) from VNC28. Production of nickel was 69,200 t in 1Q15, 4,400 t lower than in 4Q14, mainly due to severe storms that reached Canada and delayed shipments of feed from our Sudbury smelter to our Clydach refinery. Nonetheless, nickel production was 2.5% higher than the 67,500 t produced in 1Q14 and a production record for a first quarter. Copper gross sales revenues totaled US$ 464 million in 1Q15, recording a 17.0% decrease when compared to 4Q14, mainly as a result of the lower sales prices of US$ 4,758 per metric ton in 1Q15 versus US$ 5,842 in 4Q14 (US$ 108 million) which was partially off-set by the higher sales volumes of 98,000 t in 1Q15 against 95,000 t in 4Q14 (US$ 13 million). Sales volumes in 1Q15 were 16.7% higher than the 84,000 t sold in 1Q14. The LME average copper prices in 1Q15 was US$ 5,827/t, US$ 1,069/t higher than Vale’s realized price. The discount versus the LME price is mainly due to the impact of provisional pricing29 (US$ 579/t) and the treatment and refining charges on the sale of our copper products (US$ 457/t). Copper output was 107,20030 t in 1Q15, 1.7% and 21.3% higher than in 4Q14 and in 1Q14, respectively. Vale recorded a copper production record in 1Q15, supported by the ramp-up of Salobo. PGMs (platinum group metals) sales revenues were US$ 125 million in 1Q15, 17.7% lower than in 4Q14, mainly due to the lower sales volume of 144,000 oz against 168,000 oz in 4Q14 and lower prices. Sales volumes in 1Q15 were 12.2% lower than the 164,000 oz sold in 1Q14. Gold gross sales revenues amounted to US$ 113 million in 1Q15, 1.7% lower than in 4Q14, mainly due to lower sales prices. Sales volumes totaling 97,000 oz in 1Q15 were in line with sales volumes in 4Q14 and 22.8% higher than the 79,000 oz sold in 1Q14. Costs and expenses Base metals costs were US$ 1.071 billion in 1Q15 (or US$ 1.465 billion including depreciation). After adjusting for the effects of higher volumes (US$ 5 million) and exchange rate variations (-US$ 80 million), costs decreased by US$ 59 million when compared to 4Q14. The decrease was mainly due to the lower costs with the acquisition of products (- US$ 26 million), lower energy costs (-US$ 18 million), lower maintenance costs (-US$ 6 million) and lower services costs (-US$ 5 million). 28 The premium for the realized price of the finished products, when compared to the average LME nickel price, was US$ 737 /t while the discount in the realized price of nickel intermediate, was US$ 4,369/t in 1Q15. 29 Under a pricing system referred to as MAMA (month after month of arrival), sales of copper concentrates and anodes are provisionally priced at the time of shipment, and final prices are settled on the basis of the LME price for the month after the month of arrival, generally one to three months after the shipment date. 30 Including Lubambe’s attributable production. Production numbers are reported on a copper-contained basis and sales volumes are reported on a payable basis, which is lower, given the loss of copper throughout the smelting process. Lubambe sales volumes are accounted as equity income (- US$ 4 million). |

|
|
1Q15 26 SG&A and other expenses, excluding depreciation, recorded revenue of US$ 173 million in 1Q15 compared to a revenue of US$ 15 million31 in 4Q14. The revenue recorded in 1Q15 resulted from the accounting gains of US$ 230 million from the goldstream transaction with Silver Wheaton completed in March 2015. Pre-operating and stoppage expenses, net of depreciation, totaled US$ 106 million, US$ 30 million lower than in 4Q14, mainly reflecting lower expenses at VNC32 (-US$ 47 million) partially offset by higher expenses at Long Harbour (US$ 22 million). Performance by operation Unit cash cost of sales, net of by-product credit by operation are as follows: BASE METALS – Unit cash cost of sales, net of by-product credits US$ /t 1Q15 4Q14 1Q14 North Atlantic Operations 5,467 5,277 1,588 PTVI 7,554 7,990 7,665 Sossego 2,700 3,668 3,317 Salobo 2,016 2,218 2,203 Onça Puma 9,318 13,831 11,813 EBITDA Base metals’ adjusted EBITDA by operation in 1Q15 was positively impacted by lower costs and expenses. Details by operations are as follows: (i) North Atlantic operations’ EBITDA decreased by US$ 84 million compared with 4Q14, amounting to US$ 351 million in 1Q15. The decrease was mainly a result of the US$ 98 million insurance payment received in 4Q1433. (ii) PTVI’s EBITDA decreased by US$ 21 million compared with 4Q14, amounting to US$ 70 million in 1Q15. The decrease was mainly a result of lower prices (US$ 35 million). (iii) VNC's EBITDA improved by US$ 9 million compared with 4Q14, amounting to -US$ 109 million in 1Q15 vs. -US$ 118 million in 4Q14. VNC’s EBITDA improved despite lower sales prices mostly as a result of lower pre-operating expenses34 (-US$ 47 million). (iv) Sossego’s EBITDA decreased by US$ 5 million compared with 4Q14, amounting to US$ 53 million in 1Q15. The decrease was mostly a result of lower sales prices. (v) Salobo’s EBITDA increased by US$ 29 million compared with 4Q14, amounting to US$ 100 million in 1Q15. The increase was a result of lower “other operating expenses” (US$ 33 million) as 4Q14 was impacted by the write-down of ICMS and other tax credits. As we continue to ramp up Salobo, we expect further cost reductions with productivity improvements and dilution of fixed costs. (vi) Onça Puma’s EBITDA increased by US$ 21 million compared with 4Q14, amounting to US$ 26 million in 1Q15. The increase was mainly a result of higher sales volumes (1,000 t), lower unit cost and the resumption of production after the maintenance shutdown carried out in 4Q14 to repair the refractory in the rotary kiln furnace. 31 Including insurance payment of US$ 116 million received in 4Q14. 32 Net of depreciation. 33 Difference between the US$ 116 million received in 4Q14 and the US$ 7 million received in 1Q15. 34 Excluding depreciation. |
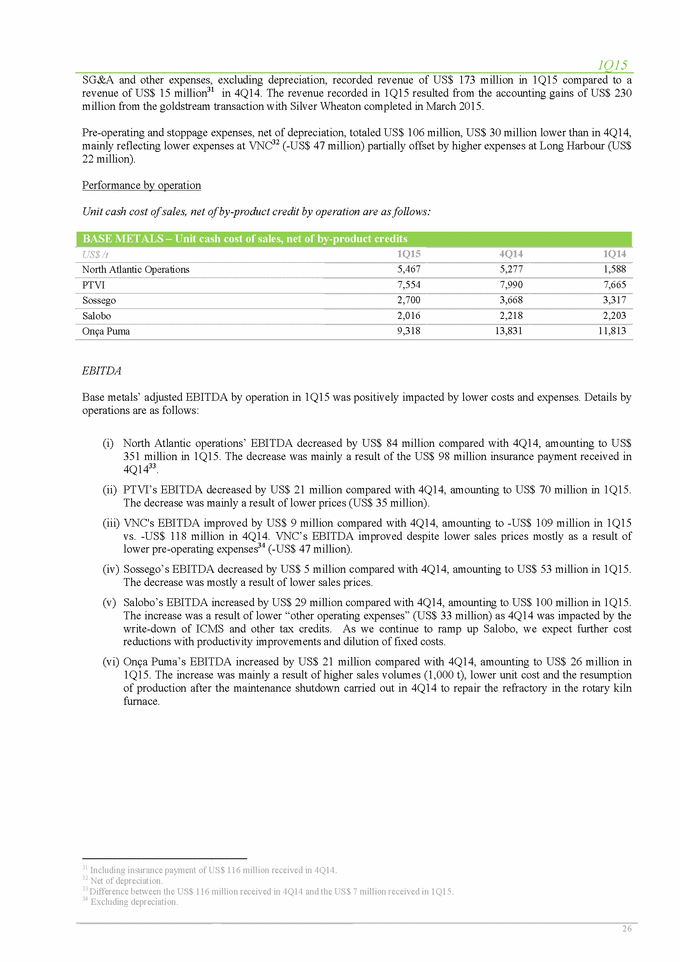
|
|
1Q15 27 BASE METALS - EBITDA BY OPERATION US$ million 1Q15 4Q14 1Q14 North Atlantic operation1 351 435 419 PTVI 70 91 49 VNC (109) (118) (84) Sossego 53 58 63 Salobo 100 71 66 Onça Puma 26 5 15 Other2 187 40 21 Total 678 582 549 1 Includes the operations in Canada and in the United Kingdom. 2 Includes the PTVI and VNC off-takes, intercompany sales and purchase of finished nickel, proceeds from the goldstream transaction and corporate center for base metals. BASE METALS - EBITDA per ton US$/t 1Q15 4Q14 1Q14 North Atlantic operation1 8,731 5,800 10,270 PTVI 3,708 4,500 2,561 VNC n/a n/a n/a Sossego 2,017 2,200 2,546 Salobo 3,101 2,200 3,294 Onça Puma 4,008 1,000 5,430 1 Includes operations in Canada and in the United Kingdom. Market outlook Base metal prices were impacted in the first quarter of 2015 by a slowdown in Chinese housing construction and bearish sentiment regarding Chinese economic growth. Nickel The LME nickel prices averaged $14,338/t in the first quarter of 2015 declining as the quarter progressed. This average price represented a 9% decline quarter-on-quarter or a 2% drop year-on-year. With continued tight credit in China, nickel prices have experienced further weakness in April with the price falling below $13,000/t to their lowest levels since 2009. At these price levels around 40-50% of nickel operations are now estimated to have negative cash margins. To date in 2015, nickel pig iron (NPI) production has been limited by the challenging environments, lower availability of high grade ores, depletion of previously stockpiled Indonesian NPI ore feed and increasing environmental regulations. NPI production in 2015 is expected to decline, year-on-year, by as much as 100,000 t due to the increase of production cash costs derived from the economics of processing lower grade ore ex-Indonesia and lower availability of ore. With lower NPI production and Chinese nickel prices remaining above the LME nickel price, nickel imports into China started to increase in the first quarter. It is expected that nickel imports will increase throughout 2015 as Chinese nickel de-stocking slows down compared with 2014. After the surge in nickel inventories at the LME, which ended the year at 413,000 t, LME stocks have increased slightly closing March 31 at 432,000 t. Copper LME copper prices were especially impacted in January as investor positioning turned distinctly negative. After strong price support above $6,000/t in 2014, prices fell to less than $5,500/t by the end of January. The effects of the exchange rate on many of the traditional producing countries also helped to bring the copper cost curve slightly down, offering additional support to the recent price level. Since then, prices have recovered partially due to expectations of reduced supply given the on-going disruptions in production. |

|
|
1Q15 28 Despite considerations about disruptions and the scale of depletion rate effects on future production, copper trading is influenced by LME inventory levels, which rose from 177,000 t at the end of 2014 to 333,000 t by March 31, 2015, which helped to keep prices lower on a quarter-on-quarter basis. Average LME copper prices averaged $5,818/t showing a decline of 12% quarter-on-quarter or 17% year-on-year. BASE METALS COGS - 4Q14 x 1Q15 Variance drivers US$ million 4Q14 Volume Exchange Rate Others Total Variation 4Q14 x 1Q15 1Q15 Personnel 220 1 (21) (4) (25) 196 Outsourced services and Materials 253 1 (24) (5) (28) 225 Energy (Electricity, fuel & gas) 159 3 - (18) (15) 144 Acquisition of products 206 - - (26) (26) 180 Maintenance 254 2 (24) (6) (28) 226 Others 112 (1) (10) 1 (11) 101 Total costs before depreciation and amortization 1,205 5 (79) (59) (134) 1,071 Depreciation 513 3 (46) (76) (120) 394 Total 1,718 8 (126) (135) (253) 1,465 BASE METALS BUSINESS PERFORMANCE GROSS OPERATING REVENUE BY PRODUCT US$ million 1Q15 4Q14 1Q14 Nickel 971 1,064 928 Copper 464 556 505 PGMs 125 152 156 Gold 113 115 101 Silver 8 11 12 Others 29 50 26 Total 1,710 1,948 1,728 AVERAGE SALE PRICE US$/ metric ton 1Q15 4Q14 1Q14 Nickel - LME 14,338 15,799 14,642 Copper - LME 5,827 6,624 7,040 Nickel 14,279 15,420 14,277 Copper 4,758 5,842 6,024 Platinum (US$/oz) 1,156 1,225 1,434 Gold (US$/oz) 1,163 1,190 1,278 Silver (US$/oz) 13.75 14.16 24.74 Cobalt (US$/lb) 9.10 9.34 11.51 VOLUME SOLD ‘000 metric tons 1Q15 4Q14 1Q14 Nickel operations & by products Nickel 68 69 65 Copper 39 37 39 Gold ('000 oz) 23 20 20 Silver ('000 oz) 452 574 433 PGMs ('000 oz) 144 168 164 Cobalt (metric ton) 1,009 1,311 591 Copper operations & by products Copper 59 58 45 Gold ('000 oz) 74 76 59 Silver ('000 oz) 158 182 64 |

|
|
1Q15 29 SELECTED FINANCIAL INDICATORS US$ million 1Q15 4Q14 1Q14 Net Revenues 1,710 1,953 1,728 Costs¹ (1,071) (1,205) (1,011) Expenses¹ 173 15 (18) Pre-operating and stoppage expenses¹ (106) (136) (119) R&D expenses (28) (45) (31) Adjusted EBITDA 678 582 549 Depreciation and amortization (470) (563) (429) Adjusted EBIT 208 19 120 Adjusted EBIT margin (%) 12.2 1.0 6.9 ¹ Net of depreciation and amortization Coal Adjusted EBITDA for the coal business segment was negative US$ 128 million in 1Q15, compared to negative US$ 204 million in 4Q14. The improvement of US$ 76 million compared with 4Q14, driven by further reduction in expenses was partially off-set by a decrease in revenues in 1Q15. Gross sales revenues of metallurgical coal decreased to US$ 129 million in 1Q15, compared to US$ 181 million in 4Q14, mainly due to lower sales volumes (US$ 50 million) and lower prices (US$ 2 million). Gross sales revenues of thermal coal decreased to US$ 16 million in 1Q15 from US$ 20 million in 4Q14, mainly as a result of lower sales volumes (US$ 3 million). The average realized price for metallurgical coal decreased by 1.6% from US$ 99.72/t in 4Q14 to US$ 98.17/t in 1Q15. The average realized price for thermal coal decreased by 3.9% from US$ 64.52/t in 4Q14 to US$ 62.02/t in 1Q15. Sales volumes of metallurgical coal reached 1.3 Mt in 1Q15, increasing by 434,000 t vs. 1Q14 but decreasing by 501,000 t vs. 4Q14. Moatize production accounts for most of the decrease in sales volumes in 1Q15 when compared with 4Q14. The production in Mozambique was affected by abnormal rains in the beginning of the year and by a lower physical availability of the mining equipment and of the coal processing plant. The placement of Isaac Plains in care and maintenance also reduced production in 1Q15 vs. 4Q14, but Australian sales were higher as we sold the existing stock from Isaac Plains and Integra. Sales volumes of thermal coal reached 257,000 t in 1Q15, decreasing 53,000 t vs. 4Q14 and 219,000 t vs. 1Q14. The lower sales volumes of thermal coal in 1Q15 are consistent with the decrease in production, which reached 427,000 t in the quarter, decreasing 93,000 t vs. 4Q14 and 134,000 t vs. 1Q14. Production of thermal coal decreased, mainly driven by the stoppages of both the Integra and the Isaac Plains mines. Coal costs amounted to US$ 186 million (or US$ 209 million with depreciation charges) in 1Q15, decreasing by US$ 64 million vs. 4Q14. After adjusting for the effects of lower volumes (-US$ 70 million) and the positive impact of the Australian dollar depreciation (-US$ 5 million), costs increased by US$ 11 million, mainly as a result of higher maintenance costs in Moatize, carried out to increase the physical availability of the processing plant and of the mining equipment. Costs net of depreciation decreased by US$ 50 million when compared to 1Q14. After adjusting for the effects of higher volumes (US$ 65 million) and the positive impact of the Australian dollar depreciation (-US$ 20 million), costs decreased by US$ 95 million. Coal expenses, excluding depreciation charges, decreased by US$ 97 million from US$ 184 million in 4Q14 to US$ 87 million in 1Q15. The decrease was mainly due to a lower inventory adjustment on thermal coal in Moatize (US$ 77 million) and a reduction in SG&A expenses (US$ 17 million) in 1Q15. Coal expenses increased by US$ 25 million in 1Q15 vs. 1Q14, as result of a higher inventory adjustment on thermal coal in Moatize. |

|
|
1Q15 30 Performance by operation Highlights by operation are: (i) Adjusted EBITDA for the Australian operations was negative US$ 5 million in 1Q15 compared to negative US$ 14 million in 4Q14. The improvement of US$ 9 million vs. 4Q14 was driven by the stoppage of the non-profitable mines of Integra and Isaac Plains and the good performance at the Carborough Downs operation. (ii) Costs net of depreciation for the Australian operations amounted to US$ 75 million in 1Q15, decreasing US$ 4 million vs. 4Q14. After adjusting for the effects of higher volumes (-US$ 16 million) and exchange rate variations (-US$ 5 million), costs were down US$ 15 million. (iii) Adjusted EBITDA for the Mozambique operations was negative US$ 123 million in 1Q15 compared to negative US$ 218 million in 4Q14. The improvement of US$ 96 million vs. 4Q14 was mainly driven by a substantial decrease in expenses (US$ 98 million) which were negatively impacted in 4Q14 by adjustments in thermal coal inventory. (iv) Mozambique costs net of depreciation amounted to US$ 111 million in 1Q15, decreasing US$ 59 million vs. 4Q14. After adjusting for the effects of lower volumes (US$ 86 million), costs were up by US$ 26 million mainly driven by higher maintenance costs, as previously explained. Market Outlook - Metallurgical coal Prices for premium hard coking coal mid vol FOB Australia decreased by 5.5% in the quarter from US$ 110/t in 4Q14 to US$ 104/t in 1Q15, whereas prices for PCI improved 3,4% from US$ 89/t to US$ 92/t. The main driver for lower prices was the resilient supply. Seaborne producers in countries such as Australia, Canada and Russia benefited from the depreciation of local currencies against the USD, which helped keep the higher cost producers from these countries operational. The seaborne market for coal was also negatively impacted by new Chinese laws intended to control the quality of imported coal, which has forced producers to sell into different markets in times of already weak demand. Coal consumption remained weak throughout the quarter. In China, coal demand had no seasonal improvement after the Chinese New Year in February, whereas consumption improved in India but was not sufficient to offset the slowdown in China. Looking forward, we expect the coal market to remain oversupplied in 2015 as demand falters and supply remains resilient. COAL BUSINESS PERFORMANCE GROSS OPERATING REVENUE BY PRODUCT US$ million 1Q15 4Q14 1Q14 Metallurgical coal 129 181 101 Thermal coal 16 20 36 Total 145 201 137 AVERAGE SALE PRICE US$/ metric ton 1Q15 4Q14 1Q14 Metallurgical coal 98.17 99.72 114.36 Thermal coal 62.26 64.52 75.49 VOLUME SOLD ‘000 metric tons 1Q15 4Q14 1Q14 Metallurgical coal 1,314 1,815 880 Thermal coal 257 310 476 Total 1,571 2,125 1,356 |
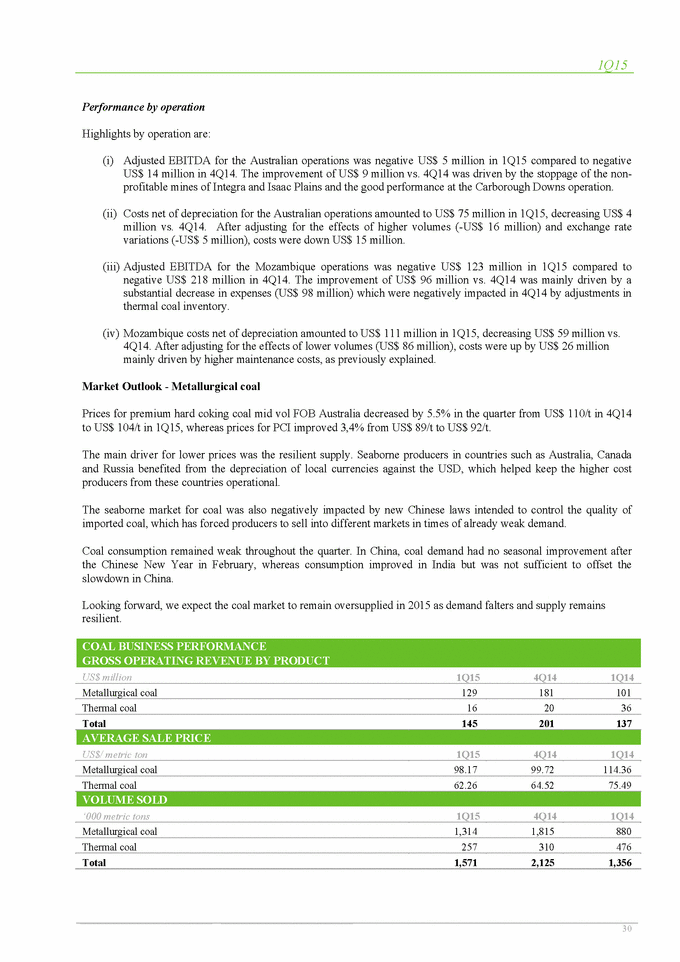
|
|
1Q15 31 SELECTED FINANCIAL INDICATORS US$ million 1Q15 4Q14 1Q14 Net Revenues 145 201 137 Costs¹ (186) (249) (237) Expenses¹ (70) (164) (53) Pre-operating and stoppage expenses¹ (12) (10) (8) R&D expenses (5) (10) (1) Adjusted EBITDA (128) (204) (162) Depreciation and amortization (23) (36) (39) Adjusted EBIT (151) (268) (201) Adjusted EBIT margin (%) (104.1) (133.3) (146.7) ¹ Net of depreciation and amortization Fertilizer nutrients Adjusted EBITDA for the fertilizer business segment increased to US$ 90 million in 1Q15 from US$ 75 million in 4Q14. The increase of US$ 15 million from 4Q14 was mainly driven by lower expenses (US$ 32 million) and by the impact of the depreciation of the Brazilian Real on COGS (US$ 24 million). The increase in EBITDA was partially offset by lower sales volumes (US$ 20 million) and lower sales prices (US$ 16 million). Potash gross sales revenues totaled US$ 33 million in 1Q15, US$ 12 million lower than in 4Q14, as a result of the decrease in sales volumes from 121,000 t in 4Q14 to 91,000 in 1Q15. Potash sales volumes were lower in 1Q15, since demand for nutrients in the Brazilian market35 is more concentrated in the second half of the year. Potash sales revenues were US$ 6 million lower in 1Q15 than in 1Q14, as a result of lower sales volumes which decreased from 116,000 t in 1Q14 to 91,000 t in 1Q15. Phosphate products gross sales revenues totaled US$ 373 million in 1Q15, US$ 59 million lower than in 4Q14 as a result of lower sales volumes (US$ 41 million) and of lower sale prices (US$ 18 million). Phosphate rock production of 2.0 Mt in 1Q15 was 3.1% higher than in 1Q14 but 9.8% lower than in 4Q14, due to the scheduled maintenance stoppage in Tapira and Araxá, in Brazil, and Bayóvar, in Peru. Phosphate products sales revenues were US$ 47 million lower in 1Q15 vs. 1Q14, mostly due to lower sales volumes (US$ 78 million), which were partially offset by higher sales prices. Nitrogen fertilizers gross sales revenues were US$ 93 million in 1Q15, US$ 15 million lower than in 4Q14, mainly as a result of lower sales volumes (US$ 13 million). Sales revenues in 1Q15 were in line with 1Q14. Fertilizer costs, net of depreciation, were US$ 337 million in 1Q15 (or US$ 399 million with depreciation charges), decreasing US$ 74 million vs. 4Q14. After excluding the effects of lower volumes (-US$ 52 million) and exchange rate variations (-US$ 25 million), costs were in line with 4Q14 despite energy cost increases. Fertilizer costs, net of depreciation, were US$ 92 million lower in 1Q15 than in 1Q14. After excluding the effects of lower volumes (-US$ 79 million) and exchange rate variations (-US$ 43 million), costs were US$ 30 million higher in 1Q15 vs. 1Q14, mainly due to price increases for imported raw materials and energy. SG&A and other expenses decreased to US$ 20 million in 1Q15 from US$ 29 million in 4Q14, mainly due to the expenses reduction initiatives. R&D expenses were US$ 17 million in 1Q15, decreasing 15% from the US$ 20 million recorded in the 4Q14. Stoppage expenses totaled US$ 14 million in 1Q15, decreasing US$ 20 million vs. 4Q14, mainly as a result of lower expenses associated with PRC (-US$ 13 million). PRC recorded US$ 4 million of stoppage expenses in 1Q15, against US$ 17 million in 4Q14. SG&A, R&D and other expenses in 1Q15 were in line with 1Q14. Stoppage expenses were US$ 16 million lower in 1Q15 than in 1Q14, mostly due to the decrease in expenses related to scheduled maintenance stoppages (US$ 13 million). 35 The Brazilian market is the most important to Vale. |

|
|
1Q15 32 Market Outlook The fertilizer market remained unbalanced in 1Q15 with a soft demand and a mild growth in supply to the seaborne market. Demand was affected by low agricultural commodities prices, seasonality and the depreciation of currencies from countries which are traditional importers of fertilizers, such as Brazil. On the supply side, volumes increased in the seaborne market mainly due to China, which is not a traditional exporter, but which entered the market after the Chinese government eased export tariffs. Prices of phosphate fertilizers shall improve on the back of higher prices of phosphoric acid. New contracts between the Morocco suppliers and the Indian buyers set phosphoric acid prices at US$ 805/t P2O5 CFR India in 1H15. This price is US$ 40/t higher than prices in 4Q14. Given these more elevated prices for phosphoric acid and a price cap introduced by the Indian government on phosphate fertilizers, Indian producers may find it more economical to slow down their production and acquire phosphate fertilizers, mostly DAP, in the international market. This commercial stance may support higher prices in the short term. Potash prices suffered a slight reduction in 1Q15 due to softer demand. In Brazil, imports should increase in the short term supported by the slowdown of domestic production. Nitrogen fertilizers prices decreased in 1Q15. The main drivers for this price decrease were the high availability of natural gas, which helped non-integrated producers, and the ramp-up of new nitrogen plants in the Middle East. Looking forward, we expect Brazil´s fertilizer demand to increase in 2015. Purchases will probably be volatile, with the low consumption levels observed in the first quarter expected to be offset by a substantial increase in demand from June onwards in order to provide for the summer crop. The Brazilian demand is likely to provide support for prices in the region. FERTILIZERS COGS - 4Q14 x 1Q15 Variance drivers US$ million 4Q14 Volume Exchange Rate Others Total Variation 4Q14 x 1Q15 1Q15 Personnel 68 (15) (6) (1) (23) 45 Outsourced services and Materials 230 (7) (10) 1 (15) 215 Energy (Electricity, fuel & gas) 62 (19) (5) 2 (22) 40 Acquisition of products 1 (1) - - (1) - Maintenance 13 (2) (2) 1 (2) 11 Others 37 (9) (2) - (11) 25 Total costs before depreciation and amortization 411 (52) (25) 3 (74) 337 Depreciation 81 (12) (7) - (19) 63 Total 492 (64) (32) 3 (93) 399 FERTILIZER NUTRIENTS BUSINESS PERFORMANCE GROSS OPERATING REVENUE BY PRODUCT US$ million 1Q15 4Q14 1Q14 Potash 33 45 39 Phosphates 373 432 420 Nitrogen 93 108 92 Others 14 22 19 Total 513 607 570 AVERAGE SALE PRICE US$/ metric ton 1Q15 4Q14 1Q14 Potash 358.53 371.90 336.21 Phosphates MAP 519.91 550.70 502.21 TSP 409.56 448.41 396.57 SSP 198.63 217.14 204.68 DCP 571.93 584.94 548.83 Phosphate rock 90.16 88.77 58.10 Nitrogen 612.01 627.91 557.58 |
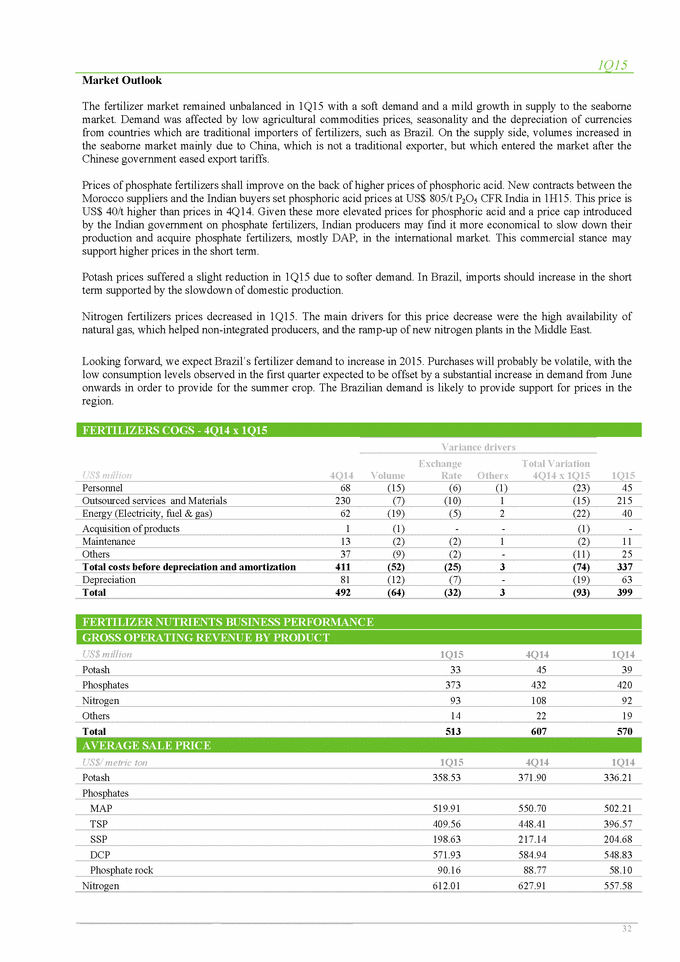
|
|
1Q15 33 VOLUME SOLD ‘000 metric tons 1Q15 4Q14 1Q14 Potash 91 121 116 Phosphates MAP 259 249 296 TSP 84 112 159 SSP 267 367 417 DCP 124 118 124 Phosphate rock 732 935 809 Others phosphates 83 71 43 Nitrogen 152 172 165 SELECTED FINANCIAL INDICATORS US$ million 1Q15 4Q14 1Q14 Net Revenues 478 569 533 Costs¹ (337) (411) (429) Expenses¹ (20) (29) (22) Pre-operating and stoppage expenses¹ (14) (34) (30) R&D expenses (17) (20) (17) Adjusted EBITDA 90 75 35 Depreciation and amortization (67) (88) (100) Adjusted EBIT 23 (13) (65) Adjusted EBIT margin (%) 4.8 (2.3) (12.2) ¹ Net of depreciation and amortization FINANCIAL INDICATORS OF NON-CONSOLIDATED COMPANIES For selected financial indicators of the main non-consolidated companies, see our quarterly financial statements on www.vale.com/Investors/Quarterly results and reports/Financial statements - Vale CONFERENCE CALL AND WEBCAST Vale will host two conference calls and webcasts on Thursday, April 30th. The first, in Portuguese (without translation), will begin at 10:00 a.m. Rio de Janeiro time. The second, in English, at 12:00 p.m. Rio de Janeiro time, 11:00 a.m. US Eastern Daylight Time, 4:00 p.m. British Standard Time, and 11:00 p.m. Hong Kong time. Dial in to conference calls/webcasts: In Portuguese: Participants from Brazil: (55 11) 3193-1001 / (55 11) 2820-4001 Participants from the US: (1 888) 700-0802 Participants from other countries: (1 786) 924-6977 Access code: VALE In English: Participants from Brazil: (55 11) 3193-1001 / (55 11) 2820-4001 Participants from USA: (1 866) 262-4553 Participants from other countries: (1 412) 317-6029 Access code: VALE Instructions for participation will be available on the website: www.vale.com/Investors. A recording will be available on Vale’s website for 90 days as of April 30th, 2015. |

|
|
1Q15 34 ANNEX 1 – SIMPLIFIED FINANCIAL STATEMENTS INCOME STATEMENT US$ million 1Q15 4Q14 1Q14 Gross operating revenues 6,358 9,226 9,682 Taxes (118) (154) (179) Net operating revenue 6,240 9,072 9,503 Cost of goods sold (5,168) (6,892) (5,590) Gross profit 1,072 2,180 3,913 Gross margin (%) 17.2 24.0 41.2 Selling, general and administrative expenses (195) (306) (282) Research and development expenses (119) (235) (145) Pre-operating and stoppage expenses (264) (292) (248) Other operational expenses 46 (491) (217) Gain (loss) from sale of assets 193 (167) - Impairment of non-current assets - (378) - Operating profit 733 311 3,021 Financial revenues 68 55 103 Financial expenses (219) (502) (682) Gains (losses) on derivatives, net (1,340) (1,087) 212 Monetary and exchange variation (3,019) (1,257) 516 Equity income (271) 31 195 Results on sale or write-off of investments from associates and joint ventures 18 31 - Impairment on investments from association and joint ventures - (31) - Income (loss) before taxes (4,030) (2,449) 3,365 Current tax (70) 363 (928) Deferred tax 930 106 (61) Net Earnings (loss) from continuing operations (3,170) (1,980) 2,376 Loss attributable to noncontrolling interest 52 131 139 Net earnings (attributable to the Company's stockholders) (3,118) (1,849) 2,515 Earnings (loss) per share (attributable to the Company's stockholders - US$) (0.61) (0.36) 0.49 Diluted earnings (loss) per share (attributable to the Company's stockholders - US$) (0.61) (0.36) 0.49 EQUITY INCOME (LOSS) BY BUSINESS SEGMENT US$ million 1Q15 % 4Q14 % 1Q14 % Ferrous minerals -142 52.4 86 277.4 217 111.3 Coal 0 0.0 5 16.1 12 6.2 Base metals -5 1.8 -10 -32.3 -6 -3.1 Logistics 0 0.0 0 0.0 0 0.0 Steel -125 46.1 -3 -9.7 -19 -9.7 Others 1 -0.4 -47 -151.6 -9 -4.6 Total -271 100.0 31 100.0 195 100.0 |

|
|
1Q15 35 BALANCE SHEET US$ million 3/31/2015 12/31/2014 3/31/2014 Assets Current assets 17,703 20,234 22,991 Cash and cash equivalents 3,684 3,974 7,182 Financial investments 1 148 - Derivative financial instruments 189 166 186 Accounts receivable 2,291 3,275 4,103 Related parties 522 579 719 Inventories 4,064 4,501 4,754 Prepaid income taxes 1,284 1,581 1,594 Recoverable taxes 1,548 1,700 1,632 Others 740 670 2,156 Non-current assets held for sale and discontinued operation 3,380 3,640 665 Non-current assets 7,301 7,180 8,475 Related parties 23 35 115 Loans and financing agreements receivable 217 229 261 Judicial deposits 1,102 1,269 1,552 Recoverable income taxes 455 478 414 Deferred income taxes 4,374 3,976 4,690 Recoverable taxes 434 401 289 Derivative financial instruments 34 87 169 Others 662 705 895 Fixed assets 79,546 89,075 96,171 Total assets 104,550 116,489 127,637 Liabilities Current liabilities 10,026 10,737 8,962 Suppliers and contractors 3,429 4,354 3,473 Payroll and related charges 526 1,163 800 Derivative financial instruments 904 1,416 490 Loans and financing 3,195 1,419 1,769 Related parties 267 306 328 Income taxes settlement program 388 457 499 Taxes payable and royalties 471 550 445 Provision for income taxes 171 353 267 Employee postretirement obligations 68 67 96 Asset retirement obligations 124 136 161 Others 339 405 634 Liabilities directly associated with non-current assets held for sale and discontinued operations 144 111 - Non-current liabilities 46,207 49,431 50,776 Derivative financial instruments 2,496 1,610 1,122 Loans and financing 25,292 27,388 28,085 Related parties 90 109 164 Employee postretirement obligations 2,121 2,236 2,086 Provisions for litigation 1,087 1,282 1,373 Income taxes settlement program 4,876 5,863 6,773 Deferred income taxes 3,099 3,341 3,210 Asset retirement obligations 2,888 3,233 2,632 Participative stockholders' debentures 1,165 1,726 1,860 Redeemable noncontrolling interest 196 243 276 Goldstream transaction 1,841 1,323 1,481 Others 1,056 1,077 1,714 Total liabilities 56,233 60,168 59,738 Stockholders' equity 48,317 56,321 67,899 Total liabilities and stockholders' equity 104,550 116,489 127,637 |

|
|
1Q15 36 CASH FLOW US$ million 1Q15 4Q14 1Q14 Cash flows from operating activities: Net income (loss) from operations (3,170) (1,980) 2,376 Adjustments to reconcile net income with cash provided by operating activities: Depreciation, depletion and amortization 1,035 1,242 1,026 Impairment - 409 - Loss on measurement or sales of non-current assets (211) 167 - Others 2,596 1,820 (609) Variation of assets and liabilities Accounts receivable 817 107 1,822 Inventories 189 (63) (811) Suppliers and contractors (387) 503 20 Payroll and related charges (567) 53 (594) Tax assets and liabilities, net 34 (701) 713 Goldstream transaction 532 - - Others (337) (369) 139 Net cash provided by operating activities 531 1,188 4,082 Cash flows from investing activities: Additions to investments (10) (24) (121) Acquisition of subsidiary (90) - - Additions to property, plant and equipment (2,200) (3,449) (2,383) Proceeds from disposal of assets and investments 107 - - Dividends and interest on capital received from joint ventures and associates 27 89 11 Proceeds from goldstream transaction 368 - - Others 114 466 (128) Net cash used in investing activities (1,684) (2,918) (2,621) Cash flows from financing activities: Loans and financing Additions 1,342 962 651 Repayments (301) (842) (293) Payments to shareholders: Dividends and interest on capital attributed to shareholders - (2,100) - Dividends and interest on capital attributed to noncontrolling interest (3) (55) - Net cash provided by (used in) financing activities 1,038 (2,035) 357 Increase (decrease) in cash and cash equivalents (115) (3,765) 1,819 Cash and cash equivalents in the beginning of the period 3,974 7,882 5,321 Effect of exchange rate changes on cash and cash equivalents (175) (143) 42 Cash and cash equivalents, end of period 3,684 3,974 7,182 Cash paid during the period for: Interest on loans and financing (471) (324) (453) Income taxes (244) (197) (159) Income taxes - settlement program (106) (111) (118) Derivatives received (paid), net (657) (319) 17 Non-cash transactions: Additions to property, plant and equipment - interest capitalization 196 184 15 |
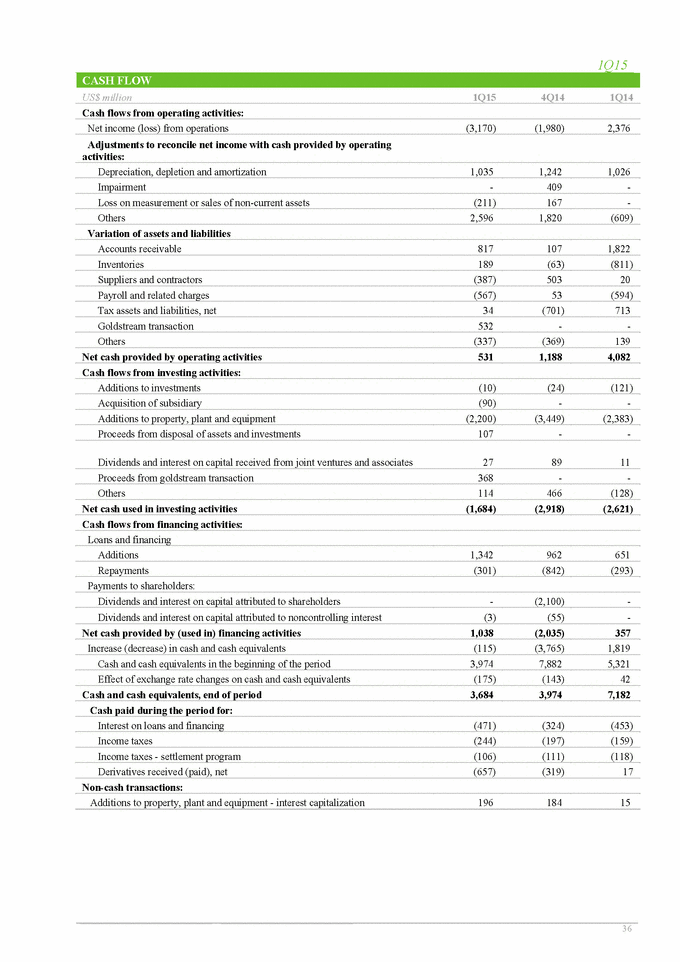
|
|
1Q15 37 ANNEX 2 – VOLUMES SOLD, PRICES AND MARGINS VOLUME SOLD - MINERALS AND METALS ‘000 metric tons 1Q15 4Q14 1Q14 Iron ore fines 59,420 74,603 54,523 ROM 2,915 3,552 3,320 Pellets 11,255 12,686 9,986 Manganese ore 363 828 124 Ferroalloys 30 36 51 Thermal coal 257 310 476 Metallurgical coal 1,314 1,815 880 Nickel 68 69 65 Copper 98 95 84 Gold ('000 oz) 97 97 79 Silver ('000 oz) 610 757 497 PGMs ('000 oz) 144 168 164 Cobalt (metric ton) 1,099 1,311 591 Potash 91 121 116 Phosphates MAP 259 249 296 TSP 84 112 159 SSP 267 367 417 DCP 124 118 124 Phosphate rock 732 935 809 Others phosphates 83 71 43 Nitrogen 152 172 165 AVERAGE SALE PRICES US$/ton 1Q15 4Q14 1Q14 Iron ore fines 46.01 61.57 94.79 ROM 10.98 11.82 20.48 Pellets 88.76 103.11 147.31 Manganese ore 112.95 111.11 169.35 Ferroalloys 1,300.00 1,416.67 1,196.08 Thermal coal 62.26 64.52 75.49 Metallurgical coal 98.17 99.72 114.36 Nickel 14,279.41 15,420.29 14,276.92 Copper 4,757.67 5,842.10 6,023.87 Platinum (US$/oz) 1,155.59 1,224.87 1,433.63 Gold (US$/oz) 1,163.08 1,189.96 1,278.40 Silver (US$/oz) 13.75 14.16 24.74 Cobalt (US$/lb) 9.10 9.34 11.51 Potash 358.53 371.90 336.21 Phosphates MAP 519.91 550.70 502.21 TSP 409.56 448.41 396.57 SSP 198.63 217.14 204.68 DCP 571.93 584.94 548.83 Phosphate rock 90.16 88.77 58.10 Nitrogen 612.01 627.91 557.58 |

|
|
1Q15 38 OPERATING MARGIN BY SEGMENT (EBIT ADJUSTED MARGIN) % 1Q15 4Q14 1Q14 Ferrous minerals 13.7 18.1 46.1 Coal (104.1) (133.3) (146.7) Base metals 12.2 1.0 6.9 Fertilizer nutrients 4.8 (2.3) (12.2) Total¹ 8.7 9.4 31.8 ¹ excluding non-recurring effects |

|
|
1Q15 39 ANNEX 3 – RECONCILIATION OF IFRS and “NON-GAAP” INFORMATION (a) Adjusted EBIT¹ US$ million 1Q15 4Q14 1Q14 Net operating revenues 6,240 9,072 9,503 COGS (5,168) (6,892) (5,590) SG&A (195) (306) (282) Research and development (119) (235) (145) Pre-operating and stoppage expenses (264) (292) (248) Other operational expenses 46 (491) (217) Adjusted EBIT 540 856 3,021 ¹ Excluding non-recurring effects. (b) Adjusted EBITDA EBITDA defines profit or loss before interest, tax, depreciation and amortization. Vale uses the term adjusted EBITDA to reflect exclusion of gains and/or losses on sale of assets, non-recurring expenses and the inclusion of dividends received from non-consolidated affiliates. However our adjusted EBITDA is not the measure defined as EBITDA under IFRS, and may possibly not be comparable with indicators with the same name reported by other companies. Adjusted EBITDA should not be considered as a substitute for operational profit or as a better measure of liquidity than operational cash flow, which are calculated in accordance with IFRS. Vale provides its adjusted EBITDA to give additional information about its capacity to pay debt, carry out investments and cover working capital needs. The following table shows the reconciliation between adjusted EBITDA and operational cash flow, in accordance with its statement of changes in financial position: RECONCILIATION BETWEEN ADJUSTED EBITDA AND OPERATIONAL CASH FLOW US$ million 1Q15 4Q14 1Q14 Adjusted EBITDA 1,602 2,187 4,058 Working capital: Accounts receivable 817 107 1,822 Inventories 189 (63) (811) Suppliers (387) 503 20 Payroll and related charges (567) 53 (594) Goldstream transaction 532 - - Others 104 (257) 182 Adjustment for non-recurring items and other effects (242) (332) 116 Cash provided from operations 2,048 2,198 4,793 Income taxes paid - current (244) (197) (159) Income taxes paid - settlement program (106) (111) (116) Interest paid for third parties (471) (324) (453) Participative stockholders' debentures paid (39) (60) - Derivatives received (paid), net (657) (318) 17 Net cash provided by (used in) operating activities 531 1,188 4,082 (c) Net debt RECONCILIATION BETWEEN Total debt AND NET DEBT US$ million 1Q15 4Q14 1Q14 Total debt 28,487 28,807 30,346 Cash and cash equivalents 3,685 4,122 7,184 Net debt 24,802 24,685 23,162 (d) Total debt / LTM adjusted EBITDA 1Q15 4Q14 1Q14 Total debt / LTM Adjusted EBITDA (x) 2.6 2.2 1.4 Total debt / LTM operational cash flow (x) 3.1 2.2 2.1 (e) LTM adjusted EBITDA / LTM interest payments 1Q15 4Q14 1Q14 LTM adjusted EBITDA / LTM interest payments (x) 6.9 8.6 13.8 |

|
|
1Q15 40 LTM operational profit / LTM interest payments (x) 3.2 4.7 8.9 This press release may include statements that present Vale's expectations about future events or results. All statements, when based upon expectations about the future and not on historical facts, involve various risks and uncertainties. Vale cannot guarantee that such statements will prove correct. These risks and uncertainties include factors related to the following: (a) the countries where we operate, especially Brazil and Canada; (b) the global economy; (c) the capital markets; (d) the mining and metals prices and their dependence on global industrial production, which is cyclical by nature; and (e) global competition in the markets in which Vale operates. To obtain further information on factors that may lead to results different from those forecast by Vale, please consult the reports Vale files with the U.S. Securities and Exchange Commission (SEC), the Brazilian Comissão de Valores Mobiliários (CVM), the French Autorité des Marchés Financiers (AMF), and The Stock Exchange of Hong Kong Limited, and in particular the factors discussed under “Forward-Looking Statements” and “Risk Factors” in Vale’s annual report on Form 20-F. |

Pursuant to the requirements of the Securities Exchange Act of 1934, the registrant has duly caused this report to be signed on its behalf by the undersigned, thereunto duly authorized.
|
|
Vale S.A. | |
|
|
(Registrant) | |
|
|
| |
|
|
By: |
/s/ Rogerio T. Nogueira |
|
Date: April 30, 2015 |
|
Rogerio T. Nogueira |
|
|
|
Director of Investor Relations |
Serious News for Serious Traders! Try StreetInsider.com Premium Free!
You May Also Be Interested In
- BMO Capital Reiterates Outperform Rating on Vale S.A. (VALE3:BZ) (VALE)
- ISG to Publish Reports on Contact Center Customer Experience Services
- Vale S.A. (VALE) PT Raised to $17 at Barclays
Create E-mail Alert Related Categories
SEC FilingsSign up for StreetInsider Free!
Receive full access to all new and archived articles, unlimited portfolio tracking, e-mail alerts, custom newswires and RSS feeds - and more!
